Embed Size (px)
Citation preview

Underground Mining Technology 2017 – M Hudyma & Y Potvin (eds) © 2017 Australian Centre for Geomechanics, Perth, ISBN 978-0-9924810-7-0
Underground Mining Technology 2017, Sudbury, Canada 115
A reverse Brayton cycle mine refrigeration system
DL Millar Laurentian University, Canada
Abstract The discounted (i = 10%) cost of a unit of refrigeration supplied by a coefficient of performance = 4 surface‐built vapour compression refrigeration mine air cooling system, with a load factor of 100%, equipped with condenser water cooling towers and underground spray chambers is approximately CAD 100/MWhr. This rises to CAD 200/MWhr for the same system when the load factor of the plant falls to 25%. These high costs motivate searches for alternative mine air cooling systems. In a reverse Brayton cycle refrigeration system, where compressed air acts both as the refrigerant and the coolant, compressed air that is aftercooled and dried on‐surface is delivered to an expansion device underground whereupon it is ‘let down’ to provide a very low‐temperature air stream. Cooling is delivered to hot mine intake air simply by allowing it to mix with the cold exhaust of a turbo‐expander or eductor. A simplified performance model for a minimum compression work hydraulic air compressor (HAC) is presented, and the formulation is extended to include the expansion device, focusing on the use of an eductor geometry. As it pressurises the mine air that passes through it, the eductor behaves as an underground booster fan, with no moving parts, that cools and dehumidifies the mine air. For the mine, HAC plus eductor systems produce compressed air very cheaply (CAD 6.11/tonne for an open loop HAC, CAD 1.52/tonne for a run‐of‐river HAC) but only the latter returns a discounted cost of refrigeration supplied of CAD 27/MWhr which is 33% of the CAD 83/MWhr for the incumbent vapour compression refrigeration technology.
Keywords: reverse Brayton cycle, mine refrigeration, hydraulic air compressor, eductor cooling
1 Introduction According to Sheer et al. (1986), the first suggestion of use of a mine‐scale sized reverse Brayton cycle (RBC) air refrigeration system was in 1932 by Egan and Ewing (1937). Youngworth (1937) also suggested a variant using a compressed air motor as the work extracting expander, where the air motor work is used to drive the ventilating fan rotor. When these situations arise, effectively it is an RBC refrigeration system that is being exploited. The development of frost or icing around the exhaust ports on pneumatic powered jackleg rock drills is another firsthand example, for those in the mining industry, of the refrigeration effect that is the subject of this paper. In the early part of this work, the RBC is explained and then compared with the accepted, incumbent, solution for many mines requiring cooling: a vapour compression refrigeration (VCR) system against which it must compete. At the heart of both types of system is a compressor: a refrigerant compressor for the VCR, and an air compressor for the RBC. That compressors are generally expensive to operate is a principal reason why the costs associated with mine refrigeration are high. The RBC alternative proposed thus adopts a hydraulic air compressor (HAC) because it promises low‐cost, energy‐efficient gas compression. Consequently, a simplified model of the design and performance of a HAC is presented in the central part of the paper. The second major component of an RBC is an expansion device, and in this case two options are considered in the analysis. A turbo‐expander driving a generating set is considered and compared against a no‐moving‐parts eductor. The eductor option is discussed in some detail because for this work, it not only generates the actual coolth that will lower the temperature of the mine air, it also causes active mixing with the mine air for coolth delivery.
https://papers.acg.uwa.edu.au/p/1710_09_Millar/

A reverse Brayton cycle mine refrigeration system DL Millar
116 Underground Mining Technology 2017, Sudbury, Canada
1.1 del Castillo’s reverse Brayton cycle cooling system In 1988, del Castillo proposed implementation of an RBC mine refrigeration system by means of a surface‐installed conventional single‐stage mechanical air compressor equipped with an aftercooler and drier, coupled to a subsurface turbo‐expander driving an electrical generator. As it depressurises across the expander, the air is exhausted at very low temperature. As this cold air stream mixes with mine ventilation air, the latter is cooled; refrigeration effect is provided while electricity is produced using the shaft work. The mixed air then passes to the mine workings where the air is warmed and then returns to atmosphere via an upcast shaft or raise. In this cycle, illustrated in Figure 1, air is both the cycle refrigerant and the mine air coolant. The cycle coefficient of performance (COP) depends on the net work input, that is, the difference between the work input at the compressor, inW , and the work delivered by the expander, outW ,
and the refrigeration effect achieved by mixing the cold expander exhaust with the mine ventilation air.
outin
r
WW
QCOP
(1)
del Castillo (1988) cited the COP being in the range 0.7 to 1.2, and further suggested that air cycle refrigeration would be superior to vapour compression systems at 3,500 m and deeper. An important contribution of that work was the report of the potential for moisture in compressed air, or the mine air being cooled, to freeze across the turbo‐expander process. This raises some doubts on the reliability that may be expected of that equipment in prolonged service. If the moisture is in the compressed air, a need for desiccant driers after the aftercooler, with regenerative capacity, would challenge the economics of such a system further.
Figure 1 Schematic of eductor-based dehumidifying, cooling mine fan, driven by compressed air
1.2 An alternative reverse Brayton cycle refrigeration concept Herein, del Castillo’s RBC proposal is conceptually upgraded and then subjected to re‐assessment. The first upgrade considered is replacing the conventional compressor (such as that illustrated on the right of Figure 1) with an isothermal HAC with higher compression efficiency than conventional incumbents. Secondly, the turbo‐expander (such as that illustrated on the left of Figure 1) is replaced with an eductor geometry (Figure 2). In the eductor the primary motive fluid is compressed air which is expanded and cooled in a convergent‐divergent (CD) nozzle, with its irreversibility characterised using an isentropic efficiency, to form a high‐speed supersonic jet. The jet is directed to the throat of a second, larger CD nozzle whereby induced suction pressure as well as mixing and momentum transfer in the throat result in the secondary mine ventilation airflow being actively drawn into the system. The diffuser section downstream of the throat causes the mixed air to re‐pressurise, so that between mine air inlet and outlet there is an overall pressure rise. At the point of mixing, as the compressed air has lower moisture content than the mine ventilation air, the outlet mixture has lower moisture content than the mine air at inlet and the mine air is effectively dehumidified through the mixing process (Millar 2014).

Ventilation
Underground Mining Technology 2017, Sudbury, Canada 117
Figure 2 Schematic of eductor-based dehumidifying, cooling mine ‘fan’, driven by compressed air
The proposed eductor structure both creates coolth in the primary CD nozzle, as occurs at the evaporator of a vapour compression refrigerator, and delivers coolth in the secondary CD nozzle, as at cooling coils or at a bulk air cooler (BAC).
The motivation for re‐examination of del Castillo’s concept, as is done herein, is fourfold:
Compressed air could be produced much more cheaply in a HAC than a conventional compressor.
The primary nozzle of the eductor that produces the cold air is a small (~0.2 m diameter) solid metal device with no moving parts. Issues of concern regarding maintenance and reliability are substantially reduced in comparison with incumbent turbo‐expander machinery. This nozzle will be trivially cheap.
For MWr scale mine refrigeration (subscript r for ‘refrigeration’, th for ‘thermal’, e for ‘electricity’), the larger CD geometry of the eductor is conceived to be formed using shuttering for poured concrete (with minimal reinforcing required) within a cooling drift; an inexpensive modification to an existing underground structure. Such a facility would be installed in a drift parallel to the main access drive, close to the downcast shaft, on the level on which refrigeration is required. The main drift would require an air lock, as for a booster fan.
The cooling eductor geometry is compact; there may be cost benefits of reducing the volume and complexity of underground space that requires development to accommodate refrigeration equipment.
1.3 Ideal Brayton power cycle The Brayton cycle is a thermodynamic power process cycle which is most commonly used to describe the performance of so‐called ‘gas turbine’ equipment. An excellent, detailed, instructional description is provided by Eastop and McConkey (2009). Ideally, it is conventionally taken to comprise (i) an isentropic compressor where work is done on the working fluid (1–2’ – as shown in Figure 3) passing through the system which raises the latter’s temperature and pressure, (ii) a high‐pressure (HP) heat exchanger (HX) where heat is added to the working fluid isobarically (2’–3) so that its temperature and enthalpy is increased further, (iii) an isentropic expander which abstracts work from the working fluid (3–4’), allowing the latter to depressurise and cool, and (iv) a low‐pressure (LP) HX that isobarically removes further heat from the working fluid (4’–1) to bring the latter back to the same state at which it entered the compression stage, so that the cycle is formed.

A reverse Brayton cycle mine refrigeration system DL Millar
118 Underground Mining Technology 2017, Sudbury, Canada
(a) (b)
Figure 3 (a) Vapour compression (refrigeration – blue) cycle; (b) Normal (power – red) and reverse Brayton (refrigeration – blue) cycle
To make these components behave as a power cycle, sufficient heat must be provided in the HP HX (2’‐3 or 2‐3), and be removed in the LP HX (4’‐1 or 4‐1) so that the work abstracted from the working fluid in the expander is greater than the work expended in the compressor. The surplus work can be applied to some external use in order to provide shaft work as in a gas turbine electricity‐generating set or a rotor in a helicopter engine, or to develop thrust as in a jet engine.
1.4 Practical Brayton power cycle Practically, (i) both compressor and turbine compressor deviate from isentropic ideals, the extents of which are defined by isentropic efficiencies, and mean that working fluid leaves these devices at 2 (as defined in Figures 3 and 4 respectively), (ii) the HP HX (2–3) constitutes a combustor where fuel is burnt within the working fluid so that heat is added directly, and (iii) the LP HX (4‐1) can constitute direct mixing of the working fluid with atmospheric air isobarically, in which case the cycle is described as ‘open’. If an indirect HX was used to implement the isobaric cooling process (4–1), then the cycle would be described as ‘closed’ instead.
Figure 4 Construction process, approximate dimensions and summary process flow diagram for a 40,000 Scfm HAC adopting the open loop concept driven by 7 MWe pumps

Ventilation
Underground Mining Technology 2017, Sudbury, Canada 119
1.5 Reverse Brayton (refrigeration) cycle In the RBC, the same components are required, and the sense of flow of the working fluid around them is the same as for the (forward) Brayton cycle: (i) compressor (1–2 (as defined on Figure 3)), (ii) HP HX (2–5), (iii) expander (5–6), (iv) LP HX (6–1). The term ‘reverse’ in reverse Brayton cycle in fact refers to the sense of heat transfers in the HP and LP heat exchangers. In the RBC, heat is removed from the working fluid in the HP HX (2–5) and heat is added to the working fluid in the LP HX (6–1). The HP HX removes heat from the working fluid after a compression process and so may be described as an ‘aftercooler’. As heat is transferred to the low‐temperature working fluid from the surroundings in the LP HX, this process provides a refrigeration effect (6–1). It can be direct so that the cycle is open, or indirect so that the cycle is closed.
2 Details of the proposed reverse Brayton cycle mine cooling concept Having reviewed the Brayton power and refrigeration cycles generally, in the following section, sufficient detail is provided such that the reader may establish simplified performance models of both a HAC and an eductor to support conceptual engineering studies.
2.1 Hydraulic air compressor principles A HAC, as articulated by Millar (2014) and shown in Figures 4(a) to (d), uses either (i) run‐of‐river (ROR) water or (ii) recirculating pumped water (in an open loop, OL) to induct and then concurrently cool and compress air in the downcomer of such devices (Figures 4(c) and (d)). In either case, the air is compressed isothermally, a minimum work compression, rendering the process maximally energy efficient. At the base of the downcomer, the two phases of the bubbly flow are separated in a gravity separator; the velocity of the flow is reduced sufficiently such that buoyancy forces dominate over drag forces and the compressed air bubbles rise and coalesce to form a compressed air plenum above the surface of the water. Compressed air can be drawn off from this plenum. With the use of a simple proportional, integral, derivative control loop between a water level sensor in the separator and a delivery valve in the air delivery line, the compressed air delivery flow rate is regulated such that the level of the water in the separator chamber remains steady. Water, free of bubbles, returns to atmospheric pressure by ascending to the tailrace chamber along the riser.
Figure (d) shows circulation pumps lifting water in the tailrace back to the forebay to complete the OL water circuit. In a ROR HAC, water from a water course would enter the HAC at the forebay and return to the water course at the tailrace. In either OL or ROR HACs, the 17 m head between the forebay and the tailrace (shown in Figure 4(d)) drives the water through the system. The pressure of air delivered by a HAC is constant, governed by the difference in elevation between the water level in the separator and the water level in the tailrace (84 m ≡ 8.24 bar(g) = 120 psi(g)) in Figure 4(d)). This is a design variable that can be set by choosing the depth of the separator. Although the water flow rate is high throughout, the water velocity in the riser is relatively low due to the latter’s relatively large cross‐sectional area. In the downcomer, the diameter(s) is (are) smaller to keep the water velocity high, in order to drag air bubbles down with the flow.
As the mass flow of the water is typically 1,000 times higher than that of the air, and the heat capacity of the water is around four times that of the air, despite the gas compression heat being transferred to the water, this produces a temperature rise of only a few mK in the water during the transit of any individual bubble down the downcomer. Over time, in a closed or open loop HAC, without an active water cooling system, the temperature of the circulating water would rise. Consequently, the upper section of the forebay chamber is designed to act as a cooling tower for the water (which would require the pumps to provide a few metres of additional head, without an increase in driving head between the two atmospheric reservoirs). In a ROR HAC, the compression heat is removed entirely from the system when the water is returned to the water course from which it was abstracted.

A reverse Brayton cycle mine refrigeration system DL Millar
120 Underground Mining Technology 2017, Sudbury, Canada
The scheme illustrated in Figure 4 also illustrates a modern construction methodology utilising raiseboring for a unit providing 40,000 cfm of compressed air at 120 psi(g). This is of a scale equal to the largest HAC ever built, at Ragged Chutes in Northern Ontario, in 1908 (Langborne 1979). The construction methodology assumes that there is no prior underground access available at a given site. Clearly, if it were available, the structure could be established without the need for an access decline to be driven. Underground access could also be provided, without developing the decline, by means of blind shaft boring – depending on ground conditions and shaft diameters.
2.2 A simplified model of hydraulic air compressor performance There are 18 confirmed cases of HAC installations constructed between 1896 and 1929, with performance summarised in Figure 5, many of which are discussed in detail by Schulze (1954), the definitive source on the subject. Published performance data from these installations has been re‐analysed by Pavese et al. (2016) who revised the cited mechanical and overall efficiencies of the devices (downward) to account for gas solubility effects, whether the airflow was measured at the inlet or outlet of the installations, and the influence these factors have on the yield of compressed air from the systems.
(a) (b)
Figure 5 Empirical trends in HAC performance. (a) DQH / versus am ; and, (b) Yield versus DH / . Red dots are am underpredicting case extensions to the empirical record used in Section 4, Table 1
The essential Achilles’ heel of HACs is that gases dissolve in water and do so more readily as the pressure increases. Based on the work of Rice (1976), and Chen and Rice (1982, 1983), Young et al. (2016) provide some details of an improved formulation for the coupled hydrodynamics, psychrometrics and gas solubility kinetics of the downcomer’s two‐phase bubby flow that has been generalised to accommodate a multitude of aqueous chemical systems. The complete details of the formulation of this model can be found in Young (2017). The model itself awaits full verification with experimental data from a large‐scale pre‐commercial demonstrator installation where salts that modify the solubility behaviour of gases can be added to the circulating water flow.
The re‐analysis of the historical systems is nevertheless useful in providing HAC design guidance. In general, for a HAC, the greater the available hydropower to drive the water flow, the greater the airflow inducted into the system and delivered at outlet. Also, the deeper the riser, the higher the delivery pressure, and so the proportion of available hydropower that can be used to compress air falls because rubbing resistance increases with depth. A HAC will simply induct less air to ensure all the available hydropower is consumed
60
65
70
75
80
85
90
95
100
0 0.5 1 1.5 2 2.5
H/D
Yie
ld (
%)
-77oC
-30oC
0.01
0.1
1
10
100
0.001 0.01 0.1 1 10 100
QH/D
Inp
ut
ma
ss f
low
ra
te o
f a
ir (
kg/s
))

Ventilation
Underground Mining Technology 2017, Sudbury, Canada 121
while respecting the pressure boundary condition in each atmospheric tank. A plot of available hydropower over delivery pressure versus the mass flow of air at inlet, am (Figure 5(a)), thus produces a coherent trend
across the historical HAC performance data, summarised as:
DQHma 75.3
(2)
where:
Q = the water discharge.
Q = wwm (m3/s) with w = the water density.
H = the available head between the atmospheric tanks (m).
D = the depth of the water level in the separator below that in the tailrace.
The historical database limits the applicability of Equation 2 to 9826.50033.0 DQH . As the delivery
pressure (riser depth) increases, so the gas solubility physics dictates that the mass of gas dissolved in the water will increase. As the available head increases, so the discharge required to consume a given amount of available hydropower reduces, and with lower discharge, so the solubility potential reduces. Consequently, as the head increases, less gas may be expected to dissolve in the circulating water. Across the historical HAC performance data, the yield (%) of compressed air at outlet is well‐approximated (R = 0.99) by the function:
4
3
21
,
,
1C
outa
ina
D
HC
CC
m
my
(3)
where:
1C = 100.5651
2C = 33,490,400
3C = 174,633,353
4C = 0.812946 (Figure 5(b)).
The historical database limits the use of Equation 3 to 986.11453.0 DH .
The mechanical efficiency of a HAC in converting the available hydropower to the pneumatic power will be
indicated by am (larger is better) and the delivery pressure (higher is better). The trend is approximately
quadratic across the historical HAC fleet (see Pavese et al. 2016).
At a point, 1, of air and water mixing at the top of the downcomer, heat will be transferred between the phases, such that they have the same temperature, and will approximate that of the water due to its far more massive presence. As the flow descends to a point, 2, at the bottom of the downcomer, the overall mechanical efficiency of the compression process can be written as the ratio of the indicated power,
indW , (kW) to the input power, inputW , (kW):
gH
m
mTT
PPTTR
ygH
m
mTT
PPTTR
m
m
Wm
VdPm
W
W
a
w
a
wa
a
ina
a
input
indoverall
1,
12
1212
1,
12
1212
2,
1,
2,
2
11, ln
ln
ln
ln
(4)

A reverse Brayton cycle mine refrigeration system DL Millar
122 Underground Mining Technology 2017, Sudbury, Canada
where P and T are absolute pressures and temperatures, subscripts w and a stand for water and air respectively, R is the gas constant and y is the yield. The pressure ratio of a HAC is:
atmwatm PgDPPP /12 (5)
Due to solubility effects, the mass flows of air at inlet and outlet are not necessarily the same; y defines
the yield of compressed air, numerator and denominator of the right quotient of Equation 4 define a mechanical efficiency (ignored or absent solubility effects) in work terms (J/kg).
mechoverall y (6)
and the denominator on the right quotient of Equation 4 is the available hydropower per unit mass of inducted air. Due to the transfer of compression heat between the phases during their transit down the downcomer, the water and air experience a small temperature rise, T :
w
a
wpa
a
w
Cm
mC
gHm
m
TTT
12
(7)
involving the water and air heat capacities wC and paC , (J kg‐1 K‐1). The temperature ratio of a HAC is
always close to, but above, unity:
1112 TTTTT (8)
In the compression process, the rate of heating (kW) of the water (and cooling of the air) is:
TCmq ww (9)
and if the water temperatures in the system are to remain steady, this heat must be removed from the circulating water in open loop systems. Quantifying the expected performance of a HAC according to this simplified performance model is thus achieved as follows. Knowledge of H , Q and D empirically estimate
am with Equation 2. H and am , define the available hydropower. Knowledge of D alone defines the
expected delivery pressure, and the pressure ratio (Equation 5). Q and am with the environmental input
air and water temperatures, and heat capacities define 1T . Equation 7 is used to establish the nearly
isothermal temperature rise, and the temperature ratio (Equation 8). Pressure, temperature and mass flow rate ratios, and H permit the indicated work and the mechanical efficiency (Equation 4) to be established. Equation 3 then empirically estimates y and permits the overall efficiency to be estimated too.
2.2.1 Case study example: hydraulic air compressor performance Using the aforementioned scheme, for H = 16.92m, D = 83.97 m (Figure 4) and Q = 29.6 m3/s (Ragged
Chutes, see Langborne (1979)), if solubility effects are to be ignored (or suppressed through judicious selection of an aqueous chemistry), 22.4 kg/s ≡ 18.6 Sm3/s ≡ 39,359 Scfm air will be produced at 8.2 bar(g) ≡ 119 psi(g). Mechanical and overall efficiency will be 86%, but with pump and motor efficiencies of 93% and 95% respectively, the total electric power consumed will be 5.56 MWe. A 40 mK temperature rise (nearly isothermal) will occur in the downcomer transit and the circulating water will need to be cooled at a rate of 4.9 MW. With the same geometry applied in an ROR application, where there is no opportunity to manipulate gas solubility, the same mass flow rate of water delivers yield of 76% and 17.0 kg/s ≡ 14.12 Sm3/s ≡ 29,918 Scfm air will be produced at the same pressure. Mechanical efficiency is again 86%, but overall efficiency falls to 65% due to the yield. There are no pumps or motors to consider in this situation, but the hydropower consumed is 4.9 MW. The water temperature again increases by 40 mK in its downcomer transit and 4.9 MW of compression heat is discharged to the water course at the tailrace. In an isothermal compression process, the heat transferred from the gas is equal to the work done on the gas.

Ventilation
Underground Mining Technology 2017, Sudbury, Canada 123
2.3 Expander
2.3.1 Performance of expansion devices There are two options for the expansion device. The first is a turbo‐expander (Figure 6) that will let down the pressure of the compressed air, deliver low velocity air at very low temperatures and will produce shaft work which may be used to turn a generator. The second option is the internal CD nozzle in the alternative presented in Section 2.20. Both of these systems aim to do the same thing: to expand compressed air to render it cold so that when the latter mixes with ventilation air, a refrigerating effect is realised.
Figure 6 Competing options for the expansion device. State labels correspond to those for the RBC scheme of Figure 3
Following the sign conventions for work and heat transfers defined by McPherson (1993), for either option, the installation conditions can be regarded as adiabatic and level, and the air can be assumed to be a perfect gas with constant heat capacity so that:
5656
26
25
2TTCw
uup
(10)
In order to achieve a given cooling effect: 56 TT , work in the process, 56w (J/kg), must be abstracted from
the system, or, if no work is removed, the velocity of the air must accelerate so that 56 uu . In an
alternative interpretation, if air is to be cooled with a turbo‐expander, the turbo‐expander exit velocity must be minimised (through choice of a large cross‐sectional area for the flow at exit) and the efficiency of the turbo‐expander must be maximised. If air is to be cooled with a nozzle, where no work is extracted at all, the exit velocity of the air must be maximised.
For a given mass flow of air, am , the useful mechanical work delivered by the turbo‐expander is:
2
26
25
5656uu
hhw
. (11)
For a turbine 056 w , so that enthalpy, (J/kg), 56 hh and, the greater the exit velocity, 6u , the lower the
extracted power. Thus the exit cross‐sectional area is selected so that 05 u , that is, the exit area is larger
than the inlet area to account for the reduction in air density due to the depressurisation. There is a maximum, ideal, amount of work that can be extracted from the depressurising air and this is:
2
25
5,6max,56u
hhw isen
. (12)

A reverse Brayton cycle mine refrigeration system DL Millar
124 Underground Mining Technology 2017, Sudbury, Canada
The extent to which the actual process deviates from this ideal is characterised by the isentropic efficiency:
2
2
25
5,6
26
25
56
max.56
56
uhh
uuhh
w
w
isen
isen
(13)
2.3.2 Equivalence of isentropic efficiency for nozzle and a turbo-expander Case 1 (Figure 7): For the case of a 22.73 kg/s mass flow of air at 9.18 bar (abs) and 36°C entering a turbo‐expander via a 0.5 m diameter pipe and adiabatically exhausting to 1.31 bar (abs), the lowest (isentropic) temperature at turbo‐expander exit is: ‐96.57°C, when the velocity at input is 11.19 m/s and that at outlet is 11.15 m/s (for an outlet area four times that of the inlet). If the turbo‐expander has an isentropic efficiency of 85%, then, for the same inlet conditions and geometry, the exit temperature expected is ‐77.0°C and the exit velocity is 12.40 m/s.
Figure 7 Expansion of compressed air through a nozzle or turbo-expander
Case 2: It is interesting to note what happens in the aforementioned example, if the isentropic efficiency of the turbo‐expander is set to zero, corresponding to the case where the turbo‐expander delivers nil shaft work, equivalent to a ‘no‐load’ condition on the generator to which the shaft may be connected. In this instance, the exit temperature of the air would be 34.35°C and the exit velocity would be 19.49 m/s. The turbo‐expander needs to deliver work in order to provide low‐temperature air for cooling.
Case 3: Following on from the previous case, to produce a lower temperature of air under the no‐load condition, the air at the exit of the turbo‐expander could be throttled with a valve by reducing the area of the exhaust port. Adjusting the exit flow area to 10.47% of the inlet area, the temperature at the exit would be lowered back to ‐77.0°C and the exit velocity would be 473.73 m/s. In effect, under this condition, the throttled, no‐load, turbo‐expander behaves as a nozzle that has traded output work for exit air velocity to bring about the same state of the air at exit as when under full load.
If, instead of a turbo‐expander, the state in Case 3 had been brought about by a CD nozzle, then as the ideal process for such a nozzle is also isentropic, the extent of deviation of the actual process through the nozzle due to irreversibility is measured with Equation 13 too.
2.3.3 Sources of irreversibility in the eductor primary (motive) flow There are two main sources of irreversibility to consider in design of a CD nozzle for cooling purposes: friction and shock losses, and the latter are much more important. Without shock irreversibilities, isentropic efficiencies of CD nozzles can reach over 90%. The reader is directed to the excellent online

Ventilation
Underground Mining Technology 2017, Sudbury, Canada 125
resource maintained by Devonport (2001) to understand how relations between the area ratio and pressure ratio of a CD nozzle lead to the occurrence of shocks within and beyond the exit plane of the nozzle. For the current presentation, the key points are these:
That the occurrence of a shock front/shockwave in a CD nozzle is generally a consequence of the nozzle operating in off‐design conditions.
If a shock occurs in a nozzle, it represents a major source of irreversibility, substantially higher than frictional loss, which will depress the isentropic efficiency of the nozzle appreciably. During laboratory investigations in support of this work, isentropic efficiencies below 5% were reliably measured. Essentially, shock front irreversibilities consume the refrigerating effect otherwise developed by CD nozzles as they expand pressurised gas. The irreversibility consumes flow work, slowing the flow, and converts this to heat which increases the temperature of the jet. Shockwave occurrence must be completely avoided for this cooling application of CD nozzles. Elsewhere, thrust is the priority.
CD nozzles have design conditions where no shocks arise, the velocity of the jet remains supersonic and the temperatures of the issuing jets are decades lower than they are at input. The area ratio of CD nozzles (area of throat/area of exit) must be selected to suit particular pressure ratios ( 65 PP , Figure 3) for shock‐free jets. A significant difference between propulsion CD nozzle
design and the design approach herein is that, in general, the gases to be expanded in a propulsion nozzle are combustion gases that may have temperatures over 1,000°C. Here, the compressed air considered for expansion has an ambient starting temperature.
Off‐design conditions occur quite frequently in propulsion nozzle design because the space into which the jet issues can have back‐pressure 6P that varies appreciably (e.g. with altitude).
In mines, the back‐pressure will fluctuate modestly (a few kPa) around a value corresponding to the elevation at which the cooling nozzle has been installed. A nozzle of fixed geometry may thus be designed to stay within shock‐free design conditions, particularly if equipped with an adjustable pressure regulator, to maintain the pressure ratio ‘seen’ by the nozzle.
2.3.4 Motive nozzle design The ideal process for a CD nozzle is an isentropic process. In the ideal, reversible, process of a CD nozzle, the pressure ratio, temperature ratio and density ratio at all sections throughout the nozzle (irrespective of shape – e.g. rectangular, circular or other) are related by:
1
5
6
1
5
6
5
6
P
P
T
T
(14)
if the gas is considered an ideal gas. vp CC is the isentropic coefficient that has a value of 1.4 for air.
Subscripts 6 and 5 are used for consistency with the RBC shown in Figure 3. Thermodynamic state variables, P and T , define all other properties of state including the entropy, S , which will remain constant for the ideal process. The real process will deviate from the ideal process; the deviation is characterised by the
isentropic efficiency (Equation 13). For the current cooling application, the knowns are: (i) 5T , the
compressed air delivery temperature which is assumed to be equal to the mine ventilation air temperature due to heat transfers across the compressed air delivery range as the air is supplied to the nozzle, and
(ii) 6P and isenP ,6 , the nozzle exhaust back‐pressure which is readily established from mine ventilation
surveys or mine ventilation simulators. The design problem then becomes one of solving for the pressure of
compressed air delivered to the CD nozzle, 5P , given a selected, shock‐free, exhaust temperature, 6T , and a
design nozzle isentropic efficiency, constraining the value of 5P with Equations 13 and 14. Practically, one

A reverse Brayton cycle mine refrigeration system DL Millar
126 Underground Mining Technology 2017, Sudbury, Canada
can solve numerically for the entropy increase between state 6 and 6isen that is consistent with the isentropic efficiency and the isentrope (Equation 14) between state 5 and 6isen.
2.3.5 Case study example: motive nozzle design and performance
For a choice of 6T = ‐77°C, observed back‐pressure 6P = 131 kPa (abs), observed compressed air delivery
temperature 5T =36°C and specified isentropic efficiency of 85% the increase of entropy is 0.106 kJ kg‐1
K‐1and the required compressed air delivery pressure is 5P = 918 kPa (abs). This is just under the pressure of compressed air that can be supplied with the HAC system illustrated in Figure 4. With knowledge of the delivery states of air for the ideal and real process, the CD nozzle critical pressure and temperature are given by:
1
5 1
2
P
Pc
1
2
5 T
Tc
(15)
and the critical velocity is:
22
2
55u
hhu cc (16)
where the critical enthalpy ch and critical density c are established using the equation of state for the air
and the other state variables. With a specified mass flow, values of the key geometric parameters for the CD nozzle to be fabricated can then be determined. The nozzle throat area is given by:
ccac umA
(17)
with identical expressions applying at nozzle inlet and exit planes. For the process end point states used
earlier: cP = 500 kPa, cT = 268.3 K = ‐4.9°C, ch = 267.3 kJ/kg, c = 6.517 kg/m3, cu 285.4 m/s. With a
given air mass flow of 22.37 kg/s, the throat area cA = 0.012 m2 and throat diameter, cD = 0.124 m. At
the exit, 6A = 0.020 m2 and 6D = 0.161 m. The compressed air delivery pipe diameter of 0.37 m (16”) is
designed for a compressed air velocity maximum of 20 m/s and a circular ‘bell mouth’ form is assumed for the convergent section of the nozzle. The length of the divergent section will be governed by the nozzle area ratio and a requirement to keep the angle of divergence around 17° or below to prevent flow separation. For the conditions given in the example, this nozzle, of a scale of around 20 cm in diameter, will produce cooling power of:
5656 hhmq a 2,508 kW (18)
2.3.6 1D conceptual framework for eductor performance Huang et al. (1998) present a 1D analytical model for eductors incorporating empirical coefficients arising from extensive testing on eductors of millimetre‐scale diameters at throat and exit planes. Despite the size, the basic formulation is the same as required herein for scales of metres. The essential problem is given that: (i) an eductor geometry (the larger CD nozzle in Figure 2), (ii) mass flow, temperature and (back‐)pressure at the exit of the primary (motive) nozzle (from Section 3.3.4), and (iii) (back‐)pressure, temperature and velocity of the secondary (inducted) mine ventilation airflow at inlet to the cooling drift in which the motive nozzle is mounted, from mine ventilation surveys or mine ventilation simulators, determine the condition (pressure, temperature, velocity and possibly moisture content) of the mixed flow at the exit of the cooling drift that then proceeds to provide a refrigerating effect to the mine workings.
The solution to the problem depends on the work and heat transfers between the primary and secondary flows in the eductor. For a conceptual study level of accuracy, these transfers can be solved by applying the

Ventilation
Underground Mining Technology 2017, Sudbury, Canada 127
steady flow energy equation, as cast by McPherson (1993), simultaneously to both primary (subscript p) and secondary (subscript s) air flows from the point where the two flows are first in contact at the inlet plane of the primary, 1, to the exit plane of the cooling drift, 2.
ssssssss
ssssss
pppppppp
pppppp
PuFwPu
huqwhu
PuFwPu
huqwhu
2222121211
21
12212121
21
2222121211
21
12212121
21
22
22
22
22
(19)
where, for example, sF12 is the frictional energy loss of the secondary mine airflow rubbing on the surfaces
of the eductor (J/kg), which can be estimated using Atkinson friction factors, the geometry of the duct and an average density for the secondary’s fluid’s process to the mixed state. Work done on an airflow and heat added to an airflow is generally taken as positive, and in this case, the expectation is that heat will be added to the primary from the secondary and work will be done on the secondary by the primary. So:
sspp
sspp
qmqm
wmwm
1212
1212
(20)
reflect the work and heat transfers associated with mixing the two flows. Substituting and simplifying Equations 18 and 19 produces:
pssssspppps
pssssspppps
mmFPhFPhq
mmFPuFPuw
1
122
121111211112
1211211211
2112
(21)
permitting estimates of the work and heat transfers to be made from information conditions (i) to (iii). Clearly,
also on the inlet side sp PP 11 and at the outlet of the cooling drift: sp PP 22 ; sp hh 22 ; sp 22 ; sp uu 22
because the flows will have completely mixed and have states indistinguishable from one another.
2.3.7 Case study example: eductor performance
If the example outlet air condition from Section 3.3.4 is adopted together with sP1 = 131 kPa (equivalent to
the pressure at the bottom of a shaft 2,500 m deep), sT1 = 309 K = 36°C, and su1 = 10.56 m/s (so that
169 m3/s or sm = 245.4 kg/s are being inducted and cooled) and the hydraulic mean diameter of the concrete
formed (Atkinson’s k = 0.004 kg/m3) cooling drift is 4 m, then: sw12 = 2.466 kJ/kg secondary airflow, pw12
= ‐27.049 kJ/kg primary airflow, sq12 = ‐8.747 kJ/kg secondary airflow and pq12 = 95.950 kJ/kg primary
airflow. The corresponding heating power applied to the mine airflow is sq12 = ‐2.146 MWr, i.e. it is cooled. It
is also important to note that mechanical work is done on the mine air at a rate of sw12 = 0.605 MW, the
source of this power being the high‐speed air jet. It may seem surprising to the reader that this occurs, but it is a consequence of utilising the eductor geometry to mix the cold, high‐velocity primary air stream with the mine air, rather than simply releasing the cold jet into a 4 × 4 m uniformed cross‐sectioned drift. Had the latter scheme been adopted, the useful mechanical work in the air jet would have been dissipated entirely to turbulence in a mine ventilation air stream driven by main fans alone.
2.3.8 Computational fluid dynamics simulations of eductor performance This work is at too early a stage to submit design recommendations, for the area ratio of the larger CD nozzle forming the body of this mine‐scale eductor, however, aside from the crude 1D formulation presented, computational fluid dynamics (CFD) simulations have been undertaken to develop understanding of the advanced effects of mixing turbulence and dissipation due to viscosity, at the scale of the example problem that has been followed so far within this paper. The results of one such simulation where a pressure increase
A reverse Brayton cycle mine refrigeration system DL Millar
128 Underground Mining Technology 2017, Sudbury, Canada
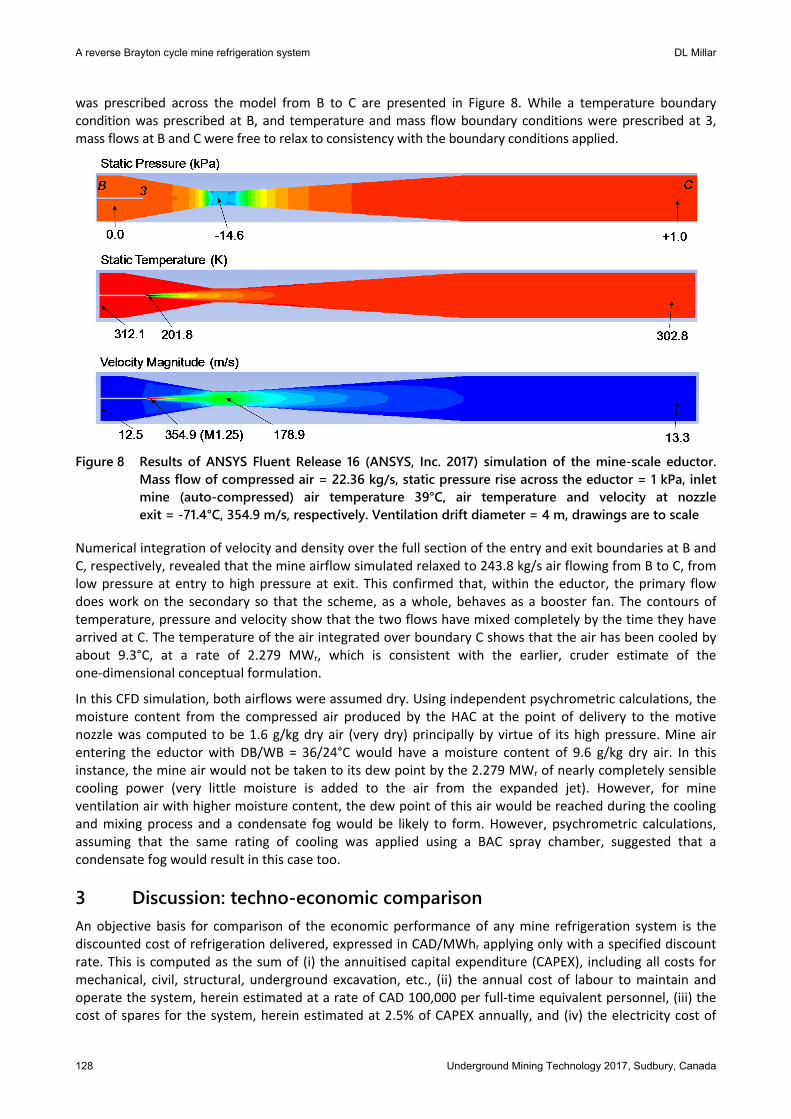
was prescribed across the model from B to C are presented in Figure 8. While a temperature boundary condition was prescribed at B, and temperature and mass flow boundary conditions were prescribed at 3, mass flows at B and C were free to relax to consistency with the boundary conditions applied.
Figure 8 Results of ANSYS Fluent Release 16 (ANSYS, Inc. 2017) simulation of the mine-scale eductor. Mass flow of compressed air = 22.36 kg/s, static pressure rise across the eductor = 1 kPa, inlet mine (auto-compressed) air temperature 39°C, air temperature and velocity at nozzle exit = -71.4°C, 354.9 m/s, respectively. Ventilation drift diameter = 4 m, drawings are to scale
Numerical integration of velocity and density over the full section of the entry and exit boundaries at B and C, respectively, revealed that the mine airflow simulated relaxed to 243.8 kg/s air flowing from B to C, from low pressure at entry to high pressure at exit. This confirmed that, within the eductor, the primary flow does work on the secondary so that the scheme, as a whole, behaves as a booster fan. The contours of temperature, pressure and velocity show that the two flows have mixed completely by the time they have arrived at C. The temperature of the air integrated over boundary C shows that the air has been cooled by about 9.3°C, at a rate of 2.279 MWr, which is consistent with the earlier, cruder estimate of the one‐dimensional conceptual formulation.
In this CFD simulation, both airflows were assumed dry. Using independent psychrometric calculations, the moisture content from the compressed air produced by the HAC at the point of delivery to the motive nozzle was computed to be 1.6 g/kg dry air (very dry) principally by virtue of its high pressure. Mine air entering the eductor with DB/WB = 36/24°C would have a moisture content of 9.6 g/kg dry air. In this instance, the mine air would not be taken to its dew point by the 2.279 MWr of nearly completely sensible cooling power (very little moisture is added to the air from the expanded jet). However, for mine ventilation air with higher moisture content, the dew point of this air would be reached during the cooling and mixing process and a condensate fog would be likely to form. However, psychrometric calculations, assuming that the same rating of cooling was applied using a BAC spray chamber, suggested that a condensate fog would result in this case too.
3 Discussion: techno-economic comparison An objective basis for comparison of the economic performance of any mine refrigeration system is the discounted cost of refrigeration delivered, expressed in CAD/MWhr applying only with a specified discount rate. This is computed as the sum of (i) the annuitised capital expenditure (CAPEX), including all costs for mechanical, civil, structural, underground excavation, etc., (ii) the annual cost of labour to maintain and operate the system, herein estimated at a rate of CAD 100,000 per full‐time equivalent personnel, (iii) the cost of spares for the system, herein estimated at 2.5% of CAPEX annually, and (iv) the electricity cost of

Ventilation
Underground Mining Technology 2017, Sudbury, Canada 129
running the system (at CAD 85/MWhe). This total is divided by the total cooling effect provided at the point of delivery of the coolth over one year: the BAC for the VCR system, and the cooling drift for the proposed RBC system. Plant load factors are assumed to be 100%, reflecting use in an ultra‐deep mine.
Total installed cost, including indirects (engineering, project management, etc.) for a VCR system of a type and configuration as depicted in Figure 9 are estimated at CAD 1.83 million/MWr; where the rating is measured at the point of delivery (the BAC). The corresponding discounted cost of refrigeration delivered is estimated at CAD 83/MWhr with a discount rate of 10%, a plant life of 15 operating years and electricity price of CAD 85/MWh. Such a system was found to have a COP of around 2.1 after auxiliaries (including pressure drop compensating demister fans at the BAC) and compressor and pump and motor efficiencies were applied.
Figure 9 Alternative schemes for refrigeration of deep mines using a conventional VCR plant and an RBC refrigeration scheme

A reverse Brayton cycle mine refrigeration system DL Millar
130 Underground Mining Technology 2017, Sudbury, Canada
For the RBC system based on an open loop HAC, the capital cost of the HAC illustrated in Figure 4 is estimated at CAD 8.9 million including indirects and was assigned a life of 20 years (limited by mine reserves). When gas solubility is not inhibited, the discounted cost of compressed air supplied is estimated at CAD 9.85/tonne at a discount rate of 10%. To put this figure in context, the corresponding figures for conventional, electrically driven, modern compressor installations of this scale is CAD 13/tonne at the same electricity price (of CAD 85/MWh) and CAD 25/tonne if diesel driven compressors are used with a fuel price of CAD 0.94/L.
To supply compressed air refrigerant to a specially excavated cooling drift including drilling of a 2,500 m deep pipe raise to the motive nozzle, another CAD 6.2 million CAPEX needs to be added. After a fan credit of CAD 0.35 million per annum due to the booster fan effect of the eductor, the discounted cost of refrigeration delivered is estimated at CAD 388/MWhr. The COP is woefully low at 0.33. With gas solubility inhibited, the economic performance of RBC improves because more compressed air is produced by the same facility. The discounted cost of compressed air supplied reduces to CAD 7.48/tonne, the fan credit increases to CAD 0.45 million per annum and the discounted cost of refrigeration delivered is CAD 296/MWhr (COP = 0.43 – still woefully low). If a ROR HAC was adopted, gas solubility effects cannot be inhibited, but the pumping electricity costs are removed altogether and the discounted cost of compressed air supplied falls to CAD 2.13/tonne. The discounted cost of refrigeration supplied falls to CAD 104/MWhr (and the COP becomes infinite) and a HAC‐based solution starts to appear competitive with the incumbent VCR scheme.
To investigate the techno‐economics of a HAC‐based RBC further, the compressed air delivery pressures and motive jet temperatures need to be varied away from the case study example values set out thus far. The results of these indicative analyses are summarised in Table 1. The principal variable altered in the performance model is the motive jet temperature. Increasing this to ‐70°C reduces the required compressed air delivery pressure to 785 kPa (abs) (= 114 psi (abs)). The HAC can thus be designed so its separator can be shallower, at 70 m, reducing capital costs for excavations, and with reduced depth, the empirically derived equation (Equation 2) predicts an increase in the mass flow rate of air at the inlet to the HAC.
The RBC system of Figure 4 has been deliberately dimensioned to match the general arrangements of the Ragged Chutes HAC so that the expected performance of the modern system can be expected to be close to that of the system built in the 1900s which operated for 60 years. If the depth of the HAC lowers, then by Equation 2 the mass flow rate at HAC inlet will increase, and will lead to a higher mechanical efficiency by Equations 4 to 6. This empirical part of the scheme may lead to over‐estimates of the intake air mass flow and the mechanical efficiency as the depth of the HAC designed reduces. Thus, the caution that is applied to the scheme in estimating the performance of HACs of this scale as the separator depth reduces,is to constrain the mechanical efficiency to the 86% that was evident at the historical Ragged Chutes plant. Under these conditions, it may be appreciated from Table 1 that as the jet cooling temperature falls, the compressed air pressure required falls, the depth of the separator reduces, the delivered mass flow of air increases, the cooling power increases, the eductor ‘fan power’ increases, the COP improves (but still remains woefully low in all cases), the financial ‘fan credit’ increases, the capital cost reduces, the discounted cost of compressed air supplied (at reduced pressure!) falls and the discounted cost of refrigeration falls too.

Ventilation
Underground Mining Technology 2017, Sudbury, Canada 131
Table 1 HAC + eductor RBC cooling systems (all for Q = 29.5 m3/s, and H = 16.92 m), OL= open loop, ROR = run-of-river, mechanical efficiency all systems = 85.83%, electricity price CAD 85/MWh
Motive jet temp (°C)
Avail./reqd. pressure (kPa abs)
Riser depth (m)
Case (type of HAC)
Gas solubility
Delivered mass flow (kg/s)
Cooling power (kW)
Eductor fan power (kW)
COP Costs (i = 10%)
Comp air (CAD/tonne)
Refrig. (CAD/MWh)
‐77 922 84 OL Allowed 17.0 1,665 469 0.33 9.85 388
918 OL Inhibited 22.4 2,146 605 0.43 7.48 296
ROR Inevitable 17.0 1,665 469 Infinite 2.13 104
‐70 785 70 OL Allowed 19.1 1,769 560 0.35 8.59 355
785 OL Inhibited 24.1 2,187 692 0.45 6.82 282
ROR Inevitable 19.1 1,769 560 Infinite 1.73 88
‐60 638 55 OL Allowed 22.3 1,888 702 0.39 7.24 320
635 OL Inhibited 26.8 2,233 830 0.47 6.02 265
ROR Inevitable 22.3 1,888 702 Infinite 1.34 70
‐50 521 43 OL Allowed 27.0 2,001 874 0.43 6.11 290
520 OL Inhibited 30.1 2,284 998 0.5 5.27 249
ROR Inevitable 27.0 2,001 874 Infinite 1.05 54
‐40 432 34 OL Allowed 30.1 2,088 1,075 0.47 5.21 266
429 OL Inhibited 33.9 2,320 1,194 0.53 4.63 235
ROR Inevitable 30.1 2,088 1,075 Infinite 0.84 40
‐30 363 27 OL Allowed 34.8 2,150 1,312 0.51 4.45 247
358 OL Inhibited 38.4 2,338 1,427 0.57 4.04 223
ROR Inevitable 34.8 2,150 1,312 Infinite 0.69 27
4 Summary and conclusions The design and performance models for (i) a HAC, (ii) the primary (motive) nozzle of an eductor, (iii) the mixing process model in the outer CD nozzle of an eductor, have been used in a coupled fashion to simplify the assessment of the expected performance of the reverse Brayton open refrigeration cycle system comprising those components. These may be used together in preliminary, conceptual design studies to assess whether or not these technologies may offer increased benefits for deep mine cooling. Caution must be applied when applying this formulation outside the performance database of historical HACs. Techno‐economic analysis suggests that in RBC systems where an open loop HAC is adopted, despite the discounted cost of compressed air producing being ~60% of that of incumbent compression plant, they will not be able to compete on refrigeration cost with a VCR plant. This result is not a consequence of the capital cost of the HAC. It is a consequence of the volume of compressed air needed to bring about a meaningful refrigeration effect being too great – so it is the electricity cost that is the determining factor. This becomes evident when the electricity costs are removed from the appraisal to simulate a ROR HAC being adopted in the RBC instead. In this case, increasing the motive jet temperature of the eductor to ‐30°C resulted in the discounted cost of refrigeration supplied, falling to 33% of the incumbent VCR offer.

A reverse Brayton cycle mine refrigeration system DL Millar
132 Underground Mining Technology 2017, Sudbury, Canada
Acknowledgement Dr Martin Hudyma of Laurentian University suggested that the most efficacious manner in which to secure underground access for raiseboring of the shafts illustrated in Figure 4 was by driving a small ‘sacrificial’ decline. Javier Rico‐Paez undertook valuable work in numerous CFD simulations of eductor geometries, all of which appear in his Masters thesis, and one of which is presented here as Figure 8. The support for this work from the Ultra Deep Mine Network (UDMN), Ontario’s Independent Electricity System Operator (IESO) and the Northern Ontario Heritage Funding Corporation (NOHFC) is gratefully acknowledged.
References ANSYS, Inc. 2017, ANSYS Fluent, version 16, ANSYS, Inc., Canonsburg, viewed 18 July 2017, http://www.ansys.com/Products/Fluids/
ANSYS‐Fluent Chen, L‐T & Rice, W 1982, ‘Some psychometric aspects of a hydraulic air compressor (HAC)’, Transactions of the ASME, Journal of
Energy Resources Technology, vol. 104, pp. 274–276. Chen, L‐T & and Rice, W 1983, ‘Properties of air leaving a hydraulic air compressor (HAC)’, Transactions of the ASME, Journal of
Fluids Engineering, vol. 105, pp. 54–57. del Castillo, D 1988, ‘Air cycle refrigeration system for cooling deep mines’, International Journal of Refrigeration, vol. 11, no. 2,
pp. 87–91. Devonport, WJ 2001, Nozzle Applet Instructions and Source Code, Virginia Tech, Blacksburg, viewed 13 July 2016,
http://www.engapplets.vt.edu/fluids/CDnozzle/cdinfo.html Eastop, TD & McConkey, A 2009, Applied Thermodynamics for Engineering Technologists, 5th edn, Pearson Education, Harlow. Egan, AL & Ewing, SET, 1937 Conditioning Mine Air, US Patent No. US2097723A, priority date 14 December 1932,
https://www.google.com/patents/US2097723 Huang, BJ, Chang, JW, Wang, CP & Petrenko, VA 1998, ‘A 1‐D analysis of ejector performance’, International Journal of
Refrigeration, vol. 22, pp. 354–364. Langborne, PL 1979, ‘Hydraulic air compression: old invention – new energy source’, Chartered Mechanical Engineer, vol. 26,
no. 10, pp. 76–81. McPherson, MJ 1993, Subsurface Ventilation and Environmental Engineering, Springer, Dordrecht, 905 p. Millar, DL 2014, ‘A review of the case for modern‐day adoption of hydraulic air compressors’, Applied Thermal Engineering, vol. 69,
no. 1–2, pp. 55–77. Pavese, V, Millar, D & Verda, V 2016, ‘Mechanical efficiency of hydraulic air compressors’, ASME Journal of Energy Resources
Technology, vol. 138, no. 6, 11 p. Rice, W 1976, ‘Performance of hydraulic gas compressors’, Transactions of the ASME, Journal of Fluids Engineering, vol. 98, no. 4,
pp. 645–652. Schulze, LE 1954, ‘Hydraulic air compressors’, United States Department of Interior Information Circular No. 7683, May 1954. Sheer, J, del Castillo, D & Csatary, C 1986, ‘Unconventional systems for removing heat from deep mines’, The South African
Mechanical Engineer, vol. 36, pp. 207–217. Young, S 2017, Simulating Air Absorption in a Hydraulic Air Compressor (HAC), MSc Thesis, Laurentian University, Sudbury. Young, SM, Pavese, V, Hutchison, AD, Rico, J & Millar, DL 2016, ‘Interphase mass transfers in hydraulic air compressors for
production of mine compressed air’, in R Canello (ed.), Proceedings of the 3rd International Seminar Energy Management in Mining: ENERMIN2016, Gecamin, Santiago, pp. 87–97.
Youngworth, M 1937, ‘An application of the use of compressed air motor exhaust in mine air cooling’, Journal of the Chemical, Metallurgical and Mining Society of South Africa, March 1937, pp. 461–465.