Embed Size (px)
Citation preview
RESEARCH
A Retrospective Analysis
of Medical Malpractice
Litigation in Three New
York Counties
Erin J. Farley
November 2014
Acknowledgments i
Acknowledgments
I wish to thank Melissa Labriola for her work on the initial stages of this project as well as
Michael Rempel and Greg Berman for their valuable feedback on earlier drafts of this report.
For their assistance in making this research possible, from the New York State Unified Court
System, I would like to express my gratitude to the Honorable Judy Harris Kluger, formerly the
Chief of Policy and Planning, as well as to Toni Cimino, Susan Senecal, Kerry Ward, and Kate
Paek. I would also like to express my gratitude to Geoffrey Vincent from the Division of
Technology for providing civil court data.
From the New York State Department of Health, I am grateful to Janet Cohn, Executive
Director, New York Stem Cell Science/NYSTEM Program and Vicki Myers from the Office of
Professional Medical Conduct, the latter of whom provided medical history data from a
Department of Health dataset. Thanks to both Geoffrey Vincent and Vicki Myers not only for
providing data but for fielding questions as I familiarized myself with their respective datasets.
Finally, thanks to Michelle Mello from the Harvard School of Public Health, who serves as a
consultant to the project and is preparing a forthcoming evaluation of the New York State Patient
Safety and Medical Reform Initiative.
This research was supported by the Agency for Healthcare Research and Quality, U.S.
Department of Health and Human Services (Grant # 1R18HS019505-1). The opinions, findings,
and conclusions or recommendations expressed in this publication are those of the author and do
not necessarily reflect the positions or policies of the U.S. Department of Health and Human
Services.
For correspondence, please contact Erin J. Farley, Center for Court Innovation, 520 8th Avenue,
18th Floor, New York, NY 10018 ([email protected]).
Table of Contents ii
TABLE OF CONTENTS
Acknowledgements i
Executive Summary iii
Chapter 1: Introduction and Research Methods 1
Chapter 2: Examining Case Characteristics and Differences between Counties 11
Chapter 3: Comparison of Case Characteristics between Participating and
Nonparticipating Medical Sites 24
Chapter 4: Predicting Case Outcome and Monetary Award 26
References 41
Appendix A: Data Cleaning Description 42
Appendix B: Distribution of Recoded Case Outcome Measure 44
Appendix C: Logistic Regression Model Utilizing Case Characteristics
to Predict Case Outcome, Separated by Injury Severity 45
Appendix D Linear Regression Predicting Judgment Amount among
Cases with Claims that Settled or Received a Judgment or Decision
Separated by Injury Severity 46
Executive Summary iii
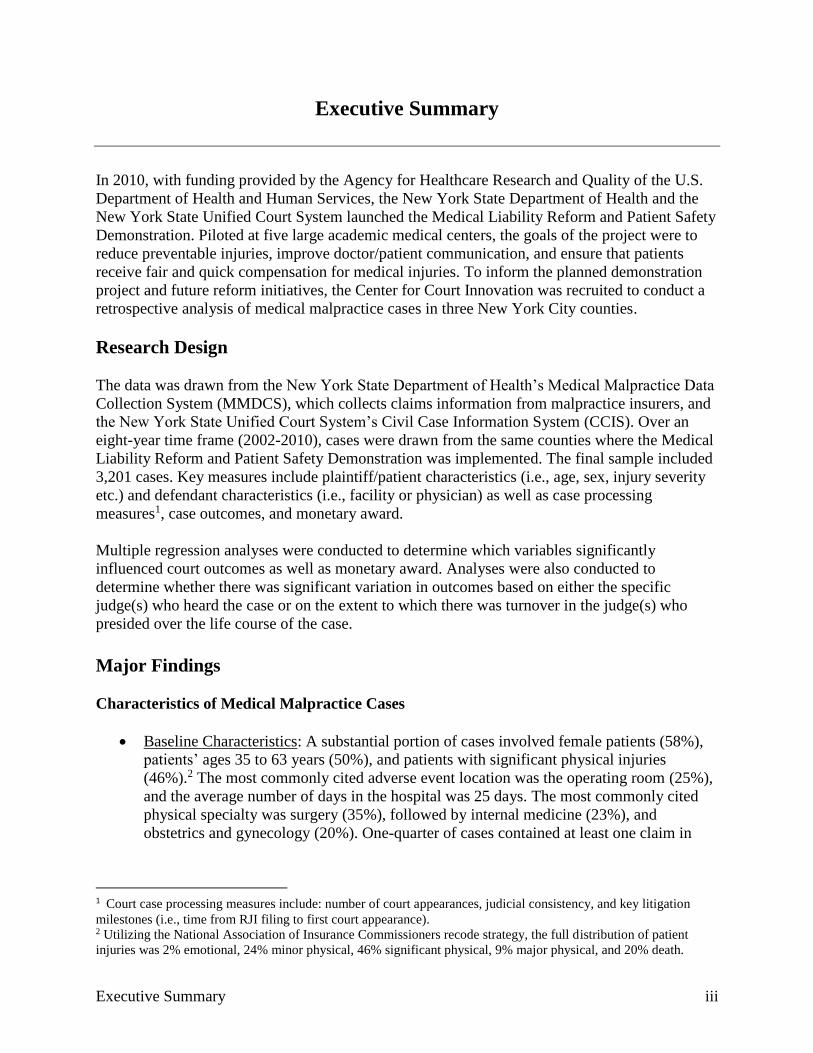
Executive Summary
In 2010, with funding provided by the Agency for Healthcare Research and Quality of the U.S.
Department of Health and Human Services, the New York State Department of Health and the
New York State Unified Court System launched the Medical Liability Reform and Patient Safety
Demonstration. Piloted at five large academic medical centers, the goals of the project were to
reduce preventable injuries, improve doctor/patient communication, and ensure that patients
receive fair and quick compensation for medical injuries. To inform the planned demonstration
project and future reform initiatives, the Center for Court Innovation was recruited to conduct a
retrospective analysis of medical malpractice cases in three New York City counties.
Research Design
The data was drawn from the New York State Department of Health’s Medical Malpractice Data
Collection System (MMDCS), which collects claims information from malpractice insurers, and
the New York State Unified Court System’s Civil Case Information System (CCIS). Over an
eight-year time frame (2002-2010), cases were drawn from the same counties where the Medical
Liability Reform and Patient Safety Demonstration was implemented. The final sample included
3,201 cases. Key measures include plaintiff/patient characteristics (i.e., age, sex, injury severity
etc.) and defendant characteristics (i.e., facility or physician) as well as case processing
measures1, case outcomes, and monetary award.
Multiple regression analyses were conducted to determine which variables significantly
influenced court outcomes as well as monetary award. Analyses were also conducted to
determine whether there was significant variation in outcomes based on either the specific
judge(s) who heard the case or on the extent to which there was turnover in the judge(s) who
presided over the life course of the case.
Major Findings
Characteristics of Medical Malpractice Cases
Baseline Characteristics: A substantial portion of cases involved female patients (58%),
patients’ ages 35 to 63 years (50%), and patients with significant physical injuries
(46%).2 The most commonly cited adverse event location was the operating room (25%),
and the average number of days in the hospital was 25 days. The most commonly cited
physical specialty was surgery (35%), followed by internal medicine (23%), and
obstetrics and gynecology (20%). One-quarter of cases contained at least one claim in
1 Court case processing measures include: number of court appearances, judicial consistency, and key litigation
milestones (i.e., time from RJI filing to first court appearance). 2 Utilizing the National Association of Insurance Commissioners recode strategy, the full distribution of patient
injuries was 2% emotional, 24% minor physical, 46% significant physical, 9% major physical, and 20% death.
Executive Summary iv
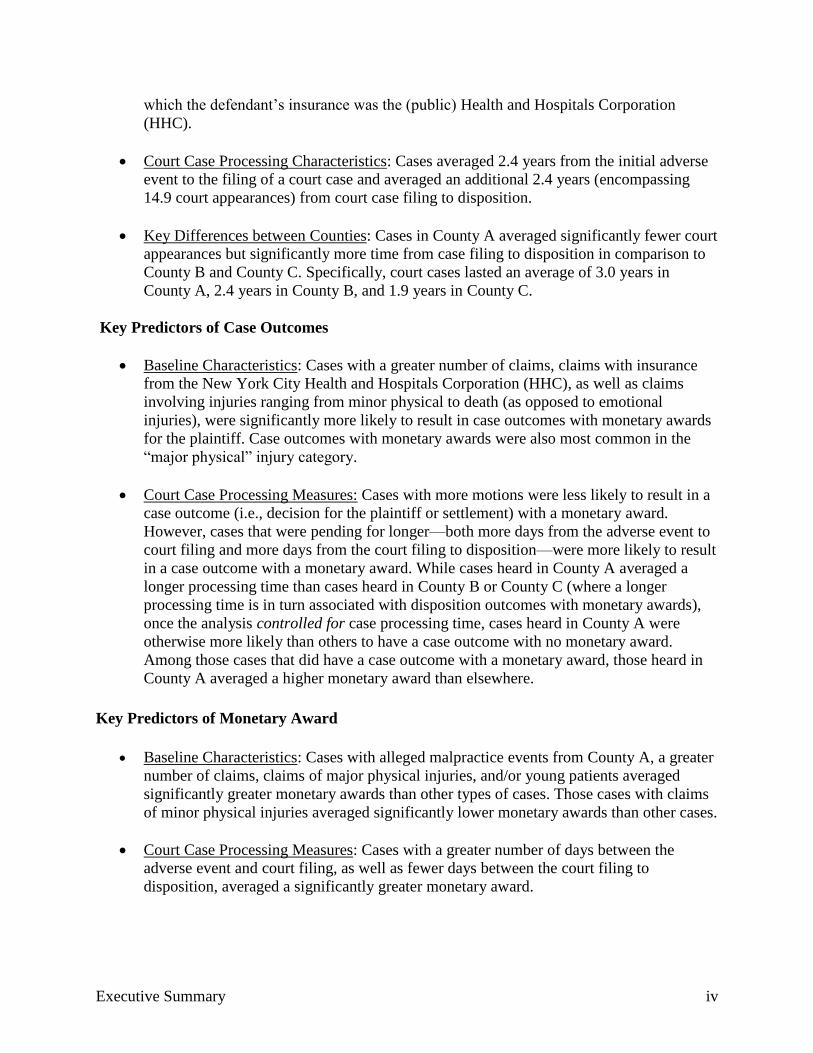
which the defendant’s insurance was the (public) Health and Hospitals Corporation
(HHC).
Court Case Processing Characteristics: Cases averaged 2.4 years from the initial adverse
event to the filing of a court case and averaged an additional 2.4 years (encompassing
14.9 court appearances) from court case filing to disposition.
Key Differences between Counties: Cases in County A averaged significantly fewer court
appearances but significantly more time from case filing to disposition in comparison to
County B and County C. Specifically, court cases lasted an average of 3.0 years in
County A, 2.4 years in County B, and 1.9 years in County C.
Key Predictors of Case Outcomes
Baseline Characteristics: Cases with a greater number of claims, claims with insurance
from the New York City Health and Hospitals Corporation (HHC), as well as claims
involving injuries ranging from minor physical to death (as opposed to emotional
injuries), were significantly more likely to result in case outcomes with monetary awards
for the plaintiff. Case outcomes with monetary awards were also most common in the
“major physical” injury category.
Court Case Processing Measures: Cases with more motions were less likely to result in a
case outcome (i.e., decision for the plaintiff or settlement) with a monetary award.
However, cases that were pending for longer—both more days from the adverse event to
court filing and more days from the court filing to disposition—were more likely to result
in a case outcome with a monetary award. While cases heard in County A averaged a
longer processing time than cases heard in County B or County C (where a longer
processing time is in turn associated with disposition outcomes with monetary awards),
once the analysis controlled for case processing time, cases heard in County A were
otherwise more likely than others to have a case outcome with no monetary award.
Among those cases that did have a case outcome with a monetary award, those heard in
County A averaged a higher monetary award than elsewhere.
Key Predictors of Monetary Award
Baseline Characteristics: Cases with alleged malpractice events from County A, a greater
number of claims, claims of major physical injuries, and/or young patients averaged
significantly greater monetary awards than other types of cases. Those cases with claims
of minor physical injuries averaged significantly lower monetary awards than other cases.
Court Case Processing Measures: Cases with a greater number of days between the
adverse event and court filing, as well as fewer days between the court filing to
disposition, averaged a significantly greater monetary award.

Executive Summary v
Significance of the Judge in the Case
Predicting Case Outcome: Analyses revealed a varying degree of influence of judicial
measures, depending on county and outcome. Within County A, cases heard by two
particular judges were significantly more likely than others to conclude with a case
outcome with a monetary award.3 In County B, one judge was more likely than others to
hear cases concluding with a disposition resulting in a monetary award for the plaintiff.
In County C, outcomes did not vary based on the specific identity of the judge, although
case outcomes involving monetary awards were more likely when there was less turnover
in whoever the judge was over the life course of the case.
Predicting Monetary award: Also reflecting the role of the judge, the identity of the judge
had a significant association with monetary award in two of the three counties.
Study Limitations
This study possessed several limitations. First, this project did not involve review of medical
records, and as a result we were unable to distinguish between meritorious and non-meritorious
medical injury claims. In addition, approximately 27% of the cases in the Department of Health
database were successfully matched to cases in the corresponding civil dataset; although we have
no reason to believe that the matching difficulties were not randomly distributed, we cannot rule
out the possibility that our final subsample may not be representative of the total sample.
In addition, when working with large databases, there is always the possibility of data entry
error. In this regard, it is important to note that the information entered into the Department of
Health databases is collected from medical malpractice insurers, not from the doctors, attorneys,
or plaintiffs, which may increase the possibility that particular medical information pertaining to
the plaintiff may not always be entirely accurate.
In respect to the civil database, our “starting line” was represented by the date of a Request for
Judicial Intervention filing;4 however, within New York State, legally substantive activity (i.e.,
discovery) occurs prior to the RJI filing. An earlier date that would have provided a more
accurate benchmark for the beginning of a case would have been the date that the adjudicative
case number was purchased; however, this information was not contained in available datasets.
A final limitation is that while many of the reported predictive relationships are suggestive,
available quantitative data did not reveal how or why their influence was realized in case
negotiations and deliberations. Accordingly, caution should be exercised when attempting to
interpret the quantitative study findings.
3 To ensure the confidentiality of findings related to specific judges, where various judicial measures were
significantly associated with outcomes, the counties in which such findings appeared are not identified. 4 The Request for Judicial Intervention is represented by the date the document was filed with the County Clerk’s
office. The filing of an RJI can be seen as a starting point for medical malpractice cases, as it is preceded only by the
purchasing of an index number. Once RJI is filed, the courts have 45 days to hold a preliminary conference.
Executive Summary vi
Conclusion
Research findings indicate that a variety of factors contribute to medical malpractice costs. While
the level of injury severity stands out as a particularly important predictor for both case outcome
and monetary award, the analysis also revealed that case processing factors (e.g., number of
court appearances and days from RJI filing to disposition), as well as the judge who presided
over the case, are influential as well.
New York has created specialized court parts for medical malpractice claims in which cases are
assigned to particular judges with extensive knowledge in this area. An underlining principle of
these specialized court parts is that, in providing an experienced and knowledgeable judge to
preside over medical malpractice cases, they may have the ability to effect positive change in
how cases are processed through the civil court system. One particular component of the
demonstration project, a judge-directed negotiation program, involves training judges in
negotiation and mediation skills so that they may also be able to effect positive change in how
cases are processed. Whereas this study does not yield conclusive evidence regarding which
specific judicial practices, in fact, make a difference in court cases involving medical
malpractice, this study does confirm the broad premise behind the specialized court model that
judges do matter.

Chapter One 1 1
Chapter One: Introduction and Research Methods
New reforms have recently emerged in an attempt to address the continuing concerns of high
malpractice overhead and patient safety related to medical malpractice litigation (AMA 2012).
Interest in this topic has also been sparked by the passage of the Patient Protection and
Affordable Care Act in 2010, legislation that was motivated in part by the high costs of health
care in the United States.
In 2010, with funding provided through the Agency for Healthcare Research and Quality of the
U.S. Department of Health and Human Services, the New York State Department of Health and
the New York State Unified Court System launched a demonstration project involving five large
academic medical centers. These hospitals and agencies came together to implement the New
York Medical Liability Reform and Patient Safety model. This model involves employing judge-
directed negotiations and a disclosure and early settlement program, with the objective of
reducing preventable injuries, improving doctor/patient communication, and ensuring that
patients receive fair and quick compensation for medical injuries, while at the same time
reducing the incidence of frivolous lawsuits and reducing the high costs of insurance premiums.
As part of the Medical Liability Reform and Patient Safety Demonstration Project, the Center for
Court Innovation was recruited to conduct a retrospective analysis of medical malpractice cases
in three New York City counties between 2002 and 2010. The retrospective analysis entails
merging data from separate court and health databases to link hospital and patient data with civil
court data. This analysis was motivated by two key research objectives: 1) determine the factors
driving higher medical malpractice costs; and 2) informing the demonstration projects efforts to
identify best practices with the end goal of reducing the frequency of malpractice claims, payout
costs, and time taken from filing to resolution of civil court cases.
Data Sources
The data in this study was drawn from two separate databases. The first database was the New
York State Department of Health’s Medical Malpractice Data Collection System (MMDCS),
which collects claims information filed against New York State insureds from their malpractice
insurers. The second database was the New York State Unified Court System’s Civil Case
Information System (CCIS), which collects court related information in 13 New York counties
regarding medical practice cases in the Civil Division of the Supreme Court.
An eight-year time frame (2002-2010) was isolated. Based on the data made available to us, we
were able to identify and utilize both case- and claims-level information. Prior research has
defined a claim as “a written demand for compensation for a medical injury” (Studdert et al.
2006; Studdert et al. 2000; Wieler et al. 1993). A plaintiff (whether it be the patient, adult
guardian or surviving relative) can file multiple claims against different physicians and/or
facilities. In this situation, a case will have a single plaintiff but multiple claims against different
defendants. We have been able to extract relevant claims-level data and recode these measures
so as to be utilized within a case-level analysis. By doing this we were able to gain a fuller

Chapter One 2 2
understanding of medical malpractice litigation not possible from examining only claims-level
data. To further elucidate the characteristics of our data we provide a brief data cleaning
summary below. See Appendix A for a more detailed description.
The MMCDS data received from the Department of Health provides information on medical
malpractice claims and includes a unique adjudicative case number that groups all claims by
case. In turn, the CCIS data provided by the Office of Court Administration is maintained at the
case-level in which every case has a unique Index Number. In order to merge these two datasets,
the MMCDS data was aggregated to the case-level at the same time preserving and transforming
claims-level data so that it can be utilized for analytic purposes. First name, last name of the
plaintiff and the unique case number (adjudicative and index number) were utilized to enable the
merging of the two datasets. Within the court context, a plaintiff may be the patient, an adult
guardian of a minor or surviving family. For current purposes, the term plaintiff will most
commonly be utilized and will also incorporate the patient. When appropriate, the term patient
may be interchanged.
After aggregating and cleaning the MMCDS data, the new dataset contained 8,276 cases. Of
these cases, 3,280 (40%) were merged successfully with the CCIS data. A factor contributing to
this low percentage is that the MMCDS database contains any case in which a civil index
number has been purchased (claim), but only a portion of these cases go on to become lawsuits.
In comparison, the CCIS database contains only those cases that have resulted in a lawsuit. After
removing an additional 79 merged cases that were identified as ineligible, the final sample of
3,201 included 732 County A cases, 1,355 County B cases, and 1,114 County C cases (see Table
1.1).
Variables of Interest
The following section describes the variables of interest and the process of recoding, when
applicable.
Department of Health’s Medical Malpractice Data Collection System
Patient Demographics
As previously mentioned, each case included in the analysis had the potential to contain more
than one claim. As a result, part of the data cleaning process included verifying the validity of
measures, like patient demographics, when possible.5 Data regarding the patient’s age (range 0 to
Merged MMDCS & CCIS Database County A County B County C Total
Final Number of Cases 732 1,355 1,114 3,201
Average Number of Claims Per Case 2.04 2.07 1.90 2.00
Range of Claims Per Case 1 to 9 1 to 12 1 to 9 1 to 12
Table 1.1. Distribution of Claims and Cases by County

Chapter One 3 3
96 years) and sex were extrapolated from the claims to the case-level. 6 No measure was
available to provide information regarding a patient’s race or ethnicity.7
Additional patient-oriented measures included:
Injury Severity: In instances where cases contained more than one claim it was
possible, although uncommon, for a case to be classified with varying levels of severity.
For ease of analysis, a single measure was created to represent level of injury severity.
The original injury severity scale included nine categories,8 with the “maximum” number
representing the “more severe” injury (i.e., 1 = emotional injury and 9 = death). Citing
prior research, this measure was then collapsed into five categories representing
emotional, minor physical, significant physical, major physical and death (Studdert and
Mello 2007). Since injury severity is a categorical measure, this variable was further
recoded into five independent dichotomous variables.
Total Days in Hospital: For those plaintiffs who were hospitalized, each claim had an
associated beginning and ending hospital date. When calculating the total days plaintiffs
spend in the hospital, we used the greatest number of days between beginning and
ending date for any claim. The range varied from 0 days (representing claimants who
had a hospital visit but spent less than one day in the hospital) to 2,686 days.
Event Location: The Event Location measure represents a record of the 16 possible
sites in which an adverse event occurred. As a way to simplify the measure for analytic
purposes, the first claim was utilized to identify the four most commonly cited locations:
the patient’s room, the labor/delivery room, the emergency department, and the operating
room. Subsequently, four dichotomous variables were created in which any case
possessing a claim with one of these four common locations was represented with a “1”.
Among those cases with two or more claims, it is possible that multiple locations can be
cited within a case. As a result, these measures are not mutually exclusive. In turn, there
are cases in which none of the four selected locations are referenced.
5 In respect to MMDCS data, claim information was vectored prior to aggregation so that as much unique data per
claim as possible could be preserved after the aggregation process. For measures that should be consistent across all
claims, like patient sex and age, only one measure was saved to represent these variables. Consistency issues
included plaintiff’s sex (i.e., husband/male) being entered for the patient’s sex (i.e., wife/female). In these situations,
case characteristics and narrative were utilized to confirm sex of patient (i.e. labor/delivery v. prostate cancer). 6 Within a portion of cases, birthdates varied by claim. Some ages were able to be verified by associated case notes.
In cases that age was not able to be confirmed, the mean age was calculated during the aggregation process after age
was created from birthdates. When possible the consistency of sex identification across claims was verified as well.
This was particularly relevant in reference to labor and delivery cases where the mother and newborn characteristics
were sometimes interchanged (male newborn mistakenly included with claim related to injuries associated with
mother). 7 Additional measures in the DOH database included patient’s income, occupation, education and number of
dependents however; these measures were not utilized with enough consistency to be included in the analysis. 8 This injury severity scale was developed by the National Association of Insurance Commissioners (Sowka 1980).
Chapter One 4 4
Defendant Characteristics
Information provided at the claim-level also permitted us to extrapolate defendant characteristics
to the case level. Defendants fell into two general categories, medical facilities and physicians.9
As a result, we created a measure representing defendant type which identified cases with claims
against physicians only, cases with claims against medical facilities only, and cases with claims
against both physicians and medical facilities. Almost half of all cases (46%) in our sample
involved claims against both physicians and facilities. (The remaining cases were split almost
equally across the two remaining categories.)
Participating Hospitals: A single dichotomous variable was created in which any case
containing a claim in which the adverse event occurred at one of the five participating
medical centers was identified as a “1”.10
Insurance Type: Claim-level information was also available regarding the insurance
type for each defendant. The original categorical variable was recoded and combined
with an additional insurance variable which permitted agencies to write in the “other”
insurance (the most common “other” insurance type was FOJP Service Corporation11). In
turn, the categories of this new insurance measure were collapsed to represent four
categories of insurance: self-insured entity; insurance company (profit) and Mutual
Company; FOJP Service Corporation; and other. Since there was no way to rank these
different types of insurance, only the first claim was examined for descriptive purposes.
An additional insurance measure, which provided the names of the respective insurance
agencies, was utilized to identify any case with at least one claim where the insurance
provider was the New York City Health and Hospitals Corporation (HHC). This type of
insurance was of particular interest because hospitals insured by HHC had already been
utilizing judge-directed negotiations.
Physician Specialty: In general, very little information was available regarding the
background characteristics of the defendant-physicians, with physician specialty being
one of the few exceptions. This measure provided information regarding 118 specialties.
For analytic purposes, the first claim was examined to identify the most commonly cited
areas of practice. From this review, three specialties stood out from the rest: Internal,
obstetrics/gynecology, and Surgery. Subsequently, three dichotomous variables were
created representing each of the three specialties, in which any case containing a claim
filed against one of these three specialty areas was coded affirmatively as a “1”.These
three physician specialty measures are not mutually exclusive; a case with multiple
claims could contain defendant physicians in two or more of these areas.
9 Cases involving non-demonstration sites are not limited to medical facilities and may include other types of sites
like clinics, nursing homes, and doctors’ offices. 10 The five participating hospitals represent 10 specific locations. 11 FOJP Service Corporation is a risk management agency serving hospitals, long term care facilities and social
services in New York City.
Chapter One 5 5
Unified Court System’s Civil Case Information System
Court Case Process Measures
Total Number of Court Appearances: Within the CCIS data system, information was
recorded for every court appearance including the purpose, the presiding judge, and court
part. For analytic purposes, a measure was created to represent the total number of court
appearances for each case. Analysis revealed a mean of 14.87 court appearances per case.
Judicial Measures: Medical malpractice cases may be presided over by different judges
over the course of many court appearances. As a result, we constructed two judicial
measures as a way to identify the judges that possessed more than just a transitory
involvement with the progress of a medical malpractice court case.
o Proportion of Court Appearances per Judge: Appearance information was
used to create a measure representing the proportion of time each case may have
appeared before a particular judge. For example, if a case involved 10 total
appearances and 5 of these appearances were presided over by Judge X, the
portion of time this case was presided over by Judge X was .50. Measures were
created to identify the five judges per county with the greatest proportion of court
appearances with all other judges being recoded as “other.” This provided us with
a numerical value with a possible range of 0 (no appearances with Judge X) to 1
(all appearances with Judge X) which could be utilized in our regression analyses.
o Judicial Consistency: Appearance information was utilized to create a single
measure to represent the greatest proportion of time a case stayed with any judge.
Total Number of Motions: Information was also available for motion practices
including the date the motion was filed as well as a description of the type of motion (i.e.,
proceeding type and relief sought). For analytic purposes, a measure representing the
total number of motions filed per case was created and ranged from 0 to 23 with a mean
of 1.87 motions per case.
Request for Judicial Intervention: The Request for Judicial Intervention (RJI) File date
represents the date when the RJI was filed with the County Clerk’s office. The filing of
an RJI in some ways can be seen as a starting point for medical malpractice cases. This
step “starts the clock” as the courts have 45 days after the RJI is filed to hold a
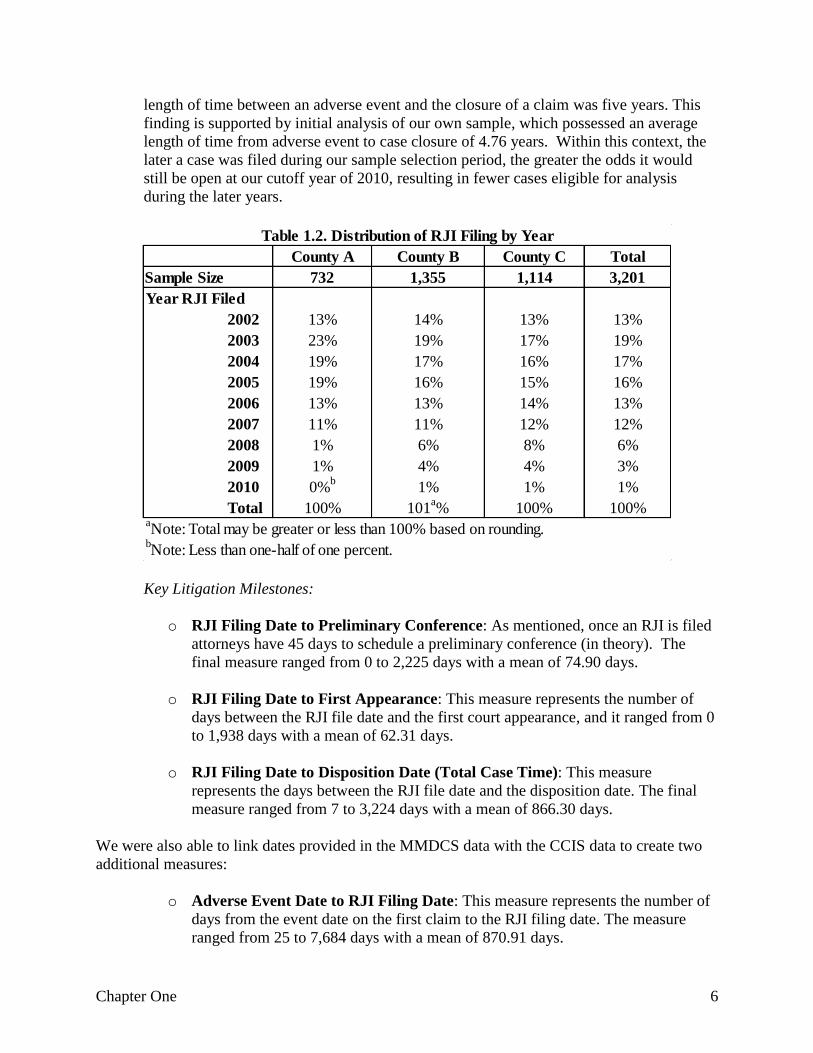
preliminary conference. 12 Table 1.2 presents the distribution of RJI filings by year and
reveals the majority (65%) of cases in the analysis were filed with the court in 2005 or
earlier. Important to note is that this trend is not evidence of the decrease in medical
malpractice litigation over time but instead an effect of our sample selection. Based on a
sample of 1,452 closed malpractice claims, Suddert et al. (2006) estimated the average
12 Of note, RJI filing is preceded by the purchasing of an Index number and also represents an important early
milestone in the medical malpractice litigation process, however, this information was not available in the CCIS data
file.
Chapter One 6 6
length of time between an adverse event and the closure of a claim was five years. This
finding is supported by initial analysis of our own sample, which possessed an average
length of time from adverse event to case closure of 4.76 years. Within this context, the
later a case was filed during our sample selection period, the greater the odds it would
still be open at our cutoff year of 2010, resulting in fewer cases eligible for analysis
during the later years.
Key Litigation Milestones:
o RJI Filing Date to Preliminary Conference: As mentioned, once an RJI is filed
attorneys have 45 days to schedule a preliminary conference (in theory). The
final measure ranged from 0 to 2,225 days with a mean of 74.90 days.
o RJI Filing Date to First Appearance: This measure represents the number of
days between the RJI file date and the first court appearance, and it ranged from 0
to 1,938 days with a mean of 62.31 days.
o RJI Filing Date to Disposition Date (Total Case Time): This measure
represents the days between the RJI file date and the disposition date. The final
measure ranged from 7 to 3,224 days with a mean of 866.30 days.
We were also able to link dates provided in the MMDCS data with the CCIS data to create two
additional measures:
o Adverse Event Date to RJI Filing Date: This measure represents the number of
days from the event date on the first claim to the RJI filing date. The measure
ranged from 25 to 7,684 days with a mean of 870.91 days.
County A County B County C Total
Sample Size 732 1,355 1,114 3,201
Year RJI Filed
2002 13% 14% 13% 13%
2003 23% 19% 17% 19%
2004 19% 17% 16% 17%
2005 19% 16% 15% 16%
2006 13% 13% 14% 13%
2007 11% 11% 12% 12%
2008 1% 6% 8% 6%
2009 1% 4% 4% 3%
2010 0%b
1% 1% 1%
Total 100% 101a% 100% 100%
aNote: Total may be greater or less than 100% based on rounding.
Table 1.2. Distribution of RJI Filing by Year
bNote: Less than one-half of one percent.
Chapter One 7 7
o Adverse Event Date to Disposition Date: This measure represents the number
of days between the event date and the disposition date and ranged from 72 to
8,375 days with a mean of 1,734.07 days.
Financial Measures:
Expense Reserve: This measure represents the amount of money a defendant’s insurance
company utilized on administrative resources (i.e., attorney’s fees, expert witnesses) and
does not include judgment or settlement amounts. The measure ranged from $0.00 to
$2,000,000.00 with a mean expense reserve of $53,485.26.
Indemnity Reserve: This measure represents the amount of money identified by the
insurance company as an acceptable payout for the medical malpractice injury. The
measure ranged from $0.00 to $14,100,000.00 with a mean indemnity reserve of
$517,677.05.
Case Outcome Measures
Through the MMDCS data file, we were able to gain access to the outcome of every medical
malpractice claim in our sample. The original variable provided 25 categories13 which we
simplified and recoded for analytic purposes. A description is provided below.
Time of Settlement: For cases with multiple claims, there was a possibility that the
timing of a settlement would vary by claim (i.e., one claim may be settled before trial and
another during). To gain a preliminary understanding of the extent of variation, we first
created a measure, utilizing the first claim only, focusing on the different settlement
times, and collapsing the measure into five categories: before litigation; before trail;
during trial; during appeal; and after verdict. Examination of this measure found very
little variation; 94% of first claims were settled before trial.
Case Outcome: As previously mentioned, the original measure contained 25 categories
representing different types of case outcomes. For the purposes of the current analysis
this measure was simplified and recoded into three separate measures:
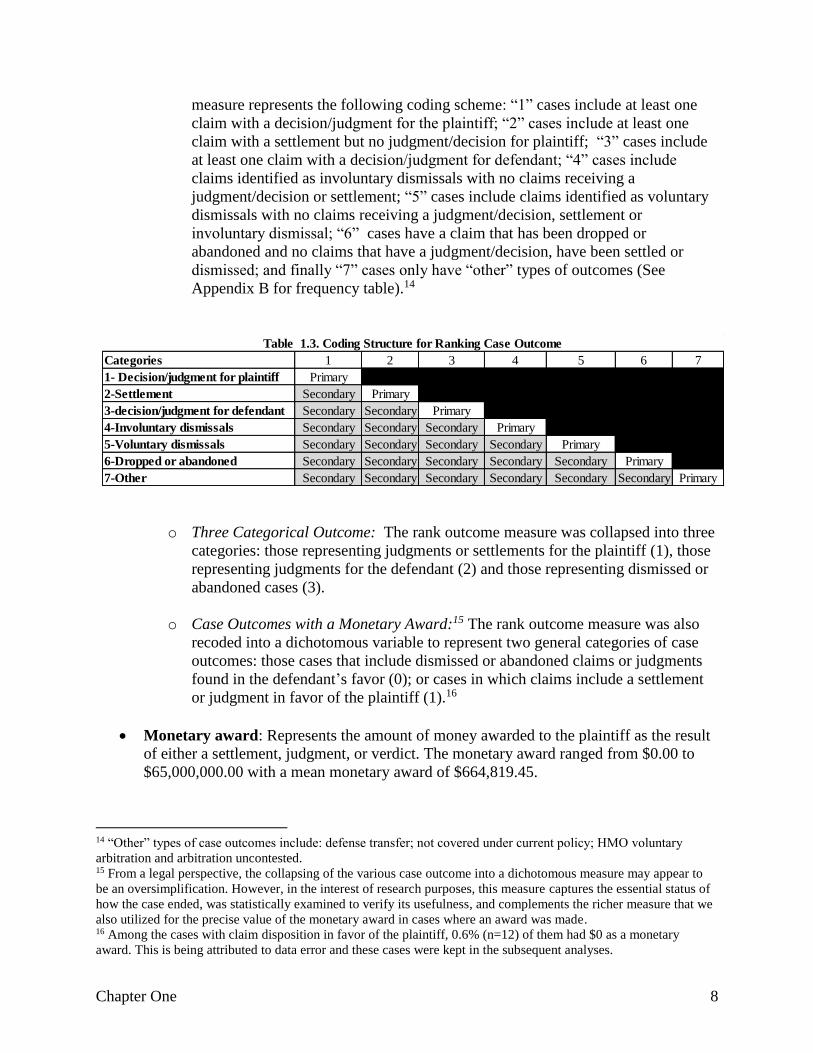
o Rank Outcome: For this measure, all outcomes for all claims were considered
when creating a rank outcome measure. Table 1.3 breaks down the specific
ranking to show how claim outcomes were ranked in terms of “primary,” as well
as the “secondary” outcomes, which include other outcomes that may have
applied to different claims that were linked to the same underlying case. The
13 The original 25 disposition codes include: settlement before litigation, settlement before trial, voluntary dismissal,
involuntary dismissal, judgment plaintiff, judgment defense, judgment no verdict plaintiff, judgment no verdict
defense, direct verdict plaintiff, direct verdict defense, plaintiff after appeal, defense after appeal, arbitration
plaintiff, arbitration defense, abandon by plaintiff, settlement during trial, settlement during appeal, HMO voluntary
arbitration, arbitration uncontested, not covered under policy, settlement achieved after verdict, dropped from suit,
defense transferred, high low agreement – high, high low agreement- low.
Chapter One 8 8
measure represents the following coding scheme: “1” cases include at least one
claim with a decision/judgment for the plaintiff; “2” cases include at least one
claim with a settlement but no judgment/decision for plaintiff; “3” cases include
at least one claim with a decision/judgment for defendant; “4” cases include
claims identified as involuntary dismissals with no claims receiving a
judgment/decision or settlement; “5” cases include claims identified as voluntary
dismissals with no claims receiving a judgment/decision, settlement or
involuntary dismissal; “6” cases have a claim that has been dropped or
abandoned and no claims that have a judgment/decision, have been settled or
dismissed; and finally “7” cases only have “other” types of outcomes (See
Appendix B for frequency table).14
o Three Categorical Outcome: The rank outcome measure was collapsed into three
categories: those representing judgments or settlements for the plaintiff (1), those
representing judgments for the defendant (2) and those representing dismissed or
abandoned cases (3).
o Case Outcomes with a Monetary Award:15 The rank outcome measure was also
recoded into a dichotomous variable to represent two general categories of case
outcomes: those cases that include dismissed or abandoned claims or judgments
found in the defendant’s favor (0); or cases in which claims include a settlement
or judgment in favor of the plaintiff (1).16
Monetary award: Represents the amount of money awarded to the plaintiff as the result
of either a settlement, judgment, or verdict. The monetary award ranged from $0.00 to
$65,000,000.00 with a mean monetary award of $664,819.45.
14 “Other” types of case outcomes include: defense transfer; not covered under current policy; HMO voluntary
arbitration and arbitration uncontested. 15 From a legal perspective, the collapsing of the various case outcome into a dichotomous measure may appear to
be an oversimplification. However, in the interest of research purposes, this measure captures the essential status of
how the case ended, was statistically examined to verify its usefulness, and complements the richer measure that we
also utilized for the precise value of the monetary award in cases where an award was made. 16 Among the cases with claim disposition in favor of the plaintiff, 0.6% (n=12) of them had $0 as a monetary
award. This is being attributed to data error and these cases were kept in the subsequent analyses.
Categories 1 2 3 4 5 6 7
1- Decision/judgment for plaintiff Primary
2-Settlement Secondary Primary
3-decision/judgment for defendant Secondary Secondary Primary
4-Involuntary dismissals Secondary Secondary Secondary Primary
5-Voluntary dismissals Secondary Secondary Secondary Secondary Primary
6-Dropped or abandoned Secondary Secondary Secondary Secondary Secondary Primary
7-Other Secondary Secondary Secondary Secondary Secondary Secondary Primary
Table 1.3. Coding Structure for Ranking Case Outcome
Chapter One 9 9
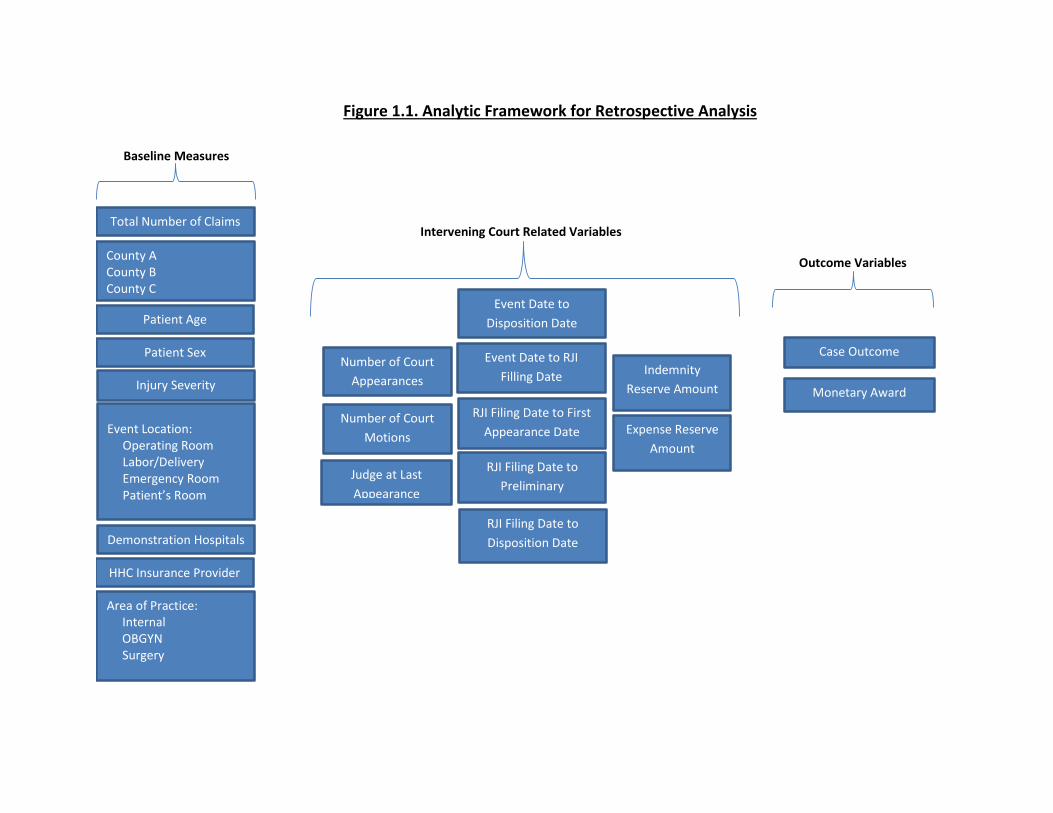
Analytic Framework
We constructed an analytic framework (Figure 1.1) in which the analytic direction goes from left
to right. The left column lists the baseline plaintiff and medical related measures. The following
group of measures (next three columns) represents the intervening court related measures and
includes measures like number of days from the adverse event to RJI filing. The third group
includes our two dependent measures, case outcome and monetary award.
To begin our analysis, we utilized cross-tabulation and Analysis of Variance (ANOVA) to
determine if plaintiff, defendant, and case characteristics significantly varied across the three
selected counties. Bivariate correlation analysis was utilized to determine which predictor
variables would be included in the logistic and linear regression models predicting case outcome
as well as monetary award. In turn, only those measures which attained a p-value of less than
0.1 in bivariate analyses were included in the multivariate regression analyses.
After all relevant measures were identified, the full sample was utilized in multiple regression
analyses to determine which predictor variables significantly influenced court outcomes as well
as monetary award. In turn, a subsample of cases involving dispositions that had resulted in
monetary awards for the plaintiff was utilized in multiple regression analyses to determine if any
variation in predictor relationships existed within this particular sample. Finally, in order to
examine the potential role of the judge in impacting case outcome and monetary award, county-
level regression analyses were conducted with judicial measures representing the key
independent variables.
Patient Age
Injury Severity
Case Outcome
Demonstration Hospitals RJI Filing Date to
Disposition Date
Number of Court
Motions
Number of Court
Appearances
RJI Filing Date to First
Appearance Date
Monetary Award
Patient Sex
Intervening Court Related Variables
Outcome Variables County A County B County C
Judge at Last
Appearance
Event Location: Operating Room Labor/Delivery Emergency Room Patient’s Room
Area of Practice: Internal OBGYN Surgery
Event Date to RJI
Filling Date
Total Number of Claims
HHC Insurance Provider
RJI Filing Date to
Preliminary
Conference
Figure 1.1. Analytic Framework for Retrospective Analysis
Indemnity
Reserve Amount
Expense Reserve
Amount
Baseline Measures
Event Date to
Disposition Date
Chapter Two 11
Chapter Two: Examining Case Characteristics and Differences
between Counties
This chapter presents descriptive information regarding the plaintiff, defendant and case
characteristics of medical malpractice cases filed and disposed between 2002 and 2010. This
chapter also presents results from analyses examining the significant differences between the
three counties.
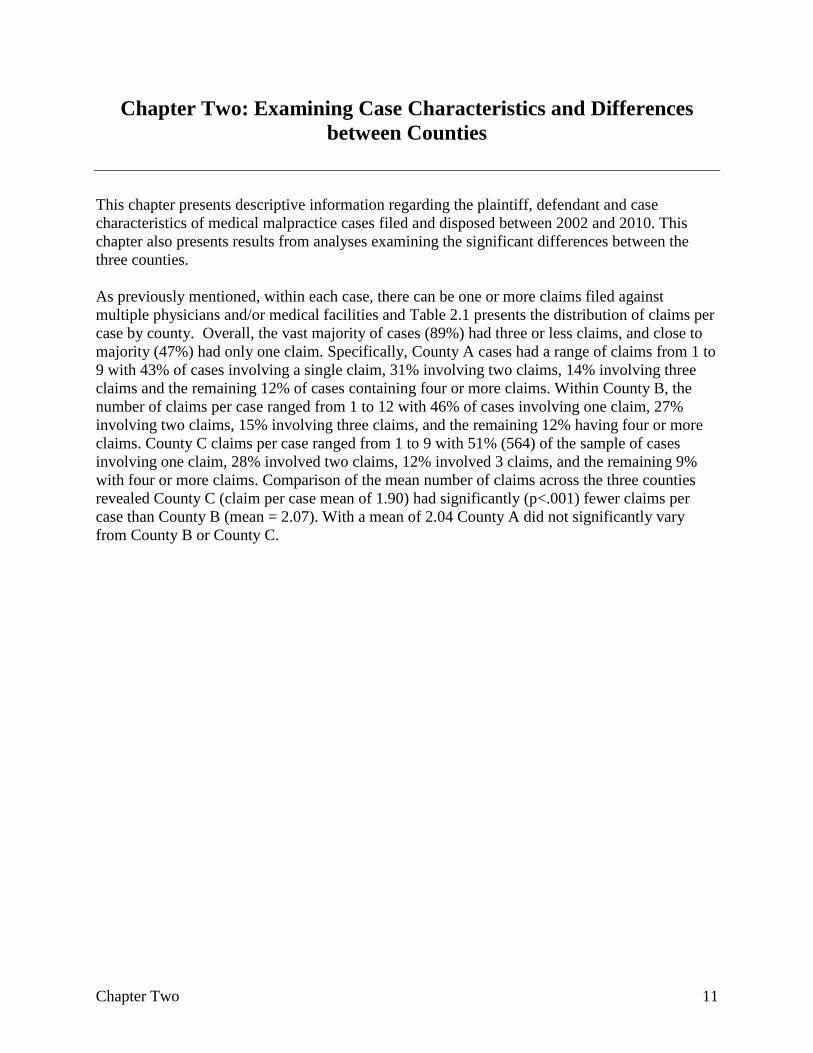
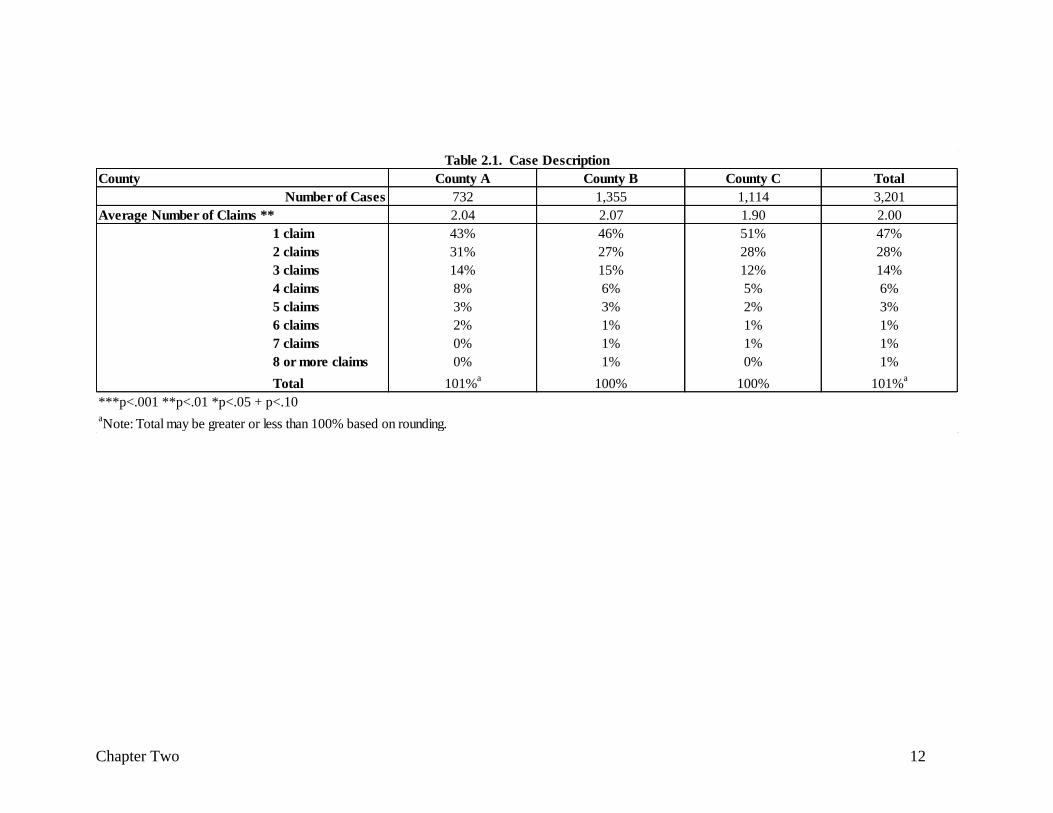
As previously mentioned, within each case, there can be one or more claims filed against
multiple physicians and/or medical facilities and Table 2.1 presents the distribution of claims per
case by county. Overall, the vast majority of cases (89%) had three or less claims, and close to
majority (47%) had only one claim. Specifically, County A cases had a range of claims from 1 to
9 with 43% of cases involving a single claim, 31% involving two claims, 14% involving three
claims and the remaining 12% of cases containing four or more claims. Within County B, the
number of claims per case ranged from 1 to 12 with 46% of cases involving one claim, 27%
involving two claims, 15% involving three claims, and the remaining 12% having four or more
claims. County C claims per case ranged from 1 to 9 with 51% (564) of the sample of cases
involving one claim, 28% involved two claims, 12% involved 3 claims, and the remaining 9%
with four or more claims. Comparison of the mean number of claims across the three counties
revealed County C (claim per case mean of 1.90) had significantly (p<.001) fewer claims per
case than County B (mean = 2.07). With a mean of 2.04 County A did not significantly vary
from County B or County C.
Chapter Two 12
County County A County B County C Total
732 1,355 1,114 3,201
Average Number of Claims ** 2.04 2.07 1.90 2.00
1 claim 43% 46% 51% 47%
2 claims 31% 27% 28% 28%
3 claims 14% 15% 12% 14%
4 claims 8% 6% 5% 6%
5 claims 3% 3% 2% 3%
6 claims 2% 1% 1% 1%
7 claims 0% 1% 1% 1%
8 or more claims 0% 1% 0% 1%
Total 101%a
100% 100% 101%a
aNote: Total may be greater or less than 100% based on rounding.
Table 2.1. Case Description
***p<.001 **p<.01 *p<.05 + p<.10
Number of Cases
Chapter Two 13 13
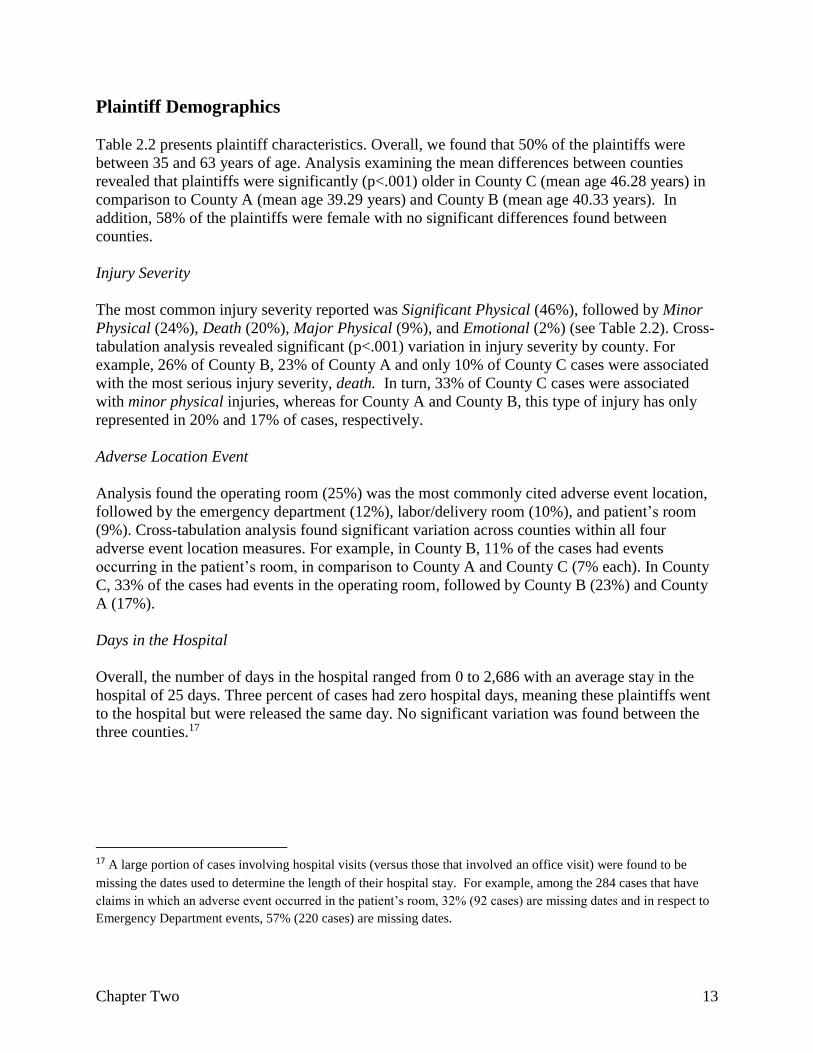
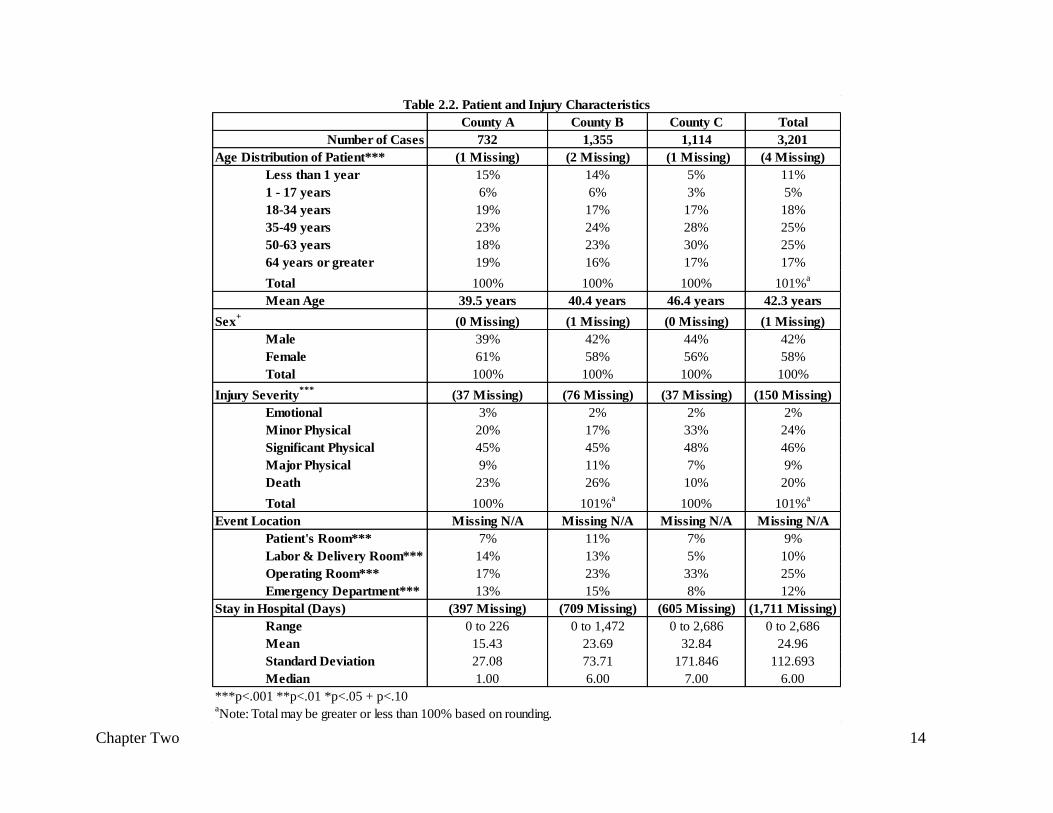
Plaintiff Demographics
Table 2.2 presents plaintiff characteristics. Overall, we found that 50% of the plaintiffs were
between 35 and 63 years of age. Analysis examining the mean differences between counties
revealed that plaintiffs were significantly (p<.001) older in County C (mean age 46.28 years) in
comparison to County A (mean age 39.29 years) and County B (mean age 40.33 years). In
addition, 58% of the plaintiffs were female with no significant differences found between
counties.
Injury Severity
The most common injury severity reported was Significant Physical (46%), followed by Minor
Physical (24%), Death (20%), Major Physical (9%), and Emotional (2%) (see Table 2.2). Cross-
tabulation analysis revealed significant (p<.001) variation in injury severity by county. For
example, 26% of County B, 23% of County A and only 10% of County C cases were associated
with the most serious injury severity, death. In turn, 33% of County C cases were associated
with minor physical injuries, whereas for County A and County B, this type of injury has only
represented in 20% and 17% of cases, respectively.
Adverse Location Event
Analysis found the operating room (25%) was the most commonly cited adverse event location,
followed by the emergency department (12%), labor/delivery room (10%), and patient’s room
(9%). Cross-tabulation analysis found significant variation across counties within all four
adverse event location measures. For example, in County B, 11% of the cases had events
occurring in the patient’s room, in comparison to County A and County C (7% each). In County
C, 33% of the cases had events in the operating room, followed by County B (23%) and County
A (17%).
Days in the Hospital
Overall, the number of days in the hospital ranged from 0 to 2,686 with an average stay in the
hospital of 25 days. Three percent of cases had zero hospital days, meaning these plaintiffs went
to the hospital but were released the same day. No significant variation was found between the
three counties.17
17 A large portion of cases involving hospital visits (versus those that involved an office visit) were found to be
missing the dates used to determine the length of their hospital stay. For example, among the 284 cases that have
claims in which an adverse event occurred in the patient’s room, 32% (92 cases) are missing dates and in respect to
Emergency Department events, 57% (220 cases) are missing dates.
Chapter Two 14
County A County B County C Total
732 1,355 1,114 3,201
(1 Missing) (2 Missing) (1 Missing) (4 Missing)
Less than 1 year 15% 14% 5% 11%
1 - 17 years 6% 6% 3% 5%
18-34 years 19% 17% 17% 18%
35-49 years 23% 24% 28% 25%
50-63 years 18% 23% 30% 25%
64 years or greater 19% 16% 17% 17%
Total 100% 100% 100% 101%a
Mean Age 39.5 years 40.4 years 46.4 years 42.3 years
(0 Missing) (1 Missing) (0 Missing) (1 Missing)
Male 39% 42% 44% 42%
Female 61% 58% 56% 58%
Total 100% 100% 100% 100%
(37 Missing) (76 Missing) (37 Missing) (150 Missing)
Emotional 3% 2% 2% 2%
Minor Physical 20% 17% 33% 24%
Significant Physical 45% 45% 48% 46%
Major Physical 9% 11% 7% 9%
Death 23% 26% 10% 20%
Total 100% 101%a
100% 101%a
Event Location Missing N/A Missing N/A Missing N/A Missing N/A
Patient's Room*** 7% 11% 7% 9%
Labor & Delivery Room*** 14% 13% 5% 10%
Operating Room*** 17% 23% 33% 25%
Emergency Department*** 13% 15% 8% 12%
Stay in Hospital (Days) (397 Missing) (709 Missing) (605 Missing) (1,711 Missing)
Range 0 to 226 0 to 1,472 0 to 2,686 0 to 2,686
Mean 15.43 23.69 32.84 24.96
Standard Deviation 27.08 73.71 171.846 112.693
Median 1.00 6.00 7.00 6.00
Table 2.2. Patient and Injury Characteristics
aNote: Total may be greater or less than 100% based on rounding.
***p<.001 **p<.01 *p<.05 + p<.10
Sex+
Age Distribution of Patient***
Injury Severity***
Number of Cases
Chapter Two 15 15
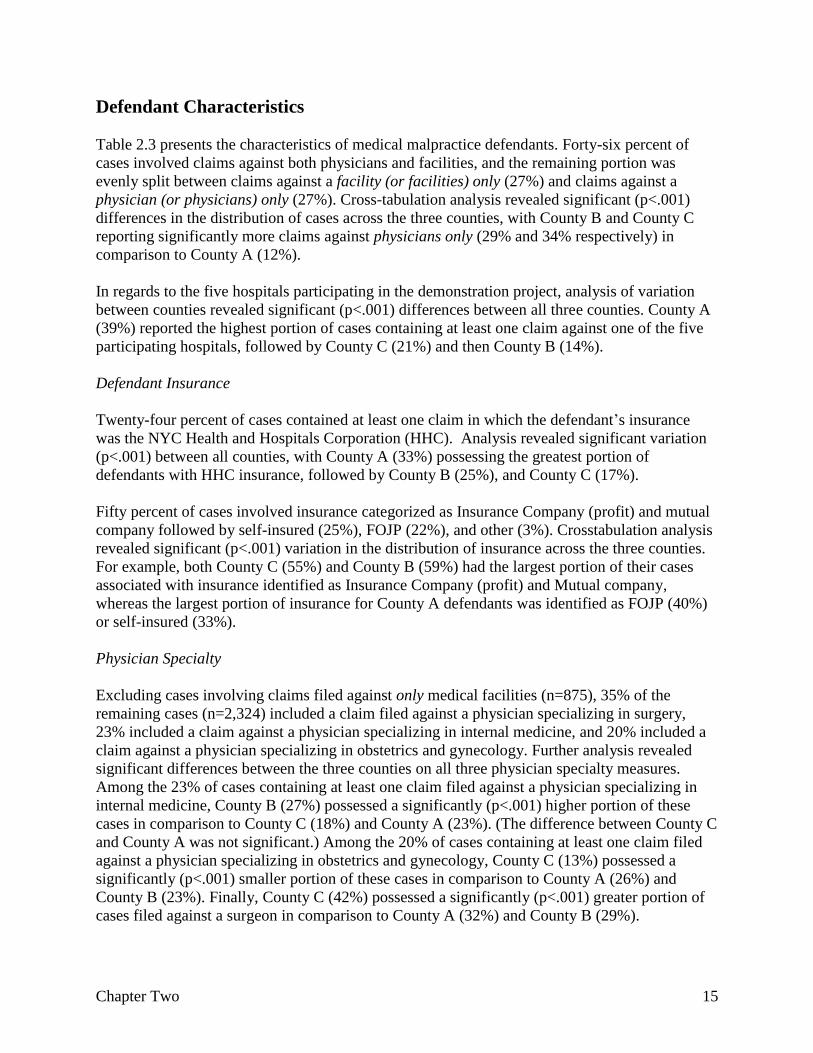
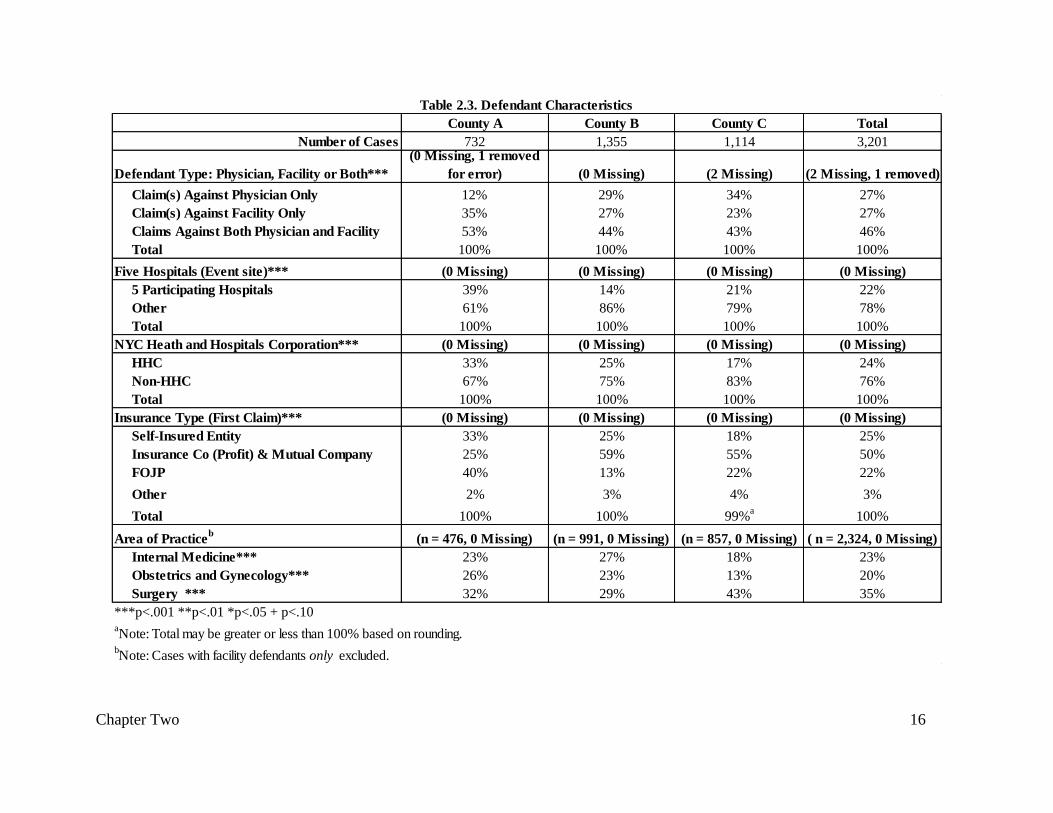
Defendant Characteristics
Table 2.3 presents the characteristics of medical malpractice defendants. Forty-six percent of
cases involved claims against both physicians and facilities, and the remaining portion was
evenly split between claims against a facility (or facilities) only (27%) and claims against a
physician (or physicians) only (27%). Cross-tabulation analysis revealed significant (p<.001)
differences in the distribution of cases across the three counties, with County B and County C
reporting significantly more claims against physicians only (29% and 34% respectively) in
comparison to County A (12%).
In regards to the five hospitals participating in the demonstration project, analysis of variation
between counties revealed significant (p<.001) differences between all three counties. County A
(39%) reported the highest portion of cases containing at least one claim against one of the five
participating hospitals, followed by County C (21%) and then County B (14%).
Defendant Insurance
Twenty-four percent of cases contained at least one claim in which the defendant’s insurance
was the NYC Health and Hospitals Corporation (HHC). Analysis revealed significant variation
(p<.001) between all counties, with County A (33%) possessing the greatest portion of
defendants with HHC insurance, followed by County B (25%), and County C (17%).
Fifty percent of cases involved insurance categorized as Insurance Company (profit) and mutual
company followed by self-insured (25%), FOJP (22%), and other (3%). Crosstabulation analysis
revealed significant (p<.001) variation in the distribution of insurance across the three counties.
For example, both County C (55%) and County B (59%) had the largest portion of their cases
associated with insurance identified as Insurance Company (profit) and Mutual company,
whereas the largest portion of insurance for County A defendants was identified as FOJP (40%)
or self-insured (33%).
Physician Specialty
Excluding cases involving claims filed against only medical facilities (n=875), 35% of the
remaining cases (n=2,324) included a claim filed against a physician specializing in surgery,
23% included a claim against a physician specializing in internal medicine, and 20% included a
claim against a physician specializing in obstetrics and gynecology. Further analysis revealed
significant differences between the three counties on all three physician specialty measures.
Among the 23% of cases containing at least one claim filed against a physician specializing in
internal medicine, County B (27%) possessed a significantly (p<.001) higher portion of these
cases in comparison to County C (18%) and County A (23%). (The difference between County C
and County A was not significant.) Among the 20% of cases containing at least one claim filed
against a physician specializing in obstetrics and gynecology, County C (13%) possessed a
significantly (p<.001) smaller portion of these cases in comparison to County A (26%) and
County B (23%). Finally, County C (42%) possessed a significantly (p<.001) greater portion of
cases filed against a surgeon in comparison to County A (32%) and County B (29%).
Chapter Two 16
County A County B County C Total
Number of Cases 732 1,355 1,114 3,201
Defendant Type: Physician, Facility or Both***
(0 Missing, 1 removed
for error) (0 Missing) (2 Missing) (2 Missing, 1 removed)
Claim(s) Against Physician Only 12% 29% 34% 27%
Claim(s) Against Facility Only 35% 27% 23% 27%
Claims Against Both Physician and Facility 53% 44% 43% 46%
Total 100% 100% 100% 100%
Five Hospitals (Event site)*** (0 Missing) (0 Missing) (0 Missing) (0 Missing)
5 Participating Hospitals 39% 14% 21% 22%
Other 61% 86% 79% 78%
Total 100% 100% 100% 100%
NYC Heath and Hospitals Corporation*** (0 Missing) (0 Missing) (0 Missing) (0 Missing)
HHC 33% 25% 17% 24%
Non-HHC 67% 75% 83% 76%
Total 100% 100% 100% 100%
Insurance Type (First Claim)*** (0 Missing) (0 Missing) (0 Missing) (0 Missing)
Self-Insured Entity 33% 25% 18% 25%
Insurance Co (Profit) & Mutual Company 25% 59% 55% 50%
FOJP 40% 13% 22% 22%
Other 2% 3% 4% 3%
Total 100% 100% 99%a
100%
Area of Practiceb
(n = 476, 0 Missing) (n = 991, 0 Missing) (n = 857, 0 Missing) ( n = 2,324, 0 Missing)
Internal Medicine*** 23% 27% 18% 23%
Obstetrics and Gynecology*** 26% 23% 13% 20%
Surgery *** 32% 29% 43% 35%
***p<.001 **p<.01 *p<.05 + p<.10aNote: Total may be greater or less than 100% based on rounding.
bNote: Cases with facility defendants only excluded.
Table 2.3. Defendant Characteristics
Chapter Two 17 17
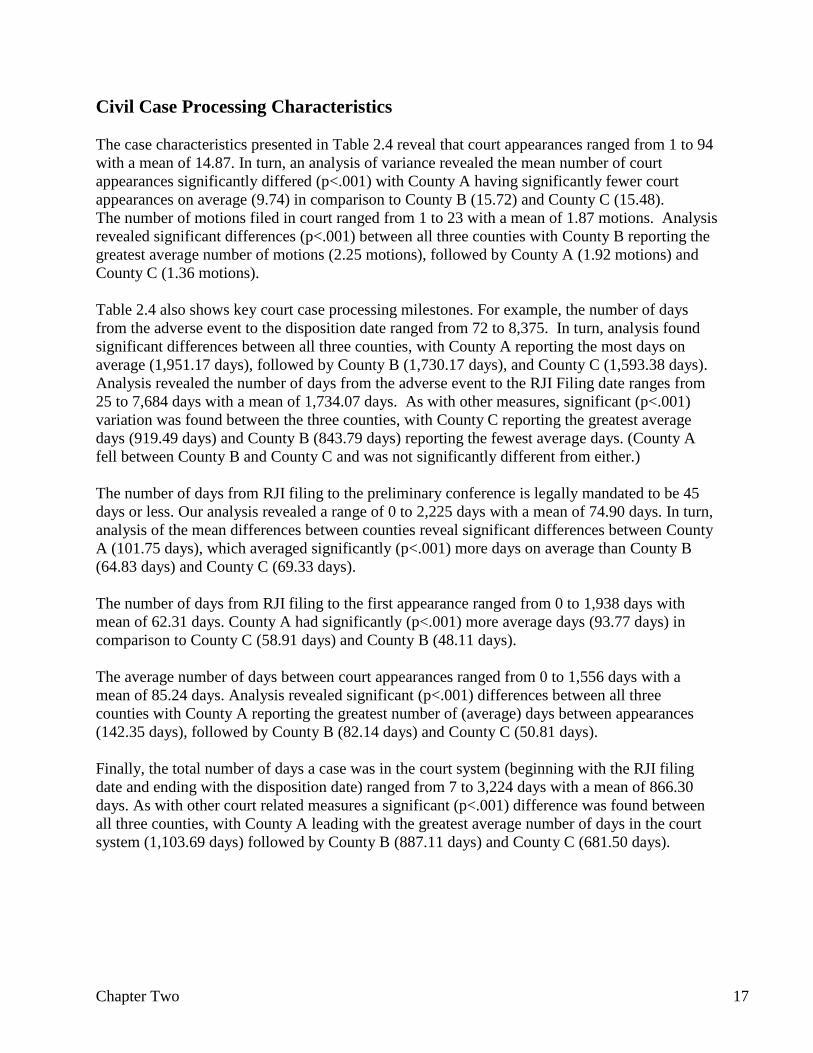
Civil Case Processing Characteristics
The case characteristics presented in Table 2.4 reveal that court appearances ranged from 1 to 94
with a mean of 14.87. In turn, an analysis of variance revealed the mean number of court
appearances significantly differed (p<.001) with County A having significantly fewer court
appearances on average (9.74) in comparison to County B (15.72) and County C (15.48).
The number of motions filed in court ranged from 1 to 23 with a mean of 1.87 motions. Analysis
revealed significant differences (p<.001) between all three counties with County B reporting the
greatest average number of motions (2.25 motions), followed by County A (1.92 motions) and
County C (1.36 motions).
Table 2.4 also shows key court case processing milestones. For example, the number of days
from the adverse event to the disposition date ranged from 72 to 8,375. In turn, analysis found
significant differences between all three counties, with County A reporting the most days on
average (1,951.17 days), followed by County B (1,730.17 days), and County C (1,593.38 days).
Analysis revealed the number of days from the adverse event to the RJI Filing date ranges from
25 to 7,684 days with a mean of 1,734.07 days. As with other measures, significant (p<.001)
variation was found between the three counties, with County C reporting the greatest average
days (919.49 days) and County B (843.79 days) reporting the fewest average days. (County A
fell between County B and County C and was not significantly different from either.)
The number of days from RJI filing to the preliminary conference is legally mandated to be 45
days or less. Our analysis revealed a range of 0 to 2,225 days with a mean of 74.90 days. In turn,
analysis of the mean differences between counties reveal significant differences between County
A (101.75 days), which averaged significantly (p<.001) more days on average than County B
(64.83 days) and County C (69.33 days).
The number of days from RJI filing to the first appearance ranged from 0 to 1,938 days with
mean of 62.31 days. County A had significantly (p<.001) more average days (93.77 days) in
comparison to County C (58.91 days) and County B (48.11 days).
The average number of days between court appearances ranged from 0 to 1,556 days with a
mean of 85.24 days. Analysis revealed significant (p<.001) differences between all three
counties with County A reporting the greatest number of (average) days between appearances
(142.35 days), followed by County B (82.14 days) and County C (50.81 days).
Finally, the total number of days a case was in the court system (beginning with the RJI filing
date and ending with the disposition date) ranged from 7 to 3,224 days with a mean of 866.30
days. As with other court related measures a significant (p<.001) difference was found between
all three counties, with County A leading with the greatest average number of days in the court
system (1,103.69 days) followed by County B (887.11 days) and County C (681.50 days).
Chapter Two 18
County A County B County C Total
Number of Cases 732 1,355 1,114 3,201
(0 Missing) (0 Missing) (0 Missing) (0 Missing)
Range 1 to 53 1 to 90 1 to 94 1 to 94
Mean 12.36 15.72 15.48 14.87
Standard Deviation 9.74 12.38 11.39 11.55
Median 10.00 13.00 13.00 12.00
Total Number of Motions*** (0 Missing) (0 Missing) (0 Missing) (0 Missing)
Range 0 to 16 0 to 23 0 to 17 1 to 23
Mean 1.92 2.25 1.36 1.87
Standard Deviation 2.06 2.70 1.7 2.28
Median 1.00 1.00 1.00 1.00
Event Date to Disposition Date (Days)*** (0 Missing) (0 Missing) (22 Missing) (22 Missing)
Range 179 to 8,375 225 to 7,323 72 to 6,381 72 to 8,375
Mean 1,951.17 1,730.17 1,593.38 1,734.07
Standard Deviation 900.46 822.26 724.59 820.05
Median 1,861.00 1,603.00 1,495.00 1,608.00
Event Date to RJI File Date (Days)*** (0 Missing) (1 Missing) (5 Missing) (6 Missing)
Range 69 to 7,684 75 to 6,417 25 to 6,287 25 to 7,684
Mean 847.47 843.79 919.49 870.91
Standard Deviation 695.65 671.55 611.21 657.76
Median 661.00 711.50 826.00 742.00
RJI File Date to Preliminary Conference (Days)*** (82 Missing) (163 Missing) (137 Missing) (382 Missing)
Range 2 to 2,225 0 to 993 10 to 1,036 0 to 2,225
Mean 101.75 64.83 69.33 74.90
Standard Deviation 184.42 85.97 65.93 112.62
Median 48.00 37.00 51.00 44.00
RJI File Date to First Appearance (Days)*** (1 Missing) (1 Missing) (4 Missing) (6 Missing)
Range 2 to 1,938 0 to 678 5 to 847 0 to 1,938
Mean 93.77 48.11 58.91 62.31
Standard Deviation 191.99 66.32 47.9 106.78
Median 35.00 30.00 43.00 36.00
Average Number of Days Between Appearances (Days)*** (37 Missing) (14 Missng) (10 Missing) (61 Missing)
Range 0 to 1,556 0 to 429 0 to 386 0 to 1,556
Mean 142.35 82.14 50.81 85.24
Standard Deviation 162.70 62.08 30.14 95.90
Median 98.55 66.50 47.31 61.00
Case Time: RJI File Date To Disposition Date (Days)*** (0 Missing) (0 Missing) (21 Missing) (21 Missing)
Range 19 to 3,004 7 to 2,933 7 to 2,909 7 to 3,224
Mean 1,103.69 887.11 681.50 866.30
Standard Deviation 589.40 490.64 382.78 507.59
Median 1,104.00 856.00 667.00 808.00
aNote: Total may be greater or less than 100% based on rounding.
Table 2.4. Civil Case Characteristics
Total Number of Court Appearances***
***p<.001 **p<.01 *p<.05 + p<.10
Chapter Two 19 19
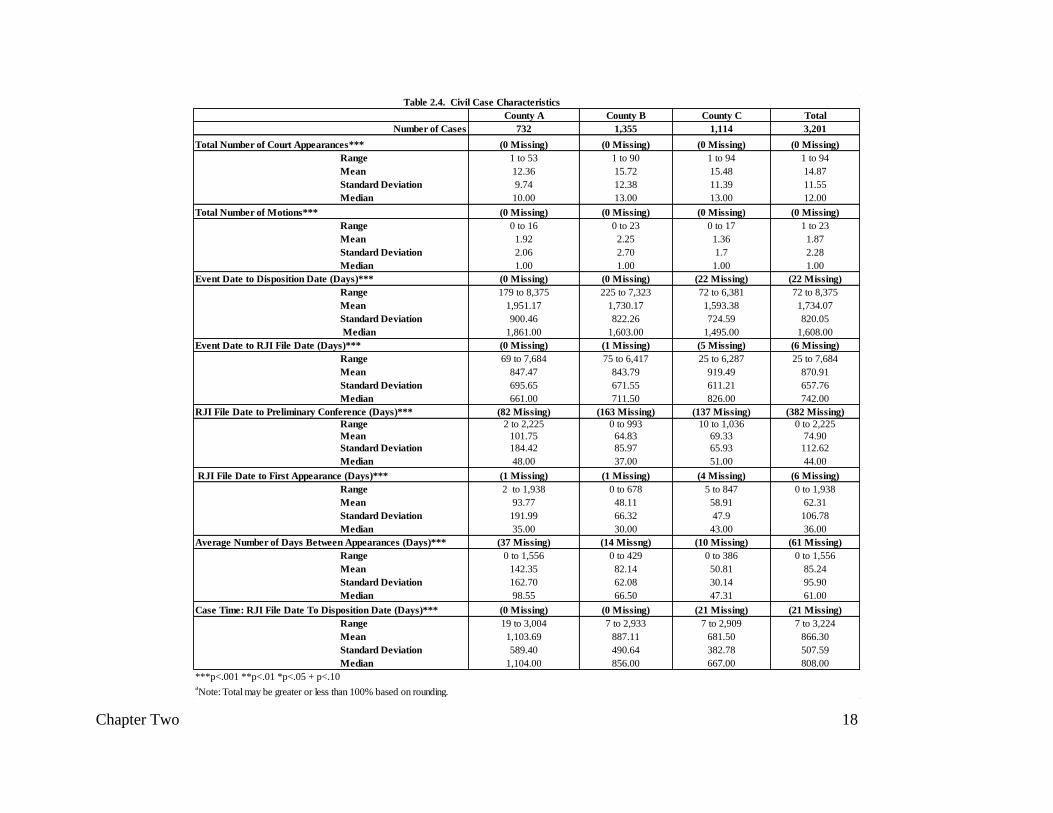
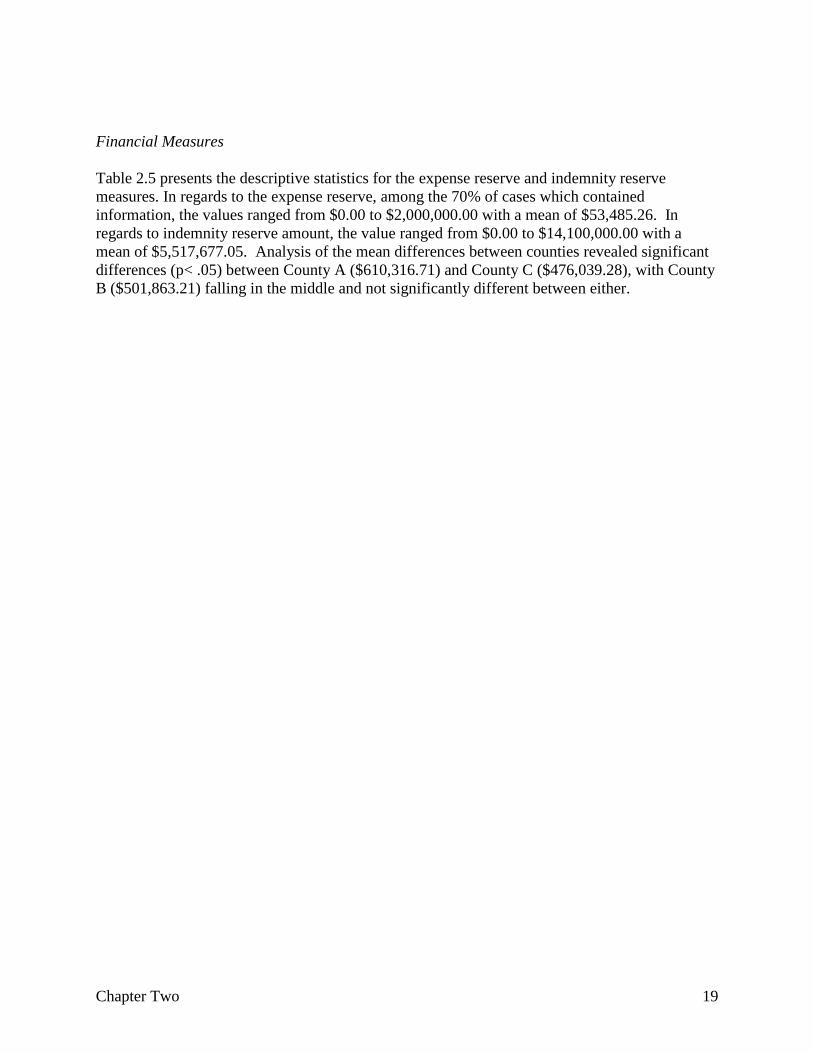
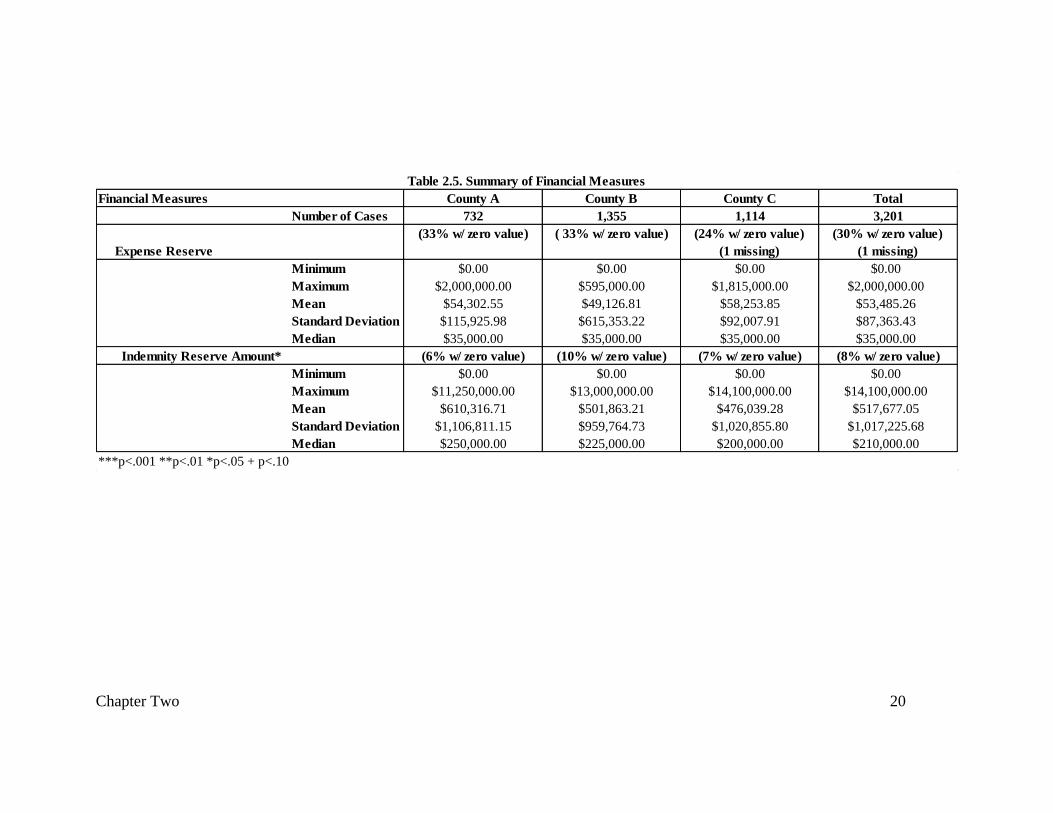
Financial Measures
Table 2.5 presents the descriptive statistics for the expense reserve and indemnity reserve
measures. In regards to the expense reserve, among the 70% of cases which contained
information, the values ranged from $0.00 to $2,000,000.00 with a mean of $53,485.26. In
regards to indemnity reserve amount, the value ranged from $0.00 to $14,100,000.00 with a
mean of $5,517,677.05. Analysis of the mean differences between counties revealed significant
differences (p< .05) between County A ($610,316.71) and County C ($476,039.28), with County
B ($501,863.21) falling in the middle and not significantly different between either.
Chapter Two 20
Financial Measures County A County B County C Total
Number of Cases 732 1,355 1,114 3,201
Expense Reserve
(33% w/ zero value) ( 33% w/ zero value) (24% w/ zero value)
(1 missing)
(30% w/ zero value)
(1 missing)
Minimum $0.00 $0.00 $0.00 $0.00
Maximum $2,000,000.00 $595,000.00 $1,815,000.00 $2,000,000.00
Mean $54,302.55 $49,126.81 $58,253.85 $53,485.26
Standard Deviation $115,925.98 $615,353.22 $92,007.91 $87,363.43
Median $35,000.00 $35,000.00 $35,000.00 $35,000.00
Indemnity Reserve Amount* (6% w/ zero value) (10% w/ zero value) (7% w/ zero value) (8% w/ zero value)
Minimum $0.00 $0.00 $0.00 $0.00
Maximum $11,250,000.00 $13,000,000.00 $14,100,000.00 $14,100,000.00
Mean $610,316.71 $501,863.21 $476,039.28 $517,677.05
Standard Deviation $1,106,811.15 $959,764.73 $1,020,855.80 $1,017,225.68
Median $250,000.00 $225,000.00 $200,000.00 $210,000.00
***p<.001 **p<.01 *p<.05 + p<.10
Table 2.5. Summary of Financial Measures
Chapter Two 21 21
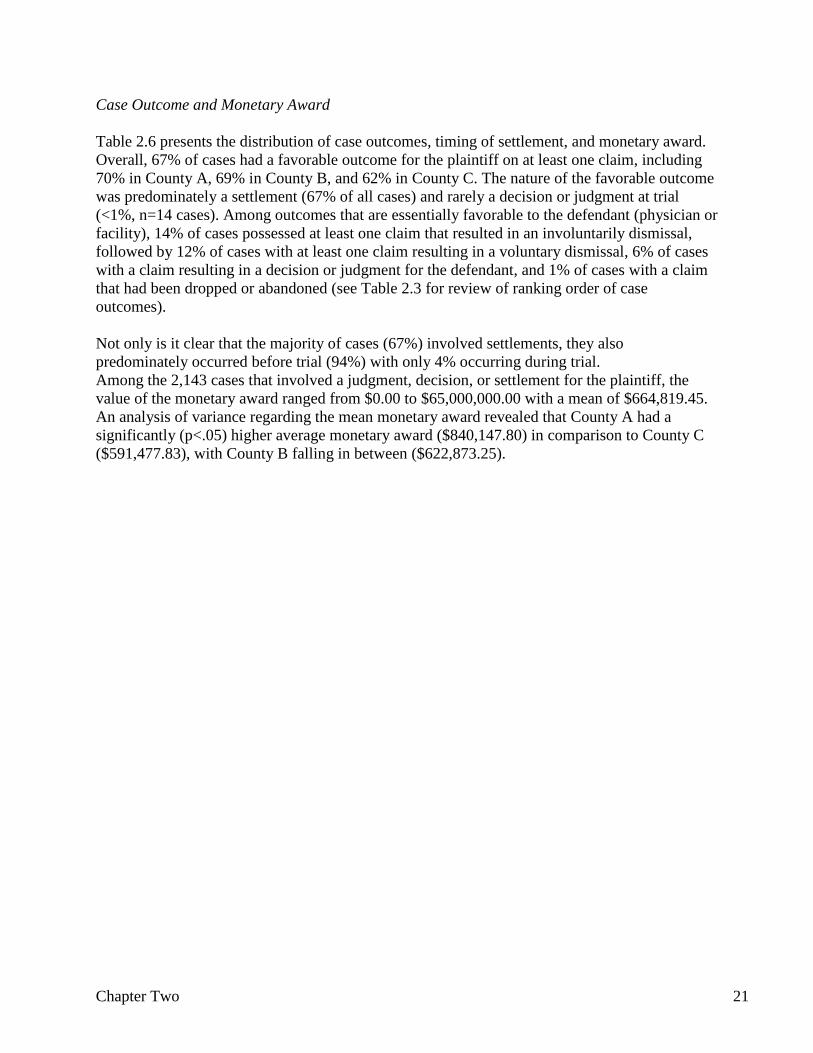
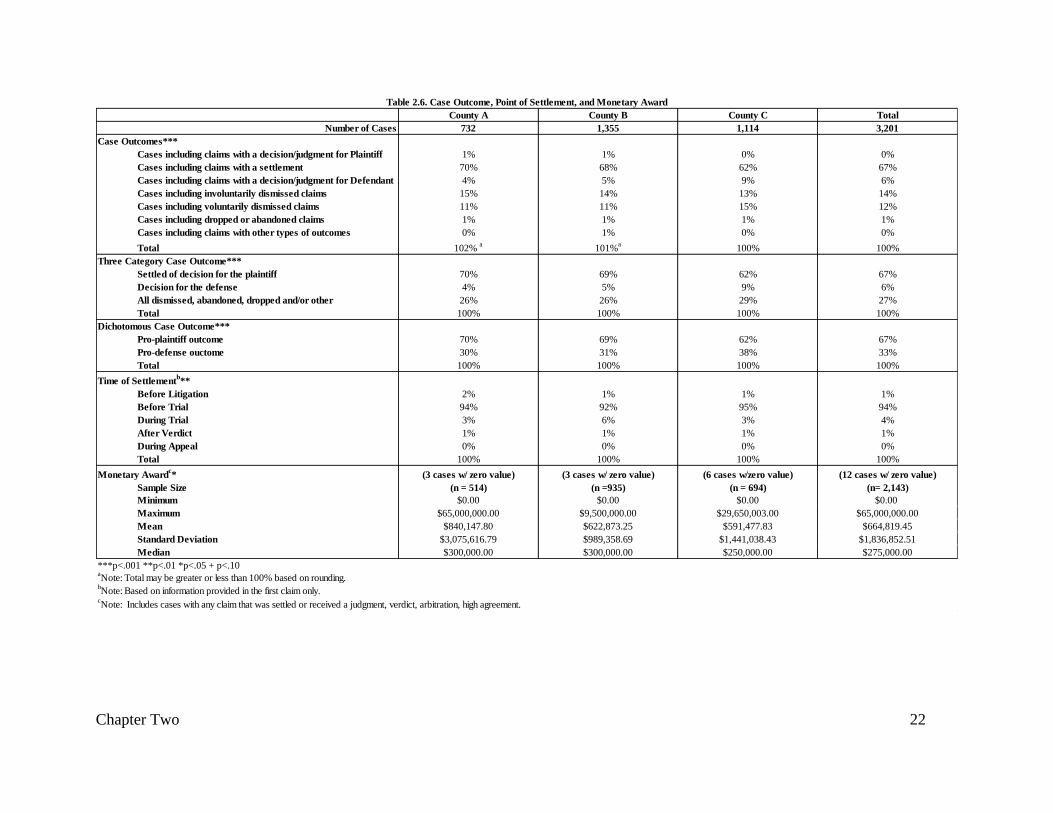
Case Outcome and Monetary Award
Table 2.6 presents the distribution of case outcomes, timing of settlement, and monetary award.
Overall, 67% of cases had a favorable outcome for the plaintiff on at least one claim, including
70% in County A, 69% in County B, and 62% in County C. The nature of the favorable outcome
was predominately a settlement (67% of all cases) and rarely a decision or judgment at trial
(<1%, n=14 cases). Among outcomes that are essentially favorable to the defendant (physician or
facility), 14% of cases possessed at least one claim that resulted in an involuntarily dismissal,
followed by 12% of cases with at least one claim resulting in a voluntary dismissal, 6% of cases
with a claim resulting in a decision or judgment for the defendant, and 1% of cases with a claim
that had been dropped or abandoned (see Table 2.3 for review of ranking order of case
outcomes).
Not only is it clear that the majority of cases (67%) involved settlements, they also
predominately occurred before trial (94%) with only 4% occurring during trial.
Among the 2,143 cases that involved a judgment, decision, or settlement for the plaintiff, the
value of the monetary award ranged from $0.00 to $65,000,000.00 with a mean of $664,819.45.
An analysis of variance regarding the mean monetary award revealed that County A had a
significantly (p<.05) higher average monetary award ($840,147.80) in comparison to County C
($591,477.83), with County B falling in between ($622,873.25).
Chapter Two 22
County A County B County C Total
Number of Cases 732 1,355 1,114 3,201
Case Outcomes***
Cases including claims with a decision/judgment for Plaintiff 1% 1% 0% 0%
Cases including claims with a settlement 70% 68% 62% 67%
Cases including claims with a decision/judgment for Defendant 4% 5% 9% 6%
Cases including involuntarily dismissed claims 15% 14% 13% 14%
Cases including voluntarily dismissed claims 11% 11% 15% 12%
Cases including dropped or abandoned claims 1% 1% 1% 1%
Cases including claims with other types of outcomes 0% 1% 0% 0%
Total 102% a
101%a
100% 100%
Settled of decision for the plaintiff 70% 69% 62% 67%
Decision for the defense 4% 5% 9% 6%
All dismissed, abandoned, dropped and/or other 26% 26% 29% 27%
Total 100% 100% 100% 100%
Pro-plaintiff outcome 70% 69% 62% 67%
Pro-defense ouctome 30% 31% 38% 33%
Total 100% 100% 100% 100%
Time of Settlementb**
Before Litigation 2% 1% 1% 1%
Before Trial 94% 92% 95% 94%
During Trial 3% 6% 3% 4%
After Verdict 1% 1% 1% 1%
During Appeal 0% 0% 0% 0%
Total 100% 100% 100% 100%
Monetary Awardc* (3 cases w/ zero value) (3 cases w/ zero value) (6 cases w/zero value) (12 cases w/ zero value)
Sample Size (n = 514) (n =935) (n = 694) (n= 2,143)
Minimum $0.00 $0.00 $0.00 $0.00
Maximum $65,000,000.00 $9,500,000.00 $29,650,003.00 $65,000,000.00
Mean $840,147.80 $622,873.25 $591,477.83 $664,819.45
Standard Deviation $3,075,616.79 $989,358.69 $1,441,038.43 $1,836,852.51
Median $300,000.00 $300,000.00 $250,000.00 $275,000.00
aNote: Total may be greater or less than 100% based on rounding.
bNote: Based on information provided in the first claim only.
cNote: Includes cases with any claim that was settled or received a judgment, verdict, arbitration, high agreement.
Table 2.6. Case Outcome, Point of Settlement, and Monetary Award
***p<.001 **p<.01 *p<.05 + p<.10
Three Category Case Outcome***
Dichotomous Case Outcome***

Chapter Two 23 23
Summary
Our analysis revealed important trends and patterns both in general and between counties. Of
note are the differences between County A in comparison to County B and County C. For
example, even though County A had the lowest average number of court appearances, County A
cases run for the longest spans of time, whether it has the time from RJI filing to the first
appearance, to the preliminary conference or to the disposition date. In turn, County A stands
out as having a significantly higher average monetary award (in conjunction with a significantly
higher average indemnity reserve amount) than the other two counties.

Chapter Three 24
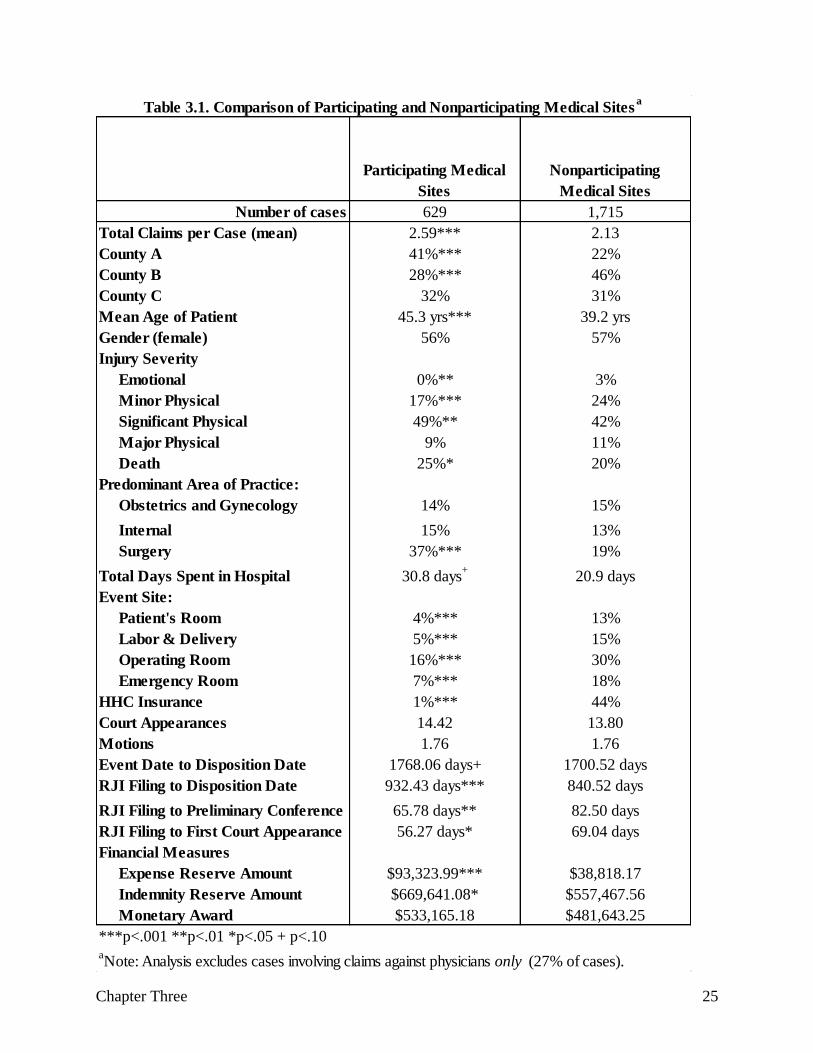
Chapter Three: Comparison of Case Characteristics between
Participating and Nonparticipating Medical Sites
This chapter presents results of a comparison of plaintiff, defendant, and case characteristics
between cases with claims against demonstration and non-demonstration medical facilities.18 The
purpose of this comparison is not to evaluate either type of facility but primarily to understand
the kinds of cases, injuries, and other baseline case characteristics that were particularly likely to
be found within those medical facilities that participated in the Medical Liability Reform and
Patient Safety Demonstration. Table 3.1 indicates significant differences between demonstration
and non-demonstration sites across many measures. For example, cases with claims against
demonstration hospitals had a significantly greater number of claims (p<.001), as well as
significantly more cases from County A (p<.001) and significantly less from County B (p<.001).
In terms of plaintiff characteristics, cases associated with demonstration hospitals had a
significantly greater number of older plaintiffs (p<.001), who suffered two types of injuries:
significant physical (p<.01) or death (p<.05). In turn, cases involving claims against non-
participating medical facilities had a significantly greater number of emotional (p<.01) and
minor physical (p<.001) injuries. There was also a greater number of cases against physicians
with a surgery specialty (p<.001) among the participating medical facilities, but significantly
fewer adverse events at all four (p<.001) isolated event locations (i.e., patient’s room, emergency
department, operating room, and labor/delivery). Cases associated with participating medical
facilities had significantly fewer hospitals with HHC insurance (p<.001) as compared to the
nonparticipating medical facilities. While cases associated with participating medical facilities
had a greater number of days on average from the time of RJI filing to the disposition date
(p<.001), they had fewer days from RJI filing to preliminary conference (p<.01) and from the
RJI filing to the first court appearance. (p <.05). Finally, both the expense (p<.001) and
indemnity (p<.05) reserve amounts were significantly higher among the participating medical
facilities, while there was no significant difference between the average monetary award.
Summary
Overall, when we compared nonparticipating and participating medical facilities, we discovered
that the participating facilities had a unique set of needs. For example, participating hospitals
were significantly more likely to have malpractice claims involving significant physical injuries
or the death of the patient. In turn, participating medical facilities were significantly more likely
to have more days from the RJI filing date to case disposition and higher expense and indemnity
reserve amounts. Within this context, these participating sites reveal a history of particular needs
that would seem to make them good candidates for the demonstration project of which they are
part.
18 Cases with claims against physicians only were excluded from the analysis (28%). Non-demonstration sites
include a range of hospitals, clinics, and doctor’s offices.
Chapter Three 25
Participating Medical
Sites
Nonparticipating
Medical Sites
Number of cases 629 1,715
Total Claims per Case (mean) 2.59*** 2.13
County A 41%*** 22%
County B 28%*** 46%
County C 32% 31%
Mean Age of Patient 45.3 yrs*** 39.2 yrs
Gender (female) 56% 57%
Injury Severity
Emotional 0%** 3%
Minor Physical 17%*** 24%
Significant Physical 49%** 42%
Major Physical 9% 11%
Death 25%* 20%
Predominant Area of Practice:
Obstetrics and Gynecology 14% 15%
Internal 15% 13%
Surgery 37%*** 19%
Total Days Spent in Hospital 30.8 days+
20.9 days
Event Site:
Patient's Room 4%*** 13%
Labor & Delivery 5%*** 15%
Operating Room 16%*** 30%
Emergency Room 7%*** 18%
HHC Insurance 1%*** 44%
Court Appearances 14.42 13.80
Motions 1.76 1.76
Event Date to Disposition Date 1768.06 days+ 1700.52 days
RJI Filing to Disposition Date 932.43 days*** 840.52 days
RJI Filing to Preliminary Conference 65.78 days** 82.50 days
RJI Filing to First Court Appearance 56.27 days* 69.04 days
Financial Measures
Expense Reserve Amount $93,323.99*** $38,818.17
Indemnity Reserve Amount $669,641.08* $557,467.56
Monetary Award $533,165.18 $481,643.25
aNote: Analysis excludes cases involving claims against physicians only (27% of cases).
Table 3.1. Comparison of Participating and Nonparticipating Medical Sitesa
***p<.001 **p<.01 *p<.05 + p<.10

Chapter Four 26
Chapter Four: Predicting Case Outcome and Monetary Award
This chapter presents findings from multiple regression analyses examining the impact of
plaintiff, defendant, and case characteristics on case outcome as well as monetary award. In
addition, separate county-level analyses were conducted to examine if the presiding judge and
judicial consistency measures have an independent impact on these relationships. Prior to
conducting final multiple regression analyses, bivariate relationships were examined with a
larger array of potential predictors than those represented in the tables that follow. Where
measures are not represented (e.g., patient sex in Table 4.1), it can be inferred that the measure
was not significant in the bivariate analyses.
Examining Dispositions: Factors Related to Case Outcomes with Monetary
Awards
Table 4.1 presents the results of logistic regression analysis predicting case outcomes with and
with a monetary award (settlement, judgment, or verdict for the plaintiff). Model 1 includes
relevant baseline measures (e.g., county, patient age, injury severity, and physician specialty).
Model 2 includes these baseline measures as well as intervening court case process measures.
These models were created to examine the extent to which the predictive power of the baseline
measures on final outcomes is mediated by what happens during the court process.
Model 1 reveals that six of the baseline measures significantly predicted case outcomes with
monetary awards. Specifically, cases with more claims (p<.001), involving an HHC insurance
provider (p<.001), minor physical injury (p<.01), significant physical injury (p< .001), major
physical injury (P<.001), or death (P<.001) had significantly greater odds of receiving case
outcomes with a monetary award. From inspecting the odds ratios, in regards to the patient injury
measures, the odds of a case outcome with a monetary award increase dramatically (odds ratio =
8.315) when there is a “major” physical injury compared to emotional injury (the reference
category); increase substantially with a “significant” physical injury or death (odds ratios
between 4.000 and 5.000); and increase less but still significantly with a “minor” physical injury
(odds ratio = 2.383).
With the introduction of court processing measures in Model 2 we see only slight reductions in
the predictive power of the baseline measures. County A also gains significance, meaning that
County A cases have significantly (p<.01) lower odds of receiving case outcomes with a
monetary award. In addition, three of the four court processing measures themselves reached
statistical significance. For example, cases with more days between the adverse event and RJI
filing (p<.001) as well as more days between the RJI filing and case disposition (p<.001) have
significantly greater odds of receiving a case outcome with a monetary award. Since cases in
County A average a significantly longer period than County B or County C from RJI filing to
disposition, it is only in Model 2 that it becomes apparent, that once controlling for this case
processing difference by county, County A otherwise sees fewer case outcomes with a monetary
award. On the other hand, cases with more motions (p<.001) had significantly lower odds of
receiving a case outcome with a monetary award. Overall, the inclusion of court processing
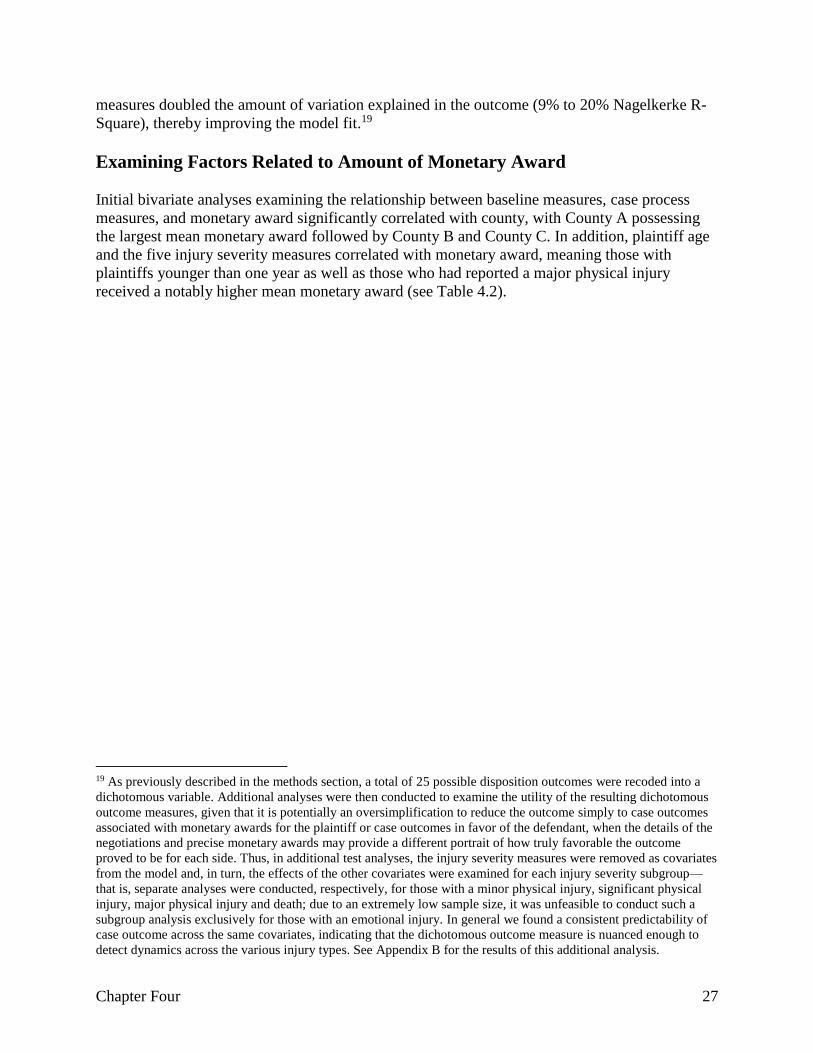
Chapter Four 27
measures doubled the amount of variation explained in the outcome (9% to 20% Nagelkerke R-
Square), thereby improving the model fit.19
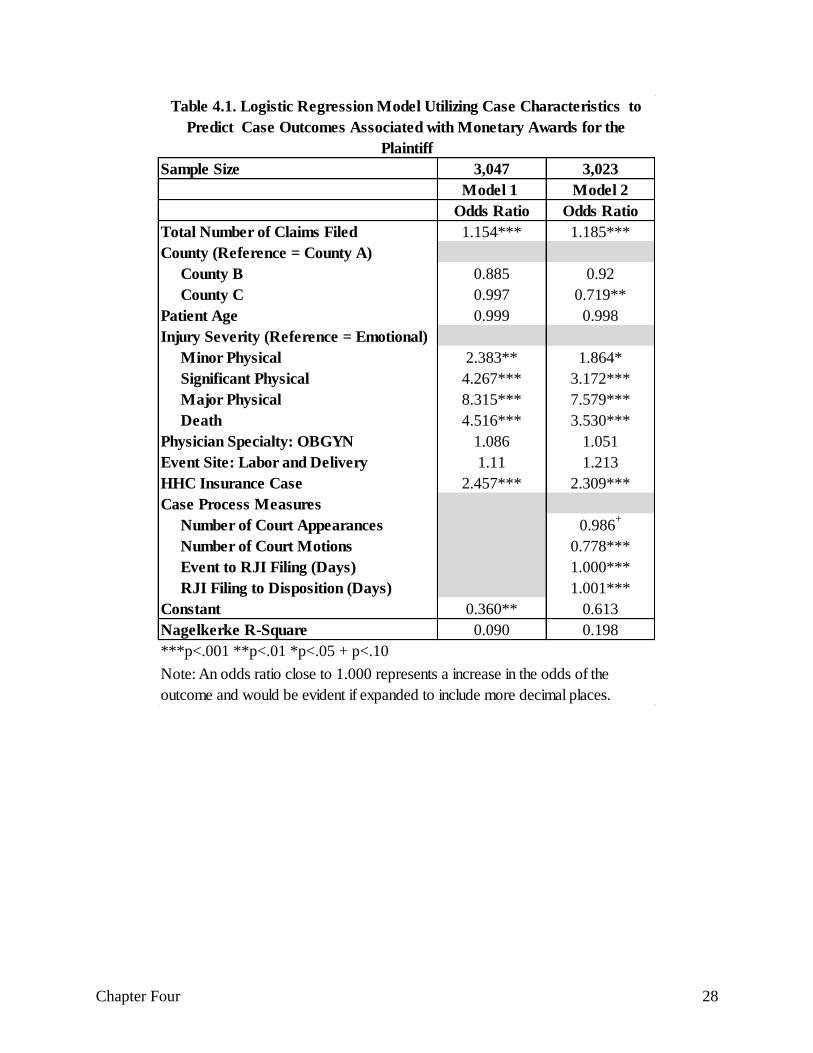
Examining Factors Related to Amount of Monetary Award
Initial bivariate analyses examining the relationship between baseline measures, case process
measures, and monetary award significantly correlated with county, with County A possessing
the largest mean monetary award followed by County B and County C. In addition, plaintiff age
and the five injury severity measures correlated with monetary award, meaning those with
plaintiffs younger than one year as well as those who had reported a major physical injury
received a notably higher mean monetary award (see Table 4.2).
19 As previously described in the methods section, a total of 25 possible disposition outcomes were recoded into a
dichotomous variable. Additional analyses were then conducted to examine the utility of the resulting dichotomous
outcome measures, given that it is potentially an oversimplification to reduce the outcome simply to case outcomes
associated with monetary awards for the plaintiff or case outcomes in favor of the defendant, when the details of the
negotiations and precise monetary awards may provide a different portrait of how truly favorable the outcome
proved to be for each side. Thus, in additional test analyses, the injury severity measures were removed as covariates
from the model and, in turn, the effects of the other covariates were examined for each injury severity subgroup—
that is, separate analyses were conducted, respectively, for those with a minor physical injury, significant physical
injury, major physical injury and death; due to an extremely low sample size, it was unfeasible to conduct such a
subgroup analysis exclusively for those with an emotional injury. In general we found a consistent predictability of
case outcome across the same covariates, indicating that the dichotomous outcome measure is nuanced enough to
detect dynamics across the various injury types. See Appendix B for the results of this additional analysis.
Chapter Four 28
Sample Size 3,047 3,023
Model 1 Model 2
Odds Ratio Odds Ratio
Total Number of Claims Filed 1.154*** 1.185***
County (Reference = County A)
County B 0.885 0.92
County C 0.997 0.719**
Patient Age 0.999 0.998
Injury Severity (Reference = Emotional)
Minor Physical 2.383** 1.864*
Significant Physical 4.267*** 3.172***
Major Physical 8.315*** 7.579***
Death 4.516*** 3.530***
Physician Specialty: OBGYN 1.086 1.051
Event Site: Labor and Delivery 1.11 1.213
HHC Insurance Case 2.457*** 2.309***
Case Process Measures
Number of Court Appearances 0.986+
Number of Court Motions 0.778***
Event to RJI Filing (Days) 1.000***
RJI Filing to Disposition (Days) 1.001***
Constant 0.360** 0.613
Nagelkerke R-Square 0.090 0.198
***p<.001 **p<.01 *p<.05 + p<.10
Table 4.1. Logistic Regression Model Utilizing Case Characteristics to
Predict Case Outcomes Associated with Monetary Awards for the
Plaintiff
Note: An odds ratio close to 1.000 represents a increase in the odds of the
outcome and would be evident if expanded to include more decimal places.
Chapter Four 29
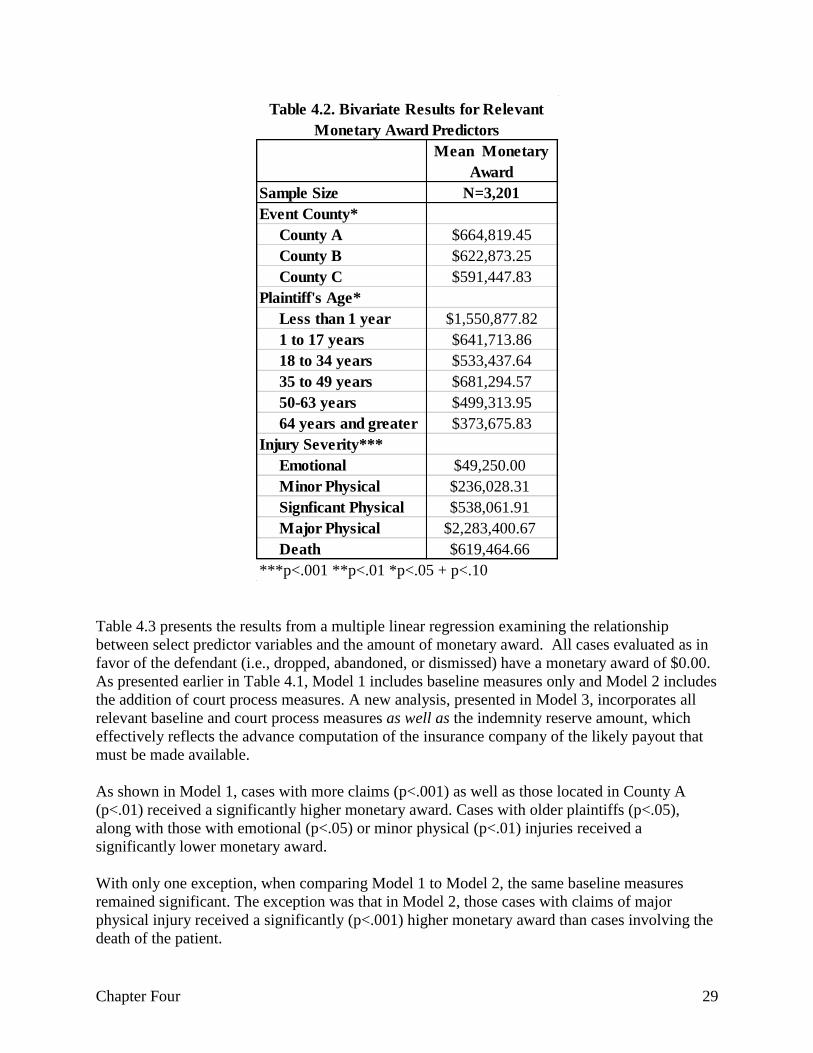
Table 4.3 presents the results from a multiple linear regression examining the relationship
between select predictor variables and the amount of monetary award. All cases evaluated as in
favor of the defendant (i.e., dropped, abandoned, or dismissed) have a monetary award of $0.00.
As presented earlier in Table 4.1, Model 1 includes baseline measures only and Model 2 includes
the addition of court process measures. A new analysis, presented in Model 3, incorporates all
relevant baseline and court process measures as well as the indemnity reserve amount, which
effectively reflects the advance computation of the insurance company of the likely payout that
must be made available.
As shown in Model 1, cases with more claims (p<.001) as well as those located in County A
(p<.01) received a significantly higher monetary award. Cases with older plaintiffs (p<.05),
along with those with emotional (p<.05) or minor physical (p<.01) injuries received a
significantly lower monetary award.
With only one exception, when comparing Model 1 to Model 2, the same baseline measures
remained significant. The exception was that in Model 2, those cases with claims of major
physical injury received a significantly (p<.001) higher monetary award than cases involving the
death of the patient.
Mean Monetary
Award
Sample Size N=3,201
Event County*
County A $664,819.45
County B $622,873.25
County C $591,447.83
Plaintiff's Age*
Less than 1 year $1,550,877.82
1 to 17 years $641,713.86
18 to 34 years $533,437.64
35 to 49 years $681,294.57
50-63 years $499,313.95
64 years and greater $373,675.83
Injury Severity***
Emotional $49,250.00
Minor Physical $236,028.31
Signficant Physical $538,061.91
Major Physical $2,283,400.67
Death $619,464.66
***p<.001 **p<.01 *p<.05 + p<.10
Table 4.2. Bivariate Results for Relevant
Monetary Award Predictors

Chapter Four 30
Among the three court process measures in Model 2, only the time from adverse event date to
RJI filing was significant, meaning that those cases with more days from the adverse event to the
RJI filing date averaged a significantly (p<.01) lower judgment award. Overall, we see close to
no change in the model fit, which remains close to 10%, from Model 1 to Model 2.
With the introduction of the indemnity reserve measure in Model 3, we observe a notable impact
on the predictive power of other measures as well as model fit. For example, five of the seven
statistically significant measures in Models 1 and 2 lost significance in Model 3. Only major
physical injury (p<.001) and time from adverse event date to RJI filing (p<.05) remained
significant. In turn, cases with higher indemnity reserve amounts averaged a significantly
(p<.001) higher monetary award (Beta = .428). In turn, we find that Model 3 increased the
variation accounted for in the outcome measure, from 10% to 24%, markedly increasing model
fit.
Chapter Four 31
Table 4.4 presents findings from the same analysis conducted above but with a subsample of the
cases with an outcome (judgement, decision, or settlement for the plaintiff) with a monetary
award (n = 2,143). This analysis is intended to examine how the relationship between baseline
and court process measures and monetary award may vary when focusing on only those cases
with outcomes in favor of the plaintiff. Overall we find similar results as the analysis presented
in Table 4.3.
With five of the baseline measures signficantly predicting monetary award, Model 1 explains
11% of the variation in monetary award. In Model 2 many these same measures remained
statistically significant, with only slight variations in beta coefficients or significance levels. In
Sample Size 3,034 3,007 3,006
Model 1 Model 2 Model 3
Beta Beta Beta
Total Number of Claims Filed 0.070*** 0.068*** -0.020
County (Reference = County B)
County C 0.024 0.026 -0.007
County A 0.054** 0.060** 0.035+
Patient Age -0.051* -0.059** -0.024
Patient Sex (Female) -0.007 -0.006 -0.004
Injury Severity (Reference = Death)1
Emotional -0.039* -0.037* -0.009
Minor Physical -0.079** -0.079** -0.011
Significant Physical -0.031 -0.031 0.015
Major Physical 0.233 0.241*** 0.137***
Physician Specialty: OBGYN 0.012 0.008 -0.004
Event Site: Labor/Delivery 0.03 0.035 -0.004
Court Related Measures
Total Number of Court Appearances 0.019 0.026
Event Date to RJI Filing (Days) -0.054** -0.038*
RJI Filing to Disposition Date (Days) -0.018 -0.026
Expense Reserve Amount -0.027
Indemnity Reserve Amount 0.428***
Adj. R-Squared 0.100 0.101 0.241
***p<.001 **p<.01 *p<.05 + p<.10
Table 4.3. Linear Regression Predicting Monetary Award
1Note: Based on lack of significant association during initial bivariate analysis, "death" was excluded
from the analysis, thereby serving as the reference measure whereas in Table 5.1 "emotional"
physical injury was the reference category as it had been excluded due to lack of significant
association in the bivariate correlation.
Chapter Four 32
addition, those cases with more days between adverse event date and RJI filing date received a
significantly (p<.05) lower monetary award. However, those cases with more days between RJI
filing and disposition date, received a significantly (p<.05) higher monetary award. For Model 2,
the variance explained increased less than one percent (Adjusted R-square of 11%).
In Model 3, two additional measures, indemnity reserve amount and expense reserve, were
introduced. However, only indemnity reserve gained statistical significance and, as observed in
the full sample analysis, the inclusion of this powerful measure (Beta = .415) dramatically
altered the findings for other parameters. For example, three of the significant baseline measures
in Model 2 lost statistical significance in Model 3. In addition, HHC insurance gained statistical
significance in Model 3, meaning that those cases in which defendants possessed HHC insurance
received a significantly (p<.05) lower monetary award, after controlling for the given insurance
company’s expectations (as signaled by the indemnity reserve). Overall, the inclusion of the
indemnity reserve measure in Model 3 increased the variance explained from 11% to 24%,
notably improving the model fit.20
20 To further examine the utility of our dichotomous outcome measure, the regression analysis in Table 4.4 was
reexamined isolating each type of injury severity in a separate subgroup analysis. (Such an analysis was not
performed with the subgroup of cases with an emotional injury severity, due to extremely low sample size. Our
analysis revealed that the R2 increased with an increase in the severity level. This finding confirms that with more
serious injuries, there may be particularly great variations in judgment amount, beyond the level of variation shown
when grouping all injury severities together in a single analysis. Accordingly, see Appendix C to view the results
from this additional clarifying analysis.

Chapter Four 33
County Level Analysis Predicting Case Outcomes with a Monetary Award:
Examining the Impact of the Presiding Judge21
In order to examine the impact of the presiding judge on case outcome, three separate county
level analyses were conducted. A select number of the most commonly cited judges were
chosen for each county and court appearance data was recoded in order to create a measure
representing the proportion of time each case had come before one of the selected judges out of
their total number of court appearances (an additional “other” category was created to represent
all other court appearances in which other judges presided). In addition, the maximum
proportion a case was seen by one judge was selected to represent judicial consistency.
21 Across Tables 4.5 to 4.9, the minimum sample size was 694. So while we're not sharing the N in order to maintain
de-identification, it wasn't low enough that is should raise any power concerns.
Sample Size 2,026 2,018 2,015
Model 1 Model 2 Model 3
Beta Beta Beta
Total Number of Claims Filed 0.065** 0.060** -0.022
CountyA County 0.058** 0.087** 0.065**
Patient Age -0.060* -0.069** -0.035
Patient Sex (Female) -0.016 -0.014 -0.009
Injury Severity (Reference = Death)
Emotional -0.031 -0.034 -0.010
Minor Physical -0.071** -0.075** -0.012
Significant Physical -0.029 -0.031 0.008
Major Physical 0.239*** 0.247*** 0.142***
Event Site: Labor/Delivery 0.033 0.042 0.008
HHC Insurance -0.040+
-0.041+ -0.049*
Physician Specialty: OBGYN 0.011 0.008 -0.002
Court Related Measures
Total Number of Court Appearances 0.059 0.052
Total Number of Court Motions -0.034 0.018
Event Date to RJI filing (Days) -0.049* -0.040*
RJI Filing to Disposition (Days) 0.080* -0.063*
Expense Reserve Amount -0.035
Indemnity Reserve Amount 0.415***
Adj. R-Squared 0.107 0.112 0.236
***p<.001 **p<.01 *p<.05 + p<.10
Table 4.4. Linear Regression Predicting Monetary Award Among Cases with Claims that
Settled or Received a Judgment or Decision
Chapter Four 34
Table 4.5 presents the findings from our multiple logistic regression analysis predicting case any
outcome with a monetary award for County A.22 Model 1 (baseline measures only) explains 6%
of the variance in the outcome measure. Model 2 displays the results when the selected judges23
are added to the model and reveal that having a greater proportion of court appearances with
Judge B (odds ratio = 24.264, p <.001) or judge C (odds ratio = 5.379, p <.05) significantly
increases the odds of receiving a case outcome with a monetary award. The results in Model 2
demonstrate that presiding judge can have a significant and independent impact on case
outcomes, even after controlling for baseline characteristics.
The final model (Model 3) introduces two court process measures, the number of motions and
days from RJI filing to disposition, with both reaching statistical significance. Specifically,
Model 3 reveals that once days between RJI filing and disposition and number of motions are
controlled for, Judge C loses significance, meaning that Judge C influences case outcome in
County A through the mechanism of taking more time to process cases. (There was .213 simple
correlation between Judge C and days from RJI filing to disposition.) While Judge B remained a
significant (p<.05) predictor of case outcome, the magnitude of influence decreased from 24.264
to 13.530. A correlation analysis between Judge B and the two court process measures revealed
positive and significant relationships; thus, some of the influence of Judge B in Model 2 was
mediated by court processes (Judge B is associated with more motions and more days between
RJI filing and disposition).
22 County name is withheld in this analysis to maintain the de-identification of the judges. 23 Reference group is an unspecified number of “other” County A judges.
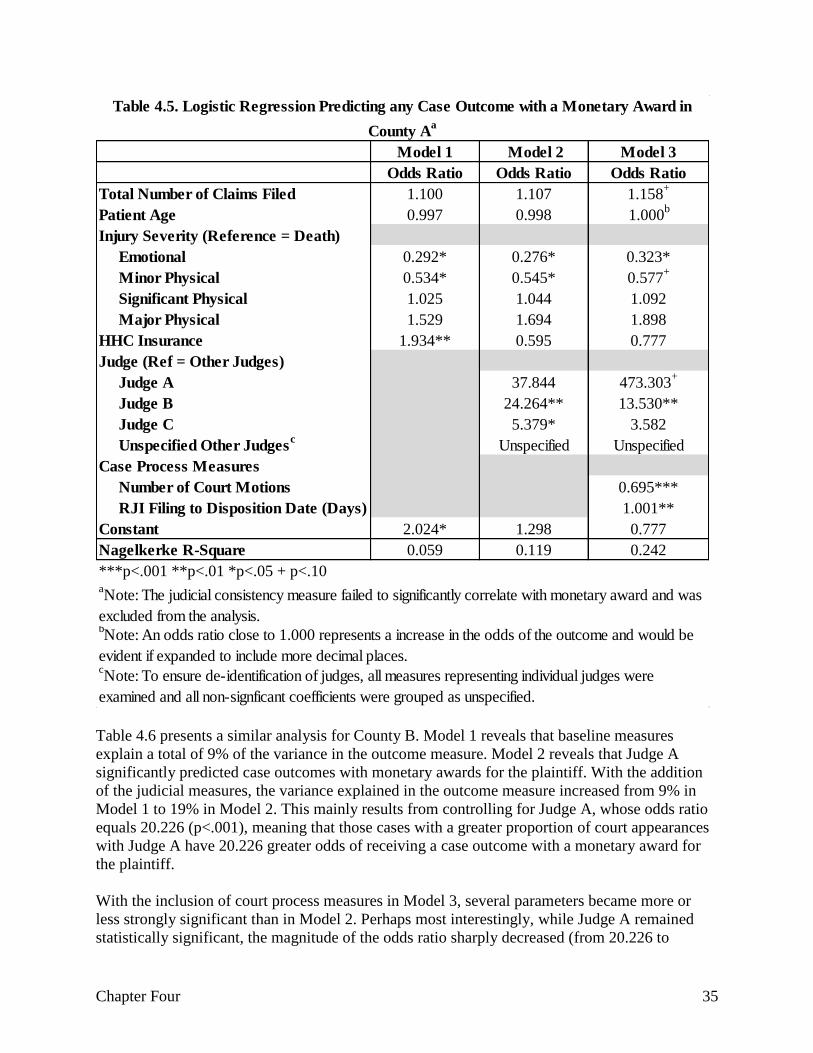
Chapter Four 35
Table 4.6 presents a similar analysis for County B. Model 1 reveals that baseline measures
explain a total of 9% of the variance in the outcome measure. Model 2 reveals that Judge A
significantly predicted case outcomes with monetary awards for the plaintiff. With the addition
of the judicial measures, the variance explained in the outcome measure increased from 9% in
Model 1 to 19% in Model 2. This mainly results from controlling for Judge A, whose odds ratio
equals 20.226 (p<.001), meaning that those cases with a greater proportion of court appearances
with Judge A have 20.226 greater odds of receiving a case outcome with a monetary award for
the plaintiff.
With the inclusion of court process measures in Model 3, several parameters became more or
less strongly significant than in Model 2. Perhaps most interestingly, while Judge A remained
statistically significant, the magnitude of the odds ratio sharply decreased (from 20.226 to
Model 1 Model 2 Model 3
Odds Ratio Odds Ratio Odds Ratio
Total Number of Claims Filed 1.100 1.107 1.158+
Patient Age 0.997 0.998 1.000b
Injury Severity (Reference = Death)
Emotional 0.292* 0.276* 0.323*
Minor Physical 0.534* 0.545* 0.577+
Significant Physical 1.025 1.044 1.092
Major Physical 1.529 1.694 1.898
HHC Insurance 1.934** 0.595 0.777
Judge (Ref = Other Judges)
Judge A 37.844 473.303+
Judge B 24.264** 13.530**
Judge C 5.379* 3.582
Unspecified Other Judgesc
Unspecified Unspecified
Case Process Measures
Number of Court Motions 0.695***
RJI Filing to Disposition Date (Days) 1.001**
Constant 2.024* 1.298 0.777
Nagelkerke R-Square 0.059 0.119 0.242
***p<.001 **p<.01 *p<.05 + p<.10
Table 4.5. Logistic Regression Predicting any Case Outcome with a Monetary Award in
County Aa
aNote: The judicial consistency measure failed to significantly correlate with monetary award and was
excluded from the analysis.bNote: An odds ratio close to 1.000 represents a increase in the odds of the outcome and would be
evident if expanded to include more decimal places.cNote: To ensure de-identification of judges, all measures representing individual judges were
examined and all non-signficant coefficients were grouped as unspecified.
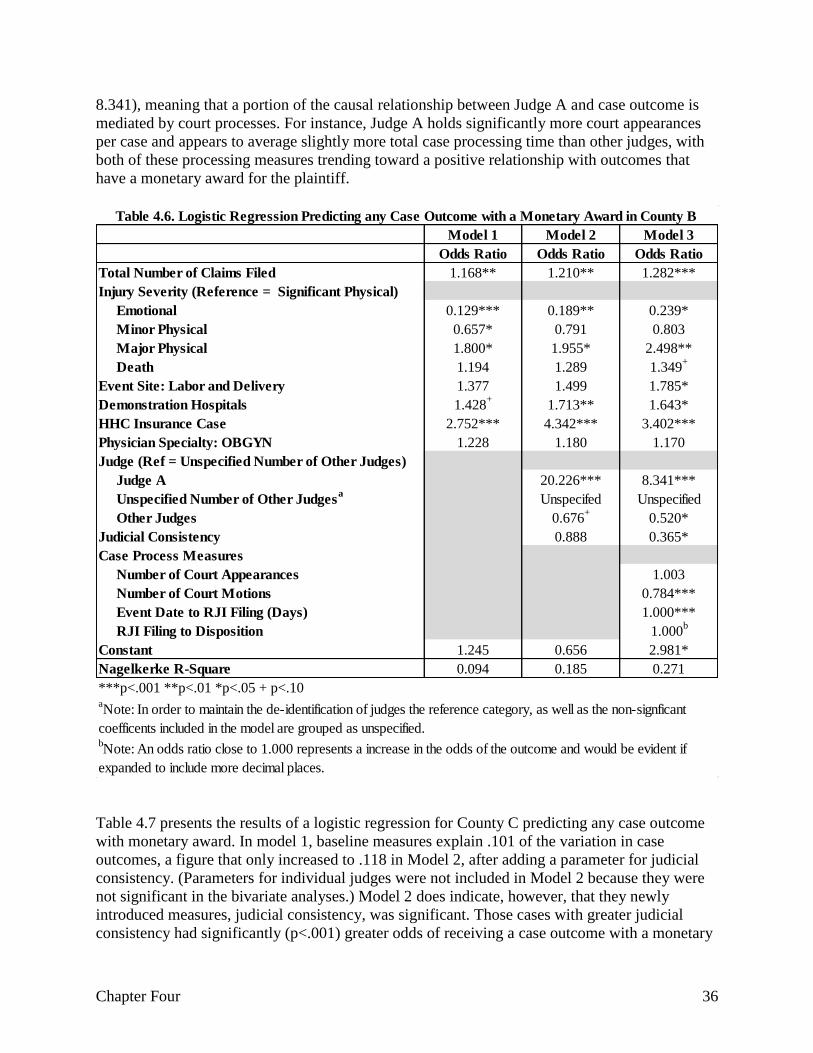
Chapter Four 36
8.341), meaning that a portion of the causal relationship between Judge A and case outcome is
mediated by court processes. For instance, Judge A holds significantly more court appearances
per case and appears to average slightly more total case processing time than other judges, with
both of these processing measures trending toward a positive relationship with outcomes that
have a monetary award for the plaintiff.
Table 4.7 presents the results of a logistic regression for County C predicting any case outcome
with monetary award. In model 1, baseline measures explain .101 of the variation in case
outcomes, a figure that only increased to .118 in Model 2, after adding a parameter for judicial
consistency. (Parameters for individual judges were not included in Model 2 because they were
not significant in the bivariate analyses.) Model 2 does indicate, however, that they newly
introduced measures, judicial consistency, was significant. Those cases with greater judicial
consistency had significantly (p<.001) greater odds of receiving a case outcome with a monetary
Model 1 Model 2 Model 3
Odds Ratio Odds Ratio Odds Ratio
Total Number of Claims Filed 1.168** 1.210** 1.282***
Injury Severity (Reference = Significant Physical)
Emotional 0.129*** 0.189** 0.239*
Minor Physical 0.657* 0.791 0.803
Major Physical 1.800* 1.955* 2.498**
Death 1.194 1.289 1.349+
Event Site: Labor and Delivery 1.377 1.499 1.785*
Demonstration Hospitals 1.428+
1.713** 1.643*
HHC Insurance Case 2.752*** 4.342*** 3.402***
Physician Specialty: OBGYN 1.228 1.180 1.170
Judge (Ref = Unspecified Number of Other Judges)
Judge A 20.226*** 8.341***
Unspecified Number of Other Judgesa
Unspecifed Unspecified
Other Judges 0.676+
0.520*
Judicial Consistency 0.888 0.365*
Case Process Measures
Number of Court Appearances 1.003
Number of Court Motions 0.784***
Event Date to RJI Filing (Days) 1.000***
RJI Filing to Disposition 1.000b
Constant 1.245 0.656 2.981*
Nagelkerke R-Square 0.094 0.185 0.271
***p<.001 **p<.01 *p<.05 + p<.10
Table 4.6. Logistic Regression Predicting any Case Outcome with a Monetary Award in County B
bNote: An odds ratio close to 1.000 represents a increase in the odds of the outcome and would be evident if
expanded to include more decimal places.
aNote: In order to maintain the de-identification of judges the reference category, as well as the non-signficant
coefficents included in the model are grouped as unspecified.
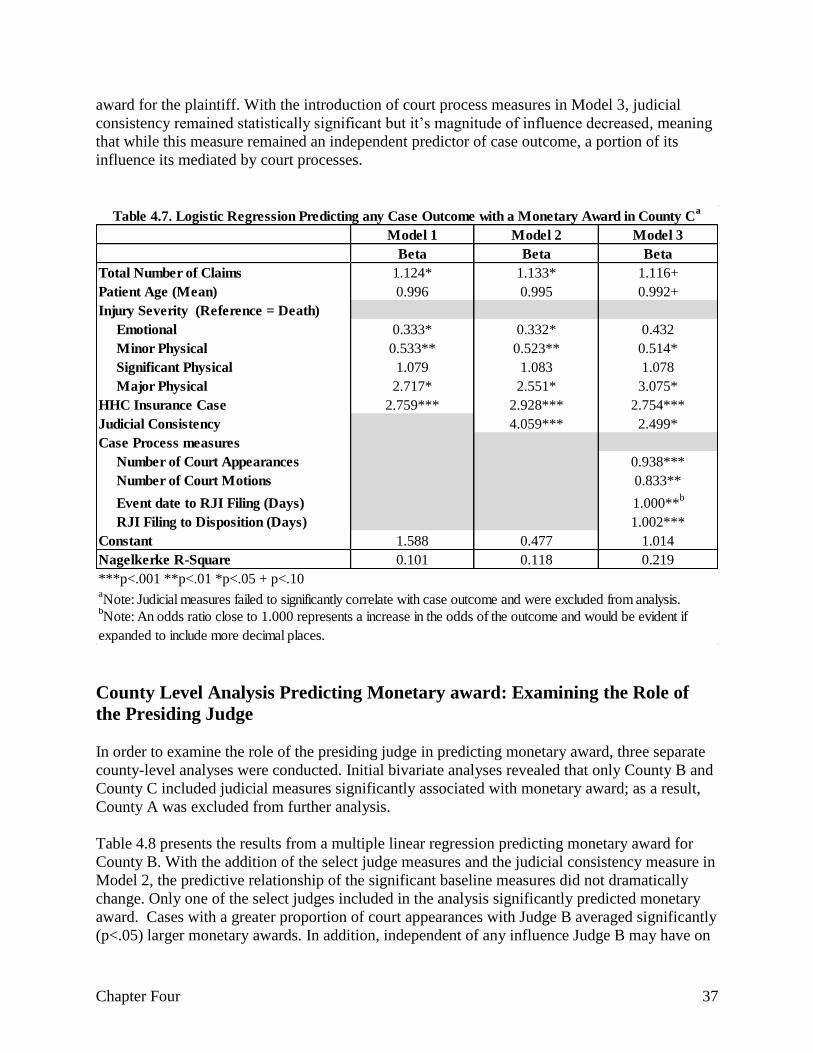
Chapter Four 37
award for the plaintiff. With the introduction of court process measures in Model 3, judicial
consistency remained statistically significant but it’s magnitude of influence decreased, meaning
that while this measure remained an independent predictor of case outcome, a portion of its
influence its mediated by court processes.
County Level Analysis Predicting Monetary award: Examining the Role of
the Presiding Judge
In order to examine the role of the presiding judge in predicting monetary award, three separate
county-level analyses were conducted. Initial bivariate analyses revealed that only County B and
County C included judicial measures significantly associated with monetary award; as a result,
County A was excluded from further analysis.
Table 4.8 presents the results from a multiple linear regression predicting monetary award for
County B. With the addition of the select judge measures and the judicial consistency measure in
Model 2, the predictive relationship of the significant baseline measures did not dramatically
change. Only one of the select judges included in the analysis significantly predicted monetary
award. Cases with a greater proportion of court appearances with Judge B averaged significantly
(p<.05) larger monetary awards. In addition, independent of any influence Judge B may have on
Model 1 Model 2 Model 3
Beta Beta Beta
Total Number of Claims 1.124* 1.133* 1.116+
Patient Age (Mean) 0.996 0.995 0.992+
Injury Severity (Reference = Death)
Emotional 0.333* 0.332* 0.432
Minor Physical 0.533** 0.523** 0.514*
Significant Physical 1.079 1.083 1.078
Major Physical 2.717* 2.551* 3.075*
HHC Insurance Case 2.759*** 2.928*** 2.754***
Judicial Consistency 4.059*** 2.499*
Case Process measures
Number of Court Appearances 0.938***
Number of Court Motions 0.833**
Event date to RJI Filing (Days) 1.000**b
RJI Filing to Disposition (Days) 1.002***
Constant 1.588 0.477 1.014
Nagelkerke R-Square 0.101 0.118 0.219
***p<.001 **p<.01 *p<.05 + p<.10aNote: Judicial measures failed to significantly correlate with case outcome and were excluded from analysis.
Table 4.7. Logistic Regression Predicting any Case Outcome with a Monetary Award in County Ca
bNote: An odds ratio close to 1.000 represents a increase in the odds of the outcome and would be evident if
expanded to include more decimal places.
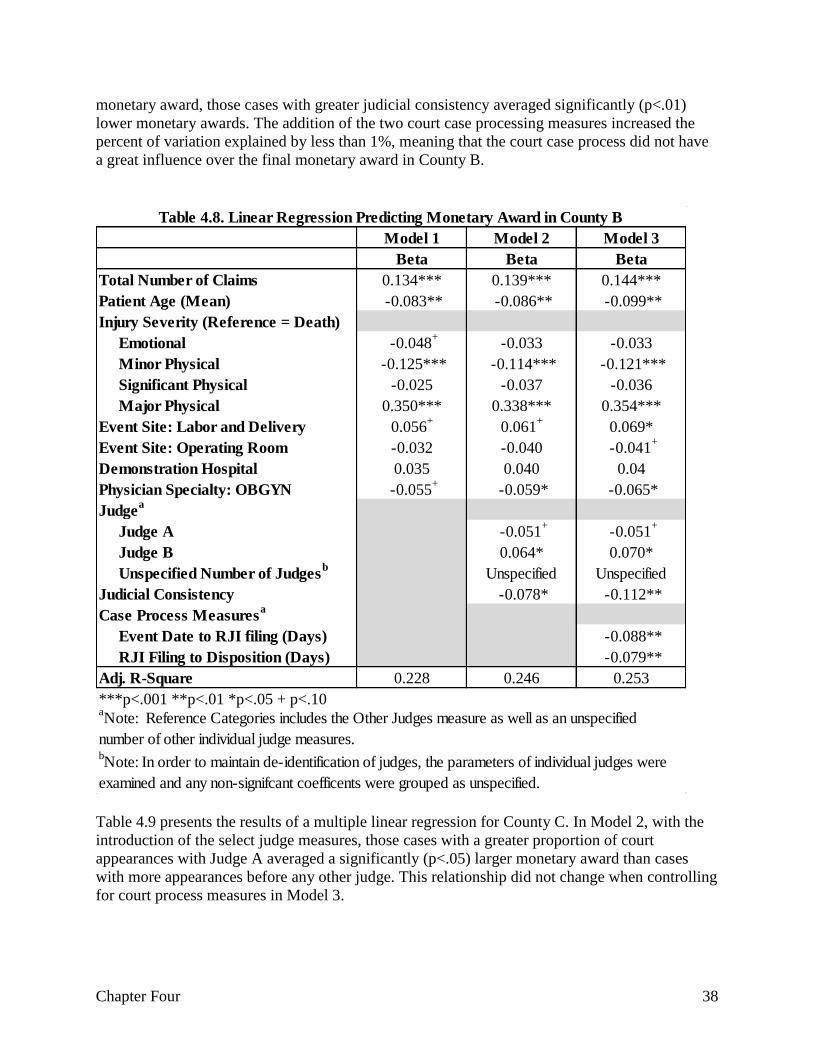
Chapter Four 38
monetary award, those cases with greater judicial consistency averaged significantly (p<.01)
lower monetary awards. The addition of the two court case processing measures increased the
percent of variation explained by less than 1%, meaning that the court case process did not have
a great influence over the final monetary award in County B.
Table 4.9 presents the results of a multiple linear regression for County C. In Model 2, with the
introduction of the select judge measures, those cases with a greater proportion of court
appearances with Judge A averaged a significantly (p<.05) larger monetary award than cases
with more appearances before any other judge. This relationship did not change when controlling
for court process measures in Model 3.
Model 1 Model 2 Model 3
Beta Beta Beta
Total Number of Claims 0.134*** 0.139*** 0.144***
Patient Age (Mean) -0.083** -0.086** -0.099**
Injury Severity (Reference = Death)
Emotional -0.048+
-0.033 -0.033
Minor Physical -0.125*** -0.114*** -0.121***
Significant Physical -0.025 -0.037 -0.036
Major Physical 0.350*** 0.338*** 0.354***
Event Site: Labor and Delivery 0.056+
0.061+
0.069*
Event Site: Operating Room -0.032 -0.040 -0.041+
Demonstration Hospital 0.035 0.040 0.04
Physician Specialty: OBGYN -0.055+
-0.059* -0.065*
Judgea
Judge A -0.051+
-0.051+
Judge B 0.064* 0.070*
Unspecified Number of Judgesb
Unspecified Unspecified
Judicial Consistency -0.078* -0.112**
Case Process Measuresa
Event Date to RJI filing (Days) -0.088**
RJI Filing to Disposition (Days) -0.079**
Adj. R-Square 0.228 0.246 0.253
***p<.001 **p<.01 *p<.05 + p<.10
Table 4.8. Linear Regression Predicting Monetary Award in County B
aNote: Reference Categories includes the Other Judges measure as well as an unspecified
number of other individual judge measures.bNote: In order to maintain de-identification of judges, the parameters of individual judges were
examined and any non-signifcant coefficents were grouped as unspecified.
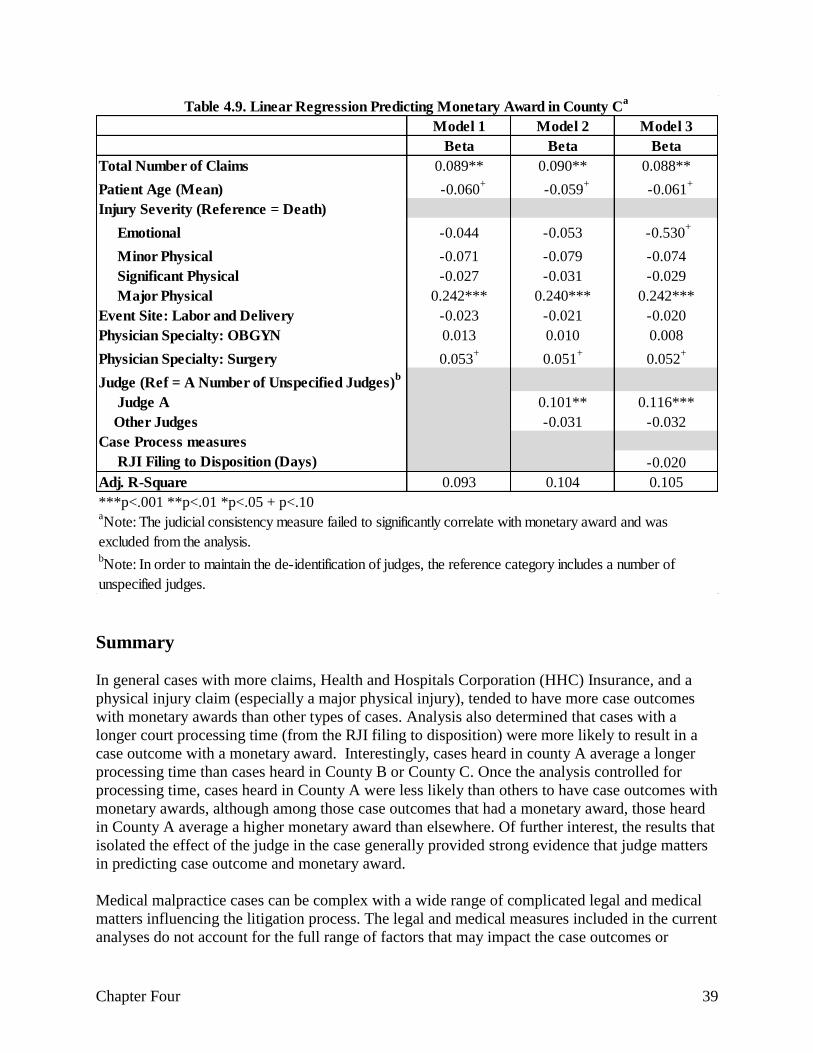
Chapter Four 39
Summary
In general cases with more claims, Health and Hospitals Corporation (HHC) Insurance, and a
physical injury claim (especially a major physical injury), tended to have more case outcomes
with monetary awards than other types of cases. Analysis also determined that cases with a
longer court processing time (from the RJI filing to disposition) were more likely to result in a
case outcome with a monetary award. Interestingly, cases heard in county A average a longer
processing time than cases heard in County B or County C. Once the analysis controlled for
processing time, cases heard in County A were less likely than others to have case outcomes with
monetary awards, although among those case outcomes that had a monetary award, those heard
in County A average a higher monetary award than elsewhere. Of further interest, the results that
isolated the effect of the judge in the case generally provided strong evidence that judge matters
in predicting case outcome and monetary award.
Medical malpractice cases can be complex with a wide range of complicated legal and medical
matters influencing the litigation process. The legal and medical measures included in the current
analyses do not account for the full range of factors that may impact the case outcomes or
Model 1 Model 2 Model 3
Beta Beta Beta
Total Number of Claims 0.089** 0.090** 0.088**
Patient Age (Mean) -0.060+
-0.059+
-0.061+
Injury Severity (Reference = Death)
Emotional -0.044 -0.053 -0.530+
Minor Physical -0.071 -0.079 -0.074
Significant Physical -0.027 -0.031 -0.029
Major Physical 0.242*** 0.240*** 0.242***
Event Site: Labor and Delivery -0.023 -0.021 -0.020
Physician Specialty: OBGYN 0.013 0.010 0.008
Physician Specialty: Surgery 0.053+
0.051+
0.052+
Judge (Ref = A Number of Unspecified Judges)b
Judge A 0.101** 0.116***
Other Judges -0.031 -0.032
Case Process measures
RJI Filing to Disposition (Days) -0.020
Adj. R-Square 0.093 0.104 0.105
***p<.001 **p<.01 *p<.05 + p<.10
Table 4.9. Linear Regression Predicting Monetary Award in County Ca
aNote: The judicial consistency measure failed to significantly correlate with monetary award and was
excluded from the analysis.bNote: In order to maintain the de-identification of judges, the reference category includes a number of
unspecified judges.
Chapter Four 40
monetary awards, no is it always discernible, absent in depth qualitative observations that were
unfeasible in this study, why some of the observed relationships were detected. Therefore, while
it is important to recognize the significant influence of the measures included in these analysis, it
is equally important to recognize the limitations in the resulting conclusions.
References 41
References
American Medical Association (2013). AMA Annual Report. Available online at: http://www.ama-
assn.org/resources/doc/about-ama/2012-annual-report.pdf.
Brennan, T.A., Leape, L.L., Laird, Heart, Locaio, A.R., Lawthers, A.G., Newhouse, JP, Weiler, PC, and
Hiatt. Incidence of Adverse Events and Negligence in Hospitalized patients: Results of the
Harvard Medical Practice Study. Qual Saf Health Czre, 2004: 13; 145-152.
Sowka, M. P. (ed). (1980). Malpractice Claims: Final Complication. Brookfield, WI: National
Association of Insurance Commissioners.
Studdert, D.M., Brennan, T.A., Thomas, E.J. (2000). Beyond Dead Reckoning: measures of Medical
Injury Buden, Malpractice Litigation, and Alternative Compensation Models from Utah and
Colorado. Indiana Law Review, 22: 1643-1686.
Studdert, D.M. and Mello, M.M. (2007). When Tort Resolutions Are “Wrong”: Predictors of Discordant
Outcomes in Medical Malpractice Litigation. Journal of Legal Studies, xxx.
Studdert, D.M., Mello, M.M., Gawande, A.A., Gandhi, T.K., Kachalia, A., Yoon, C., and Puopolo, A.L.,
Brennan, T.A. (2006). Claims, Errors, and Compensation Payments in Medical Malpractice
Litgation. The New England Journal of Medicine, 354: 2024-2033.
Weiler D.C., Hiatt, H.H., Newhouse, J.P., Johnson, W.G., Brennan, T., Leape L.L. A Measure of
Malpractice: Medical Injury, Malpractice Litigation and Patient Compensation. Cambridge Mass.
Harvard University Press. 1993.
Appendix A 42
Appendix A. Data Cleaning Description
Data cleaning began with the initial MMCDS data, which included 15,626 claims, against both
physicians and facilities, opened and closed between January 1, 2002 and December 31, 2010
from three New York City Counties: County A, County B, and County C.24 Since a single
plaintiff can file multiple claims,25 the MMDCS database contained rows of claim information
pertaining to a single case (i.e., a single plaintiff). A claim, as defined by prior research, includes
“a written demand for compensation for a medical injury” (Studdert et al., 2006; Studdert e t al.,
2000; Wieler et al, 1993). The current research diverges from prior investigations by extracting
selected claims level data and simplifying and condensing this data as to facilitate examination at
the case level. This provides us with an opportunity to encompass more characteristics of
medical malpractice litigation in a way that hopefully provides a fuller picture of how cases are
processed and what factors influence outcome measures. In order to merge MMDCS data with
the CCIS data, which is maintained at the case-level, relevant MMDCS data was vectored, after
which the data was aggregated. This aggregation created a new database which included 8,276
cases,26 and within each case plaintiffs had data associated with possibly 1 to 23 claims (average
claim per case was 1.9) (see table below).
The next step entailed merging the MMDCS and CCIS datasets and included a multistep process
due to the differential structure of the respective datasets. For example, the CCIS data was
received as numerous data files separated by county and the data characteristics of these data
files varied greatly from one county to the next. 27 As a result, as the data cleaning process
progressed, the CCIS data was maintained in three independent databases representing each of
the three counties. In comparison, the MMDCS data was maintained and received as a single,
unified dataset.
The first step in the eventual merging of the MMDCS and CCIS databases required separating of
the MMDCS database into three mutually exclusive datasets based on Event County (i.e., County
A, County B, and County C). Based on county identifier, each MMDCS dataset was then
merged with its respective CCIS dataset utilizing plaintiff’s last and first name. Of the 1,707
County A MMDCS cases, 25% (740) successfully merged with the CCIS database (this
represents 28% of CCIS cases with an RJI file date on or after January 1, 2002 and a disposition
date on or prior to December 31, 2010). Of the 2,827 County B MMDCS cases, 26% (1,379)
successfully merged with the CCIS database (this represents 31% of CCIS cases with an RJI file
data on or after January 1, 2002 and a disposition date on or prior to December 31, 2010). Of the
3,741 County C MMDCS cases, 31% (1,161) successfully merged with the CCIS database (this
represents 30% of CCIS cases with an RJI file date on or after January 1, 2010 and a disposition
date on or prior to December 31, 2010).
24 MMDDCS measure “Event County” utilized to identify three counties. 25 Plaintiff could be patient or family member. 26 A small number of cases involving separate claims representing mother and newborn were removed from analysis
prior to aggregating data. 27 In string format.
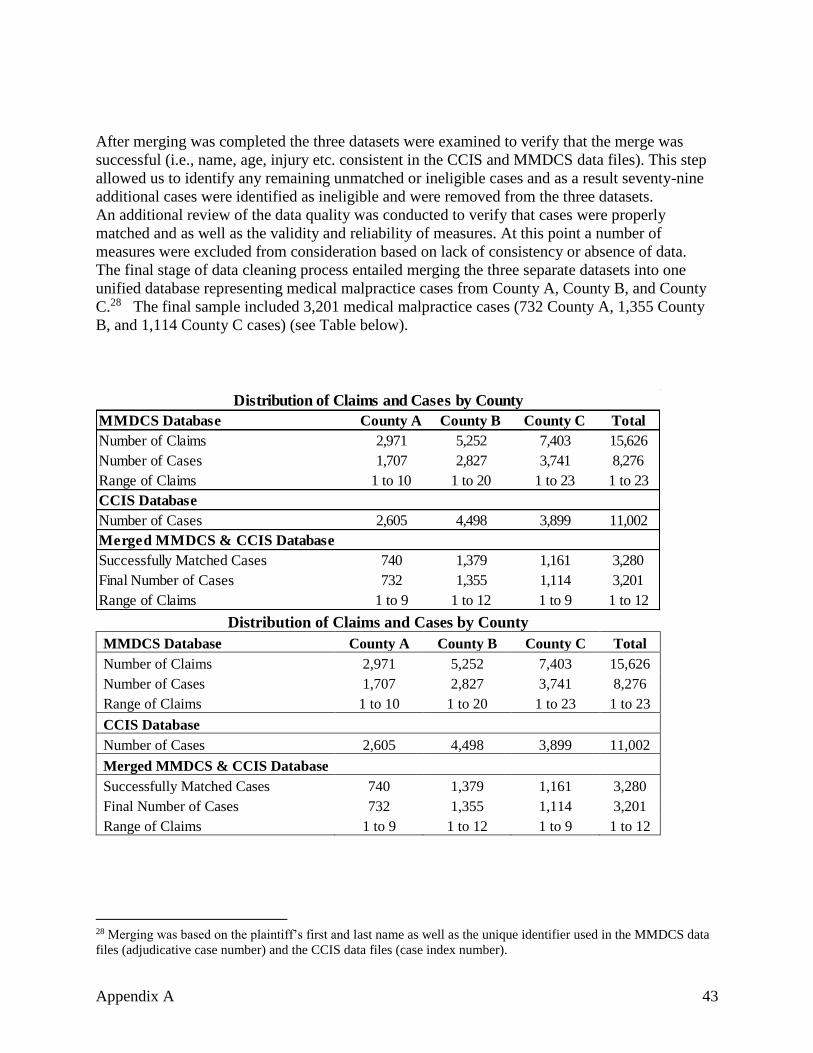
Appendix A 43
After merging was completed the three datasets were examined to verify that the merge was
successful (i.e., name, age, injury etc. consistent in the CCIS and MMDCS data files). This step
allowed us to identify any remaining unmatched or ineligible cases and as a result seventy-nine
additional cases were identified as ineligible and were removed from the three datasets.
An additional review of the data quality was conducted to verify that cases were properly
matched and as well as the validity and reliability of measures. At this point a number of
measures were excluded from consideration based on lack of consistency or absence of data.
The final stage of data cleaning process entailed merging the three separate datasets into one
unified database representing medical malpractice cases from County A, County B, and County
C.28 The final sample included 3,201 medical malpractice cases (732 County A, 1,355 County
B, and 1,114 County C cases) (see Table below).
Distribution of Claims and Cases by County
MMDCS Database County A County B County C Total
Number of Claims 2,971 5,252 7,403 15,626
Number of Cases 1,707 2,827 3,741 8,276
Range of Claims 1 to 10 1 to 20 1 to 23 1 to 23
CCIS Database
Number of Cases 2,605 4,498 3,899 11,002
Merged MMDCS & CCIS Database
Successfully Matched Cases 740 1,379 1,161 3,280
Final Number of Cases 732 1,355 1,114 3,201
Range of Claims 1 to 9 1 to 12 1 to 9 1 to 12
28 Merging was based on the plaintiff’s first and last name as well as the unique identifier used in the MMDCS data
files (adjudicative case number) and the CCIS data files (case index number).
MMDCS Database County A County B County C Total
Number of Claims 2,971 5,252 7,403 15,626
Number of Cases 1,707 2,827 3,741 8,276
Range of Claims 1 to 10 1 to 20 1 to 23 1 to 23
CCIS Database
Number of Cases 2,605 4,498 3,899 11,002
Successfully Matched Cases 740 1,379 1,161 3,280
Final Number of Cases 732 1,355 1,114 3,201
Range of Claims 1 to 9 1 to 12 1 to 9 1 to 12
Distribution of Claims and Cases by County
Merged MMDCS & CCIS Database

Appendix B 44
Appendix B
Total
Number of cases 3,201
Case Outcomes
Decision/Judgment for Plaintiff 0%a (14)
Settlement 67% (2,129)
Decision/Judgment for Defendant 6% (192)
Involuntary Dismissals 14% (438)
Voluntary Dismissals 12% (396)
Dropped or Abandoned 1% (19)
Other 0%a (13)
Total 100%
Distribution of Recoded Case Outcome Measure
aNote: Less than one-half of one percent.
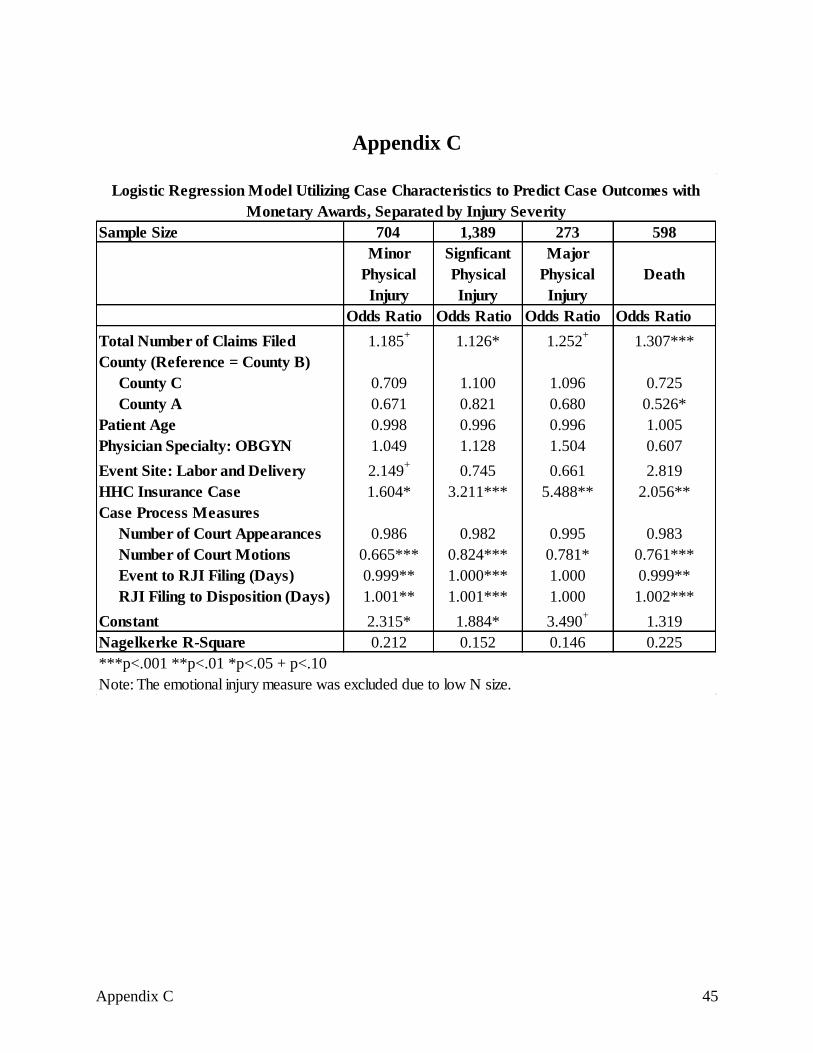
Appendix C 45
Appendix C
Sample Size 704 1,389 273 598
Minor
Physical
Injury
Signficant
Physical
Injury
Major
Physical
Injury
Death
Odds Ratio Odds Ratio Odds Ratio Odds Ratio
Total Number of Claims Filed 1.185+
1.126* 1.252+
1.307***
County (Reference = County B)
County C 0.709 1.100 1.096 0.725
County A 0.671 0.821 0.680 0.526*
Patient Age 0.998 0.996 0.996 1.005
Physician Specialty: OBGYN 1.049 1.128 1.504 0.607
Event Site: Labor and Delivery 2.149+
0.745 0.661 2.819
HHC Insurance Case 1.604* 3.211*** 5.488** 2.056**
Case Process Measures
Number of Court Appearances 0.986 0.982 0.995 0.983
Number of Court Motions 0.665*** 0.824*** 0.781* 0.761***
Event to RJI Filing (Days) 0.999** 1.000*** 1.000 0.999**
RJI Filing to Disposition (Days) 1.001** 1.001*** 1.000 1.002***
Constant 2.315* 1.884* 3.490+
1.319
Nagelkerke R-Square 0.212 0.152 0.146 0.225
***p<.001 **p<.01 *p<.05 + p<.10
Note: The emotional injury measure was excluded due to low N size.
Logistic Regression Model Utilizing Case Characteristics to Predict Case Outcomes with
Monetary Awards, Separated by Injury Severity
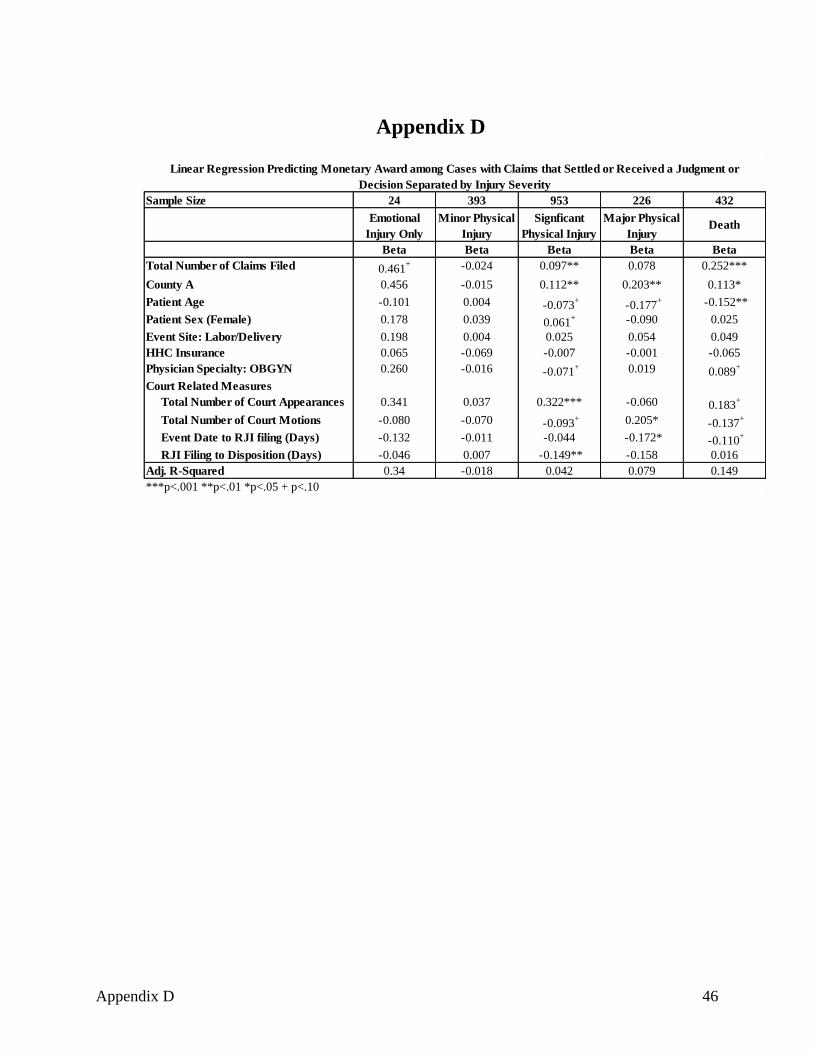
Appendix D 46
Appendix D
Sample Size 24 393 953 226 432
Emotional
Injury Only
Minor Physical
Injury
Signficant
Physical Injury
Major Physical
Injury Death
Beta Beta Beta Beta Beta
Total Number of Claims Filed 0.461+ -0.024 0.097** 0.078 0.252***
County A 0.456 -0.015 0.112** 0.203** 0.113*
Patient Age -0.101 0.004 -0.073+
-0.177+ -0.152**
Patient Sex (Female) 0.178 0.039 0.061+ -0.090 0.025
Event Site: Labor/Delivery 0.198 0.004 0.025 0.054 0.049
HHC Insurance 0.065 -0.069 -0.007 -0.001 -0.065
Physician Specialty: OBGYN 0.260 -0.016 -0.071+ 0.019 0.089
+
Court Related Measures
Total Number of Court Appearances 0.341 0.037 0.322*** -0.060 0.183+
Total Number of Court Motions -0.080 -0.070 -0.093+ 0.205* -0.137
+
Event Date to RJI filing (Days) -0.132 -0.011 -0.044 -0.172* -0.110+
RJI Filing to Disposition (Days) -0.046 0.007 -0.149** -0.158 0.016
Adj. R-Squared 0.34 -0.018 0.042 0.079 0.149
***p<.001 **p<.01 *p<.05 + p<.10
Linear Regression Predicting Monetary Award among Cases with Claims that Settled or Received a Judgment or
Decision Separated by Injury Severity


![BRIEFING BOOKmedia.avvosites.com/upload/214/2013/12/Briefing...• “[T]here are far more cases of medical malpractice than medical malpractice litigation. Professor Danzon reported](https://img.pdfslide.us/doc/110x75/5f44bc5613ee51240d3e370c/briefing-a-aoethere-are-far-more-cases-of-medical-malpractice-than-medical.jpg)


![ReviewArticle - Hindawi Publishing Corporationdownloads.hindawi.com/journals/dte/2011/967017.pdfthis is a common reason for medical malpractice litigation [7, 8]. Large compensation](https://img.pdfslide.us/doc/110x75/5ab1eab87f8b9abc2f8d51c3/reviewarticle-hindawi-publishing-is-a-common-reason-for-medical-malpractice-litigation.jpg)