Embed Size (px)
Citation preview

A
Research Proposal
For
Management Research Project - I
on
“ELECTRONICS GOODS INDUSTRY”
Submitted By:
Name Roll no.
Patel Hiren 12044311088
Patel Jayesh 12044311093
Patel Jagdish 12044311089
Patel Ashish 12044311070
Patel Ravi 12044311113
Prajapati Paresh 12044311129
M.B.A. Semester III
Under the Guidance of:
Prof. (Dr.) Mahendra Sharma Prof. & Head
V. M. Patel Institute of Management
&
Ms. Harsha Jariwala & Prof. Abhishek Parikh
Faculty Members
V. M. Patel Institute of Management
Submitted To:
V. M. Patel Institute of Management
Ganpat University, Ganpat Vidyanagar
November - 2013

II
CERTIFICATE BY THE GUIDE
This is to certify that the contents of this report entitled “A STUDY ON ELECTRONIC GOOD
INDUSTRY” by Patel Hiren (12044311088), Patel Jayesh (12044311093), Patel Jagdish
(12044311089), Patel Ashish (12044311070), Patel Ravi (12044311113), Prajapati Paresh
(12044311129) submitted to V. M. Patel Institute of Management for the Award of Master of
Business Administration (MBA Semester -III) is original research work carried out by
him/her/them under my supervision.
This report has not been submitted either partly or fully to any other University or Institute for
award of any degree or diploma.
Prof. (Dr.) Mahendra Sharma,
Professor & Head,
V. M. Patel Institute of Management,
Ganpat University.
Kherva.
Date : 4/12/13
Place : Kherva
III
CANDIDATE’S STATEMENT
I/We hereby declare that the work incorporated in this report entitled “A STUDY ON
ELECTRONIC GOOD INDUSTRY” in partial fulfillment of the requirements for the award of
Master of Business Administration (Semester - III) is the outcome of original study undertaken
by me/us and it has not been submitted earlier to any other University or Institution for the award
of any Degree or Diploma.
(Name & Sign. of Student)
Patel Hiren
Patel Jayesh
Patel Jagdish
Patel Ashish
Patel Ravi
Prajapati Paresh
Date : 4/12/13
Place : Kherva

IV
PREFACE
One can deny for the importance of the practical exposure of the problem for its better understanding
and better grip of coming out with an industrially acceptable solution.
Being the Management student and performing small practical even is in itself an experience of
responsibility on our head. The project is certainly the best chance to work in the Management field
and have practical understanding of Management Strategic Planning and his implementation. This
exposure has really added a supplement and nourishment to our growing tree of management
knowledge- just like the fertilizer does to the plants.
In view of above, this report has been completed as a part of syllabus prescribed for the master of
business administration. This had been made in order to know electronic good industry overview and
its strategic tools and its planning. This will help us to understand How Made Strategic Tools for
particular industry, which factor affected to electronic good industry. This will help to understand
financial overview of electronic good industry. We also know the Political, Economical, Social,
Technology factor which affected to the electronic good Industry.

V
ACKNOWLEDGEMENT
It is indeed of great moment to pleasure to express our sense of per found gratitude and ineptness to
all the people who have been instrumental in making our learning a rich experience. We got the
opportunity to do a challenging project in Management Research Project. The project is the
important part of our study and gives us a practical exposure to Strategic Tools its implementation
and it is almost impossible to do the same without the guidance of people in and around us.
It gives me immense pleasure to acknowledge Strategic Tools which has been nice enough to give our
chance to do our Report and providing us support throughout our Report period and afterward.
We hereby take the pleasure of thanking all who have contributed to the making of this report. Firstly
we would like to thank DR. Mahindar Sharma, Ms. Harsha Jariwala, prof Abhishek Pareikh,
Who has provided us full liberty, co –operation during our Report and sharing knowledge of her field
with us always with a smile.

INDEX
SR NO. PARTICULAR PAGE NO.
I Certificate By the Guide II
II Candidate’s Statement III
III Preface IV
IV Acknowledgement V
V Executive summary VI
CHAPTER 1 : INTRODUCTION 1
1.1 History 2
1.2 Current Scenario 4
1.3 Electronic Manufacturing Services 6
1.4 The Growth Drivers 8
CHAPTER 2 : MAJOR PLAYERS 13
2.1 Sony 14
2.2 Apply 16
2.3 Toshiba 18
2.4 Nokia 20
2.5 Samsung 21
2.6 Godrej 23
2.7 LG 25
2.8 Videocon 27
2.9 Micromax 28
2.10 Panasonic 30
CHAPTER 3 : MACRO ANALYSIS 32
3.1 Key Economic Feature 33
3.2 Porter's Five Force Model 35
3.3 Pest Analysis 46
3.4 Strategic Groups Mapping 57
3.5 Driving Forces 61
CHAPTER 4: FINANCIAL ANALYSIS 63
4.1 Ratio Analysis 64
4.2 Trend Analysis 79

CHAPTER 5 : BUSINESS PLAN 83
5.1 DEALERSHIP OUTLINE 84
5.2 ORGANIZATION CHART OF ABAJ ELECTRONIC 87
5.3 SALES OUTLINE 89
5.4 FINANCIAL ASPECT 91
Chapter 6: CONCLUSION 97
APPENDICES 101

LIST OF TABLES
2.1 Current production range of SONY 15
2.2 Current production range of APPLE 17
2.3 Current production range of TOSHIBA 19
2.4 Current production range of NOKIA 20
2.5 Current production range of SAMSUNG 22
2.6 Current production range of Godrej 24
2.7 Current production range of LG 26
2.8 Current production range of Videocon 27
2.9 Current production range of Micromax 29
2.10 Current production range of Panasonic 31
3.1 Overall Assessment 44
3.2 Numbers of product and Market share 59
4.1 Current Ratio 67
4.2 Liquid or Quick Ratio 69
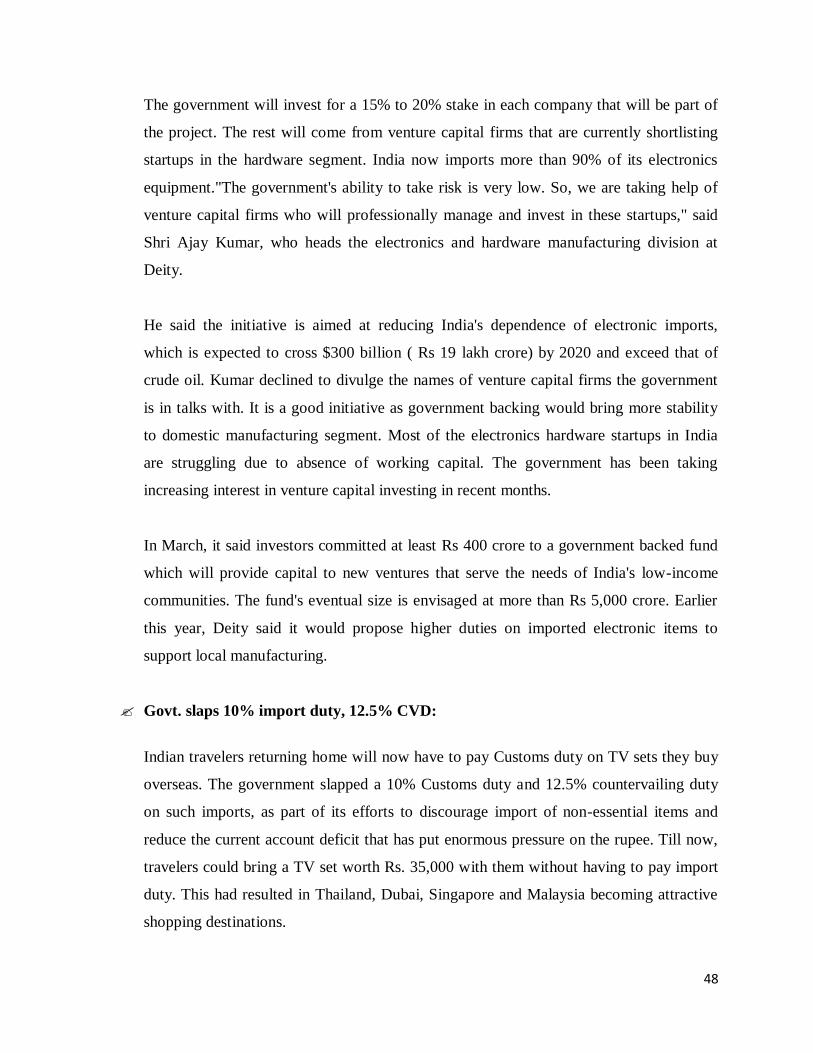
4.3 Debt-Equity Ratio 71
4.4 Debtors Turnover Ratio 73
4.5 Net Profit Ratio 75
4.6 Average Collection Period Ratio 77
4.7 Net Sales 79
4.8 Share Capital 80
4.9 Total Liability 81
4.10 Total Income 82

LIST OF CHART
1.1 Annual Growth Rates 9
1.2 Long Term Cycles 10
1.3 Total Electronic Market 11
1.4 Total Electronic Production 12
3.1 Porters five force model 36
3.2 Household income and urbanization 52
3.3 Trends in Urbanization 54
3.4 Strategic Group Mapping 59
4.1 Current Ratio 67
4.2 Liquid or Quick Ratio 70
4.3 Debt-Equity Ratio 72
4.4 Debtors Turnover Ratio 74
4.5 Net Profit Ratio 76
4.6 Average Collection Period Ratio 77
4.7 Net Sales 79
4.8 Share Capital 80
4.9 Total Liability 81
4.10 Total Income 82
5.1 Organization chart 87

1
CHAPTER - 1
INTRODUCTION

2
1.1 HISTORY
The electronics industry, especially meaning consumer electronics emerged in the 20th
century and has now become a global industry worth billions of dollars. Contemporary
society uses all manner of electronic devices built in automated or semi-automated factories
operated by the industry. The size of the industry and the use of toxic materials, as well as the
difficulty of recycling has led to a series of problems with electronic waste. International
regulation and environmental legislation has been developed in an attempt to address the
issues.
The generation of electricity began in the 19th century and this led to the development of all
manner of inventions. Gramaphones were an early invention and this was followed by radio
transmitters and receivers and televisions. The first digital computers were built in the 1940s
with a slow development in technology and total sales. In the 1990s the personal computer
became popular. A large part of the electronics industry is now involved with digital
technology. The industry now employs large numbers of electronics engineers and
electronics technicians to design, develop, test, manufacture, install, and repair electrical and
electronic equipment such as communication equipment, medical monitoring devices,
navigational equipment, and computers.
After World War II, Japanese business began to rapidly develop consumer electronics
products using keiretsu methods. By the 1980s, a relatively small number of industries
dominated Japan's international trade and investment interaction with the rest of the world.
Sony was founded in 1946 by Masaru Ibuka and Akio Morita and rapidly advanced in the
electronics field. The invention of the pocket transistor radio placed the company at the
forefront of electronics development, both in Japan and worldwide. As other companies were
formed to compete in this area, the consumer electronics industry became major exporters
that invested overseas in the 1980s. In 1991, 46.7 percent of color televisions and 87.3
percent of video cassette recorders produced in Japan were exported. The export shares of
some products were too small to show separately in summary trade data, however audio tape

3
recorders represented 2.9% of total Japanese exports in 1988, video cassette recorders 2.3
percent, radio receivers 0.8 percent, and television receivers 0.7 percent, totaling 6.7 percent.
The Electronics Industry in India took off around 1965 with an orientation towards space and
defence technologies. This was rigidly controlled and initiated by the government. This was
followed by developments in consumer electronics mainly with transistor radios, Black &
White TV, Calculators and other audio products. Colour Televisions soon followed. In 1982-
a significant year in the history of television in India - the government allowed thousands
colour TV sets to be imported into the country to coincide with the broadcast of Asian Games
in New Delhi. 1985 saw the advent of Computers and Telephone exchanges, which were
succeeded by Digital Exchanges in 1988. The period between 1984 and 1990 was the golden
period for electronics during which the industry witnessed continuous and rapid growth.
Since the beginning of the 21st century a number of the largest Japanese electronics
companies have struggled financially and lost market share, particulary to South Korean and
Taiwanese companies. Japanese companies have lost their dominant position in categories
including portable media players, TVs, computers and semiconductors. Hit hard by the
economic crisis of 2008 Sony, Hitachi, Panasonic, Fujitsu, Sharp, NEC and Toshiba reported
losses amounting to $17 billion. By 2009, Samsung Electronics operating profit was more
than two times larger than the combined operating profit of nine of Japan‘s largest consumer
electronic companies. The relative decline has been ascribed to factors including high costs,
the value of the yen and too many Japanese companies producing the same class of products,
causing duplication in research and development efforts and reducing economies of scale and
pricing power. Japan's education system has also been highlighted as a possible contributing
factor.

4
1.2 Current Scenario
In recent years the electronic industry is growing at a brisk pace. The demand in the Indian
market is expected to touch $ 400 billion by 2020. The largest segment is the consumer
electronic segment. While is largest export segment is of components. Under the Modified
Special Incentive Package Scheme (M-SIPS), the government will provide up to Rs. 100 billion
in benefits to the industry during the 12th
Five Year Plan (2012-17). India‘s production
constitutes only about 1.3% of the global electronic hardware production of $1.7 trillion. Hence
it is miniscule by international comparison. However the demand in the Indian market is growing
rapidly and investments are flowing in to augment manufacturing capacity.
The consumer electronics and durables industry is currently poised at about Rs 340 billion. India
is also an exporter of a vast range of electronic components and products for the following
segments.
• Display technologies
• Entertainment electronics
• Optical Storage devices
• Passive components
• Electromechanical components
• Telecom equipment
• Transmission & Signaling equipment
• Semiconductor designing
• Electronic Manufacturing Services (EMS)
This growth has attracted global players to India and leaders like Solectron, Flextronics, Jabil,
Nokia and many more have made large investments to access the Indian market. In consumer
electronics Korean companies such as LG and Samsung have made commitments by establishing
large manufacturing facilities and now enjoy a significant share in the growing market for
products such as Televisions, CD/DVD Players, Audio equipment and other entertainment
products.

5
The growth in telecom products demand has been breathtaking and India is adding 2 million
mobile phone users every month! With telecom penetration of around 10 per cent, this growth is
expected to continue at least over the next decade. Penetration levels in other high growth
products are equally high and growth in demand for Computer/ IT products, auto electronics,
medical, industrial, as well as consumer electronics is equally brisk. Combined with low
penetration levels and the Indian economy growing at an impressive 7 per cent per annum, the
projection of a US$150 Billion+ market is quite realistic and offers an excellent opportunity to
electronics players worldwide.

6
1.3 Electronic Manufacturing Services
India is well-known for its software prowess. But on the hardware front, the progress is rather
slow. However, the country has been making gains in this sector also. Already, 50 Electronics
Manufacturing Services (EMS)/Original Design Manufacturers (ODMs) providers are operating
in India, ranging from global players including Flextronics and Solectron to indigenous firms
including Deltron, TVS Electronics and Sahasra. Further moves by international players are
expected to add production in India in the coming years.
Obvious allure of locating electronics production in India is the nation‘s low labor costs. Labor
costs for conducting electronics manufacturing in India are between 30 to 40 per cent less than in
the United States or in Western Europe. Other equally important benefits from operating in India
include a fast-growing domestic market, an excellent education system, the nation‘s technology
parks and the recent improvements in the country‘s transit and utility infrastructure.
However, the Indian contract-manufacturing industry is not expected to pose a significant threat
to China‘s position as the epicenter of electronics manufacturing in the short term. India‘s
contract manufacturing activities primarily serve the nation‘s indigenous demand.
The consumer durables and electronics market in rural and semi-urban areas account for about
40% of the overall market and is growing at about 30% CAGR.
OEMs primarily outsource manufacturing to cater to the Indian domestic market, although
export of Indian-assembled electronic goods does occur. In the longer term, i.e. 2009 onward, it
is predicted that India may compete with the Chinese providers in select products as the nation‘s
share of the global electronics market increases.
For OEMs, using contract manufacturing services in India can help them penetrate the local
market. However, OEMs face specific risks associated with using contract manufacturers in
India. Fluid exchange rates combined with volatile oil and component prices lead to
unpredictable costs. Changing government policies along with shifting government regimes also

7
contribute to an unpredictable political environment. Doing business in India is often disjointed,
with an inefficient bureaucratic system that causes frequent delays. However, for OEMs able to
manage these risks, the opportunity in India is significant.
The semiconductor fabrication segment has a small existing base in India with only two
fabrication units, which both are developing chips for the defense and strategic sectors. However,
semiconductor suppliers are expanding their manufacturing activities in India to serve the
growing contract-manufacturing industry in the nation.
Recent trends show that an increasing number of engineering and design activities are also being
out sorced to EMS companies and they are becoming ODMs (Original Design manufacturers)
and also provide final system integration and logistical support.
The recent acceleration in EMS activity is mainly due to rapid growth in the electronic Hardware
market in all segments particularly rapid growth has taken place in Telecom Infrastructure
Equipment, computers, Consumer & Hand held devices.

8
1.4 The Growth Drivers
Behind the impressive growth of the electronics industry is the robust and consistent growth in
Electronic Hardware market of approximately 25 per cent due to a stable economy & large
middle class of 350 million people. The fastest growing segments are demand for telecom
services particularly cell phones, internet subscribers & growth in demand for it products with
increasing penetration of computers, falling prices & Government support to rapidly encourage
usage of IT in all sectors. Penetration of telephone users (both landline & mobile) is projected to
increase exponentially. Some of the other factor are
Highly talented workforce, especially for design and engineering services with good
communication skills.
Rising labor costs in China.
Presence of global Electronics Manufacturing Services (EMS) majors in India and their
plans for increased investments in India.
More outsourcing of manufacturing by both Indian and global Original Equipment
Manufacturers

9
1.5 Annual Growth Rates:
Chart 1.1 Annual Growth Rates
Source: DECISION

10
1.6 Long term cycles, 1970-2013
Chart 1.2 Long Term Cycles
Source: DECISION
11
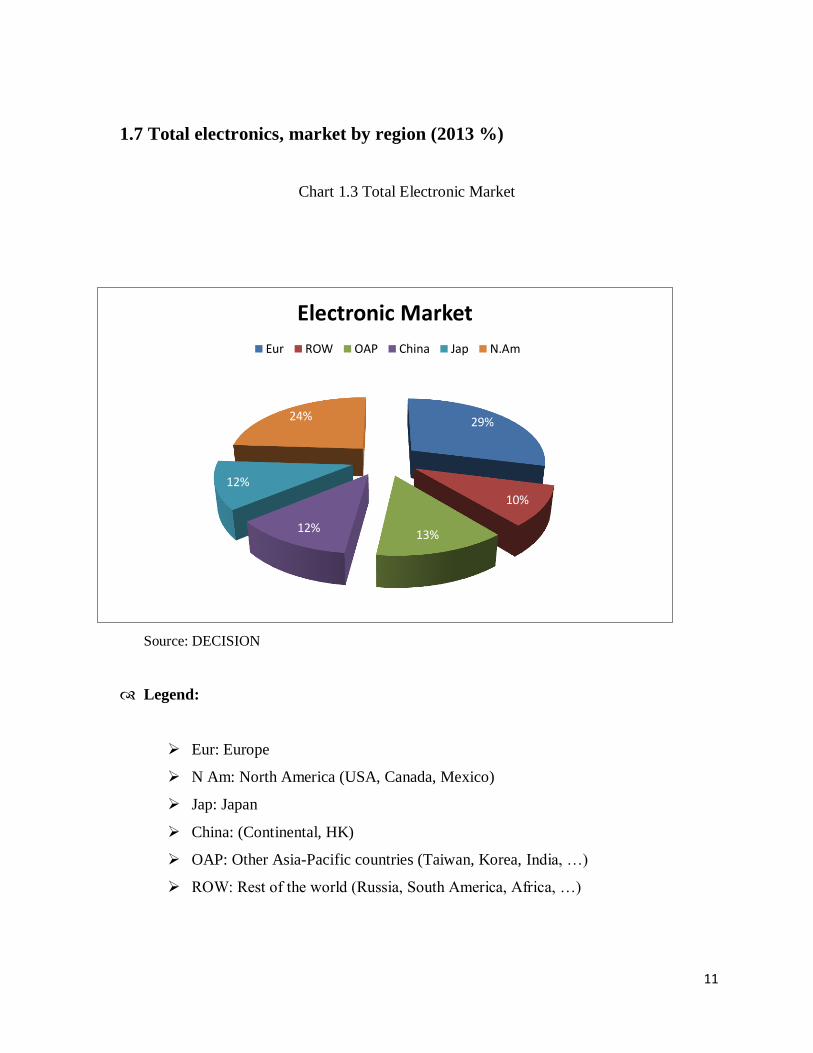
1.7 Total electronics, market by region (2013 %)
Chart 1.3 Total Electronic Market
Source: DECISION
Legend:
Eur: Europe
N Am: North America (USA, Canada, Mexico)
Jap: Japan
China: (Continental, HK)
OAP: Other Asia-Pacific countries (Taiwan, Korea, India, …)
ROW: Rest of the world (Russia, South America, Africa, …)
29%
10%
13% 12%
12%
24%
Electronic Market
Eur ROW OAP China Jap N.Am

12
1.8 Total electronics, production by region (2013 %)
Chart 1.4 Total Electronic Production
Source: DECISION
Legend:
Eur: Europe
N Am: North America (USA, Canada, Mexico)
Jap: Japan
China: (Continental, HK)
OAP: Other Asia-Pacific countries (Taiwan, Korea, India, …)
ROW: Rest of the world (Russia, South America, Africa, …)
19%
3%
19%
32%
13%
14%
Electronics Production
Eur ROW OAP China Jap N.Am

13
CHAPTER - 2
MAJOR PLAYERS

14
2.1 SONY
Akio Morita was a Japanese businessman and co- founder of Sony Corporation along with
Masaru Ibuka, Morita. On May 7, 1946, Morita and Ibuka founded the forerunner to Sony
Corporation, Tokyo Tsushin Kogyo Kabushiki Kaisha (Tokyo Telecommunications Engineering
Corporation). It had about 20 employees. Moritas family invested in Sony during the early period
and became its largest shareholder. He was the oldest of four siblings and his father Kyuzaemon
trained him as a child to take over the family. He later joined the navy and served as a lieutenant
during World War II. Sony is ranked 87th on the 2012 list of Fortune Global 500. Sony
Corporation is the electronics business unit and the parent company of the Sony Group, which is
engaged in business through its four operating segments – Electronics (including video games,
network services and medical business), Motion pictures, Music and Financial Services.
TYPE Public
FOUNDED 7 May 1946
HEADQUART
ERS
Minato, Tokyo, Japan
KEY PEOPLE Osamu Nagayama
(Chairman of the Board)
Kazuo Hirai
(President & CEO)
NET INCOME US$ 458 million
EMPLOYEES 146,300
WEBSITE Sony.net

15
Current Product Range
Table 2.1 Current production range of SONY
Television Home Video Home Audio
Home Theater System Computer & Peripherals Compact Digital Camera
Interchangeable Lens Camera Video Camera Tablet
Personal Audio Play Station Smart phones
Accessories Storage Media & Batteries

16
2.2 APPLE
Steve Jobs was born in San Francisco, California to Joanne Simpson and a Syrian father. In
1972, Jobs graduated from Homestead High School in Cupertino, California and enrolled in
Reed College in Portland, Oregon. One semester later, he had dropped out, later taking up the
study of philosophy and foreign cultures. He was co-founder, chairman, and chief executive
officer of Apple Inc. Jobs also co-founded and served as chief executive of Pixar Animation
Studios he became a member of the board of directors of The Walt Disney Company in 2006,
following the acquisition of Pixar by Disney. On medical leave for most of 2011, Jobs resigned
as Apple CEO in August that year and was elected Chairman of the Board. He died of respiratory
arrest related to his metastatic tumor on October 5, 2011. He continues to receive honors and
public recognition for his influence in the technology and music industries.
TYPE Public
FOUNDED April 1, 1976
HEADQUART
ERS
Apple Campus, 1 Infinite Loop,Cupertino,
California, U.S.
KEY PEOPLE Arthur D. Levinson (Chairman)
Tim Cook (CEO),
Steve Jobs (Founder, former CEO)
NET INCOME US$ 37.037 billion
EMPLOYEES >80,000
WEBSITE Apple.com

17
Current Product Range
Table 2.2 Current production range of APPLE
iPad iPhone Mac
Apple TV iTunes iCloud

18
2.3 TOSHIBA
Tanaka Hisashige was a Japanese engineer and inventor during the late Edo and Meiji period
Japan. He is one of the founders of what later became Toshiba Corporation. He has been called
the Thomas Edisonof Japan‖. Tanaka was born in Kurume, Chikugo province (present day
Fukuoka prefecture) as the eldest son of a tortoise shell craftsman. A gifted artisan, at the age of
14, he had already invented a loom. At 20 he made made karakuri dolls, with hydraulic
mechanism. capable of relatively complex movements, which were then much in demand by the
aristocrats of Kyoto, daimyō in various feudal domains, and by the Shōgun‘s court in Edo. At
age 21, he was performing around the country at festivals with clockwork dolls he constructed
himself.
TYPE Public
FOUNDED 1875
HEADQUARTERS Shibaura, Minato, Tokyo,Japan
KEY PEOPLE Atsutoshi Nishida
NET INCOME ¥73.70 billion
EMPLOYEES 209,784
WEBSITE Toshiba Worldwide

19
Current Product Range
Table 2.3 Current production range of TOSHIBA
Television Computer & Peripherals Washing Machines
Refrigerators

20
2.4 NOKIA
Knut Fredrik Idestam (October 28,1838– April 8, 1916) was a Finnish mining engineer and
businessman, best known as a founder of Nokia. In May 1865, Idestam obtained a permit to
construct a groundwood paper millat Tampere,Finland. The mill began operations in 1866. In
1871, Idestam and Leo Mechelin founded Nokia Ltd. and moved the companys operations to the
city of Nokia, Finland. Idestam retired from the management of the company in 1896.
TYPE Public
FOUNDED 1865
HEADQUARTERS Espoo, Finland
KEY PEOPLE Risto Siilasmaa
NET INCOME € -3.106 billion
EMPLOYEES 97,800
WEBSITE Nokia.com
Current Product Range
Table 2.4 Current production range of NOKIA
Smart phones Dual SIM phones Windows phones

21
2.5 SAMSUNG
Byung-chull Lee He was the founder of Samsung Group was born February 12, 1910, died 19
November 1987. He was the son of a wealthy land owner and had attended lectures at the
University of Tokyo Wesda though not until graduation. Lee Byung-chull use inheritance to
open a rice mill for the first attempt. efforts were not going well. In 1938 Lee Byung-Chull
export trading company established in Korea, selling fish, vegetables, and fruits to China. Lee
moved its headquarters to Seoul in 1947. After the war, in 1954, Lee founded Cheil Mojik and
build a woolen mill in Chimsan-dong, Daegu. And that is the largest woolen mill in the country,
the company grew rapidly into large companies. After his death, his estate (Ho-Am) was opened
to the public for tours.
TYPE Chaebol
FOUNDED 1938
HEADQUARTERS Samsung Town, Seoul, South Korea
KEY PEOPLE Lee Kun-hee
NET INCOME US$ 26.2 billion
EMPLOYEES 425,000
WEBSITE Samsung.com

22
Current Product Range
Table 2.5 Current production range of SAMSUNG
Television Home Video Home Audio
Home Theater System Tablet Compact Digital Camera
Smart phones PC Galaxy Note
Air Conditioners Pinter Dual SIM phone
Accessories Washing Machines Microwave Ovens
Refrigerators Dishwashers

23
2.6 GODREJ
The Company is one of the largest players of Home Appliances in India and has always
delighted the consumer with relevant technology in a wide range of efficient products. In 1958,
Godrej was the First Indian Company to manufacture Refrigerators and has become synonymous
with the category. Godrej pioneered the launch of Polyurethane Foam (PUF) which became the
new benchmark for the refrigerator industry. In the last year, Godrej has introduced more than
100 new products across various categories- Refrigerators, Air conditioners, Microwave Ovens
and Washing Machines. With new innovative technologies like Silver Shower technology in
refrigerators, i-Sense and EM5 in Air conditioners, Insta-Cook in Microwave Ovens, Tilt Drum
in Washing Machines etc, Godrej is redefining the technology space in the Indian Appliances
context.
TYPE Public
FOUNDED 1897
HEADQUARTERS Mumbai, Maharashtra, India
KEY PEOPLE Adi Godrej
NET INCOME N/A
EMPLOYEES 26,000
WEBSITE www.godrej.com

24
Current Product Range
Table 2.6 Current production range of Godrej
Refrigerators Washing Machines Microwave Ovens
Air Conditioners

25
2.7 LG
The L.G group was a merger of two Korean companies Lucky and Goldstar. Company was
started in 1952.Lucky chemical industrial corporation plastic industry in KOREA. The company
moved into electronics with a new brand name in 1958. In 1959, the company produced South
Koreas LG Electronics was established in 1958 as Gold Star. L is taken from Lucky and G from
Gold Star which formed LG Group. "Lifes Good" is the slogan of the LG Electronics.
The market leader in consumer durables is LG for close to a decade in India. They have also
been recognised for their superior innovation and after sale service. It is proud of their
distribution channels which offer its products to the breadth and length of India. As early as
1998, LG with a budget of Rs500 crores set up manufacturing facility with a state-of-the art
technology at Greater Noida, near Delhi. L.G also has recently entered directly into the consumer
market by setting up retail shops and boast of retail sales Rs. 10,000 crores in 2008.
TYPE Public
FOUNDED January 5, 1947
HEADQUARTERS Seoul, South Korea
KEY PEOPLE Koo Bon-Moo
NET INCOME N/A
EMPLOYEES 220,000
WEBSITE www.lgcorp.com

26
Current Product Range
Table 2.7 Current production range of LG
Television Home Theater System Home Video
Home Audio Smart phones Refrigerators
Air Conditioners Washing Machines Microwave Ovens
Vacuum Cleaners Water Purifier Dishwashers

27
2.8 VIDEOCON
Videocon was founded by Nandlal Madhavlal Dhoot in 19 87. It emerged as an industrial
conglomerate with interests all over the world. The group has 17 manufacturing sites in India and
plants in China, Poland, Italy and Mexico. It is the third largest picture tube manufacturer in the
world. Videocon group has an annual turnover of US$ 4.1 billion. Since the entry of Korean
Chaebols and their rising popularity in the Indian market, Videocon from a stand-point of market
leader has seen a slow decline to become a no 3 player in India.
TYPE Public Company
FOUNDED 1979
HEADQUARTERS Gurgaon, India
KEY PEOPLE Venugopal Dhoot
NET INCOME -71.63 crore
EMPLOYEES 9,000
WEBSITE www.videocon.com
Current Product Range
Table 2.8 Current production range of Videocon
Television Smart phones Air Conditioners
Refrigerators Washing Machines

28
2.9 MICROMAX
Micromax, is the 12th largest handset manufacturer in the World (According to Global Handset
Vendor Market share report from Strategy Analytics). The Indian brand is reaching out to the
global frontiers with innovative products that challenge the status quo that Innovation comes
with a price. It has 23 offices in India and an international office in Hong Kong. In 2008, it
entered mobile handset business and by 2010 it became one of the largest Indian domestic
mobile handsets company operating in low cost feature phone segments. . Micromax has
presence in more than 560 districts through 125,000 retail outlets in India. The company has
sales presence spread across Bangladesh, Sri Lanka and Nepal. On October 2013, the company
made an announcement that Hollywood actor Hugh Jackman will be endorsing the soon-to-be-
launched Micromax smartphone called Canvas Turbo. Based on this experience of innovation
arising from constraint, Micromax soon launched its first phone which had a battery back-up of
one whole month known as X1i. Micromax aims to be a company with a double digit market
share by 2014.
TYPE Private Limited Company
FOUNDED 1999
HEADQUARTERS Gurgaon, Haryana, India
KEY PEOPLE Shubhodip Pal
NET INCOME N/A
EMPLOYEES 1200
WEBSITE Micromaxinfo.com

29
Current Product Range
Table 2.9 Current production range of Micromax
Television Smart phones Home Audio

30
2.10 PANASONIC
Panasonic was founded in 1918 by Konosuke Matsushita as a vendor of duplex lamp sockets.
During World War II the company operated factories in Japan and other parts of Asia which
produced electrical components and appliances such as light fixtures, motors, electric irons,
wireless equipment, and its first vacuum tubes. With the announcement that Pioneer would exit
the production of its Kuro plasma HDTV displays, Panasonic purchased many of the patents and
incorporated these technologies into its own plasma displays. Panasonic returned to the overseas
market in 2012, with the release of the Panasonic Eluga Android-powered smartphone. In July
2013, Panasonic agreed to acquire a 13% stake in the Slovenian household appliance
manufacturer Gorenje for around €10 million.
TYPE Public
FOUNDED March 13, 1918
HEADQUARTERS Kadoma, Osaka, Japan
KEY PEOPLE Masayuki Matsushita
NET INCOME N/A
EMPLOYEES 293,742
WEBSITE Panasonic.net

31
Current Product Range
Table 2.10 Current production range of Panasonic
Television Smart phones Home Audio
Air Conditioners Home Video Video Camera
Compact Digital Camera Interchangeable Lens Camera Refrigerators
Washing Machines Water Purifier Small Appliances
Microwave Ovens Vacuum Cleaners

32
CHAPTER - 3
MACRO ANALYSIS

33
3.1 Key Economic Feature:
The major dominant economy features which are related to electronic good industry are given
below.
3.1.1 TECHNOLOGY:
However, more recently the technology revolution has transformed the nature of electronics
goods discovery and the structure of the industry. Increasingly, new electronics goods originate
in small firms, which often out-license their products to more experienced firms for later-stage
electronics goods development, regulatory review, and commercialization. In any year the
technology industry may comprise a couple of thousand firms, but the identity of these firms
changes, as new start- ups are formed and established firms grow, merge, or are acquired by
other established companies. Although larger firms have grown in market share, because of
mergers, their performance has lagged that of smaller firms, on whom the large firms
increasingly rely for new products.
3.1.2 PRODUCT INNOVATION:
Product development deals thus define the sharing of responsibilities and rewards between large
and small firms. The small firm typically gets cash and/or equity upfront, plus contingent
payments, and may choose to participate in late-stage development and co-marketing, in order to
gain experience. In return, the large firm obtains rights to develop and market the new product,
retaining the majority of product revenues, with specifics depending on the stage of the deal. The
efficiency of the market for deals is important because it allocates rents between the smaller and
originator firm, as opposed to the larger developer/marketer, and hence influences incentives. It
also provides interesting evidence on how participants use contractual structure to control
possible distortions attributable to symmetric information and agency.

34
3.1.3 PRICE REGULATION:
The high rate of entry to the electronics goods industry indicates that it is structurally
competitive. To the extent that market power exists, it derives from patents that are legal grants
of monopoly power to enable originator firms to recoup their R and D costs. Although patents
bar generically equivalent products for the life of the patent, they do not prevent entry of similar
3.1.4 EXTERNAL FACTOR:
One country's system of price regulation can affect not only its domestic prices and availability,
but also prices and availability of electronics goods in other countries. Such external spillovers
can occur because of price regulation with external referencing External referencing and parallel
trade undermine a electronics firm's ability to price-discriminate across countries, based on
elasticity that are country-specific. Rather, the optimal pricing strategy may be to charge a single
price or a narrow pricing band, and to delay or not launch in countries that do not accept the
single price. Non-launch is most likely in small countries with low prices, because the foregone
revenue of non-launch is small, compared to the revenue loss if a low price contaminates a
potentially higher price in a larger market.

35
3.2 PORTER'S FIVE FORCE MODEL ON ELECTRONICS GOODS
INDUSTRY
One important component of industry and competitive analysis involves delving into the
industry‘s competitive process to discover what the main sources of competitive pressure are and
how strong each competitive force is. This analytical step is essential because managers cannot
devise a successful strategy without in-depth understanding of the industry‘s competitive
character.
Even though competitive pressures in various industries are never precisely the same, the
competitive process works similarly enough to use a common analytical framework in gauging
the nature and intensity of competitive forces.
Two things determine your company‘s profitability- the industry in which it competes and its
strategies position in the industry. Some industries have inherently low profit potential while
others are highly profitable. The most profitable companies have a strongest competitive position
in a profitable industry. The poorest companies have weak positions in weak industries.
The following write-up is a view of the Indian Consumer electronics goods industry from these
five angles leading to the expected changes in the coming years in the underlying structure of the
Indian Consumer electronics goods industry.
Porter's Five Forces Model On Electronics Goods Industry

36
Chart 3.1 Porters five force model
Source: Adopted from Michael E. porter, ―how competitive forces shape
strategy,‖ Harvard Business Review 57, no. 2 (March-April 1979), pp. 137-45.

37
3.2.1 BARRIERS TO ENTRY:
It's true that the average person can't come along and start manufacturing electronics good. The
emergence of foreign competitors with the capital, required technologies and management skills
began to undermine the market share of many electronics company. Globalization the tendency
of world investment and businesses to move from national and domestic markets to a worldwide
environment is a huge factor affecting the electronic market. More than ever, it is becoming
easier for foreign electronic makers to enter the Domestic market. Electronic depend heavily on
consumer trends and tastes. While electronic companies do sell a large proportion of electronic
good to home, consumer sales is the largest source of revenue. For this reason, taking consumer
and business confidence into account should be a higher priority than considering the regular
factors like earnings growth and debt load.
Economies of Scale: - In the electronics good industry, economies of scale act as a significant
entry barrier since it is a capital-intensive industry. Globally, it has been witnessed that
electronic manufacturers with low volumes find it extremely difficult to survive given the high
per unit cost. The acquisitions of Sony & apple are a testament to this. On the other hand by
entering on a large scale, one runs the risk of drastic under-utilization of capacity as observed by
Daewoo's experience in India. Since the economy segment electronic are expected to drive
volume growth in India in the coming years, it is extremely important for a manufacturer to have
a model in this segment to reduce his per unit cost.
Product Differentiation: - Here the product is electronics good. Now there are many kind of
ways through which companies can differentiate their product from others as far as electronic
good industry is concern. But in India consumers are too much conscious about price rather than
uniqueness of a electronic good. One of the key trends observed in the electronic good industry
during the last decade is that the products of different companies have become increasingly
similar especially in the economy and mid-size segment. There is a perceptible shift towards
"electronic good" being treated as a commodity rather than as a consumer good. In the premium
electronic good segment in India, differentiation between different models is declining as
companies strive to increase volumes by cutting prices.

38
Brand Identity: - Brand plays an important role in Indian electronics good industry.
Consumers are quite branding conscious. Creation of brand image in consumers mind is very
important factor in Indian electronic good industry. If we take an example of Godrej, it is India‘s
oldest electronic manufacturer and it has created such kind of image in Indian consumers mind
like Godrej is good product, better performance product which gives value for money. And if we
talk about international giants like haier and funai then they are struggling to survive in Indian
market just because of their poor brand image in Indian market. And on the other side brand like
Apple has created magic in the premium electronic good segment even it‘s totally new in Indian
market. So we can say that brand identity can be a barrier for a company if it is new.
Access to channel distribution: - Availability of sources to access to channel of distribution
is easily available & easy to access. Due to which the barriers to entry is low, hence industry is
high attractive.
Access to technology: - Access to technology is quite satisfactory. Due to which moderate
barrier to entry, hence industry attractiveness is moderate.
Access to raw material: - Indian electronic component industry is growing rapidly. And
also its exports are increasing. So access to raw material is quite good.
Government Protection: - According the policy of government, it has opened the gate for
all companies to enter in the Indian market. Companies can install their plats as well as R&Ds in
the country. The prices of the electronics good are not moderate by government. So as far as
factor of government protection is concern electronic good industry is quite attractive to enter.
Capital Requirement:- Capital requirement for entering in the electronic sector are
substantially high due to high fixed cost and cost of infrastructure so the threat of new entrance is
low if the new entrance has not sufficient capital.

39
3.2.2 THREAT FROM SUBSTITUTES
Rather than looking at the threat of someone buying a different electronic good. The higher the
cost of operating a electronic good, the more likely people will seek alternative use of electronic
good. The price of gasoline has a large effect on consumers' decisions to buy electronic good.
Air Conditioners and Refrigerators utility Products have higher profit margins. When
determining the availability of substitutes you should also consider time, money, personal
preference and convenience in the electronic good industry. Then decide if one product maker
poses a big threat as a substitute.
Availability of close substitute: - Plasma Tv is the closest substitute of LCD. And the other
substitute LED is on developmental stage. So here if we consider urban area like metros then
LED system is the closest and strongest substitute of product. So the industry attractiveness is
quite moderate in this case.
Substitute’s price value: - Here substitute‘s (C Tv) price value is too low. But it has low
quality and consumer preferences.
Price band: - The threat that consumer will switch to a substitute product if there has been
an increase in price of the product or there has been a decrease in price of the substitute product.
If the price of the window air conditioner will increase the main expected customers in the one
switching from window air conditioner to split air conditioner will not move to split air
conditioner and will remain in the window air conditioner only. Thus the price is kept checked in
this manner.
Substitute’s performance: - The performance of the substitute sector will also play a
important role in the success of the product. If the prices of the window air conditioner segment
increases or the price band of the small segment fall, it will have effect on the quantity required
in the market. It‘s just on the price but also the features and the other services associated or it
may be the status symbol story.

40
3.2.3 RIVALRY AMONG COMPETITORS
Highly competitive industries generally earn low returns because the cost of competition is high.
The electronic industry is considered to be an oligopoly (A market condition in which sellers are
so few that the actions of any one of them will materially affect price) which helps to minimize
the effects of price-based competition. The electronics understand that price-based competition
does not necessarily lead to increases in the size of the marketplace, historically they have tried
to avoid price-based competition, but more recently the competition has intensified - rebates,
preferred financing and long-term warranties have helped to lure in customers, but they also put
pressure on the profit margins for electronic sales. Every year, electronic companies update their
electronic good. This is a part of normal operations, but there can be a problem when a company
decides to significantly change the fishers of a product. These changes can cause massive delays
and glitches, which result in increased costs and slower revenue growth. While new fishers may
pay off significantly in the long run, it's always a risky proposition.
Number of competitors: - Before 10 years there is negligible competition in the Indian
electronic good industry but after liberalization many MNCs like Sony, BPL, Godrej, Sharp and
many Others like Apple, LG, Samsung etc are about to come. So strong competition is prevails
in the industry thus the attractiveness is low. This describes the competition between the existing
firms in an industry. The current Business Policy & Competitive Strategy scenario, the electronic
market in India is very competitive with players like LG, Samsung, Panasonic etc. Now to be
competitive in market other companies have to either sales rates of their existing model or have
to go back to the drawing board and build again.
Price Competition: - Advertising battles may increase total industry demand, but may be
costly to smaller competitors. Products with similar function limit the prices firms can charge.
Price competition often leaves the entire industry worse off. Micromax is the only player so it
has the price freedom but as the Nokia and Samsung are also planning to launch the mobile in
the same segment the price competition will start.

41
Industry growth: - As the urbanization and modernization increase in India and India is
growing on faster bases, the electronic good industry is also growing rapidly. And industry is far
from penetration so attractiveness is high.
Openness of terms of sales: - Industry is fully open for sell. There is not any kind of
restrictions on the companies from government in terms of sell. So in this case industry
attractiveness is high.
Product Quality & Differentiation: - Increasing consumer warranties or service is very
common these days. To maintain low cost, companies consistently has to make manufacturing
improvements to keep the business competitive. This requires additional capital expenditure
which tends to eat up company's earning. On the other hand if no one else can provide products/
services the way you do you have a monopoly. Differentiation is required to stay in the
competition. But now a day‘s companies give more importance to provide different model at low
price. So because of price reduction differentiation is limited up to certain extent. So in this case
the attractiveness of the industry is moderate.
3.2.4 BARGANING POWER OF SUPPLIER
The electronic good supply business is quite fragmented (there are many firms). If an electronic
good decided to switch suppliers, it could be devastating to the previous supplier's business. As a
result, suppliers are extremely susceptible to the demands and requirements of the electronic
manufacturer and hold very little power. For parts suppliers, the life span of an electronic
product is very important. The longer a product stays operational, the greater the need for
replacement parts. On the other hand, new parts are lasting longer, which is great for consumers,
but is not such good news for parts makers.
Number of Supplier: - The availability of number of supplier is quite good. Due to which
bargaining power of supplier is moderate and thus the industry attractiveness is moderate.

42
Contribution of Quality: - The impact of contribution to quality is moderate. Indian
electronic maker component manufacturer are now improving on the quality basis. Thus they are
on developmental stage and hence here their bargaining power is low. Thus the industry is more
attractive.
Contribution of Cost: - Most of the Indian electronics maker components manufacturers
provide raw material at cheaper cost then other suppliers of foreign countries. Bargaining power
is increased. Contribution to cost is higher. So lesser attractive.
Industry Importance to Supplier: - Supplier is very important for industry. Hence the
bargaining power is very high. Therefore attractiveness of industry is lower.
3.2.5 BARGAINING POWER OF BUYERS
The bargaining powers of electronic makers are unchallenged. Consumers may become
dissatisfied with many of the products being offered by certain electronic makers and began
looking for alternatives, namely foreign product. On the other hand, while consumers are very
price sensitive, they don't have much buying power as they never purchase huge volumes of
product.
Number of buyers: - Larger number of buyers. Huge competition prevails in Indian market.
Buyers are too much price sensitive. We can say that industry is less attractive in the case of
bargaining power of buyers as they have high bargaining power.
Availability of substitute: - In the case of availability of substitutes industry attractiveness is
quite good.
Contribution to Cost: - Indian buyer is always price sensitive. They always want value for
money. If any company like Videocon provides good product at low cost then buyer‘s bargaining
power gets lower. So we can say that industry attractiveness is moderate.

43
Contribution of Quality: - Buyer wants a good quality product at least value. Now as the
quality improves, price of the product will obviously increase. So here industry attractiveness is
moderate.
3.2.6 BARRIERS TO EXIT
Assets specialization: - The assets specialization is quite high in this industry. Thus exit
barriers are quite high and industry in less attractive.
Cost of exist: - The cost to exit is higher. The company invests crores of rupees in acquiring
in capital assets, such as land, building, tower, equipment, technology and others. So barriers to
exit is higher, hence lower attractive.
Government restriction: - There is no restriction from the government to exit. So lesser the
barrier to exist, hence higher attractive.

44
3.2.7 OVERALL ASSESSMENT
Table 3.1 Overall Assessment
SR. NO. FORCE THREATS TO INDUSTRY REASONS
1 Existing rivalry Strong Number of Competitors
Price competition
2 Potential new
entrants Strong
High Capital Requirement
Achieving Economic Scale
3 Substitute products Weak No direct substitutes to
industry
4 Bargaining Power
of Supplier Weak
Number of suppliers are
more and bargaining power
of buyer is high
5 Bargaining power
of Buyer Strong Large buyers,
Although liberalization of the Indian economy has reduced the impact of government policy
as an entry barrier, the electronic industry still enjoys high entry barriers due to huge capital
costs involved in setting up efficient plants and numerous cost advantages enjoyed by LG.
The competition between firms in the electronic industry is expected to intensify considerably
as newer companies will start reducing LG dominance of the market. The expected significant
over-capacity in the industry, increasing working capital needs, and high exit barriers coupled
with low differentiation between models especially in the economy segment will put downward
pressure on prices and profitability of companies.
The entry of the global electronic manufacturers has transferred the balance of power into the
hands of the buyer. The Indian electronic buyer is not only extremely price conscious, but also
wants the highest value and service. He availability of cheap financing and maturing of the used
electronic market will also increase the choices for the consumers. With many new models

45
waiting to be launched, the Indian electronic buyer will only have more power to choose and
dictate terms to the dealer.
Supplier power in the electronic good industry will diminish greatly in the coming years due
to the large number of competing suppliers, threat of cheaper and better-quality imports, and an
increasing trend towards reduction of an electronic company's vendor base.

46
3.3 PEST ANALYSIS
PEST analysis is nothing but analysis of external environmental factors. The factors included in
PEST analysis are political/legal, economic, social-cultural, and technological. Each industry is
more or less affected by each of these factors. Every industry has to consider these factors
because these factors can create opportunity or threat at regular period of time. We will now
discuss all these factors in detail.
3.3.1 POLITICAL-LEGAL FACTORS
Many political factors affect and create opportunity or threat for the industry. Due to the socialist
leaning of some of the ministers many multinationals had to move out of India in the late 70s. A
deep-seated fear of multinationals made the political leaders to shut the door on giant
multinational companies for painfully long times. When things turned from bad to worse, the
situation was sought to remedy through a bold liberalization Programme in the early 90s. Apart
from a willingness to bend the rules and get along with the times, political stability is also
essential for economic growth. After liberalization steps taken by P.V. Narasimha Rao
government 1992, they could not make the bold decision on liberalization or could not
implement the planned programs because of the Babri Masjid demolition and subsequent
securities scams. The NDA government also could not go for bold decisions on disinvestments,

47
power sector reforms, and labor reforms etc. due to the scams of the ministers. Recent UPA
government is also find troubles because of the left parties who are giving support.
The political party in power decides the legal framework. The government, therefore, may
legislate on matters like wage fixation, managerial remuneration, safety and health at work,
location of plants, entry of multinationals, price controls, import-export policy, licensing policy
etc. During the license-permit-raj that prevailed till the late 80s, licensing policies, quota
restrictions, import duties, FOREX regulations, restrictions on FDI flows, controls on
distribution and pricing of commodities, regulations on all aspects of corporate functioning, had
really put the captains of industry in a spot and pushed them to the wall. The liberalization
measures, macroeconomic reforms, and structural adjustments brought about in the early 90s
have altered the economic scenario quite dramatically. Obviously companies that want to do
business globally must pay attention to the above developments closely and learn to adapt
themselves to the laws of the land. The rules of competition, trademark rights, price controls,
product quality lows, and a number of other legal issues in individual countries may be of special
importance to global companies.
GOVERNMENT REGULATIONS AND SUPPORT:
Flat Panel (LCD/LED/Plasma) TV allowed input under new Baggage Rules :
The Ministry of Finance, Government of India has issued Custom Notification No.
84/2013-Cus dated 19th August, 2013. Under this Rules, have been framed called
Baggage (Second Amendment) Rules, 2013. The Rules which come into force on the
26th day of August, 2013, allow input of Flat Panel (LCD/LED/Plasma) Television.
Government plans to invest in electronics manufacturers :
A bulging import bill and the near absence of electronics manufacturing in the country
has forced the government to seek help from venture capital firms to identify companies
where it can invest. The Department of Electronics and Information Technology,
abbreviated as Deity, said it is in advanced talks with leading Indian venture capital firms
and will invest up to Rs 100 crore in a project expected to start next month.
48
The government will invest for a 15% to 20% stake in each company that will be part of
the project. The rest will come from venture capital firms that are currently shortlisting
startups in the hardware segment. India now imports more than 90% of its electronics
equipment."The government's ability to take risk is very low. So, we are taking help of
venture capital firms who will professionally manage and invest in these startups," said
Shri Ajay Kumar, who heads the electronics and hardware manufacturing division at
Deity.
He said the initiative is aimed at reducing India's dependence of electronic imports,
which is expected to cross $300 billion ( Rs 19 lakh crore) by 2020 and exceed that of
crude oil. Kumar declined to divulge the names of venture capital firms the government
is in talks with. It is a good initiative as government backing would bring more stability
to domestic manufacturing segment. Most of the electronics hardware startups in India
are struggling due to absence of working capital. The government has been taking
increasing interest in venture capital investing in recent months.
In March, it said investors committed at least Rs 400 crore to a government backed fund
which will provide capital to new ventures that serve the needs of India's low-income
communities. The fund's eventual size is envisaged at more than Rs 5,000 crore. Earlier
this year, Deity said it would propose higher duties on imported electronic items to
support local manufacturing.
Govt. slaps 10% import duty, 12.5% CVD:
Indian travelers returning home will now have to pay Customs duty on TV sets they buy
overseas. The government slapped a 10% Customs duty and 12.5% countervailing duty
on such imports, as part of its efforts to discourage import of non-essential items and
reduce the current account deficit that has put enormous pressure on the rupee. Till now,
travelers could bring a TV set worth Rs. 35,000 with them without having to pay import
duty. This had resulted in Thailand, Dubai, Singapore and Malaysia becoming attractive
shopping destinations.

49
“Electronics Commission“ proposal unlikely to set nod:
A proposal to set up an Electronics Commission on lines of the existing Space
Commission and Atomic Energy Commission is set to be shot down. It drew little
support from the Planning Commission, particularly on the issue of granting it financial
autonomy to the tune of Rs. 300 crore. Officials said the Prime Minister‘s Office and the
Finance Ministry, too; were not very keen to go ahead with the proposal on the ground
that it would not be feasible to grant financial autonomy to the said body.
Senior officials said the proposed commission, mooted by the Department of Electronics
& Information Technology, intended to fast-track growth of the electronics sector in
India and was to have been modeled on the lines of the existing space and atomic energy
commissions.
Electronic goods likely to escape higher import duty :
The government might not levy higher customs duty on imports of non-essential items
like electronic goods. The commerce ministry has told the finance ministry that most
electronic goods are covered under information technology (IT) agreements with other
countries, and India unilaterally cannot raise the rates. The ministry argues raising duty
rates on IT products would not make much difference to the current account deficit.
FOREIGN INVESTMENT POLICY :
A foreign company can start operations in India by registration of its company under the
Indian Companies Act 1956. Foreign equity in such Indian companies can be up to 100
percent. At the time of registration it is necessary to have project details, local partner (if
any), structure of the company, its management structure and shareholding pattern.
Registration is a kind of formality and it takes about two weeks. It can forge strategic tie
up with an Indian partner.

50
A joint venture entails the advantages of established contracts, financial support and
distribution-marketing network of the Indian partner. Approval of foreign investments is
through either automatic route or Government approval.
Foreign technology induction is encouraged both through FDI and through foreign
technology collaboration agreement. Foreign Direct Investment and Foreign technology
collaboration agreements can be approved either through the automatic route under
powers delegated to the Reserve Bank of India (RBI) or otherwise by the Government.
FOREIGN TRADE POLICY
In general, all Electronics and IT products are freely importable, with the exception of
some defence related items. All Electronics and IT products, in general, are freely
exportable, with the exception of a small negative list which includes items such as high
power microwave tubes, high end super computer and data processing security
equipment.
Export Promotion Capital Goods scheme (EPCG) allows import of capital goods on
payment of 5 per cent customs duty. The export obligation under EPCG Scheme can also
be fulfilled by the supply of Information Technology Agreement (ITA-1) items to the
DTA provided the realization is in free foreign exchange.
The import of second hand computers including personal computers and laptops are
restricted for imports.

51
3.3.2 ECONOMIC FACTORS:
Economic factors throw light on the nature and direction of the economy in which the
industry operates. Interest rates, inflation rates, unemployment rates, gross national
product, sectoral growth rate of agriculture, industry infrastructure, level of disposable
income, availability of credits are some of the economical factors which affect more or
less to each industry.
SEZ Scheme
Special Economic Zone (SEZ) is a specifically delineated duty free enclave and shall be
deemed to be foreign territory for the purposes of trade operations and duties and tariffs.
SEZ unit may import/procure from the DTA without payment of duty all types of goods
and services, including capital goods, whether new or second hand, required by it for its
activities or in connection therewith, provided they are not prohibited items of imports.
The units shall also be permitted to import goods required for the approved activity,
including capital goods, free of cost or on loan from clients. SEZ unit may, on the basis
of a firm contract between the parties, source the capital goods from a domestic/foreign
leasing company. SEZ unit shall be a positive Net Foreign Exchange earner. Net Foreign
Exchange Earning (NFE) shall be calculated cumulatively for a period of five years from
the commencement of production.
As per the ―Special Economic Zones Rules, 2006‖, notified by the Department of
Commerce, in case a SEZ is proposed to be set up exclusively for electronics hardware
and software, including information technology enabled services, the area shall be ten
hectares or more with a minimum built up processing area of 1,00,000 square meters.

52
3.3.3 SOCIAL FACTOR
The social factors that affect a firm include the values, attitudes, beliefs, opinions, and
lifestyles of persons in the social environment, as developed from demographic, cultural,
religious, educational, and ethnic conditioning. Like other forces in the external
environment, social factors change continually. As social attitudes, beliefs, and values
change, so does the demand for various types of dresses, books, leisure activities, etc.
Key Market Drivers - Social
Growth in urbanization
Upward migration of household income levels
Low interest rates translating to low financing and acquisition costs hence greater
affordability.
Chart 3.2Household income and urbanization
Source: Economist

53
Rural Consumer Boom
India may soon see a rural consumer boom, as huge plans are being drawn for getting growth
from this segment. The consumers demand for products and services in the rural areas are on an
increase and would post a significant growth in the near future. The rural customers are now
better able to afford products and have shown a shift in their approach from ‗willing to spend‘
rather than ‗save‘. The rural family is now having multiple sources of income and is not
necessarily dependant on Agriculture for his survival. The physical boundaries between urban
and rural India is getting reduced as the infrastructure improves slowly. The penetration of
television, radio, newspaper and mobiles has resulted in creating a pent up demand for consumer
& lifestyle products.
Urbanization
Another significant qualitative aspect of the changing demographics is increasing urbanization.
Around 320 million peoples are living in urban areas. This accounts for 30% of the total
population.

54
Trends in Urbanization, 1990-2020E (Millions of people, percentage)
Chart 3.3 Trends in Urbanization
More and more people are moving toward the urban areas and this trend will increase the
demand of Electronic Product because of more penetration of Electronic Product in urban areas.
More of the social factors are discussed in detail in the Marketing Analysis section.
3.3.4 TECHNOLOGICAL FACTORS
Technological factors represent major opportunities and threats that must be taken into account
while doing strategic analysis. Technological breakthrough can dramatically influence the
industry‘s products, service markets, suppliers, distributors, competitors, customers,
manufacturing process, marketing practices, and competitive positions. Technology is changing
rapidly and the new inventions and modification in models of electronics good is very common
now a days. We will look how some of the factors affecting the electronics good market.

55
4K
It's time to take your viewing experience beyond HD to a brand new era of 4K. The 84 4K LCD
screen contains more than 8 million individual pixels (3,840 x 2,160 pixels).That's four times
more detail than the Full HD TV. It‘s like seeing the real life! Experience stunning 4K picture
quality for your favourite content from Blu-ray Discs to low-resolution smartphone clips, thanks
to Sony's latest video processing engine. It refines images with more natural detail, richer colours
and high contrast for that incredible 4K detail and sharpness. Unique to Sony, the
TRILUMINOS™ Display technology expands the range of colors enriching your viewing with a
wider palette of rich and natural colors. Compared with ordinary TV displays, reds are more
vivid and life-like, hard-to-reproduce greens and blues look more natural. Enjoy the next level in
sound technology with Sony‘s new Magnetic Fluid Speakers – these new sound blasters wrap
you in a truly immersive experience to deliver soul shaking sound clarity. These speakers also
give you more sound for less energy consumption! Enjoy 3D viewing from Blu-ray Disc to 3D
web videos with the latest generation of light weight and comfortable 3D glasses. These glasses

56
provide finely detailed 3D images that enable you to feel a natural depth of field. Bring all family
members together to share this incredible experience with a great view of the action.
Touch ID
You check your iPhone dozens and dozens of times a day, probably more. Entering a passcode
each time just slows you down. But you do it because making sure no one else has access to your
iPhone is important. With iPhone 5s, getting into your phone is faster, easier and even a little
futuristic. Introducing Touch ID — a new fingerprint identity sensor.
Put your finger on the Home button, and just like that your iPhone unlocks. It‘s a convenient and
highly secure way to access your phone. Your fingerprint can also approve purchases from
iTunes Store and the App Store, so you don‘t have to enter your password. And Touch ID is
capable of 360-degree readability. Which means no matter what its orientation — portrait,
landscape or anything in between — your iPhone reads your fingerprint and knows who you
are. And because Touch ID lets you enrol multiple fingerprints, it knows the people you trust
too.

57
3.4 STRATEGIC GROUPS MAPPING
Strategic Groups:
In some industries, groups of competitors are constrained by similar resource positions and
follow similar strategies. The groups or clusters of similar competitors are called strategic
groups. The alliance dynamics among the 35 largest firms in the worldwide electronics good
industry indicates that the likelihood of an alliance between any two firms depends on the local
density of alliances among the members of their strategic groups, rather than on the global
density of alliances in the industry. These results suggest that firms most closely observe and
imitate the strategic behavior of firms who occupy the same strategic niche rather than the
behavior of firms in their industry defined more broadly. Over time, the resource positions and
strategies are converging, and the sharp differences between strategic groups are eroding.
Strategic Group Mapping
A strategic group is a concept used in strategic management that groups companies within an
industry that have similar business models or similar combinations of strategies. For example,
the restaurant industry can be divided into several strategic groups including fast-food and fine-
dining based on variables such as preparation time, pricing, and presentation. The number of
groups within an industry and their composition depends on the dimensions used to define the
groups. Strategic management professors and consultants often make use of a two dimensional
grid to position firms along an industry's two most important dimensions in order to distinguish
direct rivals (those with similar strategies or business models) from indirect rivals. Strategy is the
direction and scope of an organization over the long term which achieves advantages for the
organization while business model refers to how the firm will generate revenues or make money.
Strategic Group Analysis
Strategic Group Analysis (SGA) aims to identify organizations with similar strategic
characteristics, following similar strategies or competing on similar bases.
Such groups can usually be identified using two or perhaps three sets of characteristics as the
bases of competition.

58
Examples of Characteristics
Extent of product (or service) diversity
Extent of Geographic coverage
Number of Market segments served
Distribution Channels used
Extent of Branding
Marketing Effort
Product (or service) quality
Pricing policy
Use of Strategic Group Analysis
This analysis is useful in several ways:
Helps identify who the most direct competitors are and on what basis they compete.
Raises the question of how likely or possible it is for another organization to move from
one strategic group to another.
Strategic Group mapping might also be used to identify opportunities.
Can also help identify strategic problems.
There are five steps to make strategy group:
1. Identify two important competitive characteristics that strategically differentiate firms
in an industry from one another:
So here there are two factors identify are reported no. of product and market share of the
company they are taken on X axis and Y axis
2. Plot the firm in two variable
In the chart sawn different companies are plotted in X axis and Y axis in respect to their
performance.
3. Draw circles around the firms that are cluster together.
In this step actually find out the close firms which are nearby similar factor that we have taken in
X, Y axes.
4. Indicate potential movement of firms with arrows.
At the last have to saw the potential movement means the strategy for future movement.

59
Table 3.2 Numbers of product and Market share
Chart 3.4 Strategic Group Mapping
Sony
Samsung
Nokia
Toshiba
LG
-1%
0%
1%
2%
3%
4%
5%
6%
7%
0 2 4 6 8 10 12 14 16 18 20
Mar
ket
Sh
are
No. of Products
Strategic Group Mapping
(Year 2012) Number of products Market share
Sony 14 2.9%
Samsung 17 5.6%
Nokia 3 3.7%
Toshiba 4 2.5%
LG 12 2.3%

60
Interpretation:
As per procedure of making group making, we have taken two unrelated variable such as number
of products and market share of the company. In the above strategic group mapping analysis, we
have taken number of products on X-axis and market share on Y- axis.
As we have observed that highest number of product was Samsung and it was 17. We also
observed that the Second Market share was Samsung and it was5.6%. We also observed that
Samsung is the market leader in the electronic good industry and there are no close competitors
in that position. We also observed that LG and Sony is close competitors and Nokia and Toshiba
product are close competitors to each other in the electronic good industry.

61
3.5 Driving forces
It‘s essential to provide strategic guidance to the innovation process, so in this chapter we take a
look at four essential forces that are driving the changes that are occurring across much of
today‘s world. While these may not be the most pressing issues for your company, chances are
that some combination of them will have huge influence on your situation, on the strategic
choices you make, and thus on your approach to innovation.
Driving force 1: Technological developments in textile industry
The study clearly indicated that the trend of the technological developments in Electronics goods
industry. The price of the products are defined in the market and the organizations should
develop new manufacturing technologies such as lean manufacturing to increase the efficiency of
manufacturing line and decrease the cost. Capacity utilization within the Electronics goods
industry is decreasing due to Chinese effect and loss of demand. The improvement in the
processes and production methods may create new Electronic systems which can be demanded in
the market. Raw material and production costs can be drastically reduced through Electronic
goods systems. In the market there is not as much enough competition as traditional Electronic
goods regarding with the price and quality as well as delivery speed.
Driving force 2: Globalization
Globalization has drawn every nation into a single economic system, and through social media,
many of us are now participating in a mediated social system as well. As a result, every
company‘s strategy must address a globalized market in which increasing numbers of people are
participating in social and business communities that transcend national boundaries.
The power and impact of globalization means that it‘s essential for every company to understand
the current and future impacts of worldwide trends on operations, to develop a globalization
strategy to optimize learning opportunities through exposure to various markets around the

62
world, and perhaps also to extend its reach to new customers. As customer communities are also
global, no large company can hope operate successfully without addressing global market.
Driving force 3: Product Innovation
Product development deals thus define the sharing of responsibilities and rewards between large
and small firms. The small firm typically gets cash and/or equity upfront, plus contingent
milestone and royalties payments, and may choose to participate in late-stage development and
co-marketing, in order to gain experience. In return, the large firm obtains rights to develop and
market the new product, retaining the majority of product revenues, with specifics depending on
the stage of the deal. The efficiency of the market for deals is important because it allocates rents
between the smaller and originator firm, as opposed to the larger developer/marketer, and hence
influences incentives.
Driving force 4: Changing in cost and efficiency
The Electronics goods industry is one of the most complicated manufacturing industries because
it is a Electronics sector dominated by small and medium enterprises (SMEs). Especially in times
of high energy price volatility should be a primary concern for electronics plants. There are
various opportunities that exist in every Electronics plant, many of which are cost-effective.
However, even cost-effective options often are not implemented in electronics plants mostly
because of limited information on how to implement & especially given the fact that a majority
of Electronics plants are categorized as SMEs and hence they have limited resources to acquire
this information.

63
CHAPTER – 4
FINANCIAL ANALYSIS

64
Financial analysis is an assessment of the (1) effectiveness with which funds (investment and
debt) are employed in a firm, (2) efficiency and profitability of its operations, and (3) value and
safety of debtors' claims against the firm's assets. It employs techniques such as 'funds flow
analysis' and financial ratios to understand the problems and opportunities inherent in an
investment or financing decision.
Tools of Financial Analysis
Ratio Analysis
Trend Analysis
4.1 RATIO ANALYSIS
Meaning:
Financial statements, as prepared and presented annually are of little use for the guidance of
prospective investor, creditors or even management. If relationships between various related
items in these financial statements are established, they are provided useful clue to gauge
accurately the financial health and ability of business to make profit. This relationship between
the two related items of financial statements is known as ratios.
Ratio analysis is a process of comparison of one figure against another and the interpretation of
the ratio to know the strengths and weaknesses of the firm‘s operation and of its financial
position. Ratio analysis helps various interested parties like prospective investor, creditors,
banks, etc. to draw useful conclusions to serve their purpose.
Classification of the ratio analysis:
According ratios are generally classified as follows:
(1) Traditional classification or classification according to the type of financial statements
(2) functional classification.

65
1. Traditional classification:
The ratio is grouped into three categories on the basis Of the statements from which the figures
are taken for computing the ratio. It is well-known traditional classification and has been so
grouped since the advent of ratio analysis. The ratio according to this classification is:
Revenue Statement Ratio: These are the ratios computed on the basis of items taken from
revenue statements i.e. profit and loss account. E.g. Net profit ratio is computed by dividing net
profit by sales. Here both net profit and sales are items appearing in profit and loss account.
Balance Sheet Ratios: When two items or groups of items appearing in the balance sheet are
compared the ratio so obtained is a balance sheet ratio. E.g., a ratio establishing relationship
between current assets and current liabilities is a balance sheet ratio.
Composite Ratios: A ratio showing the relationship between one item taken from Balance
sheet and another taken from Profit and Loss account is a composite ratio or a combined ratio
known as balance sheet and revenue statement ratio. A return on capital employed shows the
proportion of net profit to capital employed and it is a composite ratio.
2. Functional classification:
Ratios are also grouped in accordance with certain tests. On this basis there are four categories of
ratios.
Liquidity Ratios: These ratios indicate the position of liquidity. They are computed to
ascertain whether the company is capable of meeting its short-term obligations from its short
term resources. These are Current Ratio, Liquidity Ratio and Acid Test Ratio.
Profitability Ratios: A number of ratios are designed to indicate the profitability of the
business and are grouped into the category of profitability ratios. These are Gross Profit Ratio,
Net Profit Ratio, Return on Capital Employed, etc.

66
Leverage Ratios: The composition of capital of business and the proportion of owners‘ capital
and capital provided by outsiders are reflected by leverage ratios. These are Proprietary ratio,
Debt-equity ratio, Capital Gearing Ratio, and Fixed capital-Fixed Assets Ratio.
Efficiency Ratios: These are the ratios showing the effectiveness with which the resources of
the business are employed. It signifies the efficiency of the management. These are Debtors
ratio, Creditors‘ ratio, Total Assets Turnover, Fixed Assets, Turnover, etc.

67
4.1.1 LIQUIDITY RATIO
4.1.1.1 CURRENT RATIO
This most widely used ratio shows the proportion of current assets to current liabilities. It is also
known as ―working capital ratio‖ as it is a measure of working spatial available of a particular
time.
The Current Ratio formula is:
CURRENT RATIO = Current Assets / Current Liabilities
Table 4.1 Current Ratio
YEAR CURRENT ASSETS CURRENT
LIABILITIES
CR
(TIMES)
2013-12 386.09 1207.91 0.31
2012-11 520.4567 1266.90 0.41
2011-10 595.29 1635.00 0.36

68
Chart 4.1 Current Ratio
INTERPRETATION:
The financial performance of the industries is very sound as the ratio is above 1:0.36 in the year
10-11 the industry ratio is lowest as compared to other industries. In the year 11-12 it is very
high it might be industry was facing some problem the current liabilities is more than the assets
of the industry. But again it is decreasing in the next year which is a bad sign for the industry.
0
0.05
0.1
0.15
0.2
0.25
0.3
0.35
0.4
0.45
2011 2012 2013
CURRENT RATIO
CURRENT RATIO

69
4.1.1.2 LIQUID OR QUICK RATIO:
Quick ratio may be defined as the relationship between quick/current assets and current
liabilities. An asset is said to be liquid if it can be converted into cash within short period without
loss of value. In that sense, cash in hand and cash of bank are the most liquid ratio, ideal ratio is
1:1.
LIQUID RATIO: C.A - INVENTORY
CURRENT LIABILITES
Table 4.2 Liquid or Quick Ratio
YEAR C.A. - INVENTORY CURRENT
LIABILITY
LR
2013-12 -429.85 1207.91 0.35
2012-11 -381.1433 1266.90 0.30
2011-10 -588.05 1635.00 0.35

70
Chart 4.2Liquid or Quick Ratio
INTERPRETATION:
A high ratio is an indication that a firm is liquid and has that ability to meet its current
liabilities in time and on the other hand a low liquid ratio represents that the firm‘s
liquidity position is not good. As we see the three years ratio we can find that company‘s
quick ratio is more than ideal ratio in all three years which indicates that company is able
to meet current obligations using liquid assets and thus company has liquidity problem
0.27
0.28
0.29
0.3
0.31
0.32
0.33
0.34
0.35
0.36
2011 2012 2013
LIQUID RATIO
LIQUID RATIO

71
4.1.2 LEVERAGE RATIO
4.1.2.1 DEBT - EQUITY RATIO
A measure of a company's financial leverage calculated by dividing its total
liabilities by stockholders' equity. It indicates what proportion of equity and debt the company is
using to finance its assets.
DEBT-EQUITY RATIO = Total liabilities / Shareholders Equity
Table 4.3 Debt-Equity Ratio
YEAR TOTAL
LIABILITIES
SHAREHOLDERS
EQUITY
DR
2013-12 804.15 664.53 1.21
2012-11 1049.49 756.83 1.38
2011-10 1244.34 994.74 1.25
72
Chart 4.3 Debt-Equity Ratio
INTERPRETATION:
The debt in 11-12 year is high as compared to other year. The liabilities of industry is more that‘s
why the ratio is increasing but it has started decreases in next year. It is fluctuating in all the
years.
1.1
1.15
1.2
1.25
1.3
1.35
1.4
2011 2012 2013
DEBT-EQUITY RATIO
DEBT-EQUITY RATIO

73
4.1.3 TURNOVER OR ACTIVITY RATIO
4.1.3.1 DEBTOR TURNOVER RATIO
Debtor turnover ratio is the relationship between net sales and average debtors. It is also called
account receivable turnover ratio because we debtor and bill receivables' total is used for
following formula
DEBTORS TURNOVER RATIO: DEBTORS
TOTAL SALES
Table 4.4 Debtors Turnover Ratio
YEAR TOTAL SALES DEBTORS DTR
2013-12 6588.62 466.3967 14.12
2012-11 8002.27 527.6967 15.16
2011-10 10193.16 569.8767 17.88

74
Chart 4.4 Debtors Turnover Ratio
INTERPRETATION:
The ratio is fluctuating in all the year. It indicates that hoe quickly the industry is able to collect
their money. From this it is higher in 2011-10 and then it is decreases in next year.
It is decreases which is not a good sign for the company.
0
2
4
6
8
10
12
14
16
18
20
2011 2012 2013
DEBTORS TURNOVER RATIO
DEBTORS TURNOVER RATIO

75
4.1.4 PROFITABILITY RATIO
4.1.4.1 NET PROFIT RATIO
NP ratio is used to measure the overall profitability and hence it is very useful to
proprietors. The ratio is very useful as if the net profit is not sufficient, the firm shall not be able
to achieve a satisfactory return on its investment.higher the net profit ratio, better it is for the
business.
NET PROFIT : NET PROFIT / SALES
Table 4.5Net Profit Ratio
YEAR NET PROFIT SALES NPR
2013-12 493.3433 6588.62 0.07
2012-11 585.63 8002.27 0.07
2011-10 822.96 10193.16 0.08

76
Chart 4.5Net Profit Ratio
INTERPRETATION:
The net profit of the industry is increasing which is good for the company it means company is
doing good business and it is continuously increases which is good for the growth of industry.
0.064
0.066
0.068
0.07
0.072
0.074
0.076
0.078
0.08
0.082
2011 2012 2013
NET PROFIT RATIO
NET PROFIT RATIO

77
4.1.4.2 AVERAGE COLLECTON PERIOD RATIO
Debtors to sales ratio indicate the velocity of debt collection of the firm. In simple worlds, it
indicates the number of time the debtors are turned over during a year. There is no rule of thumb,
which may be used as norms to interpret the ratio, as it may be different from firm to firm,
depending upon the nature of business.
AVERAGE COLLECTION PERIOD: DEBTORS*365
SALES
Table 4.6 Average Collection Period Ratio
YEAR DEBTORS SALES ACP
2013-12 466.3967 6588.62 25.83
2012-11 527.6967 8002.27 24.06
2011-10 569.8767 10193.16 20.40

78
Chart 4.6 Average Collection Period Ratio
INTERPRITATION:-
The average collection period measures the quality of debtors and it helps in analyzing the
efficiency of collection efforts and credit policy adopted by company. As we see from the above
data in the firm average collection period is increases which shows that the firm does have
liberal credit policy but it increases in which describes more liberal credit policy
0
5
10
15
20
25
30
2011 2012 2013
AVERAGE COLLECTION PERIOD
AVERAGE COLLECTIONPERIOD

79
4.2 TREND ANALYSIS:-
4.2.1 NET SALES:-
Table 4.7 Net Sales
YEAR NET SALES
2011 6,588.62
2012 8,002.27
2013 10,193.16
Chart 4.7 Net Sales
Explanation:-
The above graph shows fluctuating trend for net sales. It is declining from 2011 to 2012 but after
that it is increasing trend, so it is good for electronics goods industry to increase in net sales of
companies.
The net sales of Electronics goods industry are shows growing trend.
0
2000
4000
6000
8000
10000
12000
2011 2012 2013
NET SALES
NET SALES
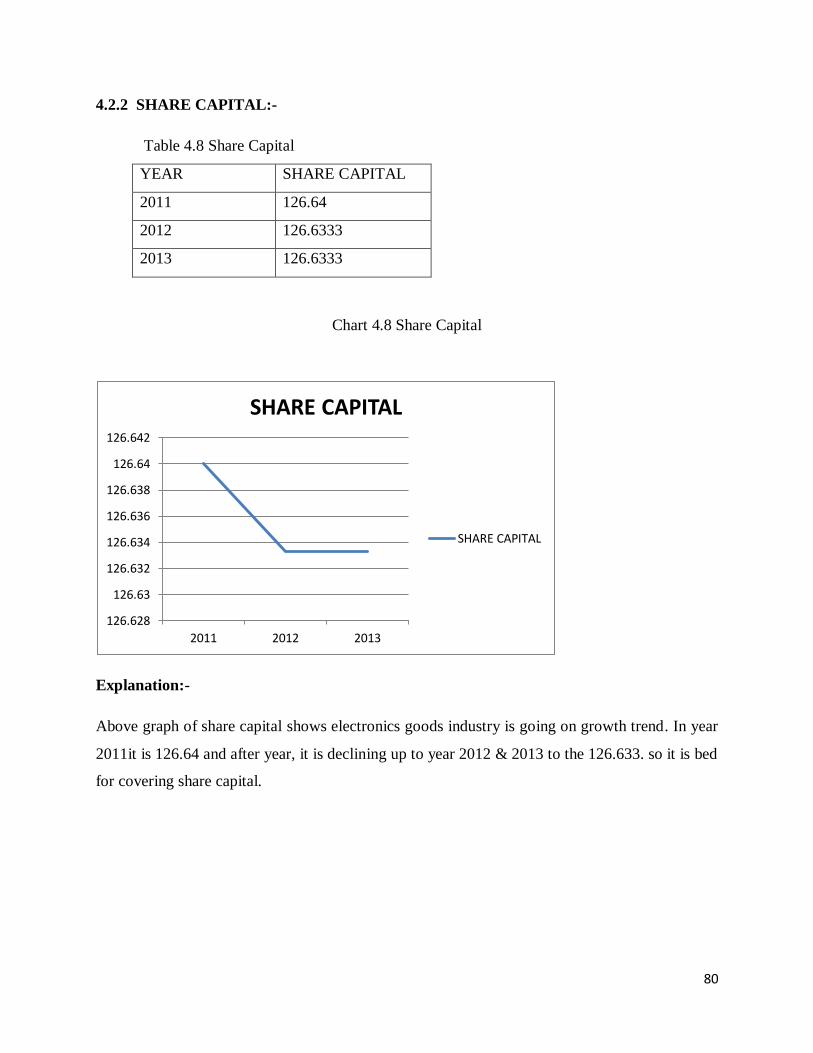
80
4.2.2 SHARE CAPITAL:-
Table 4.8 Share Capital
YEAR SHARE CAPITAL
2011 126.64
2012 126.6333
2013 126.6333
Chart 4.8 Share Capital
Explanation:-
Above graph of share capital shows electronics goods industry is going on growth trend. In year
2011it is 126.64 and after year, it is declining up to year 2012 & 2013 to the 126.633. so it is bed
for covering share capital.
126.628
126.63
126.632
126.634
126.636
126.638
126.64
126.642
2011 2012 2013
SHARE CAPITAL
SHARE CAPITAL
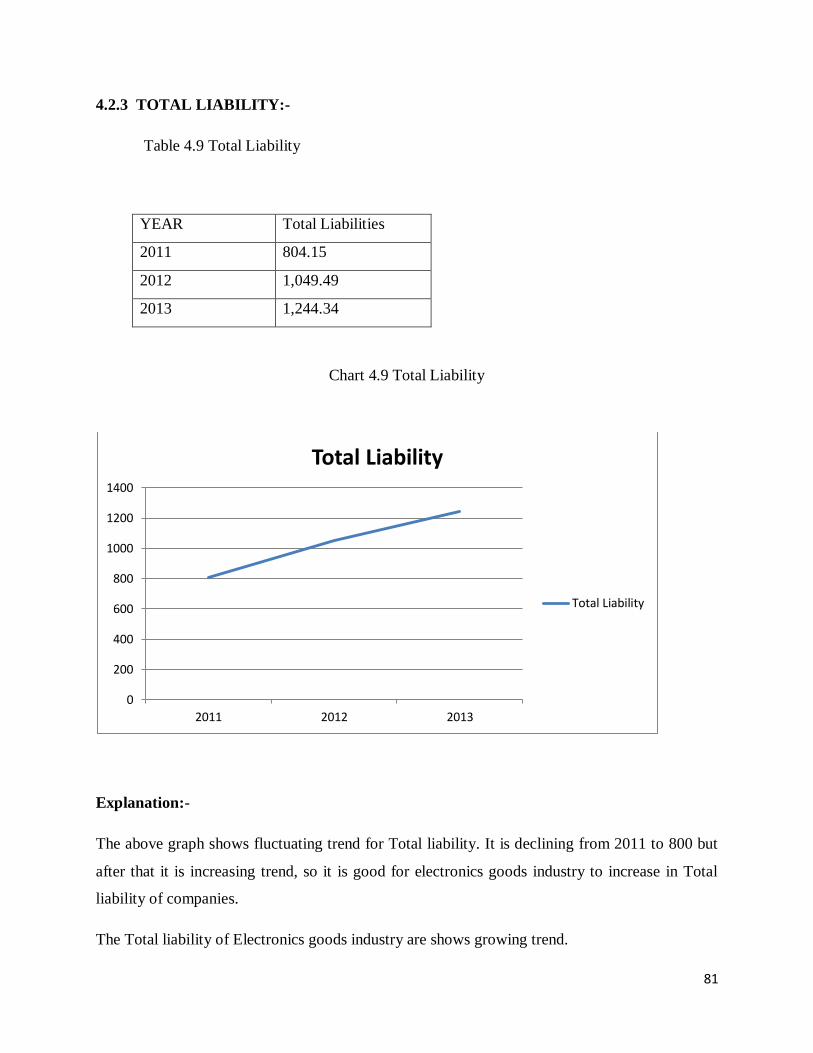
81
4.2.3 TOTAL LIABILITY:-
Table 4.9 Total Liability
YEAR Total Liabilities
2011 804.15
2012 1,049.49
2013 1,244.34
Chart 4.9 Total Liability
Explanation:-
The above graph shows fluctuating trend for Total liability. It is declining from 2011 to 800 but
after that it is increasing trend, so it is good for electronics goods industry to increase in Total
liability of companies.
The Total liability of Electronics goods industry are shows growing trend.
0
200
400
600
800
1000
1200
1400
2011 2012 2013
Total Liability
Total Liability
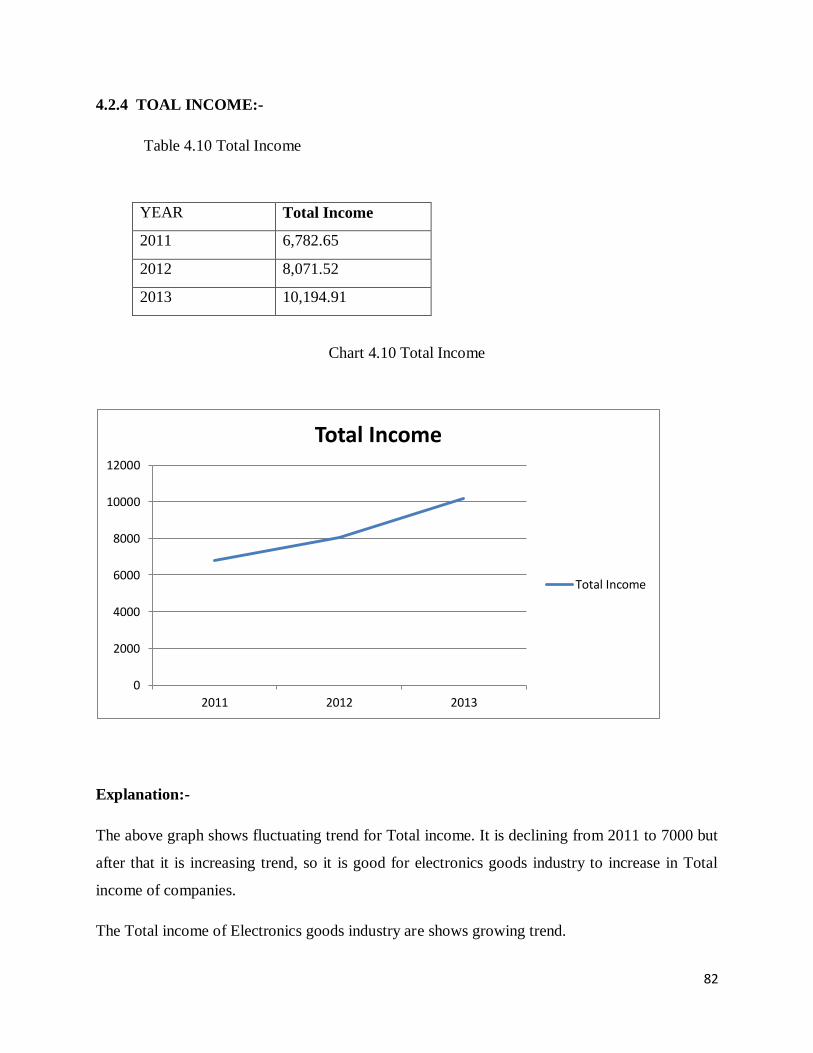
82
4.2.4 TOAL INCOME:-
Table 4.10 Total Income
YEAR Total Income
2011 6,782.65
2012 8,071.52
2013 10,194.91
Chart 4.10 Total Income
Explanation:-
The above graph shows fluctuating trend for Total income. It is declining from 2011 to 7000 but
after that it is increasing trend, so it is good for electronics goods industry to increase in Total
income of companies.
The Total income of Electronics goods industry are shows growing trend.
0
2000
4000
6000
8000
10000
12000
2011 2012 2013
Total Income
Total Income

83
CHAPTER - 5
BUSINESS PLAN

84
5.1 DEALERSHIP OUTLINE
Name, Address and Contact Detail.
Name: ABAJ Electronics
Address: C/o ABAJ Electronics
ABAJ Group,
B.K. Road,
Mehsana - 384002
Gujarat.
Contact Detail: (O) (02262) - 221099, 223099 (M) 9825081415
E-mail ID: [email protected]
Logo of ABAJ Electronics:
Partners :
Patel Hiren
Patel Jayesh
Patel Jagdish
Patel Ashish
Patel Ravi
Prajapati Paresh

85
Authorized Dealership :
Videocon
LG
Nokia
Samsung
Godrej
Panasonic
Nature of Business:
The business nature would be the authorized dealership of multi product and
ABAJ electronic will sells all product includes Television, Home Video, Home Theater
System & Refrigerators etc.
Mission:
To provide Value for Money in the Current Digitalised World of Electronics
Vision
To provide the Best Technology in Quality High End Digital Lifestyle Products at Optimum
Price
Facility Required for multi product showroom
Showroom (Area in which minimum 1200 S.q. Feet can be displayed)
Working Capital
Manpower

86
Products Range
Television Home Video Home Theater System
Video Camera Air Conditioners Compact Digital Camera
Home Audio Washing Machines Smart phones
Accessories Refrigerators Microwave Ovens
Other Competitor Dealers in North Gujarat.
Dealer Name Company
Mehsana Sales Lg, Samsung, Toshiba, Godrej, Panasonic
AtoZ Sales Toshiba, Godrej, Micromax, Videocon,
Nokia
Tanu Electronic Godrej, Micromax, Sony, Videocon
Gallops Sales Lg, Samsung, Toshiba, Nokia,
Umiya Sales Micromax, Toshiba, Nokia, Panasonic
Patel Sales Lg, Toshiba, Nokia
Om Electronic Samsung, Micromax, Godrej

87
5.2 ORGANIZATION CHART OF ABAJ ELECTRONIC
Chart 5.1 Organization chart
Showroom Manager
Cashier Demostration
Helper
Godown
Kipper

88
SALARY STRUCTURE
Designation No of Persons Salary Total Salary Yearly Salary
Showroom Manager 01 15,000 15,000 1,80,000
Demonstration 06 5,000 30,000 3,60,000
Cleaner 02 3,500 7,000 84,000
Computer Opt & Accountant 01 5,000 5,000 60,000
Cashier 01 5,000 5,000 60,000
Godown Kipper 01 4500 4500 54,000
Helper 01 4000 4000 48,000
Total Salary of ABAJ Electronic 8,46,000

89
5.3 SALES OUTLINE
Sales Forecast
Product 1
st Year 2
nd
Year
3rd
Year
4th
Year
5th
Year
Television 51 54 60 63 70
Video Camera 14 16 20 24 25
Home Audio 21 24 28 31 33
Accessories 26 30 32 34 44
Home Video 17 19 25 24 25
Air Conditioners 26 28 30 31 35
Washing Machines 28 31 33 35 39
Refrigerators 53 55 70 80 92
Home Theater System 11 15 18 19 20
Compact Digital Camera 23 25 30 32 35
Smart phones 32 35 40 50 54
Microwave Ovens 15 17 20 25 28
TOTAL 317 349 406 448 500
Marketing Strategies of ABAJ Electronic
Advertising is one of the most common ways to make buyer aware of the new launch of
electronic product, special price available or special offer available on electronic product, etc.
ABAJ Electronic can use below types of marketing Strategies which can increase sales.
Road Shows
Holdings
Paper advertisement in local newspapers.
Promotion Strategies of ABAJ Electronic

90
Promotional Strategies also plays very important role in increasing sales. The ABAJ Electronic
can use below types of Promotional Strategies which can help us.
Special Gifts
Festival Offers
Lucky Draw
Discounts
Special loan scheme (Low Interest Rate or Low EMI)
Exchange Benefits
Dealer Margin
Product category Margin
CK 5%
Good 7%
Better 12%
Best 15%
Note: 15 days payment paid. All Product category @ 2% CN extra.
Sales Facility Available
Home Delivery
Easy Finance Option

91
5.4 FINANCIAL ASPECT
Fixed Assets
Sr. No. Description Amount
1. Fixed Assets
a) Vacuum Cleaner
b) Computers
c) Air conditioner
d) Water purifier
8,000
40000
130000
10000
Total Fixed Assets 1,88,000
Source of Finance at Starting Time
Partner‘s Capital 1,20,00,000
Bank of Baroda Secured Loan @ 13% 70,00,000
Total 1,90,00,000
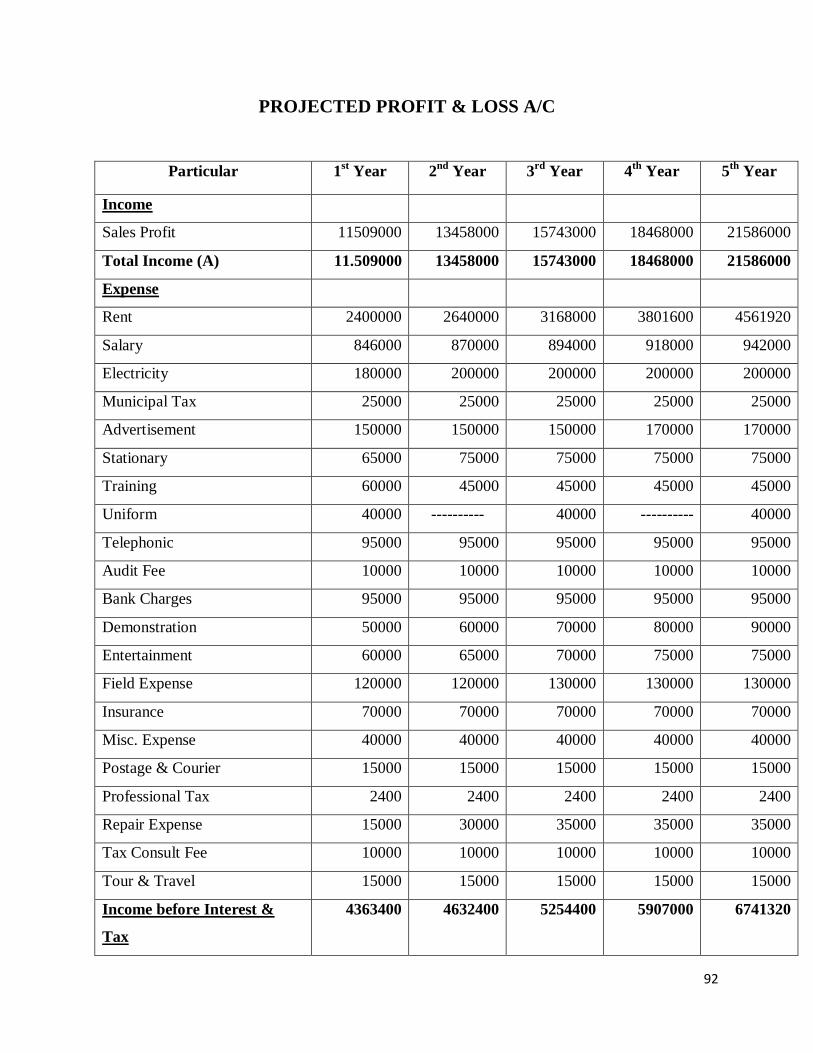
92
PROJECTED PROFIT & LOSS A/C
Particular 1st Year 2
nd Year 3
rd Year 4
th Year 5
th Year
Income
Sales Profit 11509000 13458000 15743000 18468000 21586000
Total Income (A) 11.509000 13458000 15743000 18468000 21586000
Expense
Rent 2400000 2640000 3168000 3801600 4561920
Salary 846000 870000 894000 918000 942000
Electricity 180000 200000 200000 200000 200000
Municipal Tax 25000 25000 25000 25000 25000
Advertisement 150000 150000 150000 170000 170000
Stationary 65000 75000 75000 75000 75000
Training 60000 45000 45000 45000 45000
Uniform 40000 ---------- 40000 ---------- 40000
Telephonic 95000 95000 95000 95000 95000
Audit Fee 10000 10000 10000 10000 10000
Bank Charges 95000 95000 95000 95000 95000
Demonstration 50000 60000 70000 80000 90000
Entertainment 60000 65000 70000 75000 75000
Field Expense 120000 120000 130000 130000 130000
Insurance 70000 70000 70000 70000 70000
Misc. Expense 40000 40000 40000 40000 40000
Postage & Courier 15000 15000 15000 15000 15000
Professional Tax 2400 2400 2400 2400 2400
Repair Expense 15000 30000 35000 35000 35000
Tax Consult Fee 10000 10000 10000 10000 10000
Tour & Travel 15000 15000 15000 15000 15000
Income before Interest &
Tax
4363400 4632400 5254400 5907000 6741320

93
Less: Interest 910000 910000 910000 910000 910000
Income Before Tax 3453400 3722400 4344400 4997000 5831320
less: Tax (33%) 1139622 1228392 1433652 1649010 1924336
Net Profit (After Tax) 2313778 2494008 2910748 3347990 3906984

94
PROJECTED BALANCE SHEET
FINDING 1st Year 2
nd Year 3
rd Year 4
th Year 5
th Year
Partner‘s Capital
Patel Hiren 2000000 2000000 2000000 2000000 2000000
Patel Jayesh 2000000 2000000 2000000 2000000 2000000
Patel Jagdish 2000000 2000000 2000000 2000000 2000000
Patel Ashish 2000000 2000000 2000000 2000000 2000000
Patel Ravi 2000000 2000000 2000000 2000000 2000000
Prajapati Paresh 2000000 2000000 2000000 2000000 2000000
Total Partner’s
Capital
12000000 12000000 12000000 12000000 12000000
Secured
Loan(Bank of
Baroda)
7000000 7000000 7000000 7000000 7000000
Reserves and
Surplus 2313778 2494008 2910748 3347990 3906984
Total
Liabilities
21313778 21494008 21910748 22347990 22906984
Assets
Fixed Assets
Vacuum Cleaner 8,000
Computers 40000
Air conditioner 130000
Water purifier 10000

95
TOTAL
FIXED
ASSETS
1,88,000 159800 135830 115455 98137
Dep. 28200 23970 203745 17318 14720
TOTAL 159800 135830 115455 98137 83417
Current Assets
Cash & Bank 5125000 4505463 6354751 4351420 4556560
Stock 13511280 15015981 14791255 17620498 18302315
TOTAL
CURRENT
ASSETS
18636280 19521444 21146006 21971918 22858875
TOTAL
ASSETS
18796080 19657274 21261461 22070055 22942292

96
PROJECTED CASH FLOW
Particulars 2014-15 2015-16 2016-17 2017-18 2018-19
A. Cash flow of
operating activities
PBIT 4362400 4632400 5254400 5907000 6741320
+ depreciation 28200 23970 20374 17318 14720
-Direct tax 1139622 1228392 1433652 1649010 1924336
Net cash inflow 3250978 772022 3841122 4275308 4831704
B. cash flow of
investing activities
1818000 159800 135830 115455 98137
Net cash outflow 1818000 159800 135830 115455 98137
C. cash flow from
financial activities
Borrowing loan 7000000 7000000 7000000 7000000 7000000
Interest paid 910000 910000 910000 910000 910000
Net cash outflow from
financial activities
609000 609000 609000 609000 609000
A+B+C=Net cash flow
+/-
2041978 322822 4314292 921053 5342567
Current assets 1863628 195214 211460 219719 228588
Net increase / decrease
cash flow
178350 127608 4102832 701334 5113979

97
CHAPTER -6
CONCLUSION
98
-
CONCLUSION
A robust domestic economy, rising disposable income and aspiration levels provide the ideal
backdrop to a sustained long term demand growth for the sector. The Indian domestic market
with annual demand in excess of 1.5 million products has reached the critical mass necessary to
attract investments from global majors. With most major markets facing excess capacity and
demand saturation, the Indian market is likely to remain a key destination for global majors over
the medium term. This however, is likely to lead to some overcapacity in the domestic market
over the medium term, leading to increased competitive pressures. Apart from pricing pressure
that is likely to increase with competition, the rising quality expectations and tightening
regulatory norms on emission and safety are likely to push up cost pressures on OEMs.
During this period, as new players enter the market and players with hitherto weak presence
focus on strengthening their position, the market is likely to get more fragmented. Key
challenges facing new entrants would be establishing a strong service/ distribution network,
which has become increasingly prohibitive due to rising real estate costs in many markets. Going
forward sharing and co-operation on distribution network and service facilities could play a
significant role in rationalizing cost structures. In terms of product launch, while most global
majors are likely to choose from their existing portfolio for launch in India, key to success would
be the ability to incorporate changes necessary to meet Indian preferences and market conditions.
Moreover, certain degree of localization is imperative to be cost competitive. All these factors
also imply significant long term investments that necessitate attaining a minimum volume to
achieve break-even and profitability.
Increased competition leading to fragmentation of the market is likely to take away some of the
benefits of scale arising from growing domestic demand. This apart, reduced shelf life of models
and increased variants in each segment, while supporting consumer demand are likely to be a
significant drag on OEM profitability. The OEMs will need to balance the expectations for new
models with the challenge of extending platform life cycle to stay profitable. The OEMs also
need to work on cost rationalizations through increased sharing of components across platforms

99
and variants, sharing of production facilities (to reduce idle capacity) and focus on low cost
sourcing of components to stay profitable.
The large investments planned by the global players as well as domestic OEMs in light of
integrated facilities being set up in India, the challenge for the players would be to keep break
evens low. While the growth in the domestic electronic market is expected to remain healthy, the
larger choice available to customers could necessitate aggressive selling efforts, which may in
turn result in higher cost per unit and delays in break evens. Some of the electronic players that
are targeting exports market as well as shifting capacities to India from developed countries may
have better capacity utilization and may be able them to break even earlier. While some domestic
market focused electronic manufacturers may face significant competition and pressure on
profits in the short to medium term, the longer term outlook remains positive in the backdrop of
current low penetration levels of electronic in the country.

100
LIMITATION
Industry financial analysis is done by considering our selected companies only.
Analysis is done on the basis of secondary data only.
As there is lack of availability of latest financial data we could not do the ratio analysis of
all the companies for financial analysis.
We are assuming certain method while preparing balance sheet, profit & loss account and
sales forecast.

101
APPENDICES

102
BIBLIOGRAPHY
Books:
Arthur A Thomson Jr, A J Strickland III, John E Gamlbe, Arun K Jain, Crafting and Executing
Strategy, 14th Edition, Tata Mc- Graw hill
I.M. Pandey, financial management, 9th
edition, Himalaya publication
List of Websites:
http://www.elcina.com/policy.asp
www.cci.in
www.wikipedia.org
http://smallb.in/sites/default/files/knowledge_base/reports/electronics_industry_in_india.pdf
http://www.indianmirror.com/indian-industries/electronics.html
http://www.slideshare.net/ghaayathri/consumer-electronics-in-india-an-analysis
http://en.wikipedia.org/wiki/Electronics
http://www.decision.eu/doc/brochures/exec_wei_current.pdf
http://www.calce.umd.edu/general/AsianElectronics/pref_ind.htm
http://www.eicc.info/
http://www.businessdictionary.com/definition/brown-goods.html
http://www.dare.co.in/news/others/cut-duties-on-electronics-hardware-to-12-from-30-
assocham.htm

103
―India Consumer Electronics Report Q4 2009‖ By Business Monitor India
China and India‘s Electrical and Electronics Industries : A Comparison of Market Structures By
Koichiro Kimura • Technopak, India
―Impact of Organized Retailing on the Unorganized Sector‖ Mathew Joseph, Nirupama
Soundararajan, Manisha Gupta, Sanghamitra Sahu (May 2008)
AT Kearney Report 2009
Indian retail: on the fast track and time for bridging capability gaps – KPMG Report
India Calling 2009 KPMG Report
www.univercell.in
www.themobilestore.in
www.viveks.com
www.cromaretail.com
www.next.co.in

104
PROJECTED PROFIT & LOSS A/C
YEAR 2011 2012 2013
INCOME :
Sales Turnover 6,907.83 8,012.38 10,205.48
Excise Duty 319.2133 10.10667 12.32
Net Sales 6,588.62 8,002.27 10,193.16
Other Income 69.29333 69.16667 1.213333
Stock Adjustments 124.74 0.08 0.54
Total Income 6,782.65 8,071.52 10,194.91
EXPENDITURE :
Raw Materials 4,469.26 2,111.51 101.64
Power & Fuel Cost 8.65 0.17 0.23
Employee Cost 80.94 1.64 2.75
Other Manufacturing Expenses 64.88 0.38 0.69
Selling and Administration Expenses 664.03 3.79 5.04
Miscellaneous Expenses 1,098.24 5,672.99 9,518.51
Less: Pre-operative Expenses Capitalised 16.22 0.00 0.00
Total Expenditure 6,369.78 7,790.48 9,628.85
Operating Profit 412.87 281.04 566.06
Interest 9.10 10.06 3.57

105
Gross Profit 403.77 270.97 562.49
Depreciation 84.31 112.76 135.38
Profit Before Tax 319.46 158.21 427.11
Tax 115.35 64.37 208.08
Fringe Benefit tax 1.61 0.02 0.00
Deferred Tax -17.17 1.53 -22.93
Reported Net Profit 219.68 92.29 241.96
Extraordinary Items 0.24 0.30 0.01
Adjusted Net Profit 219.43 91.99 241.96
Adjst. below Net Profit 0.00 0.00 0.03
P & L Balance brought forward 273.67 493.34 585.63
Statutory Appropriations 0.00 0.00 0.00
Appropriations 0.00 0.00 4.66
P & L Balance carried down 493.3433 585.63 822.96
Dividend 0.00 0.00 3.50
Preference Dividend 0.00 0.00 0.00
Equity Dividend % 0.00 0.00 7
Earnings Per Share-Unit Curr 13.94667 7.133333 16.84
Earnings Per Share(Adj)-Unit Curr 0.00 0.00 0.00
Book Value-Unit Curr 49.22333 56.36333 72.5

106
PROJECTED BALANCE SHEET
SOURCES OF FUNDS: 2011 2012 2013
Share Capital 126.64 126.6333 126.6333
Reserves Total 537.89 630.19 868.11
Equity Share Warrants 0.00 0.00 0.00
Equity Application Money 0.00 0.00 0.00
Total Shareholders Funds 664.53 756.83 994.74
Secured Loans 102.26 0.00 0.00
Unsecured Loans 37.35667 179.7 51.33333
Total Debt 139.6167 179.7 51.33333
Other Liabilities 0.00 112.9667 198.2667
Total Liabilities 804.15 1,049.49 1,244.34
APPLICATION OF FUNDS : 0.00 0.00 0.00
Gross Block 675.0767 923.13 1,082.28
Less : Accumulated Depreciation 389.4167 481.3167 525.7967
Less:Impairment of Assets 0.00 0.00 0.00
Net Block 285.66 441.8133 556.4833
Lease Adjustment 0.00 0.00 0.00

107
Capital Work in Progress 85.99333 11.99 8.64
Investments 0.00 0.00 0.00
Current Assets, Loans & Advances 0.00 0.00 0.00
Inventories 816.75 901.60 1,183.34
Sundry Debtors 466.3967 527.6967 569.8767
Cash and Bank 162.31 114.3433 339.4133
Loans and Advances 262.08 326.8433 302.91
Total Current Assets 1,707.54 1,870.48 2,395.54
Less : Current Liabilities and
Provisions
Current Liabilities 1,207.91 1,266.90 1,635.00
Provisions 112.7233 83.13 165.2467
Total Current Liabilities 1,320.64 1,350.03 1,800.25
Net Current Assets 386.9 520.4567 595.29
Miscellaneous Expenses not written off 0.00 0.00 0.00
Deferred Tax Assets 48.73 46.26667 67.90
Deferred Tax Liability 3.13 0.00 0.10
Net Deferred Tax 45.59667 46.26667 67.80
Other Assets 0.00 28.96667 16.13
Total Assets 804.15 1,049.49 1,244.34
Contingent Liabilities 217.20 97.68 129.59


![Porters Strategy[1]](https://img.pdfslide.us/doc/110x75/577cdebb1a28ab9e78afb51e/porters-strategy1.jpg)