Embed Size (px)
Citation preview
A Research-Based Response to Federal Non-Regulatory Guidance on Growth Models
Mark EhlertCory KoedelEric Parsons
Michael Podgursky
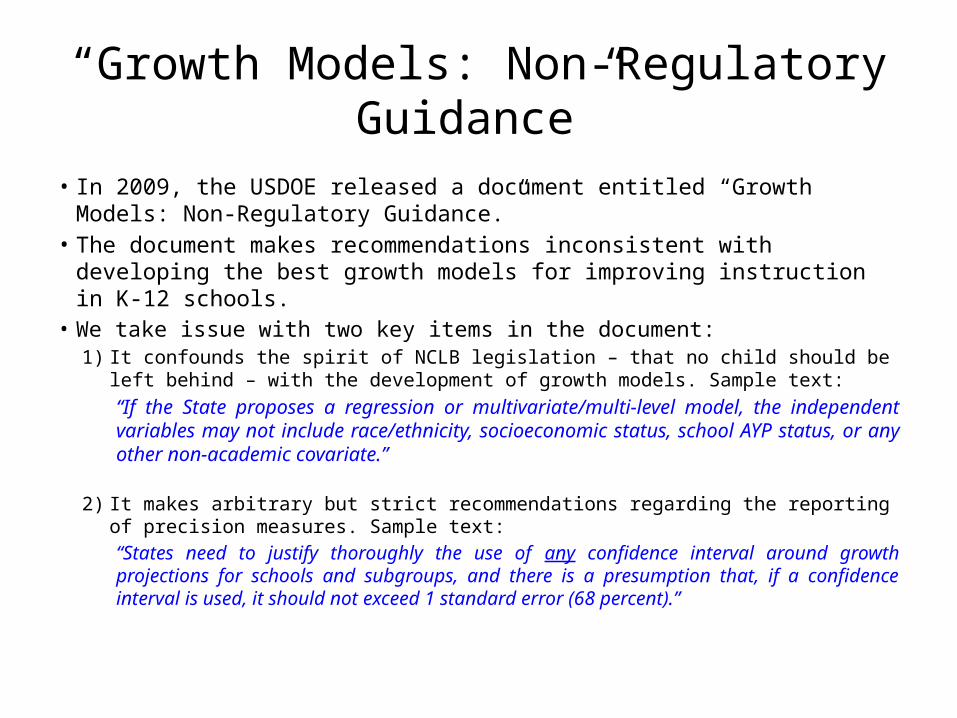
“Growth Models: Non-Regulatory Guidance”
• In 2009, the USDOE released a document entitled “Growth Models: Non-Regulatory Guidance.”
• The document makes recommendations inconsistent with developing the best growth models for improving instruction in K-12 schools.
• We take issue with two key items in the document:1) It confounds the spirit of NCLB legislation – that no child should be left behind – with
the development of growth models. Sample text:“If the State proposes a regression or multivariate/multi-level model, the independent variables may not include race/ethnicity, socioeconomic status, school AYP status, or any other non-academic covariate.”
2) It makes arbitrary but strict recommendations regarding the reporting of precision measures. Sample text:
“States need to justify thoroughly the use of any confidence interval around growth projections for schools and subgroups, and there is a presumption that, if a confidence interval is used, it should not exceed 1 standard error (68 percent).”
Motivation
• Growth models are increasingly being incorporated into district, school and teacher evaluations across the United States.
• The question of how to model student test-score growth has resulted in lively policy debates– This work came out of these debates in Missouri, where the Missouri
Department of Elementary and Secondary Education put together a well-regarded but polarized “Growth Model Technical Advisory Panel.”
• We argue that most of the discussions surrounding model choice, including those that occurred during the Missouri TAP meetings, are starting in the wrong place(s). – In particular, the guiding question for these discussions should be:
“What are the objectives of the evaluation system?”
Background (Anecdotal)How this works:• An SEA or LEA that is interested in modeling test-score growth will identify
“experts” in the field to advise in the construction of a growth model.• These experts seem to come from one of two camps.
– Camp 1: “Causal” modelers (this is my group), who do work along the lines of trying to identify the most and least effective teachers so that we can quantify the variance in teacher quality, predict which teachers will be effective, evaluate how interventions affect teacher performance (e.g., professional development), etc. For all of the main research questions regarding teacher quality, causal estimates are desirable.
– Camp 2: Sparse modelers, who are represented in the policy space primarily by advocates of the Student Growth Percentiles (SPGs) approach. Sparse modelers are not at all interested in attributing causality to their estimates, and put forth that their estimates are “descriptive” and useful only for stimulating further investigation and discussion (Betebenner, 2011).
• Neither camp is right for the job!
Summary of Findings• We argue that the three key objectives of an evaluation system in
education are:• Elicit optimal effort from agents• Provide useful performance signals to educational actors• Avoid exacerbating pre-existing inequities in the labor markets faced by
advantaged and disadvantaged schools• Given these objectives, the proper growth model for use in
evaluation systems is neither the sparse model nor the “causal” model. Instead, it is what we call the “proportional” model (or “flat-lined” model).
• “Selecting Growth Models for School and Teacher Evaluations” (Ehlert, Koedel, Parsons, Podgursky)
The Choice Set
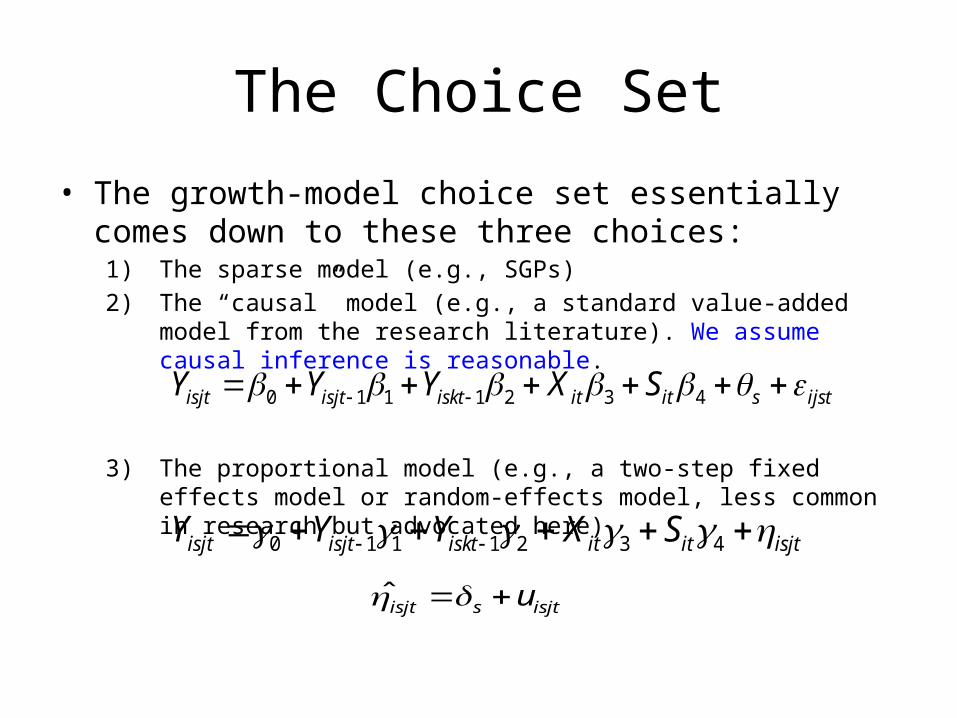
• The growth-model choice set essentially comes down to these three choices:
1) The sparse model (e.g., SGPs)2) The “causal” model (e.g., a standard value-added model from the research
literature). We assume causal inference is reasonable.
3) The proportional model (e.g., a two-step fixed effects model or random-effects model, less common in research but advocated here)
0 1 1 1 2 3 4isjt isjt iskt it it s ijstY Y Y X S
0 1 1 1 2 3 4isjt isjt iskt it it isjtY Y Y X S
ˆisjt s isjtu
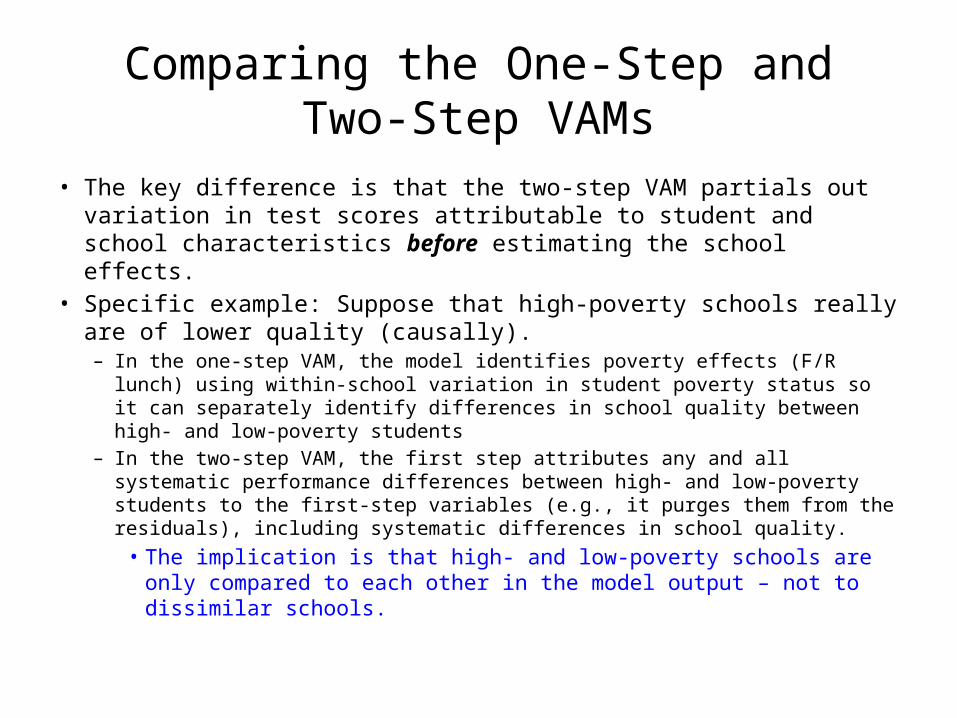
Comparing the One-Step and Two-Step VAMs
• The key difference is that the two-step VAM partials out variation in test scores attributable to student and school characteristics before estimating the school effects.
• Specific example: Suppose that high-poverty schools really are of lower quality (causally). – In the one-step VAM, the model identifies poverty effects (F/R lunch) using
within-school variation in student poverty status so it can separately identify differences in school quality between high- and low-poverty students
– In the two-step VAM, the first step attributes any and all systematic performance differences between high- and low-poverty students to the first-step variables (e.g., it purges them from the residuals), including systematic differences in school quality. • The implication is that high- and low-poverty schools are only
compared to each other in the model output – not to dissimilar schools.
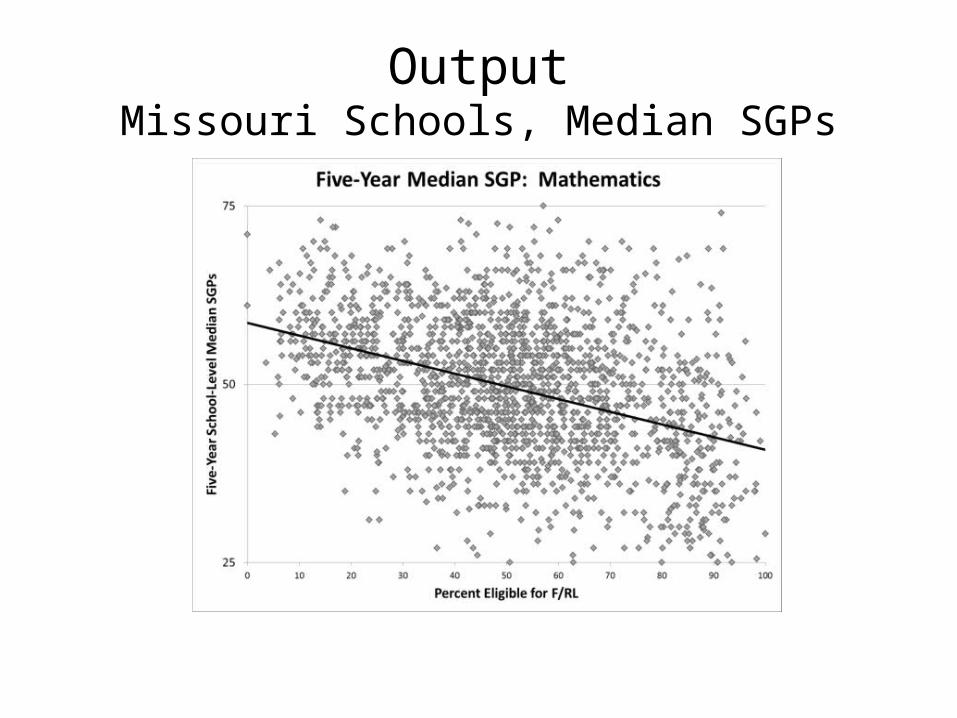
OutputMissouri Schools, Median SGPs
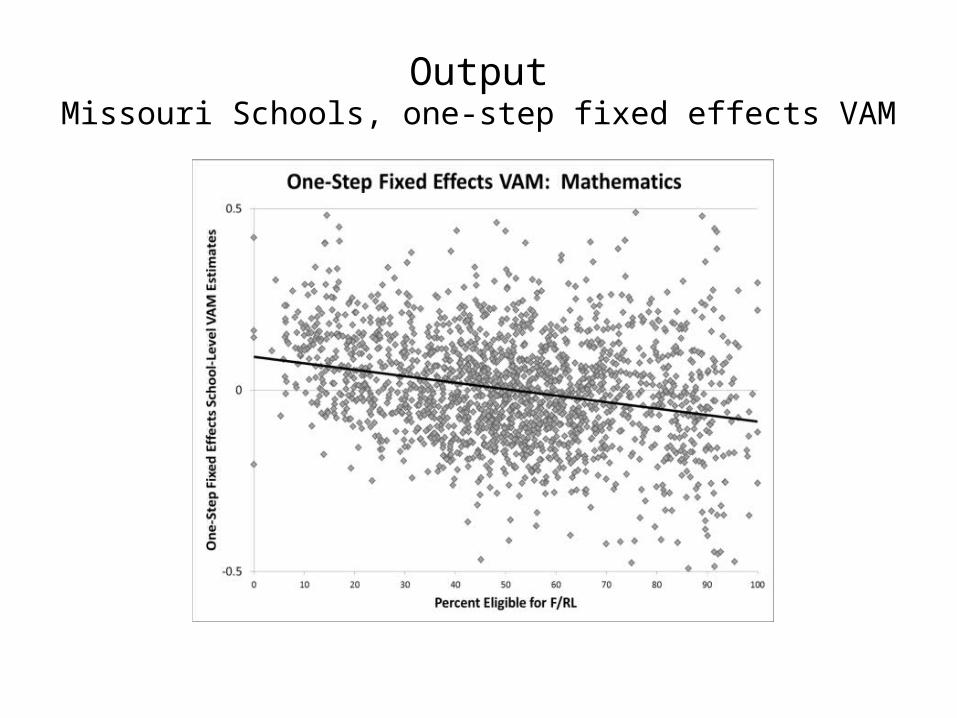
OutputMissouri Schools, one-step fixed effects VAM
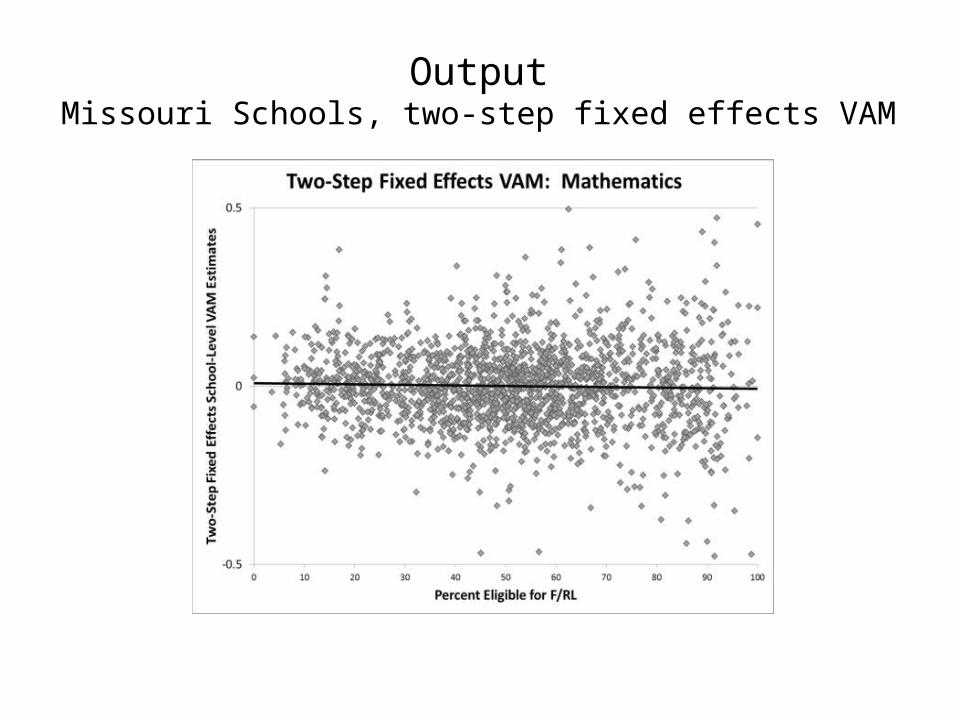
OutputMissouri Schools, two-step fixed effects VAM
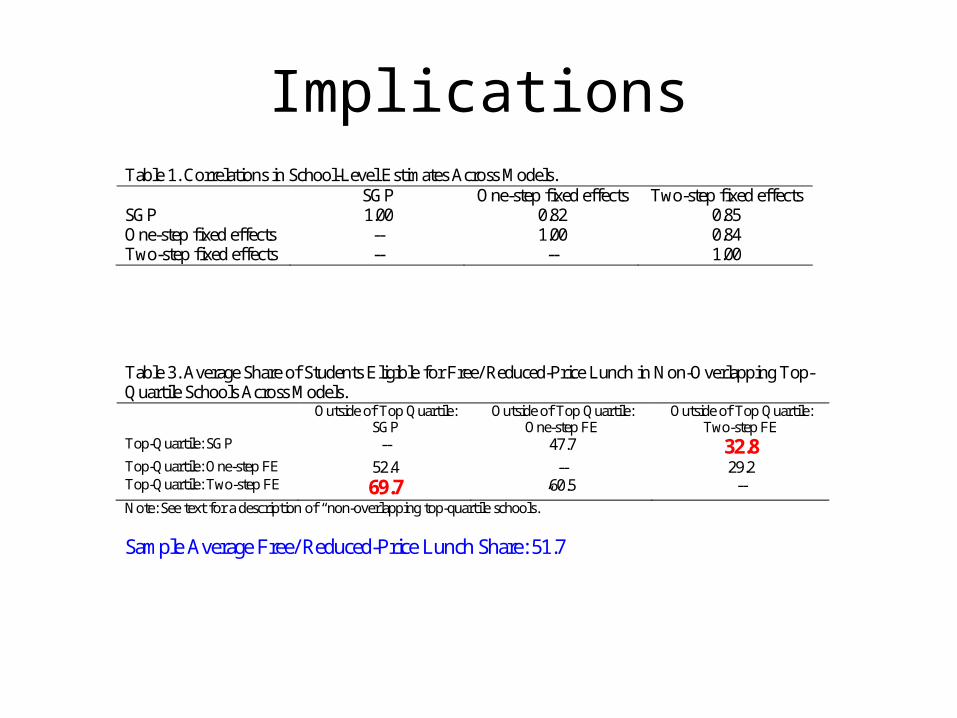
ImplicationsTable 1. Correlations in School-Level Estimates Across Models.
SGP One-step fixed effects Two-step fixed effects SGP 1.00 0.82 0.85 One-step fixed effects -- 1.00 0.84 Two-step fixed effects -- -- 1.00 Table 3. Average Share of Students Eligible for Free/ Reduced-Price Lunch in Non-Overlapping Top-Quartile Schools Across Models.
Outside of Top Quartile: SGP
Outside of Top Quartile: One-step FE
Outside of Top Quartile: Two-step FE
Top-Quartile: SGP -- 47.7 32.8 Top-Quartile: One-step FE 52.4 -- 29.2 Top-Quartile: Two-step FE 69.7 60.5 -- Note: See text for a description of “non-overlapping top-quartile schools.” Sample Average Free/ Reduced-Price Lunch Share: 51.7
How do we choose?
• There is no obvious “right” answer; the models are all equally valid from a statistical perspective.– The issue is that the models are doing different
things.• It is up to policymakers to figure out what they want
the model to tell them.
Objective #1: Elicit Optimal Educator Effort
• Barlevy and Neal (2012) cover this issue extensively.
• There is also a long literature in economics, outside of the education-evaluation context, that is very clear on how to design evaluation systems when some competitors are at an inherent disadvantage (e.g., see Schotter and Weigelt (1992), who study this issue in the context of affirmative action policy) .
• A central lesson from these studies is that the right signal must be sent to agents in different circumstances to elicit optimal effort. This signal need not be a direct measure of absolute productivity; instead, it should be an indicator of performance relative to equally-circumstanced peers.
• This is precisely what the proportional model does (based on observable circumstances).
Objective #1: Elicit Optimal Educator Effort
• Limitation: There is some evidence that the effort response margin in education in the United States is weak (Springer et al., 2010; TNTP, 2012)– This will perhaps limit the value of the effort gains
associated with the proportional model.
Objective #2: Provide useful performance signals
• It is a common conventional wisdom that growth-model output doesn’t help educational actors improve. Is this really true?– Growth model output can:
• Encourage effective schools (districts/teachers) to continue to refine and augment existing instructional strategies
• Serve as a point of departure for interventions/overhauls in ineffective schools (districts/teachers)
• Facilitate productive educator-to-educator learning by pairing low- and high-performing schools (districts/teachers).
– The signaling value of an evaluation system is particularly important when it is difficult for individual schools (districts/teachers) to assess their performance, and the performance of others, accurately.
Objective #2: Provide useful performance signals
• We argue that the most useful performance signals come from the two-step “proportional” model.
• This is true even under the maintained assumption that the one-step VAM produces causal estimates.
• A key reason is that the causal estimates from the one-step VAM do not account for the counterfactual.– Example: Disadvantaged schools face weaker educator labor markets
(Boyd et al., 2005; Jacob, 2007; Koedel et al., 2011; Reininger, 2012)
• Sparse models provide the least-useful performance signals (not controversial: acknowledged in SGP literature)
Example
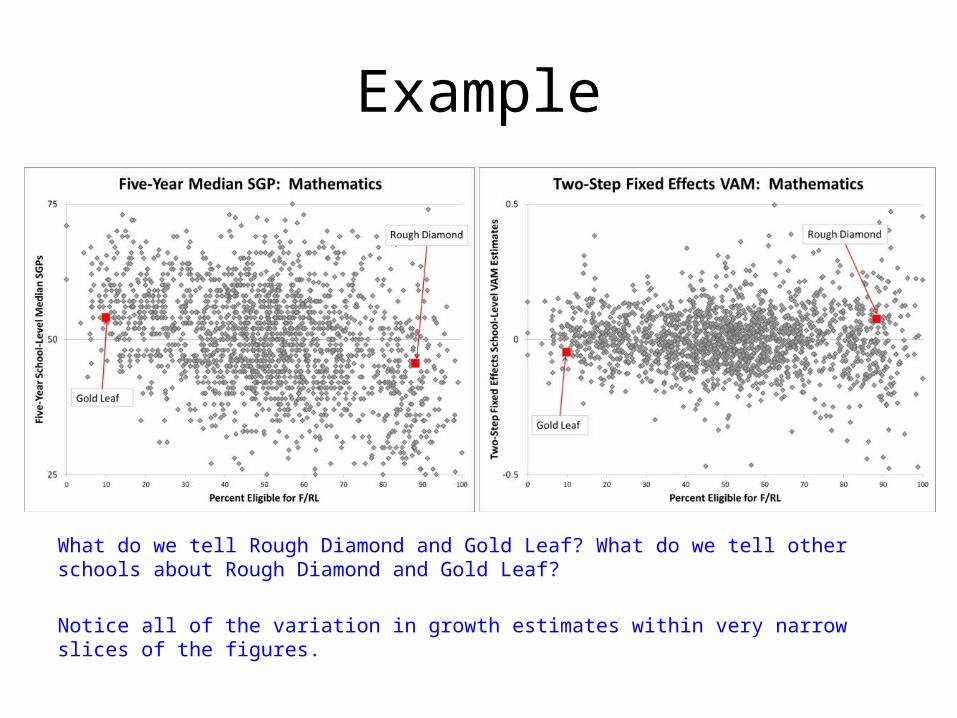
What do we tell Rough Diamond and Gold Leaf? What do we tell other schools about Rough Diamond and Gold Leaf?
Notice all of the variation in growth estimates within very narrow slices of the figures.
Objective #3: Labor-market inequities
• The labor-market struggles faced by disadvantaged schools have been well-documented (Boyd et al., 2005; Jacob, 2007; Koedel et al., 2011; Reininger, 2012).
• As stakes become attached to school rankings based on growth models, systems that disproportionately identify poor schools as “losers” will make positions at these schools even less desirable to prospective educators.
Summary thus far…
• We identify three key objectives of an evaluation system in education:1. Elicit optimal effort from agents2. Provide useful performance signals to educational actors3. Avoid exacerbating pre-existing inequities in the labor
markets faced by advantaged and disadvantaged schools
• When one considers these key objectives, the “proportionality” feature of the two-step model is desirable along all fronts.
But what about…• The fact remains that schools serving disadvantaged students really
do have lower test scores, and lower unconditional growth, than schools serving advantaged students.
• There seems to be general concern that this information will be hidden if we construct proportional growth models.
• Our view is that this concern is largely misguided. – A model along the lines of the two-step VAM can be adopted in conjunction
with reporting on test scores levels, and in fact, state- and district-level evaluation systems that incorporate test-score growth also typically have a test-score-levels component. • The reporting on test-score levels will allow state administrators and policymakers to
clearly see absolute differences in achievement across schools, regardless of which growth model is adopted. A poor school that is performing well, like Rough Diamond, can be encouraged to continue to refine and improve an already-effective instructional strategy (in terms of raising test scores compared to similar schools) but still be reminded that their students are not scoring sufficiently high relative to an absolute benchmark. The latter information need not disappear in any evaluation framework.
Concluding Remarks
• Growth models are quickly (very quickly) moving from the research space to the policy space.– The policy uses for growth models are not the same as the research
uses for growth models.
• Starting with the right question is important: “What are the objectives of the evaluation system?”
• Beginning with this question, in our view, leads to a clear answer: a “proportional” growth model is best-suited for use in educational evaluation programs for districts, schools and teachers.