Embed Size (px)
Citation preview
1
A Report to the Iowa Department of Natural Resources
The Iowa Lakes Valuation Project 2014
Summary and Findings
Hocheol Jeon, Yongjie Ji, and Catherine L. Kling
February 2016
The Iowa Lakes Valuation Project is an ongoing study to collect information on how, where, and when Iowans
make use of the state’s recreational lakes. The project allows us to properly analyze and evaluate the return on
investment for water quality improvement. In this report, we summarize and interpret the main findings of the
2014 data collection component of the overall study. The report is organized as follows: Section I provides the
overview of the Iowa Lakes Valuation Project; Section II describes the survey design and implementation for the
2014 data collection; and, Section III shows summary results and analysis of the 2014 Iowa Lakes Valuation
Project.
I. Overview of the Iowa Lakes Valuation Project
The Iowa Lakes Valuation Project is an ongoing economic study of the use of Iowa’s lakes and the value Iowans
place on water quality. The Limnology Laboratory at Iowa State had completed a five-year study that provided
the Iowa Department of Natural Resources with a lake database that included biological analysis, watershed GIS,
and water chemistry for 132 recreational lakes across the state. In 2002, the Center for Agricultural and Rural
Development, the Departments of Economics, Evolutionary Ecology and Organismal Biology, and the Limnology
Laboratory at Iowa State worked together to create the Iowa Lakes Valuation Project, which takes the information
one step further to determine use and valuation information for the same set of lakes over a comparable time
period.
2
The economic use and valuation information for the study was collected via a survey of Iowa households. The
survey, conducted in 2002, 2003, 2004, 2005, 2009, and 2014, is jointly funded by the Iowa DNR and the U.S.
Environmental Protection Agency. The first year of data collection focused on providing a baseline of information
on use and attitudes toward water quality measures and economic development. The second through fifth years of
data collection also included information on use and provided scenarios to survey respondents to elicit their
willingness to pay for quality improvements. A website (http://www.card.iastate.edu/lakes/), created with funding
from the Iowa DNR, has been developed that allows potential recreationists and policymakers to easily access the
summary information on lake usage and water quality.
This report provides information on the 2014 data.
II. Design and Implementation of the Iowa Lake Survey
The 2014 Iowa Lakes Survey was implemented in two ways. As in previous years, the survey was sent by mail
and respondents returned it following instructions included in the appendix. CARD also created a web version
(including mobile version with QR code) to increase participation rates and ease of access to the survey.
The 2014 Iowa Lakes Survey consists of two main sections. The first section asked respondents about their
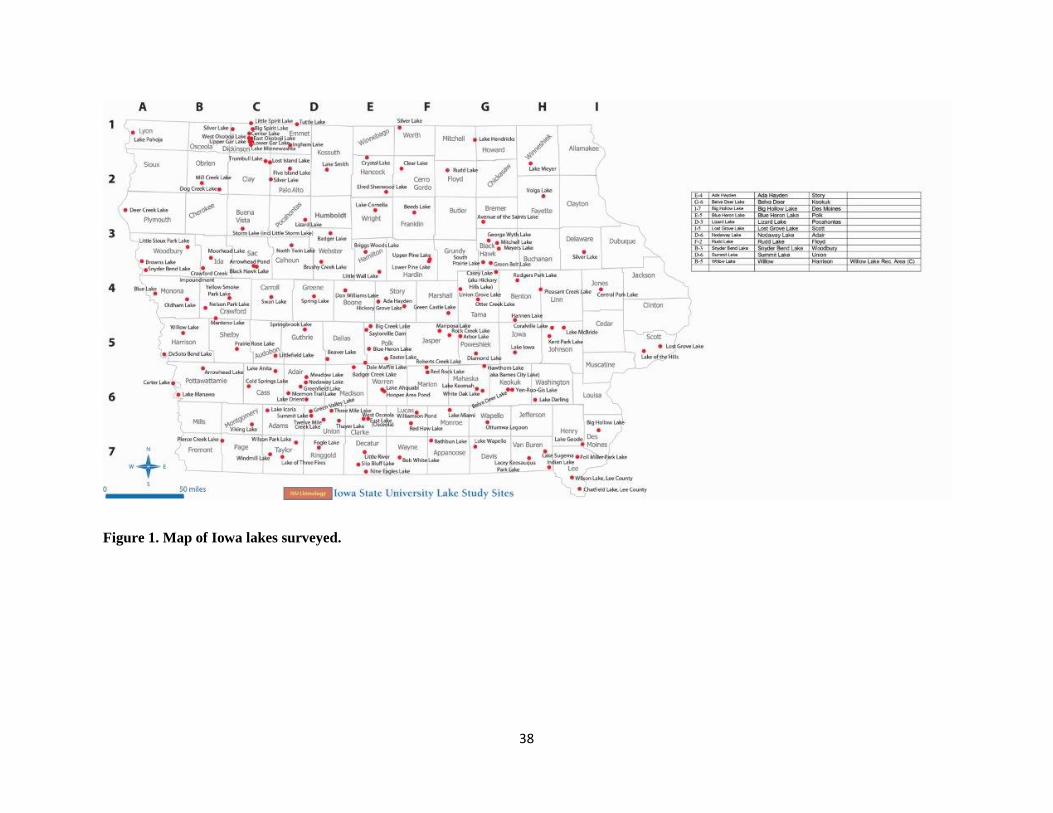
household lake visitation patterns during the 2014 calendar year. Respondents were provided with a map (Figure
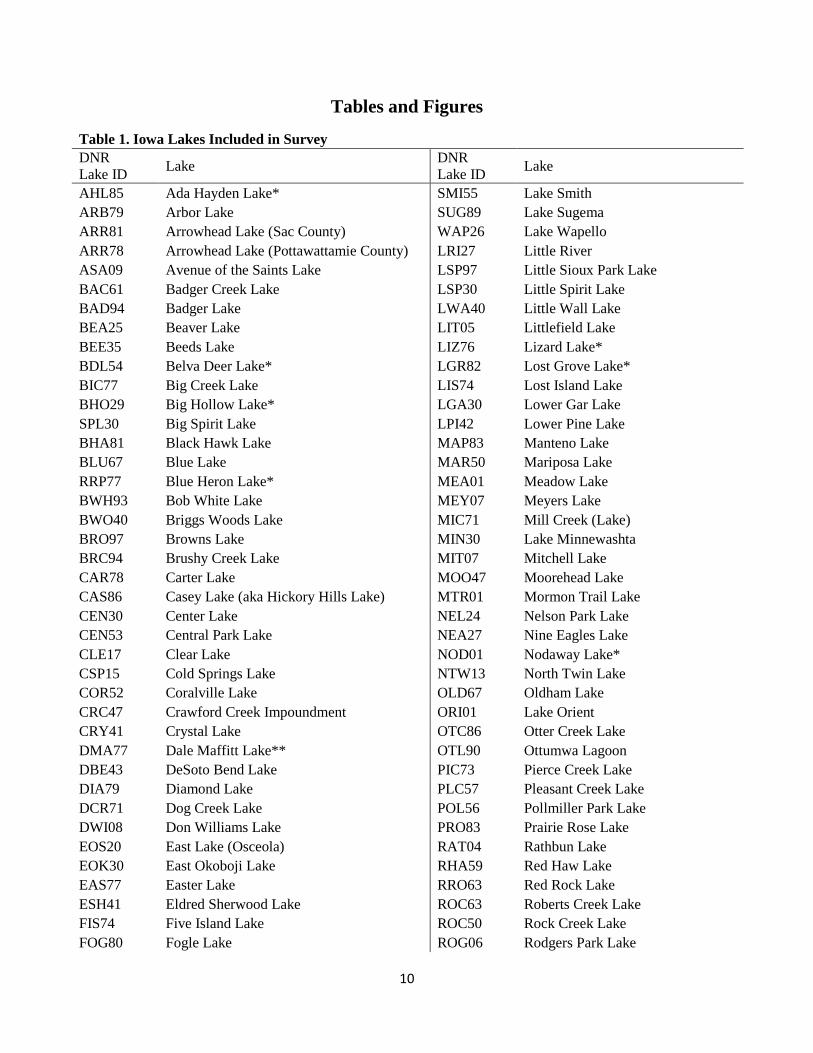
1) and asked to report the number of trips (including overnight trips) to any of the 139 DNR-identified lakes
(shown in Table 1).1 Respondents were also asked which activities their household participated in during lake
visits and visitation patterns to lakes in bordering states. In addition, respondents were asked several questions
about which social media sites (Facebook, Twitter, etc.) or informational websites (such as the DNR website) they
use for sharing or finding information about lakes.
1 All tables and figures are located at the end of the report.
3
In the second section, sociodemographic information was gathered from respondents, including age, years living
in Iowa, gender, education, household size, employment status, income, and whether the individual owned a boat
in 2014.
An initial survey design with each of these components was completed in early fall of 2014. Based on that design,
we constructed and tested a web version of the survey. In October, we fine-tuned the wording of the survey to
ensure that questions and instructions were clear to potential survey respondents; moreover, we created and
checked an individually unique password system to control web access to the survey.
The Iowa Lakes Valuation Projects had already been conducted in 2002–2005 and 2009, and we maintained the
sample randomly selected in previous years to measure the change of visitation patterns by panel data set. Some
households, however, were not available to participate in subsequent years. Moreover, our project tries to reflect
current Iowans’ lake visitation patterns using representative samples, but using prior samples does not fully
represent Iowa’s current households, as older households were a higher portion of the prior sample. Therefore, we
merged the new wave of data with prior waves to provide comprehensive coverage of Iowan households. The
final survey was mailed to 6,885 Iowa households—3,464 Iowa residents that responded to prior surveys and
3,421 new randomly selected Iowa residents. Sample households were sent a packet that contained the survey, a
map of Iowa lakes, a cover letter explaining the purpose and timeframe of the study, a self-addressed, stamped
envelope for the completed survey, and a web address, QR code, and unique password to access the web survey.
When respondents returned their survey via mail with a copy of the payment slip completed, they were sent a
check for $12 as compensation for their time. When respondents filled out the web survey, they were sent a check
for $15, because online submissions reduce the implementation cost. Respondents who did not return the survey
within 50 days were sent a postcard reminder. If they still did not respond after another month, they were sent a
replacement packet containing the complete set of materials. One month after mailing replacement packets, a
second postcard reminder was sent to those who had still not responded.
Of the 6,885 surveys sent out, 72 were returned by the postal service as undeliverable because the addressee was
deceased, had moved, or refused the mailing, and 25 were a duplicate sample. Ultimately, there were 2,058 mail
4
respondents and 1,515 online respondents for our data set. However, 12 respondents completed both the web
version and returned a paper copy in the mail—in these cases, we used only answers from the web version.
Therefore, there are 3,555 valid household respondents, generating a 52.4% response rate among deliverable
surveys.
III. Survey Results
In this section, we summarize the results of the 2014 Iowa Lake valuation survey, and report the estimated usage
statistics. In addition, we have constructed an interactive usage map for each surveyed lake based on survey
results (http://www.card.iastate.edu/ag_policy_review/f15-lakes/).
III.1. Lake Usage of Respondents
On average, a large proportion of respondents reported taking at least one single-day trip during the 2014 calendar
year. Approximately 60% of respondents reported at least one single-day trip, while about 22% reported taking at
least one overnight trip. The average number of single-day trips by all respondents was 8.6, and the average
number of single-day trips by households that reported taking at least one trip was 14.4. The average number of
overnight trips by all respondents was 1.7, and 7.7 among respondents taking at least one overnight trip.
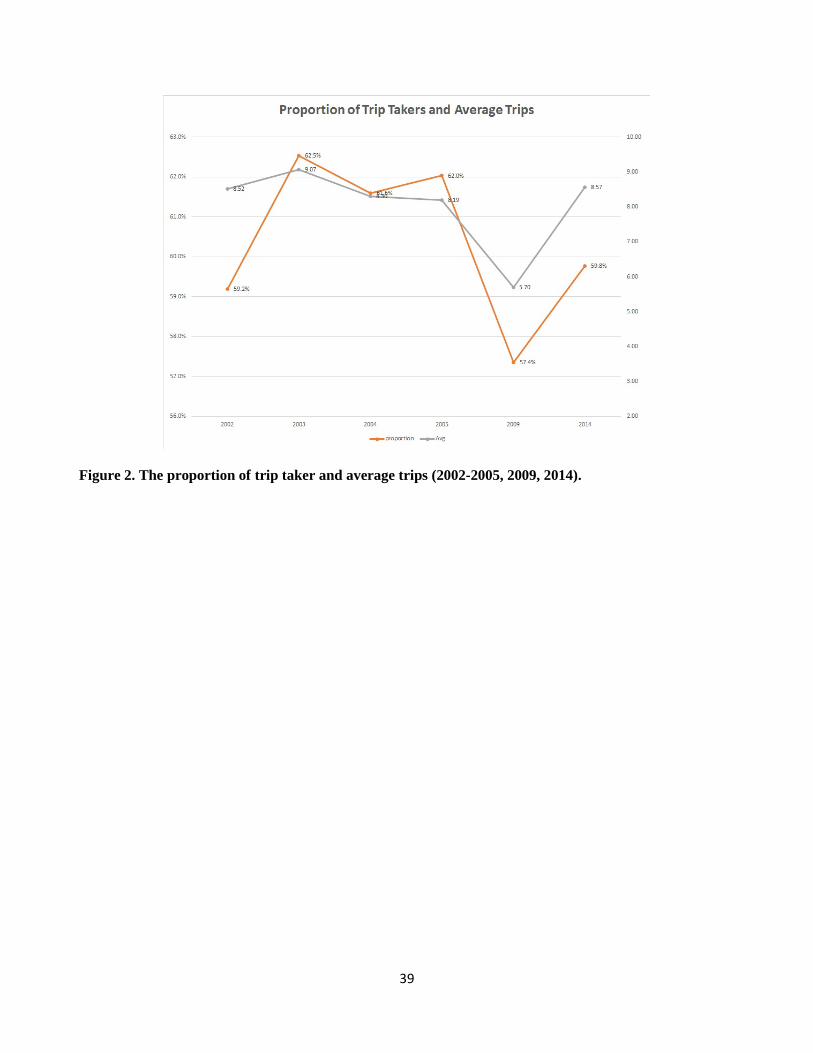
Figure 2 shows the trend of the proportion of respondents reported taking at least one single-day trip and average
trips. Even though the lowest proportion and average trips are reported in 2009, the proportions fall in the range of
57.4% to 62.5%. In addition, the average trips also show similar patterns.
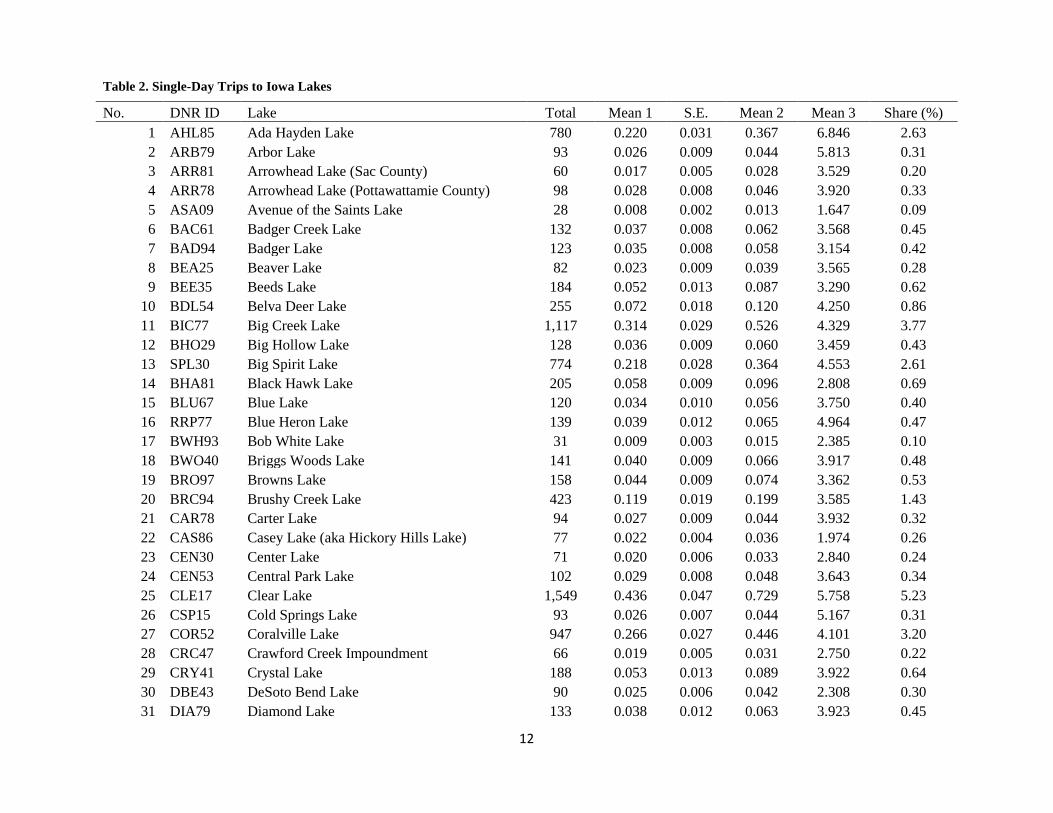
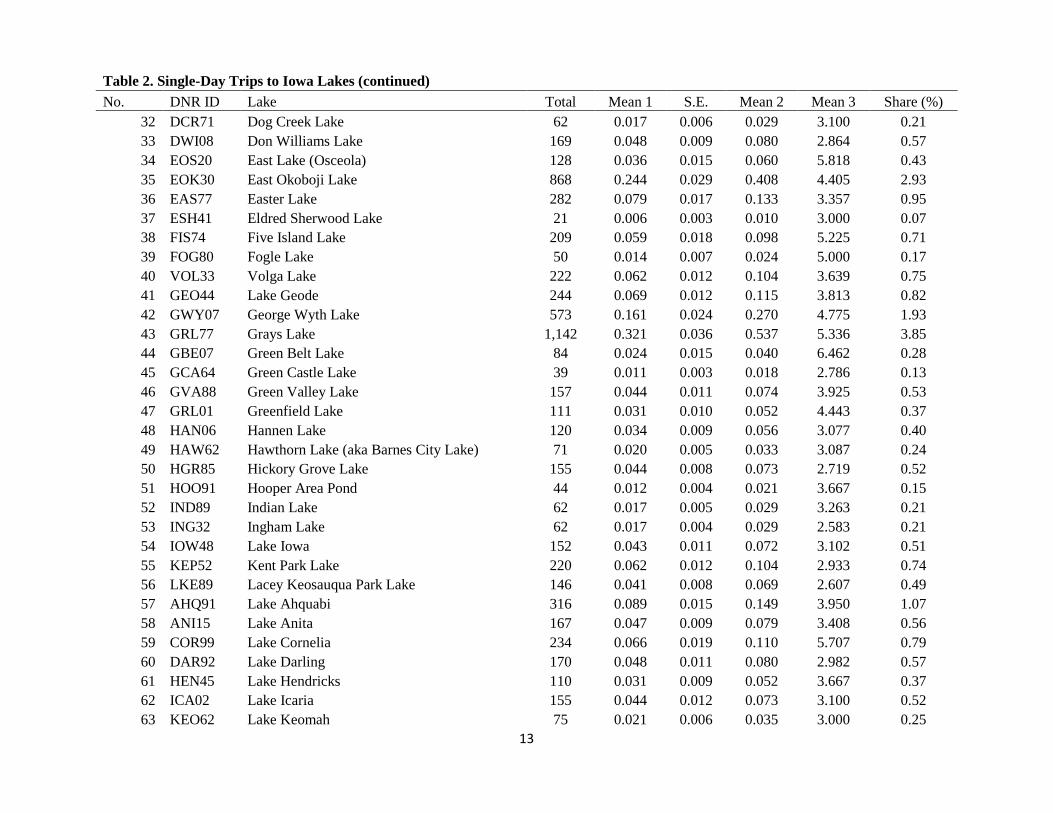
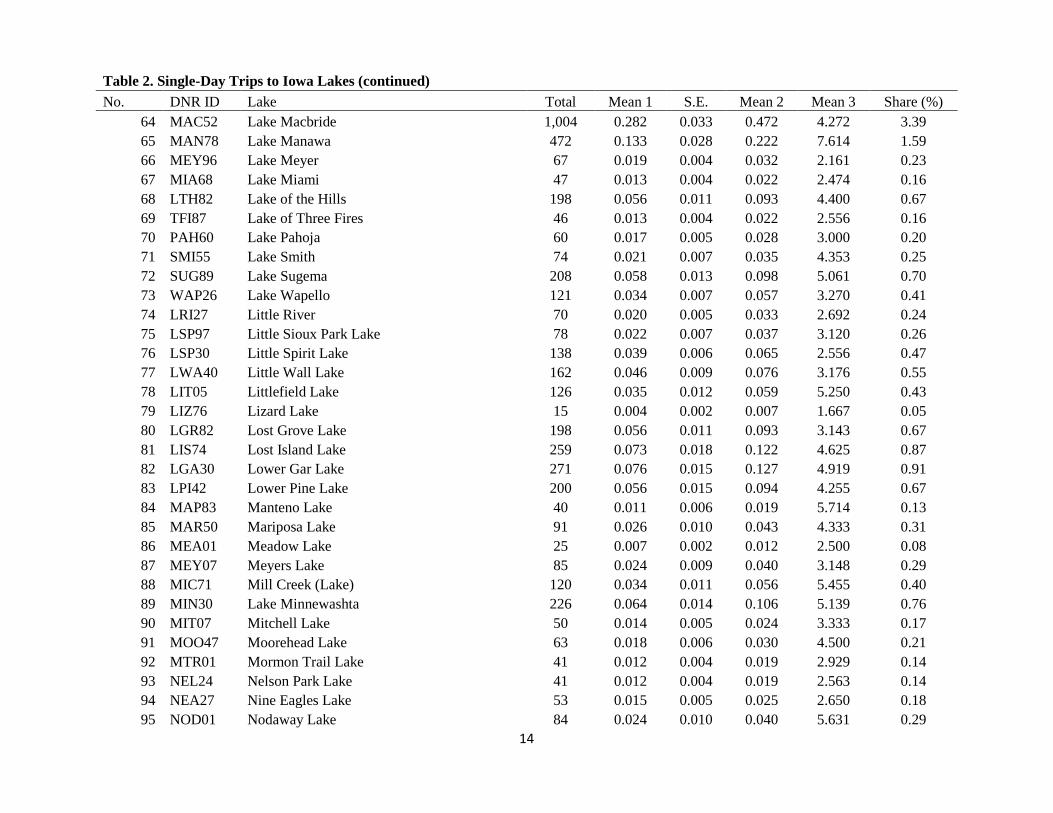
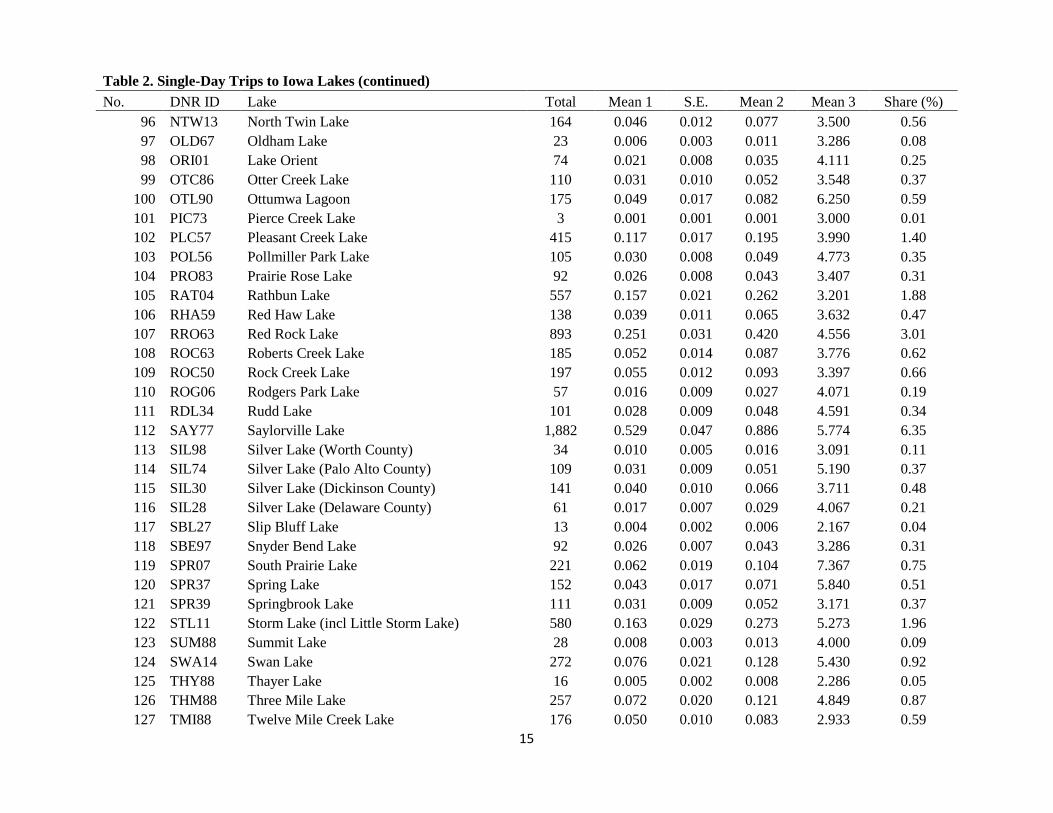
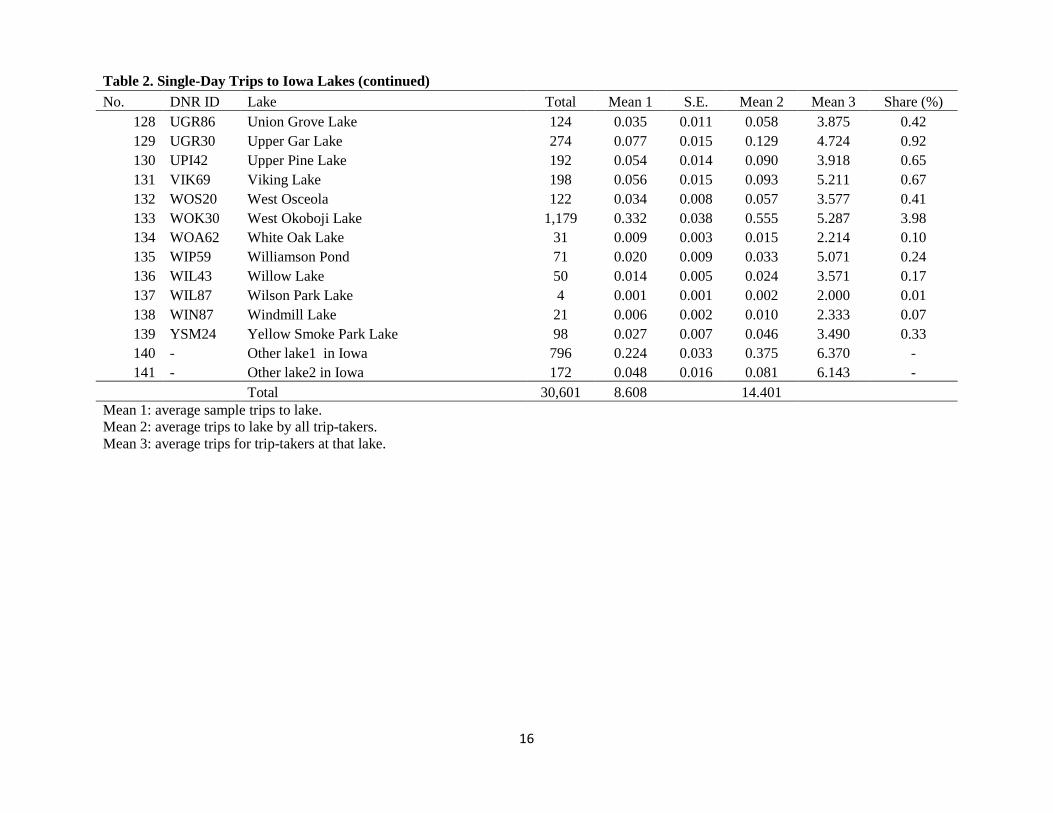
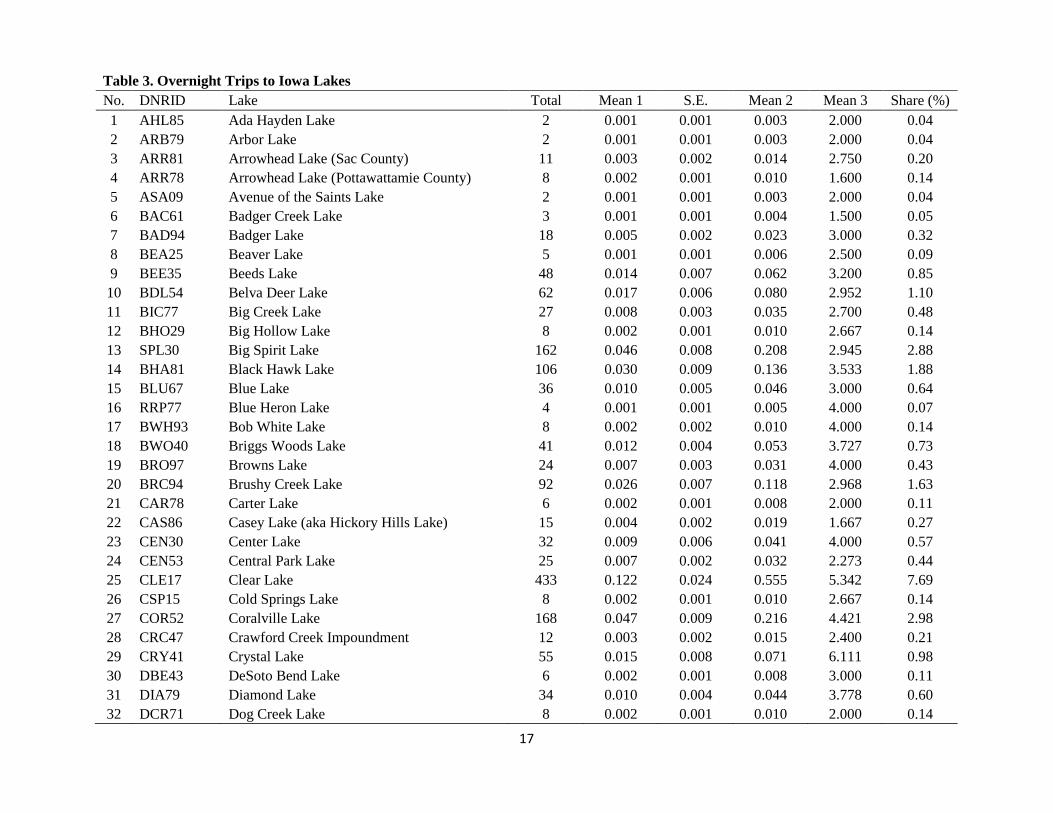
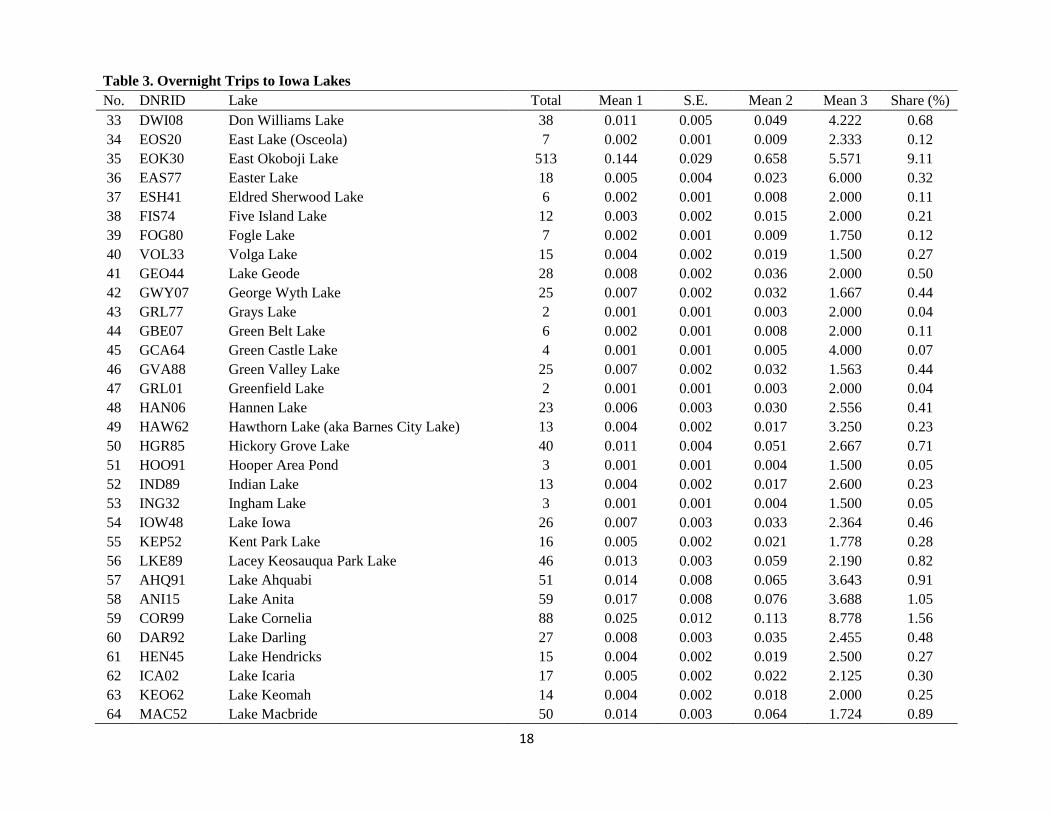
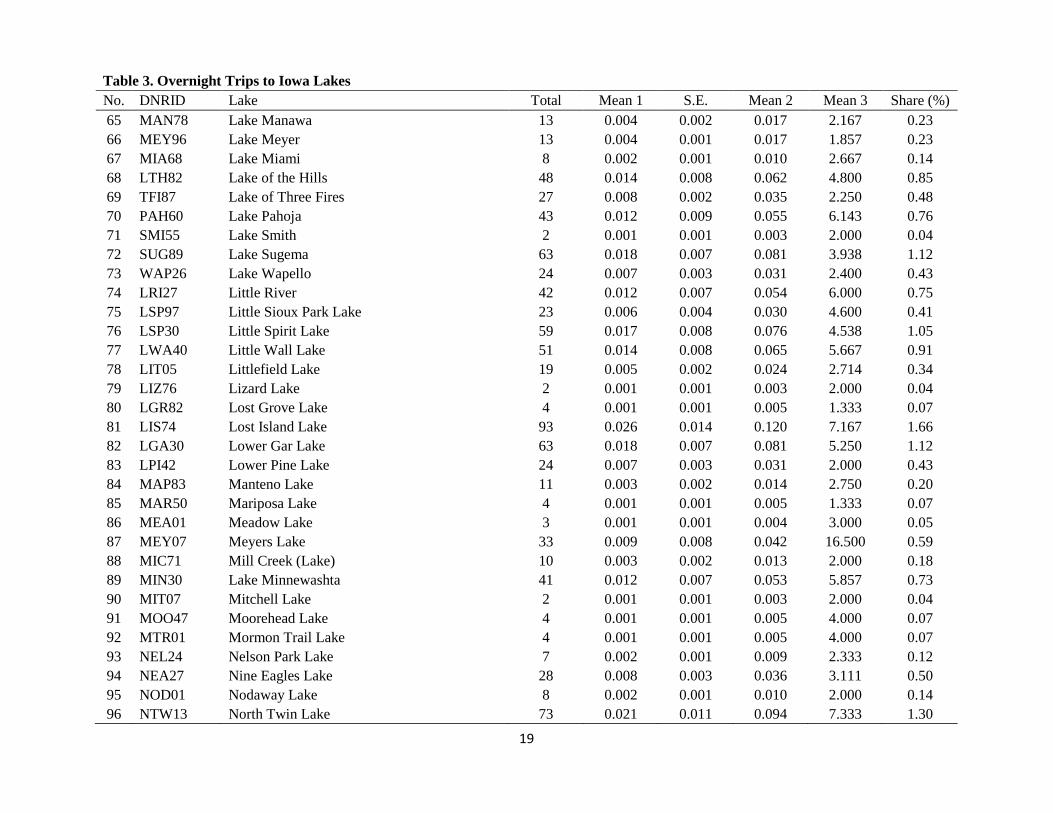
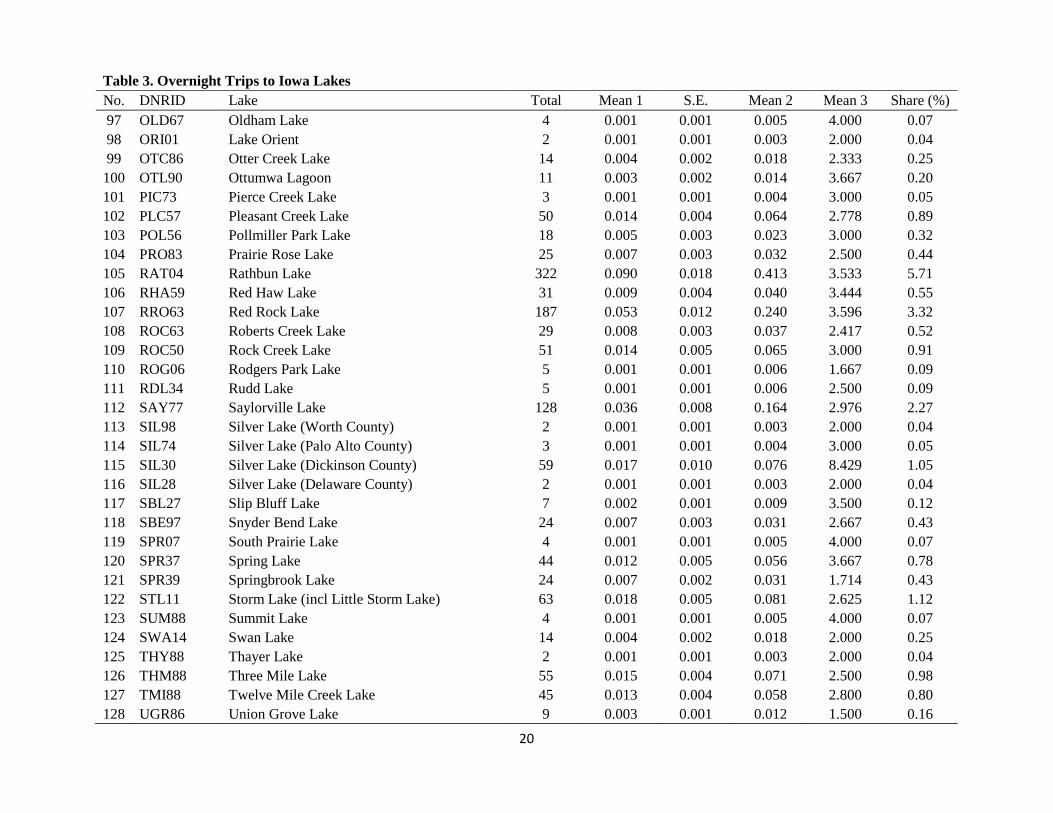
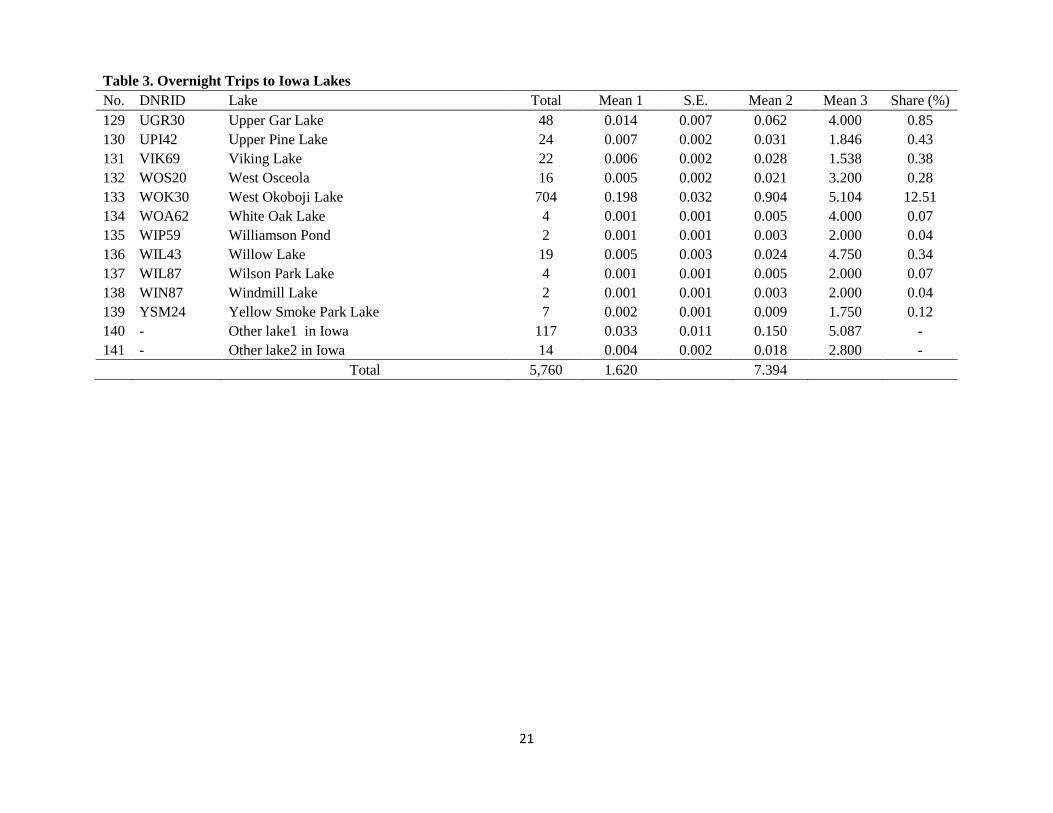
Tables 2 and 3 list some basic summary statistics on the visitation patterns of respondents categorized by lake.
The average number of single‐day trips to a particular lake among all respondents varied between 0.001 and 0.53
(Mean 1). When conditioned on households that answered affirmatively to taking trips to a specific lake, the
average number of trips varied between 1.65 and 7.37 (Mean 3). The column labeled Mean 2 contains the average
5
number of single‐day trips to a particular lake by trip‐takers. The top five most visited lakes by respondents were
Saylorville Lake, Clear Lake, West Okoboji Lake, Grays Lake, and Big Creek Lake, respectively. The five least
visited lakes by respondents were Wilson Park Lake, Thayer Lake, Slip Bluff Lake, Pierce Creek Lake, and
Lizard Lake.
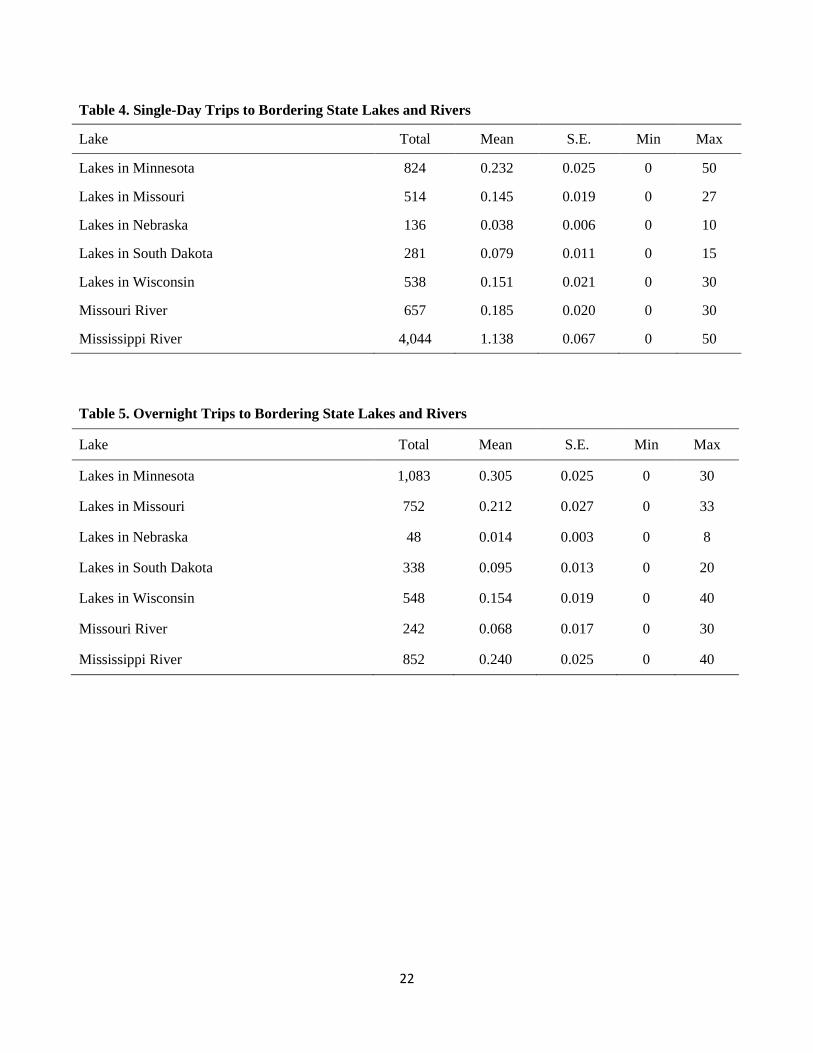
Respondents also took trips to lakes in the states bordering Iowa, as well as to the Mississippi and Missouri
Rivers. Tables 4 and 5 list some basic statistics on the respondents’ visitation patterns to these lakes and rivers.
Eighteen percent of respondents reported at least one single‐day trip to a lake in a bordering state, and 21.7%
reported taking at least one overnight trip. When asked about trips to the bordering rivers, approximately 25.7%
of respondents reported at least one single‐day trip, while only 7.7% reported taking at least one overnight trip.
Almost half, 47.6%, of respondents reported visiting a river or stream segment in Iowa, including the Mississippi
and Missouri Rivers, in the 2014 calendar year.
The majority of single‐day trips to lakes in states bordering Iowa were in Minnesota, averaging 0.23 trips in the
2014 calendar year. In contrast, the fewest number of single‐day trips to lakes in states bordering Iowa were in
Nebraska, averaging 0.04 trips. Respondents took a sizable number of single‐day trips to the Mississippi River,
averaging 1.14 trips, whereas respondents participated in an average of only 0.19 trips to the Missouri River.
The same visitation pattern is observed with overnight trips to lakes in bordering states and the river segments
bordering Iowa. Respondents reported an average of 0.31 overnight trips to lakes in Minnesota in the 2014
calendar year, but only 0.01 on average to lakes in South Dakota. The Mississippi River received an average of
0.24 overnight trips, whereas respondents participated in an average of only 0.07 overnight trips to the Missouri
River.
III.2. Activities in Lakes and Others Answers of Respondents
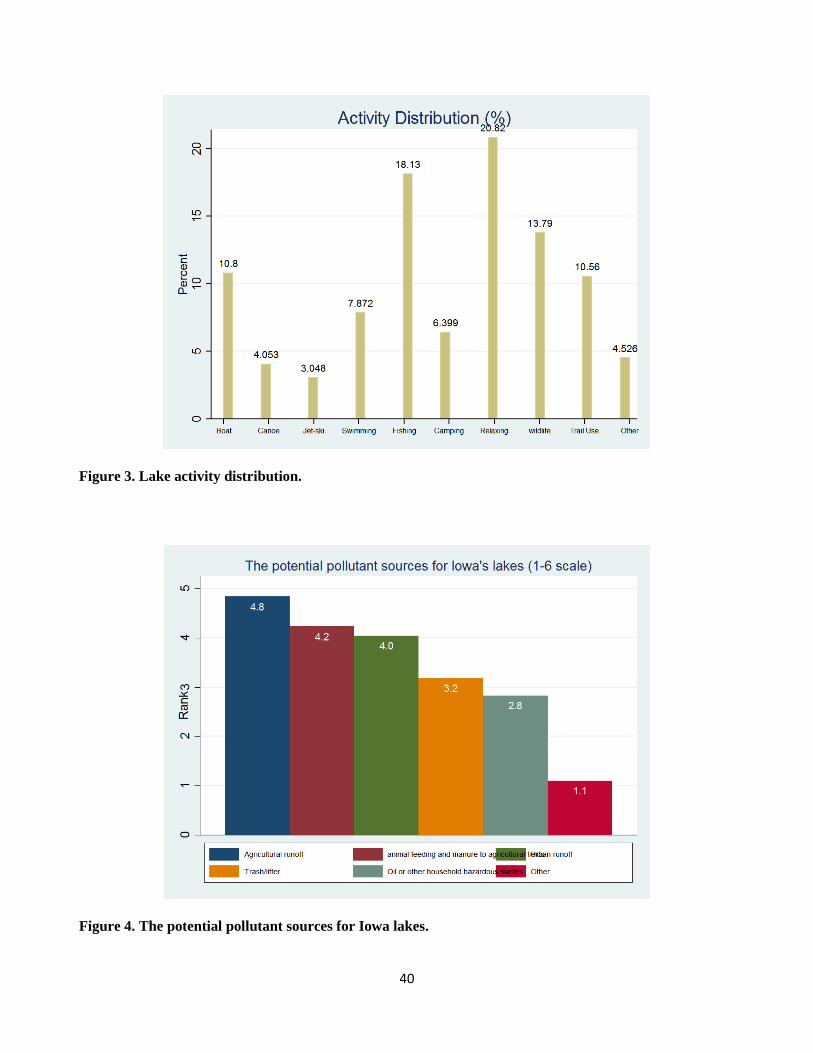
Respondents were asked to select the activities that they commonly participate in during a visit to an Iowa lake.
Figure 3 depicts the distribution with which respondents selected these activities. The top three activities selected
6
by respondents were relaxing and/or picnicking, fishing, and nature/wildlife watching, respectively. For example,
of total activities that respondents undertake at all lakes, about 11 % of them are boating and about 18% are
fishing. Note that this is not the same as how many households participate in boating or fishing. That information
is available at (http://www.card.iastate.edu/ag_policy_review/f15-lakes/).
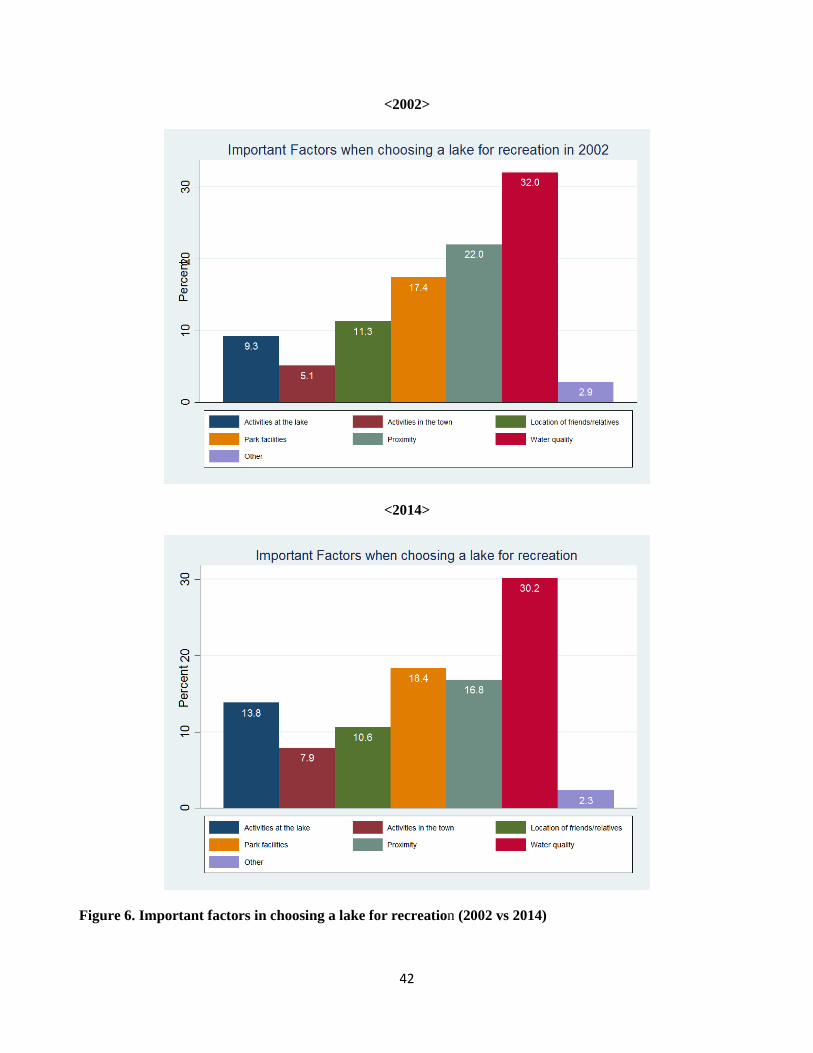
We collect the information on important characteristics and factors when people choose a lake for recreation in
2002 and this survey. Figure 4 show that the important characteristics are similar between two years. ‘Safety from
bacterial contamination/no health advisories’ is the most important and water clarity is also considered as one of
the important characteristics. Figure 5 also show the important factors when choosing a lake recreation are not
changed much between 2002 and 2014. The water quality is the most important, and then proximity and park
facilities are similarity important.
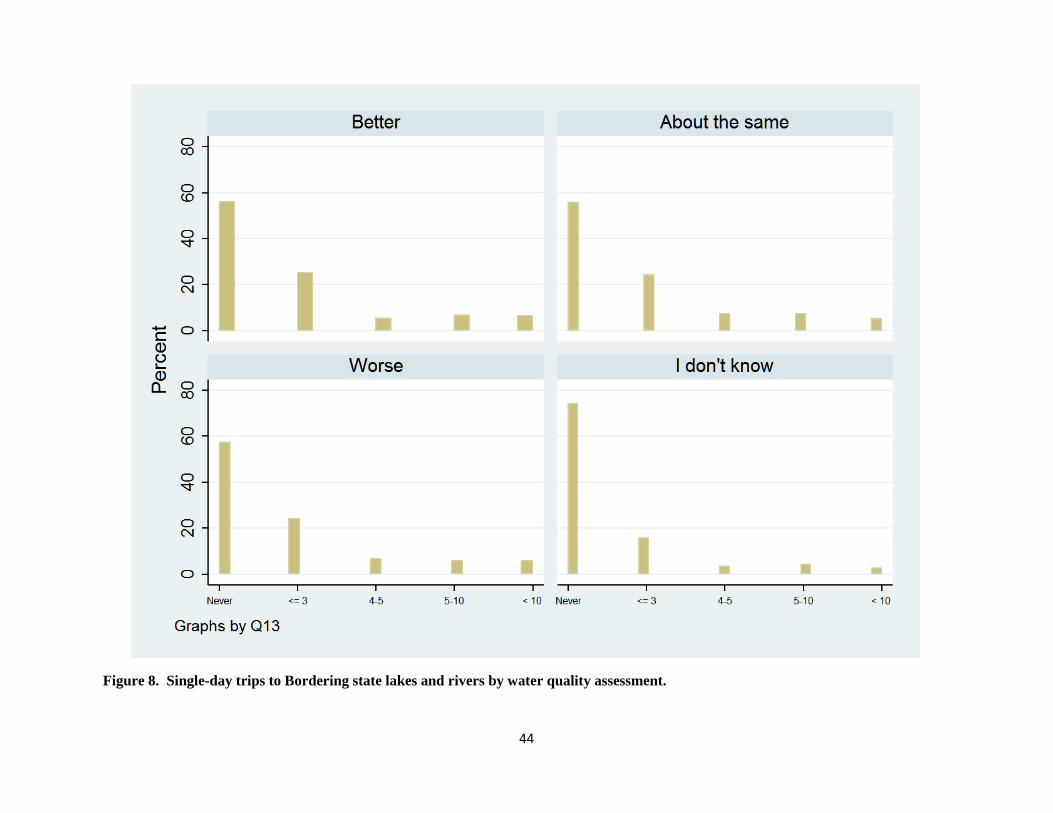
One of most important questions in 2014 Iowa Lake Project is the assessment of water quality compared to lakes
in surrounding states. Figure 7 shows the distribution of respondents’ evaluations of Iowa’s relative lake water
quality. Even though 41.6% of respondents reported ‘I don’t know,’ 24.6% reported ‘about the same.’ In contrast,
21.3% of respondents reported ‘slightly worse’ or ‘way worse’ water quality. Regarding the assessment of water
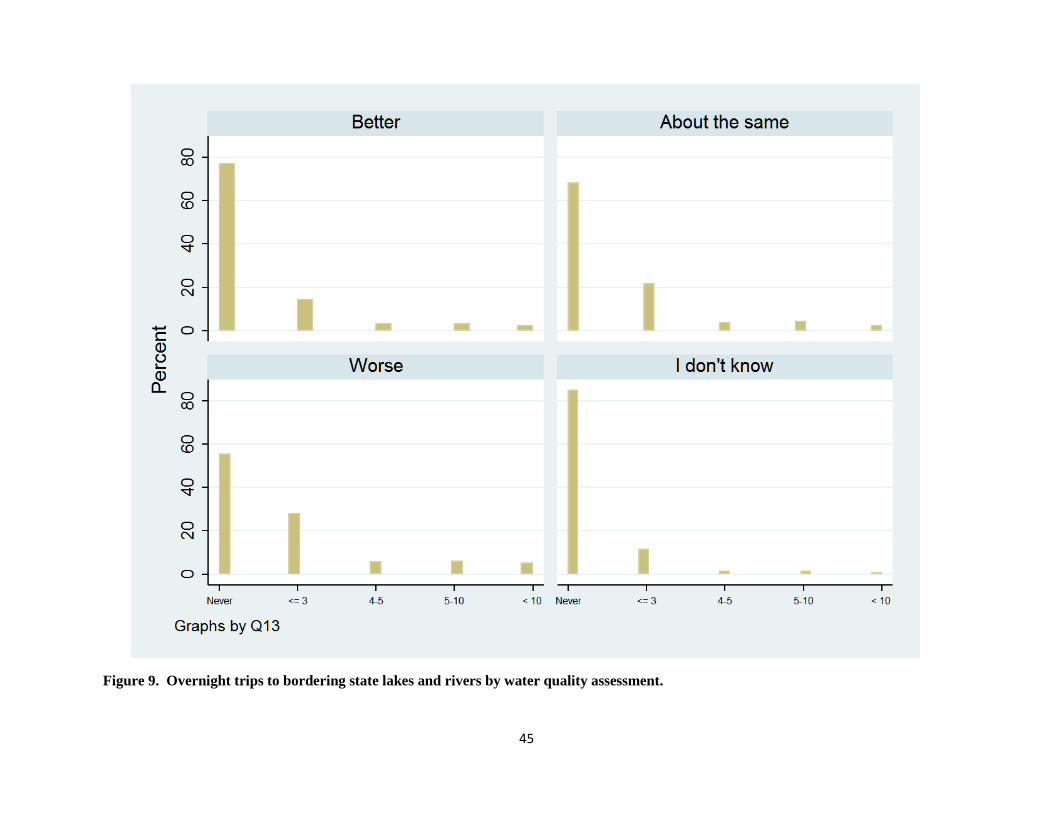
quality, Figure 8 shows the relative single-day visitation patterns by respondents’ water quality assessment
compared to lake water quality in bordering states, while Figure 9 describes overnight visitations. In Figure 8, we
can see that the rate of visitations to bordering state lakes or rivers between households reporting ‘way better’ or
‘slightly better’ and ‘way worse’ or ‘slightly worse’ are not very different. On the other hand, households
reporting ‘way worse’ or ‘slightly worse’ show more frequent visits to bordering state lakes or rivers than
households reporting ‘way better’ or ‘slightly better.’
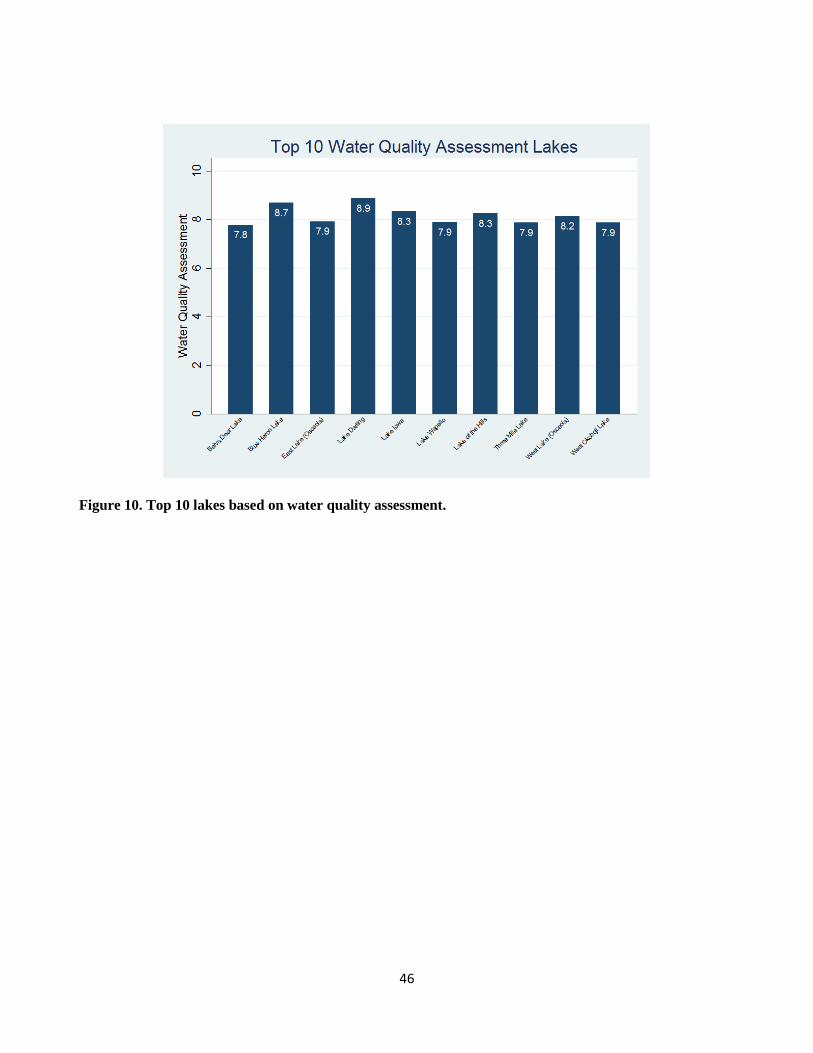
Figure 10 depicts the ten best lakes for water quality as assessed by trip-takers.2 Lake Darling, Blue Heron Lake,
Lake Iowa, Lake of the Hills, and West Lake were assessed over eight points by trip-takers.
2 We asked respondents to assess water quality on a scale of 0 to 10. Therefore, it may be different to real water quality measured by scientific devices.
7
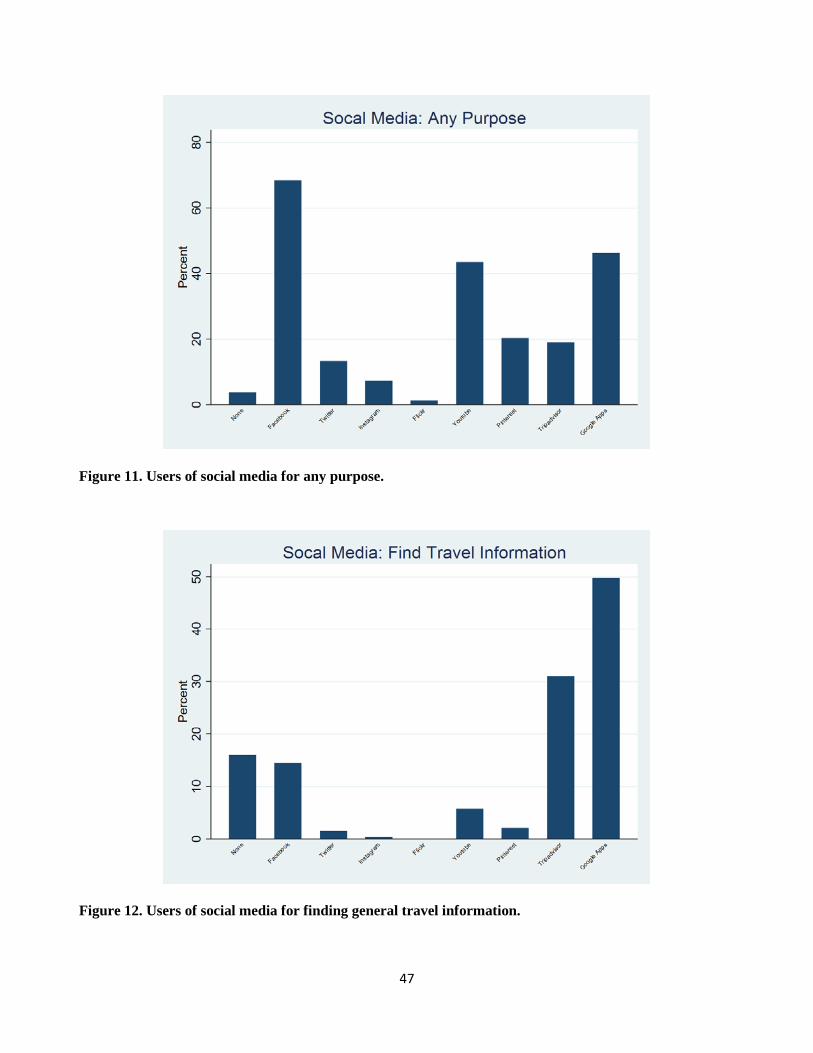
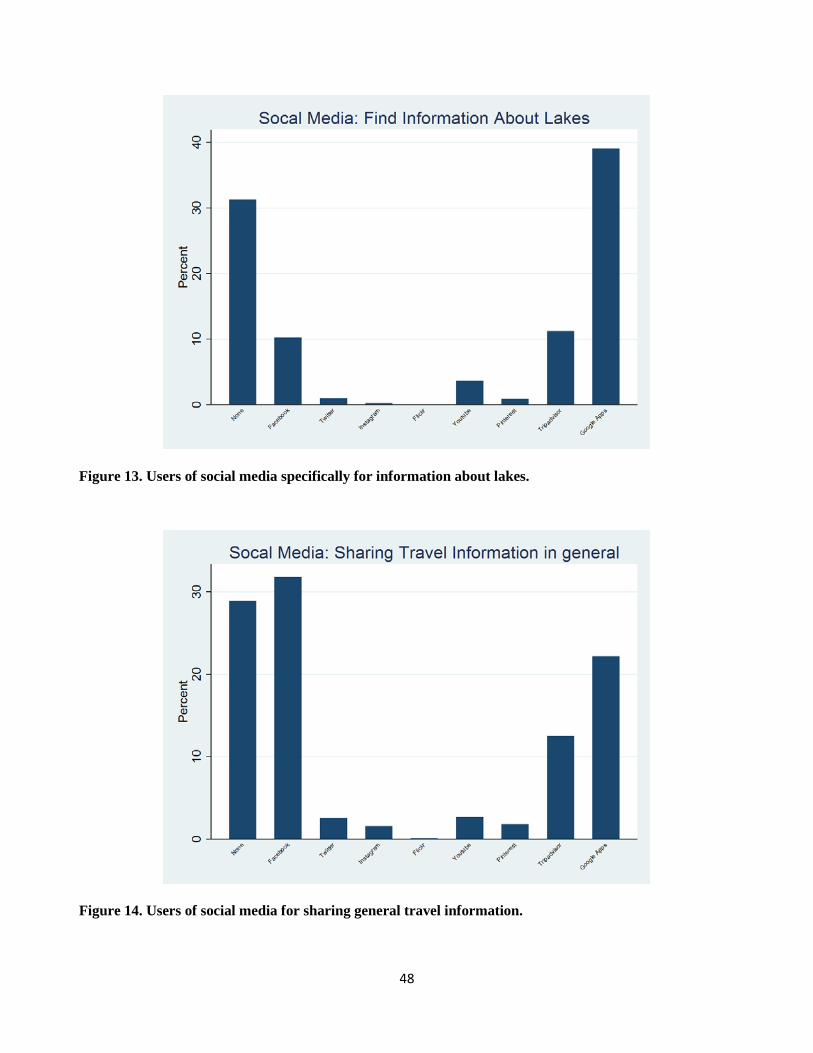
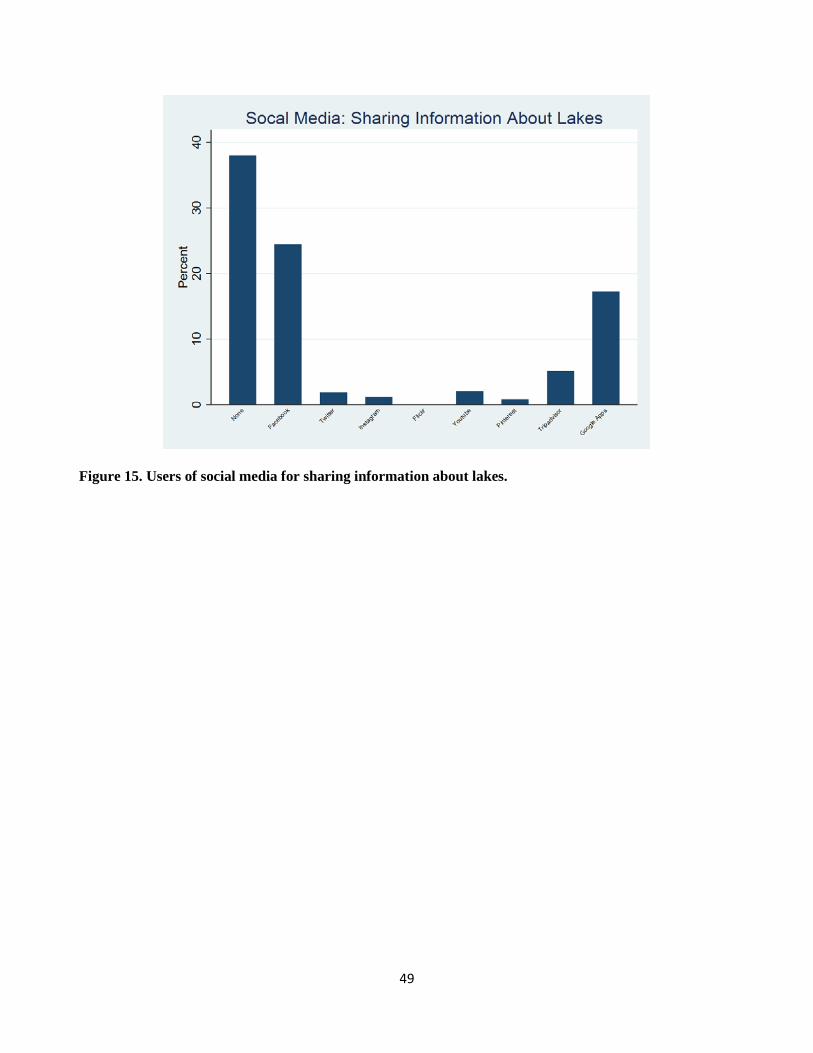
As the number of social media users has grown in recent years, many people now turn to sites like Facebook to
share vacation photos and experiences, and to seek information and recommendations from other users. In that
regard, we surveyed how Iowans use social media in general, and in relation to their lake visitation. Figures 11–15
show the percentage of respondents that use social media for any purpose and specifically for the purpose of
finding or sharing information about lakes in Iowa. The majority of respondents use some social media site for
any purpose—less than 10% of respondents said they didn’t use a social media site at all. Facebook was clearly
the most used site for general purposes, with about 70% of respondents saying they used the site. Most people—
about 85%—indicated they use social media to find information about travel or lakes.3 Close to 30% of
respondents however, said they do not share any information about any trips on social media sites, and almost
40% said they do not specifically share information about lake visitation. Those that do share information about
lake visitation or trips in general indicated they mostly do so through Facebook.
III.3. Respondent Demographics
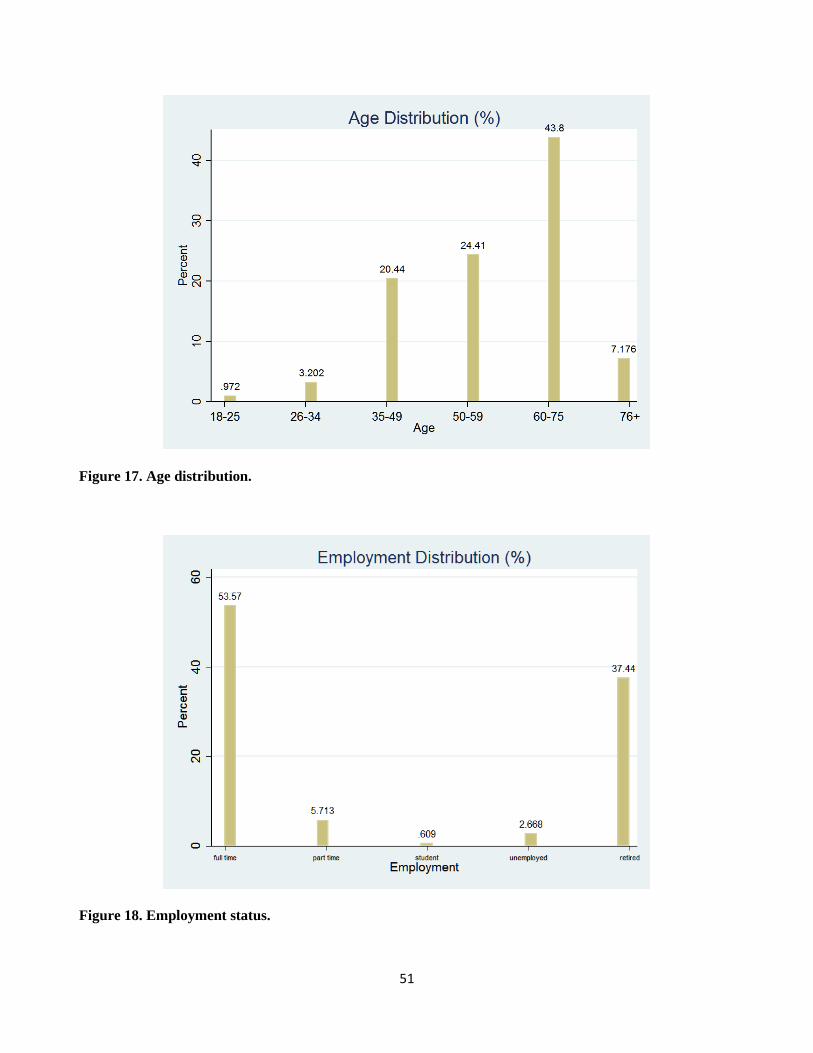
Respondents varied in age, employment status, household size, income, and education. In this section, we provide
some basic summary statistics regarding the demographic characteristics of respondents.
Figure 17 illustrates the age distribution among respondents. The majority of respondents were between the ages
of 35 and 75. The largest group of respondents contained individuals between the ages of 60 and 75.4 This is
consistent with Figure 18, which displays the employment status of respondents: 37.4% were retired, while 53.6%
were employed full time.
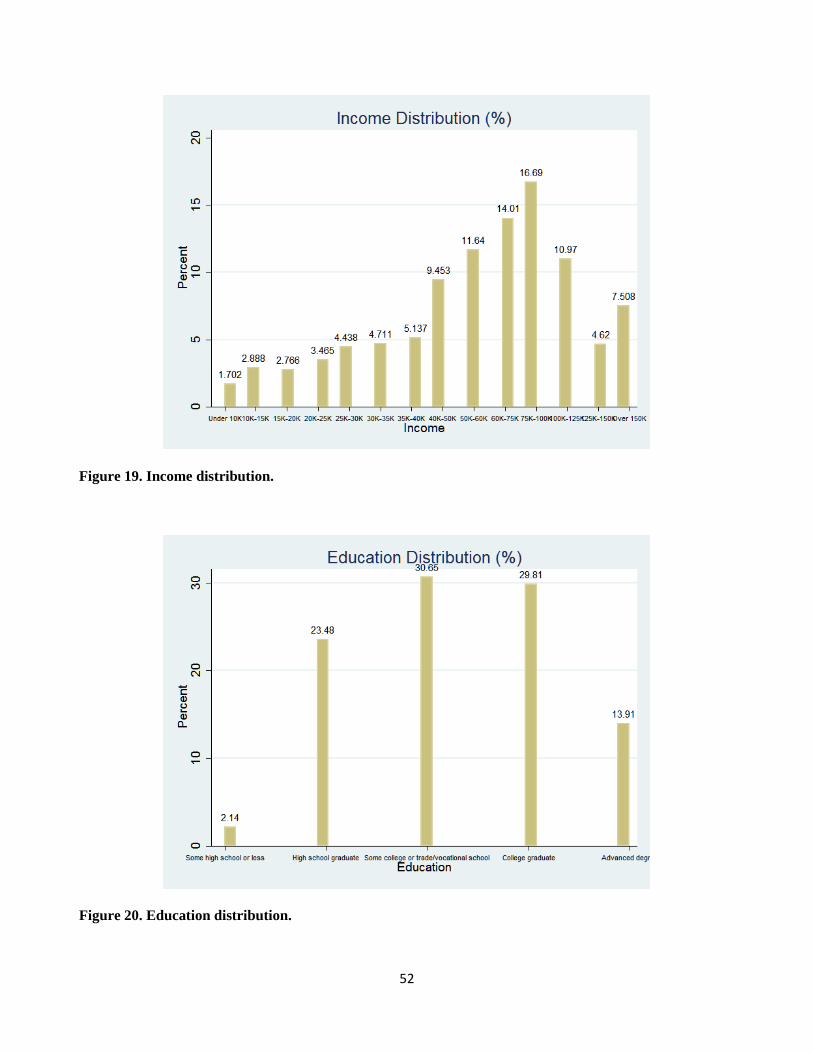
Figure 19 depicts the distribution of income among respondents. Fifty‐eight percent reported an annual income
between $40,000 and $99,999, with the largest portion of those falling between $75,000 and $99,999. This is
3 Even though we restricted Google Aps to Google’s social media such as Google Plus, we guess many respondents misunderstood Google Aps as Google search engine. 4 According to the 2009–2013 American Community Survey, 60 to 75-year old household heads account for 19.7% of Iowa households. Therefore, we correct the visitation estimates with sampling weight.
8
consistent with reported education levels among respondents, illustrated in Figure 20. A majority of respondents,
74.4%, have received at least some college education. Approximately 43.7% of respondents reported obtaining at
least a college degree, and 13.9% reported having an advanced degree.
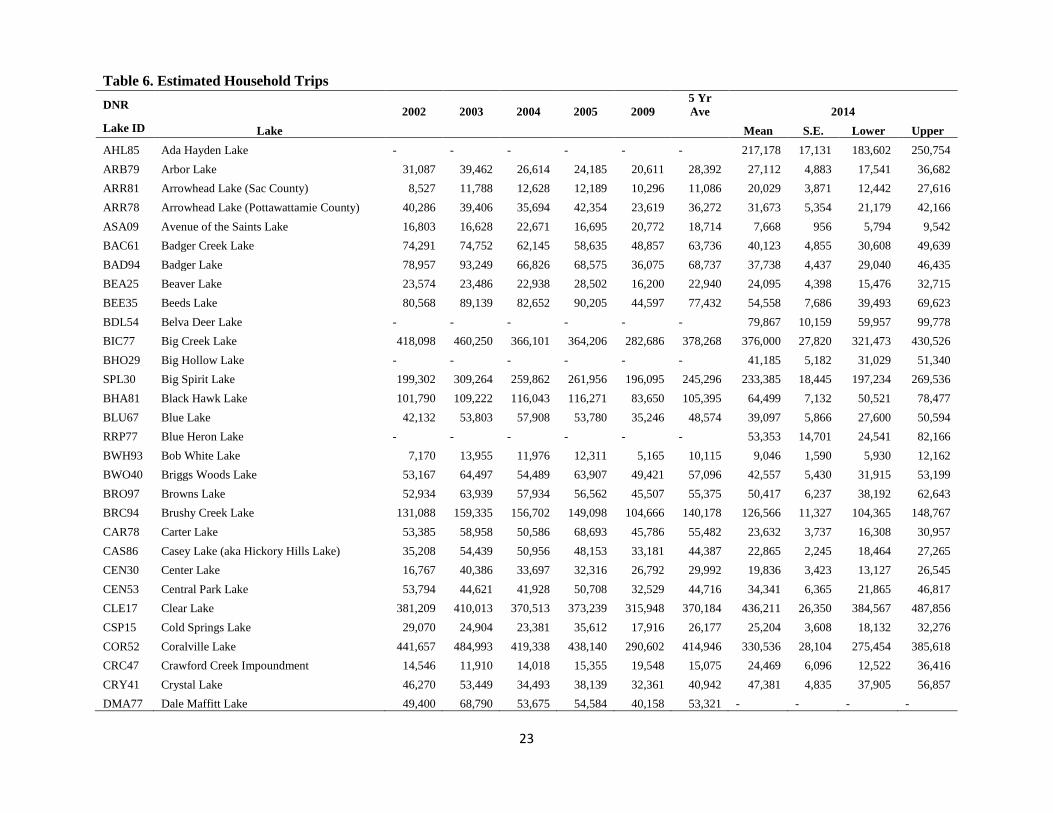
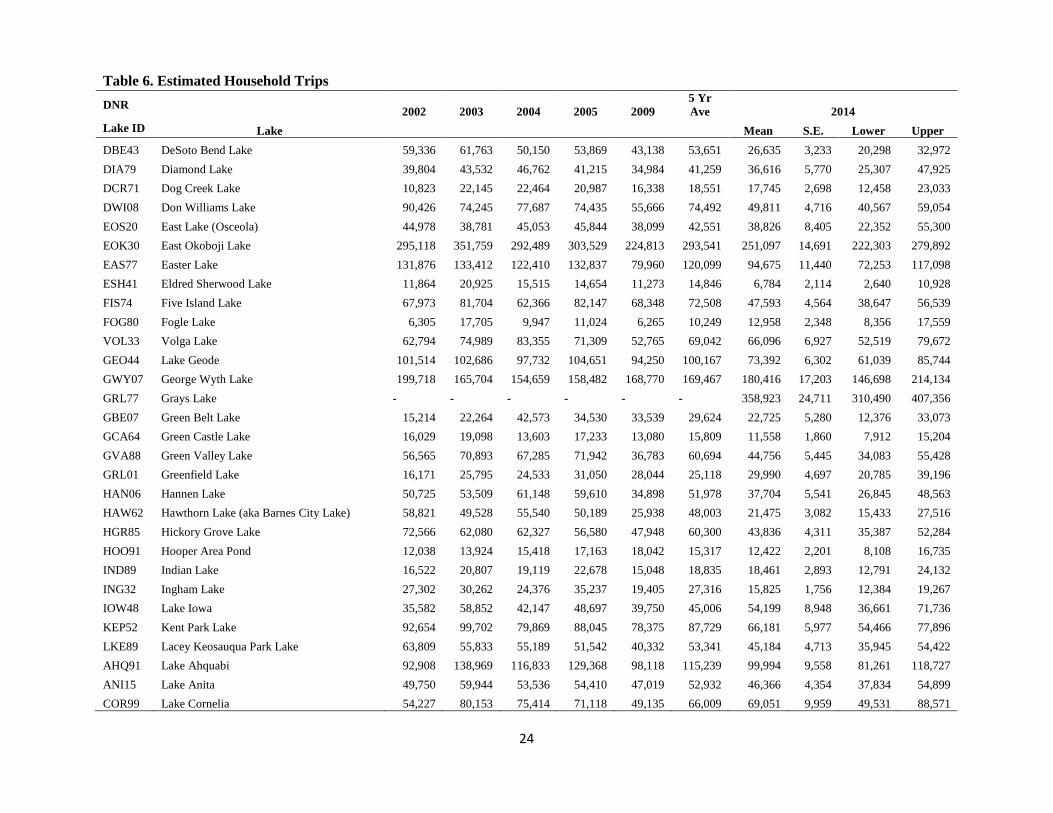
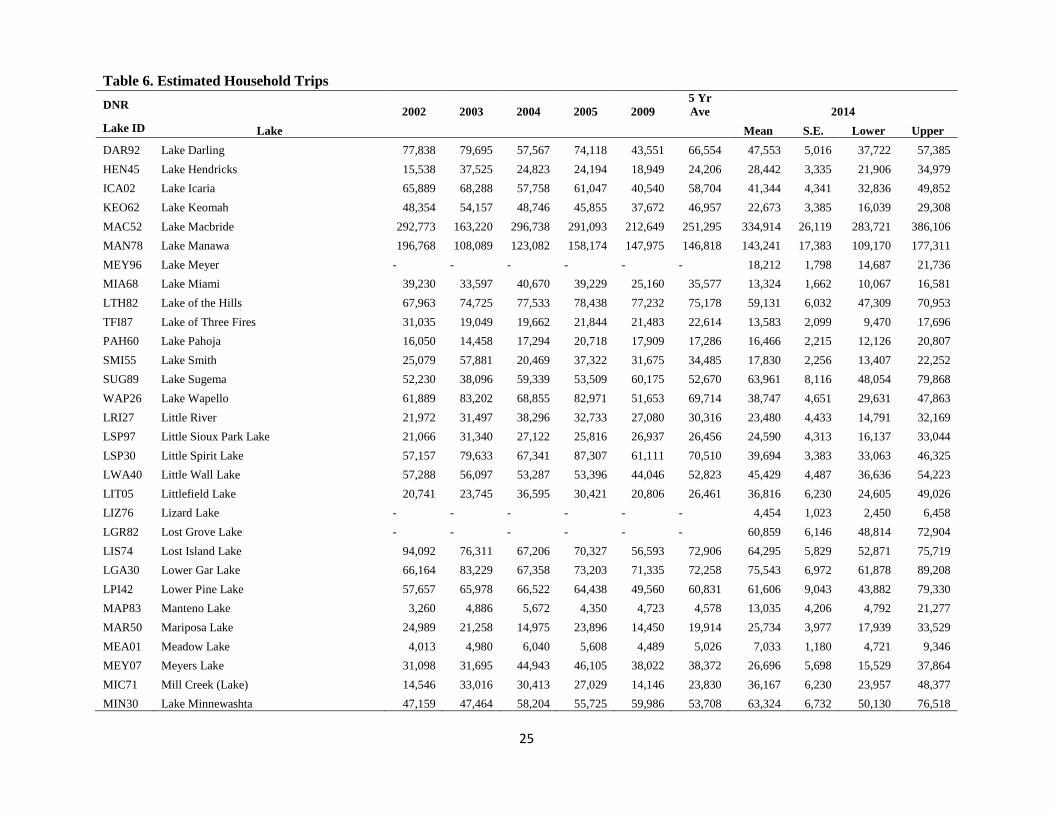
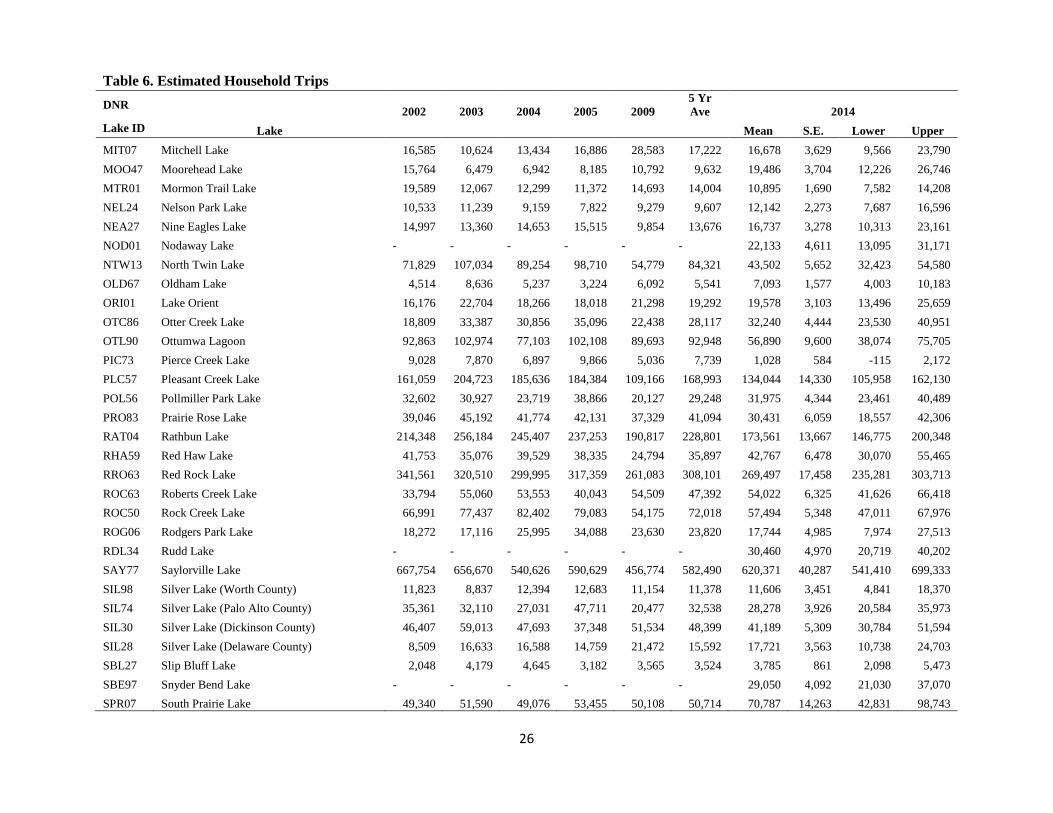
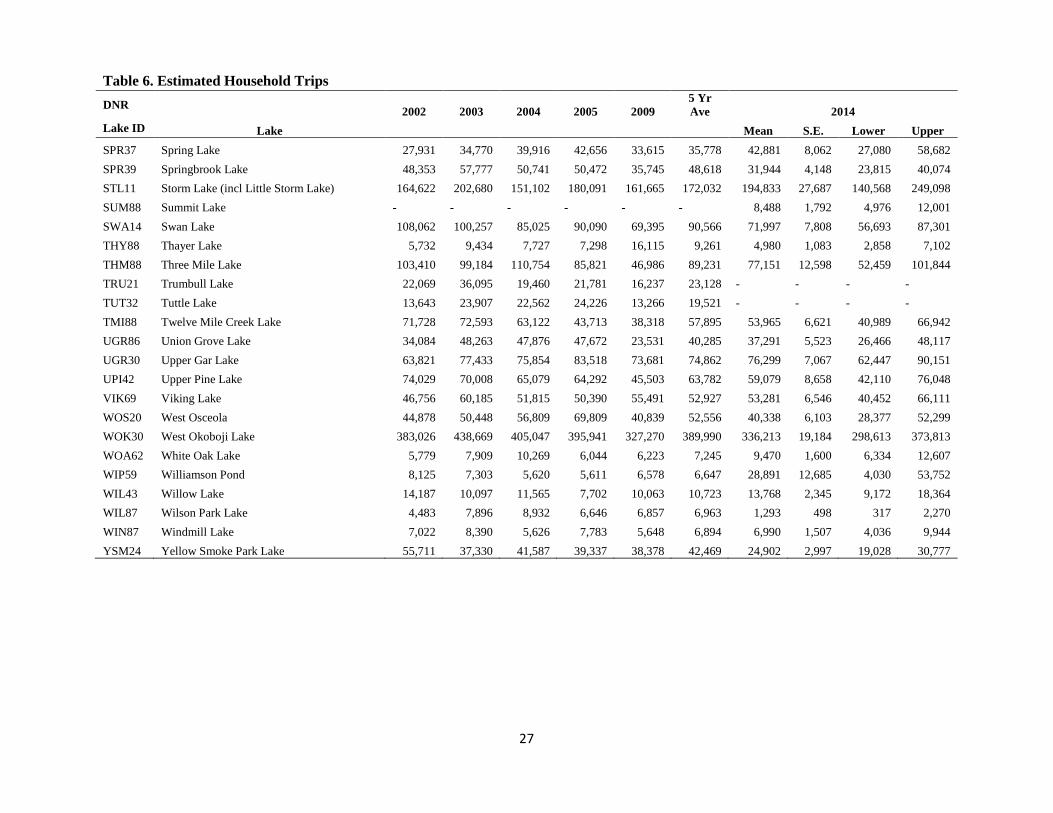
III.4. Total Usage Estimates of Iowa Lakes by Iowa Households
Using information collected from the Iowa Lakes surveys from 2002 to 2009 and 2014, and a follow‐up survey of
non‐respondents in 2002, we estimate the total number of single‐day household trips to Iowa lakes by all Iowans.5
Table 6 contains estimated household trips categorized by lake. The five‐year average between 2002 and 2009 is
also included.6 For 2014 Iowa lake usage estimates, we present mean values, standard error, and upper and lower
bound as well.
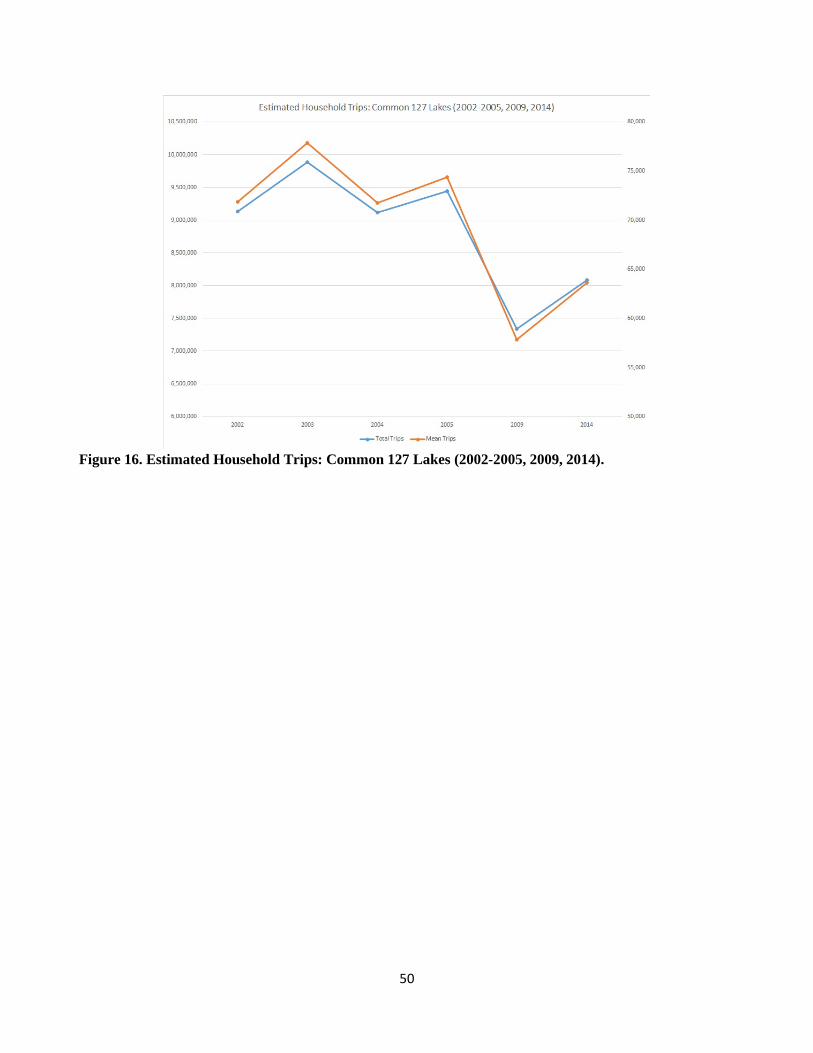
The estimates of 2014 Iowa lake visits are slightly lower than the five-year average, while the numbers are greater
than 2009 Iowa lake usage estimates—partially explainable by the 2008–2009 economic downturn. In general,
usage of Iowa’s lakes could be said to be quite stable over the surveyed years. While there are increases and
declines on individual annual bases, overall, there has been a steady amount of use. Figure 16 shows the trend of
the estimated total trips and estimated average trips per lake.
The average observed decrease is not uniform across all lakes. A considerable amount of variation at the
individual lake level exists, ranging from an over 335% increase in household visitation to an 87% decrease. The
top five most heavily visited lakes in 2014 were Saylorville Lake, Clear Lake, Big Creek Lake, Gray Lake, and
West Okoboji Lake respectively.
5 A complete description of the calculation is available from the authors upon request. 6 We found that there were some mistakes in calculation of 2009 Iowa households lake usage estimates, so we correct the numbers.
9
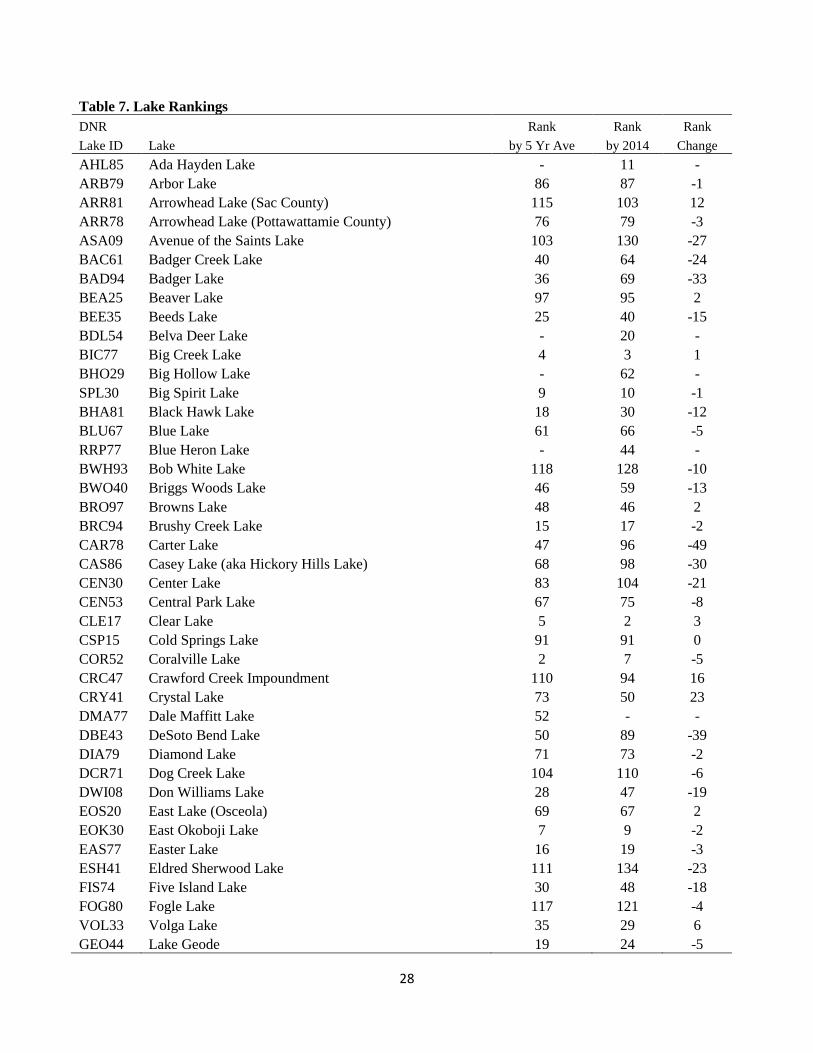
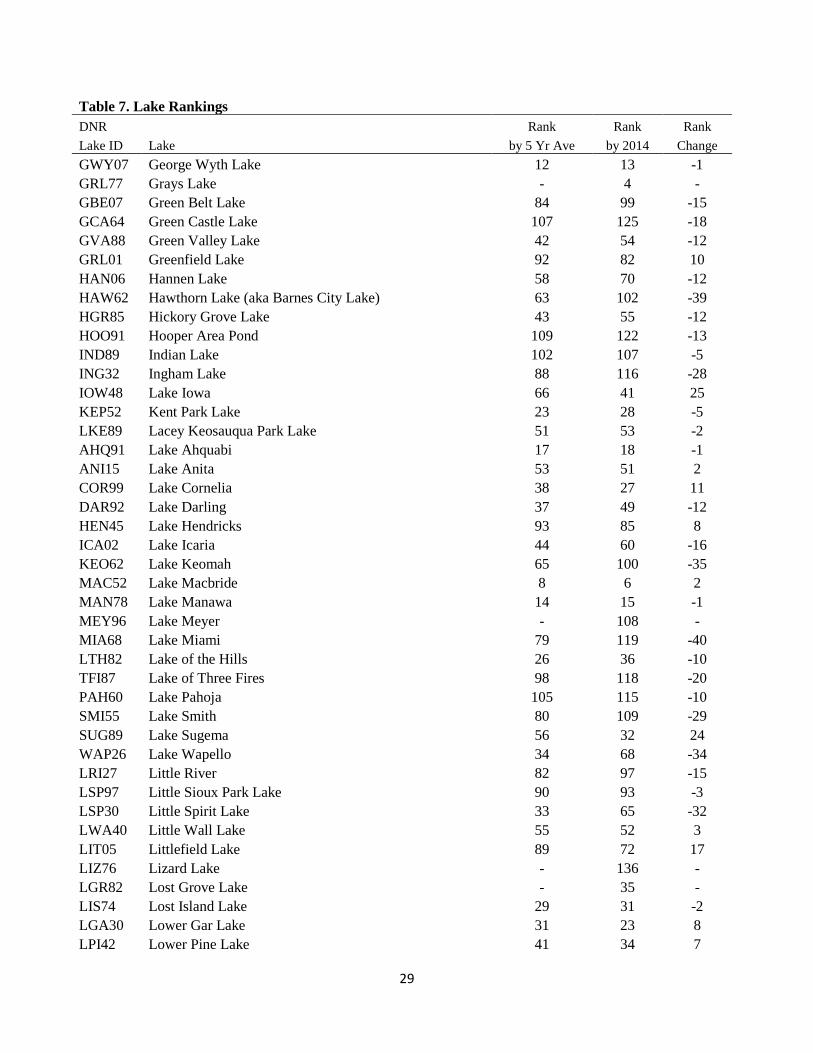
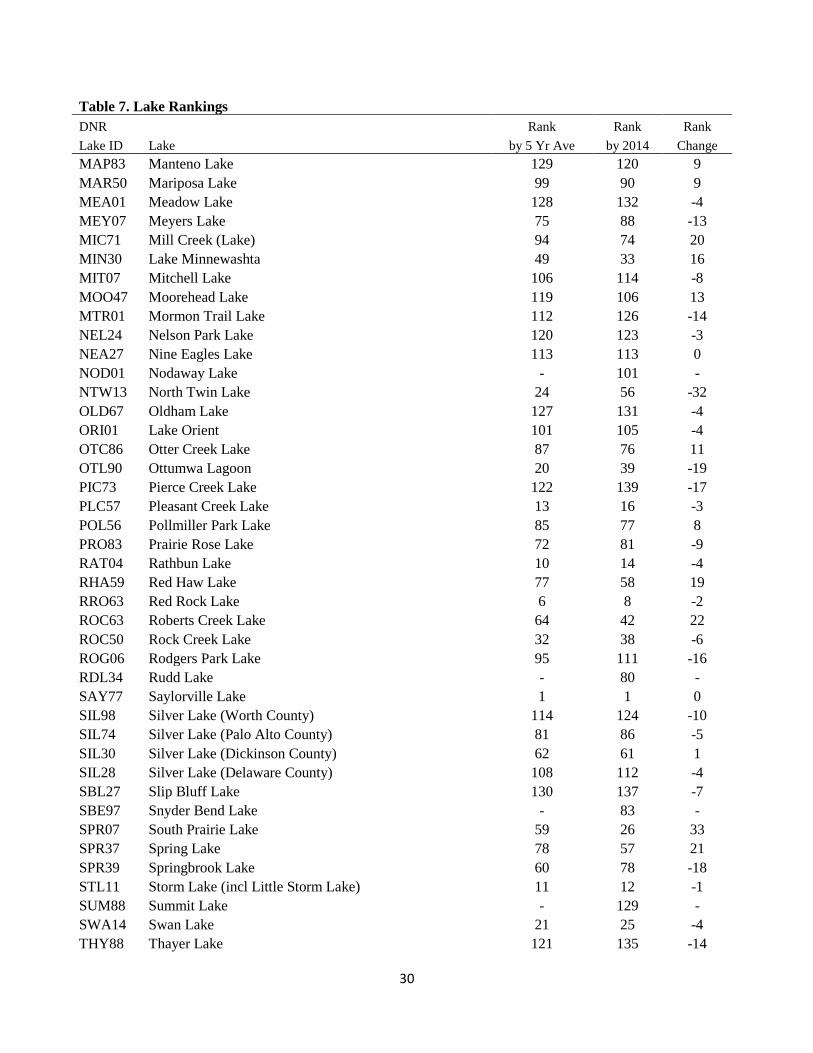
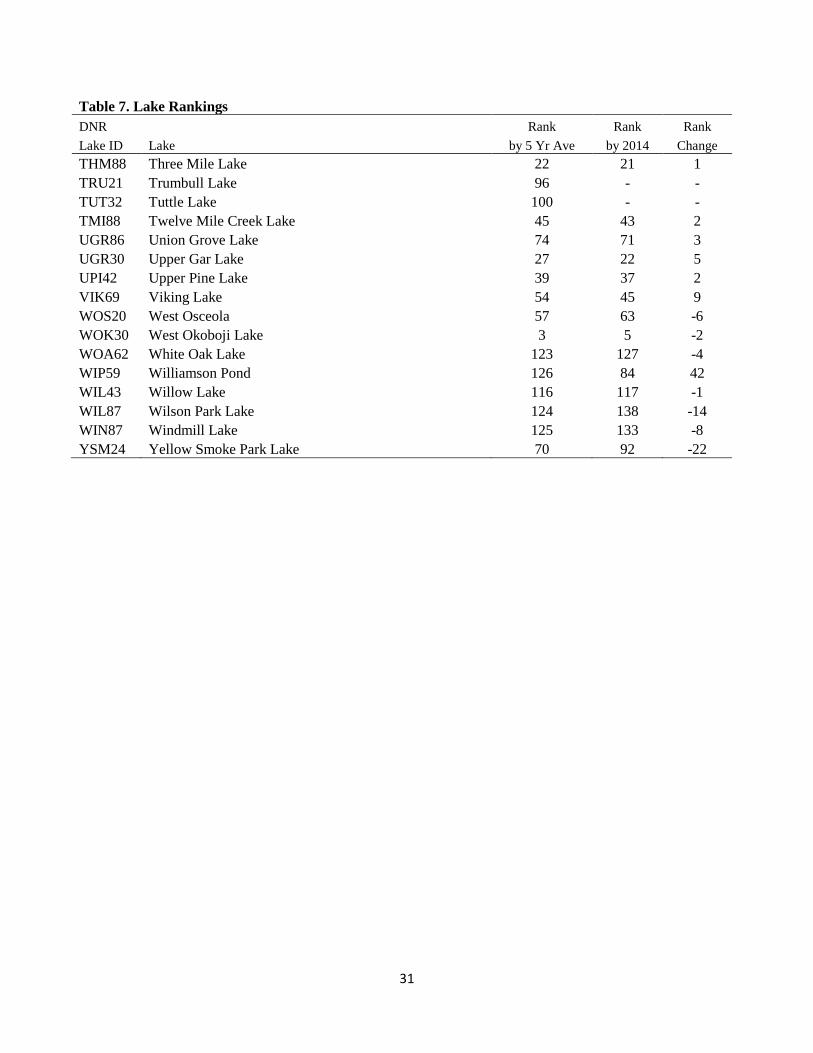
Table 7 contains the ranking of Iowa lakes according to the intensity of household visitation under the five‐year
average and in 2014, as described in Table 6. Also included is the change in overall ranking between the five‐year
average and 2014. This column captures substitution between lakes. The five lakes with the largest change in
rankings between the five‐year average and 2014 are Williamson Pond, South Prairie Lake, Lake Iowa, Lake
Sugema, and Crystal Lake, respectively. In contrast, the five lakes that experienced the largest drop in rankings
are Carter Lake, Lake Miami, DeSoto Bend Lake, Hawthorn Lake (aka Barnes City Lake), and Lake Keomah.
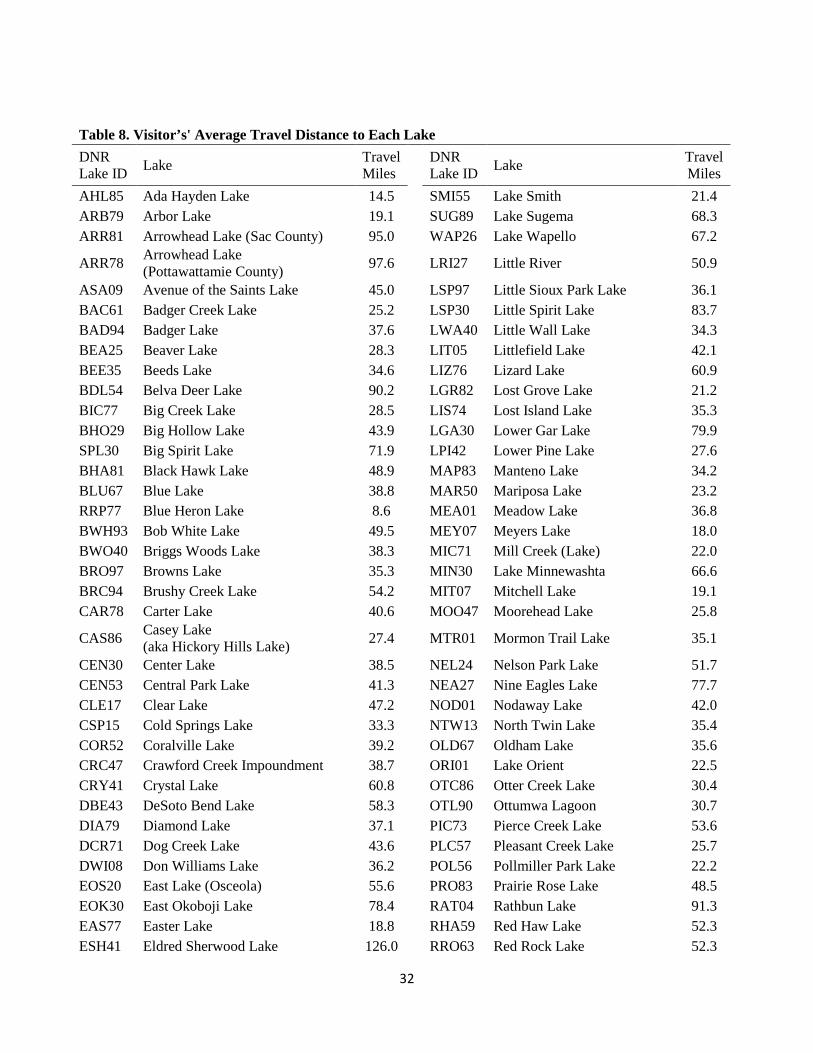
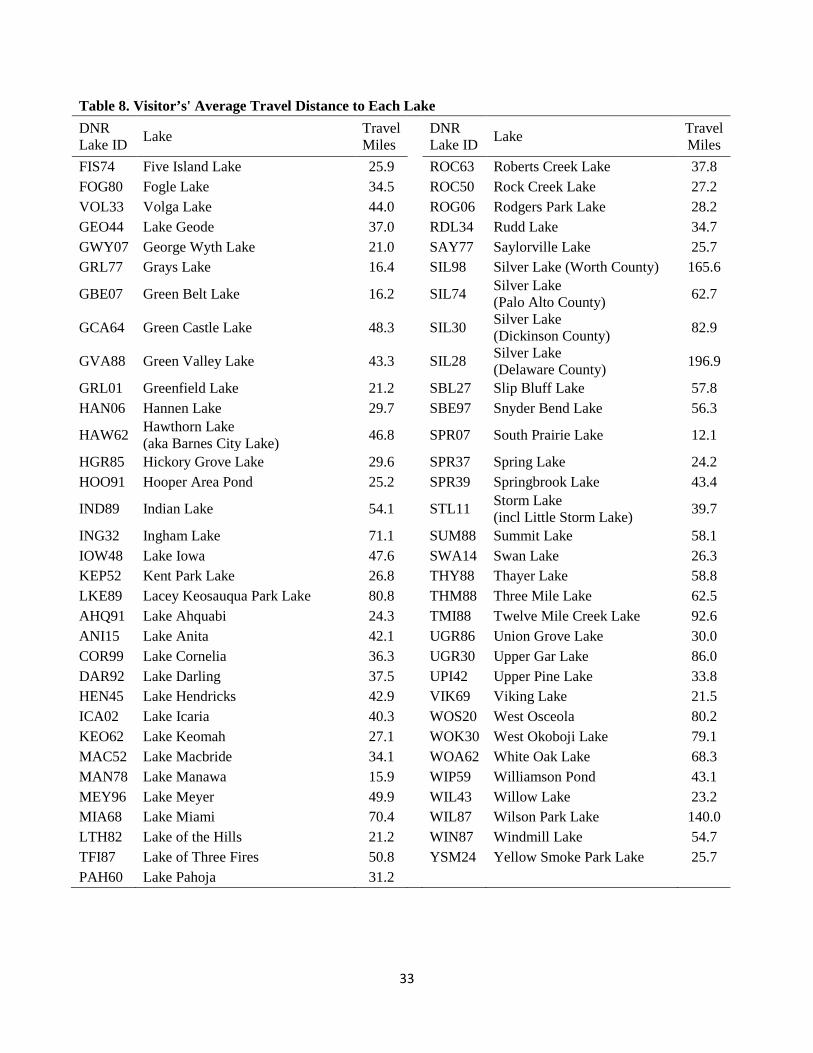
Table 8 contains the average number of miles visitors travel to each lake calculated with the number of trips as a
weight. Visitors to urban lakes such as Gray Lake, Clear Lake, Big Creek Lake, and Ada Hayden Lake live in
close proximity to the lake, while non-urban lakes such as West and East Okoboji Lakes and Big Spirit Lake have
a relatively larger number of visitors traveling long distances.
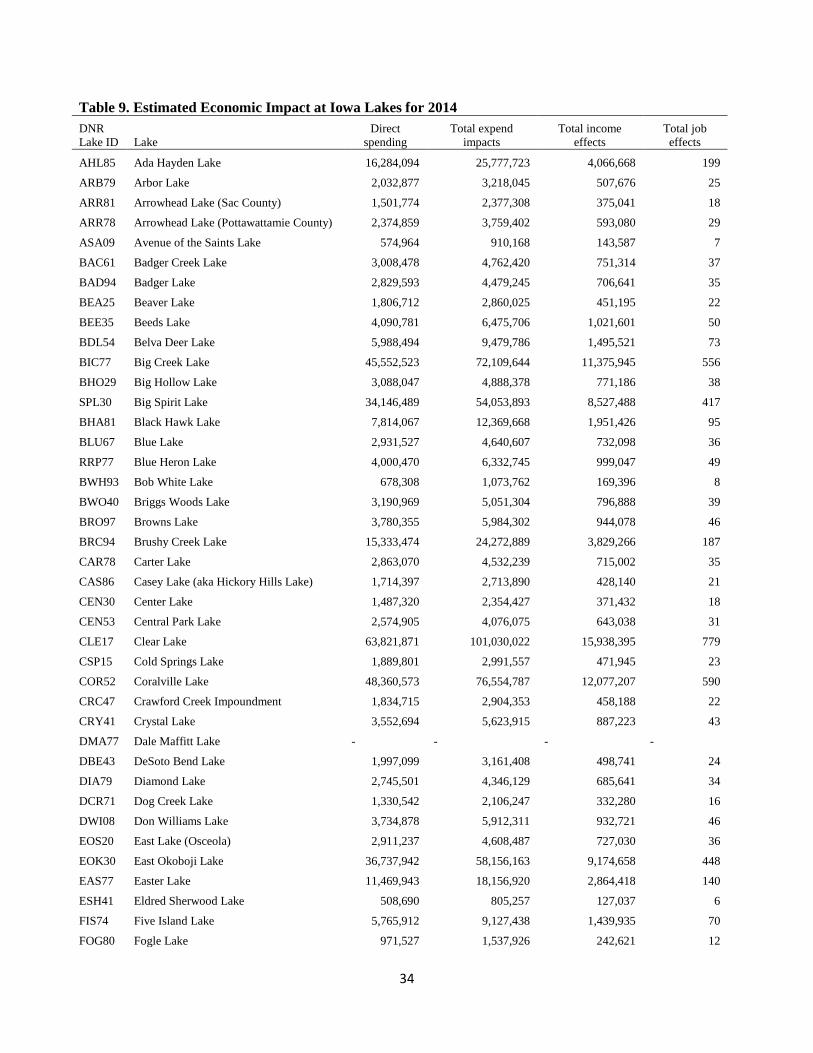
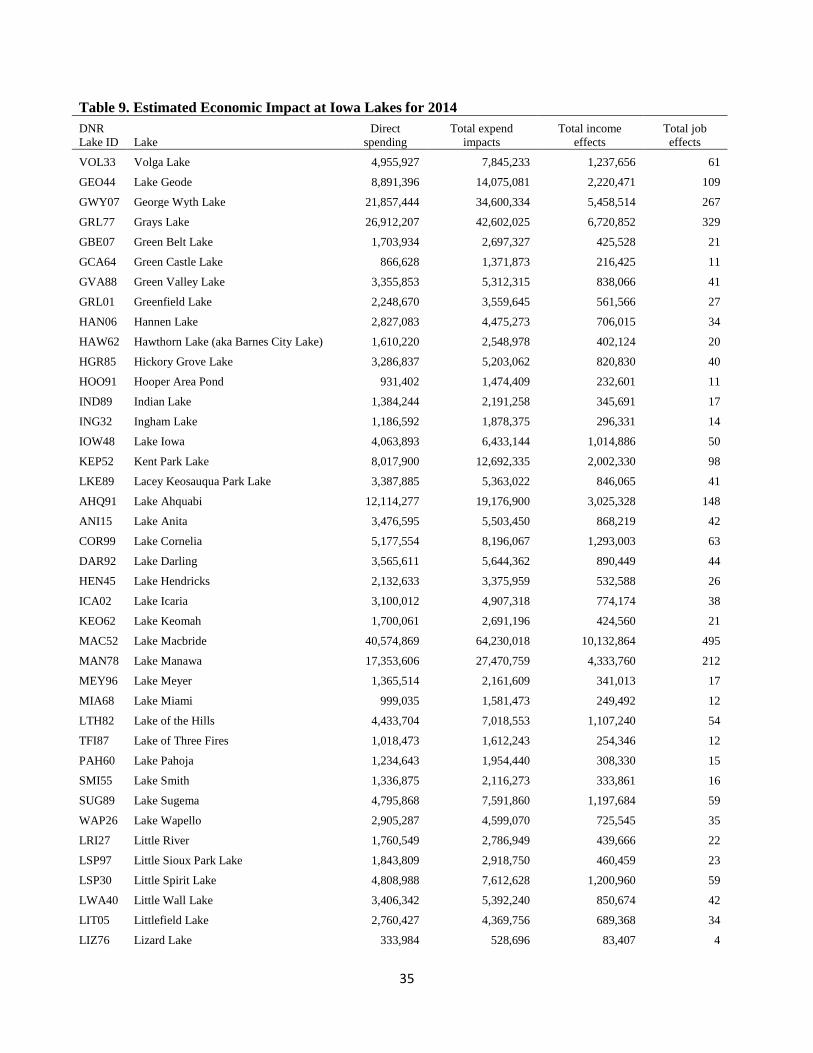
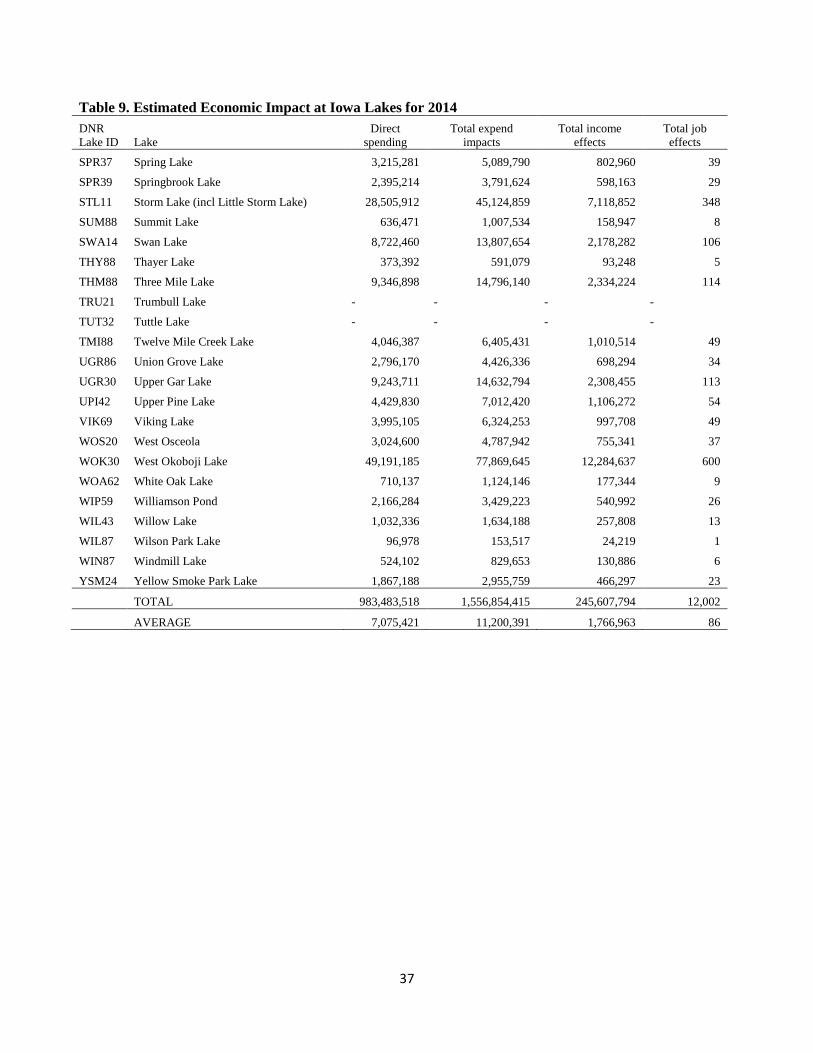
Table 9 shows the economic impact lake visitation has on local economies. The estimated direct spending is based
on an intercept survey conducted at three Iowa lakes (Clear Lake, Pleasant Lake, and Lake Manawa) during the
summers of 2009 and 2010, and two Iowa lakes (Storm lake and Rock Creek lake) in 2002.7 Direct spending is
applied to each lake visit according to lake characteristics, and ranges from $75 to $146. The estimated total direct
spending associated with Iowa’s 139 lake visits in 2014 is slightly less than $1 billon, average direct spending per
lake is $700,000.
7 To consider an increase in cost of living, we use the Consumer Price Index (CPI).
10
Tables and Figures
Table 1. Iowa Lakes Included in Survey DNR Lake ID Lake DNR
Lake ID Lake
AHL85 Ada Hayden Lake* SMI55 Lake Smith ARB79 Arbor Lake SUG89 Lake Sugema ARR81 Arrowhead Lake (Sac County) WAP26 Lake Wapello ARR78 Arrowhead Lake (Pottawattamie County) LRI27 Little River ASA09 Avenue of the Saints Lake LSP97 Little Sioux Park Lake BAC61 Badger Creek Lake LSP30 Little Spirit Lake BAD94 Badger Lake LWA40 Little Wall Lake BEA25 Beaver Lake LIT05 Littlefield Lake BEE35 Beeds Lake LIZ76 Lizard Lake* BDL54 Belva Deer Lake* LGR82 Lost Grove Lake* BIC77 Big Creek Lake LIS74 Lost Island Lake BHO29 Big Hollow Lake* LGA30 Lower Gar Lake SPL30 Big Spirit Lake LPI42 Lower Pine Lake BHA81 Black Hawk Lake MAP83 Manteno Lake BLU67 Blue Lake MAR50 Mariposa Lake RRP77 Blue Heron Lake* MEA01 Meadow Lake BWH93 Bob White Lake MEY07 Meyers Lake BWO40 Briggs Woods Lake MIC71 Mill Creek (Lake) BRO97 Browns Lake MIN30 Lake Minnewashta BRC94 Brushy Creek Lake MIT07 Mitchell Lake CAR78 Carter Lake MOO47 Moorehead Lake CAS86 Casey Lake (aka Hickory Hills Lake) MTR01 Mormon Trail Lake CEN30 Center Lake NEL24 Nelson Park Lake CEN53 Central Park Lake NEA27 Nine Eagles Lake CLE17 Clear Lake NOD01 Nodaway Lake* CSP15 Cold Springs Lake NTW13 North Twin Lake COR52 Coralville Lake OLD67 Oldham Lake CRC47 Crawford Creek Impoundment ORI01 Lake Orient CRY41 Crystal Lake OTC86 Otter Creek Lake DMA77 Dale Maffitt Lake** OTL90 Ottumwa Lagoon DBE43 DeSoto Bend Lake PIC73 Pierce Creek Lake DIA79 Diamond Lake PLC57 Pleasant Creek Lake DCR71 Dog Creek Lake POL56 Pollmiller Park Lake DWI08 Don Williams Lake PRO83 Prairie Rose Lake EOS20 East Lake (Osceola) RAT04 Rathbun Lake EOK30 East Okoboji Lake RHA59 Red Haw Lake EAS77 Easter Lake RRO63 Red Rock Lake ESH41 Eldred Sherwood Lake ROC63 Roberts Creek Lake FIS74 Five Island Lake ROC50 Rock Creek Lake FOG80 Fogle Lake ROG06 Rodgers Park Lake
11
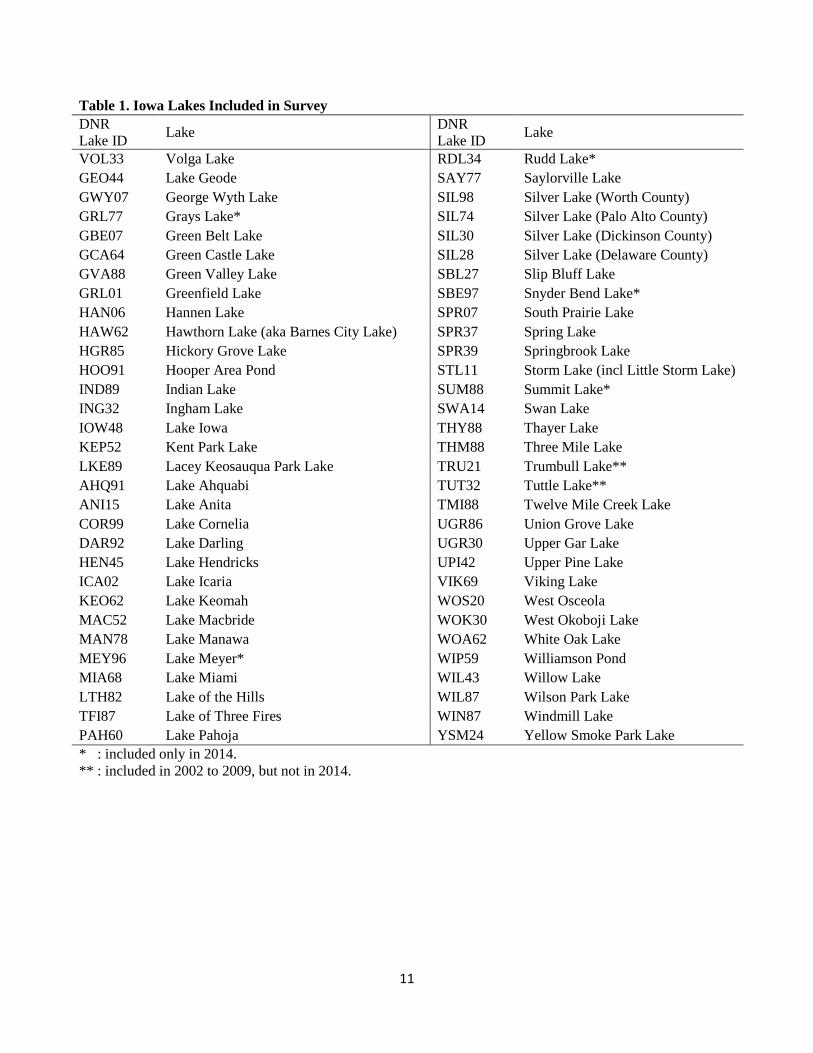
Table 1. Iowa Lakes Included in Survey DNR Lake ID Lake DNR
Lake ID Lake
VOL33 Volga Lake RDL34 Rudd Lake* GEO44 Lake Geode SAY77 Saylorville Lake GWY07 George Wyth Lake SIL98 Silver Lake (Worth County) GRL77 Grays Lake* SIL74 Silver Lake (Palo Alto County) GBE07 Green Belt Lake SIL30 Silver Lake (Dickinson County) GCA64 Green Castle Lake SIL28 Silver Lake (Delaware County) GVA88 Green Valley Lake SBL27 Slip Bluff Lake GRL01 Greenfield Lake SBE97 Snyder Bend Lake* HAN06 Hannen Lake SPR07 South Prairie Lake HAW62 Hawthorn Lake (aka Barnes City Lake) SPR37 Spring Lake HGR85 Hickory Grove Lake SPR39 Springbrook Lake HOO91 Hooper Area Pond STL11 Storm Lake (incl Little Storm Lake) IND89 Indian Lake SUM88 Summit Lake* ING32 Ingham Lake SWA14 Swan Lake IOW48 Lake Iowa THY88 Thayer Lake KEP52 Kent Park Lake THM88 Three Mile Lake LKE89 Lacey Keosauqua Park Lake TRU21 Trumbull Lake** AHQ91 Lake Ahquabi TUT32 Tuttle Lake** ANI15 Lake Anita TMI88 Twelve Mile Creek Lake COR99 Lake Cornelia UGR86 Union Grove Lake DAR92 Lake Darling UGR30 Upper Gar Lake HEN45 Lake Hendricks UPI42 Upper Pine Lake ICA02 Lake Icaria VIK69 Viking Lake KEO62 Lake Keomah WOS20 West Osceola MAC52 Lake Macbride WOK30 West Okoboji Lake MAN78 Lake Manawa WOA62 White Oak Lake MEY96 Lake Meyer* WIP59 Williamson Pond MIA68 Lake Miami WIL43 Willow Lake LTH82 Lake of the Hills WIL87 Wilson Park Lake TFI87 Lake of Three Fires WIN87 Windmill Lake PAH60 Lake Pahoja YSM24 Yellow Smoke Park Lake * : included only in 2014. ** : included in 2002 to 2009, but not in 2014.
12
Table 2. Single-Day Trips to Iowa Lakes
No. DNR ID Lake Total Mean 1 S.E. Mean 2 Mean 3 Share (%) 1 AHL85 Ada Hayden Lake 780 0.220 0.031 0.367 6.846 2.63 2 ARB79 Arbor Lake 93 0.026 0.009 0.044 5.813 0.31 3 ARR81 Arrowhead Lake (Sac County) 60 0.017 0.005 0.028 3.529 0.20 4 ARR78 Arrowhead Lake (Pottawattamie County) 98 0.028 0.008 0.046 3.920 0.33 5 ASA09 Avenue of the Saints Lake 28 0.008 0.002 0.013 1.647 0.09 6 BAC61 Badger Creek Lake 132 0.037 0.008 0.062 3.568 0.45 7 BAD94 Badger Lake 123 0.035 0.008 0.058 3.154 0.42 8 BEA25 Beaver Lake 82 0.023 0.009 0.039 3.565 0.28 9 BEE35 Beeds Lake 184 0.052 0.013 0.087 3.290 0.62
10 BDL54 Belva Deer Lake 255 0.072 0.018 0.120 4.250 0.86 11 BIC77 Big Creek Lake 1,117 0.314 0.029 0.526 4.329 3.77 12 BHO29 Big Hollow Lake 128 0.036 0.009 0.060 3.459 0.43 13 SPL30 Big Spirit Lake 774 0.218 0.028 0.364 4.553 2.61 14 BHA81 Black Hawk Lake 205 0.058 0.009 0.096 2.808 0.69 15 BLU67 Blue Lake 120 0.034 0.010 0.056 3.750 0.40 16 RRP77 Blue Heron Lake 139 0.039 0.012 0.065 4.964 0.47 17 BWH93 Bob White Lake 31 0.009 0.003 0.015 2.385 0.10 18 BWO40 Briggs Woods Lake 141 0.040 0.009 0.066 3.917 0.48 19 BRO97 Browns Lake 158 0.044 0.009 0.074 3.362 0.53 20 BRC94 Brushy Creek Lake 423 0.119 0.019 0.199 3.585 1.43 21 CAR78 Carter Lake 94 0.027 0.009 0.044 3.932 0.32 22 CAS86 Casey Lake (aka Hickory Hills Lake) 77 0.022 0.004 0.036 1.974 0.26 23 CEN30 Center Lake 71 0.020 0.006 0.033 2.840 0.24 24 CEN53 Central Park Lake 102 0.029 0.008 0.048 3.643 0.34 25 CLE17 Clear Lake 1,549 0.436 0.047 0.729 5.758 5.23 26 CSP15 Cold Springs Lake 93 0.026 0.007 0.044 5.167 0.31 27 COR52 Coralville Lake 947 0.266 0.027 0.446 4.101 3.20 28 CRC47 Crawford Creek Impoundment 66 0.019 0.005 0.031 2.750 0.22 29 CRY41 Crystal Lake 188 0.053 0.013 0.089 3.922 0.64 30 DBE43 DeSoto Bend Lake 90 0.025 0.006 0.042 2.308 0.30 31 DIA79 Diamond Lake 133 0.038 0.012 0.063 3.923 0.45
13
Table 2. Single-Day Trips to Iowa Lakes (continued) No. DNR ID Lake Total Mean 1 S.E. Mean 2 Mean 3 Share (%)
32 DCR71 Dog Creek Lake 62 0.017 0.006 0.029 3.100 0.21 33 DWI08 Don Williams Lake 169 0.048 0.009 0.080 2.864 0.57 34 EOS20 East Lake (Osceola) 128 0.036 0.015 0.060 5.818 0.43 35 EOK30 East Okoboji Lake 868 0.244 0.029 0.408 4.405 2.93 36 EAS77 Easter Lake 282 0.079 0.017 0.133 3.357 0.95 37 ESH41 Eldred Sherwood Lake 21 0.006 0.003 0.010 3.000 0.07 38 FIS74 Five Island Lake 209 0.059 0.018 0.098 5.225 0.71 39 FOG80 Fogle Lake 50 0.014 0.007 0.024 5.000 0.17 40 VOL33 Volga Lake 222 0.062 0.012 0.104 3.639 0.75 41 GEO44 Lake Geode 244 0.069 0.012 0.115 3.813 0.82 42 GWY07 George Wyth Lake 573 0.161 0.024 0.270 4.775 1.93 43 GRL77 Grays Lake 1,142 0.321 0.036 0.537 5.336 3.85 44 GBE07 Green Belt Lake 84 0.024 0.015 0.040 6.462 0.28 45 GCA64 Green Castle Lake 39 0.011 0.003 0.018 2.786 0.13 46 GVA88 Green Valley Lake 157 0.044 0.011 0.074 3.925 0.53 47 GRL01 Greenfield Lake 111 0.031 0.010 0.052 4.443 0.37 48 HAN06 Hannen Lake 120 0.034 0.009 0.056 3.077 0.40 49 HAW62 Hawthorn Lake (aka Barnes City Lake) 71 0.020 0.005 0.033 3.087 0.24 50 HGR85 Hickory Grove Lake 155 0.044 0.008 0.073 2.719 0.52 51 HOO91 Hooper Area Pond 44 0.012 0.004 0.021 3.667 0.15 52 IND89 Indian Lake 62 0.017 0.005 0.029 3.263 0.21 53 ING32 Ingham Lake 62 0.017 0.004 0.029 2.583 0.21 54 IOW48 Lake Iowa 152 0.043 0.011 0.072 3.102 0.51 55 KEP52 Kent Park Lake 220 0.062 0.012 0.104 2.933 0.74 56 LKE89 Lacey Keosauqua Park Lake 146 0.041 0.008 0.069 2.607 0.49 57 AHQ91 Lake Ahquabi 316 0.089 0.015 0.149 3.950 1.07 58 ANI15 Lake Anita 167 0.047 0.009 0.079 3.408 0.56 59 COR99 Lake Cornelia 234 0.066 0.019 0.110 5.707 0.79 60 DAR92 Lake Darling 170 0.048 0.011 0.080 2.982 0.57 61 HEN45 Lake Hendricks 110 0.031 0.009 0.052 3.667 0.37 62 ICA02 Lake Icaria 155 0.044 0.012 0.073 3.100 0.52 63 KEO62 Lake Keomah 75 0.021 0.006 0.035 3.000 0.25
14
Table 2. Single-Day Trips to Iowa Lakes (continued) No. DNR ID Lake Total Mean 1 S.E. Mean 2 Mean 3 Share (%)
64 MAC52 Lake Macbride 1,004 0.282 0.033 0.472 4.272 3.39 65 MAN78 Lake Manawa 472 0.133 0.028 0.222 7.614 1.59 66 MEY96 Lake Meyer 67 0.019 0.004 0.032 2.161 0.23 67 MIA68 Lake Miami 47 0.013 0.004 0.022 2.474 0.16 68 LTH82 Lake of the Hills 198 0.056 0.011 0.093 4.400 0.67 69 TFI87 Lake of Three Fires 46 0.013 0.004 0.022 2.556 0.16 70 PAH60 Lake Pahoja 60 0.017 0.005 0.028 3.000 0.20 71 SMI55 Lake Smith 74 0.021 0.007 0.035 4.353 0.25 72 SUG89 Lake Sugema 208 0.058 0.013 0.098 5.061 0.70 73 WAP26 Lake Wapello 121 0.034 0.007 0.057 3.270 0.41 74 LRI27 Little River 70 0.020 0.005 0.033 2.692 0.24 75 LSP97 Little Sioux Park Lake 78 0.022 0.007 0.037 3.120 0.26 76 LSP30 Little Spirit Lake 138 0.039 0.006 0.065 2.556 0.47 77 LWA40 Little Wall Lake 162 0.046 0.009 0.076 3.176 0.55 78 LIT05 Littlefield Lake 126 0.035 0.012 0.059 5.250 0.43 79 LIZ76 Lizard Lake 15 0.004 0.002 0.007 1.667 0.05 80 LGR82 Lost Grove Lake 198 0.056 0.011 0.093 3.143 0.67 81 LIS74 Lost Island Lake 259 0.073 0.018 0.122 4.625 0.87 82 LGA30 Lower Gar Lake 271 0.076 0.015 0.127 4.919 0.91 83 LPI42 Lower Pine Lake 200 0.056 0.015 0.094 4.255 0.67 84 MAP83 Manteno Lake 40 0.011 0.006 0.019 5.714 0.13 85 MAR50 Mariposa Lake 91 0.026 0.010 0.043 4.333 0.31 86 MEA01 Meadow Lake 25 0.007 0.002 0.012 2.500 0.08 87 MEY07 Meyers Lake 85 0.024 0.009 0.040 3.148 0.29 88 MIC71 Mill Creek (Lake) 120 0.034 0.011 0.056 5.455 0.40 89 MIN30 Lake Minnewashta 226 0.064 0.014 0.106 5.139 0.76 90 MIT07 Mitchell Lake 50 0.014 0.005 0.024 3.333 0.17 91 MOO47 Moorehead Lake 63 0.018 0.006 0.030 4.500 0.21 92 MTR01 Mormon Trail Lake 41 0.012 0.004 0.019 2.929 0.14 93 NEL24 Nelson Park Lake 41 0.012 0.004 0.019 2.563 0.14 94 NEA27 Nine Eagles Lake 53 0.015 0.005 0.025 2.650 0.18 95 NOD01 Nodaway Lake 84 0.024 0.010 0.040 5.631 0.29
15
Table 2. Single-Day Trips to Iowa Lakes (continued) No. DNR ID Lake Total Mean 1 S.E. Mean 2 Mean 3 Share (%)
96 NTW13 North Twin Lake 164 0.046 0.012 0.077 3.500 0.56 97 OLD67 Oldham Lake 23 0.006 0.003 0.011 3.286 0.08 98 ORI01 Lake Orient 74 0.021 0.008 0.035 4.111 0.25 99 OTC86 Otter Creek Lake 110 0.031 0.010 0.052 3.548 0.37
100 OTL90 Ottumwa Lagoon 175 0.049 0.017 0.082 6.250 0.59 101 PIC73 Pierce Creek Lake 3 0.001 0.001 0.001 3.000 0.01 102 PLC57 Pleasant Creek Lake 415 0.117 0.017 0.195 3.990 1.40 103 POL56 Pollmiller Park Lake 105 0.030 0.008 0.049 4.773 0.35 104 PRO83 Prairie Rose Lake 92 0.026 0.008 0.043 3.407 0.31 105 RAT04 Rathbun Lake 557 0.157 0.021 0.262 3.201 1.88 106 RHA59 Red Haw Lake 138 0.039 0.011 0.065 3.632 0.47 107 RRO63 Red Rock Lake 893 0.251 0.031 0.420 4.556 3.01 108 ROC63 Roberts Creek Lake 185 0.052 0.014 0.087 3.776 0.62 109 ROC50 Rock Creek Lake 197 0.055 0.012 0.093 3.397 0.66 110 ROG06 Rodgers Park Lake 57 0.016 0.009 0.027 4.071 0.19 111 RDL34 Rudd Lake 101 0.028 0.009 0.048 4.591 0.34 112 SAY77 Saylorville Lake 1,882 0.529 0.047 0.886 5.774 6.35 113 SIL98 Silver Lake (Worth County) 34 0.010 0.005 0.016 3.091 0.11 114 SIL74 Silver Lake (Palo Alto County) 109 0.031 0.009 0.051 5.190 0.37 115 SIL30 Silver Lake (Dickinson County) 141 0.040 0.010 0.066 3.711 0.48 116 SIL28 Silver Lake (Delaware County) 61 0.017 0.007 0.029 4.067 0.21 117 SBL27 Slip Bluff Lake 13 0.004 0.002 0.006 2.167 0.04 118 SBE97 Snyder Bend Lake 92 0.026 0.007 0.043 3.286 0.31 119 SPR07 South Prairie Lake 221 0.062 0.019 0.104 7.367 0.75 120 SPR37 Spring Lake 152 0.043 0.017 0.071 5.840 0.51 121 SPR39 Springbrook Lake 111 0.031 0.009 0.052 3.171 0.37 122 STL11 Storm Lake (incl Little Storm Lake) 580 0.163 0.029 0.273 5.273 1.96 123 SUM88 Summit Lake 28 0.008 0.003 0.013 4.000 0.09 124 SWA14 Swan Lake 272 0.076 0.021 0.128 5.430 0.92 125 THY88 Thayer Lake 16 0.005 0.002 0.008 2.286 0.05 126 THM88 Three Mile Lake 257 0.072 0.020 0.121 4.849 0.87 127 TMI88 Twelve Mile Creek Lake 176 0.050 0.010 0.083 2.933 0.59
16
Table 2. Single-Day Trips to Iowa Lakes (continued) No. DNR ID Lake Total Mean 1 S.E. Mean 2 Mean 3 Share (%)
128 UGR86 Union Grove Lake 124 0.035 0.011 0.058 3.875 0.42 129 UGR30 Upper Gar Lake 274 0.077 0.015 0.129 4.724 0.92 130 UPI42 Upper Pine Lake 192 0.054 0.014 0.090 3.918 0.65 131 VIK69 Viking Lake 198 0.056 0.015 0.093 5.211 0.67 132 WOS20 West Osceola 122 0.034 0.008 0.057 3.577 0.41 133 WOK30 West Okoboji Lake 1,179 0.332 0.038 0.555 5.287 3.98 134 WOA62 White Oak Lake 31 0.009 0.003 0.015 2.214 0.10 135 WIP59 Williamson Pond 71 0.020 0.009 0.033 5.071 0.24 136 WIL43 Willow Lake 50 0.014 0.005 0.024 3.571 0.17 137 WIL87 Wilson Park Lake 4 0.001 0.001 0.002 2.000 0.01 138 WIN87 Windmill Lake 21 0.006 0.002 0.010 2.333 0.07 139 YSM24 Yellow Smoke Park Lake 98 0.027 0.007 0.046 3.490 0.33 140 - Other lake1 in Iowa 796 0.224 0.033 0.375 6.370 - 141 - Other lake2 in Iowa 172 0.048 0.016 0.081 6.143 -
Total 30,601 8.608 14.401 Mean 1: average sample trips to lake. Mean 2: average trips to lake by all trip-takers. Mean 3: average trips for trip-takers at that lake.
17
Table 3. Overnight Trips to Iowa Lakes No. DNRID Lake Total Mean 1 S.E. Mean 2 Mean 3 Share (%) 1 AHL85 Ada Hayden Lake 2 0.001 0.001 0.003 2.000 0.04 2 ARB79 Arbor Lake 2 0.001 0.001 0.003 2.000 0.04 3 ARR81 Arrowhead Lake (Sac County) 11 0.003 0.002 0.014 2.750 0.20 4 ARR78 Arrowhead Lake (Pottawattamie County) 8 0.002 0.001 0.010 1.600 0.14 5 ASA09 Avenue of the Saints Lake 2 0.001 0.001 0.003 2.000 0.04 6 BAC61 Badger Creek Lake 3 0.001 0.001 0.004 1.500 0.05 7 BAD94 Badger Lake 18 0.005 0.002 0.023 3.000 0.32 8 BEA25 Beaver Lake 5 0.001 0.001 0.006 2.500 0.09 9 BEE35 Beeds Lake 48 0.014 0.007 0.062 3.200 0.85 10 BDL54 Belva Deer Lake 62 0.017 0.006 0.080 2.952 1.10 11 BIC77 Big Creek Lake 27 0.008 0.003 0.035 2.700 0.48 12 BHO29 Big Hollow Lake 8 0.002 0.001 0.010 2.667 0.14 13 SPL30 Big Spirit Lake 162 0.046 0.008 0.208 2.945 2.88 14 BHA81 Black Hawk Lake 106 0.030 0.009 0.136 3.533 1.88 15 BLU67 Blue Lake 36 0.010 0.005 0.046 3.000 0.64 16 RRP77 Blue Heron Lake 4 0.001 0.001 0.005 4.000 0.07 17 BWH93 Bob White Lake 8 0.002 0.002 0.010 4.000 0.14 18 BWO40 Briggs Woods Lake 41 0.012 0.004 0.053 3.727 0.73 19 BRO97 Browns Lake 24 0.007 0.003 0.031 4.000 0.43 20 BRC94 Brushy Creek Lake 92 0.026 0.007 0.118 2.968 1.63 21 CAR78 Carter Lake 6 0.002 0.001 0.008 2.000 0.11 22 CAS86 Casey Lake (aka Hickory Hills Lake) 15 0.004 0.002 0.019 1.667 0.27 23 CEN30 Center Lake 32 0.009 0.006 0.041 4.000 0.57 24 CEN53 Central Park Lake 25 0.007 0.002 0.032 2.273 0.44 25 CLE17 Clear Lake 433 0.122 0.024 0.555 5.342 7.69 26 CSP15 Cold Springs Lake 8 0.002 0.001 0.010 2.667 0.14 27 COR52 Coralville Lake 168 0.047 0.009 0.216 4.421 2.98 28 CRC47 Crawford Creek Impoundment 12 0.003 0.002 0.015 2.400 0.21 29 CRY41 Crystal Lake 55 0.015 0.008 0.071 6.111 0.98 30 DBE43 DeSoto Bend Lake 6 0.002 0.001 0.008 3.000 0.11 31 DIA79 Diamond Lake 34 0.010 0.004 0.044 3.778 0.60 32 DCR71 Dog Creek Lake 8 0.002 0.001 0.010 2.000 0.14
18
Table 3. Overnight Trips to Iowa Lakes No. DNRID Lake Total Mean 1 S.E. Mean 2 Mean 3 Share (%) 33 DWI08 Don Williams Lake 38 0.011 0.005 0.049 4.222 0.68 34 EOS20 East Lake (Osceola) 7 0.002 0.001 0.009 2.333 0.12 35 EOK30 East Okoboji Lake 513 0.144 0.029 0.658 5.571 9.11 36 EAS77 Easter Lake 18 0.005 0.004 0.023 6.000 0.32 37 ESH41 Eldred Sherwood Lake 6 0.002 0.001 0.008 2.000 0.11 38 FIS74 Five Island Lake 12 0.003 0.002 0.015 2.000 0.21 39 FOG80 Fogle Lake 7 0.002 0.001 0.009 1.750 0.12 40 VOL33 Volga Lake 15 0.004 0.002 0.019 1.500 0.27 41 GEO44 Lake Geode 28 0.008 0.002 0.036 2.000 0.50 42 GWY07 George Wyth Lake 25 0.007 0.002 0.032 1.667 0.44 43 GRL77 Grays Lake 2 0.001 0.001 0.003 2.000 0.04 44 GBE07 Green Belt Lake 6 0.002 0.001 0.008 2.000 0.11 45 GCA64 Green Castle Lake 4 0.001 0.001 0.005 4.000 0.07 46 GVA88 Green Valley Lake 25 0.007 0.002 0.032 1.563 0.44 47 GRL01 Greenfield Lake 2 0.001 0.001 0.003 2.000 0.04 48 HAN06 Hannen Lake 23 0.006 0.003 0.030 2.556 0.41 49 HAW62 Hawthorn Lake (aka Barnes City Lake) 13 0.004 0.002 0.017 3.250 0.23 50 HGR85 Hickory Grove Lake 40 0.011 0.004 0.051 2.667 0.71 51 HOO91 Hooper Area Pond 3 0.001 0.001 0.004 1.500 0.05 52 IND89 Indian Lake 13 0.004 0.002 0.017 2.600 0.23 53 ING32 Ingham Lake 3 0.001 0.001 0.004 1.500 0.05 54 IOW48 Lake Iowa 26 0.007 0.003 0.033 2.364 0.46 55 KEP52 Kent Park Lake 16 0.005 0.002 0.021 1.778 0.28 56 LKE89 Lacey Keosauqua Park Lake 46 0.013 0.003 0.059 2.190 0.82 57 AHQ91 Lake Ahquabi 51 0.014 0.008 0.065 3.643 0.91 58 ANI15 Lake Anita 59 0.017 0.008 0.076 3.688 1.05 59 COR99 Lake Cornelia 88 0.025 0.012 0.113 8.778 1.56 60 DAR92 Lake Darling 27 0.008 0.003 0.035 2.455 0.48 61 HEN45 Lake Hendricks 15 0.004 0.002 0.019 2.500 0.27 62 ICA02 Lake Icaria 17 0.005 0.002 0.022 2.125 0.30 63 KEO62 Lake Keomah 14 0.004 0.002 0.018 2.000 0.25 64 MAC52 Lake Macbride 50 0.014 0.003 0.064 1.724 0.89
19
Table 3. Overnight Trips to Iowa Lakes No. DNRID Lake Total Mean 1 S.E. Mean 2 Mean 3 Share (%) 65 MAN78 Lake Manawa 13 0.004 0.002 0.017 2.167 0.23 66 MEY96 Lake Meyer 13 0.004 0.001 0.017 1.857 0.23 67 MIA68 Lake Miami 8 0.002 0.001 0.010 2.667 0.14 68 LTH82 Lake of the Hills 48 0.014 0.008 0.062 4.800 0.85 69 TFI87 Lake of Three Fires 27 0.008 0.002 0.035 2.250 0.48 70 PAH60 Lake Pahoja 43 0.012 0.009 0.055 6.143 0.76 71 SMI55 Lake Smith 2 0.001 0.001 0.003 2.000 0.04 72 SUG89 Lake Sugema 63 0.018 0.007 0.081 3.938 1.12 73 WAP26 Lake Wapello 24 0.007 0.003 0.031 2.400 0.43 74 LRI27 Little River 42 0.012 0.007 0.054 6.000 0.75 75 LSP97 Little Sioux Park Lake 23 0.006 0.004 0.030 4.600 0.41 76 LSP30 Little Spirit Lake 59 0.017 0.008 0.076 4.538 1.05 77 LWA40 Little Wall Lake 51 0.014 0.008 0.065 5.667 0.91 78 LIT05 Littlefield Lake 19 0.005 0.002 0.024 2.714 0.34 79 LIZ76 Lizard Lake 2 0.001 0.001 0.003 2.000 0.04 80 LGR82 Lost Grove Lake 4 0.001 0.001 0.005 1.333 0.07 81 LIS74 Lost Island Lake 93 0.026 0.014 0.120 7.167 1.66 82 LGA30 Lower Gar Lake 63 0.018 0.007 0.081 5.250 1.12 83 LPI42 Lower Pine Lake 24 0.007 0.003 0.031 2.000 0.43 84 MAP83 Manteno Lake 11 0.003 0.002 0.014 2.750 0.20 85 MAR50 Mariposa Lake 4 0.001 0.001 0.005 1.333 0.07 86 MEA01 Meadow Lake 3 0.001 0.001 0.004 3.000 0.05 87 MEY07 Meyers Lake 33 0.009 0.008 0.042 16.500 0.59 88 MIC71 Mill Creek (Lake) 10 0.003 0.002 0.013 2.000 0.18 89 MIN30 Lake Minnewashta 41 0.012 0.007 0.053 5.857 0.73 90 MIT07 Mitchell Lake 2 0.001 0.001 0.003 2.000 0.04 91 MOO47 Moorehead Lake 4 0.001 0.001 0.005 4.000 0.07 92 MTR01 Mormon Trail Lake 4 0.001 0.001 0.005 4.000 0.07 93 NEL24 Nelson Park Lake 7 0.002 0.001 0.009 2.333 0.12 94 NEA27 Nine Eagles Lake 28 0.008 0.003 0.036 3.111 0.50 95 NOD01 Nodaway Lake 8 0.002 0.001 0.010 2.000 0.14 96 NTW13 North Twin Lake 73 0.021 0.011 0.094 7.333 1.30
20
Table 3. Overnight Trips to Iowa Lakes No. DNRID Lake Total Mean 1 S.E. Mean 2 Mean 3 Share (%) 97 OLD67 Oldham Lake 4 0.001 0.001 0.005 4.000 0.07 98 ORI01 Lake Orient 2 0.001 0.001 0.003 2.000 0.04 99 OTC86 Otter Creek Lake 14 0.004 0.002 0.018 2.333 0.25
100 OTL90 Ottumwa Lagoon 11 0.003 0.002 0.014 3.667 0.20 101 PIC73 Pierce Creek Lake 3 0.001 0.001 0.004 3.000 0.05 102 PLC57 Pleasant Creek Lake 50 0.014 0.004 0.064 2.778 0.89 103 POL56 Pollmiller Park Lake 18 0.005 0.003 0.023 3.000 0.32 104 PRO83 Prairie Rose Lake 25 0.007 0.003 0.032 2.500 0.44 105 RAT04 Rathbun Lake 322 0.090 0.018 0.413 3.533 5.71 106 RHA59 Red Haw Lake 31 0.009 0.004 0.040 3.444 0.55 107 RRO63 Red Rock Lake 187 0.053 0.012 0.240 3.596 3.32 108 ROC63 Roberts Creek Lake 29 0.008 0.003 0.037 2.417 0.52 109 ROC50 Rock Creek Lake 51 0.014 0.005 0.065 3.000 0.91 110 ROG06 Rodgers Park Lake 5 0.001 0.001 0.006 1.667 0.09 111 RDL34 Rudd Lake 5 0.001 0.001 0.006 2.500 0.09 112 SAY77 Saylorville Lake 128 0.036 0.008 0.164 2.976 2.27 113 SIL98 Silver Lake (Worth County) 2 0.001 0.001 0.003 2.000 0.04 114 SIL74 Silver Lake (Palo Alto County) 3 0.001 0.001 0.004 3.000 0.05 115 SIL30 Silver Lake (Dickinson County) 59 0.017 0.010 0.076 8.429 1.05 116 SIL28 Silver Lake (Delaware County) 2 0.001 0.001 0.003 2.000 0.04 117 SBL27 Slip Bluff Lake 7 0.002 0.001 0.009 3.500 0.12 118 SBE97 Snyder Bend Lake 24 0.007 0.003 0.031 2.667 0.43 119 SPR07 South Prairie Lake 4 0.001 0.001 0.005 4.000 0.07 120 SPR37 Spring Lake 44 0.012 0.005 0.056 3.667 0.78 121 SPR39 Springbrook Lake 24 0.007 0.002 0.031 1.714 0.43 122 STL11 Storm Lake (incl Little Storm Lake) 63 0.018 0.005 0.081 2.625 1.12 123 SUM88 Summit Lake 4 0.001 0.001 0.005 4.000 0.07 124 SWA14 Swan Lake 14 0.004 0.002 0.018 2.000 0.25 125 THY88 Thayer Lake 2 0.001 0.001 0.003 2.000 0.04 126 THM88 Three Mile Lake 55 0.015 0.004 0.071 2.500 0.98 127 TMI88 Twelve Mile Creek Lake 45 0.013 0.004 0.058 2.800 0.80 128 UGR86 Union Grove Lake 9 0.003 0.001 0.012 1.500 0.16
21
Table 3. Overnight Trips to Iowa Lakes No. DNRID Lake Total Mean 1 S.E. Mean 2 Mean 3 Share (%) 129 UGR30 Upper Gar Lake 48 0.014 0.007 0.062 4.000 0.85 130 UPI42 Upper Pine Lake 24 0.007 0.002 0.031 1.846 0.43 131 VIK69 Viking Lake 22 0.006 0.002 0.028 1.538 0.38 132 WOS20 West Osceola 16 0.005 0.002 0.021 3.200 0.28 133 WOK30 West Okoboji Lake 704 0.198 0.032 0.904 5.104 12.51 134 WOA62 White Oak Lake 4 0.001 0.001 0.005 4.000 0.07 135 WIP59 Williamson Pond 2 0.001 0.001 0.003 2.000 0.04 136 WIL43 Willow Lake 19 0.005 0.003 0.024 4.750 0.34 137 WIL87 Wilson Park Lake 4 0.001 0.001 0.005 2.000 0.07 138 WIN87 Windmill Lake 2 0.001 0.001 0.003 2.000 0.04 139 YSM24 Yellow Smoke Park Lake 7 0.002 0.001 0.009 1.750 0.12 140 - Other lake1 in Iowa 117 0.033 0.011 0.150 5.087 - 141 - Other lake2 in Iowa 14 0.004 0.002 0.018 2.800 -
Total 5,760 1.620 7.394
22
Table 4. Single-Day Trips to Bordering State Lakes and Rivers
Lake Total Mean S.E. Min Max
Lakes in Minnesota 824 0.232 0.025 0 50
Lakes in Missouri 514 0.145 0.019 0 27
Lakes in Nebraska 136 0.038 0.006 0 10
Lakes in South Dakota 281 0.079 0.011 0 15
Lakes in Wisconsin 538 0.151 0.021 0 30
Missouri River 657 0.185 0.020 0 30
Mississippi River 4,044 1.138 0.067 0 50
Table 5. Overnight Trips to Bordering State Lakes and Rivers
Lake Total Mean S.E. Min Max
Lakes in Minnesota 1,083 0.305 0.025 0 30
Lakes in Missouri 752 0.212 0.027 0 33
Lakes in Nebraska 48 0.014 0.003 0 8
Lakes in South Dakota 338 0.095 0.013 0 20
Lakes in Wisconsin 548 0.154 0.019 0 40
Missouri River 242 0.068 0.017 0 30
Mississippi River 852 0.240 0.025 0 40
23
Table 6. Estimated Household Trips
DNR 2002 2003 2004 2005 2009 5 Yr Ave 2014
Lake ID Lake Mean S.E. Lower Upper AHL85 Ada Hayden Lake - - - - - - 217,178 17,131 183,602 250,754 ARB79 Arbor Lake 31,087 39,462 26,614 24,185 20,611 28,392 27,112 4,883 17,541 36,682 ARR81 Arrowhead Lake (Sac County) 8,527 11,788 12,628 12,189 10,296 11,086 20,029 3,871 12,442 27,616 ARR78 Arrowhead Lake (Pottawattamie County) 40,286 39,406 35,694 42,354 23,619 36,272 31,673 5,354 21,179 42,166 ASA09 Avenue of the Saints Lake 16,803 16,628 22,671 16,695 20,772 18,714 7,668 956 5,794 9,542 BAC61 Badger Creek Lake 74,291 74,752 62,145 58,635 48,857 63,736 40,123 4,855 30,608 49,639 BAD94 Badger Lake 78,957 93,249 66,826 68,575 36,075 68,737 37,738 4,437 29,040 46,435 BEA25 Beaver Lake 23,574 23,486 22,938 28,502 16,200 22,940 24,095 4,398 15,476 32,715 BEE35 Beeds Lake 80,568 89,139 82,652 90,205 44,597 77,432 54,558 7,686 39,493 69,623 BDL54 Belva Deer Lake - - - - - - 79,867 10,159 59,957 99,778 BIC77 Big Creek Lake 418,098 460,250 366,101 364,206 282,686 378,268 376,000 27,820 321,473 430,526 BHO29 Big Hollow Lake - - - - - - 41,185 5,182 31,029 51,340 SPL30 Big Spirit Lake 199,302 309,264 259,862 261,956 196,095 245,296 233,385 18,445 197,234 269,536 BHA81 Black Hawk Lake 101,790 109,222 116,043 116,271 83,650 105,395 64,499 7,132 50,521 78,477 BLU67 Blue Lake 42,132 53,803 57,908 53,780 35,246 48,574 39,097 5,866 27,600 50,594 RRP77 Blue Heron Lake - - - - - - 53,353 14,701 24,541 82,166 BWH93 Bob White Lake 7,170 13,955 11,976 12,311 5,165 10,115 9,046 1,590 5,930 12,162 BWO40 Briggs Woods Lake 53,167 64,497 54,489 63,907 49,421 57,096 42,557 5,430 31,915 53,199 BRO97 Browns Lake 52,934 63,939 57,934 56,562 45,507 55,375 50,417 6,237 38,192 62,643 BRC94 Brushy Creek Lake 131,088 159,335 156,702 149,098 104,666 140,178 126,566 11,327 104,365 148,767 CAR78 Carter Lake 53,385 58,958 50,586 68,693 45,786 55,482 23,632 3,737 16,308 30,957 CAS86 Casey Lake (aka Hickory Hills Lake) 35,208 54,439 50,956 48,153 33,181 44,387 22,865 2,245 18,464 27,265 CEN30 Center Lake 16,767 40,386 33,697 32,316 26,792 29,992 19,836 3,423 13,127 26,545 CEN53 Central Park Lake 53,794 44,621 41,928 50,708 32,529 44,716 34,341 6,365 21,865 46,817 CLE17 Clear Lake 381,209 410,013 370,513 373,239 315,948 370,184 436,211 26,350 384,567 487,856 CSP15 Cold Springs Lake 29,070 24,904 23,381 35,612 17,916 26,177 25,204 3,608 18,132 32,276 COR52 Coralville Lake 441,657 484,993 419,338 438,140 290,602 414,946 330,536 28,104 275,454 385,618 CRC47 Crawford Creek Impoundment 14,546 11,910 14,018 15,355 19,548 15,075 24,469 6,096 12,522 36,416 CRY41 Crystal Lake 46,270 53,449 34,493 38,139 32,361 40,942 47,381 4,835 37,905 56,857 DMA77 Dale Maffitt Lake 49,400 68,790 53,675 54,584 40,158 53,321 - - - -
24
Table 6. Estimated Household Trips
DNR 2002 2003 2004 2005 2009 5 Yr Ave 2014
Lake ID Lake Mean S.E. Lower Upper DBE43 DeSoto Bend Lake 59,336 61,763 50,150 53,869 43,138 53,651 26,635 3,233 20,298 32,972 DIA79 Diamond Lake 39,804 43,532 46,762 41,215 34,984 41,259 36,616 5,770 25,307 47,925 DCR71 Dog Creek Lake 10,823 22,145 22,464 20,987 16,338 18,551 17,745 2,698 12,458 23,033 DWI08 Don Williams Lake 90,426 74,245 77,687 74,435 55,666 74,492 49,811 4,716 40,567 59,054 EOS20 East Lake (Osceola) 44,978 38,781 45,053 45,844 38,099 42,551 38,826 8,405 22,352 55,300 EOK30 East Okoboji Lake 295,118 351,759 292,489 303,529 224,813 293,541 251,097 14,691 222,303 279,892 EAS77 Easter Lake 131,876 133,412 122,410 132,837 79,960 120,099 94,675 11,440 72,253 117,098 ESH41 Eldred Sherwood Lake 11,864 20,925 15,515 14,654 11,273 14,846 6,784 2,114 2,640 10,928 FIS74 Five Island Lake 67,973 81,704 62,366 82,147 68,348 72,508 47,593 4,564 38,647 56,539 FOG80 Fogle Lake 6,305 17,705 9,947 11,024 6,265 10,249 12,958 2,348 8,356 17,559 VOL33 Volga Lake 62,794 74,989 83,355 71,309 52,765 69,042 66,096 6,927 52,519 79,672 GEO44 Lake Geode 101,514 102,686 97,732 104,651 94,250 100,167 73,392 6,302 61,039 85,744 GWY07 George Wyth Lake 199,718 165,704 154,659 158,482 168,770 169,467 180,416 17,203 146,698 214,134 GRL77 Grays Lake - - - - - - 358,923 24,711 310,490 407,356 GBE07 Green Belt Lake 15,214 22,264 42,573 34,530 33,539 29,624 22,725 5,280 12,376 33,073 GCA64 Green Castle Lake 16,029 19,098 13,603 17,233 13,080 15,809 11,558 1,860 7,912 15,204 GVA88 Green Valley Lake 56,565 70,893 67,285 71,942 36,783 60,694 44,756 5,445 34,083 55,428 GRL01 Greenfield Lake 16,171 25,795 24,533 31,050 28,044 25,118 29,990 4,697 20,785 39,196 HAN06 Hannen Lake 50,725 53,509 61,148 59,610 34,898 51,978 37,704 5,541 26,845 48,563 HAW62 Hawthorn Lake (aka Barnes City Lake) 58,821 49,528 55,540 50,189 25,938 48,003 21,475 3,082 15,433 27,516 HGR85 Hickory Grove Lake 72,566 62,080 62,327 56,580 47,948 60,300 43,836 4,311 35,387 52,284 HOO91 Hooper Area Pond 12,038 13,924 15,418 17,163 18,042 15,317 12,422 2,201 8,108 16,735 IND89 Indian Lake 16,522 20,807 19,119 22,678 15,048 18,835 18,461 2,893 12,791 24,132 ING32 Ingham Lake 27,302 30,262 24,376 35,237 19,405 27,316 15,825 1,756 12,384 19,267 IOW48 Lake Iowa 35,582 58,852 42,147 48,697 39,750 45,006 54,199 8,948 36,661 71,736 KEP52 Kent Park Lake 92,654 99,702 79,869 88,045 78,375 87,729 66,181 5,977 54,466 77,896 LKE89 Lacey Keosauqua Park Lake 63,809 55,833 55,189 51,542 40,332 53,341 45,184 4,713 35,945 54,422 AHQ91 Lake Ahquabi 92,908 138,969 116,833 129,368 98,118 115,239 99,994 9,558 81,261 118,727 ANI15 Lake Anita 49,750 59,944 53,536 54,410 47,019 52,932 46,366 4,354 37,834 54,899 COR99 Lake Cornelia 54,227 80,153 75,414 71,118 49,135 66,009 69,051 9,959 49,531 88,571
25
Table 6. Estimated Household Trips
DNR 2002 2003 2004 2005 2009 5 Yr Ave 2014
Lake ID Lake Mean S.E. Lower Upper DAR92 Lake Darling 77,838 79,695 57,567 74,118 43,551 66,554 47,553 5,016 37,722 57,385 HEN45 Lake Hendricks 15,538 37,525 24,823 24,194 18,949 24,206 28,442 3,335 21,906 34,979 ICA02 Lake Icaria 65,889 68,288 57,758 61,047 40,540 58,704 41,344 4,341 32,836 49,852 KEO62 Lake Keomah 48,354 54,157 48,746 45,855 37,672 46,957 22,673 3,385 16,039 29,308 MAC52 Lake Macbride 292,773 163,220 296,738 291,093 212,649 251,295 334,914 26,119 283,721 386,106 MAN78 Lake Manawa 196,768 108,089 123,082 158,174 147,975 146,818 143,241 17,383 109,170 177,311 MEY96 Lake Meyer - - - - - - 18,212 1,798 14,687 21,736 MIA68 Lake Miami 39,230 33,597 40,670 39,229 25,160 35,577 13,324 1,662 10,067 16,581 LTH82 Lake of the Hills 67,963 74,725 77,533 78,438 77,232 75,178 59,131 6,032 47,309 70,953 TFI87 Lake of Three Fires 31,035 19,049 19,662 21,844 21,483 22,614 13,583 2,099 9,470 17,696 PAH60 Lake Pahoja 16,050 14,458 17,294 20,718 17,909 17,286 16,466 2,215 12,126 20,807 SMI55 Lake Smith 25,079 57,881 20,469 37,322 31,675 34,485 17,830 2,256 13,407 22,252 SUG89 Lake Sugema 52,230 38,096 59,339 53,509 60,175 52,670 63,961 8,116 48,054 79,868 WAP26 Lake Wapello 61,889 83,202 68,855 82,971 51,653 69,714 38,747 4,651 29,631 47,863 LRI27 Little River 21,972 31,497 38,296 32,733 27,080 30,316 23,480 4,433 14,791 32,169 LSP97 Little Sioux Park Lake 21,066 31,340 27,122 25,816 26,937 26,456 24,590 4,313 16,137 33,044 LSP30 Little Spirit Lake 57,157 79,633 67,341 87,307 61,111 70,510 39,694 3,383 33,063 46,325 LWA40 Little Wall Lake 57,288 56,097 53,287 53,396 44,046 52,823 45,429 4,487 36,636 54,223 LIT05 Littlefield Lake 20,741 23,745 36,595 30,421 20,806 26,461 36,816 6,230 24,605 49,026 LIZ76 Lizard Lake - - - - - - 4,454 1,023 2,450 6,458 LGR82 Lost Grove Lake - - - - - - 60,859 6,146 48,814 72,904 LIS74 Lost Island Lake 94,092 76,311 67,206 70,327 56,593 72,906 64,295 5,829 52,871 75,719 LGA30 Lower Gar Lake 66,164 83,229 67,358 73,203 71,335 72,258 75,543 6,972 61,878 89,208 LPI42 Lower Pine Lake 57,657 65,978 66,522 64,438 49,560 60,831 61,606 9,043 43,882 79,330 MAP83 Manteno Lake 3,260 4,886 5,672 4,350 4,723 4,578 13,035 4,206 4,792 21,277 MAR50 Mariposa Lake 24,989 21,258 14,975 23,896 14,450 19,914 25,734 3,977 17,939 33,529 MEA01 Meadow Lake 4,013 4,980 6,040 5,608 4,489 5,026 7,033 1,180 4,721 9,346 MEY07 Meyers Lake 31,098 31,695 44,943 46,105 38,022 38,372 26,696 5,698 15,529 37,864 MIC71 Mill Creek (Lake) 14,546 33,016 30,413 27,029 14,146 23,830 36,167 6,230 23,957 48,377 MIN30 Lake Minnewashta 47,159 47,464 58,204 55,725 59,986 53,708 63,324 6,732 50,130 76,518
26
Table 6. Estimated Household Trips
DNR 2002 2003 2004 2005 2009 5 Yr Ave 2014
Lake ID Lake Mean S.E. Lower Upper MIT07 Mitchell Lake 16,585 10,624 13,434 16,886 28,583 17,222 16,678 3,629 9,566 23,790 MOO47 Moorehead Lake 15,764 6,479 6,942 8,185 10,792 9,632 19,486 3,704 12,226 26,746 MTR01 Mormon Trail Lake 19,589 12,067 12,299 11,372 14,693 14,004 10,895 1,690 7,582 14,208 NEL24 Nelson Park Lake 10,533 11,239 9,159 7,822 9,279 9,607 12,142 2,273 7,687 16,596 NEA27 Nine Eagles Lake 14,997 13,360 14,653 15,515 9,854 13,676 16,737 3,278 10,313 23,161 NOD01 Nodaway Lake - - - - - - 22,133 4,611 13,095 31,171 NTW13 North Twin Lake 71,829 107,034 89,254 98,710 54,779 84,321 43,502 5,652 32,423 54,580 OLD67 Oldham Lake 4,514 8,636 5,237 3,224 6,092 5,541 7,093 1,577 4,003 10,183 ORI01 Lake Orient 16,176 22,704 18,266 18,018 21,298 19,292 19,578 3,103 13,496 25,659 OTC86 Otter Creek Lake 18,809 33,387 30,856 35,096 22,438 28,117 32,240 4,444 23,530 40,951 OTL90 Ottumwa Lagoon 92,863 102,974 77,103 102,108 89,693 92,948 56,890 9,600 38,074 75,705 PIC73 Pierce Creek Lake 9,028 7,870 6,897 9,866 5,036 7,739 1,028 584 -115 2,172 PLC57 Pleasant Creek Lake 161,059 204,723 185,636 184,384 109,166 168,993 134,044 14,330 105,958 162,130 POL56 Pollmiller Park Lake 32,602 30,927 23,719 38,866 20,127 29,248 31,975 4,344 23,461 40,489 PRO83 Prairie Rose Lake 39,046 45,192 41,774 42,131 37,329 41,094 30,431 6,059 18,557 42,306 RAT04 Rathbun Lake 214,348 256,184 245,407 237,253 190,817 228,801 173,561 13,667 146,775 200,348 RHA59 Red Haw Lake 41,753 35,076 39,529 38,335 24,794 35,897 42,767 6,478 30,070 55,465 RRO63 Red Rock Lake 341,561 320,510 299,995 317,359 261,083 308,101 269,497 17,458 235,281 303,713 ROC63 Roberts Creek Lake 33,794 55,060 53,553 40,043 54,509 47,392 54,022 6,325 41,626 66,418 ROC50 Rock Creek Lake 66,991 77,437 82,402 79,083 54,175 72,018 57,494 5,348 47,011 67,976 ROG06 Rodgers Park Lake 18,272 17,116 25,995 34,088 23,630 23,820 17,744 4,985 7,974 27,513 RDL34 Rudd Lake - - - - - - 30,460 4,970 20,719 40,202 SAY77 Saylorville Lake 667,754 656,670 540,626 590,629 456,774 582,490 620,371 40,287 541,410 699,333 SIL98 Silver Lake (Worth County) 11,823 8,837 12,394 12,683 11,154 11,378 11,606 3,451 4,841 18,370 SIL74 Silver Lake (Palo Alto County) 35,361 32,110 27,031 47,711 20,477 32,538 28,278 3,926 20,584 35,973 SIL30 Silver Lake (Dickinson County) 46,407 59,013 47,693 37,348 51,534 48,399 41,189 5,309 30,784 51,594 SIL28 Silver Lake (Delaware County) 8,509 16,633 16,588 14,759 21,472 15,592 17,721 3,563 10,738 24,703 SBL27 Slip Bluff Lake 2,048 4,179 4,645 3,182 3,565 3,524 3,785 861 2,098 5,473 SBE97 Snyder Bend Lake - - - - - - 29,050 4,092 21,030 37,070 SPR07 South Prairie Lake 49,340 51,590 49,076 53,455 50,108 50,714 70,787 14,263 42,831 98,743
27
Table 6. Estimated Household Trips
DNR 2002 2003 2004 2005 2009 5 Yr Ave 2014
Lake ID Lake Mean S.E. Lower Upper SPR37 Spring Lake 27,931 34,770 39,916 42,656 33,615 35,778 42,881 8,062 27,080 58,682 SPR39 Springbrook Lake 48,353 57,777 50,741 50,472 35,745 48,618 31,944 4,148 23,815 40,074 STL11 Storm Lake (incl Little Storm Lake) 164,622 202,680 151,102 180,091 161,665 172,032 194,833 27,687 140,568 249,098 SUM88 Summit Lake - - - - - - 8,488 1,792 4,976 12,001 SWA14 Swan Lake 108,062 100,257 85,025 90,090 69,395 90,566 71,997 7,808 56,693 87,301 THY88 Thayer Lake 5,732 9,434 7,727 7,298 16,115 9,261 4,980 1,083 2,858 7,102 THM88 Three Mile Lake 103,410 99,184 110,754 85,821 46,986 89,231 77,151 12,598 52,459 101,844 TRU21 Trumbull Lake 22,069 36,095 19,460 21,781 16,237 23,128 - - - - TUT32 Tuttle Lake 13,643 23,907 22,562 24,226 13,266 19,521 - - - - TMI88 Twelve Mile Creek Lake 71,728 72,593 63,122 43,713 38,318 57,895 53,965 6,621 40,989 66,942 UGR86 Union Grove Lake 34,084 48,263 47,876 47,672 23,531 40,285 37,291 5,523 26,466 48,117 UGR30 Upper Gar Lake 63,821 77,433 75,854 83,518 73,681 74,862 76,299 7,067 62,447 90,151 UPI42 Upper Pine Lake 74,029 70,008 65,079 64,292 45,503 63,782 59,079 8,658 42,110 76,048 VIK69 Viking Lake 46,756 60,185 51,815 50,390 55,491 52,927 53,281 6,546 40,452 66,111 WOS20 West Osceola 44,878 50,448 56,809 69,809 40,839 52,556 40,338 6,103 28,377 52,299 WOK30 West Okoboji Lake 383,026 438,669 405,047 395,941 327,270 389,990 336,213 19,184 298,613 373,813 WOA62 White Oak Lake 5,779 7,909 10,269 6,044 6,223 7,245 9,470 1,600 6,334 12,607 WIP59 Williamson Pond 8,125 7,303 5,620 5,611 6,578 6,647 28,891 12,685 4,030 53,752 WIL43 Willow Lake 14,187 10,097 11,565 7,702 10,063 10,723 13,768 2,345 9,172 18,364 WIL87 Wilson Park Lake 4,483 7,896 8,932 6,646 6,857 6,963 1,293 498 317 2,270 WIN87 Windmill Lake 7,022 8,390 5,626 7,783 5,648 6,894 6,990 1,507 4,036 9,944 YSM24 Yellow Smoke Park Lake 55,711 37,330 41,587 39,337 38,378 42,469 24,902 2,997 19,028 30,777
28
Table 7. Lake Rankings DNR Rank Rank Rank Lake ID Lake by 5 Yr Ave by 2014 Change AHL85 Ada Hayden Lake - 11 - ARB79 Arbor Lake 86 87 -1 ARR81 Arrowhead Lake (Sac County) 115 103 12 ARR78 Arrowhead Lake (Pottawattamie County) 76 79 -3 ASA09 Avenue of the Saints Lake 103 130 -27 BAC61 Badger Creek Lake 40 64 -24 BAD94 Badger Lake 36 69 -33 BEA25 Beaver Lake 97 95 2 BEE35 Beeds Lake 25 40 -15 BDL54 Belva Deer Lake - 20 - BIC77 Big Creek Lake 4 3 1 BHO29 Big Hollow Lake - 62 - SPL30 Big Spirit Lake 9 10 -1 BHA81 Black Hawk Lake 18 30 -12 BLU67 Blue Lake 61 66 -5 RRP77 Blue Heron Lake - 44 - BWH93 Bob White Lake 118 128 -10 BWO40 Briggs Woods Lake 46 59 -13 BRO97 Browns Lake 48 46 2 BRC94 Brushy Creek Lake 15 17 -2 CAR78 Carter Lake 47 96 -49 CAS86 Casey Lake (aka Hickory Hills Lake) 68 98 -30 CEN30 Center Lake 83 104 -21 CEN53 Central Park Lake 67 75 -8 CLE17 Clear Lake 5 2 3 CSP15 Cold Springs Lake 91 91 0 COR52 Coralville Lake 2 7 -5 CRC47 Crawford Creek Impoundment 110 94 16 CRY41 Crystal Lake 73 50 23 DMA77 Dale Maffitt Lake 52 - - DBE43 DeSoto Bend Lake 50 89 -39 DIA79 Diamond Lake 71 73 -2 DCR71 Dog Creek Lake 104 110 -6 DWI08 Don Williams Lake 28 47 -19 EOS20 East Lake (Osceola) 69 67 2 EOK30 East Okoboji Lake 7 9 -2 EAS77 Easter Lake 16 19 -3 ESH41 Eldred Sherwood Lake 111 134 -23 FIS74 Five Island Lake 30 48 -18 FOG80 Fogle Lake 117 121 -4 VOL33 Volga Lake 35 29 6 GEO44 Lake Geode 19 24 -5
29
Table 7. Lake Rankings DNR Rank Rank Rank Lake ID Lake by 5 Yr Ave by 2014 Change GWY07 George Wyth Lake 12 13 -1 GRL77 Grays Lake - 4 - GBE07 Green Belt Lake 84 99 -15 GCA64 Green Castle Lake 107 125 -18 GVA88 Green Valley Lake 42 54 -12 GRL01 Greenfield Lake 92 82 10 HAN06 Hannen Lake 58 70 -12 HAW62 Hawthorn Lake (aka Barnes City Lake) 63 102 -39 HGR85 Hickory Grove Lake 43 55 -12 HOO91 Hooper Area Pond 109 122 -13 IND89 Indian Lake 102 107 -5 ING32 Ingham Lake 88 116 -28 IOW48 Lake Iowa 66 41 25 KEP52 Kent Park Lake 23 28 -5 LKE89 Lacey Keosauqua Park Lake 51 53 -2 AHQ91 Lake Ahquabi 17 18 -1 ANI15 Lake Anita 53 51 2 COR99 Lake Cornelia 38 27 11 DAR92 Lake Darling 37 49 -12 HEN45 Lake Hendricks 93 85 8 ICA02 Lake Icaria 44 60 -16 KEO62 Lake Keomah 65 100 -35 MAC52 Lake Macbride 8 6 2 MAN78 Lake Manawa 14 15 -1 MEY96 Lake Meyer - 108 - MIA68 Lake Miami 79 119 -40 LTH82 Lake of the Hills 26 36 -10 TFI87 Lake of Three Fires 98 118 -20 PAH60 Lake Pahoja 105 115 -10 SMI55 Lake Smith 80 109 -29 SUG89 Lake Sugema 56 32 24 WAP26 Lake Wapello 34 68 -34 LRI27 Little River 82 97 -15 LSP97 Little Sioux Park Lake 90 93 -3 LSP30 Little Spirit Lake 33 65 -32 LWA40 Little Wall Lake 55 52 3 LIT05 Littlefield Lake 89 72 17 LIZ76 Lizard Lake - 136 - LGR82 Lost Grove Lake - 35 - LIS74 Lost Island Lake 29 31 -2 LGA30 Lower Gar Lake 31 23 8 LPI42 Lower Pine Lake 41 34 7
30
Table 7. Lake Rankings DNR Rank Rank Rank Lake ID Lake by 5 Yr Ave by 2014 Change MAP83 Manteno Lake 129 120 9 MAR50 Mariposa Lake 99 90 9 MEA01 Meadow Lake 128 132 -4 MEY07 Meyers Lake 75 88 -13 MIC71 Mill Creek (Lake) 94 74 20 MIN30 Lake Minnewashta 49 33 16 MIT07 Mitchell Lake 106 114 -8 MOO47 Moorehead Lake 119 106 13 MTR01 Mormon Trail Lake 112 126 -14 NEL24 Nelson Park Lake 120 123 -3 NEA27 Nine Eagles Lake 113 113 0 NOD01 Nodaway Lake - 101 - NTW13 North Twin Lake 24 56 -32 OLD67 Oldham Lake 127 131 -4 ORI01 Lake Orient 101 105 -4 OTC86 Otter Creek Lake 87 76 11 OTL90 Ottumwa Lagoon 20 39 -19 PIC73 Pierce Creek Lake 122 139 -17 PLC57 Pleasant Creek Lake 13 16 -3 POL56 Pollmiller Park Lake 85 77 8 PRO83 Prairie Rose Lake 72 81 -9 RAT04 Rathbun Lake 10 14 -4 RHA59 Red Haw Lake 77 58 19 RRO63 Red Rock Lake 6 8 -2 ROC63 Roberts Creek Lake 64 42 22 ROC50 Rock Creek Lake 32 38 -6 ROG06 Rodgers Park Lake 95 111 -16 RDL34 Rudd Lake - 80 - SAY77 Saylorville Lake 1 1 0 SIL98 Silver Lake (Worth County) 114 124 -10 SIL74 Silver Lake (Palo Alto County) 81 86 -5 SIL30 Silver Lake (Dickinson County) 62 61 1 SIL28 Silver Lake (Delaware County) 108 112 -4 SBL27 Slip Bluff Lake 130 137 -7 SBE97 Snyder Bend Lake - 83 - SPR07 South Prairie Lake 59 26 33 SPR37 Spring Lake 78 57 21 SPR39 Springbrook Lake 60 78 -18 STL11 Storm Lake (incl Little Storm Lake) 11 12 -1 SUM88 Summit Lake - 129 - SWA14 Swan Lake 21 25 -4 THY88 Thayer Lake 121 135 -14
31
Table 7. Lake Rankings DNR Rank Rank Rank Lake ID Lake by 5 Yr Ave by 2014 Change THM88 Three Mile Lake 22 21 1 TRU21 Trumbull Lake 96 - - TUT32 Tuttle Lake 100 - - TMI88 Twelve Mile Creek Lake 45 43 2 UGR86 Union Grove Lake 74 71 3 UGR30 Upper Gar Lake 27 22 5 UPI42 Upper Pine Lake 39 37 2 VIK69 Viking Lake 54 45 9 WOS20 West Osceola 57 63 -6 WOK30 West Okoboji Lake 3 5 -2 WOA62 White Oak Lake 123 127 -4 WIP59 Williamson Pond 126 84 42 WIL43 Willow Lake 116 117 -1 WIL87 Wilson Park Lake 124 138 -14 WIN87 Windmill Lake 125 133 -8 YSM24 Yellow Smoke Park Lake 70 92 -22
32
Table 8. Visitor’s' Average Travel Distance to Each Lake DNR Lake ID Lake Travel
Miles DNR Lake ID Lake Travel
Miles AHL85 Ada Hayden Lake 14.5 SMI55 Lake Smith 21.4 ARB79 Arbor Lake 19.1 SUG89 Lake Sugema 68.3 ARR81 Arrowhead Lake (Sac County) 95.0 WAP26 Lake Wapello 67.2
ARR78 Arrowhead Lake (Pottawattamie County) 97.6 LRI27 Little River 50.9
ASA09 Avenue of the Saints Lake 45.0 LSP97 Little Sioux Park Lake 36.1 BAC61 Badger Creek Lake 25.2 LSP30 Little Spirit Lake 83.7 BAD94 Badger Lake 37.6 LWA40 Little Wall Lake 34.3 BEA25 Beaver Lake 28.3 LIT05 Littlefield Lake 42.1 BEE35 Beeds Lake 34.6 LIZ76 Lizard Lake 60.9 BDL54 Belva Deer Lake 90.2 LGR82 Lost Grove Lake 21.2 BIC77 Big Creek Lake 28.5 LIS74 Lost Island Lake 35.3 BHO29 Big Hollow Lake 43.9 LGA30 Lower Gar Lake 79.9 SPL30 Big Spirit Lake 71.9 LPI42 Lower Pine Lake 27.6 BHA81 Black Hawk Lake 48.9 MAP83 Manteno Lake 34.2 BLU67 Blue Lake 38.8 MAR50 Mariposa Lake 23.2 RRP77 Blue Heron Lake 8.6 MEA01 Meadow Lake 36.8 BWH93 Bob White Lake 49.5 MEY07 Meyers Lake 18.0 BWO40 Briggs Woods Lake 38.3 MIC71 Mill Creek (Lake) 22.0 BRO97 Browns Lake 35.3 MIN30 Lake Minnewashta 66.6 BRC94 Brushy Creek Lake 54.2 MIT07 Mitchell Lake 19.1 CAR78 Carter Lake 40.6 MOO47 Moorehead Lake 25.8
CAS86 Casey Lake (aka Hickory Hills Lake) 27.4 MTR01 Mormon Trail Lake 35.1
CEN30 Center Lake 38.5 NEL24 Nelson Park Lake 51.7 CEN53 Central Park Lake 41.3 NEA27 Nine Eagles Lake 77.7 CLE17 Clear Lake 47.2 NOD01 Nodaway Lake 42.0 CSP15 Cold Springs Lake 33.3 NTW13 North Twin Lake 35.4 COR52 Coralville Lake 39.2 OLD67 Oldham Lake 35.6 CRC47 Crawford Creek Impoundment 38.7 ORI01 Lake Orient 22.5 CRY41 Crystal Lake 60.8 OTC86 Otter Creek Lake 30.4 DBE43 DeSoto Bend Lake 58.3 OTL90 Ottumwa Lagoon 30.7 DIA79 Diamond Lake 37.1 PIC73 Pierce Creek Lake 53.6 DCR71 Dog Creek Lake 43.6 PLC57 Pleasant Creek Lake 25.7 DWI08 Don Williams Lake 36.2 POL56 Pollmiller Park Lake 22.2 EOS20 East Lake (Osceola) 55.6 PRO83 Prairie Rose Lake 48.5 EOK30 East Okoboji Lake 78.4 RAT04 Rathbun Lake 91.3 EAS77 Easter Lake 18.8 RHA59 Red Haw Lake 52.3 ESH41 Eldred Sherwood Lake 126.0 RRO63 Red Rock Lake 52.3
33
Table 8. Visitor’s' Average Travel Distance to Each Lake DNR Lake ID Lake Travel
Miles DNR Lake ID Lake Travel
Miles FIS74 Five Island Lake 25.9 ROC63 Roberts Creek Lake 37.8 FOG80 Fogle Lake 34.5 ROC50 Rock Creek Lake 27.2 VOL33 Volga Lake 44.0 ROG06 Rodgers Park Lake 28.2 GEO44 Lake Geode 37.0 RDL34 Rudd Lake 34.7 GWY07 George Wyth Lake 21.0 SAY77 Saylorville Lake 25.7 GRL77 Grays Lake 16.4 SIL98 Silver Lake (Worth County) 165.6
GBE07 Green Belt Lake 16.2 SIL74 Silver Lake (Palo Alto County) 62.7
GCA64 Green Castle Lake 48.3 SIL30 Silver Lake (Dickinson County) 82.9
GVA88 Green Valley Lake 43.3 SIL28 Silver Lake (Delaware County) 196.9
GRL01 Greenfield Lake 21.2 SBL27 Slip Bluff Lake 57.8 HAN06 Hannen Lake 29.7 SBE97 Snyder Bend Lake 56.3
HAW62 Hawthorn Lake (aka Barnes City Lake) 46.8 SPR07 South Prairie Lake 12.1
HGR85 Hickory Grove Lake 29.6 SPR37 Spring Lake 24.2 HOO91 Hooper Area Pond 25.2 SPR39 Springbrook Lake 43.4
IND89 Indian Lake 54.1 STL11 Storm Lake (incl Little Storm Lake) 39.7
ING32 Ingham Lake 71.1 SUM88 Summit Lake 58.1 IOW48 Lake Iowa 47.6 SWA14 Swan Lake 26.3 KEP52 Kent Park Lake 26.8 THY88 Thayer Lake 58.8 LKE89 Lacey Keosauqua Park Lake 80.8 THM88 Three Mile Lake 62.5 AHQ91 Lake Ahquabi 24.3 TMI88 Twelve Mile Creek Lake 92.6 ANI15 Lake Anita 42.1 UGR86 Union Grove Lake 30.0 COR99 Lake Cornelia 36.3 UGR30 Upper Gar Lake 86.0 DAR92 Lake Darling 37.5 UPI42 Upper Pine Lake 33.8 HEN45 Lake Hendricks 42.9 VIK69 Viking Lake 21.5 ICA02 Lake Icaria 40.3 WOS20 West Osceola 80.2 KEO62 Lake Keomah 27.1 WOK30 West Okoboji Lake 79.1 MAC52 Lake Macbride 34.1 WOA62 White Oak Lake 68.3 MAN78 Lake Manawa 15.9 WIP59 Williamson Pond 43.1 MEY96 Lake Meyer 49.9 WIL43 Willow Lake 23.2 MIA68 Lake Miami 70.4 WIL87 Wilson Park Lake 140.0 LTH82 Lake of the Hills 21.2 WIN87 Windmill Lake 54.7 TFI87 Lake of Three Fires 50.8 YSM24 Yellow Smoke Park Lake 25.7 PAH60 Lake Pahoja 31.2
34
Table 9. Estimated Economic Impact at Iowa Lakes for 2014 DNR Lake ID Lake
Direct spending
Total expend impacts
Total income effects
Total job effects
AHL85 Ada Hayden Lake 16,284,094 25,777,723 4,066,668 199
ARB79 Arbor Lake 2,032,877 3,218,045 507,676 25
ARR81 Arrowhead Lake (Sac County) 1,501,774 2,377,308 375,041 18
ARR78 Arrowhead Lake (Pottawattamie County) 2,374,859 3,759,402 593,080 29
ASA09 Avenue of the Saints Lake 574,964 910,168 143,587 7
BAC61 Badger Creek Lake 3,008,478 4,762,420 751,314 37
BAD94 Badger Lake 2,829,593 4,479,245 706,641 35
BEA25 Beaver Lake 1,806,712 2,860,025 451,195 22
BEE35 Beeds Lake 4,090,781 6,475,706 1,021,601 50
BDL54 Belva Deer Lake 5,988,494 9,479,786 1,495,521 73
BIC77 Big Creek Lake 45,552,523 72,109,644 11,375,945 556
BHO29 Big Hollow Lake 3,088,047 4,888,378 771,186 38
SPL30 Big Spirit Lake 34,146,489 54,053,893 8,527,488 417
BHA81 Black Hawk Lake 7,814,067 12,369,668 1,951,426 95
BLU67 Blue Lake 2,931,527 4,640,607 732,098 36
RRP77 Blue Heron Lake 4,000,470 6,332,745 999,047 49
BWH93 Bob White Lake 678,308 1,073,762 169,396 8
BWO40 Briggs Woods Lake 3,190,969 5,051,304 796,888 39
BRO97 Browns Lake 3,780,355 5,984,302 944,078 46
BRC94 Brushy Creek Lake 15,333,474 24,272,889 3,829,266 187
CAR78 Carter Lake 2,863,070 4,532,239 715,002 35
CAS86 Casey Lake (aka Hickory Hills Lake) 1,714,397 2,713,890 428,140 21
CEN30 Center Lake 1,487,320 2,354,427 371,432 18
CEN53 Central Park Lake 2,574,905 4,076,075 643,038 31
CLE17 Clear Lake 63,821,871 101,030,022 15,938,395 779
CSP15 Cold Springs Lake 1,889,801 2,991,557 471,945 23
COR52 Coralville Lake 48,360,573 76,554,787 12,077,207 590
CRC47 Crawford Creek Impoundment 1,834,715 2,904,353 458,188 22
CRY41 Crystal Lake 3,552,694 5,623,915 887,223 43
DMA77 Dale Maffitt Lake - - - -
DBE43 DeSoto Bend Lake 1,997,099 3,161,408 498,741 24
DIA79 Diamond Lake 2,745,501 4,346,129 685,641 34
DCR71 Dog Creek Lake 1,330,542 2,106,247 332,280 16
DWI08 Don Williams Lake 3,734,878 5,912,311 932,721 46
EOS20 East Lake (Osceola) 2,911,237 4,608,487 727,030 36
EOK30 East Okoboji Lake 36,737,942 58,156,163 9,174,658 448
EAS77 Easter Lake 11,469,943 18,156,920 2,864,418 140
ESH41 Eldred Sherwood Lake 508,690 805,257 127,037 6
FIS74 Five Island Lake 5,765,912 9,127,438 1,439,935 70
FOG80 Fogle Lake 971,527 1,537,926 242,621 12
35
Table 9. Estimated Economic Impact at Iowa Lakes for 2014 DNR Lake ID Lake
Direct spending
Total expend impacts
Total income effects
Total job effects
VOL33 Volga Lake 4,955,927 7,845,233 1,237,656 61
GEO44 Lake Geode 8,891,396 14,075,081 2,220,471 109
GWY07 George Wyth Lake 21,857,444 34,600,334 5,458,514 267
GRL77 Grays Lake 26,912,207 42,602,025 6,720,852 329
GBE07 Green Belt Lake 1,703,934 2,697,327 425,528 21
GCA64 Green Castle Lake 866,628 1,371,873 216,425 11
GVA88 Green Valley Lake 3,355,853 5,312,315 838,066 41
GRL01 Greenfield Lake 2,248,670 3,559,645 561,566 27
HAN06 Hannen Lake 2,827,083 4,475,273 706,015 34
HAW62 Hawthorn Lake (aka Barnes City Lake) 1,610,220 2,548,978 402,124 20
HGR85 Hickory Grove Lake 3,286,837 5,203,062 820,830 40
HOO91 Hooper Area Pond 931,402 1,474,409 232,601 11
IND89 Indian Lake 1,384,244 2,191,258 345,691 17
ING32 Ingham Lake 1,186,592 1,878,375 296,331 14
IOW48 Lake Iowa 4,063,893 6,433,144 1,014,886 50
KEP52 Kent Park Lake 8,017,900 12,692,335 2,002,330 98
LKE89 Lacey Keosauqua Park Lake 3,387,885 5,363,022 846,065 41
AHQ91 Lake Ahquabi 12,114,277 19,176,900 3,025,328 148
ANI15 Lake Anita 3,476,595 5,503,450 868,219 42
COR99 Lake Cornelia 5,177,554 8,196,067 1,293,003 63
DAR92 Lake Darling 3,565,611 5,644,362 890,449 44
HEN45 Lake Hendricks 2,132,633 3,375,959 532,588 26
ICA02 Lake Icaria 3,100,012 4,907,318 774,174 38
KEO62 Lake Keomah 1,700,061 2,691,196 424,560 21
MAC52 Lake Macbride 40,574,869 64,230,018 10,132,864 495
MAN78 Lake Manawa 17,353,606 27,470,759 4,333,760 212
MEY96 Lake Meyer 1,365,514 2,161,609 341,013 17
MIA68 Lake Miami 999,035 1,581,473 249,492 12
LTH82 Lake of the Hills 4,433,704 7,018,553 1,107,240 54
TFI87 Lake of Three Fires 1,018,473 1,612,243 254,346 12
PAH60 Lake Pahoja 1,234,643 1,954,440 308,330 15
SMI55 Lake Smith 1,336,875 2,116,273 333,861 16
SUG89 Lake Sugema 4,795,868 7,591,860 1,197,684 59
WAP26 Lake Wapello 2,905,287 4,599,070 725,545 35
LRI27 Little River 1,760,549 2,786,949 439,666 22
LSP97 Little Sioux Park Lake 1,843,809 2,918,750 460,459 23
LSP30 Little Spirit Lake 4,808,988 7,612,628 1,200,960 59
LWA40 Little Wall Lake 3,406,342 5,392,240 850,674 42
LIT05 Littlefield Lake 2,760,427 4,369,756 689,368 34
LIZ76 Lizard Lake 333,984 528,696 83,407 4

36
Table 9. Estimated Economic Impact at Iowa Lakes for 2014 DNR Lake ID Lake
Direct spending
Total expend impacts
Total income effects
Total job effects
LGR82 Lost Grove Lake 4,563,237 7,223,605 1,139,589 56
LIS74 Lost Island Lake 7,789,288 12,330,444 1,945,238 95
LGA30 Lower Gar Lake 9,152,078 14,487,740 2,285,571 112
LPI42 Lower Pine Lake 4,619,259 7,312,288 1,153,579 56
MAP83 Manteno Lake 977,353 1,547,149 244,076 12
MAR50 Mariposa Lake 1,929,531 3,054,448 481,867 24
MEA01 Meadow Lake 527,392 834,861 131,707 6
MEY07 Meyers Lake 2,001,702 3,168,695 499,890 24
MIC71 Mill Creek (Lake) 2,711,856 4,292,868 677,238 33
MIN30 Lake Minnewashta 7,671,640 12,144,207 1,915,858 94
MIT07 Mitchell Lake 1,250,563 1,979,642 312,306 15
MOO47 Moorehead Lake 1,461,080 2,312,888 364,879 18
MTR01 Mormon Trail Lake 816,903 1,293,158 204,007 10
NEL24 Nelson Park Lake 910,378 1,441,129 227,351 11
NEA27 Nine Eagles Lake 1,254,943 1,986,574 313,400 15
NOD01 Nodaway Lake 1,659,551 2,627,070 414,444 20
NTW13 North Twin Lake 5,270,248 8,342,802 1,316,152 64
OLD67 Oldham Lake 531,825 841,879 132,814 7
ORI01 Lake Orient 1,467,957 2,323,777 366,597 18
OTC86 Otter Creek Lake 2,417,424 3,826,783 603,709 30
OTL90 Ottumwa Lagoon 4,265,649 6,752,523 1,065,271 52
PIC73 Pierce Creek Lake 77,108 122,061 19,256 1
PLC57 Pleasant Creek Lake 16,239,457 25,707,059 4,055,520 198
POL56 Pollmiller Park Lake 2,397,514 3,795,266 598,737 29
PRO83 Prairie Rose Lake 2,281,790 3,612,074 569,837 28
RAT04 Rathbun Lake 25,393,645 40,198,140 6,341,618 310
RHA59 Red Haw Lake 3,206,714 5,076,229 800,821 39
RRO63 Red Rock Lake 39,430,043 62,417,759 9,846,963 481
ROC63 Roberts Creek Lake 4,050,617 6,412,126 1,011,571 49
ROC50 Rock Creek Lake 4,310,909 6,824,169 1,076,574 53
ROG06 Rodgers Park Lake 1,330,424 2,106,061 332,250 16
RDL34 Rudd Lake 2,283,940 3,615,477 570,374 28
SAY77 Saylorville Lake 90,766,293 143,683,042 22,667,293 1,108
SIL98 Silver Lake (Worth County) 870,196 1,377,520 217,316 11
SIL74 Silver Lake (Palo Alto County) 2,120,308 3,356,449 529,510 26
SIL30 Silver Lake (Dickinson County) 3,088,391 4,888,923 771,272 38
SIL28 Silver Lake (Delaware County) 1,328,701 2,103,333 331,820 16
SBL27 Slip Bluff Lake 283,826 449,297 70,880 3
SBE97 Snyder Bend Lake 2,178,178 3,448,056 543,962 27
SPR07 South Prairie Lake 5,307,663 8,402,029 1,325,496 65
37
Table 9. Estimated Economic Impact at Iowa Lakes for 2014 DNR Lake ID Lake
Direct spending
Total expend impacts
Total income effects
Total job effects
SPR37 Spring Lake 3,215,281 5,089,790 802,960 39
SPR39 Springbrook Lake 2,395,214 3,791,624 598,163 29
STL11 Storm Lake (incl Little Storm Lake) 28,505,912 45,124,859 7,118,852 348
SUM88 Summit Lake 636,471 1,007,534 158,947 8
SWA14 Swan Lake 8,722,460 13,807,654 2,178,282 106
THY88 Thayer Lake 373,392 591,079 93,248 5
THM88 Three Mile Lake 9,346,898 14,796,140 2,334,224 114
TRU21 Trumbull Lake - - - -
TUT32 Tuttle Lake - - - -
TMI88 Twelve Mile Creek Lake 4,046,387 6,405,431 1,010,514 49
UGR86 Union Grove Lake 2,796,170 4,426,336 698,294 34
UGR30 Upper Gar Lake 9,243,711 14,632,794 2,308,455 113
UPI42 Upper Pine Lake 4,429,830 7,012,420 1,106,272 54
VIK69 Viking Lake 3,995,105 6,324,253 997,708 49
WOS20 West Osceola 3,024,600 4,787,942 755,341 37
WOK30 West Okoboji Lake 49,191,185 77,869,645 12,284,637 600
WOA62 White Oak Lake 710,137 1,124,146 177,344 9
WIP59 Williamson Pond 2,166,284 3,429,223 540,992 26
WIL43 Willow Lake 1,032,336 1,634,188 257,808 13
WIL87 Wilson Park Lake 96,978 153,517 24,219 1
WIN87 Windmill Lake 524,102 829,653 130,886 6
YSM24 Yellow Smoke Park Lake 1,867,188 2,955,759 466,297 23
TOTAL 983,483,518 1,556,854,415 245,607,794 12,002
AVERAGE 7,075,421 11,200,391 1,766,963 86
38
Figure 1. Map of Iowa lakes surveyed.
39
Figure 2. The proportion of trip taker and average trips (2002-2005, 2009, 2014).
40
Figure 3. Lake activity distribution.
Figure 4. The potential pollutant sources for Iowa lakes.

41
<2002>
<2014>
Figure 5. Important characteristics when choosing a lake for recreation (2002 vs 2014)
42
<2002>
<2014>
Figure 6. Important factors in choosing a lake for recreation (2002 vs 2014)

43
Figure 7. Iowa lake water quality compared to surrounding states.
44
Figure 8. Single-day trips to Bordering state lakes and rivers by water quality assessment.
45
Figure 9. Overnight trips to bordering state lakes and rivers by water quality assessment.
46
Figure 10. Top 10 lakes based on water quality assessment.
47
Figure 11. Users of social media for any purpose.
Figure 12. Users of social media for finding general travel information.
48
Figure 13. Users of social media specifically for information about lakes.
Figure 14. Users of social media for sharing general travel information.
49
Figure 15. Users of social media for sharing information about lakes.
50
Figure 16. Estimated Household Trips: Common 127 Lakes (2002-2005, 2009, 2014).
51
Figure 17. Age distribution.
Figure 18. Employment status.
52
Figure 19. Income distribution.
Figure 20. Education distribution.

53