Embed Size (px)
Citation preview

A Report to Senate Business, Professions
and Economic Development Committee
MEDICAL BOARD OF C ALIFORNIA
SUNSET REVIEW REPORT
SUPPLEMENTAL 2013
Edmund G. Brown Jr., Governor Sharon L. Levine, M.D., President, Medical Board of California
Linda K. Whitney, Executive Director, Medical Board of California

STATE OF CALIFORNIA
EDMUND G. BROWN JR., GOVERNOR
ANNA M. CABALLERO, SECRETARY, STATE AND CONSUMER SERVICES AGENCY
DENISE D. BROWN, DIRECTOR, DEPARTMENT OF CONSUMER AFFAIRS
MEDICAL BOARD OF CALIFORNIA
SHARON L. LEVINE, M.D., PRESIDENT
LINDA K. WHITNEY, EXECUTIVE DIRECTOR
KIMBERLY KIRCHMEYER, DEPUTY DIRECTOR
Additional copies of this report can be obtained from: www.mbc.ca.gov
Medical Board of California 2005 Evergreen Street, Suite 1200
Sacramento, California 95815 (916) 263-2382
Medical Board of California: Sunset Review Report - SUPPLEMENTAL 2013 Page ii
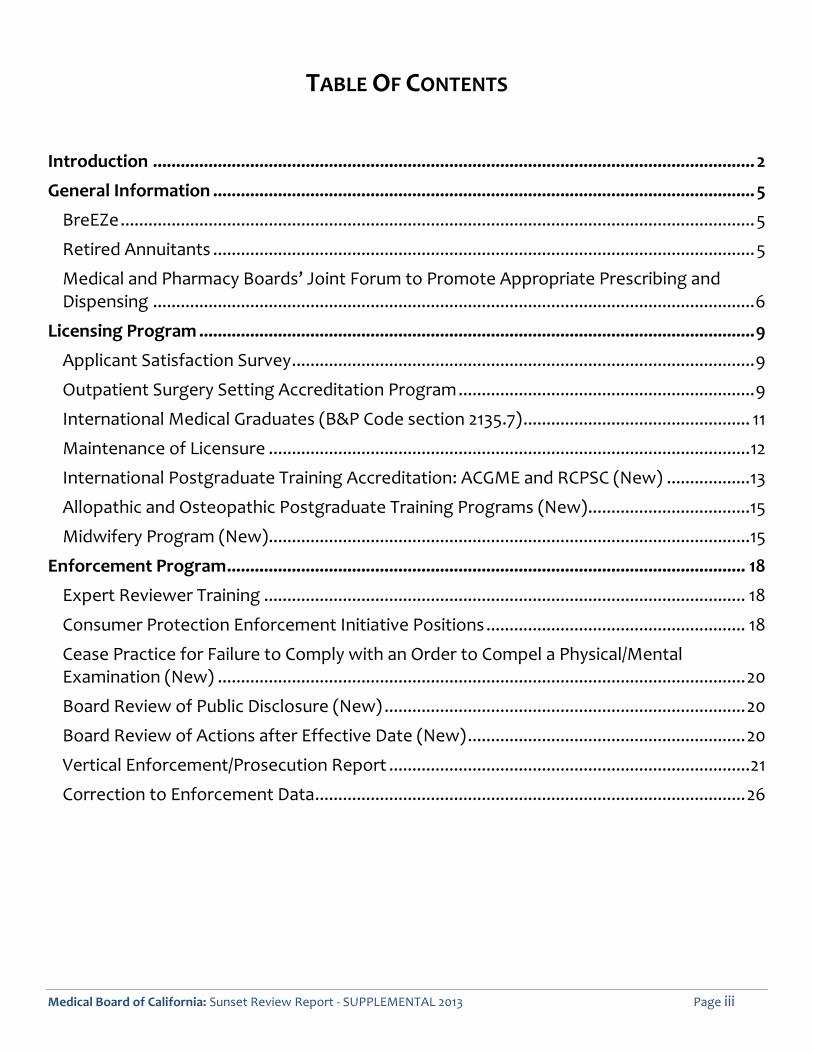
TABLE OF CONTENTS
Introduction .................................................................................................................................. 2
General Information ..................................................................................................................... 5
BreEZe.........................................................................................................................................5
Retired Annuitants .....................................................................................................................5
Medical and Pharmacy Boards’ Joint Forum to Promote Appropriate Prescribing and Dispensing ..................................................................................................................................6
Licensing Program ........................................................................................................................9
Applicant Satisfaction Survey....................................................................................................9
Outpatient Surgery Setting Accreditation Program................................................................9
International Medical Graduates (B&P Code section 2135.7)................................................. 11
Maintenance of Licensure ........................................................................................................12
International Postgraduate Training Accreditation: ACGME and RCPSC (New) ..................13
Allopathic and Osteopathic Postgraduate Training Programs (New)...................................15
Midwifery Program (New)........................................................................................................15
Enforcement Program................................................................................................................ 18
Expert Reviewer Training ........................................................................................................ 18
Consumer Protection Enforcement Initiative Positions........................................................ 18
Cease Practice for Failure to Comply with an Order to Compel a Physical/Mental Examination (New) ..................................................................................................................20
Board Review of Public Disclosure (New) ..............................................................................20
Board Review of Actions after Effective Date (New)............................................................20
Vertical Enforcement/Prosecution Report ..............................................................................21
Correction to Enforcement Data.............................................................................................26
Medical Board of California: Sunset Review Report - SUPPLEMENTAL 2013 Page iii
Introduction
Introduction
General Information
Licensing Information
Enforcement Information
Introduction
Introduction
The purpose of this Supplemental Sunset Report is to provide pertinent information that was not covered in the initial report. This report also includes additional information on topics not fully addressed in the initial report because they were either new or evolving. It also includes the evaluation of the Vertical Enforcement/Prosecution model (VE/P) of investigating and prosecuting cases. References will be made to the initial report where applicable. The initial report is available on the Board’s Web site in the “Forms/Publication” section: http://www.mbc.ca.gov/publications/sunset_report_2012.pdf.
This report is divided into three sections: General Information, Licensing Program, and Enforcement Program. In the General Information section, the Board provides an update on its progress in implementing the new Department of Consumer Affairs (DCA) BreEZe computer system. Information on the Board’s recruitment to fill behind its retired annuitant positions is also included. Lastly, this section includes information on the Medical and Pharmacy Boards’ Joint Forum to Promote Appropriate Prescribing and Dispensing held on February 21 and 22, 2013 in South San Francisco. This Forum provided education to both physicians and pharmacists on the growing epidemic of prescription drug abuse in California and nationally.
The Licensing Program Section contains an update on the applicant satisfaction survey and the Board’s Outpatient Surgery Setting Accreditation Program. The information provided in the original report did not contain a significant number of responses from the applicants, as the Board had just implemented the satisfaction survey. Therefore, the Board is providing additional information in that section. The Board is also providing an update on a section of law, Business and Professions Code section 2135.7, which became effective on January 1, 2013. This section of law allows applicants who have graduated from an unrecognized or disapproved school to apply to the Board if they meet other requirements. Although the Board has not received a large number of applications, the information on those that have been received is provided.
The Board was notified that nine states have pilot programs to begin the process of Maintenance of Licensure (MOL). This supplemental report provides information on these programs. The Board plans to evaluate the outcomes from these pilot programs prior to taking any action in regards to MOL.
Since the initial report, the Board received information regarding changes to postgraduate training programs. This information indicated the Accreditation Council Graduate for Medical Education (ACGME) and the Royal College of Physicians and Surgeons of Canada are beginning to accredit postgraduate training programs outside of the United States and Canada. Information was also obtained that ACGME has begun to accredit postgraduate training programs in hospitals that are accredited by the American Osteopathic Association-Healthcare Facilities Accreditation Program (AOA-HFAP). All of these postgraduate training options will need either legislative or regulatory changes for the Board to accept applicants for licensure from these programs. The Board will be evaluating what legislative or regulatory changes may be required.
In the new issues section of the Midwifery Program’s initial Sunset Review Report, three issues were identified. Since this original report, the Board’s Midwifery Advisory Council (MAC) identified two other issues for the Midwifery Program. One relates to Certified Nurse-Midwives supervising
Medical Board of California: Sunset Review Report - SUPPLEMENTAL 2013 Page 2

Introduction
midwifery students and the other pertains to the data collected from the licensed midwives. These issues are more fully explained in this supplemental report and the Board agreed at its February 2013 meeting to address these issues.
The Enforcement Program Section covers six topics, including an update on the Expert Reviewer Training, information on how the Board is implementing the Consumer Protection Enforcement Initiative (CPEI) positions, three new concepts, and an evaluation of the Board’s VE/P. At the time of the initial report, the Board had only completed one expert reviewer training, in Northern California. This report provides an update on the training that was provided in Southern California.
To provide the Committee with further information on the Board’s positions and its efforts to find ways to improve the enforcement timeframes, this supplemental report includes information on how the Board plans to use the CPEI positions. These positions will help the Board in reducing the time it takes to investigate a complaint and take disciplinary action against a licensee.
In the last report, the Board stated that an evaluation of the statistics on the VE/P would be provided in a supplemental report. The Enforcement Program Section includes a review and analysis of the data on the VE/P. This data includes statistics on the time it takes to investigate a complaint, to file an accusation, and to receive disciplinary documents. The Board has analyzed this data and is providing its recommended action in this supplemental report.
Medical Board of California: Sunset Review Report - SUPPLEMENTAL 2013 Page 3
Section 1 General Information
B reEZe
Retired Annuitants
Medical and Pharmacy Boards’ Joint Forum to Pro mote Appropriate Prescribing and Dispensing
Section 1 General Information
General Information
BreEZe The BreEZe information was provided in Section 9 - Current Issues of the original Sunset Review Report. The initial report discussed the Board’s efforts on implementing the Department of Consumer Affairs’ (DCA) new computer system known as BreEZe. The Board continues to spend a significant amount of hours participating in the efforts to launch the new system.
Board staff is now in the testing, training, and data validation phases of the project. A substantial amount of hours have been spent on performing test scripts. These test scripts are used to confirm the functionality of each portion of the system and provide feedback on any improvements and/or enhancements that may be necessary.
Additionally, staff has been reviewing the data that has been converted into the BreEZe system from the legacy systems to ensure the data from the older system is being placed in the correct areas and that it is all being converted to the new system. This ensures that no data is lost in the conversion.
In January 2013, Board staff began training on the BreEZe system, which is expected to be released for the Board to use in Spring 2013. Each staff member was scheduled to receive at least 4 hours of training, however, most staff required 16-40 hours of training, based upon job duties. The training covered the system’s functionality, fields, and terminology associated with the BreEZe system. A significant amount of staff received additional specialized training in their areas of expertise.
The Board has six staff who were trainers not only for the Board staff but also for other staff at the DCA. These staff attended four weeks of required Train the Trainer sessions in order to be familiar with the system and to understand their role as a trainer.
The Board expects to spend in excess of 14,000 hours on its efforts to help develop the BreEZe system. To date, the Board has also spent 3,768 hours training staff. More training hours will be necessary in order for staff to be ready for the implementation of BreEZe. This is a significant workload issue but managers have maintained staff’s enthusiasm for the system while ensuring the workload is getting done with minimal overtime.
Retired Annuitants In June, 2012 the Board was notified that due to side letter agreements with the unions that all mission critical retired annuitants would be terminated on August 31, 2012. In lieu of retired annuitants, the Board was encouraged to hire seasonal or permanent intermittent (temporary) employees. At the time of notification, the Board had 50 retired annuitants working for the Board. The Board identified 19 retired annuitants that it deemed did not meet the mission critical definition and could be easily replaced with temporary employees and were therefore terminated in June 2012. The Board requested 31 retired annuitants be able to remain with the Board as they were mission critical. Of those 31 retired annuitants, the Board was authorized to keep 20 retired annuitants and had to separate 11 that were not deemed mission critical. However, only two (2) of the remaining 20 retired annuitants can remain with the Board after June 20, 2013. All others (18) must be separated by June 30, 2013. The Board was allowed to keep these retired annuitants either to finish a special project or to provide assistance during the time the Board went through the process to hire the temporary staff.
Medical Board of California: Sunset Review Report - SUPPLEMENTAL 2013 Page 5

Section 1 General Information
The Board has advertised for several seasonal and permanent intermittent employees and is in the process of interviewing and hiring these individuals. The Board is recruiting permanent intermittent Office Technicians (OT) to replace the retired annuitants in the district offices. These OTs are used to perform the clerical duties in the offices. The Board will begin recruiting permanent intermittent Special Investigators to replace those currently performing background investigations. Although the Board does not know if there are individuals interested in a part-time Special Investigator position, it will go through the recruitment process. The Board is also recruiting for permanent intermittent Staff Services Analysts in the Licensing Program to replace the retired annuitants who process licensing applications. The Board will continue to seek these temporary employees to replace the retired annuitants.
Medical and Pharmacy Boards’ Joint Forum to Promote Appropriate Prescribing and Dispensing As stated in the Executive Summary of the Board’s Sunset Review Report, prescription drug abuse and the resulting deaths are something the Board recognizes as an issue that must be given the utmost priority. As a consumer protection agency, the Board wants to address those individuals that prescribe inappropriately and to provide education to its licensees and the public in an effort to prevent prescription drug abuse. To that end, the Board, in collaboration with the Pharmacy Board, held a “Joint Forum to Promote Appropriate Prescribing and Dispensing” for all interested parties on February 21-22, 2013.
The Forum focused on 1) the problem, including inappropriate prescribing, inappropriate security of drugs, etc; 2) the responsible parties, including prescribers, dispensers, patients, and regulators/law enforcement; and 3) the solutions, including education, enforcement, and necessary tools (CURES). The Forum’s keynote speaker from the White House Office of National Drug Control Policy discussed the global issues of prescription drug abuse and the roles of the Federal and State Governments. The Drug Enforcement Administration speaker discussed the nature of prescription drug abuse and what the State could be doing to respond. Other speakers and panelists provided a physician’s, a pharmacist’s, and a prosecutor’s perspective to the issue of prescription drug abuse. The Forum provided a discussion on how education, and cooperation between physicians and pharmacists, can address the problem, and what to do when a patient is addicted to prescription drugs.
A presentation was made on the CURES system (California’s prescription drug monitoring program) and its significance in battling prescription drug abuse and inappropriate prescribing, as well as an update on its current status. A panel discussion was held on the problems and issues with prosecuting inappropriate prescribing and dispensing cases and areas where more collaboration is needed.
Lastly, the forum looked to the future and identified steps that must be taken in order to make the prevention of prescription drug abuse a reality. The Medical and Pharmacy Boards requested licensees, legislators, regulators, and law enforcement to come together to find ways to significantly impact this problem in an effort to save thousands of lives in the future.
Both the Medical and Pharmacy Board provided free continuing education credits to those licensees in attendance. The Forum was free to all in attendance and was held in the San Francisco Bay Area. A video of the Forum will be on the Board’s Web site for individuals to view for reference and education. The Board believes that the Forum was a significant step toward addressing the public health issue of prescription drug abuse, and furthering its mission of consumer protection.
Medical Board of California: Sunset Review Report - SUPPLEMENTAL 2013 Page 6
Section 1 General Information
Since the date of the forum was immediately prior to the release of this Supplemental Sunset Report, a summary of the forum recommendations will be produced in a separate standalone report.
Medical Board of California: Sunset Review Report - SUPPLEMENTAL 2013 Page 7

Section 2
Licensing Program
Appli cant Satisfaction Survey
Outpatient Surgery Setting Accreditation Program
In ternational Medical Graduates (B&P Code section 2135.7)
Ma intenance of Licensure
In ternational Postgraduate Training Accreditation Allopathic and Osteopathic Postgraduate Training Programs
Midwifery Program

Section 2 Licensing Program
Licensing Program
Applicant Satisfaction Survey In Section 2 – Performance Measures and Customer Satisfaction Surveys of the Sunset Review Report information was provided on the Board’s new Applicant Satisfaction Survey. This report included each question with responses and measurement of satisfaction. The Board has continued to collect data from this survey, which has assisted in creating new and efficient ways to enhance its services to applicants.
The Applicant Satisfaction Survey’s previous report contained responses from only 77 applicants between the timeframe of August 22 and October 5, 2012. The Survey’s current report includes a total of 242 applicant responses. Since the Survey’s inception in August the Board’s database of applicant feedback has more than tripled. These additional responses provide the Board a clearer picture of the applicant’s experience with the application process.
The 242 responses show the Board is maintaining applicant satisfaction as stated in the initial report. 91% of applicants responded that the Board’s instructions clearly state how to complete the application. 86% stated that the Board’s Web site clearly indicates the requirements and how to apply for licensure. Among the applicants who visited the Board’s Web site with questions concerning their application, 76% indicated that the Web site was comprehensive and informative. In October 2012, the Board released a new, updated version of the physician’s and surgeon’s license application. This version implemented changes to address common applicant concerns. In the future the Board will continue to assess applicant concerns in order to better serve the applicant population.
In the responses collected since the Board’s initial report, applicant satisfaction has remained the same. The data shows only minor fluctuation of one to three percent in response to the questions. 68% of applicants were either very satisfied or somewhat satisfied with the Web Applicant Access System used to track their application progress online. Further, 71% of applicants were either very satisfied or somewhat satisfied with the time it took the Board to process their application. Responses to other questions reveal only minor changes since the initial report.
The Board must ensure that it continues to provide the same level of service identified in the surveys once it begins using the new BreEZe system.
Outpatient Surgery Setting Accreditation Program In Section 4 – Licensing Program of the original Sunset Review Report, the Board discussed its Outpatient Surgery Setting Accreditation process and action taken to begin implementation of Senate Bill 100 Price (Statutes 2011, Chapter 645). The Board continues to make progress in implementing this bill. Further, more recent legislation Assembly Bill 1548 (Carter, Chapter 140) has been passed that aims to improve patient care in outpatient cosmetic surgery centers. Therefore, the Board provides this update on its efforts to implement these bills.
SB 100 has provided an opportunity for the Board to increase its role in protecting consumers. Under existing law, the Board approved four accreditation agencies. In keeping with the Board’s mandate to evaluate the accreditation agencies, the Board intends to schedule presentations by these agencies to enable the Board to assess their process and criteria for accreditation of outpatient surgery centers.
Medical Board of California: Sunset Review Report - SUPPLEMENTAL 2013 Page 9
Section 2 Licensing Program
The Board’s Licensing Program and Information Systems Branch have been successful in designing the new Outpatient Surgery Settings database. This database is used to store information submitted to the Board from the four, Board-approved, accreditation agencies and is maintained on the Board’s Web site. SB 100 amended Health and Safety Code section 1248.2, which now requires the Board to provide the following information on the status of outpatient surgery center settings on its Web site: the name, address, and telephone number of any owners, and their medical license numbers; the name and address of the facility; the name and telephone number of the accreditation agency, the effective and expiration dates of the accreditation, and whether an outpatient setting is accredited or the setting's accreditation has been revoked, suspended, or placed on probation, or the setting has received a reprimand by the accreditation agency.
The information contained in the Outpatient Surgery Setting database is received directly from the accreditation agencies as required by law. These agencies are mandated to inform the Board on any new settings that are accredited, as well as to provide updates on any changes to existing settings. Upon receipt of new and updated information from the agencies, the Board reflects those changes on its database.
Consumers may search for an accredited Outpatient Surgery Setting by setting name or owner name (as available) on the Board’s Outpatient Surgery Setting Database. In the future, consumers will be able to search for a surgery center with a single click from the Board’s home page. The online database will include copies of the Final Inspection Reports, which are public documents. The Board’s staff will work on developing this for the Board’s Web site, after the Board’s successful implementation of its new computer system (BreEZe) for Licensing and Enforcement. Currently, the Board provides these documents to consumers upon request.
The Board continues to work directly with the accreditation agencies to ensure compliance with the reporting requirements. Since each accreditation agency uses different data collection and reporting methods, the Board created a standardized reporting form. This form must be used by the accreditation agencies to provide the required information to the Board. At this time, three out of the four accreditation agencies are in compliance. One agency has not provided the newly, required information, including ownership information, expiration dates of accreditation, and complete inspection reports. This agency has not provided the Board with a plan to meet the reporting requirements. The Board is preparing to formally notify the non-compliant agency of the Board’s expectations for compliance, specifically, advising the agency to provide written documentation identifying a specific time frame that is acceptable by the Board, to submit the required information. Further, the Board will inform the agency that if it fails to response appropriately, the Board will begin the process of seeking revocation of the accreditation.
Changes to Health and Safety Code Section 1248 now require the Board to investigate complaints related to a violation of the law or, upon discovery that an outpatient setting is not in compliance with a specific provision. This section also requires the Board to bring an appropriate action through or in conjunction with a district attorney to enjoin an outpatient setting’s operation. The Board has developed procedures to handle complaints regarding outpatient surgery centers and accrediting agencies.
SB 100 required outpatient settings to report adverse events to the California Department of Public Health (CDPH) as currently required for licensed health facilities. The setting can be subject to penalties by CDPH for failing to report adverse events. If the adverse event report/complaint is not
Medical Board of California: Sunset Review Report - SUPPLEMENTAL 2013 Page 10
Section 2 Licensing Program
within the jurisdiction of CDPH, CDPH should forward the adverse event report/complaint to the Board in order for the Board to determine if the report of adverse events is within the jurisdiction of the Board. The Board has been in contact with CDPH requesting it to forward any adverse event reports/complaints that it receives that are not within the jurisdiction of CDPH to the Board. The Board is fully prepared to take appropriate action if and when an adverse report/complaint is received from CDPH. As of January 16, 2013, the Board has not received any reports/complaints from CDPH.
One of the provisions of SB 100 requires the Board to adopt regulations on or before January 1, 2013 on the issue of physician availability, specifically regarding the appropriate level of physician availability needed within clinics or other settings using laser or intense pulse light devices for elective cosmetic procedures. The regulations do not apply to FDA approved devices sold over the counter for self-use. On October 26, 2012, the Board held a regulatory hearing and approved the following regulatory language:
“Whenever an elective cosmetic procedure involving the use of a laser or intense pulse light device is performed by a licensed health care provider acting within the scope of his or her license, a physician with relevant training and expertise shall be immediately available to the provider. For the purposes of this section, “immediately available” means contactable by electronic or telephonic means without delay, interruptible, and able to furnish appropriate assistance and direction throughout the performance of the procedure and to inform the patient of provisions for post procedure care. Such provisions shall be contained in the licensed health care provider’s standardized procedures or protocols. ”
The Board is finalizing the regulations for submission to the Office of Administrative Law for its consideration and approval.
Assembly Bill 1548 (Carter, Chapter 140) prohibits outpatient cosmetic surgery centers from violating the prohibition of the corporate practice of medicine and enhances Business and Professions Code section 2417 with the addition of section 2417.5. Section 2417.5 creates the following penalty for corporations violating the prohibition of the corporate practice of medicine: a public offense punishable by imprisonment for up to five years and/or by a fine not exceeding $50,000. The purpose of the bill was to elevate the penalties of violating the corporate practice of medicine prohibition in order to prevent further offenses, which will help to ensure consumer protection. The bill also defined “outpatient elective cosmetic medical procedures or treatments” as medical procedures or treatments that are performed to alter or reshape normal structures of the body solely in order to improve appearance. The Board does not foresee any impact to the program as the bill enhanced existing law by creating additional penalties for violating the corporate practice of medicine prohibition.
International Medical Graduates (B&P Code section 2135.7) Section 1 – Background of the Board’s Sunset Review Report discussed legislation affecting the Board, including SB 122 Price (Statutes 2012, Chapter 789). To date, the Board has received two applications pursuant to this new section (B&P Code section 2135.7). One application has been reviewed by the Application Review Committee (ARC) and the individual has been licensed. One application contained deficiencies that need to be resolved prior to processing.
The Board also received two applications in which the applicant does not meet the criteria of B&P Code section 2135.7 at this time. Additionally, one previous applicant had requested an
Medical Board of California: Sunset Review Report - SUPPLEMENTAL 2013 Page 11

Section 2 Licensing Program
Administrative Hearing. The hearing was held and the final decision was to have the applicant reviewed by the ARC. The application is now complete and will be reviewed at the next ARC.
At this time, the Board only has only held one ARC, thus it is too early to determine the regulations that are needed until more applications are received pursuant to B&P Code section 2135.7.
Maintenance of Licensure Section 11 – New Issues in the initial report included a topic on Maintenance of Licensure (MOL). This update includes additional information on the Federation of State Medical Board (FSMB) efforts in developing a MOL program.
MOL is a process by which licensed physicians periodically provide, as a condition of license renewal, evidence that they are actively participating in a program of continuous professional development that is relevant to their areas of practice, measured against objective data sources, and aimed at improving performance over time. MOL encourages and supports lifelong learning by all physicians and creates a system to confirm their practice improvement efforts.
While MOL still is several years away from being adopted by any state medical board, the FSMB currently is working to develop and implement five pilot projects to help states prepare for MOL and to determine the best practices.
While all 70 state medical boards (representing both allopathic physicians and osteopathic physicians) are aware of FSMB’s efforts in regards to MOL, and have, in one manner or another, discussed the framework at their meetings, only 12 state boards expressed any interest in participating in the pilot. When it came time for a final decision, only nine boards were able to commit resources to any one of the five pilots: the Osteopathic Medical Board of California, and the medical boards of Colorado, Delaware, Iowa, Massachusetts, Mississippi, Oregon, Virginia, and Wisconsin. The following chart lists the number of physicians licensed by each of these boards:
Osteopathic Medical Board of California 5,763
Colorado Medical Board 18,383
Delaware Board of Medical Licensure and Discipline 4,838
Iowa Board of Medicine 11,202
Massachusetts Board of Registration in Medicine 33,767
Mississippi State Board of Medical Licensure 9,543
Oregon Medical Board 13,992
Virginia Board of Medicine 31,949
All nine volunteer boards participated in the State Readiness Inventory Pilot. This pilot, administered during October and November, 2012, used an electronic survey designed to facilitate state medical boards’ discussion of the best approach to implementation of MOL. The goal is to identify issues state medical boards need to consider and possibly resolve to ensure the successful implementation of MOL. The data has been collected by FSMB and a summary/data analysis currently is being performed. An article on MOL is planned for publication in the FSMB Journal of Medical Regulation later this year; this article will include a broad, general update on MOL as well as an overview of the results of this pilot.
Medical Board of California: Sunset Review Report - SUPPLEMENTAL 2013 Page 12

Section 2 Licensing Program
There are four other pilots that will be part of the larger MOL process; each is expected to begin sometime during 2013. It is not expected that all nine boards will participate in each pilot nor is expected that any single board will participate in every pilot. Further, while FSMB has extended an invitation to all state medical boards to participate in the MOL process, it is doubtful that any new boards will join. The following describe the four additional pilots:
Physician Acceptability Survey to Assess MOL Activities Pilot: Serves to collect opinions from licensed physicians about the potential features of a comprehensive MOL system.
State Board License Renewal Process Integration Pilot: Focuses on identifying how the proposed MOL system can be integrated into existing license renewal policies and procedures.
Describing the Attributes of Physician Practices in Support of MOL Pilot: Begins the work that makes MOL “practice relevant”. The first phase of the pilot is to develop models for describing individual physician practices that, in turn, will facilitate identification of relevant and meaningful educational and practice improvement activities.
Reporting of Maintenance of Certification Data to State Medical Boards Pilot: Facilitates successful reporting of MOC participation data to state medical boards for their use in evaluating board certified physicians’ compliance with MOL program requirements. State medical boards will be asked to evaluate whether the detail and format of the provided data are adequate to enable decisions regarding board certified physician licensees’ compliance with MOL requirements.
The Board looks forward to reviewing the outcomes from these pilots, anticipated during 2014, and then will undertake its own evaluation of the data provided, in order to decide how to best move forward in California to enhance consumer protection.
International Postgraduate Training Accreditation: ACGME and RCPSC (New) To obtain a California Physician’s and Surgeon’s License, applicants must have a minimum number of years of satisfactory completion of Accreditation Council Graduate for Medical Education (ACGME) and/or Royal College of Physicians and Surgeons of Canada (RCPSC) accredited postgraduate training in the United States or Canada.
For the past 30 years, ACGME only evaluated postgraduate training residency and/or fellowship programs in the U.S. The RCPSC previously only evaluated postgraduate training residency programs in Canada. ACGME has announced it will be evaluating postgraduate training programs in other countries through the newly created ACGME-International (ACGME-I). The RCPSC has created a new division Royal College Canada International (RCCI) and is currently providing postgraduate training consultation services to other countries.
ACGME-I recently completed the first phase of a partnership with the Ministry of Health in Singapore to restructure the GME accreditations system in that country. ACGME-I has already accredited 39 postgraduate training programs in Singapore at the National University of Singapore. In addition, Duke University School of Medicine has opened a new medical school in Singapore in a joint venture with the National University of Singapore. Meanwhile, the ACGME-I has signed contracts in Qatar and Abu Dhabi in the United Arab Emirates and is in negotiation with officials in Oman.
Medical Board of California: Sunset Review Report - SUPPLEMENTAL 2013 Page 13

Section 2 Licensing Program
The ACGME-I standards are not identical to the U.S. standards. ACGME-I has incorporated the different delivery systems between U.S. and international countries in determining requirements for ACGME-I accreditation. The ACGME-I will continue to expand and accredit postgraduate training programs in other countries with standards similar but not identical to the standards in the U.S.
RCCI has recently provided services in the following countries and/or worked with organizations or medical schools/teaching hospitals, within these countries and/or organizations:
Australia - Royal Australasian College of Physicians and the Royal Australasian College of Surgeons.
Haiti - RCCI delivered simulation training to health professionals in Haiti to improve front-line care.
La Francophonie - At the 2011 annual Conference International Des Doyens De Faculte De Medecine D’Expression Francasie, RCCI presented the CanMEDs frame work and provided an overview of the RCPSC accreditation standards.
Chile - A RCCI team was recently (2011) invited by the Pontifical Catholic University in Santiago, Chile to review up to eight residency training programs utilizing Canadian standards.
India - RCCI is exploring opportunities with medical organizations in India to help Indian authorities implement national standards for the evaluation and assessment of postgraduate medical trainees.
Oman - RCCI has signed an agreement with Oman Medical Specialties Board to develop a lasting educational partnership and RCCI reviewed a number of postgraduate training programs;
Saudi Arabia - RCCI has signed agreements with the Saudi Commission on Health Specialties and medical education organizations in Saudi Arabia to facilitate the transfer of Canadian expertise and standards in postgraduate medical education to Saudi Arabian educators. Saudi Arabia is looking to implement (with modifications that reflect local needs and realities) enhanced standards in medical education and residency training that draw upon Canadian standards, experience and advice.
China - RCCI is exchanging knowledge with a number of Chinese organizations involved in medical education and postgraduate medical training. They are exploring how RCCI might offer Canadian expertise and standards in postgraduate medical education.
RCCI runs conferences, short courses and workshops for international medical faculty on all aspects of the CanMEDS competencies and standards. This includes physician evaluation and assessment, curriculum development, examiner and surveyor training, accreditation standards for residency programs and the training of clinician educators.
RCCI also provides conferences, short courses and workshops for practitioners that include online bio-ethics modules for physicians and simulation workshops that equip physicians and health care teams with training in difficult critical care situations. RCCI can deliver workshops using high-fidelity simulation platform or “virtual patient” technology- either onsite or remotely.
RCCI uses Canadian standards to perform operational reviews of international specialty residency programs, providing its partners with an assessment of their strengths and opportunities for improvement. In addition, RCCI offers consulting services covering postgraduate medical education standards, systems and tools as well as continuing professional development standards and
Medical Board of California: Sunset Review Report - SUPPLEMENTAL 2013 Page 14

Section 2 Licensing Program
programming. RCCI also provides advice on issues involving human resources and health system reform.
Based upon the information available, it appears RCCI may move into the accreditation of postgraduate training residency programs in other countries. The initial programs likely will be in the UK and Australia since the postgraduate training programs in those countries are similar to Canada’s. To date, RCCI has not accredited any international postgraduate training programs.
RCCI has already taken the first step of consulting and setting up new international postgraduate training programs to be equivalent to RCPSC accredited postgraduate training programs. It is safe to assume that RCCI accreditation to these new postgraduate training programs will be following in the near future.
These two new programs were presented to the Licensing Committee at its meeting on January 31, 2013. The Board will continue to review and assess these new programs to determine how to address them when considering postgraduate training for purposes of California licensure.
Allopathic and Osteopathic Postgraduate Training Programs (New) Currently the Board recognizes Accreditation Council Graduate for Medical Education (ACGME) accredited postgraduate training for the purposes of allopathic medical school students’ clinical clerkship training and for the required postgraduate training for licensure as a physician and surgeon. ACGME accredited postgraduate training programs are at institutions that are accredited by the Joint Commission. Recently ACGME has accredited postgraduate training programs in hospitals that are accredited by the American Osteopathic Association-Healthcare Facilities Accreditation Program (AOA-HFAP). B&P Code section 2089.5 specifically references the “Joint Commission on Accreditation of Hospitals” as the hospital accreditation agency for ACGME postgraduate training programs.
American Osteopathic Association (AOA) accredits postgraduate training for licensure purposes for osteopathic medical school graduates. AOA accredited postgraduate training programs are usually obtained in hospitals that are accredited by the AOA-HFAP.
ACGME and AOA have reached an agreement for ACGME to approve all postgraduate training programs for both Allopathic medical schools (M.D. degrees awarded) and Osteopathic medical school (D.O. degrees awarded) graduates. This change will require an amendment to B&P Code section 2089.5 to include the AOA-HFAP as an approved accreditation agency for hospitals offering ACGME accredited postgraduate training programs.
The need to amend B&P Code section 2089.5 was presented to and approved by the Licensing Committee and the Full Board at the Board’s January 31, 2013meeting.
Midwifery Program (New) In addition to the new issues listed in Appendix 1 – Midwifery Program of the Sunset Review Report, the Midwifery Advisory Committee (MAC) identified two additional issues at its December 6, 2012 meeting. The MAC determined that Business and Professions Code (B&P) section 2514 does not include certified nurse midwives (CNM) as being able to supervise midwifery students. The MAC supported amending B&P section 2514 to include CNMs, who are licensed by the Board of
Medical Board of California: Sunset Review Report - SUPPLEMENTAL 2013 Page 15

Section 2 Licensing Program
Registered Nursing (BRN), as individuals who can supervise midwifery students. The Board will need to seek the BRN’s input on this issue too.
Currently both physicians and CNMs are identified as being able to sign off on clinical experience for license midwife students pursuant to B&P section 2513, but supervision of training is not specifically identified in law.
Another issue discussed at the MAC’s December 6, 2012 meeting was a proposal to change the current retrospective method of collecting data for the required annual reporting of licensed midwife statistics. These statistics are currently being reported to the Office of Statewide Health Planning and Development (OSHPD). The reporting system that the MAC evaluated is from Midwives Alliance of North America (MANA). MANA is a private organization and the MANA data reporting system is a prospective data collection system. The Board will continue to look at the feasibility and desirability of this change and determine if it should move forward to request a statutory change to Business and Professions Code Section 2516 in order to change the methodology used for collection of data and the mechanism for reporting this to the Legislature.
Medical Board of California: Sunset Review Report - SUPPLEMENTAL 2013 Page 16

Section 3
Expert Reviewer Training Co nsumer Protection Enforcement Initiative Positions
Cea se Practice for Failure to Comply with a n Order to Co mpel a Physical/Mental Examination
Board Review of Public Disclosure
Board Review of Actions after Effective Date Ver tical Enforcement/Prosecution
Co rrection to Enforcement Data
Enforcement Program

Section 3 Enforcement Program
Enforcement Program
Expert Reviewer Training In Section 5 – Enforcement Program, of the initial Sunset Review Report the Board’s enhancements to its Expert Reviewer Training program was discussed. Under the sub-section, “Performance Targets/Expectations” the Board reported 100 expert reviewers attended its first scheduled training using the new interactive components of the training.
Since the initial report was submitted, the Board has conducted a second training session, held in Irvine. This session was held on February 9, 2013 and was attended by 102 expert reviewers. The participants also received continuing medical education credits.
Consumer Protection Enforcement Initiative Positions In July 2009 there were several negative articles written regarding the length of time it was taking the Board of Registered Nursing to discipline a registered nurse who was in violation of the law. The articles also looked at the length of time it was taking other healing arts boards under the Department of Consumer Affairs (DCA) to complete investigations. It was determined by DCA that the enforcement processes of these boards was lengthy and needed to be improved to provide better consumer protection. In response to these articles, the DCA developed the CPEI. This initiative’s main goal was to reduce the enforcement completion timelines by addressing three specific areas. These areas included administrative improvements, staffing and information technology resources, and legislative changes. For the staffing resources, the DCA developed a Budget Change Proposal (BCP) requesting resources for all healing arts boards. This BCP went through the budget process and was approved in 2010. Due to this BCP, the Medical Board of California (Board) received 22.5 positions effective fiscal year (FY) 2010/2011.
The Board began to fill these positions by hiring an additional manager and one Staff Services Analyst in the Central Complaint Unit. The manager would provide the review of the complaints, and the analyst’s duties included seeking experts to perform the upfront review, preparing the complaint for mailing to the expert, and conducting the follow-up to ensure timely response by the expert. The Board management knew that the timeframe for the upfront expert review was increasing and these two resources would assist in this area. This left the Board with 20.5 CPEI positions.
Because the Board conducted investigations for the Osteopathic Medical Board of California (OMBC) and the Board of Psychology (BOP), 2.5 of the CPEI positions authorized for the Board were to assist in those boards’ investigations. However, these boards determined that they would rather have the positions under their specific authority. Therefore, in FY 2011/2012, those 2.5 positions were taken from the Board and provided to the OMBC and the BOP. This left the Board with 18 CPEI positions.
During FY 2010/2011, the Board was required to decrease its positions due to a requested workforce cap drill. The Board had not moved to fill any of its positions due to the uncertainty of the number of positions it would lose. The final direction on how many positions the Board would lose due to the workforce cap (2.5 positions) was not provided to the Board until June 2011. With the loss of these 2.5 positions, the Board had 15.5 remaining CPEI positions.
Although the Board began to identify where to establish these 15.5 positions and into which classification, the Board was also under a hiring freeze, which required the Board to request hiring freeze exemptions for any position the Board wanted to fill. The Board had several investigator and
Medical Board of California: Sunset Review Report - SUPPLEMENTAL 2013 Page 18

Section 3 Enforcement Program
medical consultant positions that required exemptions, as well as several licensing positions that were vacant, and determined that those exemptions were higher priority than the establishment of new positions.
The hiring freeze was lifted in November of 2011 and the Board again began discussion to fill these positions. However, in early 2012, the Board was notified that it would be required to eliminate 18.1 positions due to the 5% salary savings reduction. Rather than eliminate existing staff, the Board used the 15.5 CPEI positions (and 2.6 vacant positions) to meet the reduction.
The Board was notified in September 2012 that it could reestablish these positions in the temporary help blanket as long as the Board always maintains a 5% vacancy rate to meet the required salary reduction level. The Board has determined that it will request the re-establishment of 14.5 positions in the following areas in order to improve the enforcement timeframes as originally planned in the CPEI.
Six (6) positions will be used to establish a Northern Operation Safe Medicine Unit (OSM), identical to the OSM in the South. The Northern OSM will consist of 1 Supervising Investigator, 4 Investigators, and 1 Office Technician. The establishment of this office will take the unlicensed activity cases from the workload of the investigators in the northern district offices. This will reduce the investigators caseloads in the field offices and will assist in decreasing the investigation time for physicians who violate the law. This basically adds four (4) investigators for general workload.
Two (2) positions will be used to provide the Tustin and Rancho Cucamonga district offices with the full complement of investigators. All other district offices have six investigators. Due to budget reductions several years ago, these two offices were reduced to five investigators. This increase in investigators will assist in the reduction of the number of cases assigned to each investigator thus reducing the investigation timeframe.
Two (2) positions will be added to the Board’s Expert Reviewer Program. These analyst positions will assist in the recruitment and training of the Board’s expert reviewers. The Board needs additional experts and has determined that training experts not only improves the time to provide an opinion, but also improves the quality of the opinion.
Three (3) positions will be added to the Central Complaint Unit (CCU) and the Discipline Coordination Unit (DCU) to assist in the ever increasing workload in these areas. One analyst will be assigned to the Quality of Care section and will assist with the processing of those complaints, reducing the analysts workload in this section. One analyst will be assigned to the DCU and will process the administrative cases in an effort to reduce the time it takes to prepare the disciplinary documents. Lastly, one position will be used to establish a clerical position to assist with these duties in both the CCU and the DCU. All three of the positions will assist in improving the enforcement timeframes.
One and a half (1.5) positions will be used to conduct malpractice investigations. It is believed that this workload could be processed beginning with a desk investigation thereby reducing the number of cases referred to the field investigative staff. This will reduce the investigators workload and reduce the time it takes to investigate a complaint.
Board staff is working on preparing the paperwork for the establishment of these positions, which also requires the review and approval by DCA. All of these positions will help the Board in reducing the enforcement timeframe and meeting the original goal of the CPEI. Thus far the following positions have been sent to DCA for approval: the Northern OSM positions; the additional two investigator positions; and the three CCU/DCU positions.
Medical Board of California: Sunset Review Report - SUPPLEMENTAL 2013 Page 19

Section 3 Enforcement Program
Cease Practice for Failure to Comply with an Order to Compel a Physical/Mental Examination (New) Business and Profession Code sections 820-822 provides in pertinent part: “Whenever it appears that any person holding a license, certificate or permit under this division…may be unable to practice his or her profession safely because the licentiate’s ability to practice is impaired due to mental illness, or physical illness affecting competency, the licensing agency may order the licentiate to be examined by one or more physicians and surgeons or psychologists designated by the agency.”
The order for the examination is part of the investigative phase and allows the agency to make a substantive determination, following examination of the licentiate, that the licentiate’s ability to practice his or her profession actually has or has not become impaired because of mental or physical illness.
Failure of the licentiate to comply with an order issued under section 820 constitutes grounds for the suspension or revocation of the licentiate’s certificate or license (section 821). However, failure to comply with an order or delayed compliance poses risks for consumers in that a licentiate who may be mentally or physically ill continues to practice until the examination results allow the agency to move forward with suspension or revocation proceedings. Therefore, public protection will be better served if the agency has the authority to issue a cease practice order in cases where the licentiate delays or fails to comply with an order issued under Section 820 within the specified time frame as set forth in the order. To ensure fairness, a provision should be included to allow the Executive Director to authorize additional time, due to certain circumstances, but not to exceed 30 additional days.
Board Review of Public Disclosure (New) B&P Code sections 803.1 and 2027 identify information that is available to the public on the Board’s Web site and identify the length of time the information will be available on the Web site. Section 2027 specifically states the Board shall post disciplinary actions for ten years.
The Board has determined there may be instances where it is later notified of subsequent court action that may provide additional information as to the events surrounding the disciplinary action. The Board would like the ability to review the matter and if appropriate remove the action from the Web site prior to the ten years. The Board will continue to look at this matter.
Board Review of Actions after Effective Date (New) Pursuant to the Administrative Procedure Act, once the Board has taken disciplinary action against a physician and the effective date of the decision has passed, the Board loses jurisdiction in the matter. Although the individual can pursue a writ through the Superior Court, the Board itself cannot take further action.
The Board believes that if another court were to provide findings related to unprofessional conduct that are substantially different than the findings in the administrative case, those findings could be brought back to the Board and the matter be reopened for further consideration by the Board. If the Board were to determine new facts have been identified, the Board could rehear the case and determine the appropriate disciplinary action, provided that there is no detriment to consumer protection.
Medical Board of California: Sunset Review Report - SUPPLEMENTAL 2013 Page 20

Section 3 Enforcement Program
Vertical Enforcement/Prosecution Report
Recommendations to Vertical Enforcement/Prosecution (VE/P) The Board believes that the benefits of VE/P are significant and does not believe that any legislative amendments need to be made to the Government Code sections of the VE/P statutes. The Board recognizes there have been challenges in the implementation of VE/P but those challenges can be overcome through continued collaboration between the Board and HQES, and revisions to the procedural manuals used by both staffs.
The Board and the HQES will work together to establish best practices and identify other areas where improvements can be made. As issues arise, the Board will meet with the HQES to resolve any issues and will formalize the resolution in the VE/P Manual. In addition to the quarterly supervisor meetings, quarterly meetings with Board and HQES management and a Subcommittee of the Board will be established in order to determine what progress has been made and what amendments or enhancements need to be made to the VE/P model and Manual.
In order to reduce the DAG’s workload so they may reallocate resources to high priority items, criminal conviction cases that do not involve quality of care will not require DAG involvement until the matter is ready for the filing of an Accusation. This will enable the DAGs to focus on high priority matters, such as interim suspension orders, enforcement subpoenas, preparing the expert reviewers for hearing, etc.
Interim suspension orders are essential to consumer protection. These orders remove a physician who has a potential to endanger the public from practicing medicine. With the DAG being involved earlier in the case, this allows them to know the case and be able to prepare the necessary documents to petition the court for the suspension. This results in obtaining the suspension order in a more expeditious manner. Continue focus on these cases will result in better consumer protection.
Subpoena enforcement actions for obtaining medical records and a physician interview are critical as the Board is unable to determine whether the physician’s actions are egregious until the medical records have been obtained and reviewed and the physician interviewed. The Board adopted a “zero tolerance” policy in 2009 for delays in medical record acquisition and the physician interview. In addition, it sponsored legislation to require a physician’s attendance at an interview. The DAG’s attention to the process of subpoena enforcement is essential and eliminating the DAGs time on criminal conviction cases will assist in a reduction in the time to process these subpoenas.
The Board through its Expert Reviewer Training Program has determined that the experts need more communication and preparation with the DAGs. It is recommended that the DAG have the expert review the Accusation prior to filing and meet with the expert prior to the hearing. This will prepare the expert for the hearing and ensure the expert understands the hearing process.
The Board realizes the importance of the VE/P model and will continue to strive towards its improvement with the overall goal of meeting the Board’s mandate of consumer protection.
VE/P History In Section 1 – Background and Description of the Board and Regulated Profession, and Section 5 – Enforcement Program, of the Sunset Review Report, the Vertical Enforcement/Prosecution Model (VE/P) and its origination were briefly discussed. The Report stated that additional information, including a review of pertinent data, would be provided in this Supplemental Report. Pursuant to
Medical Board of California: Sunset Review Report - SUPPLEMENTAL 2013 Page 21
Section 3 Enforcement Program
Government Code section 12529.7 the Board must provide a report to the Legislature regarding the VE/P model. The Board provided a report to the Legislature in March 2012, however, the report did not contain a detailed report with statistical data regarding the program. The Board includes this report including an analysis of the data and recommendations in this supplemental report.
The Board’s mission, in part, is to protect consumers through the vigorous, objective enforcement of the Medical Practice Act. The Board has faced criticism because of the time it takes from receipt of a complaint to the conclusion of prosecution. In an attempt to address this concern, legislation was enacted via Senate Bill (SB) 1950 (Figueroa), Chapter 1085, Statutes of 2002, which mandated the appointment of an Enforcement Program Monitor (hereinafter “Monitor”) to “monitor and evaluate the disciplinary system and procedures” of the Board for a period of two years. In both the initial and final reports of the Medical Board of California Enforcement Program Monitor, the Monitor recommended the vertical prosecution model whereby “the trial attorney and the investigator are assigned as the team to handle a complex case as soon as it is opened as a formal investigation.” The Monitor opined that the vertical prosecution model would improve efficiency and reduce case cycle time, and, thereby, ensure the quality and safety of medical care to the people of California. Consequently, SB 231, Chapter 674, Statutes of 2005, was enacted into law, codifying the use of the vertical prosecution model, effective January 1, 2006.
Under SB 231, the Board and the Department of Justice (DOJ) Health Quality Enforcement Section (HQES) were required to implement a vertical prosecution model to conduct its investigations and prosecutions. Under the legislation, each complaint referred to a Board district office for investigation is simultaneously and jointly assigned to a Board investigator and a HQES deputy. The legislative goal of VE/P was to bring Board investigators and HQES Deputies Attorney General (DAG) together from the beginning of an investigation with the goal of increasing public protection by improving coordination and teamwork, increasing efficiency, and reducing investigation and prosecution delays. Additionally, the Board hoped the relationship between Board investigators and HQES would enhance the Board’s ability to recruit and retain experienced investigators, particularly if Board investigators were compensated commensurate to DOJ Agents for the complexity of the investigations they undertake.
The Board and HQES agreed that VE/P included three basic elements. First, each complaint of alleged misconduct by a physician referred to a Board office for investigation would be simultaneously and jointly assigned to a Board investigator and a HQES DAG. Second, that joint assignment would exist for the duration of the case. Third, under the direction of a DAG, the assigned Board investigator would be responsible for obtaining the evidence required to permit the DAG to advise the Board on legal matters such as whether a formal accusation should be filed, whether the case should be closed, or whether other action should be taken.
As mandated, the Board and the HQES implemented the vertical prosecution model on January 1, 2006. Since not all of the Board’s cases lead to prosecution (approximately 60% of the cases result in closure with no need for prosecution), the name of the new model was changed from the Vertical Prosecution Model to the Vertical Enforcement/Prosecution model, (although statute still refers to a vertical prosecution model). Due to staffing limitations, the VE/P model was also changed from pairing a DAG with a Board investigator from the outset of an investigation until the matter was resolved to instead assigning a “lead” DAG to a district office to provide legal support and direction to investigators until a “primary” DAG was assigned. Sexual misconduct cases, or cases where there is a potential imminent threat to the consumer, were immediately assigned to a “primary” DAG.
Medical Board of California: Sunset Review Report - SUPPLEMENTAL 2013 Page 22

Section 3 Enforcement Program
Initial statistical data from the implementation pilot (January 2006 – April 2007) identified trends which suggested that VE/P could more quickly identify cases for closure, expedite complaints of egregious behavior, and reduce the time to complete investigations. The pilot did not, however, provide sufficient time to address concerns regarding the time to complete a prosecution because some Board investigations take more than 18 months to complete. The available statistics at that time only covered a 16-month period. The analysis of the initial pilot showed promise in reducing the time frames to: obtain medical records, obtain a physician interview, obtain a medical expert opinion, close a case without prosecution, file an Interim Suspension Order and file an Accusation. Therefore, VE/P was continued.
In August 2010, a program evaluation summary report resulting from a study of VE/P was prepared by Benjamin Frank, LLC. Mr. Frank’s conclusions were that the insertion of DAGs into the investigative process did not translate into more positive disciplinary outcomes or a decrease in investigation completion times. Mr. Frank recommended scaling back and optimizing DAG involvement in investigations. His report identified that the best practices and most fiscally sound use of DAG hours were found to occur in Northern California, where DAGs did not typically attend complainant/witness and subject interviews unless the case facts supported their attendance. Northern California disciplinary timelines statistics were superior to those of the Los Angeles area, where DAGs were significantly more involved in every aspect of the investigation. According to Mr. Frank’s assessment, this translated into unnecessary costs. He also identified in his report significant Board investigator frustration. This was due to both how the VE/P was implemented in the legislation and how it impacted the initial investigation time. Mr. Frank, identified these two factors as contributors to staff attrition.
Sunset Review and VE/P Evaluation On November 1, 2012, the Board submitted its Sunset Review Report 2012 to the Senate Business, Professional and Economic Development (B&P) Committee. Section 5 provided a review and summary of the Board’s “Enforcement Program.” While VE/P was discussed narratively within Section 5, statistical data to depict the timelines of cases was not included. The Board explained it was conducting a thorough review of statistics related to VE/P, to be relayed to the B&P Committee in a Spring 2013 report. The report would include a review of factors to assess the efficacy of VE/P and any recommendations from the Board regarding its continuation.
The following chart reflects the investigation timeframe averages prior to and continuing into VE/P implementation (FY 04/05 through FY 11/12).
INVESTIGATION TIME FRAMES
Avg. Days
# Cases
Avg. Days
# Cases
Avg. Days
# Cases
Avg. Days
# Cases
Avg. Days
# Cases
Avg. Days
# Cases
Avg. Days
# Cases
Avg. Days
# Cases
Fiscal Year 04/05 05/06 06/07 07/08 08/09 09/10 10/11 11/12
All Investigation Closures
296 1,204 312 1,062 336 941 374 961 401 847 382 1,003 356 1,089 298 1,132
749 Closed - No Further Action
269 860 290 749 324 645 354 701 384 568 355 635 330 701 272
Referred for Disciplinary Action
362 344 365 313 364 296 426 260 437 279 427 368 404 388 350 383
Discussion of Attached Statistical Charts Attachment A provides the overall and subcategorized data. The statistical data is displayed to show each of the main case types investigated by the Board and to identify where VE/P has produced efficiencies. The case types examined were gross negligence/incompetence, inappropriate prescribing,
Medical Board of California: Sunset Review Report - SUPPLEMENTAL 2013 Page 23

Section 3 Enforcement Program
unlicensed activity, sexual misconduct, mental/physical illness, self-abuse of drugs/alcohol, fraud, conviction, unprofessional conduct, and internet prescribing. (The case types examined are basically the same in Attachments A-F.)
What Attachment A indicates, is that when VE/P was first implemented there were significant increases in the overall average and median days to process investigations. The averages are now back to and lower than the pre VE/P. The anticipation is that the overall averages would continue at the current level or decrease. The data clearly indicates that there must have been many factors that needed to be overcome in the integration of the VE/P into the investigative process.
Attachment B provides the overall and subcategorized data for investigation initiated to suspension issued, and investigation completed to suspension issued. What Attachment B indicates is that there has been a significant decrease in the time it takes to obtain a suspension in the all case types, and in most subcategories. Overall, investigation to suspension has decreased by almost 100 days.
Having the DAGs working on the physical or mental illness and sexual misconduct cases from inception ensures that they are familiar with the details of the case in order to draft the necessary documents in an expeditious manner.
Attachment C provides the overall and subcategorized data for investigation initiated to accusation filed and investigation completed to accusation filed. The data indicates that VE/P has made an improvement in the average time it takes to investigate all case types and file an accusation. The average time was 551 days in FY 04/05 and 519 day in FY 11/12, a decrease of 32 days.
Attachment D provides the overall and subcategorized data for investigation initiated to stipulated decision received and investigation completed to stipulated decision received. Because of the DAGs’ involvement, in certain types of cases, the time from investigation to stipulation received went down. More focused DAG time on those cases where the time went up, such as sexual misconduct, mental/physical illness, and inappropriate prescribing might bring those averages down.
Attachment E provides the overall and subcategorized data for investigation initiated to submittal of the matter to an ALJ and investigation completed to submittal of the matter to an ALJ. What Attachment E indicates is that the overall time from the initiation of an investigation until the matter was submitted to an ALJ had a decrease of 77 days. The significance of this chart is that the time from investigation closed until the matter is heard by the ALJ has significantly decreased in almost every category. This is an indication that having the DAG involved in the case that goes to hearing and knowing the underlying circumstances has had a positive impact on getting the case heard.
Attachment F provides the overall and subcategorized data for investigation initiated to default decision received and investigation completed to default decision received. The cases that resulted in a default decision did not see any improvement.
Attachment G represents the cases declined by the Attorney General’s office and those cases needing supplemental investigation after referral to the AG’s office.
The chart below provides a synopsis of the charts discussed above and provided in the attachments. The chart below provides the timeframes for all case types. It also shows the average time in calendar days.
Medical Board of California: Sunset Review Report - SUPPLEMENTAL 2013 Page 24

TIME TO FILE AN ACCUSATION 04/05 05/06 06/07 07/08 08/09 09/10 10/11 11/12
All Case Types - (Number of cases) 164 166 171 173 154 206 198 232
From Investigation Initiated to Accusation 551 564 533 566 608 575 580 519
From Investigation Completed to Accusation 149 169 166 146 132 124 126 121
TIME TO ISSUE A SUSPENSION 04/05 05/06 06/07 07/08 08/09 09/10 10/11 11/12
All Case Types - (Number of cases) 30 28 26 20 25 18 27 31
From Investigation Initiated to Suspension Issued 392 307 315 471 358 228 451 297
From Investigation Completed to Suspension Issued 168 120 93 215 105 66 191 109
TIME TO STIPULATED DECISION RECEIVED 04/05 05/06 06/07 07/08 08/09 09/10 10/11 11/12
All Case Types - (Number of cases) 156 141 143 145 118 135 120 160
From Investigation Initiated to Stipulation Received 922 1,039 923 940 818 916 912 914
From Investigation Completed to Stipulation Received 528 636 542 518 410 431 477 459
TIME TO MATTER SUBMITTED TO ALJ OR PROPOSED DECISION RECEIVED
04/05 05/06 06/07 07/08 08/09 09/10 10/11 11/12
All Case Types - (Number of cases) 42 30 37 39 33 27 37 38
From Investigation Initiated to Proposed Decision 1,115 1,161 926 1,161 1,102 850 973 1,038
From Investigation Completed to Proposed Decision 713 747 604 751 700 437 513 565
TIME TO DEFAULT DECISION RECEIVED 04/05 05/06 06/07 07/08 08/09 09/10 10/11 11/12
All Case Types - (Number of cases) 12 7 11 8 12 7 11 8
From Investigation Initiated to Default Decision Received 477 554 673 591 732 771 690 678
From Investigation Completed to Default Decision Received 190 211 411 304 441 374 322 282
Section 3 Enforcement Program
With the decrease in investigative time in the last two years, decreases should be reflected in the overall disciplinary timeframes in FY 13/14 and ongoing.
Medical Board of California: Sunset Review Report - SUPPLEMENTAL 2013 Page 25

Table 10. Enforcement Aging
FY
2008/09 FY
2009/10 FY
2010/11 FY
2011/12 Cases
Closed Average %
Attorney General Cases (Average %)
Closed Within:
1 Year 47 60 58 60 225 22%
2 Years 56 62 60 59 237 23%
3 Years 65 52 48 76 241 24%
4 Years 37 50 42 72 201 20%
Over 4 Years 27 29 24 31 111 11%
Total Cases Closed 232 253 232 298 1,015 100%
Investigations (Average %)
Closed Within:
90 Days 3,456 3,447 3,987 3,621 14,511 53%
180 Days 1,759 1,789 1,715 1,905 7,168 26%
1 Year 620 640 632 996 2,888 11%
2 Years 408 510 584 595 2,097 8%
3 Years 153 154 163 89 559 2%
Over 3 Years 3 4 0 0 7 0%
Total Cases Closed 6,399 6,544 7,081 7,206 27,230 100%
Section 3 Enforcement Program
Correction to Enforcement Data Upon further review of Table 10 data, the Board discovered that some information was reported erroneously. For the Attorney General Cases (Average %), the FY 2008/09 statistics have been adjusted. This resulted in the ‘Cases Closed’ and the ‘Average %’ requiring adjustments as well. The corrected Table 10 is presented below.
The original report makes several references to 112 ‘Cases Referred for Criminal Action’ in FY 2011/2012. This amount includes physicians and surgeons and other allied health professions combined. There were 89 cases referred for criminal action for physicians and surgeons.
Medical Board of California: Sunset Review Report - SUPPLEMENTAL 2013 Page 26
ATTACHMENT A
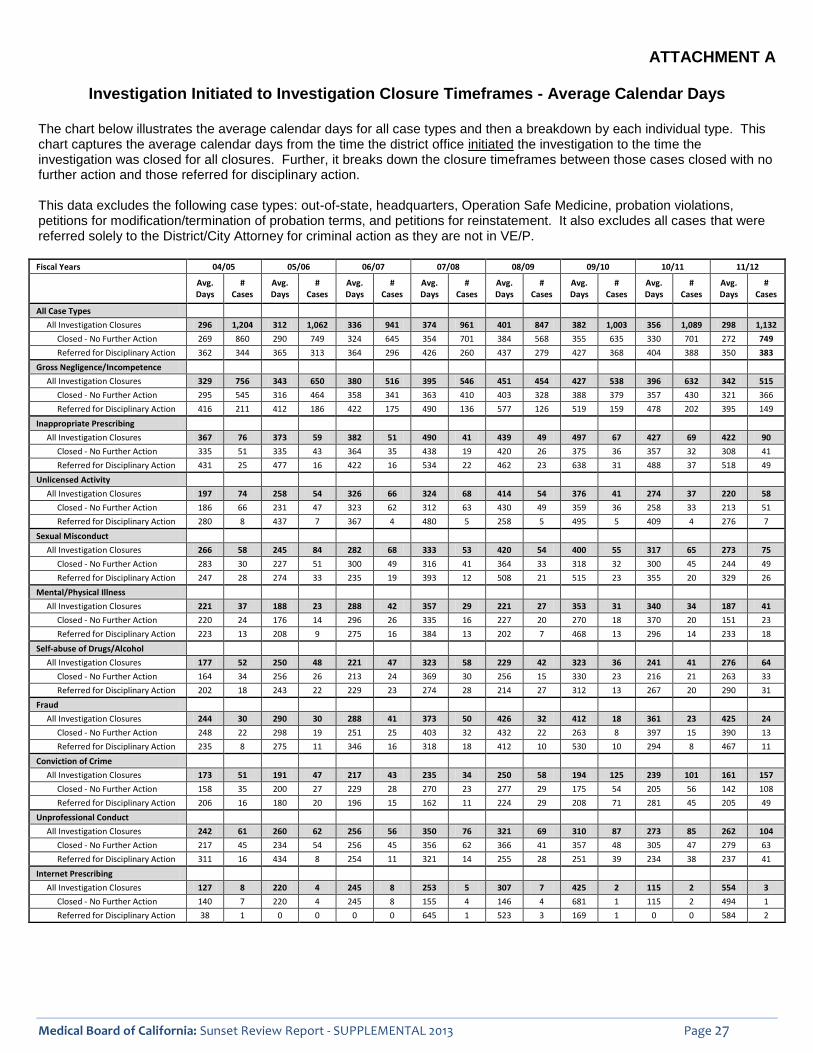
Investigation Initiated to Investigation Closure Timeframes - Average Calendar Days
The chart below illustrates the average calendar days for all case types and then a breakdown by each individual type. This chart captures the average calendar days from the time the district office initiated the investigation to the time the investigation was closed for all closures. Further, it breaks down the closure timeframes between those cases closed with no further action and those referred for disciplinary action.
This data excludes the following case types: out-of-state, headquarters, Operation Safe Medicine, probation violations, petitions for modification/termination of probation terms, and petitions for reinstatement. It also excludes all cases that were referred solely to the District/City Attorney for criminal action as they are not in VE/P.
Fiscal Years 04/05 05/06 06/07 07/08 08/09 09/10 10/11 11/12
Avg. Days
# Cases
Avg. Days
# Cases
Avg. Days
# Cases
Avg. Days
# Cases
Avg. Days
# Cases
Avg. Days
# Cases
Avg. Days
# Cases
Avg. Days
# Cases
All Case Types
All Investigation Closures 296 1,204 312 1,062 336 941 374 961 401 847 382 1,003 356 1,089 298 1,132
Closed - No Further Action 269 860 290 749 324 645 354 701 384 568 355 635 330 701 272 749
Referred for Disciplinary Action 362 344 365 313 364 296 426 260 437 279 427 368 404 388 350 383
Gross Negligence/Incompetence
All Investigation Closures 329 756 343 650 380 516 395 546 451 454 427 538 396 632 342 515
Closed - No Further Action 295 545 316 464 358 341 363 410 403 328 388 379 357 430 321 366
Referred for Disciplinary Action 416 211 412 186 422 175 490 136 577 126 519 159 478 202 395 149
Inappropriate Prescribing
All Investigation Closures 367 76 373 59 382 51 490 41 439 49 497 67 427 69 422 90
Closed - No Further Action 335 51 335 43 364 35 438 19 420 26 375 36 357 32 308 41
Referred for Disciplinary Action 431 25 477 16 422 16 534 22 462 23 638 31 488 37 518 49
Unlicensed Activity
All Investigation Closures 197 74 258 54 326 66 324 68 414 54 376 41 274 37 220 58
Closed - No Further Action 186 66 231 47 323 62 312 63 430 49 359 36 258 33 213 51
Referred for Disciplinary Action 280 8 437 7 367 4 480 5 258 5 495 5 409 4 276 7
Sexual Misconduct
All Investigation Closures 266 58 245 84 282 68 333 53 420 54 400 55 317 65 273 75
Closed - No Further Action 283 30 227 51 300 49 316 41 364 33 318 32 300 45 244 49
Referred for Disciplinary Action 247 28 274 33 235 19 393 12 508 21 515 23 355 20 329 26
Mental/Physical Illness
All Investigation Closures 221 37 188 23 288 42 357 29 221 27 353 31 340 34 187 41
Closed - No Further Action 220 24 176 14 296 26 335 16 227 20 270 18 370 20 151 23
Referred for Disciplinary Action 223 13 208 9 275 16 384 13 202 7 468 13 296 14 233 18
Self-abuse of Drugs/Alcohol
All Investigation Closures 177 52 250 48 221 47 323 58 229 42 323 36 241 41 276 64
Closed - No Further Action 164 34 256 26 213 24 369 30 256 15 330 23 216 21 263 33
Referred for Disciplinary Action 202 18 243 22 229 23 274 28 214 27 312 13 267 20 290 31
Fraud
All Investigation Closures 244 30 290 30 288 41 373 50 426 32 412 18 361 23 425 24
Closed - No Further Action 248 22 298 19 251 25 403 32 432 22 263 8 397 15 390 13
Referred for Disciplinary Action 235 8 275 11 346 16 318 18 412 10 530 10 294 8 467 11
Conviction of Crime
All Investigation Closures 173 51 191 47 217 43 235 34 250 58 194 125 239 101 161 157
Closed - No Further Action 158 35 200 27 229 28 270 23 277 29 175 54 205 56 142 108
Referred for Disciplinary Action 206 16 180 20 196 15 162 11 224 29 208 71 281 45 205 49
Unprofessional Conduct
All Investigation Closures 242 61 260 62 256 56 350 76 321 69 310 87 273 85 262 104
Closed - No Further Action 217 45 234 54 256 45 356 62 366 41 357 48 305 47 279 63
Referred for Disciplinary Action 311 16 434 8 254 11 321 14 255 28 251 39 234 38 237 41
Internet Prescribing
All Investigation Closures 127 8 220 4 245 8 253 5 307 7 425 2 115 2 554 3
Closed - No Further Action 140 7 220 4 245 8 155 4 146 4 681 1 115 2 494 1
Referred for Disciplinary Action 38 1 0 0 0 0 645 1 523 3 169 1 0 0 584 2
Medical Board of California: Sunset Review Report - SUPPLEMENTAL 2013 Page 27
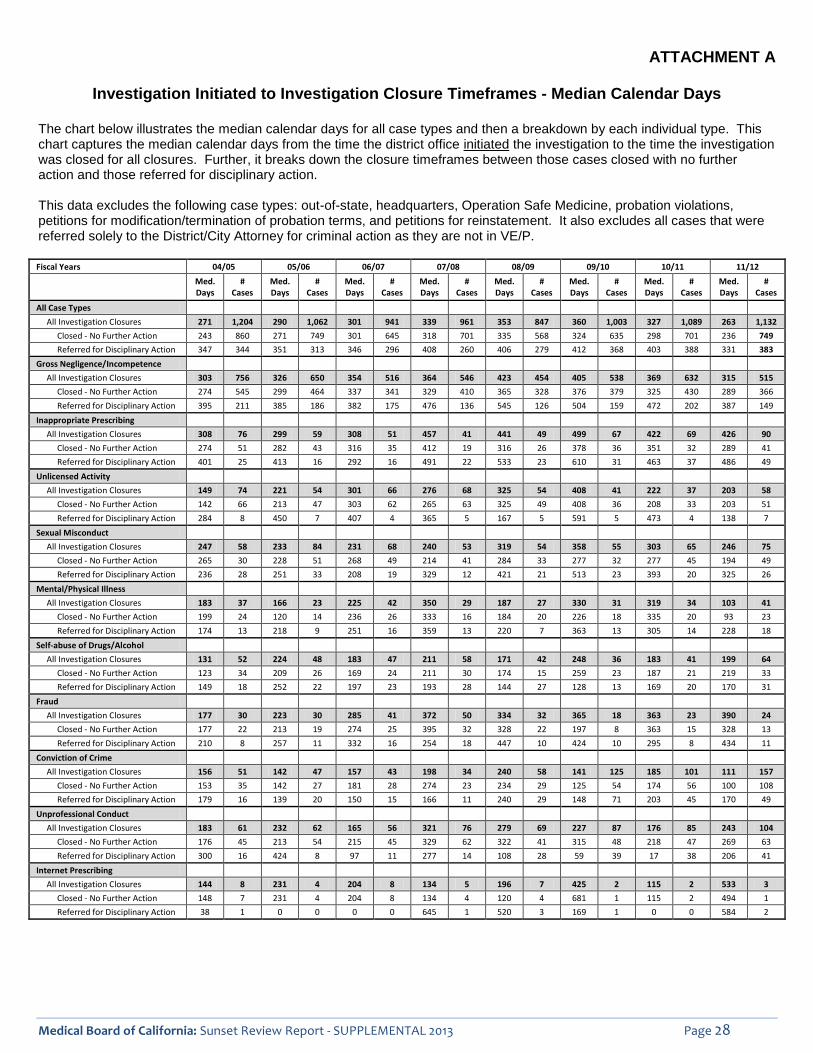
ATTACHMENT A
Investigation Initiated to Investigation Closure Timeframes - Median Calendar Days
The chart below illustrates the median calendar days for all case types and then a breakdown by each individual type. This chart captures the median calendar days from the time the district office initiated the investigation to the time the investigation was closed for all closures. Further, it breaks down the closure timeframes between those cases closed with no further action and those referred for disciplinary action.
This data excludes the following case types: out-of-state, headquarters, Operation Safe Medicine, probation violations, petitions for modification/termination of probation terms, and petitions for reinstatement. It also excludes all cases that were referred solely to the District/City Attorney for criminal action as they are not in VE/P.
Fiscal Years 04/05 05/06 06/07 07/08 08/09 09/10 10/11 11/12
Med. Days
# Cases
Med. Days
# Cases
Med. Days
# Cases
Med. Days
# Cases
Med. Days
# Cases
Med. Days
# Cases
Med. Days
# Cases
Med. Days
# Cases
All Case Types
All Investigation Closures 271 1,204 290 1,062 301 941 339 961 353 847 360 1,003 327 1,089 263 1,132
Closed - No Further Action 243 860 271 749 301 645 318 701 335 568 324 635 298 701 236 749
Referred for Disciplinary Action 347 344 351 313 346 296 408 260 406 279 412 368 403 388 331 383
Gross Negligence/Incompetence
All Investigation Closures 303 756 326 650 354 516 364 546 423 454 405 538 369 632 315 515
Closed - No Further Action 274 545 299 464 337 341 329 410 365 328 376 379 325 430 289 366
Referred for Disciplinary Action 395 211 385 186 382 175 476 136 545 126 504 159 472 202 387 149
Inappropriate Prescribing
All Investigation Closures 308 76 299 59 308 51 457 41 441 49 499 67 422 69 426 90
Closed - No Further Action 274 51 282 43 316 35 412 19 316 26 378 36 351 32 289 41
Referred for Disciplinary Action 401 25 413 16 292 16 491 22 533 23 610 31 463 37 486 49
Unlicensed Activity
All Investigation Closures 149 74 221 54 301 66 276 68 325 54 408 41 222 37 203 58
Closed - No Further Action 142 66 213 47 303 62 265 63 325 49 408 36 208 33 203 51
Referred for Disciplinary Action 284 8 450 7 407 4 365 5 167 5 591 5 473 4 138 7
Sexual Misconduct
All Investigation Closures 247 58 233 84 231 68 240 53 319 54 358 55 303 65 246 75
Closed - No Further Action 265 30 228 51 268 49 214 41 284 33 277 32 277 45 194 49
Referred for Disciplinary Action 236 28 251 33 208 19 329 12 421 21 513 23 393 20 325 26
Mental/Physical Illness
All Investigation Closures 183 37 166 23 225 42 350 29 187 27 330 31 319 34 103 41
Closed - No Further Action 199 24 120 14 236 26 333 16 184 20 226 18 335 20 93 23
Referred for Disciplinary Action 174 13 218 9 251 16 359 13 220 7 363 13 305 14 228 18
Self-abuse of Drugs/Alcohol
All Investigation Closures 131 52 224 48 183 47 211 58 171 42 248 36 183 41 199 64
Closed - No Further Action 123 34 209 26 169 24 211 30 174 15 259 23 187 21 219 33
Referred for Disciplinary Action 149 18 252 22 197 23 193 28 144 27 128 13 169 20 170 31
Fraud
All Investigation Closures 177 30 223 30 285 41 372 50 334 32 365 18 363 23 390 24
Closed - No Further Action 177 22 213 19 274 25 395 32 328 22 197 8 363 15 328 13
Referred for Disciplinary Action 210 8 257 11 332 16 254 18 447 10 424 10 295 8 434 11
Conviction of Crime
All Investigation Closures 156 51 142 47 157 43 198 34 240 58 141 125 185 101 111 157
Closed - No Further Action 153 35 142 27 181 28 274 23 234 29 125 54 174 56 100 108
Referred for Disciplinary Action 179 16 139 20 150 15 166 11 240 29 148 71 203 45 170 49
Unprofessional Conduct
All Investigation Closures 183 61 232 62 165 56 321 76 279 69 227 87 176 85 243 104
Closed - No Further Action 176 45 213 54 215 45 329 62 322 41 315 48 218 47 269 63
Referred for Disciplinary Action 300 16 424 8 97 11 277 14 108 28 59 39 17 38 206 41
Internet Prescribing
All Investigation Closures 144 8 231 4 204 8 134 5 196 7 425 2 115 2 533 3
Closed - No Further Action 148 7 231 4 204 8 134 4 120 4 681 1 115 2 494 1
Referred for Disciplinary Action 38 1 0 0 0 0 645 1 520 3 169 1 0 0 584 2
Medical Board of California: Sunset Review Report - SUPPLEMENTAL 2013 Page 28

Investigation Initiated to Investigation Closure Timeframes - Average/Median Calendar Days The graphs below illustrate the average (left column) and median (right column) calendar days for all case types and then a breakdown by each individual type. These graphs show three different measurements. One line shows the average/median calendar days from the time the district office initiated the investigation to the time the investigation was closed for all closures. The two other lines breakdown the closure timeframes between those cases closed with no further action and those referred for disciplinary action.
This data excludes the following case types: out-of-state, headquarters, Operation Safe Medicine, probation violations, petitions for modification/termination of probation terms, and petitions for reinstatement. It also excludes all cases that were referred solely to the District/City Attorney for criminal action as they are not in VE/P.
All Case Types
500
450
400
350
300
250
437426 427 401 404384365 374 382
362 364 354 355 356 350336324 330312296 290 298 269 272
200
150
100
50
0
04/05 05/06 06/07 07/08 08/09 09/10 10/11 11/12
All Investigation Closures - Average
Closed - No Further Action - Average
Referred for Disciplinary Action - Average
301
All Case Types
450
400
350
300
250
408 406 412 403
347 351 346 353 360 339 335 324 327 331318301 298290
271 271 263243 236
200
150
100
50
0
04/05 05/06 06/07 07/08 08/09 09/10 10/11 11/12
All Investigation Closures - Median
Closed - No Further Action - Median
Referred for Disciplinary Action - Median
Gross Negligence/Incompetence
700
600
500
400
300
577 519
490 478451 416 422 427412 395 403 388 396 395380358 363 357343 342329 316 321295
200
100
0
04/05 05/06 06/07 07/08 08/09 09/10 10/11 11/12
All Investigation Closures - Average
Closed - No Further Action - Average
Referred for Disciplinary Action - Average
Gross Negligence/Incompetence
600 545
500
400
300
504 476 472
423 395 405385 382 387376365 369354 364
337326 329 325 315303 299 289274
200
100
0
04/05 05/06 06/07 07/08 08/09 09/10 10/11 11/12
All Investigation Closures - Median
Closed - No Further Action - Median
Referred for Disciplinary Action - Median
ATTACHMENT A
Medical Board of California: Sunset Review Report - SUPPLEMENTAL 2013 Page 29
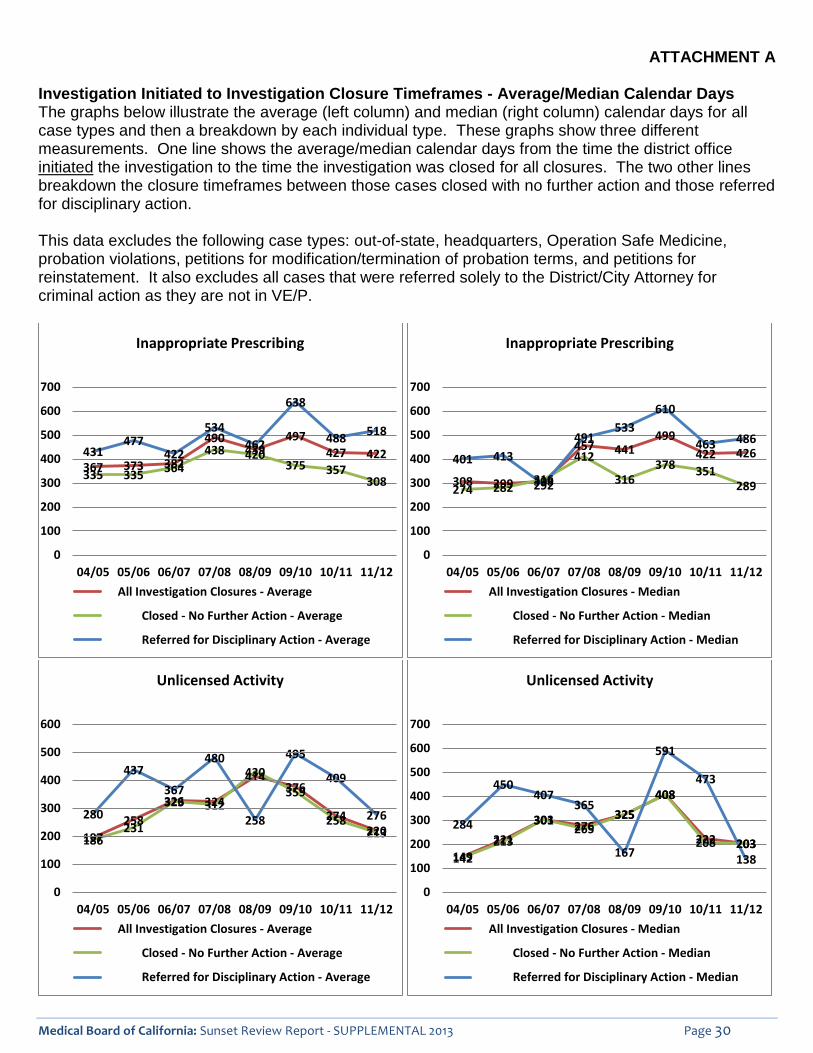
Investigation Initiated to Investigation Closure Timeframes - Average/Median Calendar Days The graphs below illustrate the average (left column) and median (right column) calendar days for all case types and then a breakdown by each individual type. These graphs show three different measurements. One line shows the average/median calendar days from the time the district office initiated the investigation to the time the investigation was closed for all closures. The two other lines breakdown the closure timeframes between those cases closed with no further action and those referred for disciplinary action.
This data excludes the following case types: out-of-state, headquarters, Operation Safe Medicine, probation violations, petitions for modification/termination of probation terms, and petitions for reinstatement. It also excludes all cases that were referred solely to the District/City Attorney for criminal action as they are not in VE/P.
Inappropriate Prescribing
700
600 638
500
400
300
534 518490 497477 488462
431 438 439422 420 427 422 382367 373 364 375 357335 335 308
200
100
0
04/05 05/06 06/07 07/08 08/09 09/10 10/11 11/12
All Investigation Closures - Average
Closed - No Further Action - Average
Referred for Disciplinary Action - Average
Inappropriate Prescribing
700
600 610
500
400
300
533 491 499 486457 463441
401 413 412 422 426 378 351
308 316 316299 308292 289274 282
200
100
0
04/05 05/06 06/07 07/08 08/09 09/10 10/11 11/12
All Investigation Closures - Median
Closed - No Further Action - Median
Referred for Disciplinary Action - Median
Unlicensed Activity
600
500 495480
400
300
200
437 430414 409 367 376359 326323 324312
280 274 276258 258 258231 220213197186
100
0
04/05 05/06 06/07 07/08 08/09 09/10 10/11 11/12
All Investigation Closures - Average
Closed - No Further Action - Average
Referred for Disciplinary Action - Average
408
325
203
Unlicensed Activity
700
600 591
500
400
300
200
473450 407 408
365 325301303284 276265
221213 222208 203
100 167149142 138
0
04/05 05/06 06/07 07/08 08/09 09/10 10/11 11/12
All Investigation Closures - Median
Closed - No Further Action - Median
Referred for Disciplinary Action - Median
ATTACHMENT A
Medical Board of California: Sunset Review Report - SUPPLEMENTAL 2013 Page 30

Investigation Initiated to Investigation Closure Timeframes - Average/Median Calendar Days The graphs below illustrate the average (left column) and median (right column) calendar days for all case types and then a breakdown by each individual type. These graphs show three different measurements. One line shows the average/median calendar days from the time the district office initiated the investigation to the time the investigation was closed for all closures. The two other lines breakdown the closure timeframes between those cases closed with no further action and those referred for disciplinary action.
This data excludes the following case types: out-of-state, headquarters, Operation Safe Medicine, probation violations, petitions for modification/termination of probation terms, and petitions for reinstatement. It also excludes all cases that were referred solely to the District/City Attorney for criminal action as they are not in VE/P.
Sexual Misconduct
600
500 508 515
400 420393 400
300
200
364 355333 329316 318 317300 300283 274 282266 273247 245 235 244227
100
0
04/05 05/06 06/07 07/08 08/09 09/10 10/11 11/12
All Investigation Closures - Average
Closed - No Further Action - Average
Referred for Disciplinary Action - Average
Sexual Misconduct
600
500 513
400 421 393
300
200
358 329 319 325303284 277 277265 268247 251236 246233228 231 240
208 214 194
100
0
04/05 05/06 06/07 07/08 08/09 09/10 10/11 11/12
All Investigation Closures - Median
Closed - No Further Action - Median
Referred for Disciplinary Action - Median
Mental/Physical Illness
500
450
400
350
300
250
200
468
384 370357 353335 340
288296 296275 270
233221220223 221227208 202188 187176 150
100 151
50
0
04/05 05/06 06/07 07/08 08/09 09/10 10/11 11/12
All Investigation Closures - Average
Closed - No Further Action - Average
Referred for Disciplinary Action - Average
Mental/Physical Illness
400
350
300
250
200
150
359 363350333 330 335
319305
251236225 228220 226218 199183 187184174 166
100 120
10393
50
0
04/05 05/06 06/07 07/08 08/09 09/10 10/11 11/12
All Investigation Closures - Median
Closed - No Further Action - Median
Referred for Disciplinary Action - Median
ATTACHMENT A
Medical Board of California: Sunset Review Report - SUPPLEMENTAL 2013 Page 31

Investigation Initiated to Investigation Closure Timeframes - Average/Median Calendar Days The graphs below illustrate the average (left column) and median (right column) calendar days for all case types and then a breakdown by each individual type. These graphs show three different measurements. One line shows the average/median calendar days from the time the district office initiated the investigation to the time the investigation was closed for all closures. The two other lines breakdown the closure timeframes between those cases closed with no further action and those referred for disciplinary action.
This data excludes the following case types: out-of-state, headquarters, Operation Safe Medicine, probation violations, petitions for modification/termination of probation terms, and petitions for reinstatement. It also excludes all cases that were referred solely to the District/City Attorney for criminal action as they are not in VE/P.
Self-abuse of Drugs/Alcohol
400
350
300
250
200
150
369
323 323330312
290274 276267 263250256 256243 241229 229221213 214 216202
177164
100
50
0
04/05 05/06 06/07 07/08 08/09 09/10 10/11 11/12
All Investigation Closures - Average
Closed - No Further Action - Average
Referred for Disciplinary Action - Average
211
Self-abuse of Drugs/Alcohol
300
250
200
150
100
259252 248 224 219209 211
197 199193183 183187 169 171174 169 170
149 144131123 128
50
0
04/05 05/06 06/07 07/08 08/09 09/10 10/11 11/12
All Investigation Closures - Median
Closed - No Further Action - Median
Referred for Disciplinary Action - Median
Fraud
600
500
400
300
200
530
467 426432 425403 412 412 397 390373 361346
318 290298 288 294275 263244248 251235
100
0
04/05 05/06 06/07 07/08 08/09 09/10 10/11 11/12
All Investigation Closures - Average
Closed - No Further Action - Average
Referred for Disciplinary Action - Average
363
177
Fraud
500
450
400
350
300
250
200
150
447 434424 395 390372 365 363
332 334328 328 295285274257 254
223210 213 197177
100
50
0
04/05 05/06 06/07 07/08 08/09 09/10 10/11 11/12
All Investigation Closures - Median
Closed - No Further Action - Median
Referred for Disciplinary Action - Median
ATTACHMENT A
Medical Board of California: Sunset Review Report - SUPPLEMENTAL 2013 Page 32

Investigation Initiated to Investigation Closure Timeframes - Average/Median Calendar Days The graphs below illustrate the average (left column) and median (right column) calendar days for all case types and then a breakdown by each individual type. These graphs show three different measurements. One line shows the average/median calendar days from the time the district office initiated the investigation to the time the investigation was closed for all closures. The two other lines breakdown the closure timeframes between those cases closed with no further action and those referred for disciplinary action.
This data excludes the following case types: out-of-state, headquarters, Operation Safe Medicine, probation violations, petitions for modification/termination of probation terms, and petitions for reinstatement. It also excludes all cases that were referred solely to the District/City Attorney for criminal action as they are not in VE/P.
Conviction of Crime
300 277 281270
250
200
150
100
250 235 239229 224217206 208 205200 205
191 196 194 180173 175
158 162 161 142
50
0
04/05 05/06 06/07 07/08 08/09 09/10 10/11 11/12
All Investigation Closures - Average
Closed - No Further Action - Average
Referred for Disciplinary Action - Average
240
142
Conviction of Crime
300 274
250
200
150
100
240234
198 203 179 181 185174166 170 156153 157150 148142139 141
125 111100
50
0
04/05 05/06 06/07 07/08 08/09 09/10 10/11 11/12
All Investigation Closures - Median
Closed - No Further Action - Median
Referred for Disciplinary Action - Median
256
Unprofessional Conduct
500
450 434 400
350
300
250
200
150
366350356 357 321 321311 310 305
273 279260 256254 255 262242 251234 234 237217
100
50
0
04/05 05/06 06/07 07/08 08/09 09/10 10/11 11/12
All Investigation Closures - Average
Closed - No Further Action - Average
Referred for Disciplinary Action - Average
Unprofessional Conduct
450
400 424
350
300
250
200
150
321329 322 315300 277 279 269
243232 227213 215 218 206 183176 176165
100 10897
50 59
0 17
04/05 05/06 06/07 07/08 08/09 09/10 10/11 11/12
All Investigation Closures - Median
Closed - No Further Action - Median
Referred for Disciplinary Action - Median
ATTACHMENT A
Medical Board of California: Sunset Review Report - SUPPLEMENTAL 2013 Page 33

Investigation Initiated to Investigation Closure Timeframes - Average/Median Calendar Days The graphs below illustrate the average (left column) and median (right column) calendar days for all case types and then a breakdown by each individual type. These graphs show three different measurements. One line shows the average/median calendar days from the time the district office initiated the investigation to the time the investigation was closed for all closures. The two other lines breakdown the closure timeframes between those cases closed with no further action and those referred for disciplinary action.
This data excludes the following case types: out-of-state, headquarters, Operation Safe Medicine, probation violations, petitions for modification/termination of probation terms, and petitions for reinstatement. It also excludes all cases that were referred solely to the District/City Attorney for criminal action as they are not in VE/P.
245220
115
800
700
600
500
400
300
200
100
0
Internet Prescribing
681645
584554523 494 425
307 245 253
220 155 169146127140 115
38 0 0 0
04/05 05/06 06/07 07/08 08/09 09/10 10/11 11/12
All Investigation Closures - Average
Closed - No Further Action - Average
Referred for Disciplinary Action - Average
231 204134 115
800
700
600
500
400
300
200
100
0
Internet Prescribing
681645
584 520 533
494 425
231 204 196 169144148 134 120 115 38
0 0 0
04/05 05/06 06/07 07/08 08/09 09/10 10/11 11/12
All Investigation Closures - Median
Closed - No Further Action - Median
Referred for Disciplinary Action - Median
ATTACHMENT A
Medical Board of California: Sunset Review Report - SUPPLEMENTAL 2013 Page 34

ATTACHMENT B
Investigation Initiated/Completed to Suspension Order Issued Timeframes Average Calendar Days
The chart below illustrates the average calendar days for all case types and then a breakdown by each individual type. This chart captures the average calendar days from the time the district office initiated the investigation to the time a Suspension Order was issued and the average calendar days from the time the district office completed the investigation to the time a Suspension Order was issued.
This data excludes the following case types: out-of-state, headquarters, Operation Safe Medicine, probation violations, petitions for modification/termination of probation, petitions for reinstatement, and subsequent discipline on probationers. This data includes the following suspension orders: interim suspension orders, Penal Code section 23 restrictions, stipulated agreements to restrictions/suspension, and temporary restraining orders. It does not include out-of-state suspension orders, automatic suspension orders, or orders to cease practice while on probation.
Fiscal Years 04/05 05/06 06/07 07/08 08/09 09/10 10/11 11/12
All Case Types - (Number of cases) 30 28 26 20 25 18 27 31
Investigation Initiated to Suspension Issued - Average 392 307 315 471 358 228 451 297
Investigation Completed to Suspension Issued - Average 168 120 93 215 105 66 191 109
Gross Negligence/Incompetence - (Number of cases) 7 2 2 1 5 1 7 4
Investigation Initiated to Suspension Issued - Average 766 488 193 521 235 378 970 690
Investigation Completed to Suspension Issued - Average 439 163 33 267 170 2 452 222
Inappropriate Prescribing - (Number of cases) 3 4 0 3 4 1 4 3
Investigation Initiated to Suspension Issued - Average 745 769 0 1,147 761 232 499 221
Investigation Completed to Suspension Issued - Average 108 241 0 572 224 2 260 103
Sexual Misconduct - (Number of cases) 11 10 7 7 3 4 6 3
Investigation Initiated to Suspension Issued - Average 258 204 394 397 556 436 40 250
Investigation Completed to Suspension Issued - Average 110 112 145 278 166 161 8 143
Mental/Physical Illness - (Number of cases) 2 3 6 2 3 5 5 6
Investigation Initiated to Suspension Issued - Average 142 309 201 752 221 182 544 214
Investigation Completed to Suspension Issued - Average 52 173 95 60 45 80 170 85
Self-abuse of Drugs/Alcohol - (Number of cases) 6 7 6 5 8 5 4 12
Investigation Initiated to Suspension Issued - Average 164 131 316 150 177 136 73 283
Investigation Completed to Suspension Issued - Average 50 45 76 34 26 20 11 92
Fraud - (Number of cases) 0 0 3 1 1 1 0 0
Investigation Initiated to Suspension Issued - Average 0 0 634 386 686 22 0 0
Investigation Completed to Suspension Issued - Average 0 0 95 81 2 2 0 0
Conviction of Crime - (Number of cases) 1 2 2 1 0 1 1 3
Investigation Initiated to Suspension Issued - Average 57 334 23 47 0 147 150 116
Investigation Completed to Suspension Issued - Average 51 63 9 2 0 40 2 46
Unprofessional Conduct - (Number of cases) 0 0 0 0 1 0 0 0
Investigation Initiated to Suspension Issued - Average 0 0 0 0 303 0 0 0
Investigation Completed to Suspension Issued - Average 0 0 0 0 44 0 0 0
Medical Board of California: Sunset Review Report - SUPPLEMENTAL 2013 Page 35

ATTACHMENT B
Investigation Initiated/Completed to Suspension Order Issued Timeframes Median Calendar Days
The chart below illustrates the median calendar days for all case types and then a breakdown by each individual type. This chart captures the median calendar days from the time the district office initiated the investigation to the time a Suspension Order was issued and the median calendar days from the time the district office completed the investigation to the time a Suspension Order was issued.
This data excludes the following case types: out-of-state, headquarters, Operation Safe Medicine, probation violations, petitions for modification/termination of probation, petitions for reinstatement, and subsequent discipline on probationers. This data includes the following suspension orders: interim suspension orders, Penal Code section 23 restrictions, stipulated agreements to restrictions/suspension, and temporary restraining orders. It does not include out-of-state suspension orders, automatic suspension orders, or orders to cease practice while on probation.
Fiscal Years 04/05 05/06 06/07 07/08 08/09 09/10 10/11 11/12
All Case Types - (Number of cases) 30 28 26 20 25 18 27 31
Investigation Initiated to Suspension Issued- Median 217 239 209 370 294 180 377 180
Investigation Completed to Suspension Issued - Median 53 43 20 48 7 27 39 42
Gross Negligence/Incompetence - (Number of cases) 7 2 2 1 5 1 7 4
Investigation Initiated to Suspension Issued- Median 617 488 193 521 107 378 971 791
Investigation Completed to Suspension Issued - Median 305 163 33 267 2 2 376 83
Inappropriate Prescribing - (Number of cases) 3 4 0 3 4 1 4 3
Investigation Initiated to Suspension Issued- Median 1039 721 0 855 715 232 387 248
Investigation Completed to Suspension Issued - Median 46 83 0 428 192 2 91 82
Sexual Misconduct - (Number of cases) 11 10 7 7 3 4 6 3
Investigation Initiated to Suspension Issued- Median 209 84 209 220 521 327 28 91
Investigation Completed to Suspension Issued - Median 86 33 2 19 2 60 2 4
Mental/Physical Illness - (Number of cases) 2 3 6 2 3 5 5 6
Investigation Initiated to Suspension Issued- Median 142 336 200 752 270 193 542 217
Investigation Completed to Suspension Issued - Median 52 169 106 60 56 113 164 41
Self-abuse of Drugs/Alcohol - (Number of cases) 6 7 6 5 8 5 4 12
Investigation Initiated to Suspension Issued- Median 137 115 387 154 86 121 65 171
Investigation Completed to Suspension Issued - Median 27 4 80 11 6 24 11 32
Fraud - (Number of cases) 0 0 3 1 1 1 0 0
Investigation Initiated to Suspension Issued- Median 0 0 358 386 686 22 0 0
Investigation Completed to Suspension Issued - Median 0 0 2 81 2 2 0 0
Conviction of Crime - (Number of cases) 1 2 2 1 0 1 1 3
Investigation Initiated to Suspension Issued- Median 57 334 23 47 0 147 150 137
Investigation Completed to Suspension Issued - Median 51 63 9 2 0 40 2 13
Unprofessional Conduct - (Number of cases) 0 0 0 0 1 0 0 0
Investigation Initiated to Suspension Issued- Median 0 0 0 0 303 0 0 0
Investigation Completed to Suspension Issued - Median 0 0 0 0 44 0 0 0
Medical Board of California: Sunset Review Report - SUPPLEMENTAL 2013 Page 36

Investigation Initiated/Completed to Suspension Order Issued Timeframes Average/Median Calendar Days
The graphs below illustrate the average (left column) and median (right column) calendar days for all case types and then a breakdown by each individual type. These graphs show two measurements. The top lines represent the average/median calendar days from the time the district office initiated the investigation to the time a Suspension Order was issued. The bottom lines are a subset of the top line and represent the average/median calendar days from the time the district office completed the investigation to the time a Suspension Order was issued.
This data excludes the following case types: out-of-state, headquarters, Operation Safe Medicine, probation violations, petitions for modification/termination of probation, petitions for reinstatement, and subsequent discipline on probationers. This data includes the following suspension orders: interim suspension orders, Penal Code section 23 restrictions, stipulated agreements to restrictions/suspension, and temporary restraining orders. It does not include out-of-state suspension orders, automatic suspension orders, or orders to cease practice while on probation.
All Case Types
500
400
300
200
100
0
392
307 315
471
358
228
451
297
168 120
93
215
105 66
191
109
04/05 05/06 06/07 07/08 08/09 09/10 10/11 11/12
Investigation Initiated to Suspension Issued - Average
Investigation Completed to Suspension Issued- Average
400
350
300
250
200
150
100
50
0
All Case Types
370 377
294
239 217 209
180 180
53 43 48 39 42 20 27
7
04/05 05/06 06/07 07/08 08/09 09/10 10/11 11/12
Investigation Initiated to Suspension Issued - Median
Investigation Completed to Suspension Issued - Median
766
488
193
521
235
378
970
690
439
163 33
267 170
2
452
222
04/05 05/06 06/07 07/08 08/09 09/10 10/11 11/12
Gross Negligence/Incompetence
Investigation Initiated to Suspension Issued - Average
Investigation Completed to Suspension Issued- Average
1,200
1,000
800
600
400
200
0
1200
1000
800
600
400
200
0
Gross Negligence/Incompetence
971
791
617 521488
378 376 305 267
163 193 107 8333 2 2
04/05 05/06 06/07 07/08 08/09 09/10 10/11 11/12
Investigation Initiated to Suspension Issued - Median
Investigation Completed to Suspension Issued - Median
745 769
0
1,147
761
232
499
221 108
241
0
572
224
2
260
103
04/05 05/06 06/07 07/08 08/09 09/10 10/11 11/12
InappropriatePrescribing
Investigation Initiated to Suspension Issued - Average
Investigation Completed to Suspension Issued- Average
1,400
1,200
1,000
800
600
400
200
0
0
1200
1000
800
600
400
200
0
Inappropriate Prescribing
1039
855
721 715
428 387
232 248192
83 91 8246 0 2
04/05 05/06 06/07 07/08 08/09 09/10 10/11 11/12
Investigation Initiated to Suspension Issued - Median
Investigation Completed to Suspension Issued - Median
ATTACHMENT B
Medical Board of California: Sunset Review Report - SUPPLEMENTAL 2013 Page 37

ATTACHMENT B
Investigation Initiated/Completed to Suspension Order Issued Timeframes Average/Median Calendar Days
The graphs below illustrate the average (left column) and median (right column) calendar days for all case types and then a breakdown by each individual type. These graphs show two measurements. The top lines represent the average/median calendar days from the time the district office initiated the investigation to the time a Suspension Order was issued. The bottom lines are a subset of the top line and represent the average/median calendar days from the time the district office completed the investigation to the time a Suspension Order was issued.
This data excludes the following case types: out-of-state, headquarters, Operation Safe Medicine, probation violations, petitions for modification/termination of probation, petitions for reinstatement, and subsequent discipline on probationers. This data includes the following suspension orders: interim suspension orders, Penal Code section 23 restrictions, stipulated agreements to restrictions/suspension, and temporary restraining orders. It does not include out-of-state suspension orders, automatic suspension orders, or orders to cease practice while on probation.
600
500
400
300
200
100
0
258
110
04/05
Sexual Misconduct
556
436 394 397
278 250
204 166 161145 143
112
40 8
05/06 06/07 07/08 08/09 09/10 10/11 11/12
Investigation Initiated to Suspension Issued - Average
Investigation Completed to Suspension Issued- Average
600
500
400
300
200
100
0
209
86
04/05
Sexual Misconduct
521
327
209 220
84 91 60
33 19 282 2 2 4
05/06 06/07 07/08 08/09 09/10 10/11 11/12
Investigation Initiated to Suspension Issued - Median
Investigation Completed to Suspension Issued - Median
800
700
600
500
400
300
200
100
0
142
52
04/05
Mental/Physical Illness
752
544
309 221201 214
173 182 170 95 8560 8045
05/06 06/07 07/08 08/09 09/10 10/11 11/12
Investigation Initiated to Suspension Issued - Average
Investigation Completed to Suspension Issued- Average
800
700
600
500
400
300
200
100
0
142
52
04/05
Mental/Physical Illness
752
542
336 270
200 217193169 164 106 113
60 56 41
05/06 06/07 07/08 08/09 09/10 10/11 11/12
Investigation Initiated to Suspension Issued - Median
Investigation Completed to Suspension Issued - Median
350
300
250
200
150
100
50
0
164
50
04/05
Self-abuse of Drugs/Alcohol
316 283
177 150
131 136
9276 73 45 34 26 20 11
05/06 06/07 07/08 08/09 09/10 10/11 11/12
Investigation Initiated to Suspension Issued - Average
Investigation Completed to Suspension Issued- Average
500
400
300
200
100
0
137
27
04/05
Self-abuse of Drugs/Alcohol
387
171154 115 121
80 86 65 24 32
4 11 6 11
05/06 06/07 07/08 08/09 09/10 10/11 11/12
Investigation Initiated to Suspension Issued - Median
Investigation Completed to Suspension Issued - Median
Medical Board of California: Sunset Review Report - SUPPLEMENTAL 2013 Page 38

ATTACHMENT B
Investigation Initiated/Completed to Suspension Order Issued Timeframes Average/Median Calendar Days
The graphs below illustrate the average (left column) and median (right column) calendar days for all case types and then a breakdown by each individual type. These graphs show two measurements. The top lines represent the average/median calendar days from the time the district office initiated the investigation to the time a Suspension Order was issued. The bottom lines are a subset of the top line and represent the average/median calendar days from the time the district office completed the investigation to the time a Suspension Order was issued.
This data excludes the following case types: out-of-state, headquarters, Operation Safe Medicine, probation violations, petitions for modification/termination of probation, petitions for reinstatement, and subsequent discipline on probationers. This data includes the following suspension orders: interim suspension orders, Penal Code section 23 restrictions, stipulated agreements to restrictions/suspension, and temporary restraining orders. It does not include out-of-state suspension orders, automatic suspension orders, or orders to cease practice while on probation.
0 0 0 0
800
700
600
500
400
300
200
100
0 0 04/05
Fraud
686 634
386
95 81 220 2 2 0 0
05/06 06/07 07/08 08/09 09/10 10/11 11/12
Investigation Initiated to Suspension Issued - Average
Investigation Completed to Suspension Issued- Average
0 0 0 0
800
700
600
500
400
300
200
100
0 0 04/05
Fraud
686
386358
81 220 2 2 2 0 0
05/06 06/07 07/08 08/09 09/10 10/11 11/12
Investigation Initiated to Suspension Issued - Median
Investigation Completed to Suspension Issued - Median
0
400
350
300
250
200
150
100
50
0
5751
04/05
Conviction of Crime
334
147 150 116
63 47 40 46 239 2 0 2
05/06 06/07 07/08 08/09 09/10 10/11 11/12
Investigation Initiated to Suspension Issued - Average
Investigation Completed to Suspension Issued- Average
0
400
350
300
250
200
150
100
50
0
5751
04/05
Conviction of Crime
334
147 150 137
63 47 40239 132 0 2
05/06 06/07 07/08 08/09 09/10 10/11 11/12
Investigation Initiated to Suspension Issued - Median
Investigation Completed to Suspension Issued - Median
0 0 0 0 0 0 0
350
300
250
200
150
100
50
0 0 04/05
Unprofessional Conduct
303
44
0 0 0 0 0 0 05/06 06/07 07/08 08/09 09/10 10/11 11/12
Investigation Initiated to Suspension Issued - Average
Investigation Completed to Suspension Issued- Average
0 0 0 0 0 0 0
350
300
250
200
150
100
50
0 0 04/05
Unprofessional Conduct
303
44
0 0 0 0 0 0 05/06 06/07 07/08 08/09 09/10 10/11 11/12
Investigation Initiated to Suspension Issued - Median
Investigation Completed to Suspension Issued - Median
Medical Board of California: Sunset Review Report - SUPPLEMENTAL 2013 Page 39

Fiscal Years 04/05 05/06 06/07 07/08 08/09 09/10 10/11 11/12
All Case Types - (Number of cases) 164 166 171 173 154 206 198 232
Investigation Initiated to Accusation Filed - Average 551 564 533 566 608 575 580 519
Investigation Completed to Accusation Filed - Average 149 169 166 146 132 124 126 121
Gross Negligence/Incompetence - (Number of cases) 93 97 107 99 84 107 116 108
Investigation Initiated to Accusation Filed - Average 610 621 595 622 721 626 639 555
Investigation Completed to Accusation Filed - Average 153 161 176 152 144 106 114 114
Inappropriate Prescribing - (Number of cases) 17 9 7 14 18 15 12 34
Investigation Initiated to Accusation Filed - Average 644 623 756 659 612 790 647 660
Investigation Completed to Accusation Filed - Average 148 157 273 136 130 167 209 104
Unlicensed Activity - (Number of cases) 2 5 2 5 2 5 2 7
Investigation Initiated to Accusation Filed - Average 619 1,068 413 848 384 430 693 664
Investigation Completed to Accusation Filed - Average 33 498 66 269 152 109 78 350
Sexual Misconduct - (Number of cases) 18 20 11 13 4 18 8 12
Investigation Initiated to Accusation Filed - Average 434 344 437 632 693 768 472 435
Investigation Completed to Accusation Filed - Average 182 93 182 243 228 274 166 81
Mental/Physical Illness - (Number of cases) 9 4 7 7 6 4 8 15
Investigation Initiated to Accusation Filed - Average 356 286 258 453 368 462 538 443
Investigation Completed to Accusation Filed - Average 98 89 64 85 107 106 141 145
Self-abuse of Drugs/Alcohol - (Number of cases) 14 8 17 19 23 21 21 23
Investigation Initiated to Accusation Filed - Average 264 391 385 324 313 344 405 421
Investigation Completed to Accusation Filed - Average 59 126 124 63 76 93 85 140
Fraud - (Number of cases) 1 8 7 7 4 6 8 10
Investigation Initiated to Accusation Filed - Average 1,025 391 552 263 525 488 439 577
Investigation Completed to Accusation Filed - Average 292 208 163 132 170 70 157 178
Conviction of Crime - (Number of cases) 3 8 9 7 7 23 14 16
Investigation Initiated to Accusation Filed - Average 358 370 247 343 302 315 453 244
Investigation Completed to Accusation Filed - Average 234 147 100 98 70 120 140 68
Unprofessional Conduct - (Number of cases) 5 4 4 2 3 6 9 6
Investigation Initiated to Accusation Filed - Average 738 551 544 491 763 710 580 247
Investigation Completed to Accusation Filed - Average 309 123 227 198 157 73 175 74
Internet Prescribing - (Number of cases) 2 3 0 0 3 1 0 1
Investigation Initiated to Accusation Filed - Average 463 1,013 0 0 861 265 0 709
Investigation Completed to Accusation Filed - Average 78 659 0 0 189 97 0 75
ATTACHMENT C
Investigation Initiated/Completed to Accusation Filed – Average Calendar Days The chart below illustrates the average calendar days for all case types and then a breakdown by each individual type. This chart captures the average calendar days from the time the district office initiated the investigation to the time an Accusation was filed and the average calendar days from the time the district office completed the investigation to the time an Accusation was filed.
This data excludes the following case types: out-of-state, headquarters, Operation Safe Medicine, probation violations, petitions for modification/termination of probation, petitions for reinstatement, and subsequent discipline on probationers. This data also excludes cases that had a petition to compel examination granted and those where an offer for a public letter of reprimand was rejected by the respondent.
Medical Board of California: Sunset Review Report - SUPPLEMENTAL 2013 Page 40
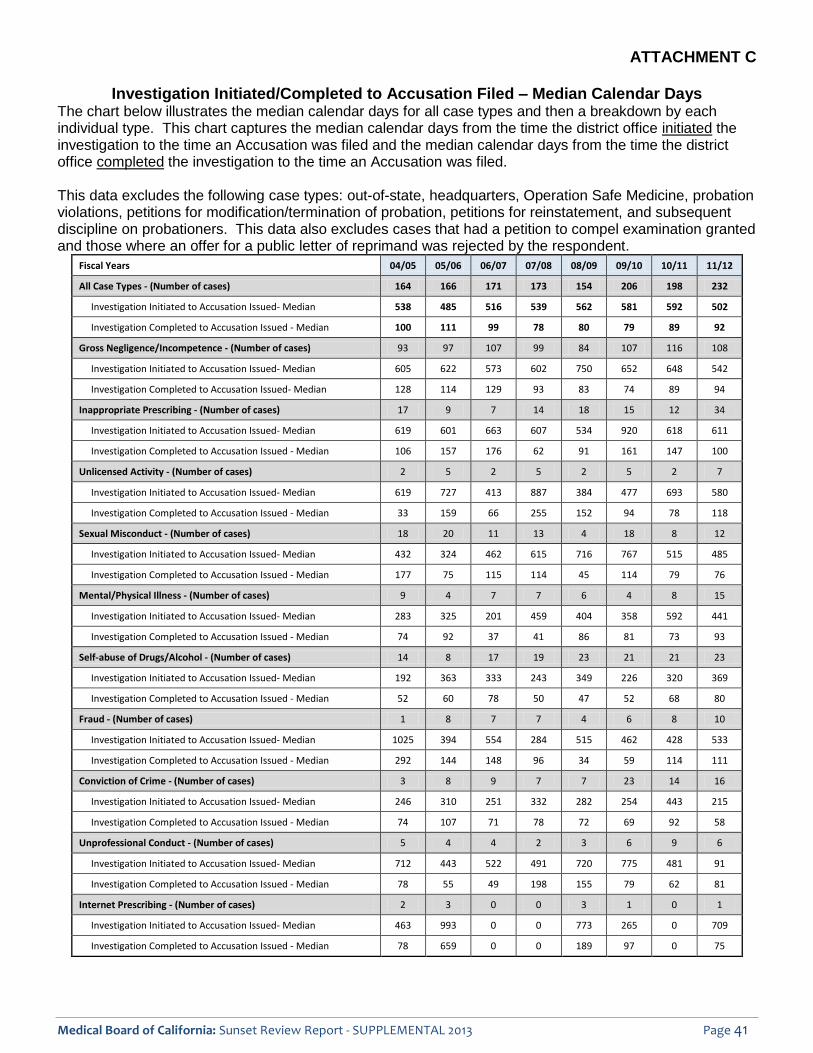
ATTACHMENT C
Investigation Initiated/Completed to Accusation Filed – Median Calendar Days The chart below illustrates the median calendar days for all case types and then a breakdown by each individual type. This chart captures the median calendar days from the time the district office initiated the investigation to the time an Accusation was filed and the median calendar days from the time the district office completed the investigation to the time an Accusation was filed.
This data excludes the following case types: out-of-state, headquarters, Operation Safe Medicine, probation violations, petitions for modification/termination of probation, petitions for reinstatement, and subsequent discipline on probationers. This data also excludes cases that had a petition to compel examination granted and those where an offer for a public letter of reprimand was rejected by the respondent.
Fiscal Years 04/05 05/06 06/07 07/08 08/09 09/10 10/11 11/12
All Case Types - (Number of cases) 164 166 171 173 154 206 198 232
Investigation Initiated to Accusation Issued- Median 538 485 516 539 562 581 592 502
Investigation Completed to Accusation Issued - Median 100 111 99 78 80 79 89 92
Gross Negligence/Incompetence - (Number of cases) 93 97 107 99 84 107 116 108
Investigation Initiated to Accusation Issued- Median 605 622 573 602 750 652 648 542
Investigation Completed to Accusation Issued- Median 128 114 129 93 83 74 89 94
Inappropriate Prescribing - (Number of cases) 17 9 7 14 18 15 12 34
Investigation Initiated to Accusation Issued- Median 619 601 663 607 534 920 618 611
Investigation Completed to Accusation Issued - Median 106 157 176 62 91 161 147 100
Unlicensed Activity - (Number of cases) 2 5 2 5 2 5 2 7
Investigation Initiated to Accusation Issued- Median 619 727 413 887 384 477 693 580
Investigation Completed to Accusation Issued - Median 33 159 66 255 152 94 78 118
Sexual Misconduct - (Number of cases) 18 20 11 13 4 18 8 12
Investigation Initiated to Accusation Issued- Median 432 324 462 615 716 767 515 485
Investigation Completed to Accusation Issued - Median 177 75 115 114 45 114 79 76
Mental/Physical Illness - (Number of cases) 9 4 7 7 6 4 8 15
Investigation Initiated to Accusation Issued- Median 283 325 201 459 404 358 592 441
Investigation Completed to Accusation Issued - Median 74 92 37 41 86 81 73 93
Self-abuse of Drugs/Alcohol - (Number of cases) 14 8 17 19 23 21 21 23
Investigation Initiated to Accusation Issued- Median 192 363 333 243 349 226 320 369
Investigation Completed to Accusation Issued - Median 52 60 78 50 47 52 68 80
Fraud - (Number of cases) 1 8 7 7 4 6 8 10
Investigation Initiated to Accusation Issued- Median 1025 394 554 284 515 462 428 533
Investigation Completed to Accusation Issued - Median 292 144 148 96 34 59 114 111
Conviction of Crime - (Number of cases) 3 8 9 7 7 23 14 16
Investigation Initiated to Accusation Issued- Median 246 310 251 332 282 254 443 215
Investigation Completed to Accusation Issued - Median 74 107 71 78 72 69 92 58
Unprofessional Conduct - (Number of cases) 5 4 4 2 3 6 9 6
Investigation Initiated to Accusation Issued- Median 712 443 522 491 720 775 481 91
Investigation Completed to Accusation Issued - Median 78 55 49 198 155 79 62 81
Internet Prescribing - (Number of cases) 2 3 0 0 3 1 0 1
Investigation Initiated to Accusation Issued- Median 463 993 0 0 773 265 0 709
Investigation Completed to Accusation Issued - Median 78 659 0 0 189 97 0 75
Medical Board of California: Sunset Review Report - SUPPLEMENTAL 2013 Page 41

ATTACHMENT C
Investigation Initiated/Completed to Accusation Filed – Average/Median Calendar Days The graphs below illustrate the average (left column) and median (right column) calendar days for all case types and then a breakdown by each individual t ype. These graphs show two measurements. The top lines represent the average/median calendar days from the time the district office initiated the investigation to the time an Accusation was filed. The bottom lines are a subset of the top lines and represent the average/median calendar days from the time the district office completed the investigation to the time an Accusation was filed. This data excludes the following case types: out-of-state, headquarters, Operation Safe Medicine, probation violations, petitions for modification/termination of probation, petitions for reinstatement, and subsequent discipline on probationers. This data also excludes cases that had a petition to compel examination granted and those where an offer for a public letter of reprimand was rejected by the respondent.
551 564 533 566
608 575 580
519
149 169 166 146 132 124 126 121
0
100
200
300
400
500
600
700
04/05 05/06 06/07 07/08 08/09 09/10 10/11 11/12
All Case Types
Investigation Initiated to Accusation Filed- Average
Investigation Completed to Accusation Filed Average
700
600
500
400
300
200
100
0
538
100
04/05
All Case Types
581 592562539516485 502
111 99 78 80 79 89 92
05/06 06/07 07/08 08/09 09/10 10/11 11/12
Investigation Initiated to Accusation Filed - Median
Investigation Completed to Accusation Filed - Median
610 621 595 622
721
626 639 555
153 161 176 152 144 106 114 114
0
100
200
300
400
500
600
700
800
04/05 05/06 06/07 07/08 08/09 09/10 10/11 11/12
Gross Negligence/Incompetence
Investigation Initiated to Accusation Filed- Average
Investigation Completed to Accusation Filed Average
800
700
600
500
400
300
200
100
0
605
128
04/05
Gross Negligence/Incompetence
750
652 648622 602573 542
114 129 93 83 9474 89
05/06 06/07 07/08 08/09 09/10 10/11 11/12
Investigation Initiated to Accusation Filed - Median
Investigation Completed to Accusation Filed - Median
644 623
756 659
612
790
647 660
148 157
273
136 130 167 209 104
0
200
400
600
800
1,000
04/05 05/06 06/07 07/08 08/09 09/10 10/11 11/12
Inappropriate Prescribing
Investigation Initiated to Accusation Filed- Average
Investigation Completed to Accusation Filed Average
1000
800
600
400
200
0
619
106
04/05
Inappropriate Prescribing
920
663 601 607 618 611
534
157 176 161 147 91 10062
05/06 06/07 07/08 08/09 09/10 10/11 11/12
Investigation Initiated to Accusation Filed - Median
Investigation Completed to Accusation Filed - Median
Medical Board of California: Sunset Review Report - SUPPLEMENTAL 2013 Page 42

ATTACHMENT C
Investigation Initiated/Completed to Accusation Filed – Average/Median Calendar Days The graphs below illustrate the average (left column) and median (right column) calendar days for all case types and then a breakdown by each individual t ype. These graphs show two measurements. The top lines represent the average/median calendar days from the time the district office initiated the investigation to the time an Accusation was filed. The bottom lines are a subset of the top lines and represent the average/median calendar days from the time the district office completed the investigation to the time an Accusation was filed. This data excludes the following case types: out-of-state, headquarters, Operation Safe Medicine, probation violations, petitions for modification/termination of pr obation, petitions for reinstatement, and subsequent discipline on probationers. This data also excludes cases that had a petition to compel examination granted and those where an offer for a public letter of reprimand was rejected by the respondent.
Unlicensed Activity
1,200
1,000
800
600
400
200
0
4
0
12
1
000
800
600
400
200
0
619
33
04/05
Unlicensed Activity
887
727 693
580 477
413 384
255 159 152
94 118 66 78
05/06 06/07 07/08 08/09 09/10 10/11 11/12
Investigation Initiated to Accusation Filed - Median
Investigation Completed to Accusation Filed - Median
1000
800
600
400
200
0
432
177
04/05
Sexual Misconduct
767 716
615 515
462 485
324
115 114 11475 79 7645
05/06 06/07 07/08 08/09 09/10 10/11 11/12
Investigation Initiated to Accusation Filed - Median
Investigation Completed to Accusation Filed - Median
700
600
500
400
300
200
100
0
283
74
04/05
Mental/Physical Illness
592
459 441 404
358325
201
92 86 81 9373 37 41
05/06 06/07 07/08 08/09 09/10 10/11 11/12
Investigation Initiated to Accusation Filed - Median
Investigation Completed to Accusation Filed - Median
356
286 258
453
368
462
538
443
98 89 64 85 107 106 141 145
04/05 05/06 06/07 07/08 08/09 09/10 10/11 11/12
Mental/Physical Illness
Investigation Initiated to Accusation Filed- Average
Investigation Completed to Accusation Filed Average
600
500
400
300
200
100
0
434 344
437
632 693
768
472 435
182 93
182 243 228
274 166
81
04/05 05/06 06/07 07/08 08/09 09/10 10/11 11/12
Sexual Misconduct
Investigation Initiated to Accusation Filed- Average
Investigation Completed to Accusation Filed Average
1,000
800
600
400
200
0
619
1,068
413
848
384 430
693 66
33
498
66
269 152 109 78
35
04/05 05/06 06/07 07/08 08/09 09/10 10/11 11/
Investigation Initiated to Accusation Filed- Average
Investigation Completed to Accusation Filed Average
Medical Board of California: Sunset Review Report - SUPPLEMENTAL 2013 Page 43

ATTACHMENT C
Investigation Initiated/Completed to Accusation Filed – Average/Median Calendar Days The graphs below illustrate the average (left column) and median (right column) calendar days for all case types and then a breakdown by each individual t ype. These graphs show two measurements. The top lines represent the average/median calendar days from the time the district office initiated the investigation to the time an Accusation was filed. The bottom lines are a subset of the top lines and represent the average/median calendar days from the time the district office completed the investigation to the time an Accusation was filed.
This data excludes the following case types: out-of-state, headquarters, Operation Safe Medicine, probation violations, petitions for modification/termination of probation, petitions for reinstatement, and subsequent discipline on probationers. This data also excludes cases that had a petition to compel examination granted and those where an offer for a public letter of reprimand was rejected by the respondent.
Self-abuse of Drugs/Alcohol
500
400
300
200
100
0
264
391 385
324 313 344
405 421
59
126 124
63 76 93 85 140
04/05 05/06 06/07 07/08 08/09 09/10 10/11 11/12
Investigation Initiated to Accusation Filed- Average
Investigation Completed to Accusation Filed Average
400
350
300
250
200
150
100
50
0
192
52
04/05
Self-abuse of Drugs/Alcohol
363 369349333 320
243 226
78 8060 68
50 47 52
05/06 06/07 07/08 08/09 09/10 10/11 11/12
Investigation Initiated to Accusation Filed - Median
Investigation Completed to Accusation Filed - Median
1,025
391
552
263
525 488 439
57
292 208 163 170 157 17132
70
04/05 05/06 06/07 07/08 08/09 09/10 10/11 11/
Fraud
Investigation Initiated to Accusation Filed- Average
Investigation Completed to Accusation Filed Average
1,200
1,000
800
600
400
200
0
7
8
12
1200
1000
800
600
400
200
0
1025
292
04/05
Fraud
554 515 533 462 428394
284
144 148 96 114 111 34 59
05/06 06/07 07/08 08/09 09/10 10/11 11/12
Investigation Initiated to Accusation Filed - Median
Investigation Completed to Accusation Filed - Median
500
400
300
200
100
0
246
74
04/05
Conviction of Crime
443
332310 282
251 254 215
107 9271 78 72 69 58
05/06 06/07 07/08 08/09 09/10 10/11 11/12
Investigation Initiated to Accusation Filed - Median
Investigation Completed to Accusation Filed - Median
358 370
247
343 302 315
453
244234
147 100 98
70 120 140
68
04/05 05/06 06/07 07/08 08/09 09/10 10/11 11/12
Conviction of Crime
Investigation Initiated to Accusation Filed- Average
Investigation Completed to Accusation Filed Average
500
400
300
200
100
0
Medical Board of California: Sunset Review Report - SUPPLEMENTAL 2013 Page 44
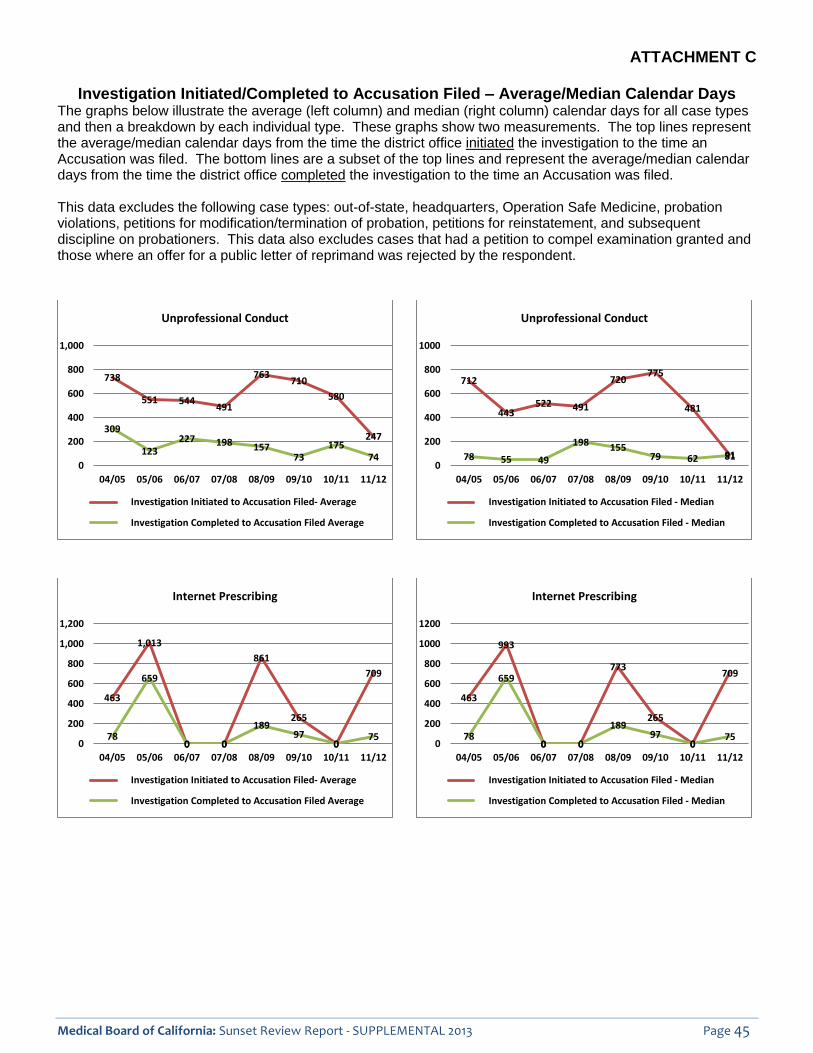
Investigation Initiated/Completed to Accusation Filed – Average/Median Calendar Days The graphs below illustrate the average (left column) and median (right column) calendar days for all case types and then a breakdown by each individual t ype. These graphs show two measurements. The top lines represent the average/median calendar days from the time the district office initiated the investigation to the time an Accusation was filed. The bottom lines are a subset of the top lines and represent the average/median calendar days from the time the district office completed the investigation to the time an Accusation was filed. This data excludes the following case types: out-of-state, headquarters, Operation Safe Medicine, probation violations, petitions for modification/termination of probation, petitions for reinstatement, and subsequent discipline on probationers. This data also excludes cases that had a petition to compel examination granted and those where an offer for a public letter of reprimand was rejected by the respondent.
Unprofessional Conduct
1,000
800
600
400
200
0
738
551 544 491
763 710
580
247 309
123 227 198 157
73 175
74
04/05 05/06 06/07 07/08 08/09 09/10 10/11 11/12
Investigation Initiated to Accusation Filed- Average
Investigation Completed to Accusation Filed Average
Unprofessional Conduct
1000
800
600
400
200
0
712
443 522 491
720 775
481
9178 7955 49
198 155 62 81
04/05 05/06 06/07 07/08 08/09 09/10 10/11 11/12
Investigation Initiated to Accusation Filed - Median
Investigation Completed to Accusation Filed - Median
Internet Prescribing
1,200
1,000
800
600
400
200
0
463
1,013
0 0
861
265
0
709
78
659
0 0
189 97
0 75
04/05 05/06 06/07 07/08 08/09 09/10 10/11 11/12
Investigation Initiated to Accusation Filed- Average
Investigation Completed to Accusation Filed Average
Internet Prescribing
04/05 05/06 06/07 07/08 08/09 09/10 10/11 11/12
Investigation Initiated to Accusation Filed - Median
Investigation Completed to Accusation Filed - Median
463
993
0 0
773
265
0
709
78
659
0 0
189 97
0 75
0
200
400
600
800
1000
1200
ATTACHMENT C
Medical Board of California: Sunset Review Report - SUPPLEMENTAL 2013 Page 45

ATTACHMENT D
Investigation Initiated/Completed to Stipulated Decision Received Average Calendar Days
The chart below illustrates the average calendar days for all case types and then a breakdown by each individual type. The chart captures the average calendar days from the time the district office initiated the investigation to the time a Stipulated Decision was received and the average calendar days from the time the district office completed the investigation to the time a Stipulated Decision was received.
This data excludes the following case types: out-of-state, headquarters, Operation Safe Medicine, probation violations, petitions for modification/termination of probation terms, petitions for reinstatement, and subsequent discipline on probationers.
Fiscal Years 04/05 05/06 06/07 07/08 08/09 09/10 10/11 11/12
All Case Types - (Number of cases) 156 141 143 145 118 135 120 160
Investigation Initiated to Stipulation Received- Average 922 1,039 923 940 818 916 912 914
Investigation Completed to Stipulation Received- Average 528 636 542 518 410 431 477 459
Gross Negligence/Incompetence - (Number of cases) 90 88 82 86 69 76 57 90
Investigation Initiated to Stipulation Received- Average 979 1,083 1,032 997 965 1,012 1,025 974
Investigation Completed to Stipulation Received- Average 559 665 582 536 495 447 499 452
Inappropriate Prescribing - (Number of cases) 18 16 7 10 9 14 10 14
Investigation Initiated to Stipulation Received- Average 913 1,193 1,163 945 895 1,002 1,312 1,097
Investigation Completed to Stipulation Received- Average 458 704 590 491 455 419 726 529
Unlicensed Activity - (Number of cases) 6 2 2 7 3 1 3 4
Investigation Initiated to Stipulation Received- Average 1,233 1,119 964 1,386 677 843 803 1,285
Investigation Completed to Stipulation Received- Average 1,157 532 754 856 175 408 472 855
Sexual Misconduct - (Number of cases) 9 12 9 7 4 9 8 6
Investigation Initiated to Stipulation Received- Average 812 715 620 1,057 736 1,286 1,050 917
Investigation Completed to Stipulation Received- Average 374 438 387 665 263 806 637 539
Mental/Physical Illness - (Number of cases) 8 2 11 9 5 5 4 12
Investigation Initiated to Stipulation Received- Average 792 599 449 627 358 304 867 632
Investigation Completed to Stipulation Received- Average 267 533 275 306 178 110 531 360
Self-abuse of Drugs/Alcohol - (Number of cases) 10 8 10 11 17 10 17 16
Investigation Initiated to Stipulation Received- Average 414 588 495 522 503 462 536 743
Investigation Completed to Stipulation Received- Average 224 357 263 310 217 290 288 456
Fraud - (Number of cases) 2 2 9 8 2 4 2 6
Investigation Initiated to Stipulation Received- Average 1,052 1,808 1,048 809 526 583 787 657
Investigation Completed to Stipulation Received- Average 762 1,297 649 410 330 263 261 339
Conviction of Crime - (Number of cases) 5 2 8 4 7 10 14 5
Investigation Initiated to Stipulation Received- Average 850 1,437 534 810 584 594 619 711
Investigation Completed to Stipulation Received- Average 667 1,028 439 536 354 359 380 361
Unprofessional Conduct - (Number of cases) 6 7 1 1 2 5 3 7
Investigation Initiated to Stipulation Received- Average 976 990 680 184 723 938 1,058 789
Investigation Completed to Stipulation Received- Average 537 544 214 184 430 403 450 474
Internet Prescribing - (Number of cases) 2 2 3 2 0 1 1 0
Investigation Initiated to Stipulation Received- Average 970 969 2,046 1,319 0 1,141 588 0
Investigation Completed to Stipulation Received- Average 520 610 1,613 830 0 622 420 0
Medical Board of California: Sunset Review Report - SUPPLEMENTAL 2013 Page 46

ATTACHMENT D
Investigation Initiated/Completed to Stipulated Decision Received Median Calendar Days
The chart below illustrates the median calendar days for all case types and then a breakdown by each individual type. The chart captures the median calendar days from the time the district office initiated the investigation to the time a Stipulated Decision was received and the median calendar days from the time the district office completed the investigation to the time a Stipulated Decision was received.
This data excludes the following case types: out-of-state, headquarters, Operation Safe Medicine, probation violations, petitions for modification/termination of probation terms, petitions for reinstatement, and subsequent discipline on probationers.
Fiscal Years 04/05 05/06 06/07 07/08 08/09 09/10 10/11 11/12
All Case Types - (Number of cases) 156 141 143 145 118 135 120 160
Investigation Initiated to Stipulation Received - Median 755 999 822 888 815 877 888 917
Investigation Completed to Stipulation Received- Median 478 551 458 414 342 364 420 414
Gross Negligence/Incompetence - (Number of cases) 90 88 82 86 69 76 57 90
Investigation Initiated to Stipulation Received - Median 981 1,036 1,010 939 918 1,007 1,017 972
Investigation Completed to Stipulation Received- Median 531 612 534 429 421 388 455 436
Inappropriate Prescribing - (Number of cases) 18 16 7 10 9 14 10 14
Investigation Initiated to Stipulation Received - Median 903 1,141 821 989 883 998 1,107 1,142
Investigation Completed to Stipulation Received- Median 419 655 502 325 273 341 711 594
Unlicensed Activity - (Number of cases) 6 2 2 7 3 1 3 4
Investigation Initiated to Stipulation Received - Median 1,262 1,119 964 1,152 989 843 704 1,282
Investigation Completed to Stipulation Received- Median 1,197 532 754 678 171 408 579 1,026
Sexual Misconduct - (Number of cases) 9 12 9 7 4 9 8 6
Investigation Initiated to Stipulation Received - Median 828 662 629 1053 601 1156 1139 935
Investigation Completed to Stipulation Received- Median 358 309 338 666 202 583 365 514
Mental/Physical Illness - (Number of cases) 8 2 11 9 5 5 4 12
Investigation Initiated to Stipulation Received - Median 720 599 454 602 338 310 860 536
Investigation Completed to Stipulation Received- Median 164 533 245 203 99 128 534 260
Self-abuse of Drugs/Alcohol - (Number of cases) 10 8 10 11 17 10 17 16
Investigation Initiated to Stipulation Received - Median 363 442 483 496 478 419 430 702
Investigation Completed to Stipulation Received- Median 149 299 216 281 204 264 222 442
Fraud - (Number of cases) 2 2 9 8 2 4 2 6
Investigation Initiated to Stipulation Received - Median 1,052 1,808 707 808 526 572 787 577
Investigation Completed to Stipulation Received- Median 762 1,297 391 432 330 479 261 344
Conviction of Crime - (Number of cases) 5 2 8 4 7 10 14 5
Investigation Initiated to Stipulation Received - Median 832 1,437 457 895 527 597 590 574
Investigation Completed to Stipulation Received- Median 528 1,028 376 433 373 341 287 269
Unprofessional Conduct - (Number of cases) 6 7 1 1 2 5 3 7
Investigation Initiated to Stipulation Received - Median 939 1,083 680 184 723 1,040 1,092 667
Investigation Completed to Stipulation Received- Median 587 485 214 184 430 365 318 407
Internet Prescribing - (Number of cases) 2 2 3 2 0 1 1 0
Investigation Initiated to Stipulation Received - Median 970 969 1447 1319 0 1141 588 0
Investigation Completed to Stipulation Received- Median 520 610 1158 830 0 622 420 0
Medical Board of California: Sunset Review Report - SUPPLEMENTAL 2013 Page 47

ATTACHMENT D
Investigation Initiated/Completed to Stipulated Decision Received Average/Median Calendar Days
The graphs below illustrate the average (left column) and median (right column) calendar days for all case types and then a breakdown by each individual type. These graphs show two measurements. The top lines represent the average/median calendar days from the time the district office initiated the investigation to the time a Stipulated Decision was received. The bottom lines are a subset of the top lines and represent the average/median calendar days from the time the district office completed the investigation to the time a Stipulated Decision was received.
This data excludes the following case types: out-of-state, headquarters, Operation Safe Medicine, probation violations, petitions for modification/termination of probation terms, petitions for reinstatement, and subsequent discipline on probationers.
1,200
1,000
800
600
400
200
0
All Case Types
1,039 922 923 940 916 912 914
818
636 528 542 518 477 459410 431
04/05 05/06 06/07 07/08 08/09 09/10 10/11 11/12
Investigation Initiated to Stipulation Received - Average
Investigation Completed to Stipulation Received - Average
1,200
1,000
800
600
400
200
0
All Case Types
999 888 917877 888
822 815755
551 478 458 414 420 414
342 364
04/05 05/06 06/07 07/08 08/09 09/10 10/11 11/12
Investigation Initiated to Stipulation Received - Median
Investigation Completed to Stipulation Received- Median
1,200
1,000
800
600
400
200
0
Gross Negligence/Incompetence
1,083 1,032 1,012 1,025 979 997 965 974
665 559 582 536 495 499447 452
04/05 05/06 06/07 07/08 08/09 09/10 10/11 11/12
Investigation Initiated to Stipulation Received - Average
Investigation Completed to Stipulation Received - Average
1200
1000
800
600
400
200
0
Gross Negligence/Incompetence
1,036 1,017 981 1,010 1,007 972939 918
612 531 534
429 455421 436388
04/05 05/06 06/07 07/08 08/09 09/10 10/11 11/12
Investigation Initiated to Stipulation Received - Median
Investigation Completed to Stipulation Received- Median
1,400
1,200
1,000
800
600
400
200
0
Inappropriate Prescribing
1,312 1,193 1,163
1,097 1,002
913 945 895
704 726 590 529
458 491 455 419
04/05 05/06 06/07 07/08 08/09 09/10 10/11 11/12
Investigation Initiated to Stipulation Received - Average
Investigation Completed to Stipulation Received - Average
1200
1000
800
600
400
200
0
Inappropriate Prescribing
1,141 1,142 1,107 989 998
903 883 821
711655
594 502
419 325 341
273
04/05 05/06 06/07 07/08 08/09 09/10 10/11 11/12
Investigation Initiated to Stipulation Received - Median
Investigation Completed to Stipulation Received- Median
Medical Board of California: Sunset Review Report - SUPPLEMENTAL 2013 Page 48

ATTACHMENT D
Investigation Initiated/Completed to Stipulated Decision Received Average/Median Calendar Days
The graphs below illustrate the average (left column) and median (right column) calendar days for all case types and then a breakdown by each individual type. These graphs show two measurements. The top lines represent the average/median calendar days from the time the district office initiated the investigation to the time a Stipulated Decision was received. The bottom lines are a subset of the top lines and represent the average/median calendar days from the time the district office completed the investigation to the time a Stipulated Decision was received.
This data excludes the following case types: out-of-state, headquarters, Operation Safe Medicine, probation violations, petitions for modification/termination of probation terms, petitions for reinstatement, and subsequent discipline on probationers.
1,600
1,400
1,200
1,000
800
600
400
200
0
Unlicensed Activity
1,386 1,285 1,233
1,157 1,119 964
856 843 855803754 677
532 472408
175
04/05 05/06 06/07 07/08 08/09 09/10 10/11 11/12
Investigation Initiated to Stipulation Received - Average
Investigation Completed to Stipulation Received - Average
400
200
000
800
600
400
200
0
Unlicensed Activity
1,262 1,282 1,197
1,119 1,152 1,026 964 989
843 754
678 704 579532
408
171
04/05 05/06 06/07 07/08 08/09 09/10 10/11 11/12
Investigation Initiated to Stipulation Received - Median
Investigation Completed to Stipulation Received- Median
1,400
1,200
1,000
800
600
400
200
0
Sexual Misconduct
1,286
1,057 1,050 917
812 806 715 736
665620 637 539
438374 387
263
04/05 05/06 06/07 07/08 08/09 09/10 10/11 11/12
Investigation Initiated to Stipulation Received - Average
Investigation Completed to Stipulation Received - Average
1
1
1
400
200
000
800
600
400
200
0
Sexual Misconduct
1156 1139 1053
935 828
662 666629 601 583 514
358 365309 338 202
04/05 05/06 06/07 07/08 08/09 09/10 10/11 11/12
Investigation Initiated to Stipulation Received - Median
Investigation Completed to Stipulation Received- Median
1,
1,
1,
1,000
800
600
400
200
0
Mental/Physical Illness
867 792
627 632599 533 531
449 358 360
306 304267 275 178
110
04/05 05/06 06/07 07/08 08/09 09/10 10/11 11/12
Investigation Initiated to Stipulation Received - Average
Investigation Completed to Stipulation Received - Average
1000
800
600
400
200
0
Mental/Physical Illness
860
720
599 602 533 534 536
454
338 310 245 260
203164 12899
04/05 05/06 06/07 07/08 08/09 09/10 10/11 11/12
Investigation Initiated to Stipulation Received - Median
Investigation Completed to Stipulation Received- Median
Medical Board of California: Sunset Review Report - SUPPLEMENTAL 2013 Page 49

ATTACHMENT D
Investigation Initiated/Completed to Stipulated Decision Received Average/Median Calendar Days
The graphs below illustrate the average (left column) and median (right column) calendar days for all case types and then a breakdown by each individual type. These graphs show two measurements. The top lines represent the average/median calendar days from the time the district office initiated the investigation to the time a Stipulated Decision was received. The bottom lines are a subset of the top lines and represent the average/median calendar days from the time the district office completed the investigation to the time a Stipulated Decision was received.
This data excludes the following case types: out-of-state, headquarters, Operation Safe Medicine, probation violations, petitions for modification/termination of probation terms, petitions for reinstatement, and subsequent discipline on probationers.
800
700
600
500
400
300
200
100
0
Self-abuse of Drugs/Alcohol
743
588 522 536
495 503 462 456
414 357
310 290 288263224 217
04/05 05/06 06/07 07/08 08/09 09/10 10/11 11/12
Investigation Initiated to Stipulation Received - Average
Investigation Completed to Stipulation Received - Average
800
700
600
500
400
300
200
100
0
Self-abuse of Drugs/Alcohol
702
483 496 478442 442419 430
363 299 281 264
216 204 222 149
04/05 05/06 06/07 07/08 08/09 09/10 10/11 11/12
Investigation Initiated to Stipulation Received - Median
Investigation Completed to Stipulation Received- Median
2,000
1,500
1,000
500
0
Fraud
1,808
1,297
1,052 1,048
762 809 787 649 657583526
410 330 339263 261
04/05 05/06 06/07 07/08 08/09 09/10 10/11 11/12
Investigation Initiated to Stipulation Received - Average
Investigation Completed to Stipulation Received - Average
2,000
1,500
1,000
500
0
Fraud
1,808
1,297
1,052
762 808 787707 577526 572
479391 432 330 344261
04/05 05/06 06/07 07/08 08/09 09/10 10/11 11/12
Investigation Initiated to Stipulation Received - Median
Investigation Completed to Stipulation Received- Median
1,600
1,400
1,200
1,000
800
600
400
200
0
Conviction of Crime
1,437
1,028 850 810
711667 584 594 619
534 536 439
354 359 380 361
04/05 05/06 06/07 07/08 08/09 09/10 10/11 11/12
Investigation Initiated to Stipulation Received - Average
Investigation Completed to Stipulation Received - Average
1600
1400
1200
1000
800
600
400
200
0
Conviction of Crime
1,437
1,028 895832
597 590 574528 527457 433376 373 341 287 269
04/05 05/06 06/07 07/08 08/09 09/10 10/11 11/12
Investigation Initiated to Stipulation Received - Median
Investigation Completed to Stipulation Received- Median
Medical Board of California: Sunset Review Report - SUPPLEMENTAL 2013 Page 50
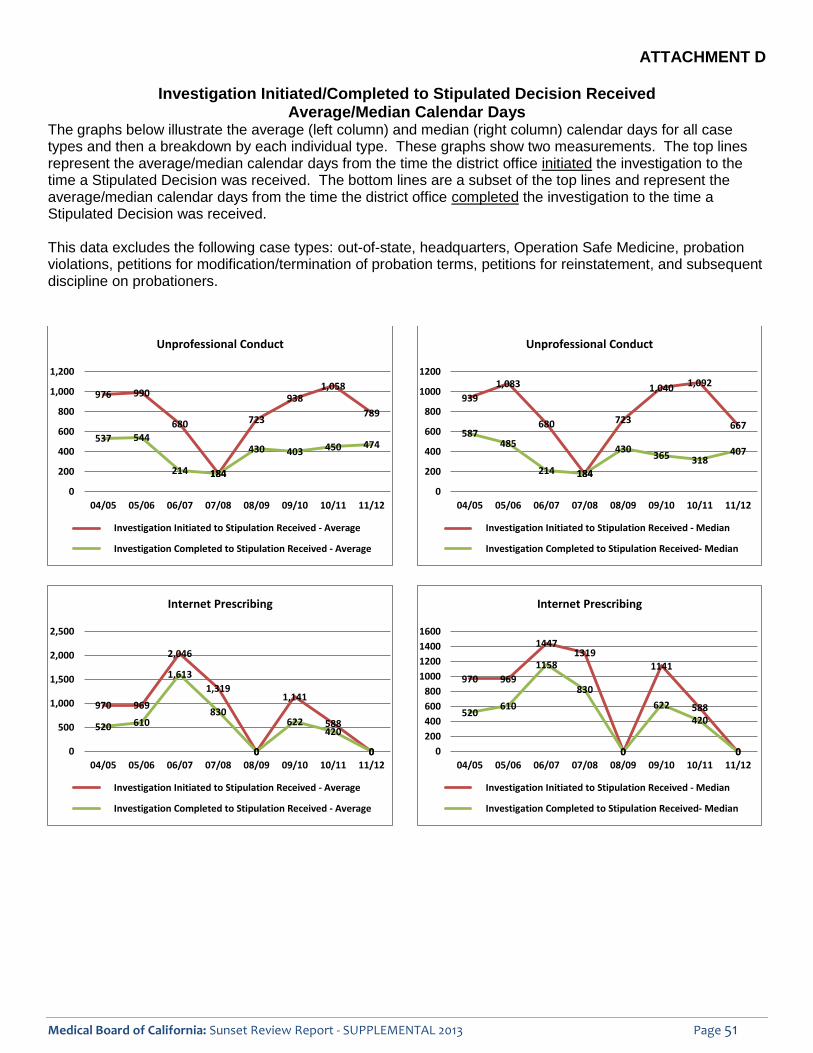
ATTACHMENT D
Investigation Initiated/Completed to Stipulated Decision Received Average/Median Calendar Days
The graphs below illustrate the average (left column) and median (right column) calendar days for all case types and then a breakdown by each individual type. These graphs show two measurements. The top lines represent the average/median calendar days from the time the district office initiated the investigation to the time a Stipulated Decision was received. The bottom lines are a subset of the top lines and represent the average/median calendar days from the time the district office completed the investigation to the time a Stipulated Decision was received.
This data excludes the following case types: out-of-state, headquarters, Operation Safe Medicine, probation violations, petitions for modification/termination of probation terms, petitions for reinstatement, and subsequent discipline on probationers.
1,200
1,000
800
600
400
200
0
Unprofessional Conduct
976 990
680
184
723
938 1,058
789
537 544
214 184
430 403 450 474
04/05 05/06 06/07 07/08 08/09 09/10 10/11 11/12
Investigation Initiated to Stipulation Received - Average
Investigation Completed to Stipulation Received - Average
Unprofessional Conduct
1200
1000
800
600
400
200
0
939
1,083
680
184
1,092
723
1,040
667 587
485
214 184
430 365 318
407
04/05 05/06 06/07 07/08 08/09 09/10 10/11 11/12
Investigation Initiated to Stipulation Received - Median
Investigation Completed to Stipulation Received- Median
Internet Prescribing
970 969
1447 1319
0
1141
588
0
520 610
1158
830
0
622
420
00
200
400
600
800
1000
1200
1400
1600
04/05 05/06 06/07 07/08 08/09 09/10 10/11 11/12
Investigation Initiated to Stipulation Received - Median
Investigation Completed to Stipulation Received- Median
Internet Prescribing
2,500
2,000 2,046
1,613 1,500 1,319
1,141 1,000 970 969
830 610 622 588 500 520 420
0 00 00 04/05 05/06 06/07 07/08 08/09 09/10 10/11 11/12
Investigation Initiated to Stipulation Received - Average
Investigation Completed to Stipulation Received - Average
Medical Board of California: Sunset Review Report - SUPPLEMENTAL 2013 Page 51

ATTACHMENT E
Investigation Initiated/Completed to Submittal of the Matter to an Administrative Law Judge (ALJ) or Proposed Decision Received – Average Calendar Days
The chart below illustrates the average calendar days for all case types and then a breakdown by each individual type. This chart captures the average calendar days from the time the district office initiated the investigation to the time a matter was submitted to an ALJ or a proposed decision was received and the average calendar days from the time the district office completed the investigation to the time a matter was submitted to an ALJ or a proposed decision was received. Note: the date a proposed decision was received was only used in cases where the Board could not identify when the matter was submitted to the ALJ.
This data excludes the following case types: out-of-state, headquarters, Operation Safe Medicine, probation violations, petitions for modification/termination of probation terms, petitions for reinstatement, and subsequent discipline on probationers.
Fiscal Years 04/05 05/06 06/07 07/08 08/09 09/10 10/11 11/12
All Case Types - (Number of cases) 42 30 37 39 33 27 37 38
Investigation Initiated to Matter Submitted to ALJ or Proposed Decision Received - Average 1,115 1,161 926 1,161 1,102 850 973 1,038
Investigation Completed to Matter Submitted to ALJ or Proposed Decision Received - Average 713 747 604 751 700 437 513 565
Gross Negligence/Incompetence - (Number of cases) 23 18 17 23 20 13 16 19
Investigation Initiated to Matter Submitted to ALJ or Proposed Decision Received - Average 1,233 1,198 1,064 1,212 1,224 1,046 1,095 1,213
Investigation Completed to Matter Submitted to ALJ or Proposed Decision Received - Average 722 727 640 739 762 443 529 604
Inappropriate Prescribing - (Number of cases) 3 1 2 2 2 0 2 3
Investigation Initiated to Matter Submitted to ALJ or Proposed Decision Received - Average 1,360 1,786 774 1,477 680 0 1,106 1,262
Investigation Completed to Matter Submitted to ALJ or Proposed Decision Received - Average 833 1,362 522 965 452 0 673 964
Unlicensed Activity - (Number of cases) 0 0 1 1 0 0 2 0
Investigation Initiated to Matter Submitted to ALJ or Proposed Decision Received - Average 0 0 1,005 1,297 0 0 637 0
Investigation Completed to Matter Submitted to ALJ or Proposed Decision Received - Average 0 0 556 710 0 0 401 0
Sexual Misconduct - (Number of cases) 5 3 4 5 3 5 5 0
Investigation Initiated to Matter Submitted to ALJ or Proposed Decision Received - Average 934 725 747 1,017 1,138 855 1,370 0
Investigation Completed to Matter Submitted to ALJ or Proposed Decision Received - Average 611 547 534 902 668 604 863 0
Mental/Physical Illness - (Number of cases) 1 1 4 2 2 0 3 3
Investigation Initiated to Matter Submitted to ALJ or Proposed Decision Received - Average 611 1,038 643 826 765 0 632 922
Investigation Completed to Matter Submitted to ALJ or Proposed Decision Received - Average 407 639 450 134 570 0 367 483
Self-abuse of Drugs/Alcohol - (Number of cases) 4 2 4 4 3 6 3 5
Investigation Initiated to Matter Submitted to ALJ or Proposed Decision Received - Average 717 503 685 625 434 615 350 844
Investigation Completed to Matter Submitted to ALJ or Proposed Decision Received - Average 643 408 388 365 247 389 231 414
Fraud - (Number of cases) 2 3 0 2 1 1 1 3
Investigation Initiated to Matter Submitted to ALJ or Proposed Decision Received - Average 1,091 1,606 0 1,964 1,666 501 890 809
Investigation Completed to Matter Submitted to ALJ or Proposed Decision Received - Average 7 77 1,045 0 1,699 1,151 262 342 529
Conviction of Crime - (Number of cases) 2 1 4 0 0 2 3 3
Investigation Initiated to Matter Submitted to ALJ or Proposed Decision Received - Average 1,222 1,079 1,135 0 0 444 650 533
Investigation Completed to Matter Submitted to ALJ or Proposed Decision Received - Average 1,049 775 1,014 0 0 212 353 392
Unprofessional Conduct - (Number of cases) 1 1 1 0 2 0 2 2
Investigation Initiated to Matter Submitted to ALJ or Proposed Decision Received - Average 447 1,342 772 0 1,312 0 1,178 800
Investigation Completed to Matter Submitted to ALJ or Proposed Decision Received - Average 351 951 325 0 950 0 433 417
Internet Prescribing - (Number of cases) 1 0 0 0 0 0 0 0
Investigation Initiated to Matter Submitted to ALJ or Proposed Decision Received - Average 1,181 0 0 0 0 0 0 0
Investigation Completed to Matter Submitted to ALJ or Proposed Decision Received - Average 807 0 0 0 0 0 0 0
Medical Board of California: Sunset Review Report - SUPPLEMENTAL 2013 Page 52

ATTACHMENT E
Investigation Initiated/Completed to Submittal of the Matter to an Administrative Law Judge (ALJ) or Proposed Decision Received – Median Calendar Days
The chart below illustrates the median calendar days for all case types and then a breakdown by each individual type. This chart captures the median calendar days from the time the district office initiated the investigation to the time a matter was submitted to an ALJ or a proposed decision was received and the median calendar days from the time the district office completed the investigation to the time a matter was submitted to an ALJ or a proposed decision was received. Note: the date a proposed decision was received was only used in cases where the Board could not identify when the matter was submitted to the ALJ.
This data excludes the following case types: out-of-state, headquarters, Operation Safe Medicine, probation violations, petitions for modification/termination of probation terms, petitions for reinstatement, and subsequent discipline on probationers.
Fiscal Years 04/05 05/06 06/07 07/08 08/09 09/10 10/11 11/12
All Case Types - (Number of cases) 42 30 37 39 33 27 37 38
Investigation Initiated to Matter Submitted to ALJ or Proposed Decision Received - Median 1,006 1,114 833 1,123 1,146 817 899 1,104
Investigation Completed to Matter Submitted to ALJ or Proposed Decision Received - Median 648 639 513 746 621 352 420 505
Gross Negligence/Incompetence - (Number of cases) 23 18 17 23 20 13 16 19
Investigation Initiated to Matter Submitted to ALJ or Proposed Decision Received - Median 1,034 1,142 961 1,273 1,181 1,083 1,114 1,201
Investigation Completed to Matter Submitted to ALJ or Proposed Decision Received - Median 648 615 606 786 738 404 450 534
Inappropriate Prescribing- (Number of cases) 3 1 2 2 2 0 2 3
Investigation Initiated to Matter Submitted to ALJ or Proposed Decision Received - Median 1,208 1,786 774 1,477 680 0 1,106 1,140
Investigation Completed to Matter Submitted to ALJ or Proposed Decision Received - Median 561 1,362 522 965 452 0 673 906
Unlicensed Activity - (Number of cases) 0 0 1 1 0 0 2 0
Investigation Initiated to Matter Submitted to ALJ or Proposed Decision Received - Median 0 0 1,005 1,297 0 0 637 0
Investigation Completed to Matter Submitted to ALJ or Proposed Decision Received - Median 0 0 556 710 0 0 401 0
Sexual Misconduct - (Number of cases) 5 3 4 5 3 5 5 0
Investigation Initiated to Matter Submitted to ALJ or Proposed Decision Received - Median 956 863 727 1,123 1,210 936 1,309 0
Investigation Completed to Matter Submitted to ALJ or Proposed Decision Received - Median 759 537 396 1,003 577 428 762 0
Mental/Physical Illness - (Number of cases) 1 1 4 2 2 0 3 3
Investigation Initiated to Matter Submitted to ALJ or Proposed Decision Received - Median 611 1,038 439 826 765 0 603 1,104
Investigation Completed to Matter Submitted to ALJ or Proposed Decision Received - Median 407 639 434 134 570 0 308 332
Self-abuse of Drugs/Alcohol - (Number of cases) 4 2 4 4 3 6 3 5
Investigation Initiated to Matter Submitted to ALJ or Proposed Decision Received - Median 674 503 726 557 380 588 442 928
Investigation Completed to Matter Submitted to ALJ or Proposed Decision Received - Median 581 408 317 407 278 315 265 437
Fraud - (Number of cases) 2 3 0 2 1 1 1 3
Investigation Initiated to Matter Submitted to ALJ or Proposed Decision Received - Median 1,091 1,671 0 1,964 1,666 501 890 778
Investigation Completed to Matter Submitted to ALJ or Proposed Decision Received - Median 777 978 0 1,699 1,151 262 342 472
Conviction of Crime - (Number of cases) 2 1 4 0 0 2 3 3
Investigation Initiated to Matter Submitted to ALJ or Proposed Decision Received - Median 1,222 1,079 456 0 0 444 707 614
Investigation Completed to Matter Submitted to ALJ or Proposed Decision Received - Median 1,049 775 274 0 0 212 315 430
Unprofessional Conduct - (Number of cases) 1 1 1 0 2 0 2 2
Investigation Initiated to Matter Submitted to ALJ or Proposed Decision Received - Median 447 1,342 772 0 1,312 0 1,178 800
Investigation Completed to Matter Submitted to ALJ or Proposed Decision Received - Median 351 951 325 0 655 0 433 417
Internet Prescribing - (Number of cases) 1 0 0 0 0 0 0 0
Investigation Initiated to Matter Submitted to ALJ or Proposed Decision Received - Median 1,181 0 0 0 0 0 0 0
Investigation Completed to Matter Submitted to ALJ or Proposed Decision Received - Median 807 0 0 0 0 0 0 0
Medical Board of California: Sunset Review Report - SUPPLEMENTAL 2013 Page 53

Proposed Decision Received - Average
ATTACHMENT E Investigation Initiated/Completed to Submittal of the Matter to an Administrative Law Judge (ALJ) or
Proposed Decision Received - Average/Median Calendar Days The graphs below illustrate the average (left column) and median (right column) calendar days for all case types and then a breakdown by each individual type. These graphs show two measurements. The top lines represent the average/median calendar days from the time the district office initiated the investigation to the time a matter was submitted to an ALJ or a proposed decision was received. The bottom lines are a subset of the top lines and represent the average/median calendar days from the time the district office completed the investigation to the time a matter was submitted to an ALJ or a proposed decision was received. Note: the date a proposed decision was received was only used in cases where the Board could not identify when the matter was submitted to the ALJ.
This data excludes the following case types: out-of-state, headquarters, Operation Safe Medicine, probation violations, petitions for modification/termination of probation terms, petitions for reinstatement, and subsequent discipline on probationers.
1,400
1,200
1,000
800
600
400
200
0
All Case Types
1,161 1,1611,115 1,102 1,038
973926 850
747 751713 700 604 565513
437
04/05 05/06 06/07 07/08 08/09 09/10 10/11 11/12
Investigation Initiated to Matter Submitted to ALJ or Proposed Decision Received - Average
Investigation Completed to Matter Submitted to ALJ or
1,400
1,200
1,000
800
600
400
200
0
All Case Types
1,1461,114 1,123 1,104 1,006
899 833 817
746 648 639 621
513 505 420
352
04/05 05/06 06/07 07/08 08/09 09/10 10/11 11/12
Investigation Initiated to Matter Submitted to ALJ or Proposed Decision Received - Median
Investigation Completed to Matter Submitted to ALJ or Proposed Decision Received - Median
1,400
1,200
1,000
800
600
400
200
0
Gross Negligence/Incompetence
1,233 1,198 1,212 1,224 1,213
1,064 1,0951,046
762722 727 739 640 604
529 443
04/05 05/06 06/07 07/08 08/09 09/10 10/11 11/12
Investigation Initiated to Matter Submitted to ALJ or Proposed Decision Received - Average
Investigation Completed to Matter Submitted to ALJ or Proposed Decision Received - Average
1,400
1,200
1,000
800
600
400
200
0
Gross Negligence/Incompetence
1,273 1,181 1,201
1,142 1,1141,0831,034 961
786 738 648 615 606
534 450404
04/05 05/06 06/07 07/08 08/09 09/10 10/11 11/12
Investigation Initiated to Matter Submitted to ALJ or Proposed Decision Received - Median
Investigation Completed to Matter Submitted to ALJ or
0
2,000
1,500
1,000
500
0
Inappropriate Prescribing
1,786
1,477 1,360 1,362
1,262 1,106
965 964 833 774
680 673 522 452
0 04/05 05/06 06/07 07/08 08/09 09/10 10/11 11/12
Investigation Initiated to Matter Submitted to ALJ or Proposed Decision Received - Average
Investigation Completed to Matter Submitted to ALJ or Proposed Decision Received - Average
Proposed Decision Received - Median
0
2,000
1,500
1,000
500
0
Inappropriate Prescribing
1,786
1,477 1,362
1,208 1,106 1,140
965 906 774
680 673 561 522 452
0 04/05 05/06 06/07 07/08 08/09 09/10 10/11 11/12
Investigation Initiated to Matter Submitted to ALJ or Proposed Decision Received - Median
Investigation Completed to Matter Submitted to ALJ or Proposed Decision Received - Median
Medical Board of California: Sunset Review Report - SUPPLEMENTAL 2013 Page 54

ATTACHMENT E Investigation Initiated/Completed to Submittal of the Matter to an Administrative Law Judge (ALJ) or
Proposed Decision Received - Average/Median Calendar Days The graphs below illustrate the average (left column) and median (right column) calendar days for all case types and then a breakdown by each individual type. These graphs show two measurements. The top lines represent the average/median calendar days from the time the district office initiated the investigation to the time a matter was submitted to an ALJ or a proposed decision was received. The bottom lines are a subset of the top lines and represent the average/median calendar days from the time the district office completed the investigation to the time a matter was submitted to an ALJ or a proposed decision was received. Note: the date a proposed decision was received was only used in cases where the Board could not identify when the matter was submitted to the ALJ. This data excludes the following case types: out-of-state, headquarters, Operation Safe Medicine, probation violations, petitions for modification/termination of probation terms, petitions for reinstatement, and subsequent discipline on probationers.
0 0 0 0 0
1,400
1,200
1,000
800
600
400
200
0
Unlicensed Activity
1,297
1,005
710 637
556
401
0 0 0 0 0 04/05 05/06 06/07 07/08 08/09 09/10 10/11 11/12
Investigation Initiated to Matter Submitted to ALJ or Proposed Decision Received - Average
Investigation Completed to Matter Submitted to ALJ or Proposed Decision Received - Average
0 0 0 0 0
1,400
1,200
1,000
800
600
400
200
0
Unlicensed Activity
1,297
1,005
710 637
556
401
0 0 0 0 0 04/05 05/06 06/07 07/08 08/09 09/10 10/11 11/12
Investigation Initiated to Matter Submitted to ALJ or Proposed Decision Received - Median
Investigation Completed to Matter Submitted to ALJ or
0
1,600
1,400
1,200
1,000
800
600
400
200
0
Sexual Misconduct
1,370
1,138 1,017
934 902 855 863 725 747
668611 604547 534
0 04/05 05/06 06/07 07/08 08/09 09/10 10/11 11/12
Investigation Initiated to Matter Submitted to ALJ or Proposed Decision Received - Average
Investigation Completed to Matter Submitted to ALJ or
1
1
1
Proposed Decision Received - Median
0
400
200
000
800
600
400
200
0
Sexual Misconduct
1,309 1,210
1,123 1,003956 936
863 759 762727
577537 428396
0 04/05 05/06 06/07 07/08 08/09 09/10 10/11 11/12
Investigation Initiated to Matter Submitted to ALJ or Proposed Decision Received - Median
Investigation Completed to Matter Submitted to ALJ or Proposed Decision Received - Median Proposed Decision Received - Average
0
1,200
1,000
800
600
400
200
0
Mental/Physical Illness
1,038 922
826 765
639 643611 632 570
483450407 367
134
0 04/05 05/06 06/07 07/08 08/09 09/10 10/11 11/12
Investigation Initiated to Matter Submitted to ALJ or Proposed Decision Received - Average
Investigation Completed to Matter Submitted to ALJ or Proposed Decision Received - Average
0
1200
1000
800
600
400
200
0
Mental/Physical Illness
1,104 1,038
826 765
639611 603570
439434407 308 332
134
0 04/05 05/06 06/07 07/08 08/09 09/10 10/11 11/12
Investigation Initiated to Matter Submitted to ALJ or Proposed Decision Received - Median
Investigation Completed to Matter Submitted to ALJ or Proposed Decision Received - Median
Medical Board of California: Sunset Review Report - SUPPLEMENTAL 2013 Page 55
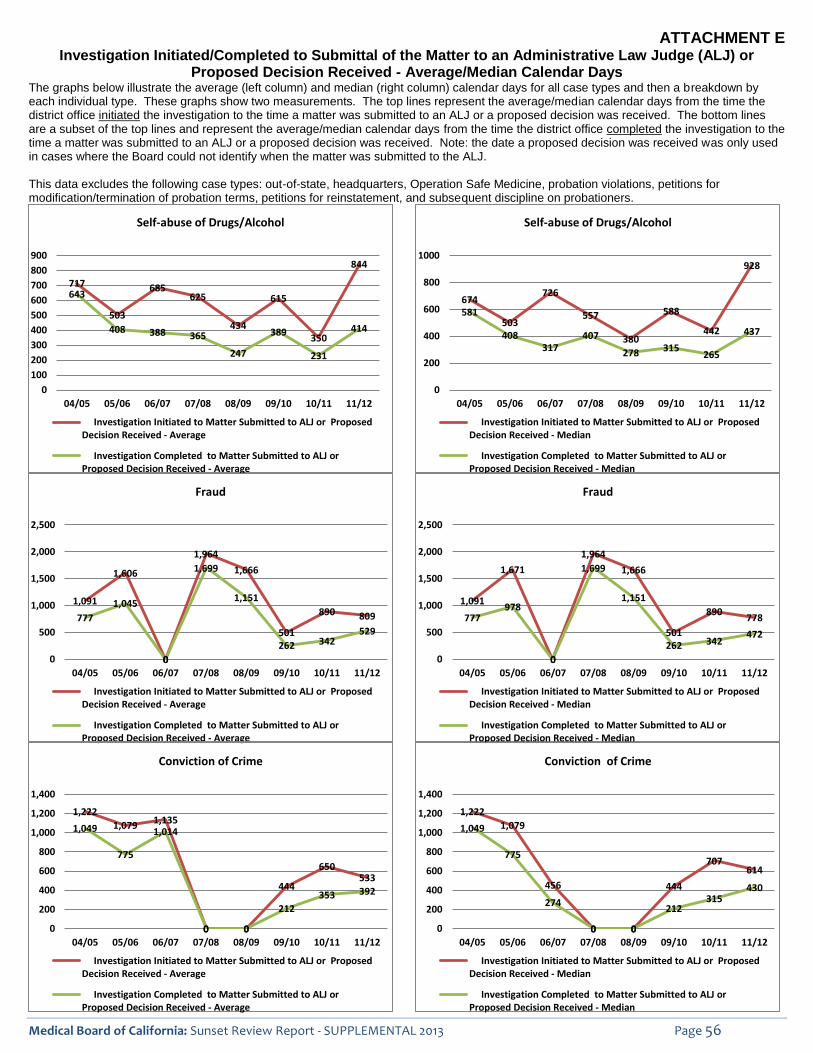
ATTACHMENT E Investigation Initiated/Completed to Submittal of the Matter to an Administrative Law Judge (ALJ) or
Proposed Decision Received - Average/Median Calendar Days The graphs below illustrate the average (left column) and median (right column) calendar days for all case types and then a breakdown by each individual type. These graphs show two measurements. The top lines represent the average/median calendar days from the time the district office initiated the investigation to the time a matter was submitted to an ALJ or a proposed decision was received. The bottom lines are a subset of the top lines and represent the average/median calendar days from the time the district office completed the investigation to the time a matter was submitted to an ALJ or a proposed decision was received. Note: the date a proposed decision was received was only used in cases where the Board could not identify when the matter was submitted to the ALJ.
This data excludes the following case types: out-of-state, headquarters, Operation Safe Medicine, probation violations, petitions for modification/termination of probation terms, petitions for reinstatement, and subsequent discipline on probationers.
900
800
700
600
500
400
300
200
100
0
Self-abuse of Drugs/Alcohol
844
717 685 643 625 615
503 434408 414388 389365 350
247 231
04/05 05/06 06/07 07/08 08/09 09/10 10/11 11/12
Investigation Initiated to Matter Submitted to ALJ or Proposed Decision Received - Average
Investigation Completed to Matter Submitted to ALJ or Proposed Decision Received - Average
1000
800
600
400
200
0
Self-abuse of Drugs/Alcohol
928
726 674 581 588557
503 442 437408 407 380
317 315278 265
04/05 05/06 06/07 07/08 08/09 09/10 10/11 11/12
Investigation Initiated to Matter Submitted to ALJ or Proposed Decision Received - Median
Investigation Completed to Matter Submitted to ALJ or Proposed Decision Received - Median
0
2,500
2,000
1,500
1,000
500
0
Fraud
1,964
1,699 1,6661,606
1,1511,091 1,045 890
777 809
501 529 342262
0 04/05 05/06 06/07 07/08 08/09 09/10 10/11 11/12
Investigation Initiated to Matter Submitted to ALJ or Proposed Decision Received - Average
Investigation Completed to Matter Submitted to ALJ or Proposed Decision Received - Average
0
2,500
2,000
1,500
1,000
500
0
Fraud
1,964
1,671 1,699 1,666
1,1511,091 978 890
777 778
501 472 342262
0 04/05 05/06 06/07 07/08 08/09 09/10 10/11 11/12
Investigation Initiated to Matter Submitted to ALJ or Proposed Decision Received - Median
Investigation Completed to Matter Submitted to ALJ or Proposed Decision Received - Median
0 0
1,400
1,200
1,000
800
600
400
200
0
Conviction of Crime
1,222 1,135
1,0791,049 1,014
775 650
533 444 392353
212
0 0 04/05 05/06 06/07 07/08 08/09 09/10 10/11 11/12
Investigation Initiated to Matter Submitted to ALJ or Proposed Decision Received - Average
Investigation Completed to Matter Submitted to ALJ or Proposed Decision Received - Average
0 0
1,400
1,200
1,000
800
600
400
200
0
Conviction of Crime
1,222
1,049 1,079
775 707
614
456 444 430 315274
212
0 0 04/05 05/06 06/07 07/08 08/09 09/10 10/11 11/12
Investigation Initiated to Matter Submitted to ALJ or Proposed Decision Received - Median
Investigation Completed to Matter Submitted to ALJ or Proposed Decision Received - Median
Medical Board of California: Sunset Review Report - SUPPLEMENTAL 2013 Page 56
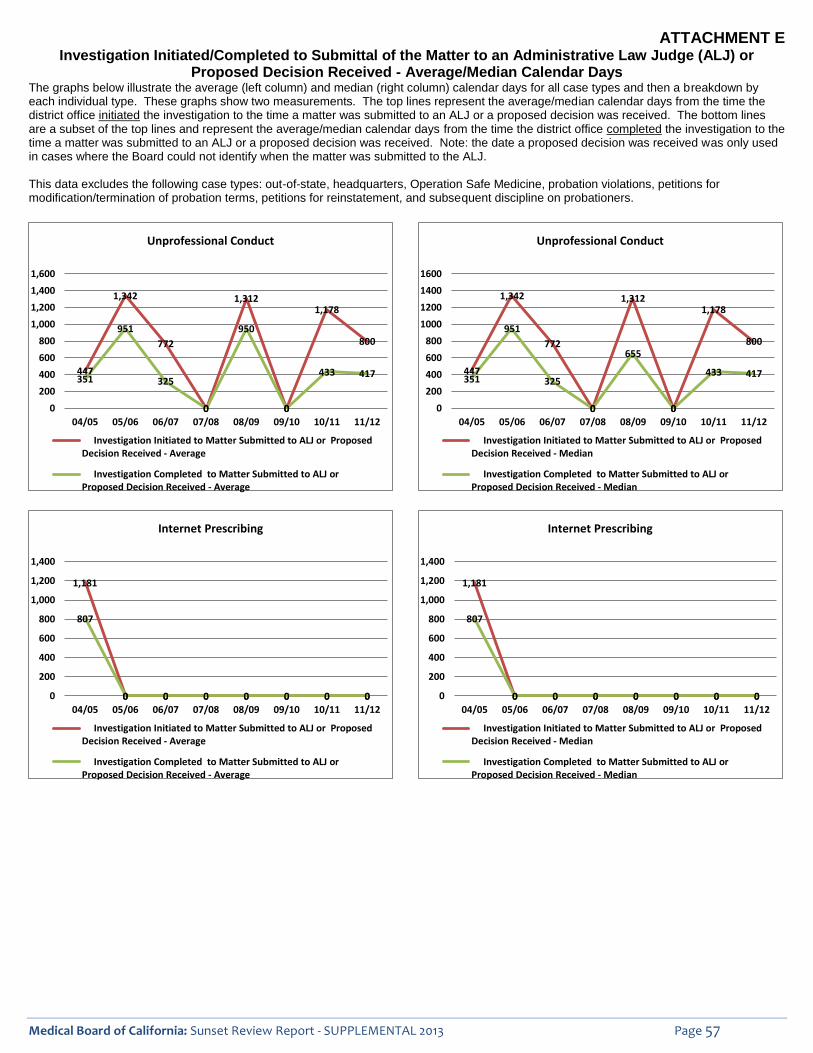
ATTACHMENT E Investigation Initiated/Completed to Submittal of the Matter to an Administrative Law Judge (ALJ) or
Proposed Decision Received - Average/Median Calendar Days The graphs below illustrate the average (left column) and median (right column) calendar days for all case types and then a breakdown by each individual type. These graphs show two measurements. The top lines represent the average/median calendar days from the time the district office initiated the investigation to the time a matter was submitted to an ALJ or a proposed decision was received. The bottom lines are a subset of the top lines and represent the average/median calendar days from the time the district office completed the investigation to the time a matter was submitted to an ALJ or a proposed decision was received. Note: the date a proposed decision was received was only used in cases where the Board could not identify when the matter was submitted to the ALJ.
This data excludes the following case types: out-of-state, headquarters, Operation Safe Medicine, probation violations, petitions for modification/termination of probation terms, petitions for reinstatement, and subsequent discipline on probationers.
1,600
1,400
1,200
1,000
800
600
400
200
0
Unprofessional Conduct
447
1,342
772
0
1,312
0
1,178
800
351
951
325
0
950
0
433 417
04/05 05/06 06/07 07/08 08/09 09/10 10/11 11/12
Investigation Initiated to Matter Submitted to ALJ or Proposed Decision Received - Average
Investigation Completed to Matter Submitted to ALJ or Proposed Decision Received - Average
Unprofessional Conduct
447
1,342
772
0
1,312
0
1,178
800
351
951
325
0
655
0
433 417
0
200
400
600
800
1000
1200
1400
1600
04/05 05/06 06/07 07/08 08/09 09/10 10/11 11/12
Investigation Initiated to Matter Submitted to ALJ or Proposed Decision Received - Median
Investigation Completed to Matter Submitted to ALJ or Proposed Decision Received - Median
0 0 0 0 0 0
Internet Prescribing
1,400
1,200
00
1,181
1,000
800 807
600
400
200
0 0 0 0 0 0 0 04/05 05/06 06/07 07/08 08/09 09/10 10/11 11/12
Investigation Initiated to Matter Submitted to ALJ or Proposed Decision Received - Average
Investigation Completed to Matter Submitted to ALJ or Proposed Decision Received - Average
0 0 0 0 0 0
Internet Prescribing
1,400
1,200
00
1,181
1,000
800 807
600
400
200
0 0 0 0 0 0 0 04/05 05/06 06/07 07/08 08/09 09/10 10/11 11/12
Investigation Initiated to Matter Submitted to ALJ or Proposed Decision Received - Median
Investigation Completed to Matter Submitted to ALJ or Proposed Decision Received - Median
Medical Board of California: Sunset Review Report - SUPPLEMENTAL 2013 Page 57

ATTACHMENT F
Investigation Initiated/Completed to Default Decision Received – Average Calendar Days The chart below illustrates the average calendar days for all case types and then a breakdown by each individual type. This graph captures the average calendar days from the time the district office initiated the investigation to the time a default decision was received and the average calendar days from the time the district office completed the investigation to the time a default decision was received.
This data excludes the following case types: out-of-state, headquarters, Operation Safe Medicine, probation violations, petitions for modification/termination of probation terms, petitions for reinstatement, and subsequent discipline on probationers.
Fiscal Year 04/05 05/06 06/07 07/08 08/09 09/10 10/11 11/12
All Case Types - (Number of cases) 12 7 11 8 12 7 11 8
Investigation Initiated to Default Decision Received - Average 477 554 673 591 732 771 690 678
Investigation Completed to Default Decision Received - Average 190 211 411 304 441 374 322 282
Gross Negligence/Incompetence - (Number of cases) 3 3 3 1 3 1 3 2
Investigation Initiated to Default Decision Received - Average 731 636 1,087 781 1,215 1,605 894 710
Investigation Completed to Default Decision Received - Average 270 185 719 190 871 1,301 115 218
Inappropriate Prescribing - (Number of cases) 1 0 0 0 2 0 0 0
Investigation Initiated to Default Decision Received - Average 195 0 0 0 400 0 0 0
Investigation Completed to Default Decision Received - Average 83 0 0 0 162 0 0 0
Sexual Misconduct - (Number of cases) 0 0 1 0 0 1 0 0
Investigation Initiated to Default Decision Received - Average 0 0 279 0 0 1,121 0 0
Investigation Completed to Default Decision Received - Average 0 0 219 0 0 73 0 0
Mental/Physical Illness - (Number of cases) 4 0 1 3 3 3 2 3
Investigation Initiated to Default Decision Received - Average 338 0 692 723 563 585 668 633
Investigation Completed to Default Decision Received - Average 157 0 525 417 371 287 214 215
Self-abuse of Drugs/Alcohol - (Number of cases) 4 0 3 1 2 2 1 1
Investigation Initiated to Default Decision Received - Average 497 0 690 276 680 460 309 376
Investigation Completed to Default Decision Received - Average 191 0 384 121 207 191 132 151
Fraud - (Number of cases) 0 0 0 2 1 0 0 1
Investigation Initiated to Default Decision Received - Average 0 0 0 565 965 0 0 1,009
Investigation Completed to Default Decision Received - Average 0 0 0 352 660 0 0 640
Conviction of Crime - (Number of cases) 0 1 2 1 1 0 5 1
Investigation Initiated to Default Decision Received - Average 0 351 409 373 328 0 653 716
Investigation Completed to Default Decision Received - Average 0 237 138 168 173 0 526 384
Unprofessional Conduct - (Number of cases) 0 3 1 0 0 0 0 0
Investigation Initiated to Default Decision Received - Average 0 540 277 0 0 0 0 0
Investigation Completed to Default Decision Received - Average 0 228 199 0 0 0 0 0
Medical Board of California: Sunset Review Report - SUPPLEMENTAL 2013 Page 58

ATTACHMENT F
Investigation Initiated/Completed to Default Decision Received – Average Calendar Days The chart below illustrates the average calendar days for all case types and then a breakdown by each individual type. This graph captures the average calendar days from the time the district office initiated the investigation to the time a default decision was received and the average calendar days from the time the district office completed the investigation to the time a default decision was received.
This data excludes the following case types: out-of-state, headquarters, Operation Safe Medicine, probation violations, petitions for modification/termination of probation terms, petitions for reinstatement, and subsequent discipline on probationers.
Fiscal Years 04/05 05/06 06/07 07/08 08/09 09/10 10/11 11/12
All Case Types - (Number of cases) 12 7 11 8 12 7 11 8
From Investigation Initiated to Default Decision - Median 370 539 692 629 681 758 654 660
From Investigation Completed to Default Decision - Median 211 185 237 296 282 269 175 190
Gross Negligence/Incompetence - (Number of cases) 3 3 3 1 3 1 3 2
From Investigation Initiated to Default Decision - Median 745 640 1,059 781 681 1,605 866 710
From Investigation Completed to Default Decision - Median 269 185 533 190 395 1,301 100 218
Inappropriate Prescribing - (Number of cases) 1 0 0 0 2 0 0 0
From Investigation Initiated to Default Decision - Median 195 0 0 0 400 0 0 0
From Investigation Completed to Default Decision - Median 83 0 0 0 162 0 0 0
Sexual Misconduct - (Number of cases) 0 0 1 0 0 1 0 0
From Investigation Initiated to Default Decision - Median 0 0 279 0 0 1,121 0 0
From Investigation Completed to Default Decision - Median 0 0 219 0 0 73 0 0
Mental/Physical Illness - (Number of cases) 4 0 1 3 3 3 2 3
From Investigation Initiated to Default Decision - Median 316 0 692 834 783 648 668 610
From Investigation Completed to Default Decision - Median 163 0 525 358 527 299 214 161
Self-abuse of Drugs/Alcohol - (Number of cases) 4 0 3 1 2 2 1 1
From Investigation Initiated to Default Decision - Median 390 0 773 276 680 460 309 376
From Investigation Completed to Default Decision - Median 200 0 254 121 207 191 132 151
Fraud - (Number of cases) 0 0 0 2 1 0 0 1
From Investigation Initiated to Default Decision - Median 0 0 0 565 965 0 0 1,009
From Investigation Completed to Default Decision - Median 0 0 0 352 660 0 0 640
Conviction of Crime - (Number of cases) 0 1 2 1 1 0 5 1
From Investigation Initiated to Default Decision - Median 0 351 409 373 328 0 450 716
From Investigation Completed to Default Decision - Median 0 237 138 168 173 0 290 384
Unprofessional Conduct - (Number of cases) 0 3 1 0 0 0 0 0
From Investigation Initiated to Default Decision - Median 0 409 277 0 0 0 0 0
From Investigation Completed to Default Decision - Median 0 184 199 0 0 0 0 0
Medical Board of California: Sunset Review Report - SUPPLEMENTAL 2013 Page 59

Investigation Initiated/Completed to Default Decision Received – Average/Median Calendar Days The graphs below illustrate the average (left column) and median (right column) calendar days for all case types and then a breakdown by each individual type. These graphs show two measurements. The top lines represent t he average/median calendar days from the time the district office initiated the investigation to the time a default decision was received. The bottom lines are a subset of the top lines and represent t he average/median calendar days from the time the district office completed the investigation to the time a de fault decision was received.
This data excludes the following case types: out-of-state, headquarters, Operation Safe Medicine, probation violations, petitions for modification/termination of probation terms, petitions for reinstatement, and subsequent discipline on probationers.
1,000
800
600
400
200
0
All Case Types
771732 673 690 678
591554 477 441411 374
304 322 282 190 211
04/05 05/06 06/07 07/08 08/09 09/10 10/11 11/12
Investigation Initiated to Default Decision Received - Average
Investigation Completed to Default Decision Received - Average
800
700
600
500
400
300
200
100
0
All Case Types
758 692 681 654 660629
539
370 296 282 269237211 185 175 190
04/05 05/06 06/07 07/08 08/09 09/10 10/11 11/12
Investigation Initiated to Default Decision Received - Median
Investigation Completed to Default Decision Received - Median
2,000
1,500
1,000
500
0
Gross Negligence/Incompetence
1,605
1,3011,215 1,087
871 894 731 781719 710636
270 185 190 218 115
04/05 05/06 06/07 07/08 08/09 09/10 10/11 11/12
Investigation Initiated to Default Decision Received - Average
Investigation Completed to Default Decision Received - Average
2,000
1,500
1,000
500
0
Gross Negligence/Incompetence
1,605
1,301
1,059 866
745 781 710640 681 533
395 269 185 190 218
100
04/05 05/06 06/07 07/08 08/09 09/10 10/11 11/12
Investigation Initiated to Default Decision Received - Median
Investigation Completed to Default Decision Received - Median
0 0 0 0 0 0
500
400
300
200
100
0
Inappropriate Prescribing
400
195 162
83
0 0 0 0 0 0 04/05 05/06 06/07 07/08 08/09 09/10 10/11 11/12
Investigation Initiated to Default Decision Received - Average
Investigation Completed to Default Decision Received - Average
0 0 0 0 0 0
500
400
300
200
100
0
Inappropriate Prescribing
400
195 162
83
0 0 0 0 0 0 04/05 05/06 06/07 07/08 08/09 09/10 10/11 11/12
Investigation Initiated to Default Decision Received - Median
Investigation Completed to Default Decision Received - Median
ATTACHMENT F
Medical Board of California: Sunset Review Report - SUPPLEMENTAL 2013 Page 60

Investigation Initiated/Completed to Default Decision Received – Average/Median Calendar Days The graphs below illustrate the average (left column) and median (right column) calendar days for all case types and then a breakdown by each individual type. These graphs show two measurements. The top lines represent t he average/median calendar days from the time the district office initiated the investigation to the time a default decision was received. The bottom lines are a subset of the top lines and represent t he average/median calendar days from the time the district office completed the investigation to the time a de fault decision was received.
This data excludes the following case types: out-of-state, headquarters, Operation Safe Medicine, probation violations, petitions for modification/termination of probation terms, petitions for reinstatement, and subsequent discipline on probationers.
0 0 0 0 0 0
1,200
1,000
800
600
400
200
0
Sexual Misconduct
1,121
279219
73 0 0 0 0 0 0
04/05 05/06 06/07 07/08 08/09 09/10 10/11 11/12
Investigation Initiated to Default Decision Received - Average
Investigation Completed to Default Decision Received - Average
0 0 0 0 0 0
1,200
1,000
800
600
400
200
0
Sexual Misconduct
1,121
279219
73 0 0 0 0 0 0
04/05 05/06 06/07 07/08 08/09 09/10 10/11 11/12
Investigation Initiated to Default Decision Received - Median
Investigation Completed to Default Decision Received - Median
0
800
700
600
500
400
300
200
100
0
Mental/Physical Illness
723692 668 633 585563
525
417 371338
287 214 215
157
0 04/05 05/06 06/07 07/08 08/09 09/10 10/11 11/12
Investigation Initiated to Default Decision Received - Average
Investigation Completed to Default Decision Received - Average
0
1,000
800
600
400
200
0
Mental/Physical Illness
834 783
692 648 668 610
525 527
358316 299 214
163 161
0 04/05 05/06 06/07 07/08 08/09 09/10 10/11 11/12
Investigation Initiated to Default Decision Received - Median
Investigation Completed to Default Decision Received - Median
0
800
700
600
500
400
300
200
100
0
Self-abuse of Drugs/Alcohol
690 680
497 460
384 376 309276
191 207 191 151121 132
0 04/05 05/06 06/07 07/08 08/09 09/10 10/11 11/12
Investigation Initiated to Default Decision Received - Average
Investigation Completed to Default Decision Received - Average
0
1,000
800
600
400
200
0
Self-abuse of Drugs/Alcohol
773 680
460 390 376
309 254 276
200 207 191 151121 132
0 04/05 05/06 06/07 07/08 08/09 09/10 10/11 11/12
Investigation Initiated to Default Decision Received - Median
Investigation Completed to Default Decision Received - Median
ATTACHMENT F
Medical Board of California: Sunset Review Report - SUPPLEMENTAL 2013 Page 61

Investigation Initiated/Completed to Default Decision Received – Average/Median Calendar Days The graphs below illustrate the average (left column) and median (right column) calendar days for all case types and then a breakdown by each individual type. These graphs show two measurements. The top lines represent t he average/median calendar days from the time the district office initiated the investigation to the time a default decision was received. The bottom lines are a subset of the top lines and represent t he average/median calendar days from the time the district office completed the investigation to the time a de fault decision was received.
This data excludes the following case types: out-of-state, headquarters, Operation Safe Medicine, probation violations, petitions for modification/termination of probation terms, petitions for r einstatement, and subsequent discipline on probationers.
0 0 0 0 0
1,200
1,000
800
600
400
200
0
Fraud
1,009965
660 640 565
352
0 0 0 0 0 04/05 05/06 06/07 07/08 08/09 09/10 10/11 11/12
Investigation Initiated to Default Decision Received - Average
Investigation Completed to Default Decision Received - Average
0 0 0 0 0
1,200
1,000
800
600
400
200
0
Fraud
1,009965
660 640 565
352
0 0 0 0 0 04/05 05/06 06/07 07/08 08/09 09/10 10/11 11/12
Investigation Initiated to Default Decision Received - Median
Investigation Completed to Default Decision Received - Median
0 0
800
700
600
500
400
300
200
100
0
Conviction of Crime
716 653
526
409 373 384351 328
237 168 173138
0 0 04/05 05/06 06/07 07/08 08/09 09/10 10/11 11/12
Investigation Initiated to Default Decision Received - Average
Investigation Completed to Default Decision Received - Average
0 0
800
700
600
500
400
300
200
100
0
Conviction of Crime
716
450 409
373 384351 328 290
237 168 173138
0 0 04/05 05/06 06/07 07/08 08/09 09/10 10/11 11/12
Investigation Initiated to Default Decision Received - Median
Investigation Completed to Default Decision Received - Median
0 0 0 0 0 0
600
500
400
300
200
100
0
Unprofessional Conduct
540
277 228
199
0 0 0 0 0 0 04/05 05/06 06/07 07/08 08/09 09/10 10/11 11/12
Investigation Initiated to Default Decision Received - Average
Investigation Completed to Default Decision Received - Average
0 0 0 0 0 0
500
400
300
200
100
0
Unprofessional Conduct
409
277
199184
0 0 0 0 0 0 04/05 05/06 06/07 07/08 08/09 09/10 10/11 11/12
Investigation Initiated to Default Decision Received - Median
Investigation Completed to Default Decision Received - Median
ATTACHMENT F
Medical Board of California: Sunset Review Report - SUPPLEMENTAL 2013 Page 62

ATTACHMENT G
Cases Declined by the Attorney General's Office The Chart represents the number of cases, which after the investigation was completed through VE/P, were declined to be prosecuted by the Attorney General's Office.
04-05 05-06 06-07 07-08 08-09 09-10 10-11 11-12
San Jose 1 1 2 1 5 2 7 4
Pleasant Hill 4 1 2 1 2 0 4 0
Sacramento 0 1 0 1 2 1 0 1
Fresno 2 1 5 1 2 1 2 0
Tustin 1 0 2 1 1 1 2 1
San Bernardino 1 1 2 0 0 0 2 0
San Diego 3 0 2 0 8 0 2 0
Rancho Cucamonga
1 0 0 0 0 0 0 1
Valencia 0 2 3 3 0 0 0 3
Cerritos 0 9 5 3 2 0 2 1
San Dimas 0 1 3 3 2 5 2 1
Glendale 7 3 3 2 2 1 7 3
Probation 0 0 0 0 0 0 0 0
Total Cases 20 20 29 16 26 11 30 15
Cases Requesting Supplemental Investigation After Transmittal The Chart below represents the number of cases, which after the investigation was completed through VE/P, were deemed to need additional investigation.
04-05 05-06 06-07 07-08 08-09 09-10 10-11 11-12
San Jose 4 0 0 3 0 1 3 9
Pleasant Hill 4 2 0 0 1 0 2 1
Sacramento 0 0 0 0 1 1 3 4
Fresno 0 0 0 0 0 0 2 0
Tustin 6 1 0 1 0 0 0 0
San Bernardino 0 1 0 0 0 0 1 0
San Diego 0 0 0 0 1 0 1 1
Rancho Cucamonga
1 0 0 0 0 0 1 1
Valencia 1 3 2 0 1 5 2 0
Cerritos 2 9 0 1 0 0 0 2
San Dimas 0 3 4 5 5 6 5 5
Glendale 1 1 2 1 0 0 1 0
Probation 0 0 0 0 0 0 0 0
Total Cases 19 20 8 11 9 13 21 23
Medical Board of California: Sunset Review Report - SUPPLEMENTAL 2013 Page 63