Embed Size (px)
Citation preview
A REPORT PRODUCED BY ARTHRITIS AND OSTEOPOROSIS VICTORIA
BASED ON ANALYSIS BY DELOITTE ACCESS ECONOMICS
ACKNOWLEDGEMENTS
This report was produced by Arthritis and Osteoporosis Victoria based on analysis by Deloitte Access
Economics.
Personnel involved in the report from Arthritis and Osteoporosis Victoria were:
Ms Linda Martin, Chief Executive Officer;
Mr Gavin McDonald, Senior Policy and Planning Adviser / Project Manager;
Ms Kirsti Kihl Larssen, Consultant;
Ms Geraldine McDonald, General Manager Policy, Strategy and Partnerships;
Dr Andrew Briggs, Research Manager;
Mr Tony Whitfort, Head of Marketing and Communication;
Professor Peter Brooks, Board Director; and
Dr Ian Relf, Board Director.
Graphic design by Coolwise Creative.
Suggested citation: Arthritis and Osteoporosis Victoria (2013). A problem worth solving. Elsternwick:
Arthritis and Osteoporosis Victoria.
©2013 Arthritis and Osteoporosis Victoria
Limitation of our work:
This report has been prepared for the purpose of contributing to estimates of the prevalence and
economic impact of musculoskeletal conditions in Australia. You should not refer to or use our name
or the name of the contributors or the advice for any other purpose.
CONTENTS
Foreword .............................................................................................................................................. 1
Executive summary .............................................................................................................................. 2
1 Introduction ............................................................................................................................. 7
1.1 Arthritis and other musculoskeletal conditions ................................................ 9
1.2 Report structure ............................................................................................... 9
2 Prevalence estimates ............................................................................................................. 11
2.1 Data sources .................................................................................................... 13
2.2 Prevalence in the Australian population ........................................................ 14
2.3 Comparison with other conditions .................................................................. 21
2.4 Historical prevalence trends ........................................................................... 22
2.5 Prevalence projections to 2032 ...................................................................... 23
3 Economic impact .................................................................................................................... 27
3.1 Health costs .................................................................................................... 29
3.2 Other financial costs ....................................................................................... 34
3.3 Burden of disease ........................................................................................... 48
3.4 Summary of economic impact ........................................................................ 53
4 Conclusion .............................................................................................................................. 55
4.1 Strategic response .......................................................................................... 57
Appendix A: Brief description of conditions ...................................................................................... 58
References ......................................................................................................................................... 59
CHARTS Chart 2.1: Prevalence of arthritis and other musculoskeletal conditions
by age and gender, 2012 ............................................................................................. 15
Chart 2.2: Prevalence of osteoarthritis by age and gender, 2012 ............................................... 16
Chart 2.3: Prevalence of rheumatoid arthritis by age and gender, 2012 ..................................... 16
Chart 2.4: Prevalence of osteoporosis by age and gender, 2012 ................................................. 17
Chart 2.5: Prevalence of back problems by age and gender, 2012 .............................................. 17
Chart 2.6: Prevalence of arthritis and other musculoskeletal conditions
by jurisdiction, 2012 .................................................................................................... 19
Chart 2.7: Prevalence comparisons – arthritis and other musculoskeletal
conditions and selected National Health Priority Areas, 2011‐12 .............................. 21
Chart 2.8: Prevalence of arthritis and other musculoskeletal conditions to 2032
by condition ................................................................................................................ 23
Chart 2.9: Prevalence of arthritis and other musculoskeletal conditions to 2032
by gender .................................................................................................................... 24
Chart 2.10: Prevalence of arthritis and other musculoskeletal conditions to 2032
by age group ................................................................................................................ 25
Chart 3.1: Total health cost by condition, 2012 ........................................................................... 33
Chart 3.2: Distribution of total other financial costs, 2012 .......................................................... 47
Chart 3.3: Disability adjusted life years lost due to arthritis and other
musculoskeletal conditions, by age and gender, 2012 ............................................... 51
TABLES Table 2.1: Prevalence of arthritis and other musculoskeletal conditions
by age and gender, 2012 ............................................................................................. 15
Table 2.2: Prevalence of osteoarthritis, rheumatoid arthritis, osteoporosis
and back problems by age, gender and condition, 2012 ............................................ 18
Table 2.3: Prevalence of arthritis and other musculoskeletal conditions
by jurisdiction, 2012 .................................................................................................... 20
Table 2.4: Prevalence of arthritis and other musculoskeletal conditions
from 2004‐05 to 2012 ................................................................................................. 22
Table 3.1: Rheumatoid arthritis, allocated health cost by type, 2012 ......................................... 29
Table 3.2: Osteoarthritis, allocated health cost by type, 2012 .................................................... 30
Table 3.3: Osteoporosis, health cost per person, 2012 ............................................................... 31
Table 3.4: Summary of osteoporosis total health cost by type, 2012 ($ millions) ....................... 32
Table 3.5: Summary of health costs, 2012 ................................................................................... 33
Table 3.6: Average employment rates (%) for people with arthritis and
other musculoskeletal conditions ............................................................................... 36
Table 3.7: Adjusted labour productivity loss estimates due to presenteeism ............................. 38
Table 3.8: Lost earnings and taxation revenue, 2012 .................................................................. 40
Table 3.9: Average per person cost of aids and home modifications by condition ..................... 43
Table 3.10: Summary of other financial costs, 2012 ...................................................................... 47
Table 3.11: Estimated years of healthy life lost due to disability attributed to
arthritis and other musculoskeletal conditions, 2012 ................................................. 50
Table 3.12: Estimated years of life lost due to premature death attributed to
arthritis and other musculoskeletal conditions, 2012 ................................................. 50
Table 3.13: Estimated disability adjusted life years lost due to arthritis
and other musculoskeletal conditions, 2012 .............................................................. 51
Table 3.14: Total cost of arthritis and other musculoskeletal conditions in 2012 ......................... 53
FIGURES
Figure 3.1: Deadweight loss of taxation ........................................................................................ 45
GLOSSARY OF ACRONYMS
ABS Australian Bureau of Statistics
AHS Australian Health Survey
AIHW Australian Institute of Health and Welfare
AWE Average weekly earnings
BP Back problems
DALY Disability Adjusted Life Years
DEXA Dual energy x‐ray absorptiometry
DMARD Disease modifying antirheumatic drug
DW Disability weight
DWL Deadweight loss
GP General practitioner
NHPA National Health Priority Area
NHS National Health Survey
OA Osteoarthritis
OP Osteoporosis
QALY Quality‐adjusted life years
RA Rheumatoid arthritis
SDAC Survey of Disability, Ageing and Carers
VSL Value of a Statistical Life
VSLY Value of a Statistical Life Year
WTP Willingness to pay
YLD Years of healthy life lost due to disability
YLL Years of life lost due to premature death
A Problem Worth Solving. 1 Arthritis and Osteoporosis Victoria
FOREWORD
This isn’t ‘just another report’ full of new statistics – it’s the story of a much bigger issue.
There are already 6.1 million Australians with musculoskeletal conditions. It’s affecting
productivity, placing an enormous burden on the health system and causing pain and
disability.
For the first time, this report reveals the full economic cost of the ‘arthritis and
musculoskeletal conditions’ National Health Priority Area (focusing on back problems,
osteoarthritis, osteoporosis and rheumatoid arthritis). Furthermore, it illuminates how
population ageing over the next two decades will cause a surge in prevalence of
musculoskeletal conditions, particularly affecting older Australians.
There is a social and economic imperative for government and industry to take
action now. We must invest to manage the rising cost of musculoskeletal conditions
– for the benefit of our community and as a substantial step towards addressing the
sustainability of health system expenditure in Australia.
I am proud to present this report to you produced by Arthritis and Osteoporosis
Victoria based on analysis completed by Deloitte Access Economics.
This is a problem worth solving.
Linda Martin
Chief Executive Officer
Arthritis and Osteoporosis Victoria
A Problem Worth Solving. 2 Arthritis and Osteoporosis Victoria
EXECUTIVE SUMMARY
This report was produced by Arthritis and Osteoporosis Victoria based on analysis completed by
Deloitte Access Economics. The purpose of the report is to identify the dimensions and impact of
arthritis and other musculoskeletal conditions in Australia and provide the basis for a proactive
strategic response. The conditions considered in this study include osteoarthritis, rheumatoid
arthritis, osteoporosis and back problems, which are the four most prevalent conditions within the
‘arthritis and musculoskeletal conditions’ National Health Priority Area.
PREVALENCE IN AUSTRALIA In 2012, there were an estimated 6.1 million cases1 of arthritis and other musculoskeletal conditions
in Australia (26.9% of the population), including 2.9 million people with back problems, 1.9 million
people with osteoarthritis, 0.8 million people with osteoporosis and 0.5 million people with
rheumatoid arthritis. In general, arthritis and other musculoskeletal conditions are more prevalent
in women (31.6%, 3.6 million) than men (22.2%, 2.5 million). While prevalence rates are higher in
older Australians, more than half of those with musculoskeletal conditions (58.4%) are currently
between the ages of 25 and 64 years – the prime working age population. ‘Arthritis and
musculoskeletal conditions’ are more prevalent than any other National Health Priority Area.
As Australia’s population ages over the next two decades, the prevalence of musculoskeletal
conditions will rise substantially. By 2032, it is projected that the number of cases of arthritis and
other musculoskeletal conditions will increase by 43% to 8.7 million (a rise of 2.6 million), affecting
30.2% of the population. Osteoarthritis is projected to increase by 1.1 million (affecting 3.0 million
people), back problems to increase by 0.9 million (affecting 3.8 million people), osteoporosis to
increase by 0.4 million (affecting 1.2 million people) and rheumatoid arthritis to increase by 0.2
million (affecting 0.7 million people).
The number of people with osteoarthritis and osteoporosis is projected to increase the fastest (58%
and 50% growth respectively), however back problems will remain the most prevalent of the four
conditions. Chart i illustrates the magnitude of the prevalence increases.
1 There are fewer than 6.1 million individual Australians with osteoarthritis, rheumatoid arthritis, osteoporosis and back problems due to comorbidity between the four conditions. However the 2011‐12 AHS (ABS Report) identified a total of 6.1 million individual Australians with 'diseases of the musculoskeletal system and connective tissue' (which includes the four conditions focused on in this report as well as other less prevalent musculoskeletal conditions).
A Problem Worth Solving. 3 Arthritis and Osteoporosis Victoria
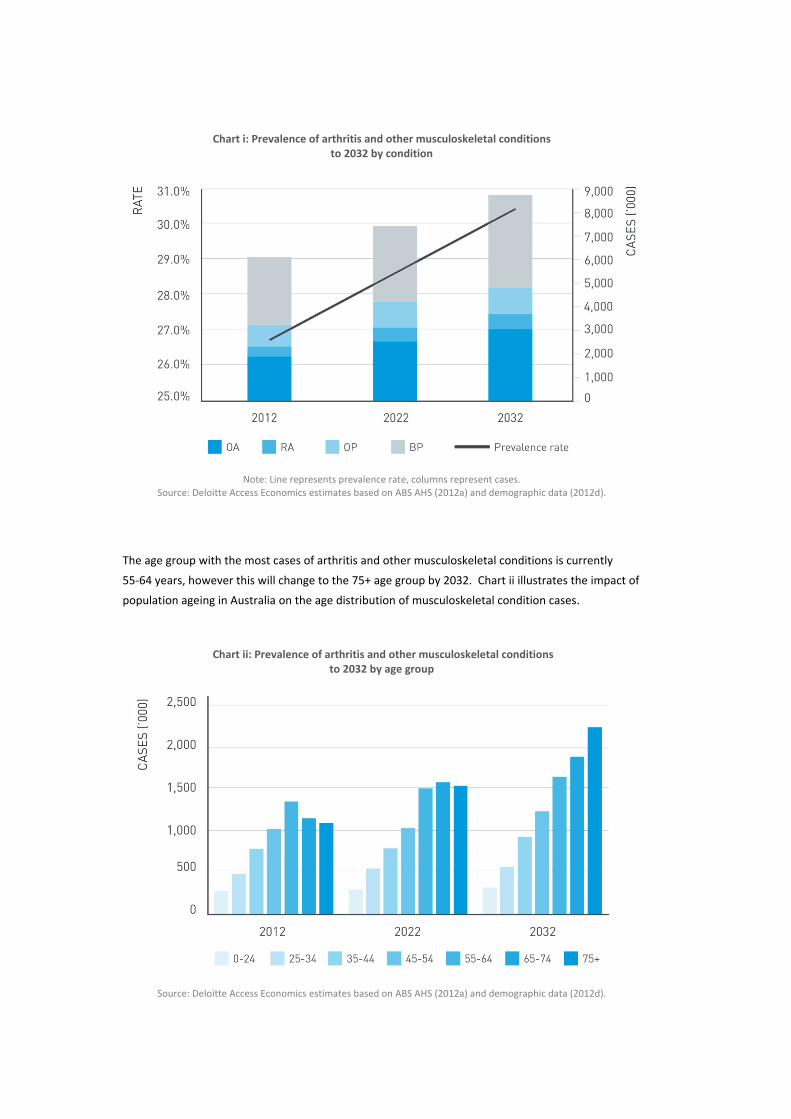
Chart i: Prevalence of arthritis and other musculoskeletal conditions to 2032 by condition
Note: Line represents prevalence rate, columns represent cases. Source: Deloitte Access Economics estimates based on ABS AHS (2012a) and demographic data (2012d).
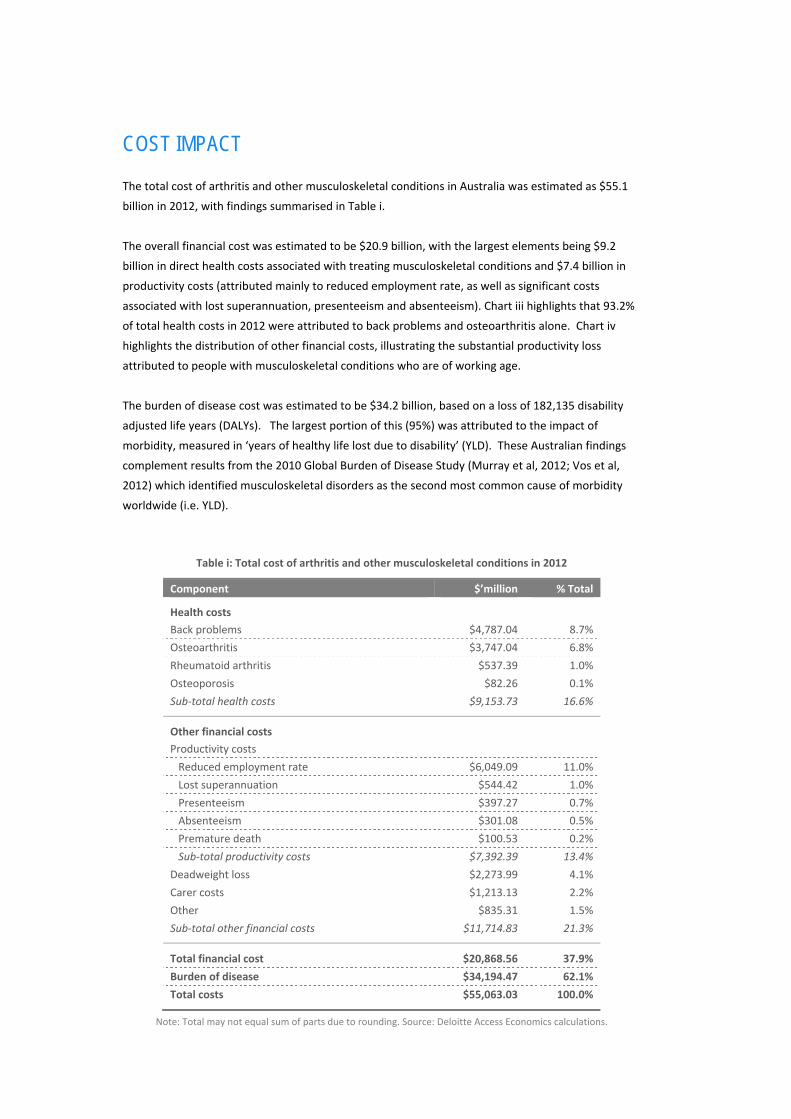
The age group with the most cases of arthritis and other musculoskeletal conditions is currently
55‐64 years, however this will change to the 75+ age group by 2032. Chart ii illustrates the impact of
population ageing in Australia on the age distribution of musculoskeletal condition cases.
Chart ii: Prevalence of arthritis and other musculoskeletal conditions to 2032 by age group
Source: Deloitte Access Economics estimates based on ABS AHS (2012a) and demographic data (2012d).
A Problem Worth Solving. 4 Arthritis and Osteoporosis Victoria
COST IMPACT The total cost of arthritis and other musculoskeletal conditions in Australia was estimated as $55.1
billion in 2012, with findings summarised in Table i.
The overall financial cost was estimated to be $20.9 billion, with the largest elements being $9.2
billion in direct health costs associated with treating musculoskeletal conditions and $7.4 billion in
productivity costs (attributed mainly to reduced employment rate, as well as significant costs
associated with lost superannuation, presenteeism and absenteeism). Chart iii highlights that 93.2%
of total health costs in 2012 were attributed to back problems and osteoarthritis alone. Chart iv
highlights the distribution of other financial costs, illustrating the substantial productivity loss
attributed to people with musculoskeletal conditions who are of working age.
The burden of disease cost was estimated to be $34.2 billion, based on a loss of 182,135 disability
adjusted life years (DALYs). The largest portion of this (95%) was attributed to the impact of
morbidity, measured in ‘years of healthy life lost due to disability’ (YLD). These Australian findings
complement results from the 2010 Global Burden of Disease Study (Murray et al, 2012; Vos et al,
2012) which identified musculoskeletal disorders as the second most common cause of morbidity
worldwide (i.e. YLD).
Table i: Total cost of arthritis and other musculoskeletal conditions in 2012
Component $’million % Total
Health costs
Back problems $4,787.04 8.7%
Osteoarthritis $3,747.04 6.8%
Rheumatoid arthritis $537.39 1.0%
Osteoporosis $82.26 0.1%
Sub‐total health costs $9,153.73 16.6%
Other financial costs
Productivity costs
Reduced employment rate $6,049.09 11.0%
Lost superannuation $544.42 1.0%
Presenteeism $397.27 0.7%
Absenteeism $301.08 0.5%
Premature death $100.53 0.2%
Sub‐total productivity costs $7,392.39 13.4%
Deadweight loss $2,273.99 4.1%
Carer costs $1,213.13 2.2%
Other $835.31 1.5%
Sub‐total other financial costs $11,714.83 21.3%
Total financial cost $20,868.56 37.9%
Burden of disease $34,194.47 62.1%
Total costs $55,063.03 100.0%
Note: Total may not equal sum of parts due to rounding. Source: Deloitte Access Economics calculations.

A Problem Worth Solving. 5 Arthritis and Osteoporosis Victoria
Chart iii: Distribution of total health cost by condition, 2012
Source: Deloitte Access Economics calculations based on various sources.
Note: Cost for osteoporosis in this analysis is related to fractures only,
based on average costs of hospitalisation, residential aged care and rehabilitation in 2012.
Chart iv: Distribution of total other financial costs, 2012
Source: Deloitte Access Economics calculations based on various sources.
KEY AREAS FOR INTERVENTION A comprehensive strategic response is required to address the magnitude of economic costs
associated with musculoskeletal conditions in Australia and the substantial prevalence increases
projected over the next two decades. The evidence in this report highlights the current impact on
direct health costs, productivity costs, linkages with pain, disability and other chronic diseases (such
as cardiovascular, diabetes and mental health), as well as the future impact on the aged care system
as key areas for intervention.

A Problem Worth Solving. 6 Arthritis and Osteoporosis Victoria

A Problem Worth Solving. 7 Arthritis and Osteoporosis Victoria
1 INTRODUCTION
INSERT CHAPTER 1 ART
The purpose of this study is to produce national
evidence which identifies the dimensions and
impact of arthritis and other musculoskeletal
conditions in Australia and provides the basis for
a proactive strategic response.
INTRODUCTION
1.

A Problem Worth Solving. 8 Arthritis and Osteoporosis Victoria
A Problem Worth Solving. 9 Arthritis and Osteoporosis Victoria
1.1 ARTHRITIS AND OTHER MUSCULOSKELETAL CONDITIONS ‘Arthritis and musculoskeletal conditions’ have been a National Health Priority Area (NHPA) in
Australia since 2002. The musculoskeletal conditions included in this study comprise osteoarthritis
(OA), rheumatoid arthritis (RA), osteoporosis (OP) and back problems (BP), which are the four most
prevalent conditions within this NHPA. Any variation to this definition reflects the terms used in
specific datasets or reports, which are noted in the relevant sections. Appendix A provides a brief
description of the four conditions.
1.2 REPORT STRUCTURE This report is structured in accordance with the activities that were undertaken.
Chapter 2 provides the current prevalence estimates of arthritis and other musculoskeletal
conditions in Australia, including a breakdown by age, gender and jurisdiction. Prevalence
projections are also provided for the years 2022 and 2032, including a breakdown by age and
gender.
Chapter 3 estimates the total economic cost of arthritis and other musculoskeletal conditions in
Australia in 2012, including health costs, other financial costs and burden of disease. Particular
emphasis is given to productivity costs, including impacts on employment rate, absenteeism,
presenteeism, superannuation contributions, premature death and taxation revenue. Estimates
are based on extrapolations from previous Access Economics’ reports such as Painful Realities:
The economic impact of arthritis in Australia (2007), and The high price of pain: The economic
impact of persistent pain in Australia (2007).
Chapter 4 concludes the report and summarises the key impacts of arthritis and other
musculoskeletal conditions which could form the basis of a strategic response.

A Problem Worth Solving. 10 Arthritis and Osteoporosis Victoria
A Problem Worth Solving. 11 Arthritis and Osteoporosis Victoria
2 PREVALENCE ESTIMATES
INSERT CHAPTER 2 ART
This chapter provides the current prevalence
estimates of arthritis and other musculoskeletal
conditions in Australia, including a breakdown by
age, gender and jurisdiction. The prevalence of
musculoskeletal conditions are also estimated and
projected for the years 2022 and 2032, including
breakdown by age and gender.
PREVALENCE ESTIMATES
2.

A Problem Worth Solving. 12 Arthritis and Osteoporosis Victoria
A Problem Worth Solving. 13 Arthritis and Osteoporosis Victoria
2.1 DATA SOURCES The method for estimating the prevalence of arthritis and other musculoskeletal conditions follows
previous works undertaken by Access Economics including but not limited to a report for Arthritis
Australia, Painful Realities: The economic impact of arthritis in Australia (2007), a report for the MBF
Foundation, The high price of pain: The economic impact of persistent pain in Australia (2007), and a
report for Osteoporosis Australia, The burden of brittle bones: Costing osteoporosis in Australia
(2001).
The age‐gender prevalence rates are based on the Australian Health Survey (AHS) which is
conducted by Australian Bureau of Statistics (ABS). The 2011‐12 AHS combines the existing ABS
National Health Survey (NHS) and the National Aboriginal and Torres Strait Islander Health Survey
together with two new elements – a National Nutrition and Physical Activity Survey and a National
Health Measure Survey. The prevalence data presented in this report comes from the NHS
component of the AHS only, with the latest being 2011‐122.
In the AHS, respondents were classified as having a long‐term health condition if they had:
ever been told by a doctor or nurse that they had a particular health condition;
the condition was current at the time of the survey; and
the condition had lasted at least six months or more, or the respondent expected it to last for six
months or more.
As with other surveys based on self‐report, there are potential issues and challenges ensuring the
accuracy of outcome measures, in this instance the prevalence rates. For example, as highlighted in
Zheltoukhoava et al (2012), patients at the early stages of the disease may be unaware of their
condition. Consequently, these patients may not seek appropriate treatments and consultations.
This may result in an under‐reporting of conditions and thus an underestimation of the overall
prevalence estimates.
The prevalence estimates presented in the following sections may represent conservative estimates
of the prevalence of arthritis and other musculoskeletal conditions in Australia. However, this is
counterbalanced by the fact that the AHS includes osteopenia in its questions regarding
osteoporosis. The prevalence is estimated together with Australian demographic data for 2012
which is also from the ABS (ABS, 2012).
2 Note that ABS has presented the data by age and gender separately. Consequently, Deloitte Access Economics derived the age‐gender split by applying the disease rate for male and female to the number of persons in each of the age groups.
A Problem Worth Solving. 14 Arthritis and Osteoporosis Victoria
2.2 PREVALENCE IN THE AUSTRALIAN POPULATION 2.2.1 AUSTRALIA AS A WHOLE
The AHS collects data on a suite of diseases of the musculoskeletal system and connective tissue,
including RA, OA, other or unknown arthritidies, other arthropathies, rheumatism, back pain and
disorders, osteoporosis, other unspecified diseases of the musculoskeletal system and connective
tissue and conditions which have signs and symptoms involving the musculoskeletal system and
connective tissue. While the AHS acknowledges a total of 6.1 million individual Australians have
‘diseases of the musculoskeletal system and connective tissue’, this report focuses only on the four
most prevalent long‐term musculoskeletal conditions – OA, RA, OP and BP3.
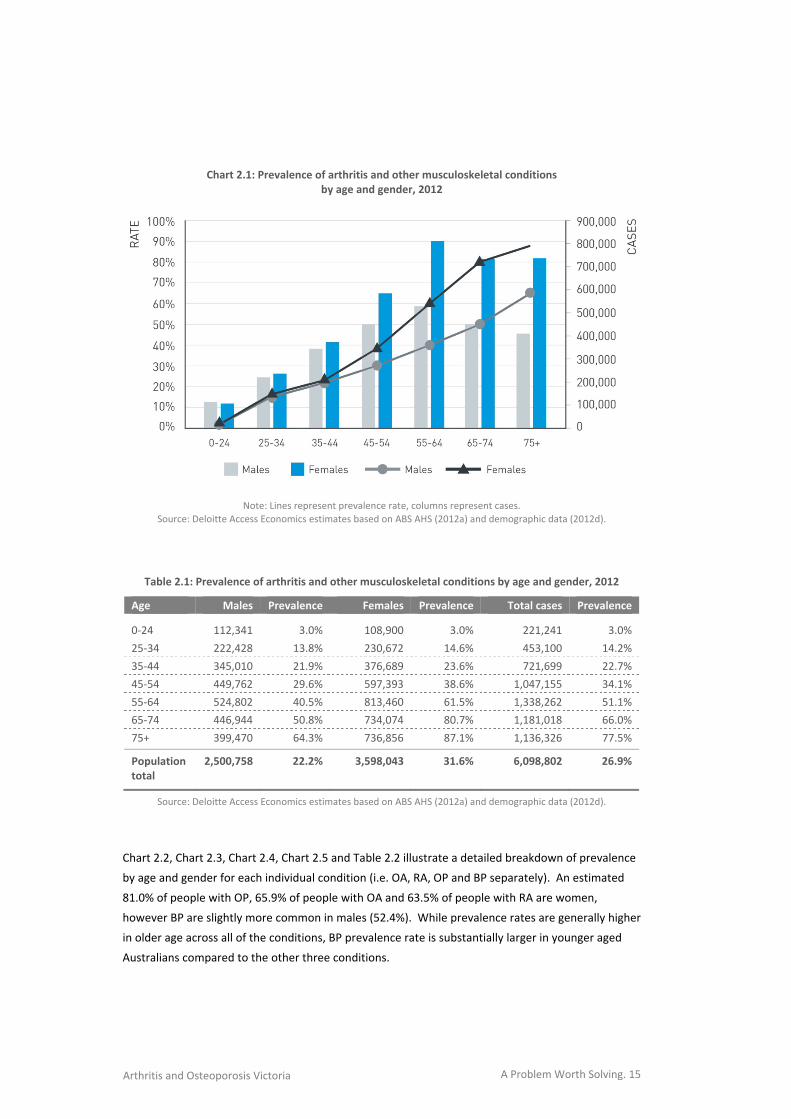
Chart 2.1 and Table 2.1 illustrate the total prevalence of arthritis and other musculoskeletal
conditions in Australia by age and gender for 2012 (i.e. OA, RA, OP and BP combined).
More than half of those with arthritis and other musculoskeletal conditions (58.4%) are between
the age of 25 and 64 years – the prime working age population.
Prevalence rates are correlated with age and are higher in older Australians. The 75+ age group
has the largest prevalence rates – 64.3% for men and 87.1% for women.
Musculoskeletal conditions are more prevalent among women, with 31.6% of all Australian
women (3.6 million) estimated to have some form of arthritis or other musculoskeletal condition
compared to 22.2% of all men (2.5 million).
In 2012, there were an estimated 6.1 million cases4 of arthritis and other
musculoskeletal conditions in Australia (26.9% of the population), including 2.9
million people with back problems, 1.9 million people with osteoarthritis, 0.8
million people with osteoporosis and 0.5 million people with rheumatoid
arthritis.
3 Specifically, the long‐term health condition, back pain/problems, disc disorder, is defined to include back pain or other back problems, such as sprains, strains, or joint pain, as well as disc disorders, such as slipped discs or disc degeneration, but exclude arthritis and osteoporosis (ABS, 2012).
4 There are fewer than 6.1 million individual Australians with osteoarthritis, rheumatoid arthritis, osteoporosis and back problems due to comorbidity between the four conditions. However the 2011‐12 AHS (ABS Report) identified a total of 6.1 million individual Australians with 'diseases of the musculoskeletal system and connective tissue' (which includes the four conditions focused on in this report as well as other less prevalent musculoskeletal conditions).
A Problem Worth Solving. 15 Arthritis and Osteoporosis Victoria
Chart 2.1: Prevalence of arthritis and other musculoskeletal conditions by age and gender, 2012
Note: Lines represent prevalence rate, columns represent cases.
Source: Deloitte Access Economics estimates based on ABS AHS (2012a) and demographic data (2012d).
Table 2.1: Prevalence of arthritis and other musculoskeletal conditions by age and gender, 2012
Age Males Prevalence Females Prevalence Total cases Prevalence
0‐24 112,341 3.0% 108,900 3.0% 221,241 3.0%
25‐34 222,428 13.8% 230,672 14.6% 453,100 14.2%
35‐44 345,010 21.9% 376,689 23.6% 721,699 22.7%
45‐54 449,762 29.6% 597,393 38.6% 1,047,155 34.1%
55‐64 524,802 40.5% 813,460 61.5% 1,338,262 51.1%
65‐74 446,944 50.8% 734,074 80.7% 1,181,018 66.0%
75+ 399,470 64.3% 736,856 87.1% 1,136,326 77.5%
Population total
2,500,758 22.2% 3,598,043 31.6% 6,098,802 26.9%
Source: Deloitte Access Economics estimates based on ABS AHS (2012a) and demographic data (2012d).
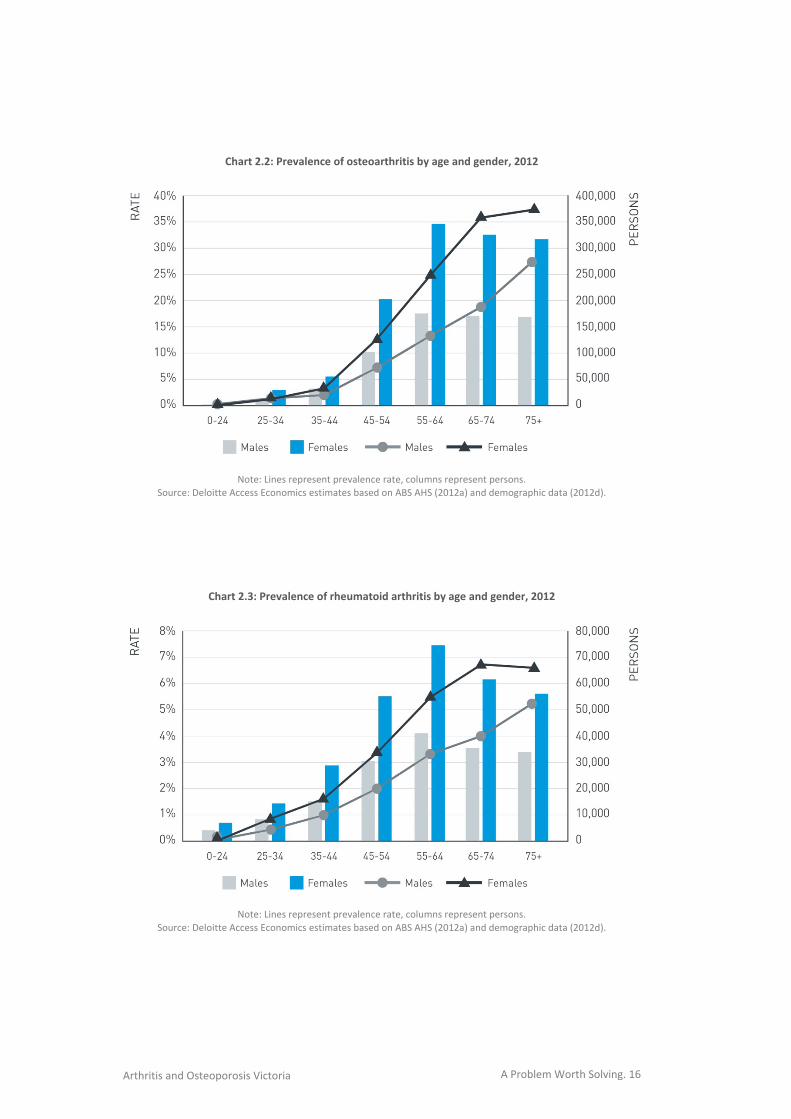
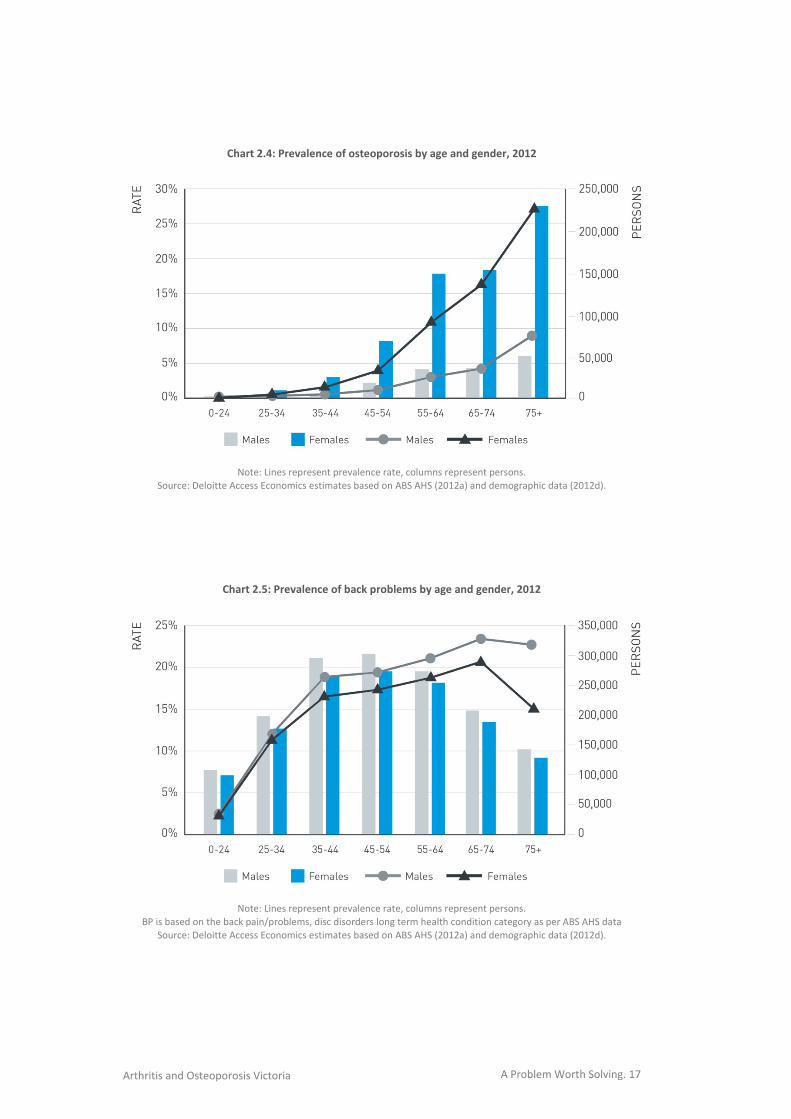
Chart 2.2, Chart 2.3, Chart 2.4, Chart 2.5 and Table 2.2 illustrate a detailed breakdown of prevalence
by age and gender for each individual condition (i.e. OA, RA, OP and BP separately). An estimated
81.0% of people with OP, 65.9% of people with OA and 63.5% of people with RA are women,
however BP are slightly more common in males (52.4%). While prevalence rates are generally higher
in older age across all of the conditions, BP prevalence rate is substantially larger in younger aged
Australians compared to the other three conditions.
A Problem Worth Solving. 16 Arthritis and Osteoporosis Victoria
Chart 2.2: Prevalence of osteoarthritis by age and gender, 2012
Note: Lines represent prevalence rate, columns represent persons.
Source: Deloitte Access Economics estimates based on ABS AHS (2012a) and demographic data (2012d).
Chart 2.3: Prevalence of rheumatoid arthritis by age and gender, 2012
Note: Lines represent prevalence rate, columns represent persons.
Source: Deloitte Access Economics estimates based on ABS AHS (2012a) and demographic data (2012d).
A Problem Worth Solving. 17 Arthritis and Osteoporosis Victoria
Chart 2.4: Prevalence of osteoporosis by age and gender, 2012
Note: Lines represent prevalence rate, columns represent persons.
Source: Deloitte Access Economics estimates based on ABS AHS (2012a) and demographic data (2012d).
Chart 2.5: Prevalence of back problems by age and gender, 2012
Note: Lines represent prevalence rate, columns represent persons.
BP is based on the back pain/problems, disc disorders long term health condition category as per ABS AHS data
Source: Deloitte Access Economics estimates based on ABS AHS (2012a) and demographic data (2012d).
A Problem Worth Solving. 18 Arthritis and Osteoporosis Victoria
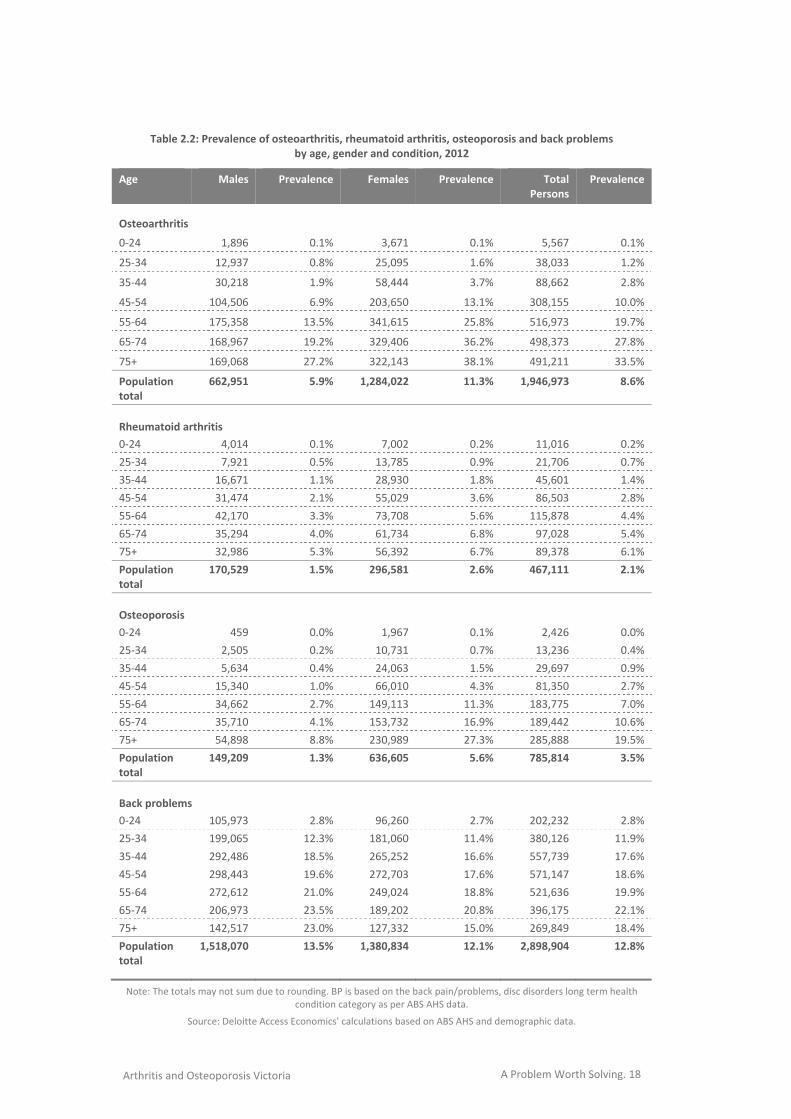
Table 2.2: Prevalence of osteoarthritis, rheumatoid arthritis, osteoporosis and back problems by age, gender and condition, 2012
Age Males Prevalence Females Prevalence Total Persons
Prevalence
Osteoarthritis
0‐24 1,896 0.1% 3,671 0.1% 5,567 0.1%
25‐34 12,937 0.8% 25,095 1.6% 38,033 1.2%
35‐44 30,218 1.9% 58,444 3.7% 88,662 2.8%
45‐54 104,506 6.9% 203,650 13.1% 308,155 10.0%
55‐64 175,358 13.5% 341,615 25.8% 516,973 19.7%
65‐74 168,967 19.2% 329,406 36.2% 498,373 27.8%
75+ 169,068 27.2% 322,143 38.1% 491,211 33.5%
Population total
662,951 5.9% 1,284,022 11.3% 1,946,973 8.6%
Rheumatoid arthritis
0‐24 4,014 0.1% 7,002 0.2% 11,016 0.2%
25‐34 7,921 0.5% 13,785 0.9% 21,706 0.7%
35‐44 16,671 1.1% 28,930 1.8% 45,601 1.4%
45‐54 31,474 2.1% 55,029 3.6% 86,503 2.8%
55‐64 42,170 3.3% 73,708 5.6% 115,878 4.4%
65‐74 35,294 4.0% 61,734 6.8% 97,028 5.4%
75+ 32,986 5.3% 56,392 6.7% 89,378 6.1%
Population total
170,529 1.5% 296,581 2.6% 467,111 2.1%
Osteoporosis
0‐24 459 0.0% 1,967 0.1% 2,426 0.0%
25‐34 2,505 0.2% 10,731 0.7% 13,236 0.4%
35‐44 5,634 0.4% 24,063 1.5% 29,697 0.9%
45‐54 15,340 1.0% 66,010 4.3% 81,350 2.7%
55‐64 34,662 2.7% 149,113 11.3% 183,775 7.0%
65‐74 35,710 4.1% 153,732 16.9% 189,442 10.6%
75+ 54,898 8.8% 230,989 27.3% 285,888 19.5%
Population total
149,209 1.3% 636,605 5.6% 785,814 3.5%
Back problems
0‐24 105,973 2.8% 96,260 2.7% 202,232 2.8%
25‐34 199,065 12.3% 181,060 11.4% 380,126 11.9%
35‐44 292,486 18.5% 265,252 16.6% 557,739 17.6%
45‐54 298,443 19.6% 272,703 17.6% 571,147 18.6%
55‐64 272,612 21.0% 249,024 18.8% 521,636 19.9%
65‐74 206,973 23.5% 189,202 20.8% 396,175 22.1%
75+ 142,517 23.0% 127,332 15.0% 269,849 18.4%
Population total
1,518,070 13.5% 1,380,834 12.1% 2,898,904 12.8%
Note: The totals may not sum due to rounding. BP is based on the back pain/problems, disc disorders long term health condition category as per ABS AHS data.
Source: Deloitte Access Economics' calculations based on ABS AHS and demographic data.
A Problem Worth Solving. 19 Arthritis and Osteoporosis Victoria
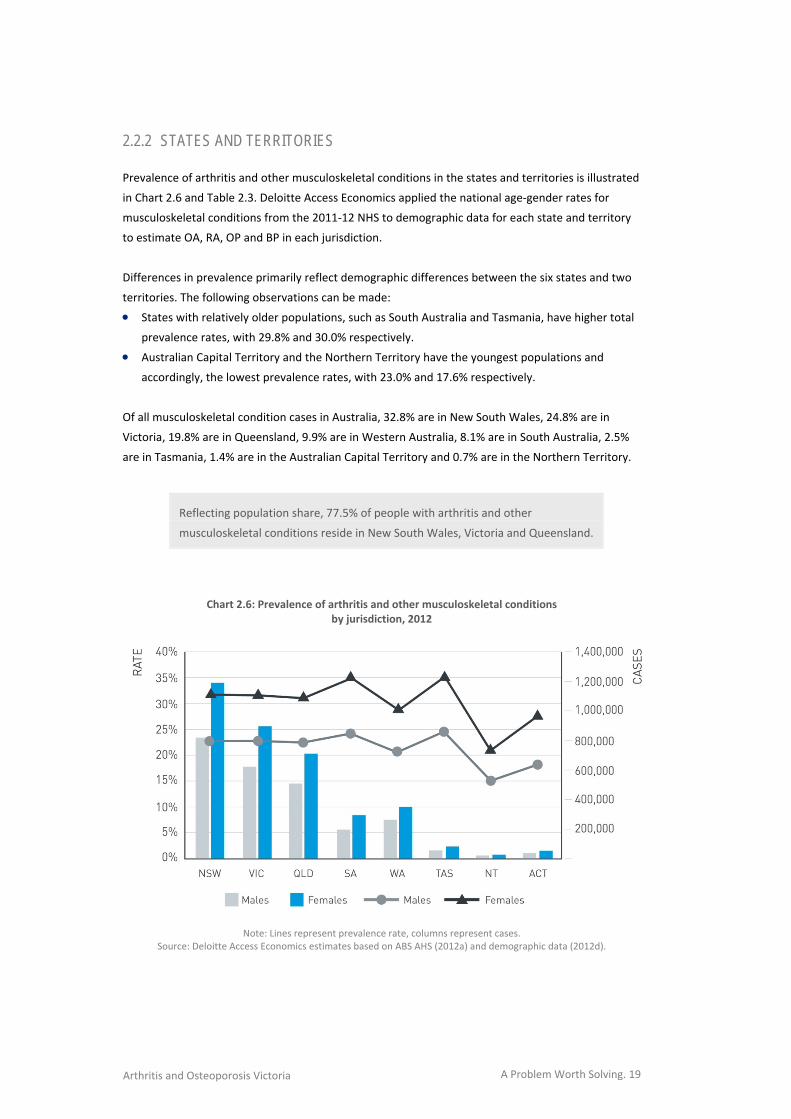
2.2.2 STATES AND TERRITORIES
Prevalence of arthritis and other musculoskeletal conditions in the states and territories is illustrated
in Chart 2.6 and Table 2.3. Deloitte Access Economics applied the national age‐gender rates for
musculoskeletal conditions from the 2011‐12 NHS to demographic data for each state and territory
to estimate OA, RA, OP and BP in each jurisdiction.
Differences in prevalence primarily reflect demographic differences between the six states and two
territories. The following observations can be made:
States with relatively older populations, such as South Australia and Tasmania, have higher total
prevalence rates, with 29.8% and 30.0% respectively.
Australian Capital Territory and the Northern Territory have the youngest populations and
accordingly, the lowest prevalence rates, with 23.0% and 17.6% respectively.
Of all musculoskeletal condition cases in Australia, 32.8% are in New South Wales, 24.8% are in
Victoria, 19.8% are in Queensland, 9.9% are in Western Australia, 8.1% are in South Australia, 2.5%
are in Tasmania, 1.4% are in the Australian Capital Territory and 0.7% are in the Northern Territory.
Reflecting population share, 77.5% of people with arthritis and other
musculoskeletal conditions reside in New South Wales, Victoria and Queensland.
Chart 2.6: Prevalence of arthritis and other musculoskeletal conditions
by jurisdiction, 2012
Note: Lines represent prevalence rate, columns represent cases.
Source: Deloitte Access Economics estimates based on ABS AHS (2012a) and demographic data (2012d).
A Problem Worth Solving. 20 Arthritis and Osteoporosis Victoria
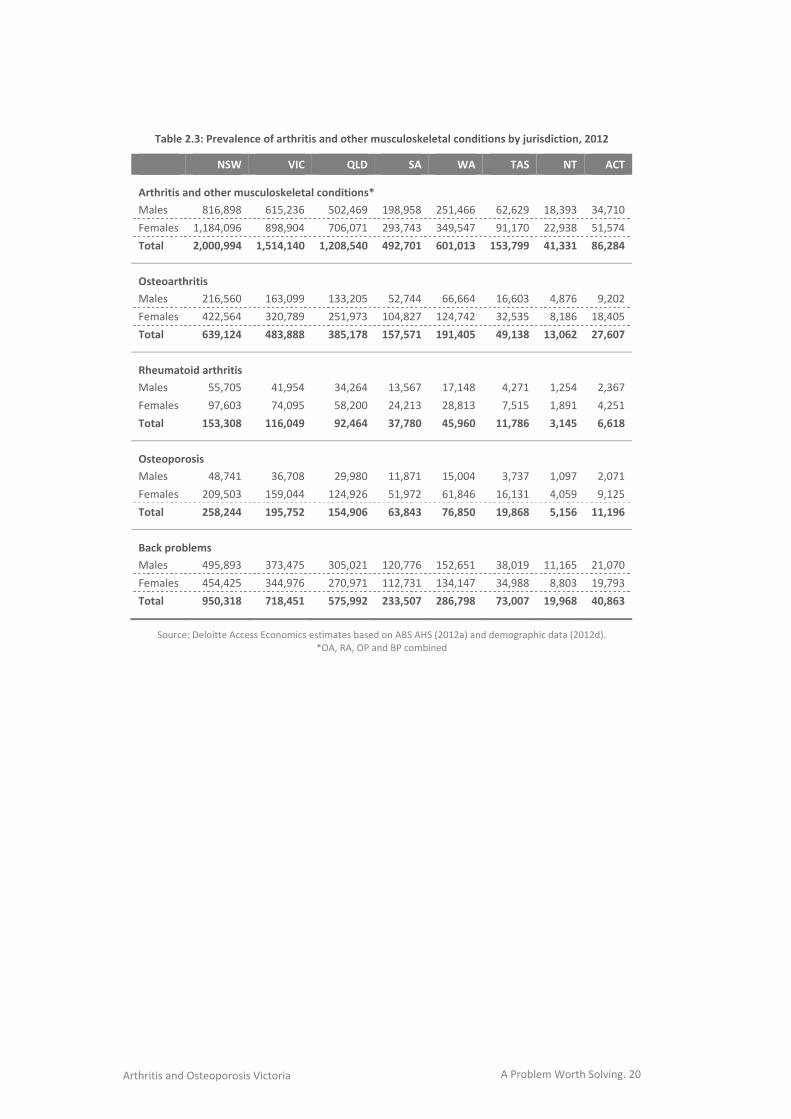
Table 2.3: Prevalence of arthritis and other musculoskeletal conditions by jurisdiction, 2012
NSW VIC QLD SA WA TAS NT ACT
Arthritis and other musculoskeletal conditions*
Males 816,898 615,236 502,469 198,958 251,466 62,629 18,393 34,710
Females 1,184,096 898,904 706,071 293,743 349,547 91,170 22,938 51,574
Total 2,000,994 1,514,140 1,208,540 492,701 601,013 153,799 41,331 86,284
Osteoarthritis
Males 216,560 163,099 133,205 52,744 66,664 16,603 4,876 9,202
Females 422,564 320,789 251,973 104,827 124,742 32,535 8,186 18,405
Total 639,124 483,888 385,178 157,571 191,405 49,138 13,062 27,607
Rheumatoid arthritis
Males 55,705 41,954 34,264 13,567 17,148 4,271 1,254 2,367
Females 97,603 74,095 58,200 24,213 28,813 7,515 1,891 4,251
Total 153,308 116,049 92,464 37,780 45,960 11,786 3,145 6,618
Osteoporosis
Males 48,741 36,708 29,980 11,871 15,004 3,737 1,097 2,071
Females 209,503 159,044 124,926 51,972 61,846 16,131 4,059 9,125
Total 258,244 195,752 154,906 63,843 76,850 19,868 5,156 11,196
Back problems
Males 495,893 373,475 305,021 120,776 152,651 38,019 11,165 21,070
Females 454,425 344,976 270,971 112,731 134,147 34,988 8,803 19,793
Total 950,318 718,451 575,992 233,507 286,798 73,007 19,968 40,863
Source: Deloitte Access Economics estimates based on ABS AHS (2012a) and demographic data (2012d). *OA, RA, OP and BP combined
A Problem Worth Solving. 21 Arthritis and Osteoporosis Victoria
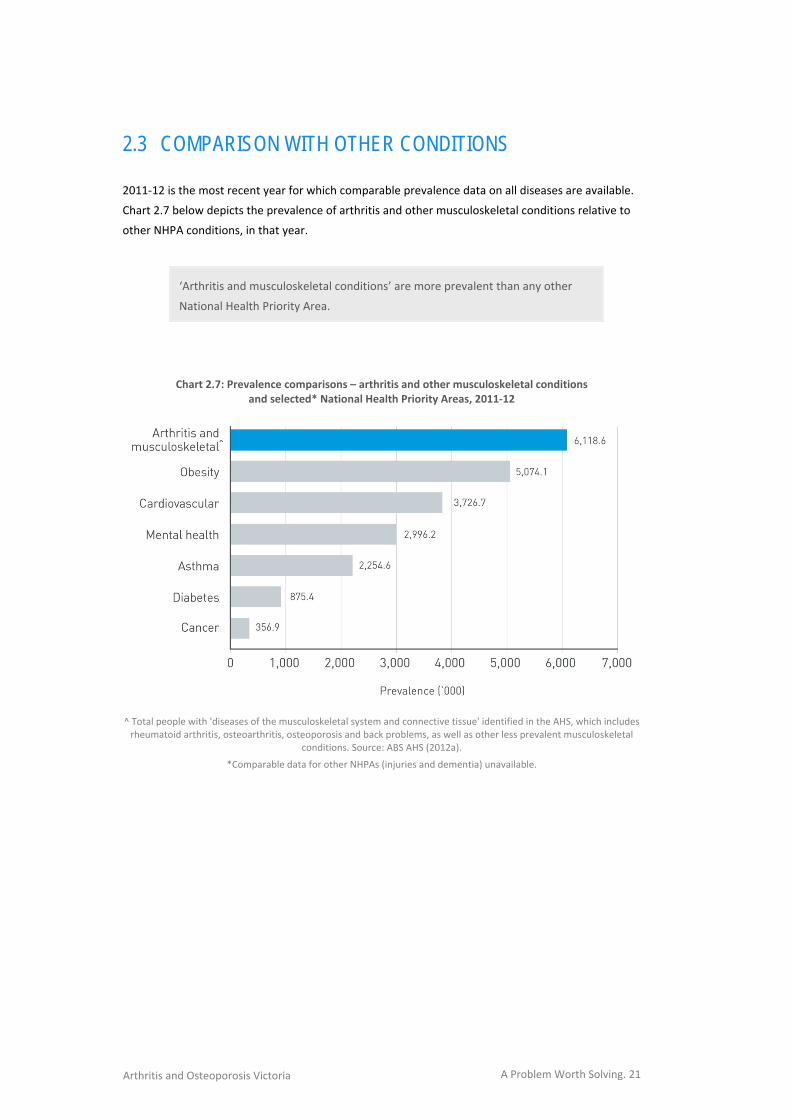
2.3 COMPARISON WITH OTHER CONDITIONS 2011‐12 is the most recent year for which comparable prevalence data on all diseases are available.
Chart 2.7 below depicts the prevalence of arthritis and other musculoskeletal conditions relative to
other NHPA conditions, in that year.
‘Arthritis and musculoskeletal conditions’ are more prevalent than any other
National Health Priority Area.
Chart 2.7: Prevalence comparisons – arthritis and other musculoskeletal conditions and selected* National Health Priority Areas, 2011‐12
^ Total people with 'diseases of the musculoskeletal system and connective tissue' identified in the AHS, which includes rheumatoid arthritis, osteoarthritis, osteoporosis and back problems, as well as other less prevalent musculoskeletal
conditions. Source: ABS AHS (2012a).
*Comparable data for other NHPAs (injuries and dementia) unavailable.
A Problem Worth Solving. 22 Arthritis and Osteoporosis Victoria
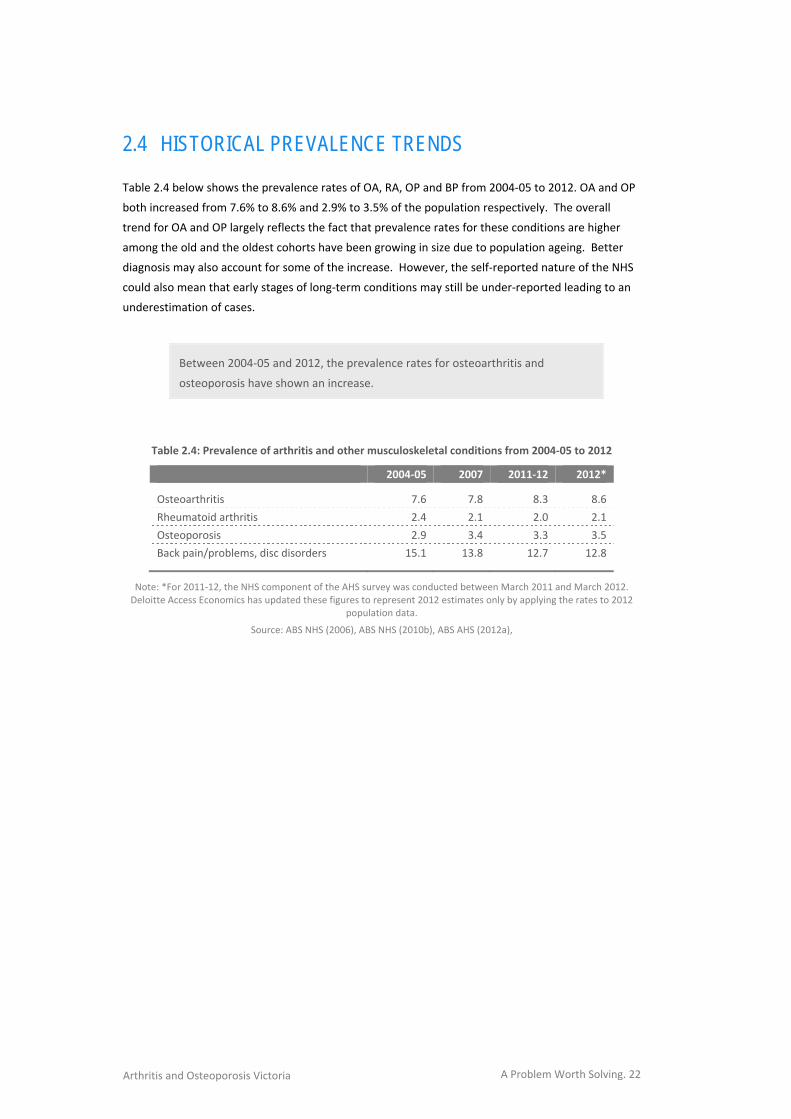
2.4 HISTORICAL PREVALENCE TRENDS Table 2.4 below shows the prevalence rates of OA, RA, OP and BP from 2004‐05 to 2012. OA and OP
both increased from 7.6% to 8.6% and 2.9% to 3.5% of the population respectively. The overall
trend for OA and OP largely reflects the fact that prevalence rates for these conditions are higher
among the old and the oldest cohorts have been growing in size due to population ageing. Better
diagnosis may also account for some of the increase. However, the self‐reported nature of the NHS
could also mean that early stages of long‐term conditions may still be under‐reported leading to an
underestimation of cases.
Between 2004‐05 and 2012, the prevalence rates for osteoarthritis and
osteoporosis have shown an increase.
Table 2.4: Prevalence of arthritis and other musculoskeletal conditions from 2004‐05 to 2012
2004‐05 2007 2011‐12 2012*
Osteoarthritis 7.6 7.8 8.3 8.6
Rheumatoid arthritis 2.4 2.1 2.0 2.1
Osteoporosis 2.9 3.4 3.3 3.5
Back pain/problems, disc disorders 15.1 13.8 12.7 12.8
Note: *For 2011‐12, the NHS component of the AHS survey was conducted between March 2011 and March 2012. Deloitte Access Economics has updated these figures to represent 2012 estimates only by applying the rates to 2012
population data.
Source: ABS NHS (2006), ABS NHS (2010b), ABS AHS (2012a),
A Problem Worth Solving. 23 Arthritis and Osteoporosis Victoria
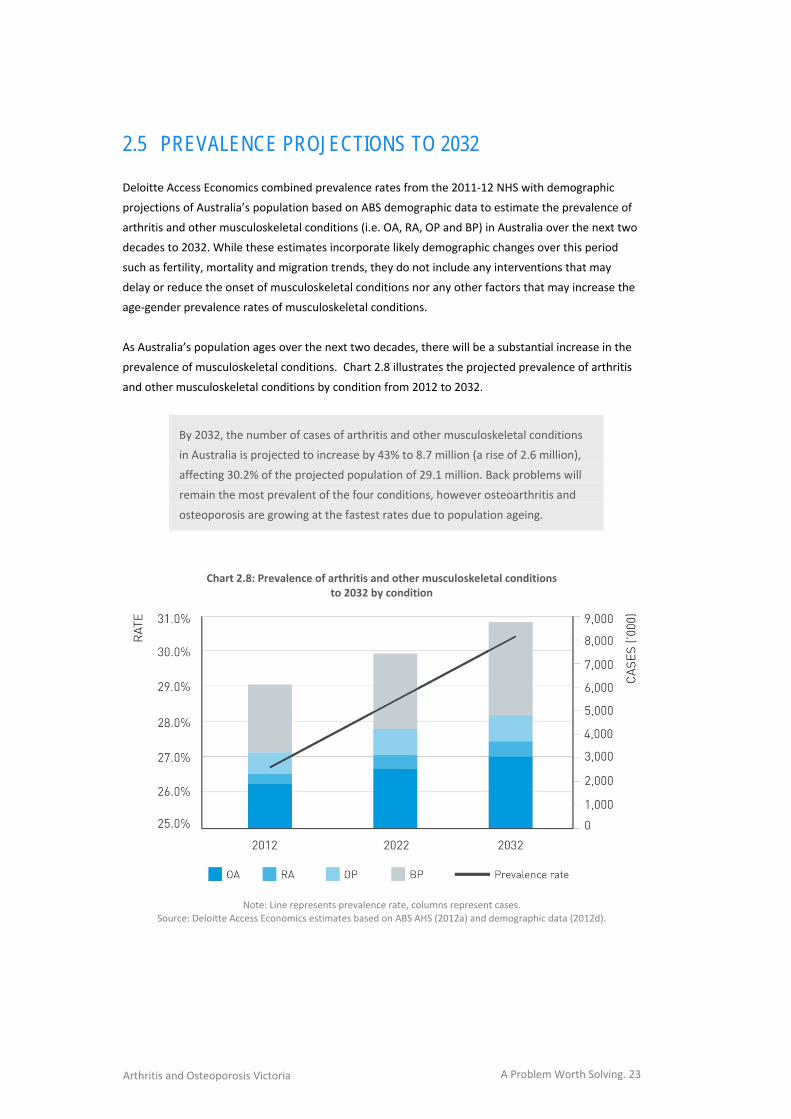
2.5 PREVALENCE PROJECTIONS TO 2032 Deloitte Access Economics combined prevalence rates from the 2011‐12 NHS with demographic
projections of Australia’s population based on ABS demographic data to estimate the prevalence of
arthritis and other musculoskeletal conditions (i.e. OA, RA, OP and BP) in Australia over the next two
decades to 2032. While these estimates incorporate likely demographic changes over this period
such as fertility, mortality and migration trends, they do not include any interventions that may
delay or reduce the onset of musculoskeletal conditions nor any other factors that may increase the
age‐gender prevalence rates of musculoskeletal conditions.
As Australia’s population ages over the next two decades, there will be a substantial increase in the
prevalence of musculoskeletal conditions. Chart 2.8 illustrates the projected prevalence of arthritis
and other musculoskeletal conditions by condition from 2012 to 2032.
By 2032, the number of cases of arthritis and other musculoskeletal conditions
in Australia is projected to increase by 43% to 8.7 million (a rise of 2.6 million),
affecting 30.2% of the projected population of 29.1 million. Back problems will
remain the most prevalent of the four conditions, however osteoarthritis and
osteoporosis are growing at the fastest rates due to population ageing.
Chart 2.8: Prevalence of arthritis and other musculoskeletal conditions
to 2032 by condition
Note: Line represents prevalence rate, columns represent cases.
Source: Deloitte Access Economics estimates based on ABS AHS (2012a) and demographic data (2012d).
A Problem Worth Solving. 24 Arthritis and Osteoporosis Victoria
Projections to 2032 by condition are as follows:
The number of Australians with OA is projected to increase by 58% to 3.0 million – a rise of 1.1
million people.
The number of Australians with OP is projected to increase by 50% to 1.2 million – a rise of 0.4
million people.
The number of Australians with RA is projected to increase by 40% to 0.7 million – a rise of 0.2
million people.
The number of Australians with BP is projected to increase by 31% to 3.8 million – a rise of 0.9
million people.
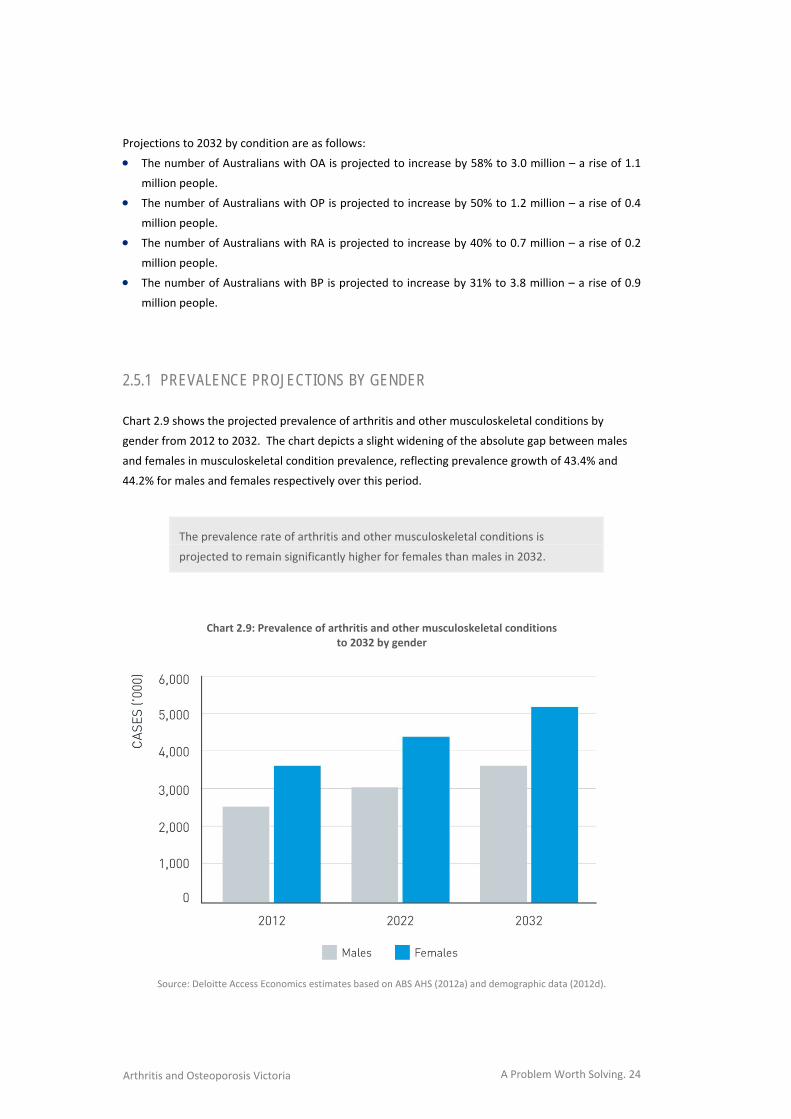
2.5.1 PREVALENCE PROJECTIONS BY GENDER Chart 2.9 shows the projected prevalence of arthritis and other musculoskeletal conditions by
gender from 2012 to 2032. The chart depicts a slight widening of the absolute gap between males
and females in musculoskeletal condition prevalence, reflecting prevalence growth of 43.4% and
44.2% for males and females respectively over this period.
The prevalence rate of arthritis and other musculoskeletal conditions is
projected to remain significantly higher for females than males in 2032.
Chart 2.9: Prevalence of arthritis and other musculoskeletal conditions
to 2032 by gender
Source: Deloitte Access Economics estimates based on ABS AHS (2012a) and demographic data (2012d).
A Problem Worth Solving. 25 Arthritis and Osteoporosis Victoria
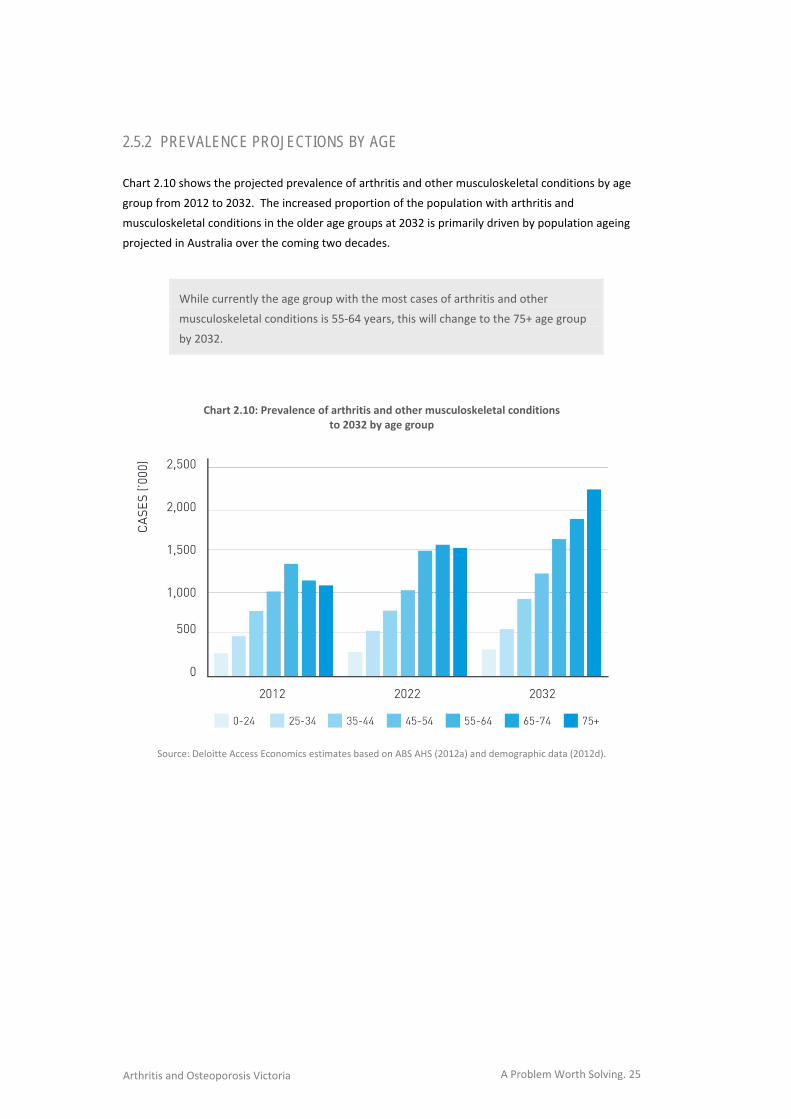
2.5.2 PREVALENCE PROJECTIONS BY AGE Chart 2.10 shows the projected prevalence of arthritis and other musculoskeletal conditions by age
group from 2012 to 2032. The increased proportion of the population with arthritis and
musculoskeletal conditions in the older age groups at 2032 is primarily driven by population ageing
projected in Australia over the coming two decades.
While currently the age group with the most cases of arthritis and other
musculoskeletal conditions is 55‐64 years, this will change to the 75+ age group
by 2032.
Chart 2.10: Prevalence of arthritis and other musculoskeletal conditions
to 2032 by age group
Source: Deloitte Access Economics estimates based on ABS AHS (2012a) and demographic data (2012d).

A Problem Worth Solving. 26 Arthritis and Osteoporosis Victoria
A Problem Worth Solving. 27 Arthritis and Osteoporosis Victoria
3 ECONOMIC IMPACT
INSERT CHAPTER 3 ART
In view of the prevalence of arthritis and other
musculoskeletal conditions, the economic impacts
are of considerable magnitude. This section
estimates the size and nature of the impacts –
which consist of health costs, other financial costs
(including productivity losses) and the burden of
disease (loss of wellbeing).
ECONOMIC IMPACT
3.

A Problem Worth Solving. 28 Arthritis and Osteoporosis Victoria
A Problem Worth Solving. 29 Arthritis and Osteoporosis Victoria
3.1 HEALTH COSTS
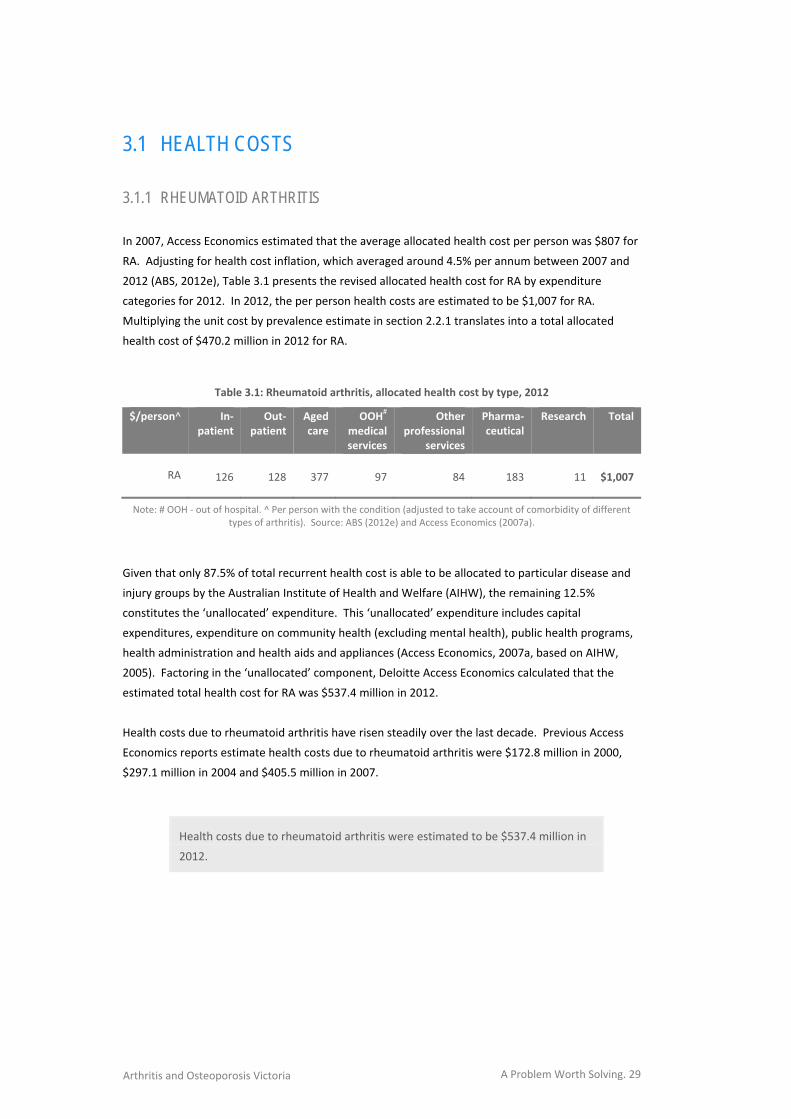
3.1.1 RHEUMATOID ARTHRITIS In 2007, Access Economics estimated that the average allocated health cost per person was $807 for
RA. Adjusting for health cost inflation, which averaged around 4.5% per annum between 2007 and
2012 (ABS, 2012e), Table 3.1 presents the revised allocated health cost for RA by expenditure
categories for 2012. In 2012, the per person health costs are estimated to be $1,007 for RA.
Multiplying the unit cost by prevalence estimate in section 2.2.1 translates into a total allocated
health cost of $470.2 million in 2012 for RA.
Table 3.1: Rheumatoid arthritis, allocated health cost by type, 2012
$/person^ In‐patient
Out‐patient
Aged care
OOH# medical services
Other professional
services
Pharma‐ceutical
Research Total
RA 126 128 377 97 84 183 11 $1,007
Note: # OOH ‐ out of hospital. ^ Per person with the condition (adjusted to take account of comorbidity of different types of arthritis). Source: ABS (2012e) and Access Economics (2007a).
Given that only 87.5% of total recurrent health cost is able to be allocated to particular disease and
injury groups by the Australian Institute of Health and Welfare (AIHW), the remaining 12.5%
constitutes the ‘unallocated’ expenditure. This ‘unallocated’ expenditure includes capital
expenditures, expenditure on community health (excluding mental health), public health programs,
health administration and health aids and appliances (Access Economics, 2007a, based on AIHW,
2005). Factoring in the ‘unallocated’ component, Deloitte Access Economics calculated that the
estimated total health cost for RA was $537.4 million in 2012.
Health costs due to rheumatoid arthritis have risen steadily over the last decade. Previous Access
Economics reports estimate health costs due to rheumatoid arthritis were $172.8 million in 2000,
$297.1 million in 2004 and $405.5 million in 2007.
Health costs due to rheumatoid arthritis were estimated to be $537.4 million in
2012.
A Problem Worth Solving. 30 Arthritis and Osteoporosis Victoria
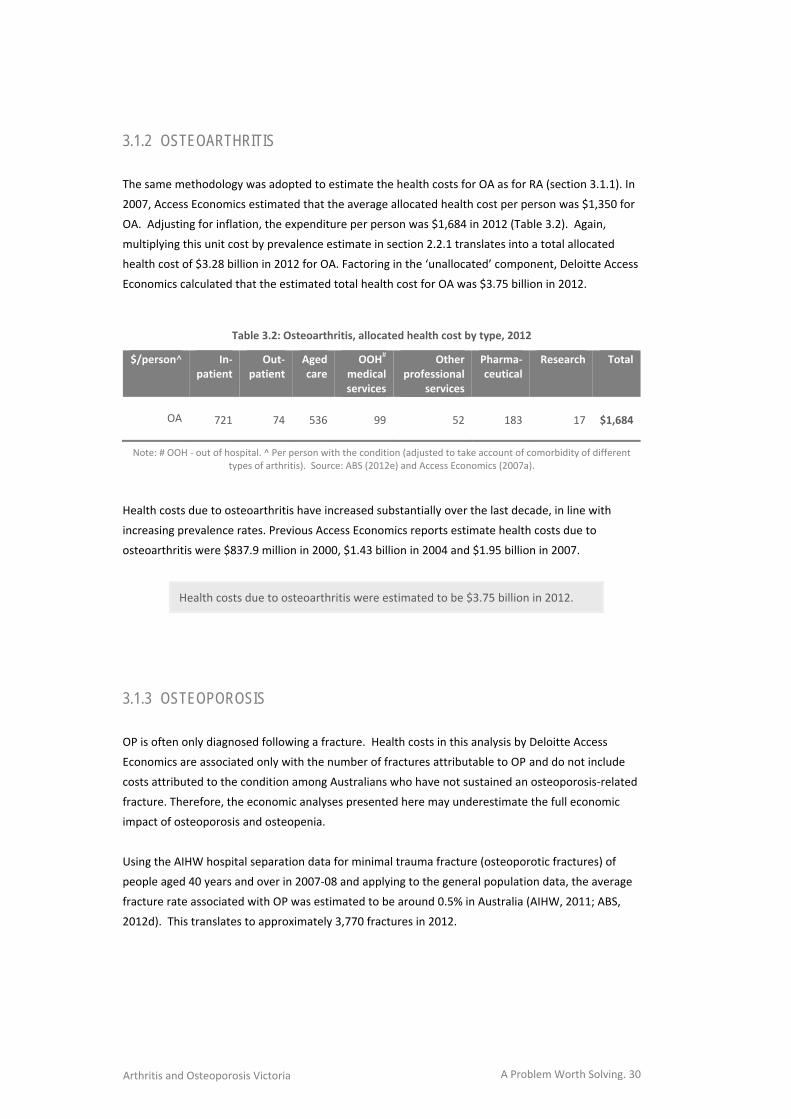
3.1.2 OSTEOARTHRITIS The same methodology was adopted to estimate the health costs for OA as for RA (section 3.1.1). In
2007, Access Economics estimated that the average allocated health cost per person was $1,350 for
OA. Adjusting for inflation, the expenditure per person was $1,684 in 2012 (Table 3.2). Again,
multiplying this unit cost by prevalence estimate in section 2.2.1 translates into a total allocated
health cost of $3.28 billion in 2012 for OA. Factoring in the ‘unallocated’ component, Deloitte Access
Economics calculated that the estimated total health cost for OA was $3.75 billion in 2012.
Table 3.2: Osteoarthritis, allocated health cost by type, 2012
$/person^ In‐patient
Out‐patient
Aged care
OOH# medical services
Other professional
services
Pharma‐ceutical
Research Total
OA 721 74 536 99 52 183 17 $1,684
Note: # OOH ‐ out of hospital. ^ Per person with the condition (adjusted to take account of comorbidity of different types of arthritis). Source: ABS (2012e) and Access Economics (2007a).
Health costs due to osteoarthritis have increased substantially over the last decade, in line with
increasing prevalence rates. Previous Access Economics reports estimate health costs due to
osteoarthritis were $837.9 million in 2000, $1.43 billion in 2004 and $1.95 billion in 2007.
Health costs due to osteoarthritis were estimated to be $3.75 billion in 2012.
3.1.3 OSTEOPOROSIS OP is often only diagnosed following a fracture. Health costs in this analysis by Deloitte Access
Economics are associated only with the number of fractures attributable to OP and do not include
costs attributed to the condition among Australians who have not sustained an osteoporosis‐related
fracture. Therefore, the economic analyses presented here may underestimate the full economic
impact of osteoporosis and osteopenia.
Using the AIHW hospital separation data for minimal trauma fracture (osteoporotic fractures) of
people aged 40 years and over in 2007‐08 and applying to the general population data, the average
fracture rate associated with OP was estimated to be around 0.5% in Australia (AIHW, 2011; ABS,
2012d). This translates to approximately 3,770 fractures in 2012.
A Problem Worth Solving. 31 Arthritis and Osteoporosis Victoria
As established in previous reports, the largest health cost components are likely to be acute
hospitalisation, admission to residential aged care and rehabilitation (Access Economics, 2006 and
2010). Additional costs relating to diagnostic imaging, medications and supplements are also
estimated in this report.
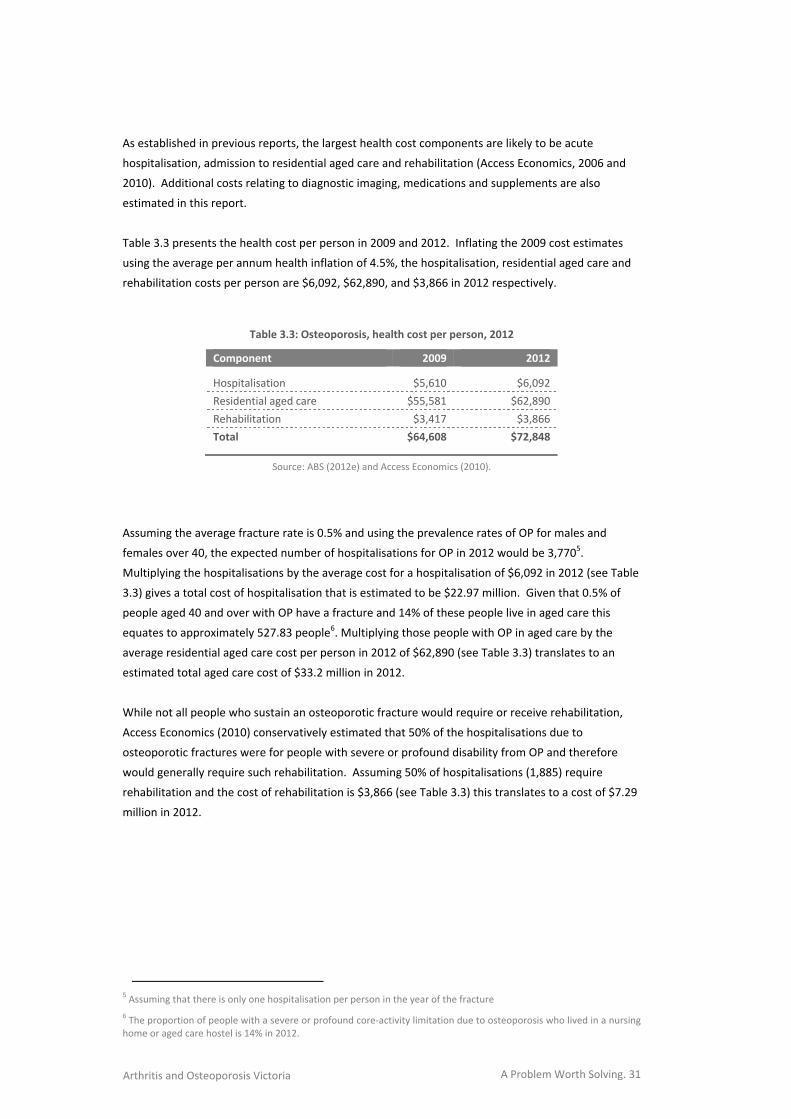
Table 3.3 presents the health cost per person in 2009 and 2012. Inflating the 2009 cost estimates
using the average per annum health inflation of 4.5%, the hospitalisation, residential aged care and
rehabilitation costs per person are $6,092, $62,890, and $3,866 in 2012 respectively.
Table 3.3: Osteoporosis, health cost per person, 2012
Component 2009 2012
Hospitalisation $5,610 $6,092
Residential aged care $55,581 $62,890
Rehabilitation $3,417 $3,866
Total $64,608 $72,848
Source: ABS (2012e) and Access Economics (2010).
Assuming the average fracture rate is 0.5% and using the prevalence rates of OP for males and
females over 40, the expected number of hospitalisations for OP in 2012 would be 3,7705.
Multiplying the hospitalisations by the average cost for a hospitalisation of $6,092 in 2012 (see Table
3.3) gives a total cost of hospitalisation that is estimated to be $22.97 million. Given that 0.5% of
people aged 40 and over with OP have a fracture and 14% of these people live in aged care this
equates to approximately 527.83 people6. Multiplying those people with OP in aged care by the
average residential aged care cost per person in 2012 of $62,890 (see Table 3.3) translates to an
estimated total aged care cost of $33.2 million in 2012.
While not all people who sustain an osteoporotic fracture would require or receive rehabilitation,
Access Economics (2010) conservatively estimated that 50% of the hospitalisations due to
osteoporotic fractures were for people with severe or profound disability from OP and therefore
would generally require such rehabilitation. Assuming 50% of hospitalisations (1,885) require
rehabilitation and the cost of rehabilitation is $3,866 (see Table 3.3) this translates to a cost of $7.29
million in 2012.
5 Assuming that there is only one hospitalisation per person in the year of the fracture
6 The proportion of people with a severe or profound core‐activity limitation due to osteoporosis who lived in a nursing home or aged care hostel is 14% in 2012.
A Problem Worth Solving. 32 Arthritis and Osteoporosis Victoria
Other health costs for OP relate to diagnostic imaging, medication and supplements. Dual energy x‐
ray absorptiometry (DEXA) is a means of measuring bone mineral density, which is a measure of
fracture risk. Each standard deviation decrease in bone mineral density is associated with an
approximately twofold increase in the risk of fracture (Access Economics, 2008a). The average cost
of a DEXA scan was $130.28 in 2008 (Access Economics, 2008a) which is equivalent to $155.04 in
2012 dollars. Assuming all fractures that occurred (i.e. 3,770) require at least one DEXA scan, this
would mean that the cost of imaging is $0.58 million.
The most relevant types of medications and supplements for people with OP are bisphosphonates,
vitamin D and calcium. Access Economics (2008a) indicated that the cost of bisphosphonates,
vitamin D and calcium was $726.407 per year in 2008. Adjusted for inflation to 2012, the unit cost
was $864.47 in 2012. Multiplying these costs by the percentage of those who reported in the NHS
that they used bisphosphonates, vitamin D and calcium8 and by the prevalence rates of OP translates
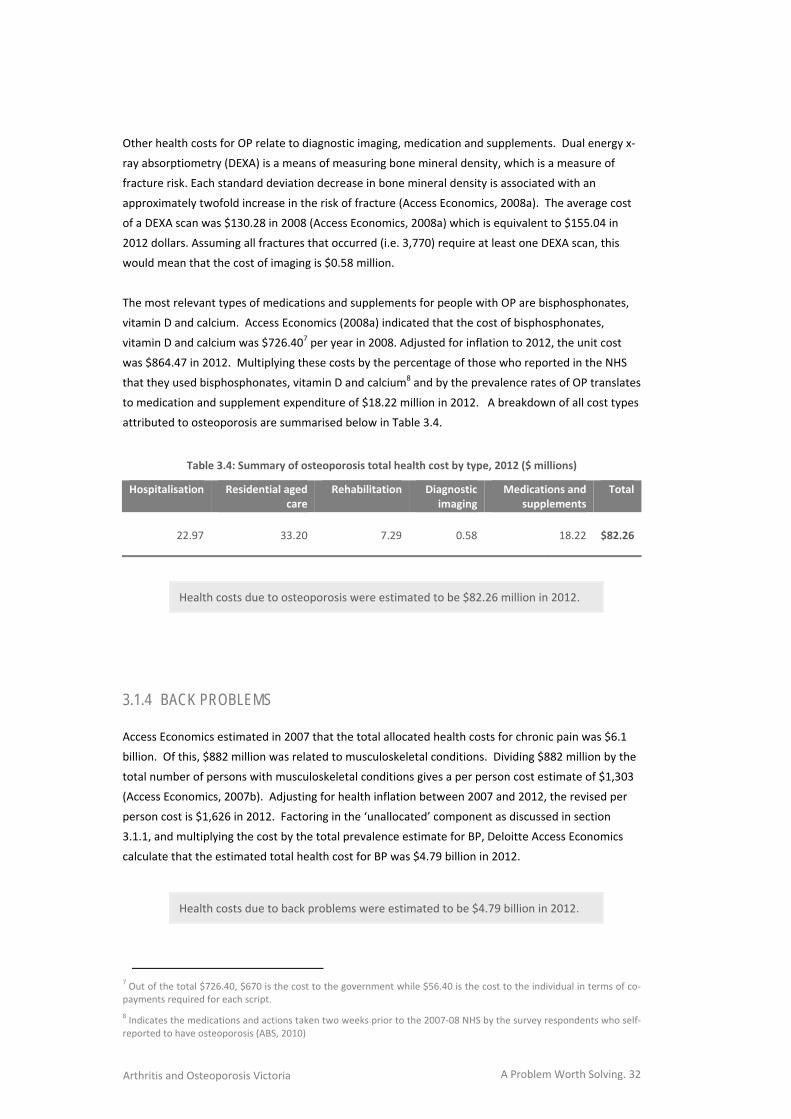
to medication and supplement expenditure of $18.22 million in 2012. A breakdown of all cost types
attributed to osteoporosis are summarised below in Table 3.4.
Table 3.4: Summary of osteoporosis total health cost by type, 2012 ($ millions)
Hospitalisation Residential aged care
Rehabilitation Diagnostic imaging
Medications and supplements
Total
22.97 33.20 7.29 0.58 18.22 $82.26
Health costs due to osteoporosis were estimated to be $82.26 million in 2012.
3.1.4 BACK PROBLEMS
Access Economics estimated in 2007 that the total allocated health costs for chronic pain was $6.1
billion. Of this, $882 million was related to musculoskeletal conditions. Dividing $882 million by the
total number of persons with musculoskeletal conditions gives a per person cost estimate of $1,303
(Access Economics, 2007b). Adjusting for health inflation between 2007 and 2012, the revised per
person cost is $1,626 in 2012. Factoring in the ‘unallocated’ component as discussed in section
3.1.1, and multiplying the cost by the total prevalence estimate for BP, Deloitte Access Economics
calculate that the estimated total health cost for BP was $4.79 billion in 2012.
Health costs due to back problems were estimated to be $4.79 billion in 2012.
7 Out of the total $726.40, $670 is the cost to the government while $56.40 is the cost to the individual in terms of co‐payments required for each script.
8 Indicates the medications and actions taken two weeks prior to the 2007‐08 NHS by the survey respondents who self‐reported to have osteoporosis (ABS, 2010)
A Problem Worth Solving. 33 Arthritis and Osteoporosis Victoria
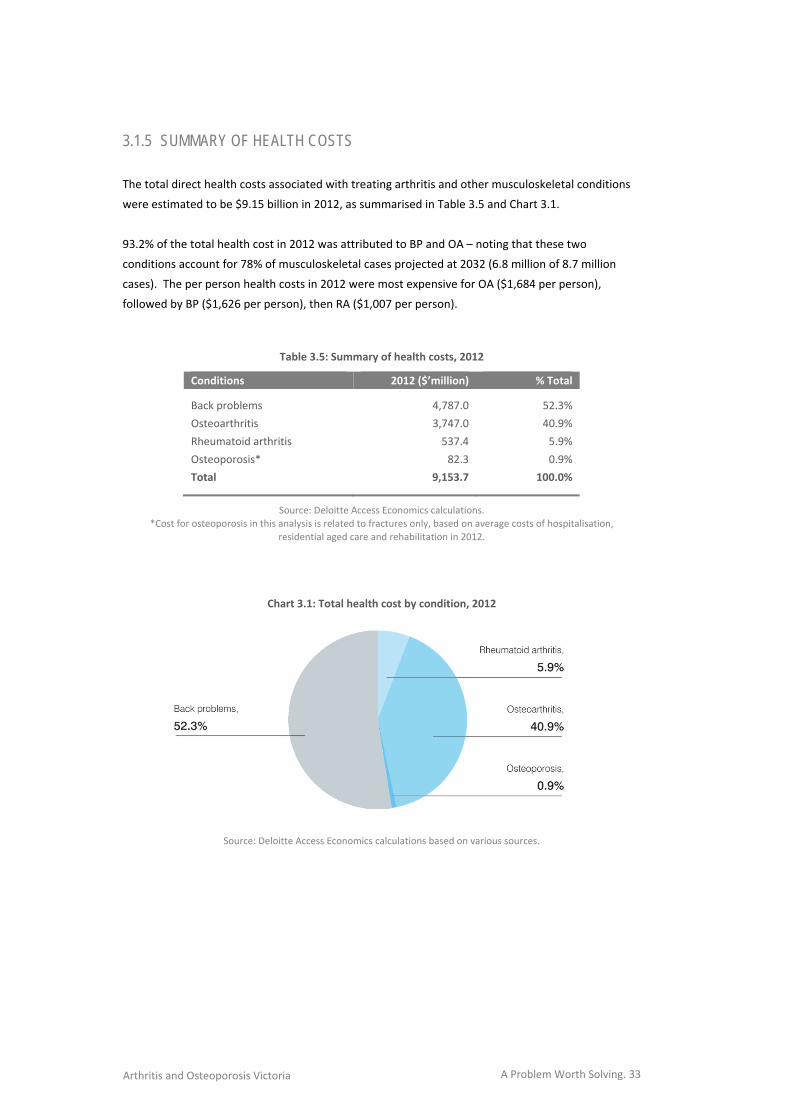
3.1.5 SUMMARY OF HEALTH COSTS The total direct health costs associated with treating arthritis and other musculoskeletal conditions
were estimated to be $9.15 billion in 2012, as summarised in Table 3.5 and Chart 3.1.
93.2% of the total health cost in 2012 was attributed to BP and OA – noting that these two
conditions account for 78% of musculoskeletal cases projected at 2032 (6.8 million of 8.7 million
cases). The per person health costs in 2012 were most expensive for OA ($1,684 per person),
followed by BP ($1,626 per person), then RA ($1,007 per person).
Table 3.5: Summary of health costs, 2012
Conditions 2012 ($’million) % Total
Back problems 4,787.0 52.3%
Osteoarthritis 3,747.0 40.9%
Rheumatoid arthritis 537.4 5.9%
Osteoporosis* 82.3 0.9%
Total 9,153.7 100.0%
Source: Deloitte Access Economics calculations.
*Cost for osteoporosis in this analysis is related to fractures only, based on average costs of hospitalisation,
residential aged care and rehabilitation in 2012.
Chart 3.1: Total health cost by condition, 2012
Source: Deloitte Access Economics calculations based on various sources.
A Problem Worth Solving. 34 Arthritis and Osteoporosis Victoria
3.2 OTHER FINANCIAL COSTS Other financial costs are all those that are not direct health costs (section 3.1) or associated with
burden of disease (section 3.3). Other financial costs include productivity losses (from a reduced
employment rate, absenteeism, presenteeism, premature death, superannuation loss and reduced
taxation revenue), as well as welfare payments, carer costs, aids and home modifications, travel
costs, program costs and deadweight efficiency loss from transfers.
It is important to make the economic distinction between real and transfer costs. Real costs use up
real resources, such as capital or labour, or reduce the economy’s overall capacity to produce goods
and services. Transfer costs involve payments from one economic agent to another that do not use
up real resources, for example, a disability support pension, or taxation revenue. Transfer costs are
important when adopting a whole‐of‐government approach to policy formulation and budgeting.
Measurement of indirect costs remains a matter of some debate and controversy. For the purposes
of this report, Deloitte Access Economics estimated two types of indirect costs of arthritis and other
musculoskeletal conditions.
Financial costs (this section) include lost production due to the impacts of arthritis and other
musculoskeletal conditions and the associated deadweight taxation losses, and other financial
costs e.g. carers, aids and home modifications for people with a disability.
Non‐financial costs (section 3.3) derive from loss of healthy life – the pain, premature death and
loss of life quality that result from arthritis and other musculoskeletal conditions. These are
more difficult to measure, but can be analysed in terms of the years of healthy life lost, both
quantitatively and qualitatively, known as the ‘burden of disease’, with an imputed value of a
‘statistical’ life so as to compare these costs with financial costs of arthritis and other
musculoskeletal conditions.
3.2.1 PRODUCTIVITY COSTS
Deloitte Access Economics measured the lost earnings and production due to health conditions using
a ‘human capital’ approach. The lower end of such estimates includes only the ‘friction’ period until
the worker can be replaced, which would be highly dependent on labour market conditions and
un(der)employment levels.
In an economy operating at near full capacity, as Australia is at present, a better estimate includes
costs of temporary work absences plus the discounted stream of lifetime earnings lost due to early
retirement from the workforce, reduced working hours (part‐time rather than full‐time) and
premature mortality, if any. In this case, it is likely that, in the absence of the disease, people with
arthritis and musculoskeletal conditions would participate in the labour force and obtain
employment at the same rate as other Australians, and earn the same average weekly earnings. The
implicit and probable economic assumption is that the numbers of such people would not be of
sufficient magnitude to substantially influence the overall clearing of the labour market.
A Problem Worth Solving. 35 Arthritis and Osteoporosis Victoria
Prior to estimating the productivity losses associated with arthritis and other musculoskeletal
conditions, it is important to consider the potential number of individuals with multiple
musculoskeletal conditions. As highlighted by the AIHW, people with musculoskeletal conditions
often have other diseases and long‐term conditions concurrently. This is mostly due to the co‐
occurrence of aged‐related problems or similar underlying disease processes and risk factors (AIHW,
2010).
Not considering that some individuals will have multiple musculoskeletal conditions could overstate
the impact on productivity losses due to these conditions. Consequently, the prevalent cases
estimated in section 2 are factored downward by the potential number of individuals who have
more than one musculoskeletal condition, with the maximum number of musculoskeletal
comorbidities set at four (that is, a person could have OA, RA, OP and BP concurrently).
The potential number of individuals with more than one musculoskeletal condition is estimated by
cross multiplying the prevalence rates for all the conditions by age and gender groups9. After
considering individuals with multiple musculoskeletal conditions, the prevalence estimate for people
aged 15 to 64 years with OA, RA, OP and BP is approximately 2.73 million in total (compared to 3.76
million prior to the adjustment).
3.2.1.1 REDUCED EMPLOYMENT RATE
Arthritis and other musculoskeletal conditions can have an impact on a person’s capacity to work. If
employment rates are lower for people with arthritis and other musculoskeletal conditions relative
to the general population, this loss in productivity constitutes a real cost to the economy.
Data on employment rates is available in the Survey of Disability, Ageing and Carers (SDAC) ‐ a
national survey conducted by the ABS throughout Australia. The primary objective of the SDAC is to
collect detailed information about three population groups:
people with a disability;
older people (i.e. those aged 60 years and over); and
people who provide assistance to older people and people with disabilities.
The SDAC also collects information on people who are not in these populations, allowing for
comparison of their relative demographic and socioeconomic situations. In addition to people living
in private dwellings, those in care accommodation (such as residential aged care facilities) are also
surveyed. Data on long‐term health conditions is based on self‐identification rather than clinical
diagnosis and time elapsed since diagnosis is not reported.
9 Specifically, the formula is as follows: Overall prevalence rate by age and gender minus (RA*OA) – (RA*OP) – (RA*BP) – (OA*OP) – (OA*BP) – (OP*BP) – (RA*OA*OP) – (OA*OP*BP) – (RA*OP*BP) – (RA*OA*BP) – (RA*OA*OP*BP) where RA, OA, OP and BP stand for their respective prevalence rates.
A Problem Worth Solving. 36 Arthritis and Osteoporosis Victoria
The survey uses questions about activity limitation to screen respondents before asking questions
about conditions present, and thus may miss people with arthritis and other musculoskeletal
conditions without activity limitation – for example those in the very early stages of diagnosis, and
those who have finished their treatment regimes. Consequently the SDAC estimate of prevalence is
more likely to identify people currently undergoing treatment.
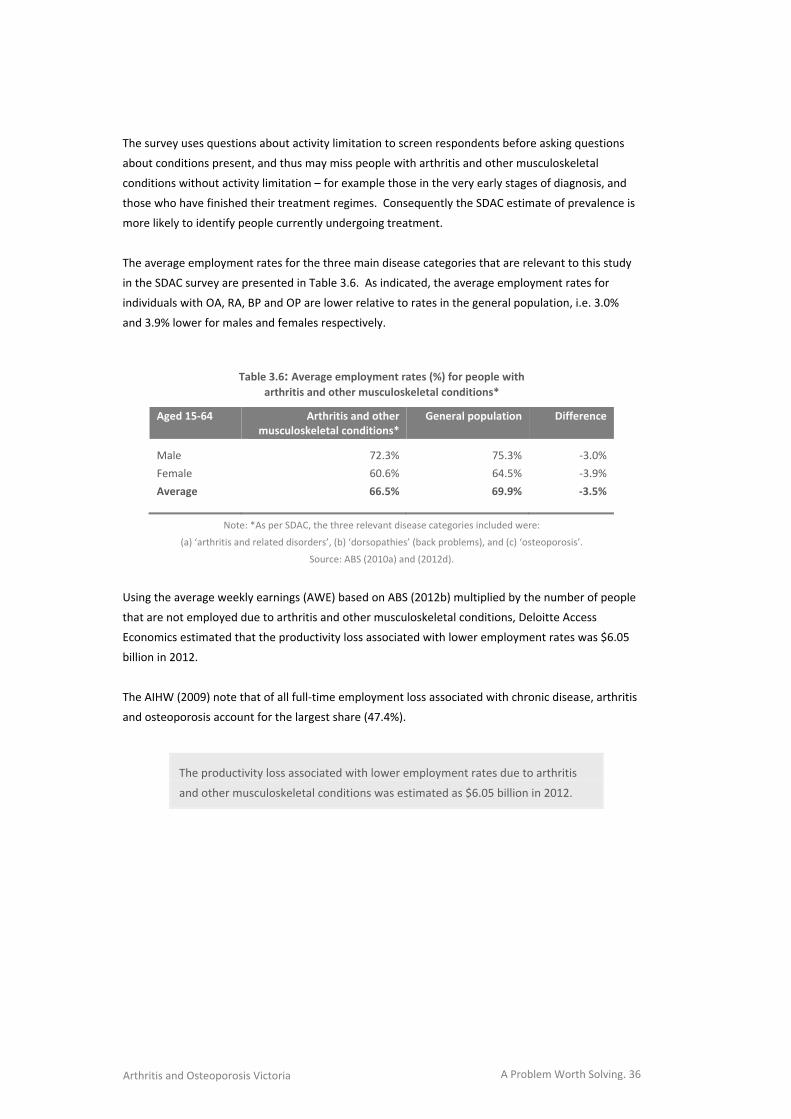
The average employment rates for the three main disease categories that are relevant to this study
in the SDAC survey are presented in Table 3.6. As indicated, the average employment rates for
individuals with OA, RA, BP and OP are lower relative to rates in the general population, i.e. 3.0%
and 3.9% lower for males and females respectively.
Table 3.6: Average employment rates (%) for people with
arthritis and other musculoskeletal conditions*
Aged 15‐64 Arthritis and other musculoskeletal conditions*
General population Difference
Male 72.3% 75.3% ‐3.0%
Female 60.6% 64.5% ‐3.9%
Average 66.5% 69.9% ‐3.5%
Note: *As per SDAC, the three relevant disease categories included were:
(a) ‘arthritis and related disorders’, (b) ‘dorsopathies’ (back problems), and (c) ‘osteoporosis’.
Source: ABS (2010a) and (2012d).
Using the average weekly earnings (AWE) based on ABS (2012b) multiplied by the number of people
that are not employed due to arthritis and other musculoskeletal conditions, Deloitte Access
Economics estimated that the productivity loss associated with lower employment rates was $6.05
billion in 2012.
The AIHW (2009) note that of all full‐time employment loss associated with chronic disease, arthritis
and osteoporosis account for the largest share (47.4%).
The productivity loss associated with lower employment rates due to arthritis
and other musculoskeletal conditions was estimated as $6.05 billion in 2012.
A Problem Worth Solving. 37 Arthritis and Osteoporosis Victoria
3.2.1.2 ABSENTEEISM
Some people will remain in the workforce in the early stages of arthritis and other musculoskeletal
conditions, either because they are not yet diagnosed or because they need or want to continue to
work. Remaining in employment is more likely if the illness is in the early stages, if the work
environment is supportive, if tasks are familiar or repetitive, and if supervision and occupational
health and safety arrangements are adequate. These people may, however, be absent from work
more often than those without musculoskeletal conditions as a result of their condition – because
they need to take time off for medical appointments, to organise their affairs, or because of their
symptoms, which may be episodic (e.g. inflammatory arthritis). This absenteeism represents further
productivity losses.
According to AIHW (2009), people with chronic disease averaged nearly half a day (0.48) off work in
the previous fortnight compared with a quarter of a day (0.25) for people without chronic disease.
This translates to a total loss of 8.10 and 4.32 days per annum for males and females respectively.
AIHW (2009) also showed that the average days away for males were slightly higher than females,
0.55 versus 0.41, although there was no clear pattern by age. Because of a lack of specific literature,
the above is used to proxy for the number of absence days due to arthritis and other
musculoskeletal conditions.
Converting the average fortnightly number of absence days to a yearly figure (i.e. multiplying by 26),
and multiplying by AWE and total prevalence estimates, Deloitte Access Economics estimated the
additional productivity losses due to absenteeism to be $301.1 million.
The productivity loss due to a higher level of absenteeism for individuals with
arthritis and other musculoskeletal conditions was estimated to be $301.1
million in 2012.
3.2.1.3 PRESENTEEISM
Presenteeism refers to lost productivity that occurs when workers come to work but, as a
consequence of illness or other medical conditions, are less productive than usual. It is clear that
presenteeism represents a problem to the employer and a cost to the economy. Econtech (2007)
conducted economic modelling of the cost of presenteeism in Australia, which revealed that the
overall productivity loss caused by presenteeism was about 2.54%, i.e. a loss of six working days per
worker per year for an average Australian worker. It was further estimated that the cost of
presenteeism amounted to $1,377 per employee per year for the top ten health conditions in 2007.
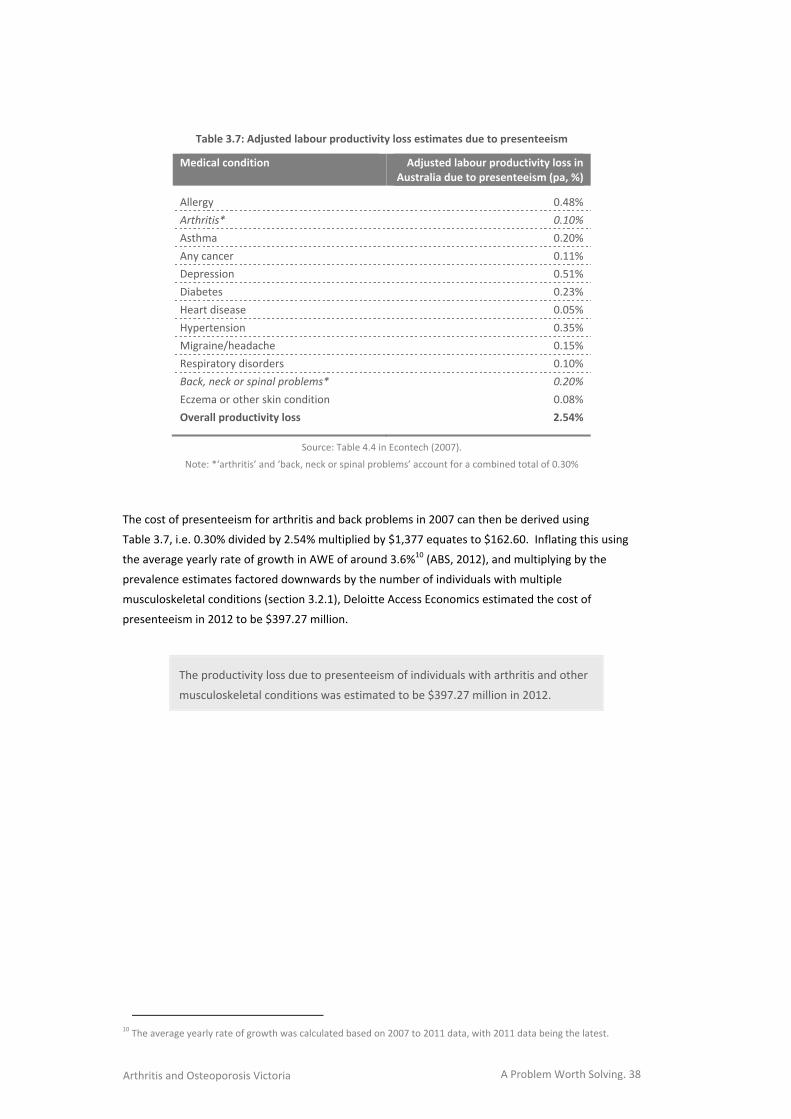
Table 3.7 illustrates the productivity losses due to presenteeism by conditions, as presented in
Table 4.4 of Econtech (2007).
A Problem Worth Solving. 38 Arthritis and Osteoporosis Victoria
Table 3.7: Adjusted labour productivity loss estimates due to presenteeism
Medical condition Adjusted labour productivity loss in Australia due to presenteeism (pa, %)
Allergy 0.48%
Arthritis* 0.10%
Asthma 0.20%
Any cancer 0.11%
Depression 0.51%
Diabetes 0.23%
Heart disease 0.05%
Hypertension 0.35%
Migraine/headache 0.15%
Respiratory disorders 0.10%
Back, neck or spinal problems* 0.20%
Eczema or other skin condition 0.08%
Overall productivity loss 2.54%
Source: Table 4.4 in Econtech (2007).
Note: *‘arthritis’ and ‘back, neck or spinal problems’ account for a combined total of 0.30%
The cost of presenteeism for arthritis and back problems in 2007 can then be derived using
Table 3.7, i.e. 0.30% divided by 2.54% multiplied by $1,377 equates to $162.60. Inflating this using
the average yearly rate of growth in AWE of around 3.6%10 (ABS, 2012), and multiplying by the
prevalence estimates factored downwards by the number of individuals with multiple
musculoskeletal conditions (section 3.2.1), Deloitte Access Economics estimated the cost of
presenteeism in 2012 to be $397.27 million.
The productivity loss due to presenteeism of individuals with arthritis and other
musculoskeletal conditions was estimated to be $397.27 million in 2012.
10 The average yearly rate of growth was calculated based on 2007 to 2011 data, with 2011 data being the latest.
A Problem Worth Solving. 39 Arthritis and Osteoporosis Victoria
3.2.1.4 PREMATURE DEATH
OA is a disease of low mortality and most deaths, of the few that do occur, result from complications
and comorbidities. Similarly, RA is seldom an underlying cause of death, but may be an associated
cause of death for conditions such as cardiovascular disorders, respiratory disorders and cancer
(Access Economics, 2007a). OP on the other hand can cause deaths directly due to osteoporotic
fractures although the portion is still relatively small (i.e. 0.4% of all deaths in Australia) (Access
Economics, 2010). For BP, Deloitte Access Economics adopted a conservative approach as per their
previous reports and hence did not attribute mortality costs to BP (Access Economics, 2007b). Based
on these calculations, and incorporating employment rates and estimates of average lifetime
earnings for different age groups, the present value of lost earnings due to mortality among those
who would otherwise have been employed is thus estimated.
The productivity loss arising from premature mortality associated with arthritis
and other musculoskeletal conditions was estimated to be $100.53 million in
2012.
3.2.1.5 LOST SUPERANNUATION
A worker is generally entitled to super guarantee contributions from an employer if the worker is
aged between 18 and 69 years old (inclusive) and paid $450 or more (before tax) in a month. For a
worker under 18 years of age, this worker must meet the above conditions and work more than 30
hours per week in order to be entitled to super contributions. Once a worker satisfies the eligibility
conditions, at least every three months his/her employer is required to pay a super contribution of a
minimum of 9% of the worker’s ordinary time earnings (Australian Tax Office, 2012)11.
To estimate the amount of lost superannuation, the minimum employer contribution rate of 9% is
applied to the estimated productivity losses from lower employment rates. Therefore, in 2012,
Deloitte Access Economics calculated that there is an estimated $544.42 million lost superannuation
associated with the loss of income due to lower employment rates for people with arthritis and
other musculoskeletal conditions. Reduced superannuation contributions may ultimately reduce
individuals’ retirement incomes and potentially lead to greater dependence on government funded
services later in life.
The lost superannuation due to arthritis and other musculoskeletal conditions
was estimated to be $544.42 million in 2012.
11 http://www.ato.gov.au/individuals/content.aspx?doc=/content/00250233.htm&page=3&H3
A Problem Worth Solving. 40 Arthritis and Osteoporosis Victoria
3.2.1.6 TAXATION REVENUE
Lower earnings due to a reduced employment rate, absenteeism, presenteeism and premature
death will also have an effect on taxation revenue collected by the government. As well as forgone
income (personal) taxation, there will also be a fall in indirect (consumption) tax, as those with lower
incomes spend less on the consumption of goods and services.
Personal income tax forgone is a product of the average personal income tax rate and the forgone
income. With musculoskeletal conditions and lower income, there will be less consumption of goods
and services, estimated up to the level of the disability pension. Without arthritis and other
musculoskeletal conditions, it is assumed that consumption would comprise 90% of income. This is a
conservative estimate and, in fact, the savings rate may well be lower. The indirect tax forgone is
estimated as a product of the forgone consumption and the average indirect tax rate, derived from
the Deloitte Access Economics macroeconomic model. Findings are summarised in Table 3.8.
Lost taxation revenue is considered a transfer payment, rather than an economic cost per se (as per
discussion in section 3.2). However, raising additional taxation revenues does impose real efficiency
costs on the Australian economy, known as deadweight loss (DWL). Administration of the taxation
system costs around 1.25% of revenue raised (derived from total amounts spent and revenue raised
in 2000‐01, relative to Commonwealth department running costs). An even larger DWL arises from
the distortionary impact of taxes on workers’ work and consumption choices. These distortionary
impacts are estimated to be 27.5% of each tax dollar collected (Lattimore, 1997 and used in
Productivity Commission, 2003:6.15‐6.16, with rationale).
Deloitte Access Economics estimated that $699 million in additional DWL was incurred in 2012, due
to the additional taxation required to replace that forgone due to lost productivity of people with
arthritis and other musculoskeletal conditions. Welfare payments made to people who are no
longer working must, in a budget‐neutral setting, also be funded by additional taxation. The total
DWL associated with arthritis and other musculoskeletal conditions is tallied in section 3.2.8.
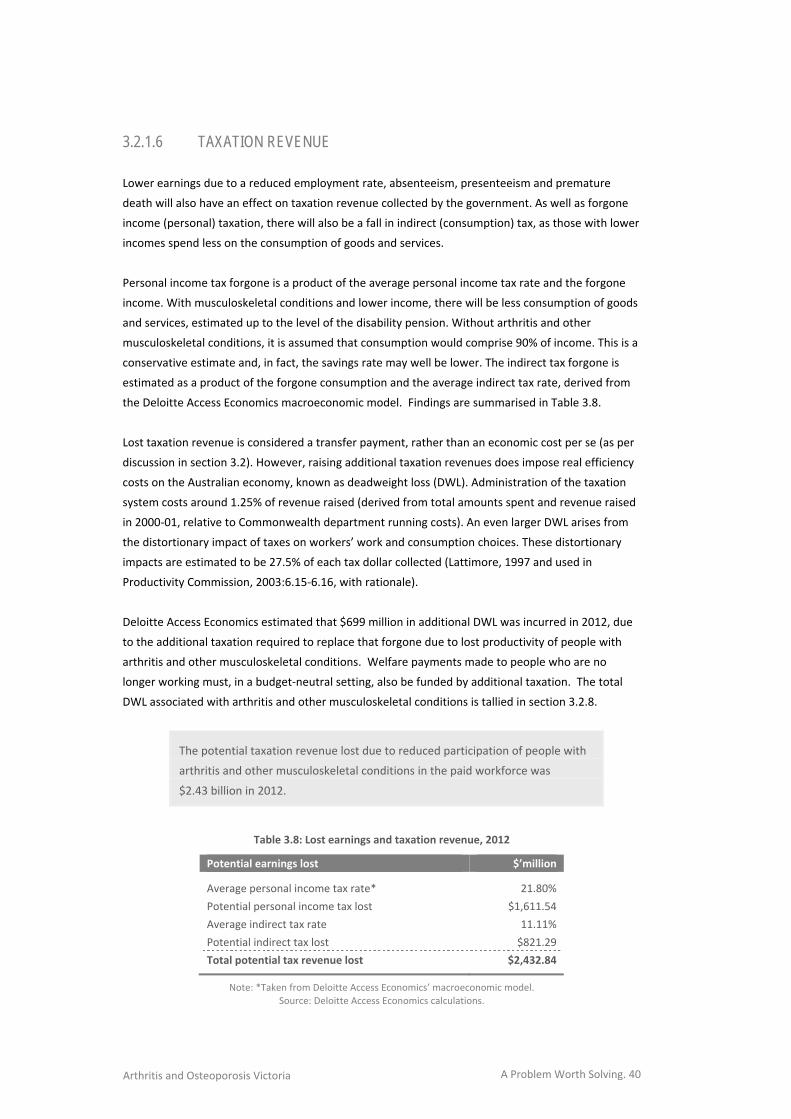
The potential taxation revenue lost due to reduced participation of people with
arthritis and other musculoskeletal conditions in the paid workforce was
$2.43 billion in 2012.
Table 3.8: Lost earnings and taxation revenue, 2012
Potential earnings lost $’million
Average personal income tax rate* 21.80%
Potential personal income tax lost $1,611.54
Average indirect tax rate 11.11%
Potential indirect tax lost $821.29
Total potential tax revenue lost $2,432.84
Note: *Taken from Deloitte Access Economics’ macroeconomic model. Source: Deloitte Access Economics calculations.
A Problem Worth Solving. 41 Arthritis and Osteoporosis Victoria
3.2.2 CARER COSTS
Carers are people who provide informal care to others in need of assistance or support. For
example, carers may take time off work to accompany people with arthritis and other
musculoskeletal conditions to medical appointments, stay with them in hospital, or care for them at
home. Carers may also take time off work to undertake many of the unpaid tasks that the person
with a musculoskeletal condition would do if they did not have a musculoskeletal condition and
were able to do these tasks.
Informal care is distinguished from services provided by people employed in the health and
community sectors (formal care) because the care is generally provided free of charge to the
recipient and is not regulated by the government. Most informal carers are family or friends of the
person receiving care.
While informal care is provided free of charge, it is not free in an economic sense, as time spent
caring is time that cannot be directed to other activities such as paid work, unpaid work (such as
housework or yard work) or leisure. As such, informal care is a use of economic resources.
Deloitte Access Economics has adopted the opportunity cost method – the value of lost wages
forgone by the carer – in this report. This method provides the most accurate estimate of carer
costs, and can be adopted since sufficient demographic data on providers of care for people with
arthritis and other musculoskeletal conditions are available.
Data from the 2009 SDAC identified 129,117 carers who reported themselves as the primary carer of
a person whose main condition was ‘arthritis and related disorders’, ‘dorsopathies’ (back problems),
or ‘osteoporosis’. Of these, 46% were providing less than 20 hours of care per week on average, 20%
between 20 and 40 hours and 32% more than 40 hours. The remaining 2% did not state the number
of hours of care provided12. Based on these findings and incorporating age‐gender AWEs in Australia,
Deloitte Access Economics estimated the total cost of informal care for people with arthritis and
other musculoskeletal conditions as $1.21 billion in 2012.
The opportunity cost of care for people with arthritis and other musculoskeletal
conditions was estimated as $1.21 billion in 2012.
12 For the purpose of estimating the cost of carers, the following approach is taken: 10 hours, 29.5, and 50 hours per
week was imputed in the <20 hours, 20‐39 hours, and 40+ hours per week groups, respectively. Further, the lowest category, i.e. 10 hours per week was used to impute for those who did not state the number of hours per week.
A Problem Worth Solving. 42 Arthritis and Osteoporosis Victoria
3.2.3 FUNERAL COSTS
The ‘additional’ cost of funerals borne by family and friends of patients is based on the likelihood of
death in the “x” years due to arthritis and other musculoskeletal conditions. However, some
patients (particularly older patients) would have died during this time anyway. Eventually everyone
must die and thus incur funeral expenses – so the true cost is the cost brought forward (adjusted for
the likelihood of dying anyway in a given year). The Bureau of Transport Economics (2000)
calculated a weighted average cost of a funeral across all States and Territories, to estimate an
Australian total average cost of $3,200 per person for 1996, or $4,946 per person in 2007.
Funeral costs associated with premature death due to arthritis and other
musculoskeletal conditions were estimated as $3.91 million in 2012.
3.2.4 WELFARE PAYMENTS
Transfer payments represent a shift of resources from one economic entity to another (as discussed
in section 3.2). The act of taxation and redistribution creates distortions and inefficiencies in the
economy, so transfers also involve real net costs to the economy. Access Economics (2007a)
reported the number of individuals with arthritis (includes RA, OA and other arthritis conditions)
who received welfare payments. For the purpose of this report, the number of individuals with RA
and OA was proportioned according to their prevalence estimates in 2007 and inflated using the
prevalence growth of RA and OA between 2007 and 2012.
A similar approach was used to derive the number of individuals with BP based on Access Economics
(2007b). Applying the most recent rate of payments for disability support pension, NewStart
allowance, and sickness allowance13, Deloitte Access Economics estimated the total value of welfare
payments to be $1.34 billion in 2012. There was no existing data available to base a cost estimate
for OP.
The value of welfare payments associated with osteoarthritis, rheumatoid
arthritis and back problems was estimated as $1.34 billion in 2012.
13 Based on a payment of $712 per fortnight for disability support pension, $492.60 for NewStart and sickness
allowance.
A Problem Worth Solving. 43 Arthritis and Osteoporosis Victoria
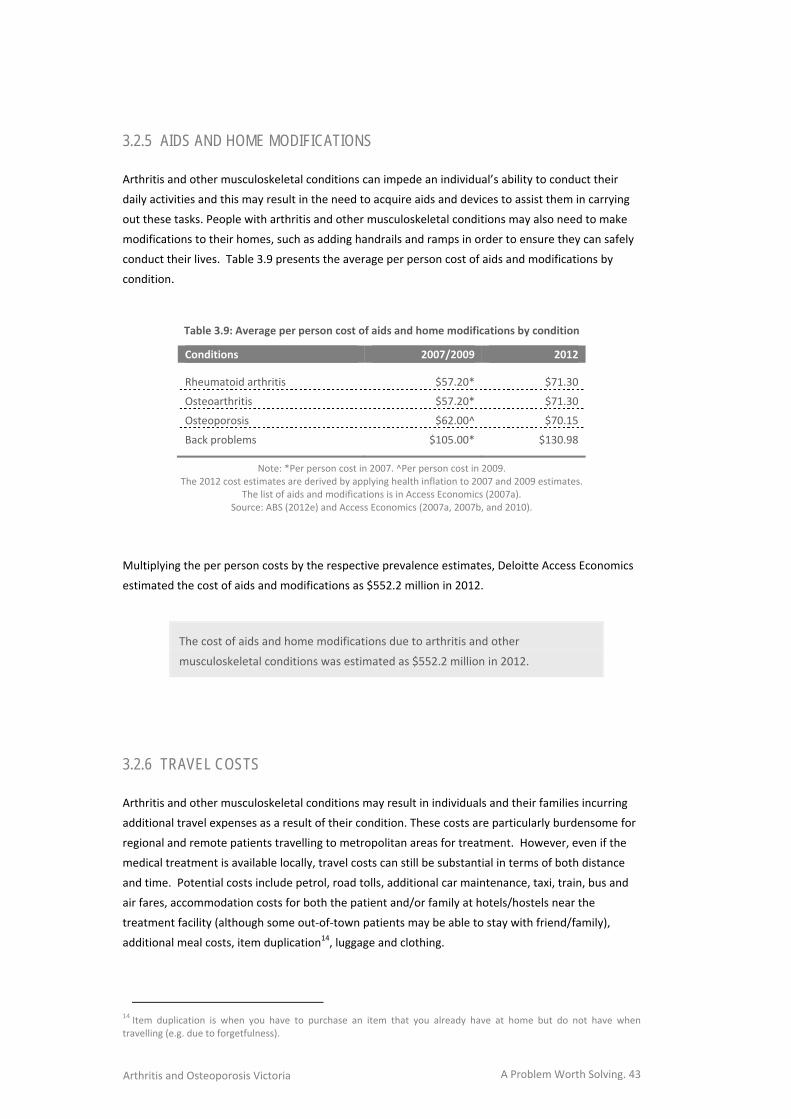
3.2.5 AIDS AND HOME MODIFICATIONS
Arthritis and other musculoskeletal conditions can impede an individual’s ability to conduct their
daily activities and this may result in the need to acquire aids and devices to assist them in carrying
out these tasks. People with arthritis and other musculoskeletal conditions may also need to make
modifications to their homes, such as adding handrails and ramps in order to ensure they can safely
conduct their lives. Table 3.9 presents the average per person cost of aids and modifications by
condition.
Table 3.9: Average per person cost of aids and home modifications by condition
Conditions 2007/2009 2012
Rheumatoid arthritis $57.20* $71.30
Osteoarthritis $57.20* $71.30
Osteoporosis $62.00^ $70.15
Back problems $105.00* $130.98
Note: *Per person cost in 2007. ^Per person cost in 2009. The 2012 cost estimates are derived by applying health inflation to 2007 and 2009 estimates.
The list of aids and modifications is in Access Economics (2007a). Source: ABS (2012e) and Access Economics (2007a, 2007b, and 2010).
Multiplying the per person costs by the respective prevalence estimates, Deloitte Access Economics
estimated the cost of aids and modifications as $552.2 million in 2012.
The cost of aids and home modifications due to arthritis and other
musculoskeletal conditions was estimated as $552.2 million in 2012.
3.2.6 TRAVEL COSTS
Arthritis and other musculoskeletal conditions may result in individuals and their families incurring
additional travel expenses as a result of their condition. These costs are particularly burdensome for
regional and remote patients travelling to metropolitan areas for treatment. However, even if the
medical treatment is available locally, travel costs can still be substantial in terms of both distance
and time. Potential costs include petrol, road tolls, additional car maintenance, taxi, train, bus and
air fares, accommodation costs for both the patient and/or family at hotels/hostels near the
treatment facility (although some out‐of‐town patients may be able to stay with friend/family),
additional meal costs, item duplication14, luggage and clothing.
14 Item duplication is when you have to purchase an item that you already have at home but do not have when
travelling (e.g. due to forgetfulness).
A Problem Worth Solving. 44 Arthritis and Osteoporosis Victoria
In 1999, Walsh and Chappell (1999) conducted a study on behalf of the Department of Family and
Community Services, surveying 409 recipients of Disability Support Pension who had musculoskeletal
impairment. Based on these findings, Access Economics (2005a) estimated that in 2004, the cost of
travel associated with their condition for people with arthritis (all types, including OA and RA) in
Australia was $88.1 million or around $26 for every person with arthritis.
In the absence of more recent analysis of the transport costs incurred by those with arthritis and
other musculoskeletal conditions as a result of their condition, Deloitte Access Economics has
estimated the 2012 costs (for OA and RA only) based on Walsh and Chappell’s unit costs, allowing for
inflation (no existing data were available on unit costs for OP or BP). Applying these unit costs to
2012 cases of OA and RA, the cost incurred as a result of travel associated with these conditions was
estimated as $78.6 million in 2012.
The travel costs attributed to osteoarthritis and rheumatoid arthritis were
estimated as $78.6 million in 2012.
3.2.7 PROGRAM COSTS
A number of community care programs are conducted in Australia to support older people and
people with a disability in conducting their daily lives. Examples include Extended Aged Care at
Home packages, Community Aged Care packages and the Home and Community Care program.
Access Economics reported that in 2007, the cost of these three government programs attributable
to arthritis (all types, including OA and RA) was estimated as $256 million. This translated to around
$66.60 per person. Inflating this to 2012 prices and multiplying by the prevalence estimates for RA
and OA only, Deloitte Access Economics estimated a total program cost of $200.6 million in 2012.
There was no existing data available on which to base a cost estimate for OP or BP.
The program costs (from Extended Aged Care at Home packages, Community
Aged Care packages and Home and Community Care) attributed to osteoarthritis
and rheumatoid arthritis were estimated as $200.6 million in 2012.
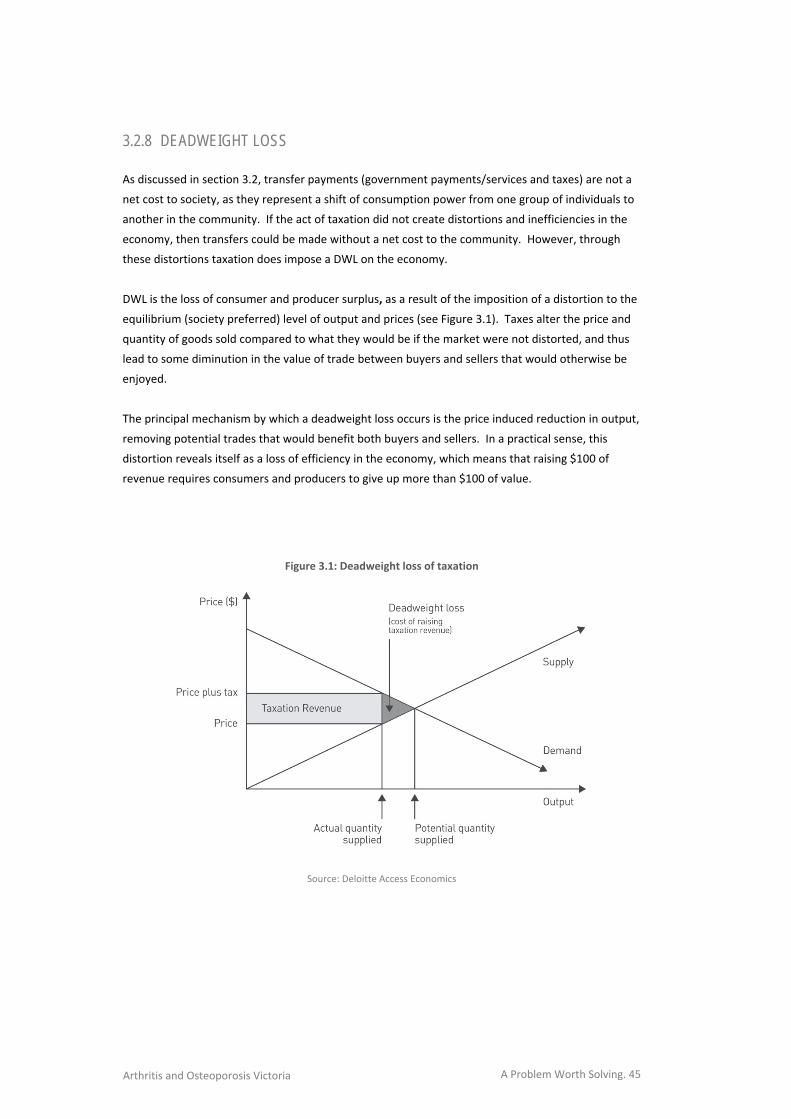
A Problem Worth Solving. 45 Arthritis and Osteoporosis Victoria
3.2.8 DEADWEIGHT LOSS
As discussed in section 3.2, transfer payments (government payments/services and taxes) are not a
net cost to society, as they represent a shift of consumption power from one group of individuals to
another in the community. If the act of taxation did not create distortions and inefficiencies in the
economy, then transfers could be made without a net cost to the community. However, through
these distortions taxation does impose a DWL on the economy.
DWL is the loss of consumer and producer surplus, as a result of the imposition of a distortion to the
equilibrium (society preferred) level of output and prices (see Figure 3.1). Taxes alter the price and
quantity of goods sold compared to what they would be if the market were not distorted, and thus
lead to some diminution in the value of trade between buyers and sellers that would otherwise be
enjoyed.
The principal mechanism by which a deadweight loss occurs is the price induced reduction in output,
removing potential trades that would benefit both buyers and sellers. In a practical sense, this
distortion reveals itself as a loss of efficiency in the economy, which means that raising $100 of
revenue requires consumers and producers to give up more than $100 of value.
Figure 3.1: Deadweight loss of taxation
Source: Deloitte Access Economics
A Problem Worth Solving. 46 Arthritis and Osteoporosis Victoria
The rate of DWL used in this report is 0.275 per $1 of tax revenue raised, based on Productivity
Commission (2003), plus 0.0125 per $1 of tax revenue raised for Australian Taxation Office
administration (Access Economics 2004: Part II, 66).
Deloitte Access Economics estimated that the total extra tax dollars required to be collected include:
the calculation for the loss of income tax from people with arthritis and other musculoskeletal
conditions, carers and employers (with DWL of $699 million as calculated in section 3.2.1.6,
which is included in the total below);
the additional induced social welfare payments required to be paid (with $385 million in
associated DWL); and
the value of government services provided i.e. health costs paid by the Australian Government
and program costs (with $1.19 billion in associated DWL).
The total deadweight loss associated with arthritis and other musculoskeletal
conditions was estimated as $2.27 billion in 2012.
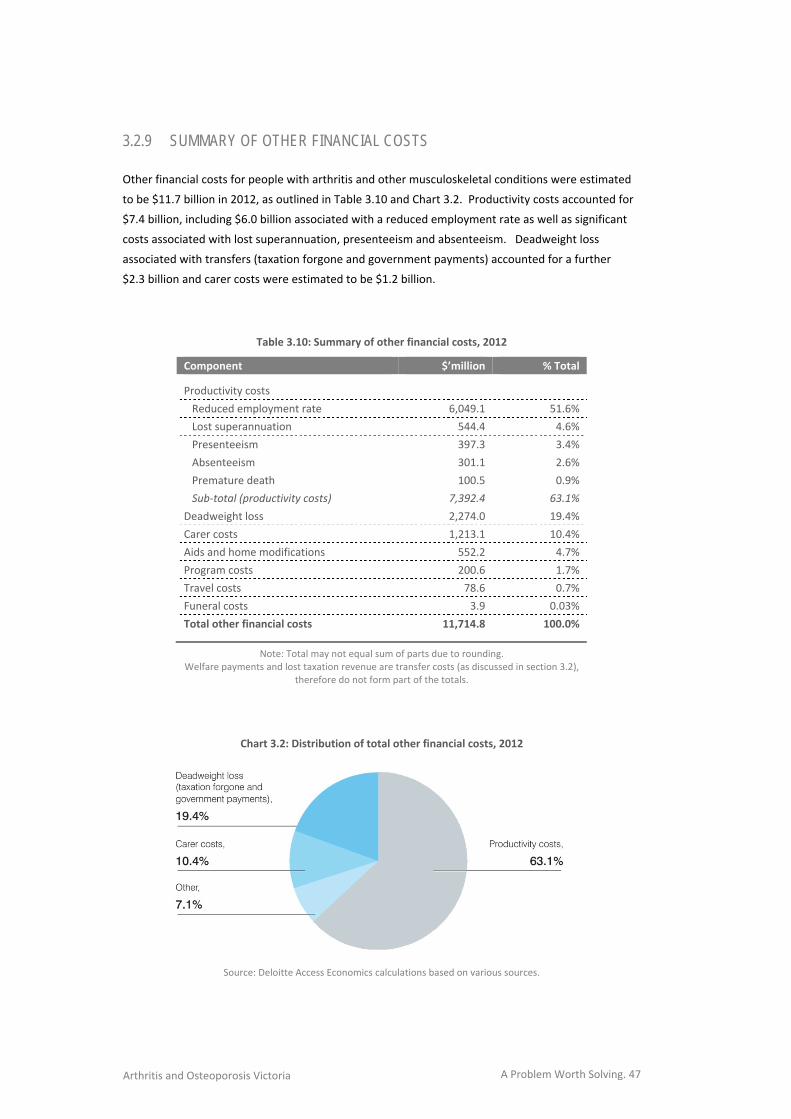
A Problem Worth Solving. 47 Arthritis and Osteoporosis Victoria
3.2.9 SUMMARY OF OTHER FINANCIAL COSTS
Other financial costs for people with arthritis and other musculoskeletal conditions were estimated
to be $11.7 billion in 2012, as outlined in Table 3.10 and Chart 3.2. Productivity costs accounted for
$7.4 billion, including $6.0 billion associated with a reduced employment rate as well as significant
costs associated with lost superannuation, presenteeism and absenteeism. Deadweight loss
associated with transfers (taxation forgone and government payments) accounted for a further
$2.3 billion and carer costs were estimated to be $1.2 billion.
Table 3.10: Summary of other financial costs, 2012
Component $’million % Total
Productivity costs
Reduced employment rate 6,049.1 51.6%
Lost superannuation 544.4 4.6%
Presenteeism 397.3 3.4%
Absenteeism 301.1 2.6%
Premature death 100.5 0.9%
Sub‐total (productivity costs) 7,392.4 63.1%
Deadweight loss 2,274.0 19.4%
Carer costs 1,213.1 10.4%
Aids and home modifications 552.2 4.7%
Program costs 200.6 1.7%
Travel costs 78.6 0.7%
Funeral costs 3.9 0.03%
Total other financial costs 11,714.8 100.0%
Note: Total may not equal sum of parts due to rounding. Welfare payments and lost taxation revenue are transfer costs (as discussed in section 3.2),
therefore do not form part of the totals.
Chart 3.2: Distribution of total other financial costs, 2012
Source: Deloitte Access Economics calculations based on various sources.
A Problem Worth Solving. 48 Arthritis and Osteoporosis Victoria
3.3 BURDEN OF DISEASE Deloitte Access Economics adopted the ‘burden of disease’ method in order to quantify the impact
of arthritis and musculoskeletal conditions on wellbeing. The approach is non‐financial, where pain,
suffering and premature mortality are measured in terms of Disability Adjusted Life Years (DALYs),
with 0 representing a year of perfect health and 1 representing death.
3.3.1 VALUING LIFE AND HEALTH
The burden of disease as measured in DALYs can be converted into a dollar figure using an estimate
of the Value of a ‘Statistical’ Life (VSL). As the name suggests, the VSL is an estimate of the value
society places on an anonymous life. Since Schelling’s (1968) discussion of the economics of life
saving, the economic literature has focused on willingness to pay (WTP) – or, conversely, willingness
to accept – measures of mortality and morbidity, in order to develop estimates of the VSL.
Estimates may be derived from observing people’s choices in situations where they rank or trade off
various states of wellbeing (loss or gain) either against each other or for dollar amounts e.g. stated
choice models of people’s WTP for interventions that enhance health or willingness to accept poorer
health outcomes or the risk of such states. Alternatively, risk studies use evidence of market trade‐
offs between risk and money, including numerous labour market and other studies (such as installing
smoke detectors, wearing seatbelts or bike helmets and so on).
The extensive literature in this field mostly uses econometric analysis to value mortality risk and the
‘hedonic wage’ by estimating compensating differentials for on‐the‐job risk exposure in labour
markets; in other words, determining what dollar amount would be accepted by an individual to
induce him/her to increase the probability of death or morbidity by a particular percentage. Viscusi
and Aldy (2002), in a summary of mortality studies, found the VSL ranged between US$4 million and
US$9 million with a median of US$7 million (in year 2000 US dollars), similar but marginally higher
than the VSL derived from studies of US product and housing markets. They also reviewed a parallel
literature on the implicit value of the risk of non‐fatal injuries.
Weaknesses in the WTP approach, as with human capital approaches to valuing life and wellbeing,
are that there can be substantial variation between individuals. Extraneous influences in labour
markets such as imperfect information, income/wealth or power asymmetries can cause difficulty in
correctly perceiving the risk or in negotiating an acceptably higher wage in wage‐risk trade off
studies, for example.
A Problem Worth Solving. 49 Arthritis and Osteoporosis Victoria
As DALYs are enumerated in years of life rather than in whole lives it is necessary to calculate the
Value of a ‘Statistical’ Life Year (VSLY) based on the VSL. This is done using the formula15:
VSLY = VSL / Σi=0,…,n‐1(1+r)i
Where: n = years of remaining life, and r = discount rate
Clearly there is a need to know n (the years of remaining life), and to determine an appropriate value
for r (the discount rate). There is a substantial body of literature, which often provides conflicting
advice, on the appropriate mechanism by which costs should be discounted over time, properly
taking into account risks, inflation, positive time preference and expected productivity gains.
Access Economics (2008b) recommended an average VSL of $6.0 million in 2006 Australian dollars
($3.7 million to $8.1 million). This equates to an average VSLY in 2006 of $252,014 ($155,409 to
$340,219), using a discount rate of 3% over an estimated 40 years remaining life expectancy.
However, from this gross value, Deloitte Access Economics deducts all costs borne by the individual,
reflecting the source study VSL estimates, to avoid double counting. This provides a different net
VSLY for different conditions (and for different age‐gender groups).
Since Access Economics (2008b), The health of nations: The value of a statistical life, was published,
the Department of Finance and Deregulation (2008) has also provided an estimate of the VSLY,
which appears to represent a fixed estimate of the net VSLY. This estimate was $151,000 in 2007,
which inflates to $187,741 in 2012 dollars. This 2012 estimate is used for modelling calculations in
this report.
3.3.2 BURDEN OF DISEASE DUE TO ARTHRITIS AND OTHER MUSCULOSKELETAL CONDITIONS
3.3.2.1 YEARS OF HEALTHY LIFE LOST DUE TO DISABILITY
The disability weights (DWs) for RA and OA are estimated based on an ‘implicit DW’ of 0.024 derived
from the years of healthy life lost due to disability (YLDs) and prevalence of arthritis calculated by
the AIHW (Access Economics, 2007a which is in turn based on Mathers et al, 1999). Based on the
same AIHW source (Mathers et al, 1999), the DWs for people with osteoporosis and chronic back
pain are 0.009 and 0.060.
15 The formula is derived from the definition:
VSL = ΣVSLYi/(1+r)^i where i=0,1,2….n
where VSLY is assumed to be constant (i.e. no variation with age).
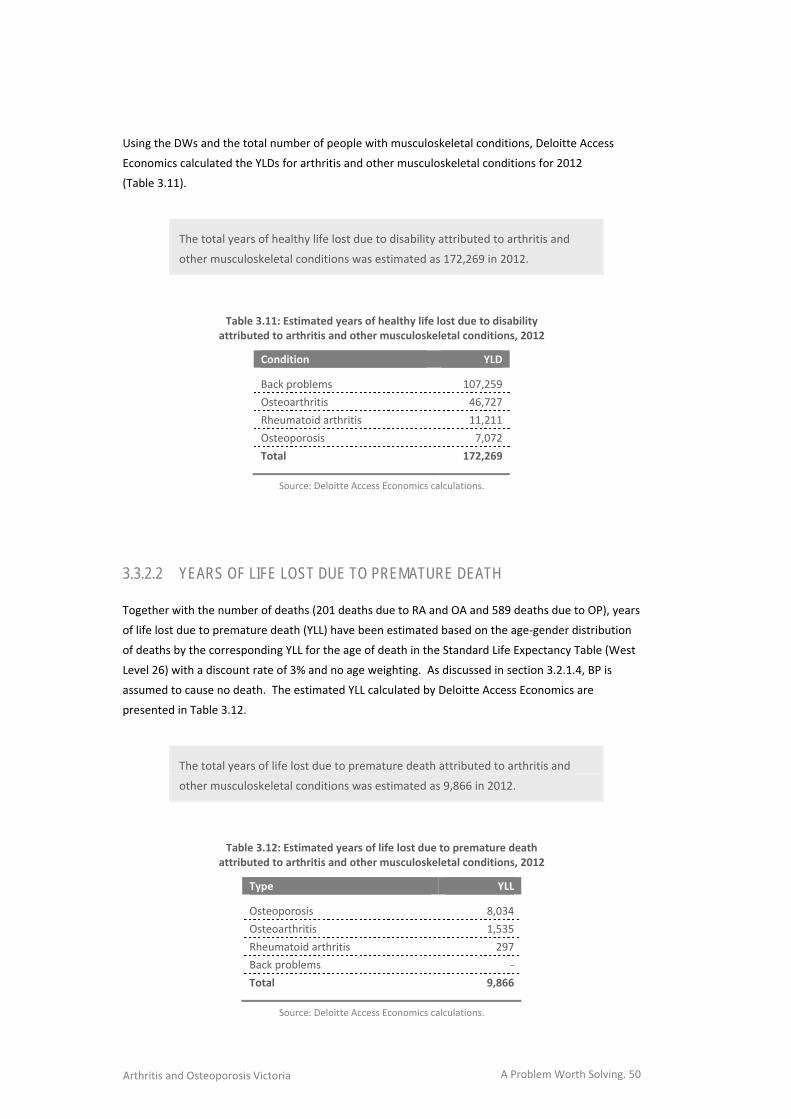
A Problem Worth Solving. 50 Arthritis and Osteoporosis Victoria
Using the DWs and the total number of people with musculoskeletal conditions, Deloitte Access
Economics calculated the YLDs for arthritis and other musculoskeletal conditions for 2012
(Table 3.11).
The total years of healthy life lost due to disability attributed to arthritis and
other musculoskeletal conditions was estimated as 172,269 in 2012.
Table 3.11: Estimated years of healthy life lost due to disability attributed to arthritis and other musculoskeletal conditions, 2012
Condition YLD
Back problems 107,259
Osteoarthritis 46,727
Rheumatoid arthritis 11,211
Osteoporosis 7,072
Total 172,269
Source: Deloitte Access Economics calculations.
3.3.2.2 YEARS OF LIFE LOST DUE TO PREMATURE DEATH
Together with the number of deaths (201 deaths due to RA and OA and 589 deaths due to OP), years
of life lost due to premature death (YLL) have been estimated based on the age‐gender distribution
of deaths by the corresponding YLL for the age of death in the Standard Life Expectancy Table (West
Level 26) with a discount rate of 3% and no age weighting. As discussed in section 3.2.1.4, BP is
assumed to cause no death. The estimated YLL calculated by Deloitte Access Economics are
presented in Table 3.12.
The total years of life lost due to premature death attributed to arthritis and
other musculoskeletal conditions was estimated as 9,866 in 2012.
Table 3.12: Estimated years of life lost due to premature death attributed to arthritis and other musculoskeletal conditions, 2012
Type YLL
Osteoporosis 8,034
Osteoarthritis 1,535
Rheumatoid arthritis 297
Back problems ‐
Total 9,866
Source: Deloitte Access Economics calculations.
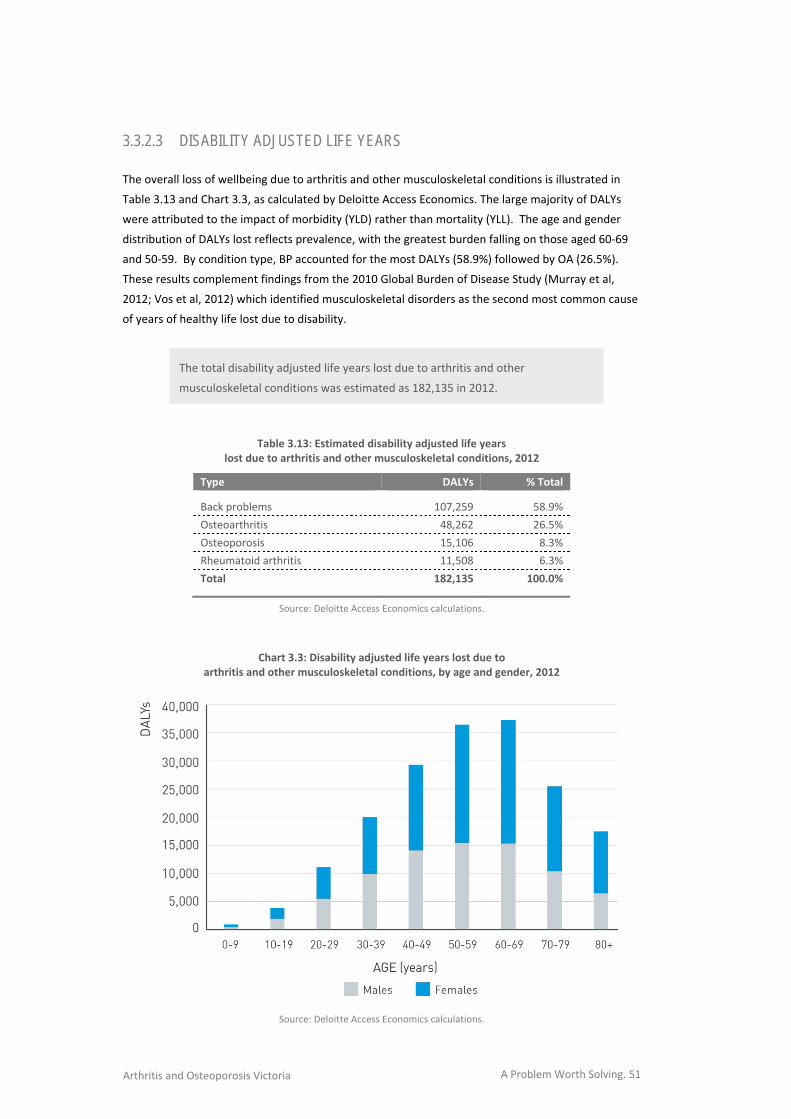
A Problem Worth Solving. 51 Arthritis and Osteoporosis Victoria
3.3.2.3 DISABILITY ADJUSTED LIFE YEARS
The overall loss of wellbeing due to arthritis and other musculoskeletal conditions is illustrated in
Table 3.13 and Chart 3.3, as calculated by Deloitte Access Economics. The large majority of DALYs
were attributed to the impact of morbidity (YLD) rather than mortality (YLL). The age and gender
distribution of DALYs lost reflects prevalence, with the greatest burden falling on those aged 60‐69
and 50‐59. By condition type, BP accounted for the most DALYs (58.9%) followed by OA (26.5%).
These results complement findings from the 2010 Global Burden of Disease Study (Murray et al,
2012; Vos et al, 2012) which identified musculoskeletal disorders as the second most common cause
of years of healthy life lost due to disability.
The total disability adjusted life years lost due to arthritis and other
musculoskeletal conditions was estimated as 182,135 in 2012.
Table 3.13: Estimated disability adjusted life years lost due to arthritis and other musculoskeletal conditions, 2012
Type DALYs % Total
Back problems 107,259 58.9%
Osteoarthritis 48,262 26.5%
Osteoporosis 15,106 8.3%
Rheumatoid arthritis 11,508 6.3%
Total 182,135 100.0%
Source: Deloitte Access Economics calculations.
Chart 3.3: Disability adjusted life years lost due to arthritis and other musculoskeletal conditions, by age and gender, 2012
Source: Deloitte Access Economics calculations.
A Problem Worth Solving. 52 Arthritis and Osteoporosis Victoria
3.3.3 VALUE OF THE BURDEN OF DISEASE
Deloitte Access Economics multiplied the number of DALYs (i.e. 182,135) by the VSLY (i.e. $187,741)
to provide an estimate of the dollar value of the loss of wellbeing due to arthritis and other
musculoskeletal conditions in 2012.
The cost from lost wellbeing due to arthritis and other musculoskeletal
conditions was estimated as $34.19 billion in 2012.
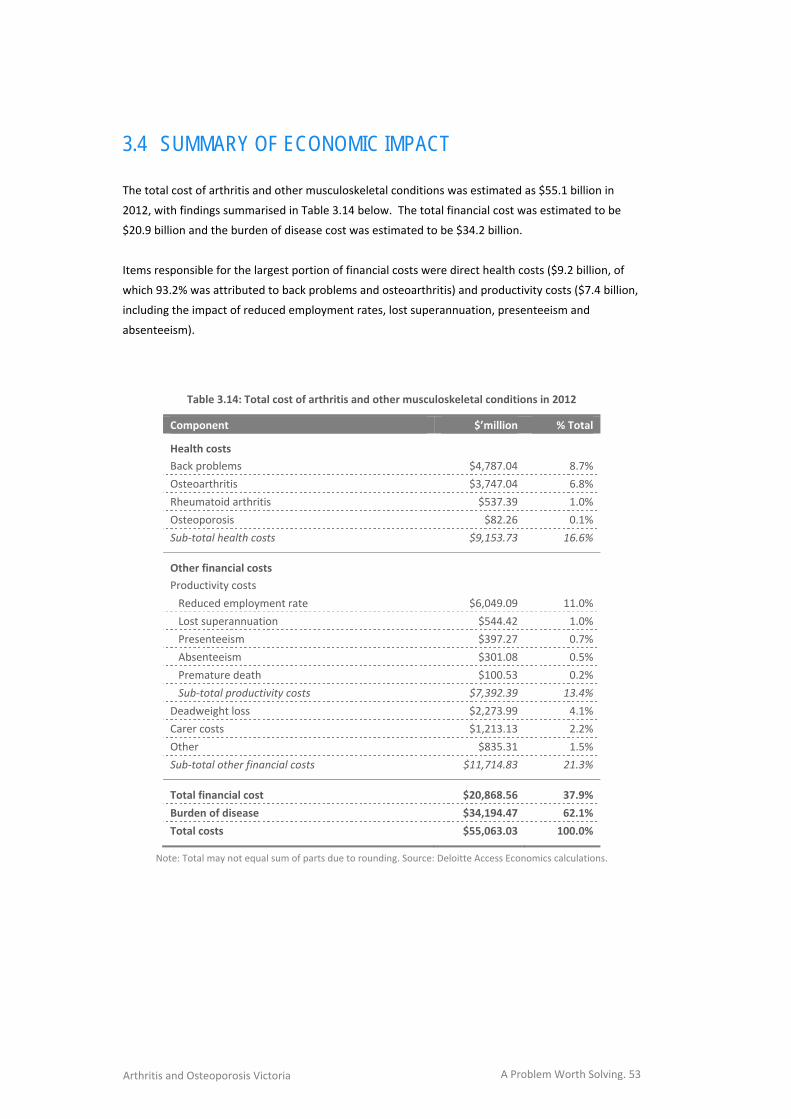
A Problem Worth Solving. 53 Arthritis and Osteoporosis Victoria
3.4 SUMMARY OF ECONOMIC IMPACT The total cost of arthritis and other musculoskeletal conditions was estimated as $55.1 billion in
2012, with findings summarised in Table 3.14 below. The total financial cost was estimated to be
$20.9 billion and the burden of disease cost was estimated to be $34.2 billion.
Items responsible for the largest portion of financial costs were direct health costs ($9.2 billion, of
which 93.2% was attributed to back problems and osteoarthritis) and productivity costs ($7.4 billion,
including the impact of reduced employment rates, lost superannuation, presenteeism and
absenteeism).
Table 3.14: Total cost of arthritis and other musculoskeletal conditions in 2012
Component $’million % Total
Health costs
Back problems $4,787.04 8.7%
Osteoarthritis $3,747.04 6.8%
Rheumatoid arthritis $537.39 1.0%
Osteoporosis $82.26 0.1%
Sub‐total health costs $9,153.73 16.6%
Other financial costs
Productivity costs
Reduced employment rate $6,049.09 11.0%
Lost superannuation $544.42 1.0%
Presenteeism $397.27 0.7%
Absenteeism $301.08 0.5%
Premature death $100.53 0.2%
Sub‐total productivity costs $7,392.39 13.4%
Deadweight loss $2,273.99 4.1%
Carer costs $1,213.13 2.2%
Other $835.31 1.5%
Sub‐total other financial costs $11,714.83 21.3%
Total financial cost $20,868.56 37.9%
Burden of disease $34,194.47 62.1%
Total costs $55,063.03 100.0%
Note: Total may not equal sum of parts due to rounding. Source: Deloitte Access Economics calculations.

A Problem Worth Solving. 54 Arthritis and Osteoporosis Victoria

A Problem Worth Solving. 55 Arthritis and Osteoporosis Victoria
KEY AREAS FOR INTERVENTION
INSERT CHAPTER 5 ART
A comprehensive strategic response is required
to meet the challenges associated with the
increasing prevalence of arthritis and other
musculoskeletal conditions in Australia.
CONCLUSION
4.

A Problem Worth Solving. 56 Arthritis and Osteoporosis Victoria
A Problem Worth Solving. 57 Arthritis and Osteoporosis Victoria
4.1 STRATEGIC RESPONSE
This report details the magnitude of economic costs associated with musculoskeletal conditions in
Australia and the substantial prevalence increases projected over the next two decades.
The growth in prevalence rate and costs for osteoarthritis provide a particularly clear illustration of
the problem. Osteoarthritis is currently the most prevalent type of arthritis (affecting 1.9 million
Australians in 2012) and the most expensive type of arthritis in per person costs ($1,684 in 2012).
Deloitte Access Economics estimated the direct health costs associated with osteoarthritis have risen
from $837 million in 2000, to $1.43 billion in 2004, to $1.95 billion in 2007 and to $3.75 billion in
2012. By 2032, the number of Australians with osteoarthritis is projected to increase by 1.1 million
(affecting a total of 3.0 million people) – a growth of 58%.
A proactive strategic response is required, appropriate to the size and nature of findings identified in
this report.
The evidence in the previous chapters highlights the following as key areas for intervention:
direct health costs;
productivity costs;
linkages with pain, disability and other chronic diseases (such as cardiovascular, diabetes and
mental health); and
the future impact on the aged care system.
A Problem Worth Solving. 58 Arthritis and Osteoporosis Victoria
APPENDIX A: BRIEF DESCRIPTION OF CONDITIONS
OSTEOARTHRITIS
OA is a degenerative joint condition that mostly affects the hands, spine, hips, knees and ankles. Its
main feature is the breakdown of the cartilage that overlies the ends of the bones in the joints,
causing pain and compromised joint function. Age is the strongest factor in the development and
progression of OA. Other important risk factors for the development of OA include: being
overweight, physical inactivity, joint trauma and repetitive joint loading tasks (e.g. kneeling,
squatting and heavy lifting). The role of genetics is also recognised as important in the aetiology of
OA16.
RHEUMATOID ARTHRITIS
RA is an auto‐immune disease where the body’s immune system mistakenly attacks its own tissues.
The immune system attacks the tissues lining the joints (called the synovial membranes), causing
pain, swelling and stiffness. Over time there is progressive and irreversible joint damage, resulting in
deformities and severe disability. RA is a systemic disease, meaning that the whole body, including
the organs, is affected. Systemic inflammation can lead to problems with the heart, respiratory
system, nerves and eyes16.
OSTEOPOROSIS
OP is a thinning and weakening of bones, which increases the risk of fracture. The risk factors
associated with the development of OP include increasing age, female gender, family history of the
condition, low vitamin D levels, low intake of calcium, low body weight, smoking, excess alcohol
consumption, physical inactivity, long‐term corticosteroid use and reduced oestrogen levels. OP may
also occur secondary to other health conditions and therapies16.
BACK PROBLEMS
The majority of back problems, manifesting predominantly as back pain, cannot be attributed to a
specific structural problem in the spine and are commonly referred to as ‘non‐specific’ back
problems. Only a small proportion of back problems can be linked with a specific pathology. While
most back problems resolve in a short time (e.g. 6 weeks), a proportion of people experience
ongoing pain and disability. The experience of back pain is often linked to a combination of factors:
biological, social and psychological16.
16 Adapted from page 312 of AIHW (2012), http://www.aihw.gov.au/WorkArea/DownloadAsset.aspx?id=10737422169.
A Problem Worth Solving. 59 Arthritis and Osteoporosis Victoria
REFERENCES
Access Economics (2010). The economic value of informal care in 2012. Report for Carers Australia.
Canberra: Access Economics.
Access Economics (2010). A future less fragile. Report for Novartis Australia. Canberra: Access
Economics.
Access Economics (2008a). The value of diagnostic imaging. Report for Australian Diagnostic Imaging
Association. Canberra: Access Economics.
Access Economics (2008b). The health of nations: The value of a statistical life. Report for the Office
of the Australian Safety and Compensation Council. Canberra: Access Economics.
Access Economics (2007a). Painful Realities: The economic impact of arthritis in Australia in 2007.
Report for Arthritis Australia. Canberra: Access Economics.
Access Economics (2007b). The high price of pain: The economic impact of persistent pain in
Australia. Report for MBF Foundation. Canberra: Access Economics.
Access Economics (2006). Breaking point: The economic cost of not adhering to bisphosphonate
treatment for osteoporosis. Report for Roche Products Pty Limited and GlaxoSmithKline.
Canberra: Access Economics.
Access Economics (2004). The cost of domestic violence to the Australian economy. Report for the
Office for Women. Canberra: Access Economics.
Access Economics (2001). The burden of brittle bones: Costing osteoporosis in Australia. Report for
Osteoporosis Australia. Canberra: Access Economics.
Ackerman, I., Buchbinder, R. and Osborne, R. (2012). Challenges in evaluating an Arthritis Self‐
Management Program for people with hip and knee osteoarthritis in real‐world clinical
settings. Journal of Rheumatology, 39 (5), pp.1047‐55.
Åkesson, K. and Mitchell, P. (2012). Capture the fracture: A global campaign to break the fragility
fracture cycle. Nyon: International Osteoporosis Foundation. Retrieved from:
http://share.iofbonehealth.org/WOD/2012/report/WOD12‐Report.pdf. Accessed: December
2012.
Aletaha, D., Eberl, G., Nell, V., Machold, K. and Smolen, J. (2002). Practical progress in realisation of
early diagnosis and treatment of patients with suspected rheumatoid arthritis: Results from
two matched questionnaires within three years. Annals of the Rheumatic Diseases, 61 (7),
pp.630‐4.
A Problem Worth Solving. 60 Arthritis and Osteoporosis Victoria
Arterburn, D., Wellman, R., Westbrook, E., Rutter, C., Ross, T., McCulloch, D., …Jung, C. (2012).
Introducing decision aids at Group Health was linked to sharply lower hip and knee surgery
rates and costs. Health Affairs, 31 (9), pp.2094‐104.
Arthritis Australia (2012). Back pain. Retrieved from: http://www.arthritisvic.org.au/Conditions‐and‐
Symptoms/Back‐Pain. Accessed: 13 December 2012.
Australian Bureau of Statistics (2012). Australian Health Survey: First Results, 2011‐12. Canberra:
Australian Bureau of Statistics. Retrieved from:
http://www.abs.gov.au/ausstats/[email protected]/Lookup/4364.0.55.001main+features12011‐12.
Accessed: 13 December 2012.
Australian Bureau of Statistics (2012b). Employee earnings, benefits and trade union membership,
Australia, August 2011. Canberra: Australian Bureau of Statistics. Retrieved from:
http://www.abs.gov.au/ausstats/[email protected]/mf/6310.0. Accessed: 11 October 2012.
Australian Bureau of Statistics (2012c). Labour force, Australia, August 2012. Canberra: Australian
Bureau of Statistics. Retrieved from: http://www.abs.gov.au/ausstats/[email protected]/mf/6202.0.
Accessed: 11 October 2012.
Australian Bureau of Statistics (2012d). Australian demographic statistics, March 2012. Canberra:
Australian Bureau of Statistics. Retrieved from:
http://www.abs.gov.au/ausstats/[email protected]/mf/3101.0. Accessed: 11 October 2012.
Australian Bureau of Statistics (2012e). Consumer Price Index, Australia, June 2012. Canberra:
Australian Bureau of Statistics. Retrieved from:
http://www.abs.gov.au/ausstats/[email protected]/mf/6401.0. Accessed: 11 October 2012.
Australian Bureau of Statistics (2010a). Disability, ageing and carers, Australia, 2009. Canberra:
Australian Bureau of Statistics. Retrieved from:
http://www.abs.gov.au/ausstats/[email protected]/mf/4430.0. Accessed: 11 October 2012.
Australian Bureau of Statistics (2010b). National Health Survey: Summary of results, 2007‐2008
(Reissue). Canberra: Australian Bureau of Statistics. Retrieved from:
http://www.abs.gov.au/ausstats/[email protected]/mf/4364.0. Accessed: 13 December 2012.
Australian Bureau of Statistics (2006). National Health Survey: Summary of results, 2004‐2005.
Canberra: Australian Bureau of Statistics. Retrieved from:
http://www.ausstats.abs.gov.au/Ausstats/DetailsPage/4364.02004‐05?OpenDocument.
Accessed: 13 December 2012.
Australian Government (2008). Best practice regulation guidance note value of statistical life.
Canberra: Office of Best Practice Regulation, Department of Finance and Deregulation.
Australian Institute of Health and Welfare (2012). Australia's health 2012. Australia's health no. 13.
Canberra: Australian Institute of Health and Welfare.
Australian Institute of Health and Welfare (2010). A snapshot of arthritis in Australia 2010. Arthritis
series no. 13. Canberra: Australian Institute of Health and Welfare.
Australian Institute of Health and Welfare (2011). A snapshot of osteoporosis in Australia 2011.
Arthritis series no. 15. Canberra: Australian Institute of Health and Welfare.
A Problem Worth Solving. 61 Arthritis and Osteoporosis Victoria
Australian Institute of Health and Welfare (2009). Chronic disease and participation in work.
Canberra: Australian Institute of Health and Welfare.
Australian Institute of Health and Welfare (2004). Health system expenditure on disease and injury in
Australia 2000‐01. Canberra: Australian Institute of Health and Welfare.
Australian Institute of Health and Welfare (2001). Analysis of the ABS National Health Survey.
Canberra: Australian Institute of Health and Welfare. Retrieved from:
http://aihw.gov.au/workarea/downloadasset.aspx?id=6442453292. Accessed: 13 December
2012.
Australian Institute of Health and Welfare (2010). When musculoskeletal conditions and mental
disorders occur together. Canberra: Australian Institute of Health and Welfare.
Australian Taxation Office (2012). Guide to superannuation for individuals ‐ Overview. Retrieved
from: http://www.ato.gov.au/individuals/content.aspx?doc=/content/00250233.htm.
Accessed: 13 December 2012.
Begg, S., Vos, T., Barker, B., Stevenson, C., Stanley, L. and Lopez, A. (2007). The burden of disease and
injury in Australia 2003. Canberra: Australian Institute of Health and Welfare.
Benucci, M., Saviola, G., Manfredi, M., Sarzi‐Puttini,P. and Atzeni, F. (2011). Cost effectiveness
analysis of disease‐modifying antirheumatic drugs in rheumatoid arthritis. A systematic review
literature. International Journal of Rheumatology.
Berger, M., Murray, J., Xu, J. and Pauly, M. (2001). Alternative valuations of work loss and
productivity. 43 (1), pp.18‐24.
Bevan, S., Passmore, E. and Mahdon, M. (2013). Fit for work?: Musculoskeletal disorders and labour
market participation. London: The Work Foundation.
Bleicher, K., Naganathan, V., Cumming, R., Seibel, M., Sambrook, P., Blyth, F., …Creasey, H. (2010).
Prevalence and treatment of osteoporosis in older Australian men: Findings from the CHAMP
study. The Medical Journal of Australia, 193 (7), pp.387‐391.
Bodenheimer, T., Macgregor, K. and Sharifi, C. (2005). Helping patients manage their chronic
conditions. Oakland: California HealthCare Foundation.
Brand, C., Elkadi, S. and Amatya, B. (2005). A literature review of public health intervention for
rheumatoid arthritis, osteoarthritis and osteoporosis. Melbourne: Clinical Epidemiology and
Health Service Evaluation Unit.
Breedveld, F. (2002). Current and future management approaches for rheumatoid arthritis. Arthritis
Research, 4 (Suppl 2), pp.S16‐21.
Bureau of Transport Economics (2000). Road crash costs in Australia. Report 102. Canberra: Bureau
of Transport Economics.
Buszewicz, M., Rait, G., Griffin, M., Nazareth, I., Patel, A., Atkinson, A., …Haines, A. (2006). Self
management of arthritis in primary care: Randomised controlled trial. British Medical Journal,
333, pp.879.
A Problem Worth Solving. 62 Arthritis and Osteoporosis Victoria
Clarke, D. and Currie, K. (2009). Depression, anxiety and their relationship with chronic diseases: A
review of the epidemiology, risk and treatment evidence. Medical Journal of Australia, 190 (7
Supplement), pp.S54‐60.
Department of Health, Western Australia (2011). Osteoporosis model of care. Perth: Health
Networks Branch, Department of Health.
Devine, E., Alfonso‐Cristancho, R. and Sullivan, S. (2011). Effectiveness of biologic therapies for
rheumatoid arthritis: an indirect comparisons approach. Pharmacotherapy, 31 (1), pp.39‐51.
Dibben, P., Wood, G., Nicolson, R. and O’Hara, R. (2012). Quantifying the effectiveness of
interventions for people with common health conditions in enabling them to stay in or return
to work: A rapid evidence assessment. UK: Department for Work and Pensions.
Donahue, K., Gartlehner, G., Jonas, D., Lux, L., Thieda, P., Jonas, B., …Lohr, K. (2008). Systematic
review: comparative effectiveness and harms of disease‐modifying medications for
rheumatoid arthritis. Annals of Internal Medicine, 148 (2), pp.124‐34.
Doan, Q., Chiou, C. and Dubois, R. (2006). Review of eight pharmacoeconomic studies of the value of
biologic DMARDs (adalimumab, etanercept, and infliximab) in the management of rheumatoid
arthritis. Journal of Managed Care Pharmacy, 12 (7), pp.555‐69.
Econtech (2007). Economic modelling of the cost of presenteeism in Australia. Report for Medibank
Private. Kingston: Econtech.
Elwyn, G., Scholl, I., Tietbohl, C., Mann, M., Edwards, A., Clay, K., …Frosch, D. (2013). The
implementation of patient decision support interventions into routine clinical practice: A
systematic review. International Patient Decision Aid Standards Collaboration. Retrieved from:
http://ipdas.ohri.ca/IPDAS‐Implementation.pdf. Accessed: January 2013.
Emery, P., Breedveld, F., Dougados, M., Kalden, J., Schiff, M. and Smolen, J. (2002). Early referral
recommendation for newly diagnosed rheumatoid arthritis: Evidence based development of a
clinical guide. Annals of the Rheumatic Diseases, 61 (4), pp.290‐297.
Flinders Human Behaviour and Health Research Unit (2009). Capabilities for supporting prevention
and chronic condition self‐management: A resource for educators of primary health care
professionals. Canberra: Australian Government, Department of Health and Ageing. Retrieved
from:
http://www.flinders.edu.au/medicine/fms/sites/FHBHRU/documents/publications/Capabilitie
s%20Self‐Management%20Resource.pdf. Accessed: January 2013.
Foreman, P., Murphy, G. and Swerissen, H. (2006). Barriers and facilitators to return to work: A
literature review. Melbourne: Australian Institute for Primary Care, La Trobe University.
Gormley, G., Steele, W., Gilliland, A., Leggett, P., Wright, G., Bell, A., …Taggart, A. (2003). Can
diagnostic triage by general practitioners or rheumatology nurses improve the positive
predictive value of referrals to early arthritis clinics?. Rheumatology (Oxford), 42 (6), pp.763‐8.
Gyrd‐Hansen, D. (2007). Looking for willingness to pay (WTP) threshold for a QALY ‐ Does it make
sense? A critical view. ISPOR Connection, 13, pp.5‐8.
A Problem Worth Solving. 63 Arthritis and Osteoporosis Victoria
Harrington, T. (2008). Improving access to rheumatology care: A continuing challenge. Journal of
Rheumatology, 35 (7), pp.1233‐4.
Iasp‐pain.org (2005). International Association for the Study of Pain | IASP Taxonomy. Retrieved
from: http://www.iasp‐pain.org/AM/template.cfm?section=pain_definitions.
ISPS UK (1998). What is mental illness and what is mental health?. Retrieved from:
http://ispsuk.org/?p=312.
Jayadev, C., Khan, T., Coulter, A., Beard, D. and Price, A. (2013). Patient decision aids in knee
replacement surgery. The Knee, 19 (6), pp.746‐50. Retrieved from:
http://www.ncbi.nlm.nih.gov/pubmed/22386538. Accessed: January 2013.
Keefe, F. and Somers, T. (2010). Psychological approaches to understanding and treating arthritis
pain. Nature Reviews. Rheumatology, 6 (4), pp.210‐6.
Keefe, F., Somers, T. and Martire, L. (2008). Psychological interventions and lifestyle modifications
for arthritis pain management. Rheumatic Disease Clinics of North America, 34 (2), pp.351‐
368.
Lacaille, D., White, M., Rogers, P., Backman, C., Gignac, M. and Esdaile, J. (2013). A proof‐of‐concept
study of the "Employment and Arthritis: Making It Work" program. Arthritis Care & Research ,
59 (11), pp.1647–1655.
Lattimore, R. (1997). Policy evaluation in innovation and technology : Towards best practices. In:
Unknown. eds. (2007). Policy evaluation in innovation and technology: Towards best practices.
1st ed. Paris: Organisation for Economic Co‐operation and Development, pp.91‐134.
Luqmani, R. and Jackman, J. (2006). The BSR promotes early referral for rheumatoid arthritis.
Guidelines in Practice, 9 (11), Retrieved from:
http://www.eguidelines.co.uk/eguidelinesmain/gip/vol_9/nov_06/luqmani_ra_nov06.php.
Mathers, C., Vos, T. and Stevenson, C. (1999). The burden of disease and injury in Australia.
Canberra: Australian Institute of Health and Welfare.
Michaud, K. and Wolfe, F. (2007). Comorbidities in rheumatoid arthritis. Best Practice & Research.
Clinical Rheumatology, 21 (5), pp.885‐906.
Montag, K., Gingold, M., Boers, A. and Littlejohn, G. (2011). Disease‐modifying anti‐rheumatic drug
usage, prescribing patterns and disease activity in rheumatoid arthritis patients in community‐
based practice. Internal Medicine Journal, 41 (6), pp.450‐5.
Murray, C., Vos, T., Lozano, R., Naghavi, M., Flaxman, A., Michaud, C., …Lopez, A. (2012). Disability‐
adjusted life years (DALYs) for 291 diseases and injuries in 21 regions, 1990–2010: A
systematic analysis for the Global Burden of Disease Study 2010. The Lancet, 380 (9859),
pp.2197 ‐ 2223.
New South Wales (NSW) Agency for Clinical Innovation (2011). Musculoskeletal Network : NSW
model of care for osteoporotic refracture prevention. Chatswood: NSW Agency for Clinical
Innovation. Retrieved from:
http://www.aci.health.nsw.gov.au/__data/assets/pdf_file/0003/153543/aci_osteoporotic_ref
ractu.pdf#zoom=100. Accessed: December 2012.
A Problem Worth Solving. 64 Arthritis and Osteoporosis Victoria
New South Wales (NSW) Agency for Clinical Innovation (2012). System wide analysis: Osteoporotic
refracture prevention model of care. Chatswood: NSW Agency for Clinical Innovation.
Norton, S., Koduri, G., Nikiphorou, E., Dixey, J., Williams, P. and Young, A. (2013). A study of baseline
prevalence and cumulative incidence of comorbidity and extra‐articular manifestations in RA
and their impact on outcome. Rheumatology (Oxford), 52 (1), pp.99‐110.
Palmer, K., Harris, E., Linaker , C., Barker, M., Lawrence, W., Cooper, C. and Coggon, D. (2012).
Effectiveness of community and workplace‐based interventions to manage musculoskeletal‐
related sickness absence and job loss: A systematic review. Rheumatology (Oxford), 51 (2),
pp.230‐42.
Productivity Commission (2003). Evaluation of the pharmaceutical industry investment program.
Melbourne: Productivity Commission.
Quinn, M., Conaghan, P. and Emery, P. (2001). The therapeutic approach of early intervention for
rheumatoid arthritis: What is the evidence?. Rheumatology (Oxford), 40 (11), pp.1211‐20.
Reavley, N., Livingston, J., Buchbinder, R. and Osborne, R. (2012). Identifying and understanding the
concerns of business: A systematic approach to the development of the Australian
WorkHealth Program ‐ Arthritis. Journal of Health Services Research & Policy, 17 (3), pp.164‐
72.
Reavley, N., Livingston, J., Buchbinder, R., Bennell, K., Stecki, C. and Osborne, R. (2010). A systematic
grounded approach to the development of complex interventions: The Australian WorkHealth
Program‐‐Arthritis as a case study. Social Science & Medicine, 70 (3), pp.342‐50.
Riddle, D., Keefe, F., Ang, D., Khaled, J., Dumenci, L., Jensen, M., …Kroenke, K. (2012). A phase III
randomized three‐arm trial of physical therapist delivered pain coping skills training for
patients with total knee arthroplasty: The KASTPain protocol.. BMC Musculoskeletal Disorders,
13 (1), pp.149.
Robinson, P. and Taylor, W. (2010). Time to treatment in rheumatoid arthritis: Factors associated
with time to treatment initiation and urgent triage assessment of general practitioner
referrals. Journal of Clinical Rheumatology, 16 (6), pp.267‐73.
Royal Australasian College of General Practitioners (2009). Clinical guideline for the diagnosis and
management of early rheumatoid arthritis. South Melbourne: Royal Australasian College of
General Practitioners.
Schelling, T. (1968). The life you save may be your own. In: Chase, S. eds. (1968). Problems in public
expenditure analysis. 1st ed. Washington: The Brookings Institution., pp.127‐162.
Somers, T., Blumenthal, J., Guilak, F., Kraus, V., Schmitt, D., Babyak, M., …Keefe, F. (2012). Pain
coping skills training and lifestyle behavioural weight management in patients with knee
osteoarthritis: A randomized controlled study. Pain, 153 (6), pp.1199‐209.
Stacey, D., Bennett, C., Barry, M., Col, N., Eden, K., Holmes‐Rovner, M., …Thomson, R. (2011).
Decision aids for people facing health treatment or screening decisions. Cochrane Database of
Systematic Reviews, 10, Art. No.: CD001431. DOI: 10.1002/14651858.CD001431.pub3.
Retrieved from: http://onlinelibrary.wiley.com/doi/10.1002/14651858.CD001431.pub3.
Accessed: January 2013.
A Problem Worth Solving. 65 Arthritis and Osteoporosis Victoria
The Robert Wood Johnson Foundation & The Center For The Advancement Of Health (2001).
Essential elements of self‐management interventions. Washington: CFAH Publications.
Thompson, A. (2010). Referral and triage in rheumatology: Accelerating the spectrum of care.
Rheumatology National Grand Rounds, 1 (3).
UK National Audit Office (2009). Services for people with rheumatoid arthritis. London: The
Stationery Office.
Van Oostrom, S., Driessen, M., De Vet, H., Franche, R., Schonstein, E., Loisel, P., …Anema, J. (2009).
Workplace interventions for preventing work disability. Cochrane Database of Systematic
Reviews, 2, Art. No.: CD006955. DOI: 10.1002/14651858.CD006955.pub2.
Verhoeven, A., Bibo, J., Boers, M., Engel, G. and Van Der Linden, S. (1998). Cost‐effectiveness and
cost‐utility of combination therapy in early rheumatoid arthritis: randomized comparison of
combined step‐down prednisolone, methotrexate and sulphasalazine with sulphasalazine
alone. COBRA Trial Group. Combinatietherapie Bij Reumatoïde Artritis. British Journal of
Rheumatology, 37 (10), pp.1102‐9.
Villeneuve, E., Nam, J., Bell, M., Deighton, C., Felson, D., Hazes, J., …Emery, P. (2013). A systematic
literature review of strategies promoting early referral and reducing delays in the diagnosis
and management of inflammatory arthritis. Annals of the Rheumatic Diseases, 72 pp.13‐22.
Viscusi, W. and Aldy, J. (2002). The value of a statistical life: A critical review of market estimates
throughout the world. Discussion Paper No. 392. Cambridge: Harvard Law School. Retrieved
from: http://www.law.harvard.edu/programs/olin_center.
Vos, T., Flaxman, A., Naghavi, M., Lozano, R., Michaud, C., Ezzati, M., …Murray, C. (2012). Years lived
with disability (YLDs) for 1160 sequelae of 289 diseases and injuries 1990‐2010: A systematic
analysis for the Global Burden of Disease Study 2010. The Lancet, 380 (9859), pp.2163 ‐ 2196.
World Health Organization (2003). Adherence to long‐term therapies: Evidence for action. Geneva:
World Health Organization. Retrieved from:
http://whqlibdoc.who.int/publications/2003/9241545992.pdf. Accessed: January 2013.
Who.int (2013). World Health Organization | Disabilities. Retrieved from:
http://who.int/topics/disabilities/en/.
Zheltoukhova, K., Bevan, S. and Reich, A. (2012). Fit For work? Musculoskeletal disorders and the
Australian labour market. London: The Work Foundation.
ARTHRITIS AND OSTEOPOROSIS VICTORIA
ABN: 26 811 336 442 263‐265 Kooyong Road, Elsternwick, Victoria, 3185
P.O. Box 130, Caulfield South, Victoria, 3162 Tel: 03 8531 8000 Fax: 03 9530 0228
Email: [email protected] www.arthritisvic.org.au