Embed Size (px)
Citation preview

18 M.O. ŞERİFOĞLU, T. HIZARCI and H. AKYILDIZ
GiDB|DERGi Sayı 8, 2017
A REPORT ON RISK ASSESSMENT OF UNDERWATER
GLIDERS USING UNCERTAINTY ANALYSIS AND FAULT
TOLERANT CONTROL
Mehmet Ozan ŞERİFOĞLU*, Turgay HIZARCI* and Hakan AKYILDIZ*
*Istanbul Technical University, Department of Ship Building and Ocean Engineering,
akyıldı[email protected]
ABSTRACT
Underwater gliders are important autonomous underwater vehicles for ocean observations. They are
characterized by long endurance, low speed and high efficiency. Improvement of these vehicles can be
achieved through decreasing uncertainties and increasing reliability in navigation. Uncertainty and
reliability analysis is an efficient way of determining key points that have to be improved. Also, FTC is a
widely used control method in autonomous systems, satisfying system continuity in errors. It is essential to
apply it to underwater glider navigation system. Uncertainty analysis and FTC method can be used together
to enhance system behavior and further determine important design factors.
Key Words: Underwater glider, uncertainty, reliability, FMEA, FTC.
1. Introduction
The significant part of the Earth’s surface is covered by the ocean. Exploration of the ocean
becomes crucial activity to understand the operation of the Earth (Tropea et al., 2007). However,
some factors that prevent the explorations take considerable time. Quantity of the ocean,
inhospitable environment for human being, price that need to be paid, uncertainty and fluxional
situations definitely can be example to these factors. Research and examination of the ocean is
crucial to protect and improve these effects and resources.
Observation, exploration and development are important parameters for improvement of the
ocean observation systems. Stationary and passive systems have many disadvantages against
mobile systems like AUVs, ROVs and AUGs with their high maneuverability and controllability
(Zue, 2015). In addition to that, coordination and communication with multiple underwater
vehicles can perform difficult and time consuming tasks easily. While designing and building
these vehicles mathematical models of the system, the physical parameters of the vehicle, the
loads and the working environments are taking into account. However, parameters like uncertain
current and uncertain density of the seawater creates uncertainty problems in real engineering
(Lei, 2016). So making the necessary uncertainty analyses is really important. Also, it is a lot
more important to design a fault proof system for gliders as their work durations reach months.
To do that, a fault detection and analysis mechanism with a fault control system that can repair
and improve itself is necessary. In this paper there is an analysis of uncertainties of the glider and

RISK ASSESSMENT OF UNDERWATER GLIDERS USING
UNCERTAINTY ANALYSIS AND FAULT TOLERANT CONTROL
19
Sayı 8, 2017 GiDB|DERGi
importance of the systems within, and also overviews of fault identification method FMEA and
fault control method FTC with their applications on a part of glider navigation system.
2. Underwater Gliders
Underwater gliders are the vehicles that can operate unmanned and autonomously throughout the
water column. Navigation and glide control are accomplished with usage of sensors together and
in combination. Wetted sensors are used for gathering the physical, chemical and biological
oceanographic data. Sensors on gliders can measure physical variables as pressure, noise
(background, ambient, ships, marine mammal calls, etc.), temperature, salinity, current, biological
variables relevant to the quantity of phytoplankton and zooplankton, and ecologically important
chemical variables such as dissolved oxygen and nitrate.
Buoyancy driven underwater gliders use buoyancy engine to change their volume for propulsion
and movement rather than conventional propeller. This mechanism has low energy consumption
values and gives advantage to gliders operate in long term projects. They have inflatable external
bladders to increase the volume of the glider. When the external bladder filled with liquid,
buoyancy force is increased and initiate the upward motion (Barker, 2012).
Wings are the main components for the underwater gliders to gain horizontal motion and
propulsion in the ocean while profiling. Wings use vertical motion to generate hydrodynamic lift
force for horizontal motion and have an important effect on glide slope and angle (Lippsett &
Carlowicz, 2008). Underwater gliders move with sawtooth pattern in vertical plane
however in horizontal plane follow random route because of the currents and their effects.
Sensors are integral parts of the underwater gliders to collect data. Gliders can be used in different
missions when sensors are replaced with suitable one. According to Kongsberg Underwater
Technology, Inc. CTD sensors, fluorometers, dissolved oxygen sensors, PAR sensors, current
profilers (ADCPs), optical backscatter and other sensors can be mounted to underwater gliders
(2013). With the help of gliders, salinity and temperature profiles versus depth can be obtained,
pollutants in the ocean can be tested and monitored in an automated way. Depending on the
vehicle's configuration scientists can measure the health of the ocean with the help of
phytoplankton. While climate is based on ocean currents, collected data and instant data
transmission by underwater gliders help scientists to refine climate models and improve
forecasting (Dent, 2014). Underwater glider fleets also help to collect data for improvement of
storm intensity forecast during hurricane seasons (Oceanservice.noaa.gov, 2013).
Another usage area of the underwater gliders is military applications. Silence and stealthiness are
important properties for Navies. Usage of buoyancy changing mechanism as propulsion system
makes gliders pretty quiet and hard to detect. Small dimensions and body, easy deployment even
from a small boat also significantly satisfy the Navy’s desires and requirements. Firstly, gliders
are being used in Navy to collect crucial data and guide the fleet. For example, U.S. Navy Lt.
Cmdr. Patrick Cross mentions that “The gliders are a great way to have a persistent sensor out
there to continuously feed us data on what the ocean is doing. Then we can feed that to our shore-
based computer models and get a better picture of the ocean” (Rush, 2005). Secondly, gliders can
be used to spot submarines and underwater mines with their capability of environmental

20 M.O. ŞERİFOĞLU, T. HIZARCI and H. AKYILDIZ
GiDB|DERGi Sayı 8, 2017
characterization of denied areas, passive detection of acoustic sources, sustained monitoring and
surveillance of marine regions, and multistatic acoustic detection (Cmre.nato.int, 2014).
3. Uncertainty
Uncertainty analysis investigates the effect of lack of knowledge or potential errors of the model.
Uncertainty is incomplete knowledge and information about a system as well as inaccuracy of the
behavior of systems. Uncertainty can be categorized into three groups as physical uncertainty,
statistical uncertainty, and modelling uncertainty (Thof & Murotsu, 1986). Physical uncertainty
caused by physical quantities, such as loads, material properties and environmental changes. This
uncertainty also be called aleatory and random uncertainty. This type of uncertainty cannot be
reduced or eliminated by means of collection of additional information because of that there is
always be unpredictability in the variables. However, uncertainty can be quantified by
examination of the data. The statistical uncertainty arises due to a lack of information. Distribution
parameters can be considered as random variable according to given data set. This uncertainty
also be called epistemic and systematical uncertainty. Caused by limited information or lack of
knowledge on a quantity. The model uncertainty caused by assumptions and unidentified
boundary conditions and their interaction with the model. To design and develop a model, a lot
of assumptions and hypotheses have to be defined. Even if these assumptions are chosen correctly,
model need to match with the real world conditions. (Liu, 1996).
An uncertainty analysis uses the occurrence levels to determine the possible outputs and
possibilities of the outputs. The probabilities of observing particular range of values of a random
variable are described or defined by a probability distribution.
Uncertainty analyses involve identifying characteristics of various probability distributions of
model input and output variables, and subsequently functions of those random output variables
that are performance indicators or measures.
Uncertainty analyses can be used for:
Determination of probability and outputs range and tresh holds.
Determination of standard deviation of the system and the effects of inputs to the outputs.
Determination of the total relaibility of the system and estimating the possible outcomes.
3.1 Sensitivity
Sensitivity is another important parameter for the system reliability with the uncertainty.
Sensitivity analysis is a method to determine which variables, parameters or other inputs have the
most influence on the model output. This involves a study of the effect each of the different
parameters has on results of reliability analysis of the overall system. If the overall effects of
changing a variable are found to be small, then the variable can be treated deterministically.
However, where changes in a variable are found to affect the overall reliability significantly, then
it is important to model the variable by using the best available distribution.

RISK ASSESSMENT OF UNDERWATER GLIDERS USING
UNCERTAINTY ANALYSIS AND FAULT TOLERANT CONTROL
21
Sayı 8, 2017 GiDB|DERGi
3.2 Uncertainty Analysis on Underwater Gliders
3.2.1 Faults in Underwater Gliders
Potential faults in underwater gliders can be grouped under these titles:
Power System Faults: Battery problems is the most important parameter in the gliders because
any malfunctioning cause stopping of all systems. Because of that all battery systems are being
monitored autonomously all the time for short circuit, voltage changes and voltages on
components.
Leak Detection System Faults: Underwater gliders’ working depths can reach up to 5000 meters.
That means these vehicles needs proper sealing and water tide systems. Leak detection system
faults can be end with loss of the vehicle. While operation continue this system protect the vehicle
from drowning with surfacing if there is a leak.
Diving System Faults: There are two type of diving mechanism that control the glider. Most
important one is the bladder system that can change the reserve buoyancy of the vehicle with
changing the fluid inside the capsule that located aft side of the vehicle. Water inside the capsule
is replaced with the lighter fluid like oil which is kept inside reservoir cause increase in buoyancy.
Second type is the ballast system that can take and discharge the water with pumps. Leakage in
the capsule block the diving system and make impossible to change buoyancy which result in
drowning of the vehicle. Malfunctioning in buoyancy pumps prevent the changing center of
gravity that affect the control of the glider.
Environmental Detection System Faults: Underwater gliders can be equipped with various type
of sensors that can collect physical, chemical and biological data. However, every underwater
glider equips CTD (Conductivity Temperature and Depth) that can collect changing salinity and
temperature with depth. Malfunctioning in these sensor will abort the mission because of the
inability of the collection of required data.
Collision Avoidance System Faults: Collision of the underwater gliders can be classified in two
groups that are collusion with sea floor and collusion with the floating objects. Trapping in fish
nets also can be considered as the probability of the collusion of underwater glider systems.
Underwater gliders use sonar modem, sonar transponders and altimeter to prevent the collusion.
Any malfunction of these systems can be end with the collusion.
Computer System Faults: Underwater gliders mainly have 3 different computer systems. First
one is for storing the collected data. Faults in this computer makes the mission useless. Second
one is for navigation and planning. Last on is for monitoring the systems and coordination.
Malfunctioning in these computers jeopardize the mission and can lead to system failure.
Propulsion and Stability System Faults: There no propeller on the underwater gliders however
propulsion is fulfilled with the help of wings and fixed fins. Failure or rupture on these parts affect
the gliders moving mechanism. Thus, glider cannot move in horizontal plane and correction of
the diving angle will be impossible. Pitch and roll motion correctors failure lead to unstable diving
and wrong navigation. These faults lead the failure of the mission.

22 M.O. ŞERİFOĞLU, T. HIZARCI and H. AKYILDIZ
GiDB|DERGi Sayı 8, 2017
Communication System Faults: Underwater gliders communicate with the control center
throughout satellite. Connection occur at surface and glider transmit the collected data and take
the upcoming mission requirements. If communication cut off glider can be lost and start to drift
uncontrollably.
Navigation System Faults: Location data collected with the GPS antenna which can be located
on one of the wings or aft section of the underwater glider. Antenna locates on the surface in order
to get data in a stable condition. If the antenna locates on one of the wing gliders need to roll at
the surface with moving its battery side to side. Other type need to put its aft section out of the
water with the help of buoyancy mechanism. Any malfunction on these systems resulted in loss
of the glider.
3.2.2 Uncertainty and Reliability of Underwater Gliders
Underwater gliders are autonomous and unmanned systems therefore reliability is the most
important parameter to prevent the loss. Minimal cut sets and cut sets will be used to determine
the effect of subsystems to the entire system failure, to find the focus points on the subsystems
and which system create the most unreliability on the entire system. Cut sets are the unique
combinations of component failures that can cause system failure. Minimal cut sets can be used
to understand the structural vulnerability of a system. The longer a minimal cut set is, the less
vulnerable the system is to that combination of events. Also, numerous cut sets indicate higher
vulnerability. Cut sets can also be used to discover single point failures (one independent element
of a system which causes an immediate hazard to occur and/or causes the whole system to fail).
To find the minimal cut sets, formula (1) that below is used and the chart is created. P(MCs) and
MCsI values are found with the stress and reliability tests that applied to glider. These tests
showed effect of the subsystem failure to the entire failure of the system and critical subsystems
for the system unreliability. Tests also revealed that the failure rate of the subsystems and the
occurrence probabilities.
𝑀𝐶𝑠𝐼 = 𝑃(𝑀𝐶𝑠) 𝑃(𝐿𝑜𝑠𝑠)⁄ (1)
Figure 1. Minimal cut-sets (MCs) and minimal cut-sets importance (MCsI) of the systems
0.5
64
0.7
62
0.8
81
0.8
62
0.8
65
0.8
81
0.9
64
0.9
13
0.6
22
4.4
53 6.0
18
6.9
57
6.8
05
6.8
32
6.9
57
7.6
16
7.2
14
4.9
14
P(MCs) MCsI

RISK ASSESSMENT OF UNDERWATER GLIDERS USING
UNCERTAINTY ANALYSIS AND FAULT TOLERANT CONTROL
23
Sayı 8, 2017 GiDB|DERGi
Created chart shows that the power system is the heights probability of failure. This affects the
reliability of the vehicle and need to be improved. Power system is the energy source of the glider
and first parameter need to work perfectly. Any malfunctioning in this system lead to loss of the
underwater glider. Navigation system and leak detection system have the highest failure
probability after the power system. Improvement priority need to be organized according to the
failure probabilities and rates of the subsystems. (Aslansefat, 2014).
Table 1: Failure rate of the subsystems
Sub-System Failure FR(λx10-6) Sub-System Failure FR(λx10-6) Sub-System
Failure FR(λx10-6)
Current Monitor 6,5 Science Sensor 3,62 Rudder Broken 0,91
Leak Detection 13,59 CTD 0,2 Wing Broken 0,91
Voltage Detection 6,5 Iridium 3,62 Argos 0,91
Power/Battery 8,15 Data Logging 1,81 GPS Host 8,5
Battery Detection 7,5 Attitude Control 2,72 Bad GPS 13,41
Buoyancy Pump 5,44 Command/Control 0,91 Pitch Motor 0,91
Air Bladder Leak 0,91 Onboard Software 0,91 Roll Motor 0,91
Collision Vessel 3,62 Glider Recovered 1,81 Unknown 3,62
Collision Seabed 1,81
4. Fault Tolerant Control
As underwater gliders are autonomous vehicles they benefit from the FTC method a lot in every
aspect of their operation. In the case of a glider, most important operation it does is navigation.
Its data quality, maximum work time and damages to vehicle is all related to navigation efficiency
and success. So navigation related errors are one of the most important possible error types in a
glider. In this part possible navigation errors are defined using FMEA method and FTC method
is used to create a fail-safe system.
4.1 FMEA Method
To determine possible problems and understand their effects on the system FMEA method is a
good choice. Results of FMEA method is also adaptable to FTC system very well. FMEA stands
for “Fault Mode and Effects Analysis”. Carlson states that FMEA is an engineering study that is
done by a team of experts on subject to find and fix the weaknesses early on (2014). In that matter,
FMEAs depend mostly on expert knowledge and error data if available. By applying FMEA, we
can prevent dangerous errors before operation, increase reliability of the system and evaluate the
system from a new point.
FMEA has six steps approach. Those are; determination of failure modes, evaluating severity,
probability and detection numbers, calculating risk priority number and determining the necessary
actions. Severity number tells that how serious the failure is, probability number show how likely
is it for the failure to occur and detection number states is the detection of the failure early on is
easy or not. When those three numbers are multiplied the RPN number occur. If the RPN number
is high, it means that the failure is a dangerous one for our system and has the priority on getting
fixed. Generally, all that information is collected on a table with severity, probability, detection
and RPN numbers; name, position, cause and effect of the failure and also the suggestion on how
to deal with the failure giving the user a good overview.

24 M.O. ŞERİFOĞLU, T. HIZARCI and H. AKYILDIZ
GiDB|DERGi Sayı 8, 2017
There are a lot of direct and indirect benefits of the method. First of all, FMEA is an easy process
to make. It also supplies other failure detection and isolation techniques with meaningful data.
FMEA increases reliability, quality and safety of the finished product. Those improvements
increase customer satisfaction. On the other hand, method requires experts of different disciplines
to work together and their performance will affect the performance of the method directly.
4.2 Fault Tolerant Control Method
Fault tolerant control is the main systematic for most of our modern day autonomous applications.
It is basically a method, used to make a system continue working even if there are errors in the
system. When a fault occurs in a system, ideally it has to be detected fast and then replied with a
fix if possible. Main frame of FTC system consists of a self-repairing, reconfigurable and self-
designing control structure. It consists of two main parts; fault diagnosis and control redesign.
Faults in a system are diagnosed and identified in the fault diagnosis step and then in control
redesign step controllers are adapted to the system with fault so that it can continue working. If
severity of the error is high, power degradation is also an acceptable solution. Fault tolerant
control can be applied to all systems. However, FTC is a complex mixture of three research fields;
FDI (Fault Detection and Isolation), robust control, and reconfigurable control which make it a
complicated and expensive. So it is applied into systems within the condition of critical safety.
4.2.1 Structure
There are several different structure types of FTC and they are grouped under 3 categories.
However, before that terminology should be understood. Here is the basic terminology used in
FTC applications:
Fault: A deviation of a parameter of the system from acceptable condition
Failure: A permanent interruption of system’s ability to perform its goal
Error: A deviation between measured and computed value
Controlled system: A plant under consideration with sensors and actuators
Fail-operational: Operational system without a performance change despite failure
Fail-safe: A system that fails to a state which is considered safe
Fault types are also separated to three categories as seen below:
Plant faults: Changes dynamics of I/O properties. Physical parameter of system changes
such as coefficients.
Sensor faults: Plant properties are stable but sensors have errors. These faults represent
incorrect reading from the sensors. They can happen due to wire defects.
Actuator faults: Plant specifications are not changed but controller effect on the plant is
disturbed. They represent partial or complete loss of control action

RISK ASSESSMENT OF UNDERWATER GLIDERS USING
UNCERTAINTY ANALYSIS AND FAULT TOLERANT CONTROL
25
Sayı 8, 2017 GiDB|DERGi
Figure 2. Way of input to output with faults (Blanke et al., 2006)
Timing of the faults are also important for FTC structure. Abrupt faults occur instantly and can
happen as a result of hardware damage. Incipient faults are the ones that occur or change slowly
with time. Intermittent faults come and go randomly, many time.
Structures of the FTC can be categorized in three main title. Those are embedded systems
approach, distributed diagnostics and remote diagnosis. In embedded systems approach fault
analysis and controller reconfiguration is done on the main control of the system. Main computer
can reach all error information and all algorithms that can be used in faults. Distributed diagnosis
is a structure that distributes information and possible answers to a problem between multiple
systems, linking them to each other. It is used to find fixes to faults that require a lot of
computational work. Remote diagnosis is the last structure type. It uses an on board controller
and an off board controller group. Onboard one has limited power but off board group has a huge
computing power. On board system detects the possible faults while off board group is responsible
for identifying and isolating the fault.
Figure 3. Coordinated diagnosis and remote diagnosis structure (Blanke et al., 2006).
4.2.2 FTC Types
There are mainly two types of FTC. One of them is passive and the other one is the active fault
tolerant control. Passive FTC is also called robust control and handles failures without the need
of a FDI system. It has high reliability for a certain number of faults and uncertainties. In robust
control the worst case scenario algorithms are used. Even in case of a little fault this setup may
cause power degradation in system. On the other hand, robust control gives fast and exact
26 M.O. ŞERİFOĞLU, T. HIZARCI and H. AKYILDIZ
GiDB|DERGi Sayı 8, 2017
responses to faults in its range. Active fault tolerant systems depend on an assistant FDI system.
AFTC system has a complex structure and it responds to failures actively. AFTC can answer a
wider variety of faults and can improve itself over them. AFTC has many sub-method and also
has a wider variety of application. It also has research possibilities and many areas to improve.
But it is complicated and because of its high mathematical requirements, it is expensive and hard
to apply. Fault Detection and Isolation system or FDI is one of the most important parts of AFTC.
Its function is to detect the failure and the find its location. Reliability of this system plays a great
role in reliability of the AFTC in general.
4.3 Application of FMEA Method
FMEA will be a guide to supply necessary information for FTC method later. To apply FMEA,
we need to first determine possible failure modes, second, assign severity, probability and
detection values and third, calculate the risk priority numbers (RPN) for each failure mode. For
this work, experience, technical sheet information of individual parts of the system and some
experimental data are used rather than statistical failure data as there was not enough data. For
severity, probability and detection values general tables and ranking are used. In the, Table 2, 3
and 4 below, the used parameters can be seen for these values.
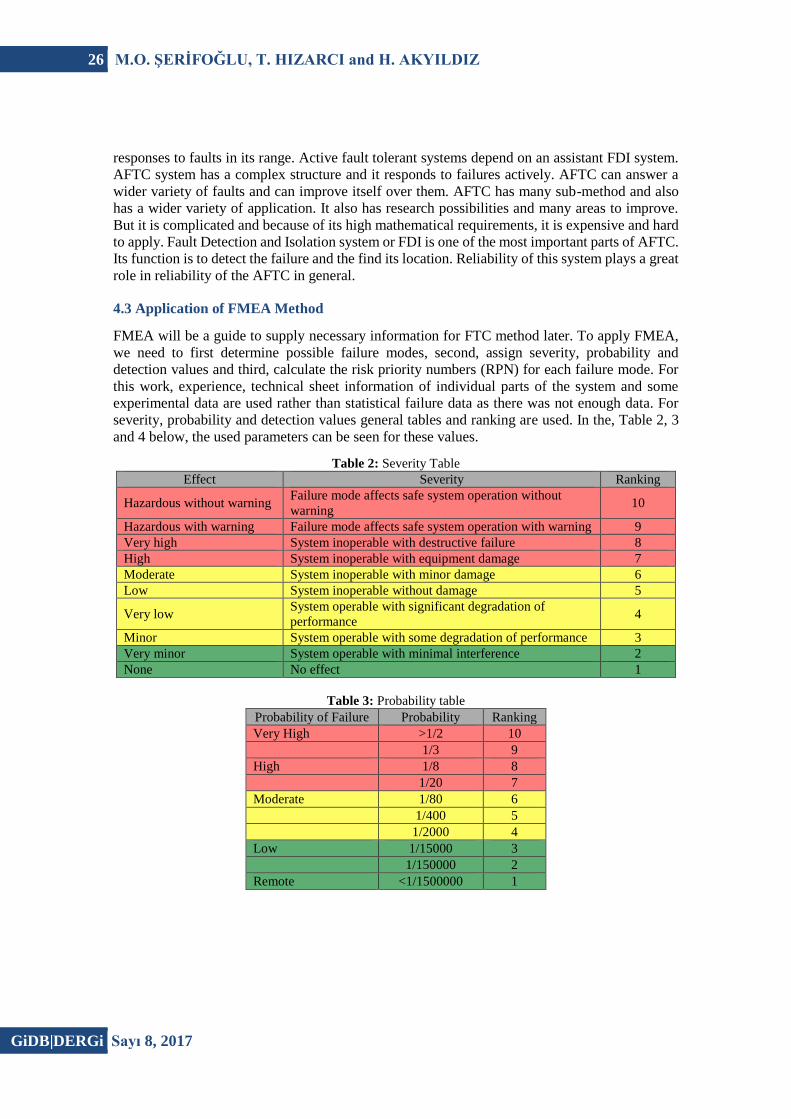
Table 2: Severity Table
Effect Severity Ranking
Hazardous without warning Failure mode affects safe system operation without
warning 10
Hazardous with warning Failure mode affects safe system operation with warning 9
Very high System inoperable with destructive failure 8
High System inoperable with equipment damage 7
Moderate System inoperable with minor damage 6
Low System inoperable without damage 5
Very low System operable with significant degradation of
performance 4
Minor System operable with some degradation of performance 3
Very minor System operable with minimal interference 2
None No effect 1
Table 3: Probability table
Probability of Failure Probability Ranking
Very High >1/2 10
1/3 9
High 1/8 8
1/20 7
Moderate 1/80 6
1/400 5
1/2000 4
Low 1/15000 3
1/150000 2
Remote <1/1500000 1

RISK ASSESSMENT OF UNDERWATER GLIDERS USING
UNCERTAINTY ANALYSIS AND FAULT TOLERANT CONTROL
27
Sayı 8, 2017 GiDB|DERGi
Table 4: Detection Table
Detection Likelihood of Detection by Design Ranking
Absolute
uncertainty Cannot detect 10
Very remote Very remote chance of detection 9
Remote Remote chance of detection 8
Very low Very low chance of detection 7
Low Low chance of detection 6
Moderate Moderate chance of detection 5
Moderate high Moderately high chance of detection 4
High High chance of detection 3
Very high Very high chance of detection 2
Almost certain Design control will detect the failure 1
The possible failure modes in the navigation system are determined in sub-system basis. In the
ballast mechanism there are ballast pump, tank and coupler parts. Main control unit is made of
mother board. Pitch Motion system has pitch motor, shaft and coupler. Roll motion system is
made of servo and a coupler. Energy unit has batteries and cables. Antenna is a part of
communication system. Pressure sensor, altimeter, gyro and collision sensor are parts of sensory
unit. Lastly, wings are included under hull sections. When all of those sub-systems are
investigated the most possible failure types can be understood and the effect of the failure can be
derived from there using experience or computer simulation methods. If we group all the
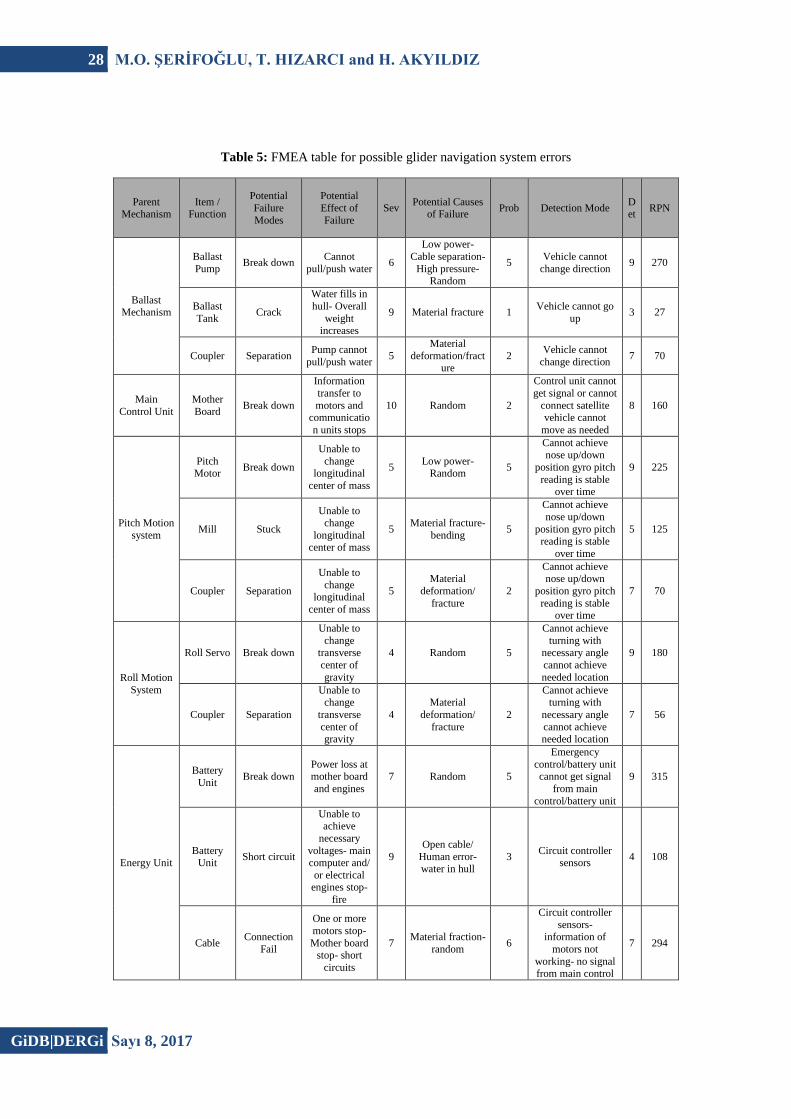
information for FMEA in a table, Table 5 appears.
Figure 4. A generic underwater glider with sections used in navigation
28 M.O. ŞERİFOĞLU, T. HIZARCI and H. AKYILDIZ
GiDB|DERGi Sayı 8, 2017
Table 5: FMEA table for possible glider navigation system errors
Parent Mechanism
Item / Function
Potential
Failure
Modes
Potential
Effect of
Failure
Sev Potential Causes
of Failure Prob Detection Mode
Det
RPN
Ballast Mechanism
Ballast
Pump Break down
Cannot
pull/push water 6
Low power-
Cable separation-
High pressure- Random
5 Vehicle cannot
change direction 9 270
Ballast
Tank Crack
Water fills in
hull- Overall
weight increases
9 Material fracture 1 Vehicle cannot go
up 3 27
Coupler Separation Pump cannot
pull/push water 5
Material
deformation/fracture
2 Vehicle cannot
change direction 7 70
Main
Control Unit
Mother
Board Break down
Information
transfer to
motors and communicatio
n units stops
10 Random 2
Control unit cannot
get signal or cannot
connect satellite vehicle cannot
move as needed
8 160
Pitch Motion
system
Pitch Motor
Break down
Unable to
change longitudinal
center of mass
5 Low power-
Random 5
Cannot achieve nose up/down
position gyro pitch
reading is stable over time
9 225
Mill Stuck
Unable to change
longitudinal center of mass
5 Material fracture-
bending 5
Cannot achieve
nose up/down
position gyro pitch
reading is stable
over time
5 125
Coupler Separation
Unable to
change longitudinal
center of mass
5
Material
deformation/
fracture
2
Cannot achieve nose up/down
position gyro pitch
reading is stable over time
7 70
Roll Motion
System
Roll Servo Break down
Unable to
change transverse
center of
gravity
4 Random 5
Cannot achieve
turning with necessary angle
cannot achieve
needed location
9 180
Coupler Separation
Unable to change
transverse
center of gravity
4
Material
deformation/
fracture
2
Cannot achieve turning with
necessary angle
cannot achieve needed location
7 56
Energy Unit
Battery
Unit Break down
Power loss at mother board
and engines
7 Random 5
Emergency
control/battery unit cannot get signal
from main
control/battery unit
9 315
Battery Unit
Short circuit
Unable to achieve
necessary
voltages- main computer and/
or electrical engines stop-
fire
9
Open cable/
Human error- water in hull
3 Circuit controller
sensors 4 108
Cable Connection
Fail
One or more
motors stop-
Mother board stop- short
circuits
7 Material fraction-
random 6
Circuit controller
sensors- information of
motors not
working- no signal
from main control
7 294
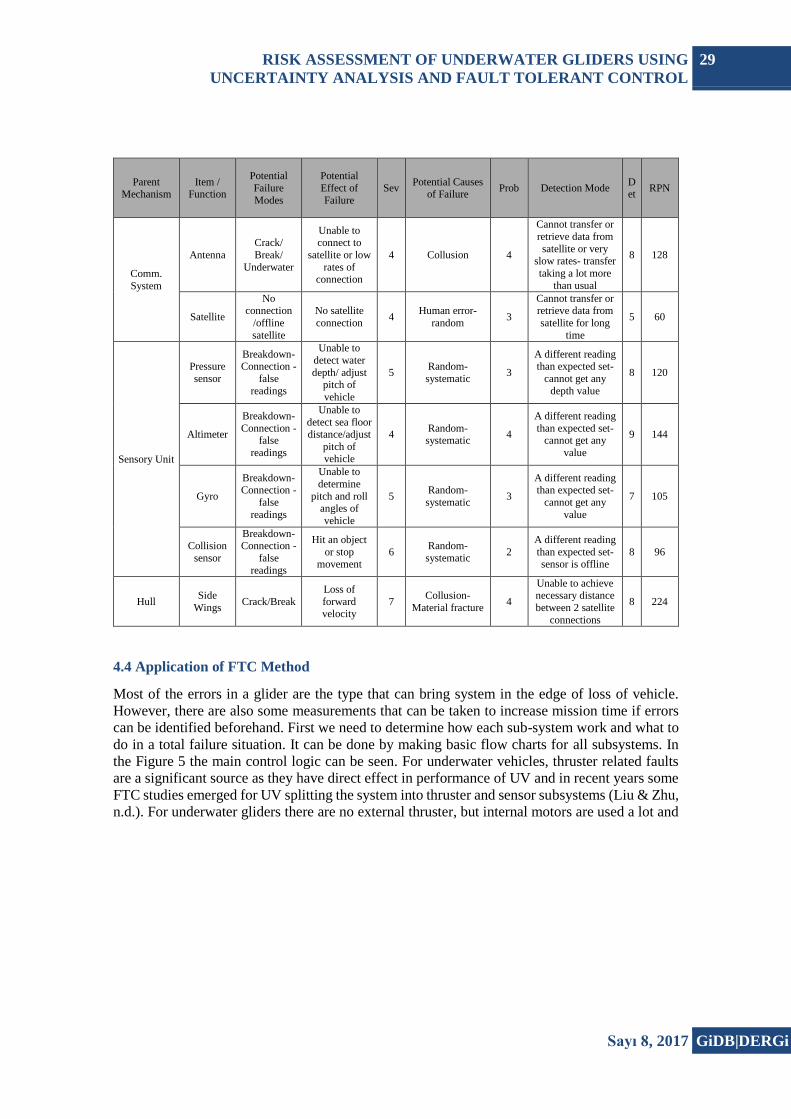
RISK ASSESSMENT OF UNDERWATER GLIDERS USING
UNCERTAINTY ANALYSIS AND FAULT TOLERANT CONTROL
29
Sayı 8, 2017 GiDB|DERGi
Parent Mechanism
Item / Function
Potential
Failure
Modes
Potential
Effect of
Failure
Sev Potential Causes
of Failure Prob Detection Mode
Det
RPN
Comm.
System
Antenna
Crack/
Break/
Underwater
Unable to connect to
satellite or low
rates of connection
4 Collusion 4
Cannot transfer or
retrieve data from
satellite or very slow rates- transfer
taking a lot more
than usual
8 128
Satellite
No connection
/offline
satellite
No satellite
connection 4
Human error-
random 3
Cannot transfer or retrieve data from
satellite for long
time
5 60
Sensory Unit
Pressure
sensor
Breakdown-Connection -
false
readings
Unable to
detect water
depth/ adjust pitch of
vehicle
5 Random-
systematic 3
A different reading than expected set-
cannot get any
depth value
8 120
Altimeter
Breakdown-
Connection - false
readings
Unable to
detect sea floor distance/adjust
pitch of vehicle
4 Random-systematic
4
A different reading
than expected set- cannot get any
value
9 144
Gyro
Breakdown-Connection -
false
readings
Unable to
determine
pitch and roll angles of
vehicle
5 Random-
systematic 3
A different reading than expected set-
cannot get any
value
7 105
Collision
sensor
Breakdown-Connection -
false
readings
Hit an object
or stop movement
6 Random-
systematic 2
A different reading
than expected set- sensor is offline
8 96
Hull Side
Wings Crack/Break
Loss of
forward velocity
7 Collusion-
Material fracture 4
Unable to achieve necessary distance
between 2 satellite
connections
8 224
4.4 Application of FTC Method
Most of the errors in a glider are the type that can bring system in the edge of loss of vehicle.
However, there are also some measurements that can be taken to increase mission time if errors
can be identified beforehand. First we need to determine how each sub-system work and what to
do in a total failure situation. It can be done by making basic flow charts for all subsystems. In
the Figure 5 the main control logic can be seen. For underwater vehicles, thruster related faults
are a significant source as they have direct effect in performance of UV and in recent years some
FTC studies emerged for UV splitting the system into thruster and sensor subsystems (Liu & Zhu,
n.d.). For underwater gliders there are no external thruster, but internal motors are used a lot and

30 M.O. ŞERİFOĞLU, T. HIZARCI and H. AKYILDIZ
GiDB|DERGi Sayı 8, 2017
they also the most important performance aspect in glider navigation. An example of pitch motion
flow chart is in the Figure 6 below.
Figure 5. Main logic of navigation system control
Figure 6. Pitch control unit flow chart as an example (αr is reference pitch angle)

RISK ASSESSMENT OF UNDERWATER GLIDERS USING
UNCERTAINTY ANALYSIS AND FAULT TOLERANT CONTROL
31
Sayı 8, 2017 GiDB|DERGi
The flow charts are made to see how the mechanisms should work. Now it is needed to do an
importance ranking in all of those errors and insert some redundant hardware or software for the
ones with most benefit/cost ratio. Benefit/cost ratio is our limiting point here as there may be
numerous improvements for each sub-system making design stage a lot longer.
It is clear that in a glider an emergency mother board and battery pack is required as redundant
hardware. What is harder to determine is that what improvement can be made to high RPN motor
and sensory breakdowns. To give an example to let’s take pitch control system as in the flow chart
above. If the shaft on weight transfer unit gets jammed the pitch motion will stop. The first mission
of a fault-tolerant control is finding and identifying the faults that are present (Blanke et al., 2006).
So it should be found that if fault is there. By taking data from the gyro we can determine whether
center of gravity shifted enough or not. Of course there can be little disruption on the measured
pitch angle but by taking data every sampling time for brief time steps, it is possible to pick the
error that is important to us. To detect the error, we can use a simple formulation as follows:
𝑒(𝑘) =1
5∑ (𝛼(𝑘) − 𝛼𝑟(𝑘))
2𝑘0+5𝑘=𝑘0
(2)
Where 𝛼(𝑘) is signal and also pitch angle of the vehicle and 𝛼𝑟(𝑘) is reference pitch angle; if
e(k) > λ (fault limit) then there is an fault. The extend of the fault can be found by using fault
identification networks like SOM, CMAC or ICMAC and the output from there gives us
parameters of degree of fault. For our case it can be a “c” parameter where:
c=1.0 for normal state
c=0.66 for jammed state where weight movement in unit time on
shaft is between full value and half value.
c=0.33 for jammed state where weight movement in unit time on
shaft is between half value and zero.
c=0 for complete stop
Figure 7. Mechanism to verify fault and restricted parameter.
After we got our “c” value main control system will adjust the voltage that goes to pitch motor.
By that, motor will produce more power and break-pass the jammed part opening the shaft or else
system will act as in the flow chart. The error calculation and the restricted parameter value can
be made exact for the sub-system by increasing simulation and experiment amounts. With every
error situation system will go for a finer error fix state, cutting unnecessary performance
degrading actions.
32 M.O. ŞERİFOĞLU, T. HIZARCI and H. AKYILDIZ
GiDB|DERGi Sayı 8, 2017
FTC method in general is a hard method to apply but even the easiest part that is done in this
paper can improve operation quality a lot. If this can be applied to all sub-systems, effects of
errors on the system would very low.
5. Conclusion
Underwater glider is still a developing vehicle. Long endurance, large cover area, variety of
sensors and autonomous control parameters increase attention for marine researches. However,
reliability is a big concern for these vehicles. Gliders are formed with various subsystems and
controlling these systems is important to prevent the lost. Uncertainty analysis can be efficient
way to narrow down the possibilities of failure. Determination of possible malfunctioning points,
failure rates and causes can be the key of increasing reliability of the whole system. Uncertainty
analysis is a useful method for defining and analyzing the failure probabilities.
On the other side, FTC is a good method to use in designing a fault proof autonomous underwater
vehicle and it is gaining popularity. The core of the method and its branches are highly
mathematical modelling orientated which makes its application hard in complex systems. As a
result of gliders special movement mechanism, finding error information and developed control
system charts from other UV types, in literature is a lot harder. This creates requirement of expert
knowledge and model simulations. In the future, when the collective information on those systems
increases, all of the possible errors that are talked about in the paper can be analyzed to core and
developed according to FTC.
Synthesis of FTC with uncertainty analysis is also very important. Nearly all of the errors
analyzed with FTC have uncertainty problems in it. So, whether we are doing a standalone
uncertainty analysis or a FTC analysis, mixing the methods and understanding the uncertain
parameters will have a big importance.
References
Alwi, H., Edwards, C., & Pin tan, C. (2011). Fault Detection and Fault-Tolerant Contrl Using
Sliding Modes (1st ed.).
Aslansefat K., Latif-Shabgahi, G., Kanarlouei, M. (2014). A Strategy for Reliability Evaluation
and Fault Diagnosis of Autonomous Underwater Gliding Robot Based on Its Fault Tree.
Barker, W. (2012). An Analysis of Undersea Glider Architectures and an Assessment of
Undersea Glider Integration Into Undersea Applications (Master). Naval Postgraduate
School.
Blanke, M., Kinnaert, M., Lunze, J., & Staroswiecki, M. (2006). Diagnosis and Fault-Tolerant
Control (2nd ed., p. 13). Berlin: Springer.
Carlson, C. (2014). 2014 AR&MS Tutorial Notes (1st ed.).
Claustre, H., & Beguery, L. (2014). SeaExplorer Glider Breaks Two World Records. Sea
Technology, (1-3).
Cmre.nato.int,. (2014). Second Workshop on Military Applications of Underwater Glider
Technology. Retrieved 28 December 2016, from http://www.cmre.nato.int/
RISK ASSESSMENT OF UNDERWATER GLIDERS USING
UNCERTAINTY ANALYSIS AND FAULT TOLERANT CONTROL
33
Sayı 8, 2017 GiDB|DERGi
Davies, J., Steffen, T., Dixon, R., Goodall, R., & Zolotas, A. (2009). Active versus passive fault
tolerant control of a High Redundancy Actuator (1st ed.). IEEE.
Dent, S. (2014). Fleet of underwater gliders could improve global weather forecasts. Engadget.
Retrieved 28 December 2016, from http://www.engadget.com/2014/03/17/
Kalander, O., (2016) Uncertainty Analysis on Risk Management for Formal Safety Assessment.
Koçoğlu, H. (2016). Failure Mode and Effects Analysis (FMEA). Presentation, Istanbul
Technical University.
Lei, Z., Wang, Y., Zhang, L., Liu, Y., Liu, F. (2016). Uncertainty Behavior Research of Hybrid
Underwater Glider. China Tianjin University.
Lippsett, L., & Carlowicz, M. (2008). 'Green' Energy Powers Undersea Glider. Oceanus
Magazine. Retrieved 5 January 2017, from http://www.whoi.edu/ oceanus/feature/green-
energy-powers-undersea-glider
Liu, D., Dong, S., Wang, C., (1996). Uncertainty and Sensitivity Analysis of Reliability for
Marine Structures. Proc. 6th International Offshore and Polar Engineering Conference,
ISOPE '96, Los Angeles, Volume IV, pp.380-386, ISOPE, 1996.
Liu, Q. & Zhu, D. Fault-tolerant Control of Unmanned Underwater Vehicles with Continuous
Faults: Simulations and Experiments (1st ed., p. 301). Shanghai Maritime University
Oceanservice.noaa.gov,. (2013). Underwater Gliders Help Improve Hurricane Forecasts.
Retrieved 20 December 2016, from http://oceanservice.noaa.gov/news/
weeklynews/sept13/ioos-glider.html
Rush, D. (2005). Submarine Makes First Launch of an Underwater Glider. Navy.mil. Retrieved
6 April 2015, from http://www.navy.mil/navydata/cno/n87/usw/ issue_29/glider.html
Shin Kobara, G. (2015). GCOOS Glider Tracker. Gcoos.org. Retrieved 3 January 2017, from
http://gcoos.org/products/maps/glidertracker/
Xue, D., Wu, Z., Wang, S. (2015). Dynamical Analysis of Autonomous Underwater Glider
Formation with Environmental Uncertainties. China Tianjin University.
Thoft, P. And Murotsu, Y., (1986). Application of Structural Systems Reliability Theory.
Spinger-Verlag Berlin, Heidelberg.
Tropea, C., Yarin, A., & Foss, J. (2007). Springer handbook of experimental fluid mechanics.
Berlin: Springer.