Embed Size (px)
Citation preview
A report of a survey carried out across five denominations into giving habits and practices.
Produced by the Stewardship Network of the Churches Together in Britain and Ireland
November 2011
Page 2
CONTENTS
p3 Introduction
p4 A. Executive Summary
p5 B. The Methodology
p5 C. Who responded?
p9 D. The Age Time-bomb.
p10 E. All Givers Great and Small
p12 F. Methods of Giving
p14 G. Gift Aid
p14 H. Knowledge and Need
p16 I. Who feels guilty?
p18 J. Proportionate Giving
p21 K. Challenging church members with a specific giving target
p23 L. Teaching….. who doesn’t want it?
p24 M. Self Sufficiency, Income and Dependents
p26 N. Leadership and Home Groups
p27 O. Church and Other Charitable Giving
p28 P. Future Research
p29 Annex One : The Survey Form
Page 3
Introduction
It is my great pleasure to introduce this ‘Giving Insight’ report.
In commissioning this report, the Stewardship Network of the Churches Together in Britain and
Ireland recognised that churches of all denominations face major challenges, both in renewing and
growing the mission of God’s church and in underpinning it with effective Christian giving and
witness.
An anonymous quote rather unhelpfully, but perhaps insightfully, says about ecumenism, “Good
fences make good neighbours. Ecumenism tramples down fences and invites itself into others'
homes.” It is true that the strength of the ecumenical movement has ebbed and flowed over many
years and what it means to be ecumenical in 21st
century Britain is perhaps a very different thing to
what it meant in the mid to late 20th
century. I am pleased that the strength of this report lies not
in simply comparing and contrasting the statistics of the participating denominations, but in
exploring common factors, differing strengths and weaknesses and shared opportunities. It may
also help in putting into context the giving levels and motivators in our own denomination and may
dispel some deeply ingrained impressions or views that we might have held about giving within
other denominations.
Giving data, whilst interesting at a certain level, is of course nothing new – indeed each
denomination will collect and analyse such data on an annual basis and draw its own conclusions.
However, perhaps the ‘golden nugget’ within this report, lies in the research and findings
particularly concerned with giving ‘motivators’ and ‘triggers’. This is an area largely unexplored in
similar past surveys and reports and surely is essential in better understanding our givers and how
we might encourage, foster and grow Christian giving in the future.
The extensive data and comprehensive but clear reflections and conclusions form an excellent
platform for the presentations and discussions which will form part of the ‘Giving Insight’ day
conference, being held on 23rd
November 2011, at Salvation Army International Headquarters,
London, at which this report is to be formally launched and presented.
I offer my sincere thanks to all those officers and churches from the participating denominations
whose hard work and willing agreement ensured the collection of 1670 completed survey
questionnaires. A special debt of gratitude is owed to Dr. John Preston, National Stewardship &
Resources Officer, the Church of England, whose enthusiasm and skills have been pivotal in the
compilation and publication of this report and I offer him my thanks on behalf of the participating
churches and from all those whose future thinking and work will ultimately benefit from his efforts.
I am confident that this report represents a significant milestone in the long history of the CTBI
Stewardship Network and will continue our aim of promoting an ecumenism which builds ‘good
fences and make good neighbours’. I commend it to you.
Richard D Jones Chair – Churches Together in Britain & Ireland, Stewardship Network
November 2011
Page 4
A. Executive Summary
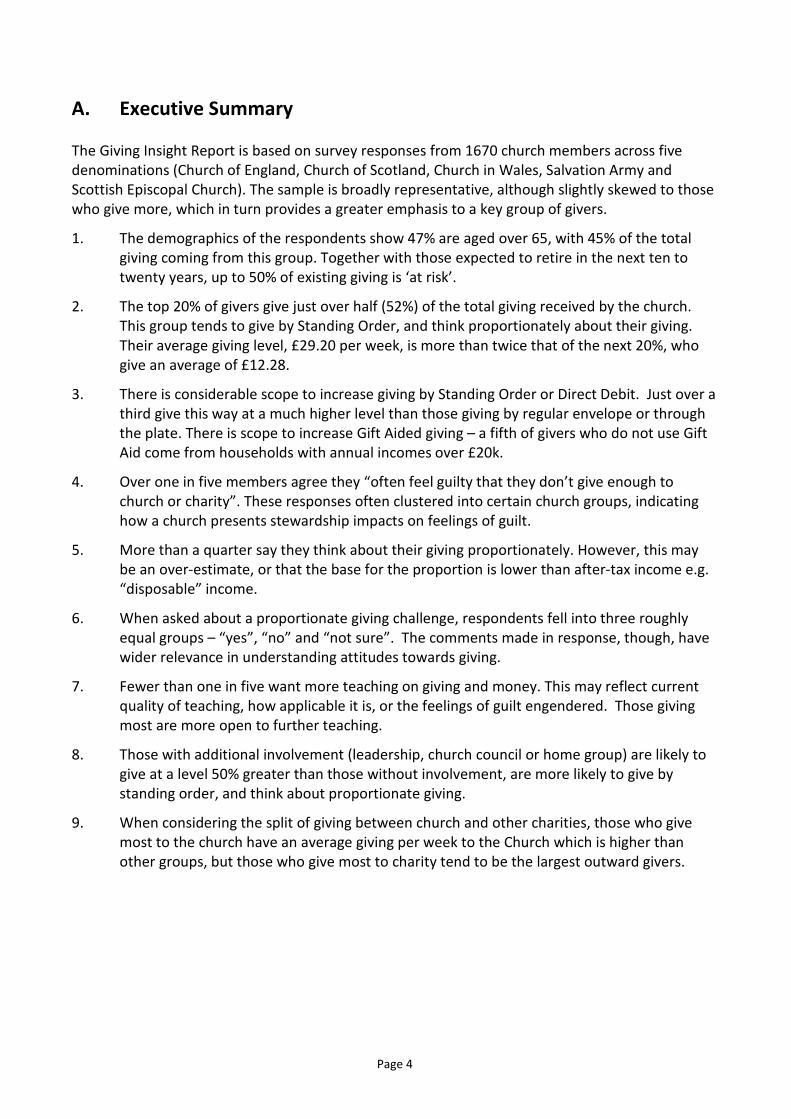
The Giving Insight Report is based on survey responses from 1670 church members across five
denominations (Church of England, Church of Scotland, Church in Wales, Salvation Army and
Scottish Episcopal Church). The sample is broadly representative, although slightly skewed to those
who give more, which in turn provides a greater emphasis to a key group of givers.
1. The demographics of the respondents show 47% are aged over 65, with 45% of the total
giving coming from this group. Together with those expected to retire in the next ten to
twenty years, up to 50% of existing giving is ‘at risk’.
2. The top 20% of givers give just over half (52%) of the total giving received by the church.
This group tends to give by Standing Order, and think proportionately about their giving.
Their average giving level, £29.20 per week, is more than twice that of the next 20%, who
give an average of £12.28.
3. There is considerable scope to increase giving by Standing Order or Direct Debit. Just over a
third give this way at a much higher level than those giving by regular envelope or through
the plate. There is scope to increase Gift Aided giving – a fifth of givers who do not use Gift
Aid come from households with annual incomes over £20k.
4. Over one in five members agree they “often feel guilty that they don’t give enough to
church or charity”. These responses often clustered into certain church groups, indicating
how a church presents stewardship impacts on feelings of guilt.
5. More than a quarter say they think about their giving proportionately. However, this may
be an over-estimate, or that the base for the proportion is lower than after-tax income e.g.
“disposable” income.
6. When asked about a proportionate giving challenge, respondents fell into three roughly
equal groups – “yes”, “no” and “not sure”. The comments made in response, though, have
wider relevance in understanding attitudes towards giving.
7. Fewer than one in five want more teaching on giving and money. This may reflect current
quality of teaching, how applicable it is, or the feelings of guilt engendered. Those giving
most are more open to further teaching.
8. Those with additional involvement (leadership, church council or home group) are likely to
give at a level 50% greater than those without involvement, are more likely to give by
standing order, and think about proportionate giving.
9. When considering the split of giving between church and other charities, those who give
most to the church have an average giving per week to the Church which is higher than
other groups, but those who give most to charity tend to be the largest outward givers.
Page 5
B. The Methodology
The Giving Insight survey was carried out by self-completion questionnaire across five
denominations. In most cases, Stewardship Advisers invited a selection of churches considered to
be representative of the wider denomination to participate. 1670 responses were received from
over 80 churches. 762 responses came from 38 Church of England churches, 148 Salvation Army
responses from 8 corps, 254 responses from 9 churches in the Church in Wales, and 260 responses
from 24 churches of the Scottish Episcopal Church. In the Church of Scotland, participants at a
conference provided 252 responses: this provided a geographical spread across the Church of
Scotland but appears to have led to a high proportion of individual respondents being office
bearers in congregations. Thus this research method gathered a sufficiently large sample at
minimal cost.
The drawback of a self-completion survey is those feeling more comfortable about giving are more
likely to complete and return the survey forms, giving a potentially skewed picture, although
samples can, if necessary, be post-stratified to ensure that the survey population is representative
e.g. on the basis of age if details of the population are known.
Alternative methods were considered:
a) Telephone questionnaire. Typically denominations don’t have good databases of planned
givers other than the local church level. Further, there were felt to be privacy issues, and a
reluctance to participate, if givers were approached over the phone.
b) Face to face interviews. Planned givers to churches are a relatively small proportion of the
population, interviews would therefore be difficult to carry out in the street. Placed
interviews (e.g. in churches on Sundays) would be expensive, particularly in covering over
80 churches.
c) Internet questionnaire. Although cheap and flexible, it was felt the population of
churchgoers to be insufficiently IT literate to get a representative sample.
The survey form is provided at Annex One. In addition, background data on participating churches
was captured relating to size, context (rural, urban etc), when a stewardship programme was last
run and the level of contribution sought by the national church towards the cost of ministry.
The survey was run between September 2010 and Easter 2011.
C. Who responded?
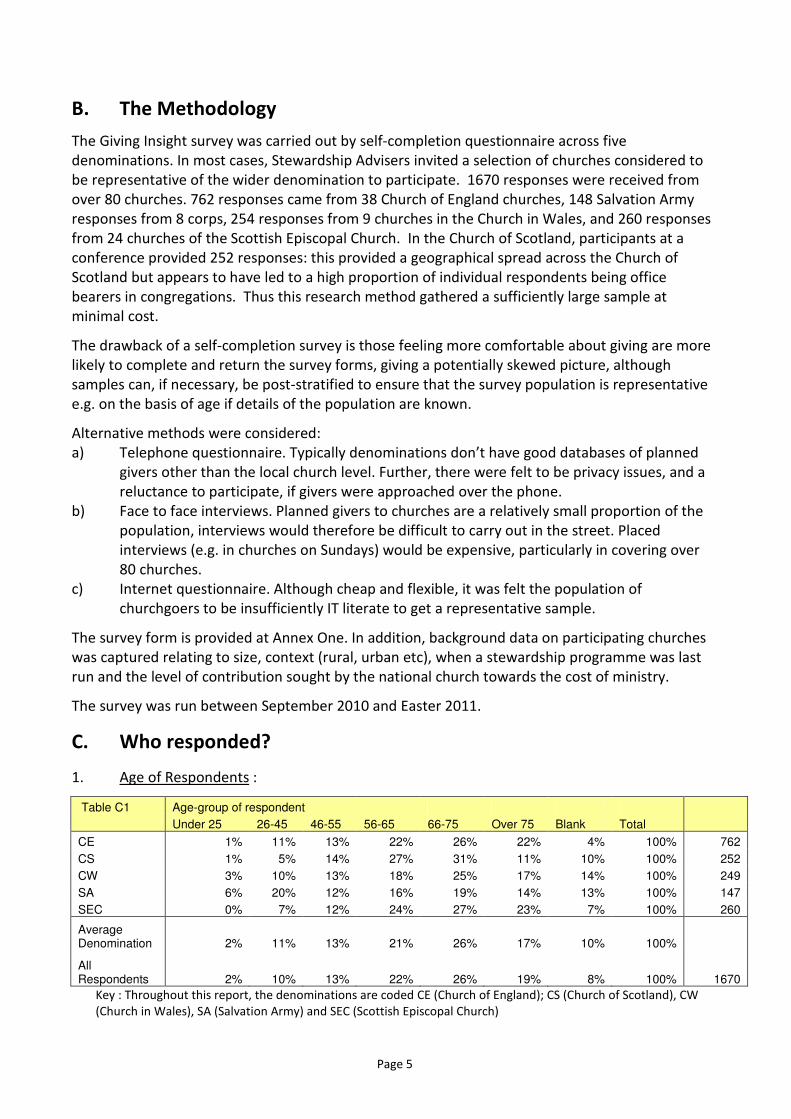
1. Age of Respondents :
Table C1 Age-group of respondent
Under 25 26-45 46-55 56-65 66-75 Over 75 Blank Total
CE 1% 11% 13% 22% 26% 22% 4% 100% 762
CS 1% 5% 14% 27% 31% 11% 10% 100% 252
CW 3% 10% 13% 18% 25% 17% 14% 100% 249
SA 6% 20% 12% 16% 19% 14% 13% 100% 147
SEC 0% 7% 12% 24% 27% 23% 7% 100% 260
Average Denomination 2% 11% 13% 21% 26% 17% 10% 100%
All Respondents 2% 10% 13% 22% 26% 19% 8% 100% 1670
Key : Throughout this report, the denominations are coded CE (Church of England); CS (Church of Scotland), CW
(Church in Wales), SA (Salvation Army) and SEC (Scottish Episcopal Church)
Page 6
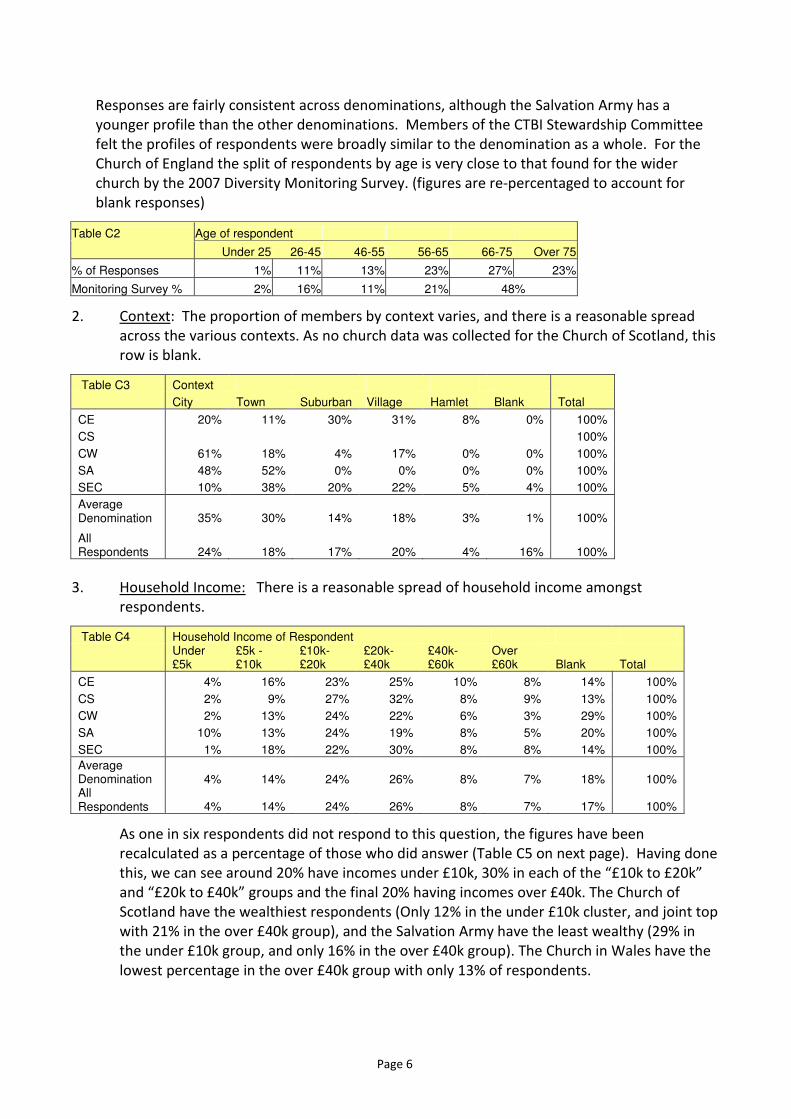
Responses are fairly consistent across denominations, although the Salvation Army has a
younger profile than the other denominations. Members of the CTBI Stewardship Committee
felt the profiles of respondents were broadly similar to the denomination as a whole. For the
Church of England the split of respondents by age is very close to that found for the wider
church by the 2007 Diversity Monitoring Survey. (figures are re-percentaged to account for
blank responses)
Table C2 Age of respondent
Under 25 26-45 46-55 56-65 66-75 Over 75
% of Responses 1% 11% 13% 23% 27% 23%
Monitoring Survey % 2% 16% 11% 21% 48%
2. Context: The proportion of members by context varies, and there is a reasonable spread
across the various contexts. As no church data was collected for the Church of Scotland, this
row is blank.
Table C3 Context
City Town Suburban Village Hamlet Blank Total
CE 20% 11% 30% 31% 8% 0% 100%
CS 100%
CW 61% 18% 4% 17% 0% 0% 100%
SA 48% 52% 0% 0% 0% 0% 100%
SEC 10% 38% 20% 22% 5% 4% 100%
Average Denomination 35% 30% 14% 18% 3% 1% 100%
All Respondents 24% 18% 17% 20% 4% 16% 100%
3. Household Income: There is a reasonable spread of household income amongst
respondents.
Table C4 Household Income of Respondent
Under £5k
£5k - £10k
£10k-£20k
£20k-£40k
£40k-£60k
Over £60k Blank Total
CE 4% 16% 23% 25% 10% 8% 14% 100%
CS 2% 9% 27% 32% 8% 9% 13% 100%
CW 2% 13% 24% 22% 6% 3% 29% 100%
SA 10% 13% 24% 19% 8% 5% 20% 100%
SEC 1% 18% 22% 30% 8% 8% 14% 100%
Average Denomination 4% 14% 24% 26% 8% 7% 18% 100% All Respondents 4% 14% 24% 26% 8% 7% 17% 100%
As one in six respondents did not respond to this question, the figures have been
recalculated as a percentage of those who did answer (Table C5 on next page). Having done
this, we can see around 20% have incomes under £10k, 30% in each of the “£10k to £20k”
and “£20k to £40k” groups and the final 20% having incomes over £40k. The Church of
Scotland have the wealthiest respondents (Only 12% in the under £10k cluster, and joint top
with 21% in the over £40k group), and the Salvation Army have the least wealthy (29% in
the under £10k group, and only 16% in the over £40k group). The Church in Wales have the
lowest percentage in the over £40k group with only 13% of respondents.
Page 7
Table C5 Household Income of Respondent
Under £5k
£5k - £10k
£10k-£20k
£20k-£40k
£40k-£60k
Over £60k Total
CE 5% 18% 27% 29% 11% 10% 100%
CS 2% 10% 31% 37% 10% 11% 100%
CW 3% 18% 34% 32% 8% 5% 100%
SA 13% 16% 31% 24% 10% 6% 100%
SEC 1% 21% 25% 35% 9% 9% 100%
Average Denomination 5% 17% 30% 31% 10% 8% 100%
All Respondents 4% 17% 29% 31% 10% 9% 100%
4. Size of Church: This is another useful way of checking the survey sample is reasonably
representative. As no data was collected for the Church of Scotland, this row is blank. For
the Church of England, the picture is reasonable with a slight under-representation of the
very largest churches, but the second group being over-represented.
Table C6 Size of Church
>150 100-150 70-100 40-70 20-40 <20 Blank Total
CE 7% 35% 17% 13% 23% 5% 0% 100%
CS 100% 100%
CW 0% 0% 50% 39% 0% 12% 0% 100%
SA 0% 18% 35% 44% 3% 0% 0% 100%
SEC 4% 17% 7% 20% 36% 16% 0% 100%
All Respondents 2% 10% 13% 22% 26% 19% 8% 100%
5. Length of Church Association: There is a reasonable similarity between denominations,
although Salvation Army respondents have spent less time in their current church on
average, and Church of Scotland ones longer.
Table C7 Length of Attendance at Current Church
<6m 6m - 1yr 1yr - 3yrs 3 - 10yrs 10yrs+ (blank) Total
CE 2% 2% 8% 21% 66% 1% 100%
CS 0% 0% 4% 11% 84% 0% 100%
CW 2% 2% 11% 16% 69% 0% 100%
SA 7% 4% 14% 15% 60% 0% 100%
SEC 0% 2% 6% 24% 67% 4% 100%
Average Denomination 2% 2% 9% 17% 69% 1% 100% All Respondents 2% 2% 8% 19% 69% 1% 100%
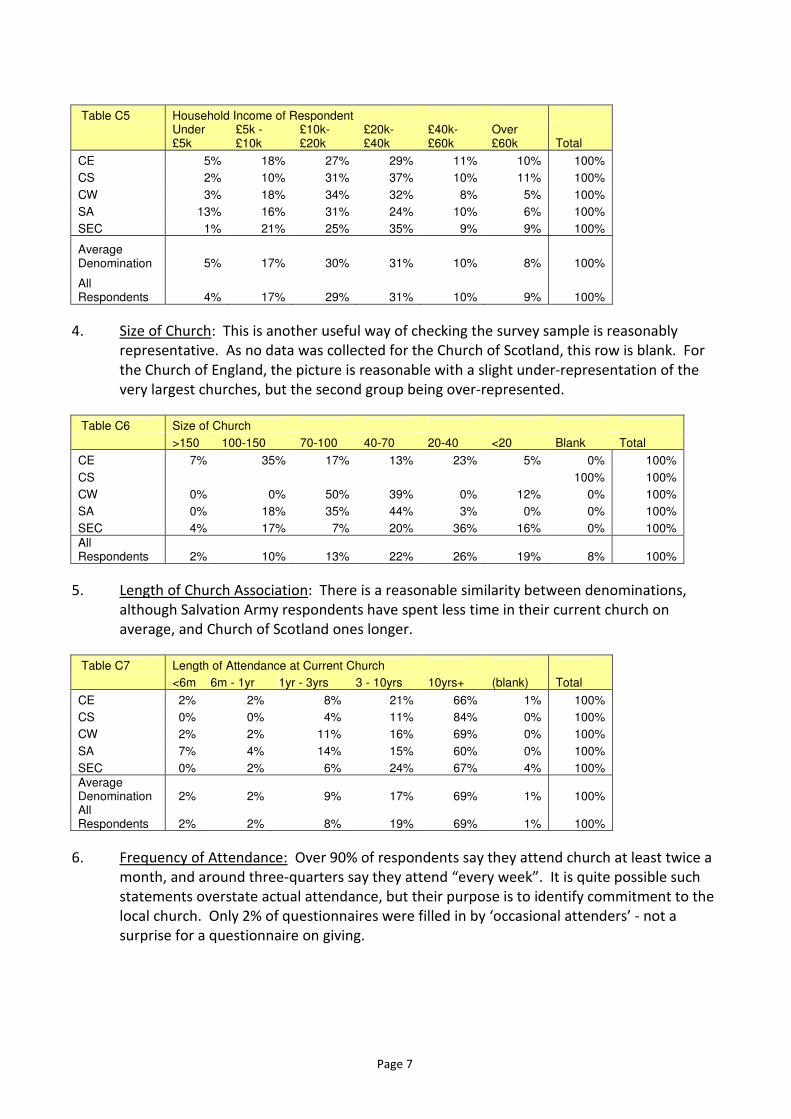
6. Frequency of Attendance: Over 90% of respondents say they attend church at least twice a
month, and around three-quarters say they attend “every week”. It is quite possible such
statements overstate actual attendance, but their purpose is to identify commitment to the
local church. Only 2% of questionnaires were filled in by ‘occasional attenders’ - not a
surprise for a questionnaire on giving.
Page 8
Table C8 Frequency of Attendance
"Every Week"
2/3x per month
1/2x per month
Occasion-ally Never (blank) Total
CE 67% 21% 9% 2% 0% 1% 100%
CS 79% 15% 4% 2% 1% 0% 100%
CW 74% 18% 5% 2% 0% 0% 100%
SA 91% 6% 2% 0% 1% 0% 100%
SEC 76% 16% 7% 1% 0% 0% 100%
Average Denomination 77% 15% 5% 2% 0% 0% 100%
All Respondents 73% 18% 6% 2% 0% 1% 100%
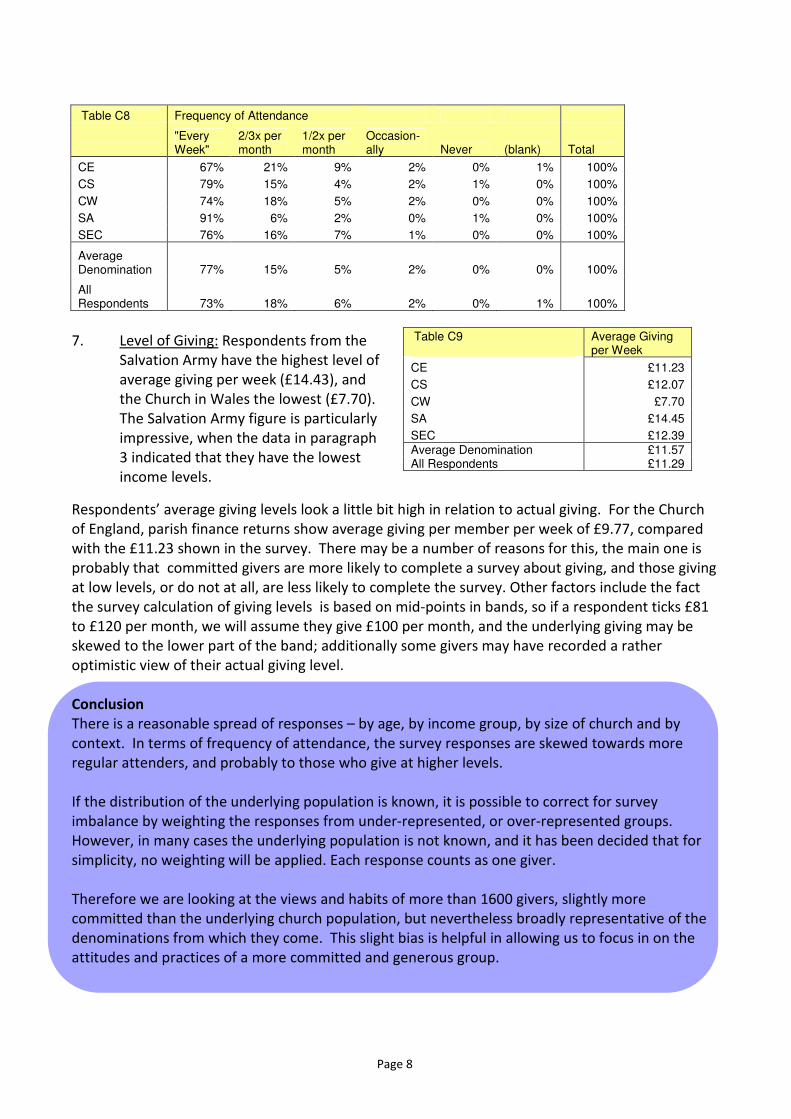
7. Level of Giving: Respondents from the
Salvation Army have the highest level of
average giving per week (£14.43), and
the Church in Wales the lowest (£7.70).
The Salvation Army figure is particularly
impressive, when the data in paragraph
3 indicated that they have the lowest
income levels.
Respondents’ average giving levels look a little bit high in relation to actual giving. For the Church
of England, parish finance returns show average giving per member per week of £9.77, compared
with the £11.23 shown in the survey. There may be a number of reasons for this, the main one is
probably that committed givers are more likely to complete a survey about giving, and those giving
at low levels, or do not at all, are less likely to complete the survey. Other factors include the fact
the survey calculation of giving levels is based on mid-points in bands, so if a respondent ticks £81
to £120 per month, we will assume they give £100 per month, and the underlying giving may be
skewed to the lower part of the band; additionally some givers may have recorded a rather
optimistic view of their actual giving level.
Conclusion
There is a reasonable spread of responses – by age, by income group, by size of church and by
context. In terms of frequency of attendance, the survey responses are skewed towards more
regular attenders, and probably to those who give at higher levels.
If the distribution of the underlying population is known, it is possible to correct for survey
imbalance by weighting the responses from under-represented, or over-represented groups.
However, in many cases the underlying population is not known, and it has been decided that for
simplicity, no weighting will be applied. Each response counts as one giver.
Therefore we are looking at the views and habits of more than 1600 givers, slightly more
committed than the underlying church population, but nevertheless broadly representative of the
denominations from which they come. This slight bias is helpful in allowing us to focus in on the
attitudes and practices of a more committed and generous group.
Table C9
Average Giving per Week
CE £11.23
CS £12.07
CW £7.70
SA £14.45
SEC £12.39
Average Denomination £11.57 All Respondents £11.29
Page 9
D. The Age Time-Bomb
In many churches there is a clear skew to the older age-groups. 10% of respondents chose not to
answer this question so the figures have been re-percentaged. On the basis of these responses,
47% of the average denomination are over 65. The chart below maps out the proportion of
respondents, and the share of total giving, coming from each age group.
Table D1 Age-group of respondent
Under 25 26-45 46-55 56-65 66-75 Over 75 Total
CE % of respondents 1% 12% 14% 23% 27% 23% 100%
% of giving 1% 12% 16% 29% 26% 16% 100%
CS % of respondents 1% 6% 16% 30% 35% 12% 100%
% of giving 0% 3% 16% 29% 39% 13% 100%
CW % of respondents 3% 12% 15% 21% 29% 20% 100%
% of giving 1% 13% 17% 21% 32% 16% 100%
SA % of respondents 7% 23% 14% 18% 22% 16% 100%
% of giving 2% 24% 15% 23% 21% 16% 100%
SEC % of respondents 0% 7% 13% 26% 29% 25% 100%
% of giving 1% 11% 17% 26% 20% 25% 100%
% of respondents 3% 12% 14% 24% 28% 19% 100%
% of giving 1% 13% 16% 26% 28% 17% 100% Average Denomination
Average Giving/Wk £5.24 £12.30 £13.03 £12.93 £11.05 £9.57 £11.29
This reveals two potential ‘time-bombs’ in terms of the sustainability of the church’s income….
a) The contribution of the retired…..
For the average denomination, 47% of the respondents are aged over 65, and might reasonably be
assumed to be retired and living on pension income. This varies by denomination, at one end, the
Scottish Episcopal Church having 54% and the Church of England having 50%; and at the other end
the Salvation Army having 38%. Please note the sampling methods used by this survey are not
sufficiently robust to yield accurate estimates of the size of age cohorts, although the Church of
England sample is broadly in line with the 2007 Diversity Monitoring survey which showed 48% of C
of E members being over 65.
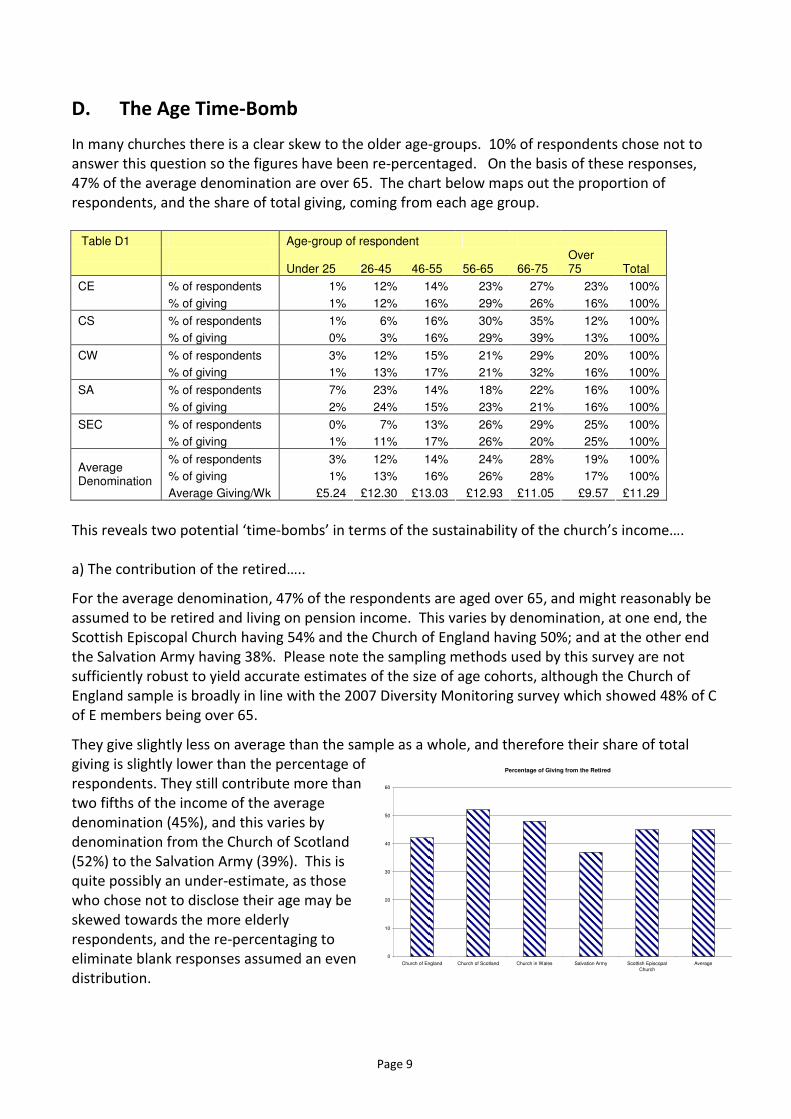
They give slightly less on average than the sample as a whole, and therefore their share of total
giving is slightly lower than the percentage of
respondents. They still contribute more than
two fifths of the income of the average
denomination (45%), and this varies by
denomination from the Church of Scotland
(52%) to the Salvation Army (39%). This is
quite possibly an under-estimate, as those
who chose not to disclose their age may be
skewed towards the more elderly
respondents, and the re-percentaging to
eliminate blank responses assumed an even
distribution.
Percentage of Giving from the Retired
0
10
20
30
40
50
60
Church of England Church of Scotland Church in Wales Salvation Army Scottish Episcopal
Church
Average
Page 10
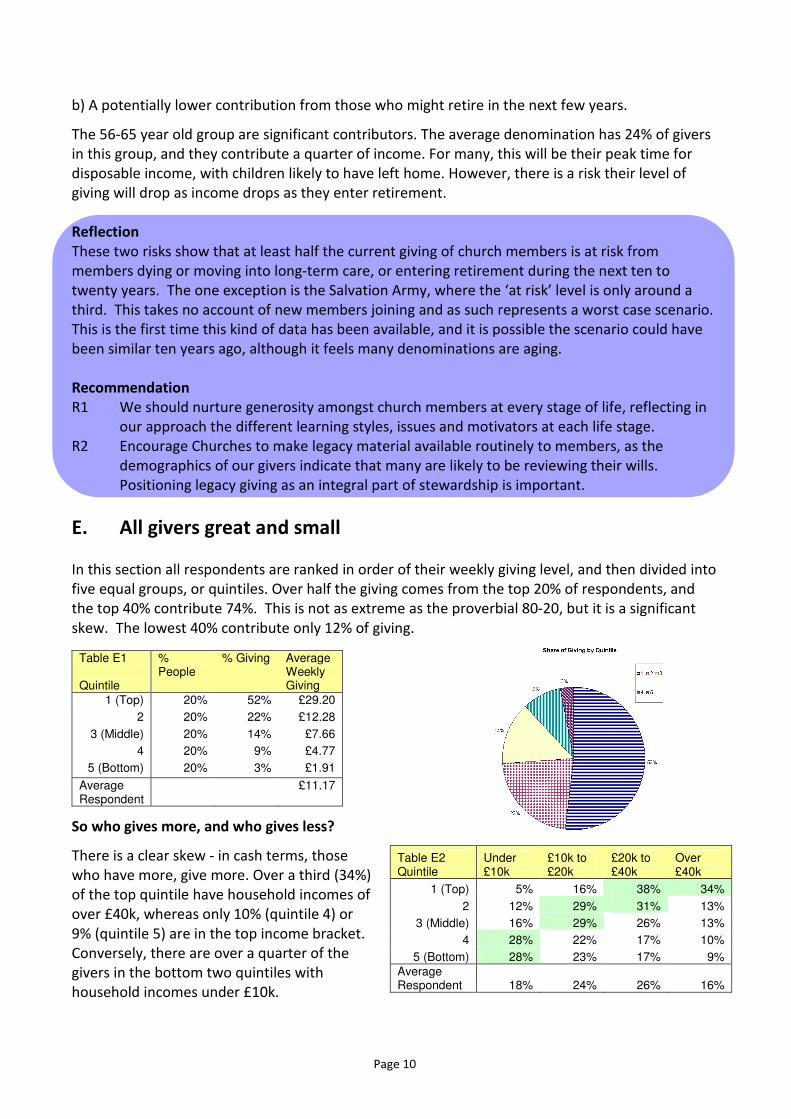
b) A potentially lower contribution from those who might retire in the next few years.
The 56-65 year old group are significant contributors. The average denomination has 24% of givers
in this group, and they contribute a quarter of income. For many, this will be their peak time for
disposable income, with children likely to have left home. However, there is a risk their level of
giving will drop as income drops as they enter retirement.
Reflection
These two risks show that at least half the current giving of church members is at risk from
members dying or moving into long-term care, or entering retirement during the next ten to
twenty years. The one exception is the Salvation Army, where the ‘at risk’ level is only around a
third. This takes no account of new members joining and as such represents a worst case scenario.
This is the first time this kind of data has been available, and it is possible the scenario could have
been similar ten years ago, although it feels many denominations are aging.
Recommendation
R1 We should nurture generosity amongst church members at every stage of life, reflecting in
our approach the different learning styles, issues and motivators at each life stage.
R2 Encourage Churches to make legacy material available routinely to members, as the
demographics of our givers indicate that many are likely to be reviewing their wills.
Positioning legacy giving as an integral part of stewardship is important.
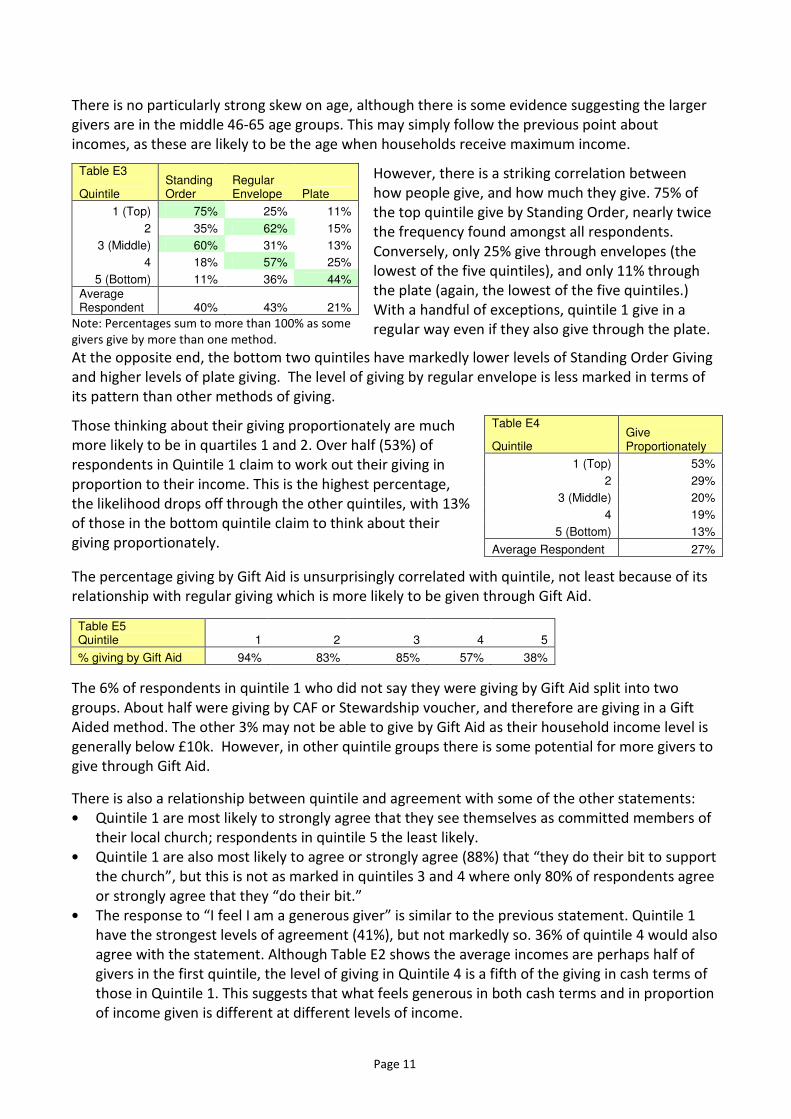
E. All givers great and small
In this section all respondents are ranked in order of their weekly giving level, and then divided into
five equal groups, or quintiles. Over half the giving comes from the top 20% of respondents, and
the top 40% contribute 74%. This is not as extreme as the proverbial 80-20, but it is a significant
skew. The lowest 40% contribute only 12% of giving.
Table E1 Quintile
% People
% Giving Average Weekly Giving
1 (Top) 20% 52% £29.20
2 20% 22% £12.28
3 (Middle) 20% 14% £7.66
4 20% 9% £4.77
5 (Bottom) 20% 3% £1.91
Average Respondent
£11.17
So who gives more, and who gives less?
There is a clear skew - in cash terms, those
who have more, give more. Over a third (34%)
of the top quintile have household incomes of
over £40k, whereas only 10% (quintile 4) or
9% (quintile 5) are in the top income bracket.
Conversely, there are over a quarter of the
givers in the bottom two quintiles with
household incomes under £10k.
Table E2 Quintile
Under £10k
£10k to £20k
£20k to £40k
Over £40k
1 (Top) 5% 16% 38% 34%
2 12% 29% 31% 13%
3 (Middle) 16% 29% 26% 13%
4 28% 22% 17% 10%
5 (Bottom) 28% 23% 17% 9%
Average Respondent 18% 24% 26% 16%
Page 11
There is no particularly strong skew on age, although there is some evidence suggesting the larger
givers are in the middle 46-65 age groups. This may simply follow the previous point about
incomes, as these are likely to be the age when households receive maximum income.
Table E3
Quintile Standing Order
Regular Envelope Plate
1 (Top) 75% 25% 11%
2 35% 62% 15%
3 (Middle) 60% 31% 13%
4 18% 57% 25%
5 (Bottom) 11% 36% 44%
Average Respondent 40% 43% 21%
Note: Percentages sum to more than 100% as some
givers give by more than one method.
However, there is a striking correlation between
how people give, and how much they give. 75% of
the top quintile give by Standing Order, nearly twice
the frequency found amongst all respondents.
Conversely, only 25% give through envelopes (the
lowest of the five quintiles), and only 11% through
the plate (again, the lowest of the five quintiles.)
With a handful of exceptions, quintile 1 give in a
regular way even if they also give through the plate.
At the opposite end, the bottom two quintiles have markedly lower levels of Standing Order Giving
and higher levels of plate giving. The level of giving by regular envelope is less marked in terms of
its pattern than other methods of giving.
Those thinking about their giving proportionately are much
more likely to be in quartiles 1 and 2. Over half (53%) of
respondents in Quintile 1 claim to work out their giving in
proportion to their income. This is the highest percentage,
the likelihood drops off through the other quintiles, with 13%
of those in the bottom quintile claim to think about their
giving proportionately.
Table E4
Quintile Give Proportionately
1 (Top) 53%
2 29%
3 (Middle) 20%
4 19%
5 (Bottom) 13%
Average Respondent 27%
The percentage giving by Gift Aid is unsurprisingly correlated with quintile, not least because of its
relationship with regular giving which is more likely to be given through Gift Aid.
Table E5 Quintile 1 2 3 4 5
% giving by Gift Aid 94% 83% 85% 57% 38%
The 6% of respondents in quintile 1 who did not say they were giving by Gift Aid split into two
groups. About half were giving by CAF or Stewardship voucher, and therefore are giving in a Gift
Aided method. The other 3% may not be able to give by Gift Aid as their household income level is
generally below £10k. However, in other quintile groups there is some potential for more givers to
give through Gift Aid.
There is also a relationship between quintile and agreement with some of the other statements:
• Quintile 1 are most likely to strongly agree that they see themselves as committed members of
their local church; respondents in quintile 5 the least likely.
• Quintile 1 are also most likely to agree or strongly agree (88%) that “they do their bit to support
the church”, but this is not as marked in quintiles 3 and 4 where only 80% of respondents agree
or strongly agree that they “do their bit.”
• The response to “I feel I am a generous giver” is similar to the previous statement. Quintile 1
have the strongest levels of agreement (41%), but not markedly so. 36% of quintile 4 would also
agree with the statement. Although Table E2 shows the average incomes are perhaps half of
givers in the first quintile, the level of giving in Quintile 4 is a fifth of the giving in cash terms of
those in Quintile 1. This suggests that what feels generous in both cash terms and in proportion
of income given is different at different levels of income.
Page 12
Reflection
Our Churches’ income is largely dependent upon about 40% of givers, who give three quarters of
the voluntary income. This is not as extreme as an “80% from 20%” split, but it is significant.
Churches tend not to treat donors any differently, but there are some pointers suggesting we may
need to support our largest donors better, even if provision is available to all e.g. advice on Gift Aid
for higher-rate taxpayers.
Recommendation
R3 Donors should be encouraged to give via Standing Order or Direct Debit. We cannot prove
that doing so would increase giving, but it is clear that givers using these methods tend to
give at significantly higher levels.
F. Methods of Giving
We asked respondents how they give financially to their local church, offering them five different
methods of giving, and asking them to tick as many ways as applied to them.
Table F1 Standing Order/DD
Regular Envelope Plate
CAF Voucher
One-off Gift Aid
Avg no of ways
Church of England 44.8% 37.3% 24.4% 1.3% 7.4% 1.15
Church of Scotland 37.7% 50.4% 23.8% 17.5% 6.0% 1.35
Church in Wales 27.3% 50.6% 24.9% 0.0% 6.8% 1.10
Salvation Army 21.3% 51.7% 23.1% 1.4% 8.2% 1.06
Scottish Episcopal Church 50.4% 36.9% 21.5% 0.4% 10.8% 1.20
Average Denomination 36.3% 45.4% 23.8% 4.1% 7.8% 1.17
For the Scottish Episcopal Church and the Church of England, Standing Order is the most common
method of giving. The other three denominations have envelope giving as the most common
method of giving. In all five denominations, between one in five and one in four givers use the
plate (although this is the most likely method of giving to be used by those giving in other ways.)
Between 5% and 10% use a one-off Gift Aid envelope. In general, very few givers use a CAF or
Stewardship Account, apart from in the Church in Scotland where almost one in five say they do,
although we believe this to be an error.
The majority of givers (85%) say they only use one method of giving, 11% say they use two
methods, and 2% say they use three. The most common application is for Standing Order givers to
give in church in some way in addition. A quarter of Standing Order givers also give either regularly
or occasionally using plate (10%), Regular Envelope (8%) or one-off Gift Aid envelope (7%)
The amount given by
method varies,
although there is
broad consistency
within this.
Standing Orders tend
to have the highest
level of average
Table F2 Weekly Average Giving
Standing Order/DD
Regular Envelope Plate
CAF Voucher
One-off Gift Aid
Church of England £16.49 £8.40 £5.46 £24.81 £12.88
Church of Scotland £15.82 £10.14 £20.31 £5.74 £10.91
Church in Wales £14.50 £7.18 £3.97 £5.54
Salvation Army £21.71 £15.26 £11.31 £23.08 £14.71
Scottish Episcopal Church £16.57 £9.98 £10.85 £9.23 £13.45
Average Denomination £17.02 £10.19 £10.38 £15.72 £11.50
Average Respondent £16.46 £9.50 £7.62 £9.75 £11.96
weekly giving .This is followed by those who use Regular Envelopes, and the lowest levels of giving
are usually associated with plate giving. The exception is the Church of Scotland, where plate giving
Page 13
is shown as the highest method of giving, although this can probably be discounted as the sample is
very small (only 14 responses). One-off Gift Aid envelopes can be used for a wide range of
purposes, from an ad-hoc donation at a Gift Day, when large amounts might be given, or in lieu of a
regular giving envelope for givers in rural teams who may be worshipping in a different church on a
Sunday when their church has no service.
Combining this data provides an estimated share of giving. Across all the respondents nearly half of
giving (49%) is given by Standing Order or Direct Debit and 30% by regular Envelope.
Table F3 Standing Order/DD
Regular Envelope Plate
CAF Voucher
One-off Gift Aid
% of Respondents 39.9% 42.5% 21.3% 3.5% 7.7%
Average Giving/Week £16.46 £9.50 £7.62 £9.75 £11.96
Share of Giving 49% 30% 12% 3% 7%
The data shows the three most popular forms of regular, planned giving (Standing Orders, Regular
Envelopes and Plate givers) have quite different profiles.
a. A higher proportion of Standing Order givers have household incomes over £20k
Table F4
<£20k £20k-£40k >£40k Total
Regular Envelopes 60% 28% 12% 100%
Standing Orders 35% 37% 26% 100%
Plate Givers 53% 29% 16% 100%
Note: re-percentaged to allow for blank responses.
b. Younger church members are relatively more likely to give through the plate or by regular
envelope than by Standing Order. Only 6% of Standing Order givers are under 45, compared
with 13% of envelope givers and 21% of plate givers.
Table F5 Under 45 45 to 65 Over 65 Total
Regular Envelopes 13% 43% 44% 100%
Standing Orders 6% 36% 54% 100%
Plate Givers 21% 37% 41% 100%
Note: re-percentaged to allow for blank responses.
c. Plate givers are far less likely to think about their giving proportionately. Only 16% of those
givers who give through the plate claim to think about their giving proportionately,
compared with 28% of regular envelope givers, and 31% of standing order givers.
G. Gift Aid
The vast majority of respondents answered the question about whether they gave through Gift Aid.
Just under three-quarters of respondents said they give through Gift Aid (73%) and just over a
quarter (27%), said they did not. Those giving through Gift Aid give at a higher level, and on the
basis of the estimations made about giving levels, around seven-eighths of giving (87%) is from
givers who use Gift Aid. However, not all of their giving is given under Gift Aid – there is a small
amount from some standing order givers who also give through the plate that seems less likely to
be covered by Gift Aid.
Page 14
Conclusion
There is still some opportunity to increase Gift Aid effectiveness, around one in four givers not
using Gift Aid claim to have household incomes in excess of £20,000, indicating there is at least one
taxpayer in the household.
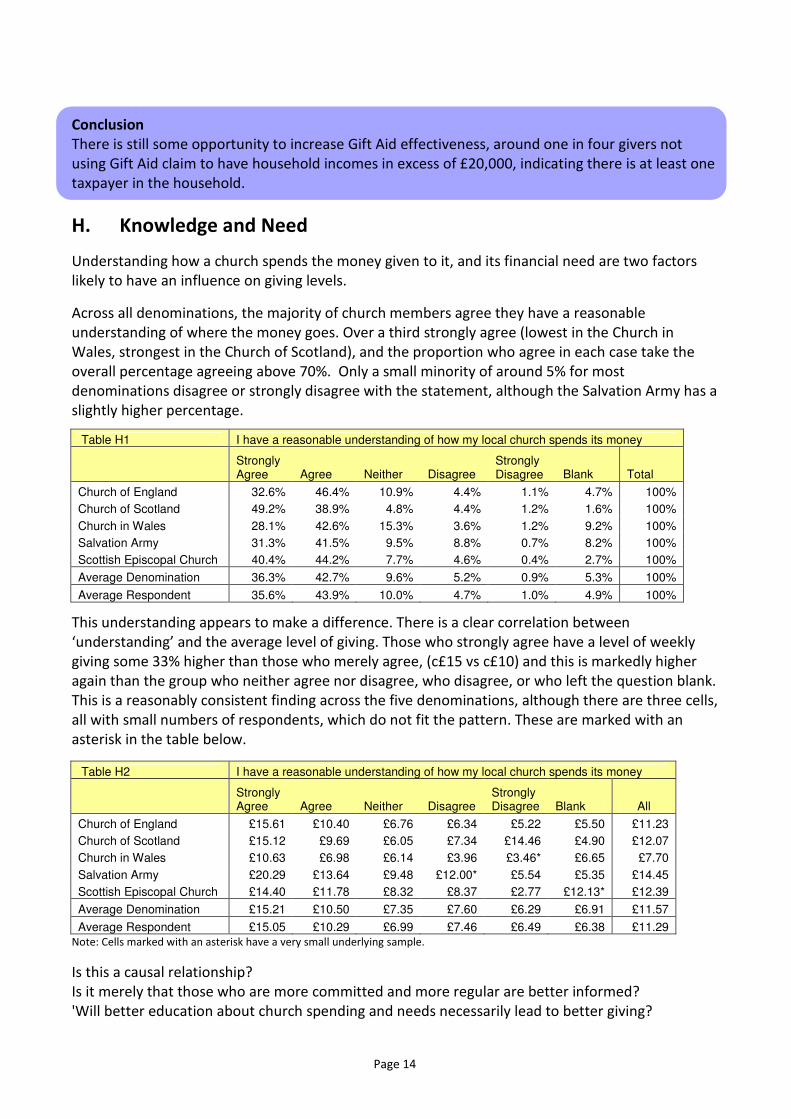
H. Knowledge and Need
Understanding how a church spends the money given to it, and its financial need are two factors
likely to have an influence on giving levels.
Across all denominations, the majority of church members agree they have a reasonable
understanding of where the money goes. Over a third strongly agree (lowest in the Church in
Wales, strongest in the Church of Scotland), and the proportion who agree in each case take the
overall percentage agreeing above 70%. Only a small minority of around 5% for most
denominations disagree or strongly disagree with the statement, although the Salvation Army has a
slightly higher percentage.
Table H1 I have a reasonable understanding of how my local church spends its money
Strongly Agree Agree Neither Disagree
Strongly Disagree Blank Total
Church of England 32.6% 46.4% 10.9% 4.4% 1.1% 4.7% 100%
Church of Scotland 49.2% 38.9% 4.8% 4.4% 1.2% 1.6% 100%
Church in Wales 28.1% 42.6% 15.3% 3.6% 1.2% 9.2% 100%
Salvation Army 31.3% 41.5% 9.5% 8.8% 0.7% 8.2% 100%
Scottish Episcopal Church 40.4% 44.2% 7.7% 4.6% 0.4% 2.7% 100%
Average Denomination 36.3% 42.7% 9.6% 5.2% 0.9% 5.3% 100%
Average Respondent 35.6% 43.9% 10.0% 4.7% 1.0% 4.9% 100%
This understanding appears to make a difference. There is a clear correlation between
‘understanding’ and the average level of giving. Those who strongly agree have a level of weekly
giving some 33% higher than those who merely agree, (c£15 vs c£10) and this is markedly higher
again than the group who neither agree nor disagree, who disagree, or who left the question blank.
This is a reasonably consistent finding across the five denominations, although there are three cells,
all with small numbers of respondents, which do not fit the pattern. These are marked with an
asterisk in the table below.
Table H2 I have a reasonable understanding of how my local church spends its money
Strongly Agree Agree Neither Disagree
Strongly Disagree Blank All
Church of England £15.61 £10.40 £6.76 £6.34 £5.22 £5.50 £11.23
Church of Scotland £15.12 £9.69 £6.05 £7.34 £14.46 £4.90 £12.07
Church in Wales £10.63 £6.98 £6.14 £3.96 £3.46* £6.65 £7.70
Salvation Army £20.29 £13.64 £9.48 £12.00* £5.54 £5.35 £14.45
Scottish Episcopal Church £14.40 £11.78 £8.32 £8.37 £2.77 £12.13* £12.39
Average Denomination £15.21 £10.50 £7.35 £7.60 £6.29 £6.91 £11.57
Average Respondent £15.05 £10.29 £6.99 £7.46 £6.49 £6.38 £11.29
Note: Cells marked with an asterisk have a very small underlying sample.
Is this a causal relationship?
Is it merely that those who are more committed and more regular are better informed?
'Will better education about church spending and needs necessarily lead to better giving?
Page 15
• Over 90% of those who strongly agree they have a reasonable understanding of how the local
church spends its money, also strongly agree they see themselves as committed members of
their local church (Q11a). This group of 532 respondents have an average giving level of £15.58
• Of those who only agree that they have a reasonable understanding of how the local church
spends its money, just 50% would also strongly agree that they see themselves as committed
members of the local church. This group of 361 respondents has a lower giving level, with an
average weekly giving of £11.67.
• A further 45% of those who only agreed that they have a reasonable understanding of how the
local church spends its money also only agree that they are committed members of their local
church. This group of 328 respondents has an average weekly level of giving of £9.36
Conclusion
Those who are strongly committed are also very likely to have a clear understanding of how the
church spends its money. These two factors combine to give a significantly higher giving level.
However, for those who are slightly less committed, the degree to which they understand where
the money goes does make a significant difference to their level of giving, with a weekly giving level
25% higher (£11.67 vs £9.36).
Recommendation
R4 It is important churches continue to communicate their collective stewardship of the money
entrusted to them. It is important donors know where the money has been spent, as it
does affect the level at which they are willing to give, especially those who are in the second
strongest group in terms of commitment to their Church.
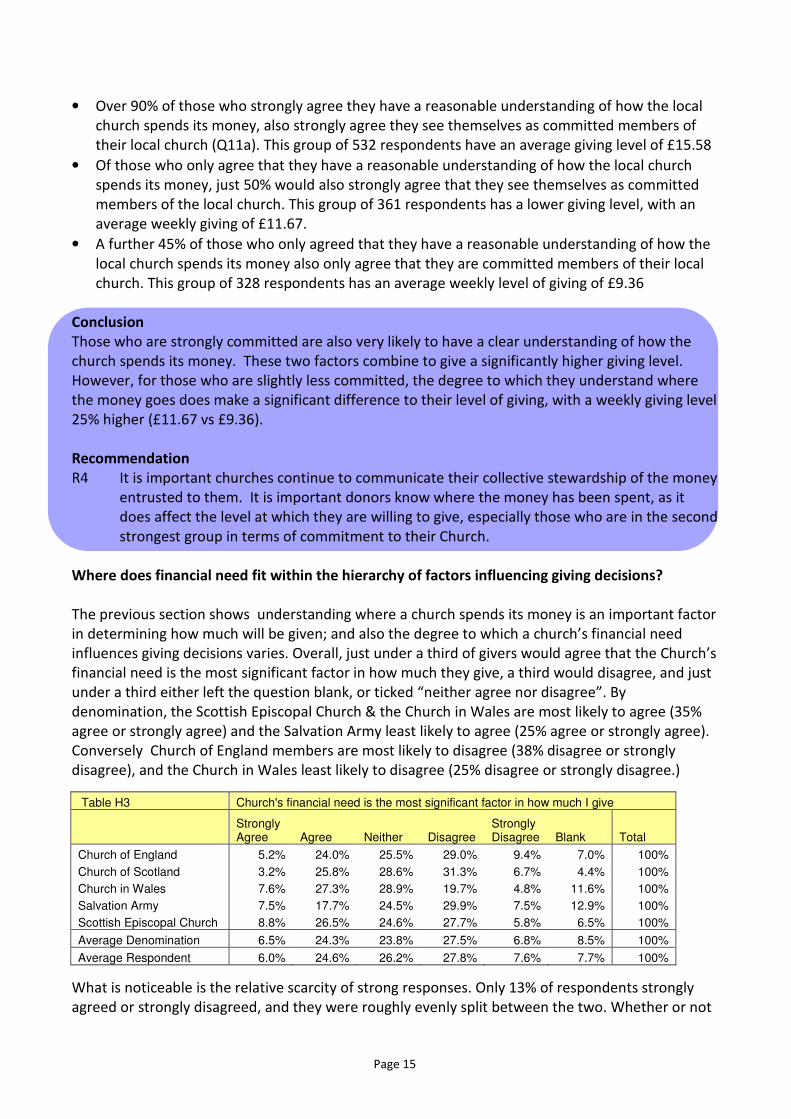
Where does financial need fit within the hierarchy of factors influencing giving decisions?
The previous section shows understanding where a church spends its money is an important factor
in determining how much will be given; and also the degree to which a church’s financial need
influences giving decisions varies. Overall, just under a third of givers would agree that the Church’s
financial need is the most significant factor in how much they give, a third would disagree, and just
under a third either left the question blank, or ticked “neither agree nor disagree”. By
denomination, the Scottish Episcopal Church & the Church in Wales are most likely to agree (35%
agree or strongly agree) and the Salvation Army least likely to agree (25% agree or strongly agree).
Conversely Church of England members are most likely to disagree (38% disagree or strongly
disagree), and the Church in Wales least likely to disagree (25% disagree or strongly disagree.)
Table H3 Church's financial need is the most significant factor in how much I give
Strongly Agree Agree Neither Disagree
Strongly Disagree Blank Total
Church of England 5.2% 24.0% 25.5% 29.0% 9.4% 7.0% 100%
Church of Scotland 3.2% 25.8% 28.6% 31.3% 6.7% 4.4% 100%
Church in Wales 7.6% 27.3% 28.9% 19.7% 4.8% 11.6% 100%
Salvation Army 7.5% 17.7% 24.5% 29.9% 7.5% 12.9% 100%
Scottish Episcopal Church 8.8% 26.5% 24.6% 27.7% 5.8% 6.5% 100%
Average Denomination 6.5% 24.3% 23.8% 27.5% 6.8% 8.5% 100%
Average Respondent 6.0% 24.6% 26.2% 27.8% 7.6% 7.7% 100%
What is noticeable is the relative scarcity of strong responses. Only 13% of respondents strongly
agreed or strongly disagreed, and they were roughly evenly split between the two. Whether or not
Page 16
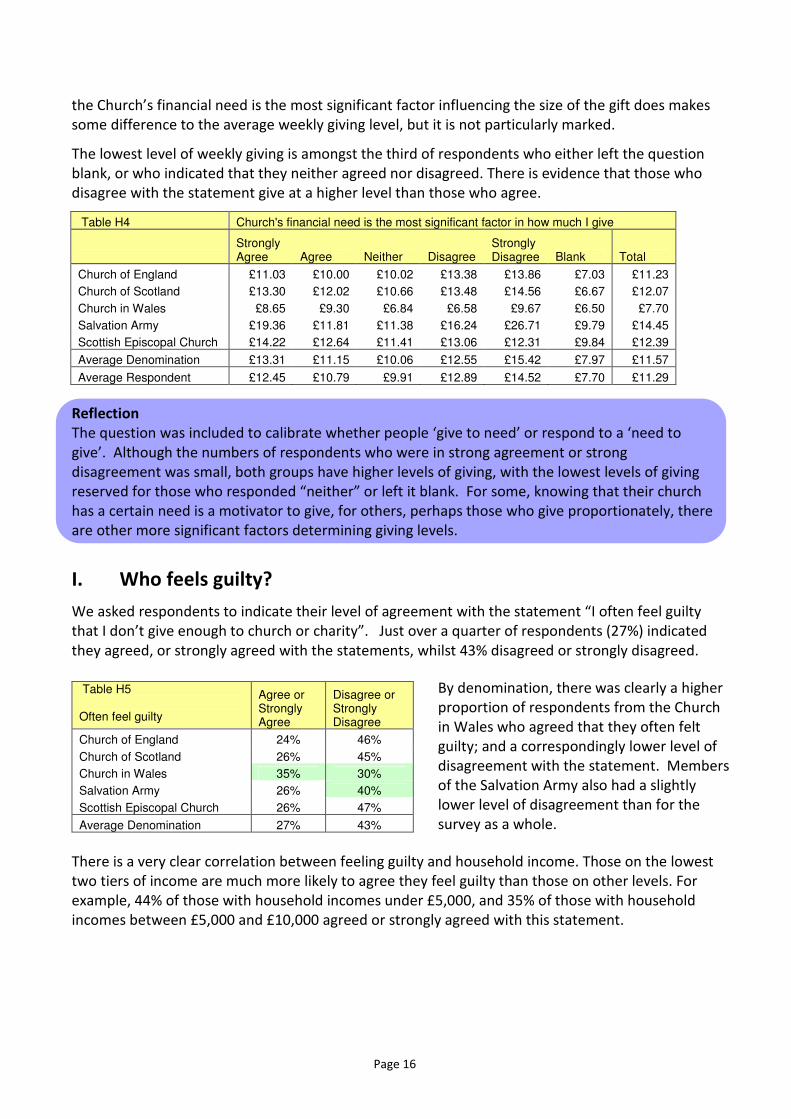
the Church’s financial need is the most significant factor influencing the size of the gift does makes
some difference to the average weekly giving level, but it is not particularly marked.
The lowest level of weekly giving is amongst the third of respondents who either left the question
blank, or who indicated that they neither agreed nor disagreed. There is evidence that those who
disagree with the statement give at a higher level than those who agree.
Table H4 Church's financial need is the most significant factor in how much I give
Strongly Agree Agree Neither Disagree
Strongly Disagree Blank Total
Church of England £11.03 £10.00 £10.02 £13.38 £13.86 £7.03 £11.23
Church of Scotland £13.30 £12.02 £10.66 £13.48 £14.56 £6.67 £12.07
Church in Wales £8.65 £9.30 £6.84 £6.58 £9.67 £6.50 £7.70
Salvation Army £19.36 £11.81 £11.38 £16.24 £26.71 £9.79 £14.45
Scottish Episcopal Church £14.22 £12.64 £11.41 £13.06 £12.31 £9.84 £12.39
Average Denomination £13.31 £11.15 £10.06 £12.55 £15.42 £7.97 £11.57
Average Respondent £12.45 £10.79 £9.91 £12.89 £14.52 £7.70 £11.29
Reflection
The question was included to calibrate whether people ‘give to need’ or respond to a ‘need to
give’. Although the numbers of respondents who were in strong agreement or strong
disagreement was small, both groups have higher levels of giving, with the lowest levels of giving
reserved for those who responded “neither” or left it blank. For some, knowing that their church
has a certain need is a motivator to give, for others, perhaps those who give proportionately, there
are other more significant factors determining giving levels.
I. Who feels guilty?
We asked respondents to indicate their level of agreement with the statement “I often feel guilty
that I don’t give enough to church or charity”. Just over a quarter of respondents (27%) indicated
they agreed, or strongly agreed with the statements, whilst 43% disagreed or strongly disagreed.
Table H5 Often feel guilty
Agree or Strongly Agree
Disagree or Strongly Disagree
Church of England 24% 46%
Church of Scotland 26% 45%
Church in Wales 35% 30%
Salvation Army 26% 40%
Scottish Episcopal Church 26% 47%
Average Denomination 27% 43%
By denomination, there was clearly a higher
proportion of respondents from the Church
in Wales who agreed that they often felt
guilty; and a correspondingly lower level of
disagreement with the statement. Members
of the Salvation Army also had a slightly
lower level of disagreement than for the
survey as a whole.
There is a very clear correlation between feeling guilty and household income. Those on the lowest
two tiers of income are much more likely to agree they feel guilty than those on other levels. For
example, 44% of those with household incomes under £5,000, and 35% of those with household
incomes between £5,000 and £10,000 agreed or strongly agreed with this statement.
Page 17
When we focus in on those who “strongly agreed”,
there is a particular match with those on the lowest
income level. Slightly surprisingly, those on the
highest income level, also are more likely to agree
(although not strongly agree), perhaps indicating a
degree of felt responsibility that wealth affords?
Table H6 Income level
Agree or Strongly Agree
Strongly Agree only
Under £5,000 44% 10%
£5,000 to £10,000 35% 4%
£10,000 to £20,000 26% 5%
£20,000 to £40,000 27% 5%
£40,000 to £60,000 26% 3%
Over £60,000 30% 4%
Average All respondents 27% 5%
This finding points to the possibility that some feelings of guilt among those on low incomes may
have arisen as a result of stewardship teaching that encourages a flat rate of contribution, or a flat
rate of increase. “This church costs an average of £12 per person per week”; “We only need an
extra £1.30 per person per week – the price of a litre of petrol”; or this message is perceived by
givers, even if it is not what has been said.
Agreement with "I feel I should probably give more than I do to my church or to charity"
Those who feel
guilty All
Respondents
Strongly Agree 18% 6%
Agree 64% 31%
Neither Agree nor Disagree 11% 26%
Disagree 5% 25%
Strongly Disagree 1% 4%
Blank 1% 6%
TOTAL 100% 100%
Those who feel guilty do feel they should be
giving more. Over four out of five in this
group would agree (64%) or strongly agree
(18%) they should probably give more than
they do to either church or charity. This is
very significantly more than the universe of
all respondents. Conversely, there is a very
low level of disagreement compared with the
sample as a whole.
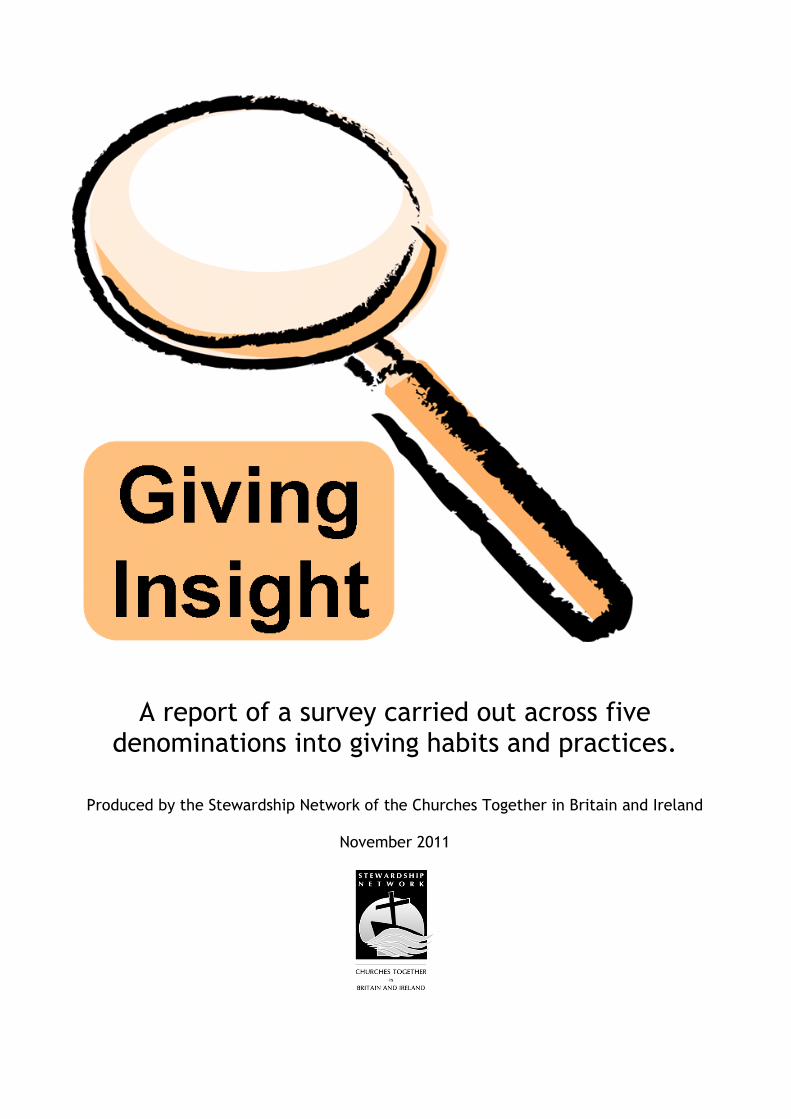
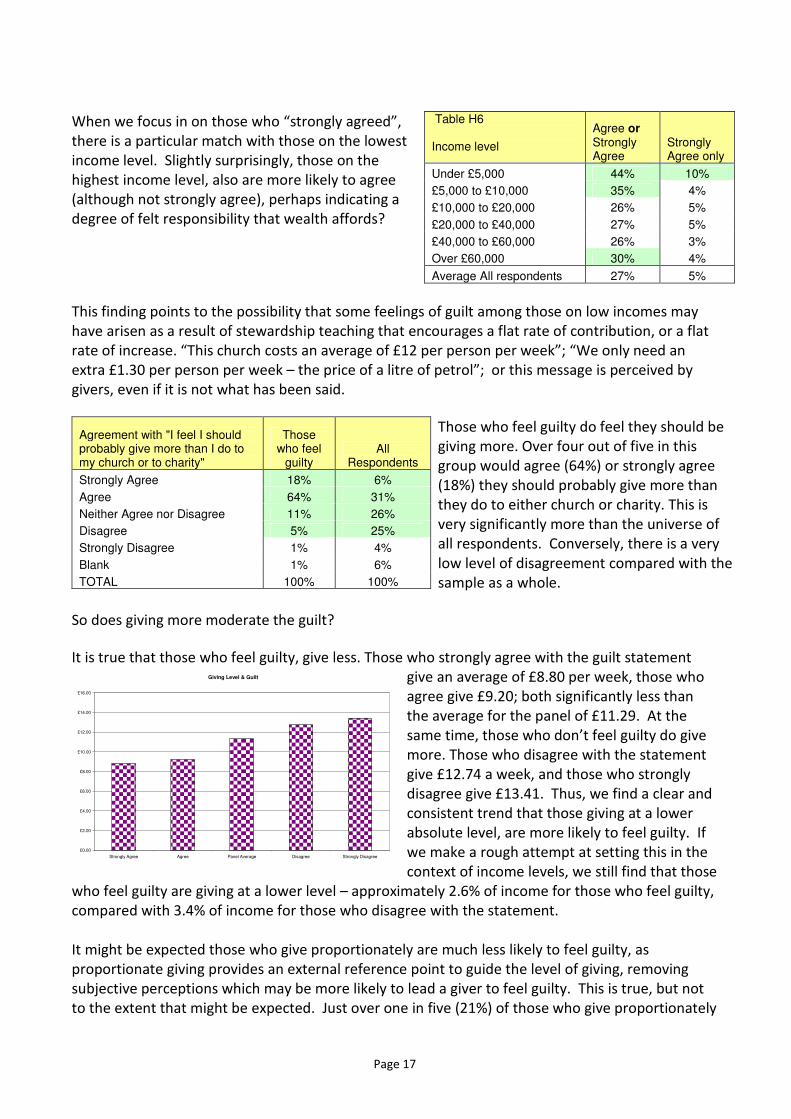
So does giving more moderate the guilt?
It is true that those who feel guilty, give less. Those who strongly agree with the guilt statement
give an average of £8.80 per week, those who
agree give £9.20; both significantly less than
the average for the panel of £11.29. At the
same time, those who don’t feel guilty do give
more. Those who disagree with the statement
give £12.74 a week, and those who strongly
disagree give £13.41. Thus, we find a clear and
consistent trend that those giving at a lower
absolute level, are more likely to feel guilty. If
we make a rough attempt at setting this in the
context of income levels, we still find that those
who feel guilty are giving at a lower level – approximately 2.6% of income for those who feel guilty,
compared with 3.4% of income for those who disagree with the statement.
It might be expected those who give proportionately are much less likely to feel guilty, as
proportionate giving provides an external reference point to guide the level of giving, removing
subjective perceptions which may be more likely to lead a giver to feel guilty. This is true, but not
to the extent that might be expected. Just over one in five (21%) of those who give proportionately
Giving Level & Guilt
£0.00
£2.00
£4.00
£6.00
£8.00
£10.00
£12.00
£14.00
£16.00
Strongly Agree Agree Panel Average Disagree Strongly Disagree
Page 18
either agree or strongly agree they often feel guilty,
compared with 27% for the panel as a whole, and 29% for
those who say they do not work out their giving in
proportion to their income.
There is a clear clustering of responses of those who feel guilty in particular churches. Excluding
responses from the Church of Scotland which cannot be linked to individual churches, one third of
those agreeing or strongly agreeing that they felt guilty were found in just 9 of the 80 churches
taking part in the survey. One church had the majority of its respondents indicating they feel guilty.
Local church practice and teaching clearly plays a role in engendering feelings of guilt.
Reflection
There is a fine line between a giver feeling uncomfortable with their current level of giving, and
wishing they had either the financial capability, the commitment or the discipline to increase it; and
feeling guilty about it. The former can be a helpful motivator along the disciples’ path of increasing
stewardship; the latter, an unhelpful emotion that can hold us back.
In nuturing a progression in stewardship we inevitably seek a dissatisfaction with the status-quo
that leads to a maturing into a greater understanding of the joyful, but accountable, responsibilities
of the steward. The challenge is to do this in ways which move people on, nurture increased
generosity, but which do not lead to feelings of guilt, except perhaps for a few individuals where
the level of giving compared with what might be reasonably expected is particularly low.
Recommendations
R5 Good practice needs to clarify that “the ask” is linked to income, rather than just a share of
costs; and if the share of costs or share of increased costs are used, then it needs to be
clearly stated that some will be able to give more, others less.
R6 Teaching on tithing and proportionate giving should stress the journey of generosity, rather
than a particular percentage; and if the tithe is recommended, it should be done so in the
context of grace rather than obligation.
J. Proportionate Giving
The survey asked specifically whether respondents work out their giving in proportion to their
income.
Table J1: Work out giving in proportion to income
Denom Yes No (blank) Grand Total
CE 26.6% 70.2% 3.1% 100.0%
CS 19.0% 78.6% 2.4% 100.0%
CW 21.2% 72.6% 6.2% 100.0%
SA 40.8% 51.7% 7.5% 100.0%
SE 30.0% 65.0% 5.0% 100.0%
All respondents 26.5% 69.3% 4.2% 100.0%
Just over a quarter of respondents said that
they did, around 70% said they did not, and
4% left the question blank. We can probably
add those leaving the question blank to the
“No” group.
The Salvation Army has the highest
percentage of proportionate givers (two out
of five), the Church of Scotland the lowest.
Proportionate givers unsurprisingly give at a much higher average level of giving, £17.08 per week
compared with £9.27 for those who answered “no”.
Just over one in five
proportionate givers often
feel guilty about their giving.
Page 19
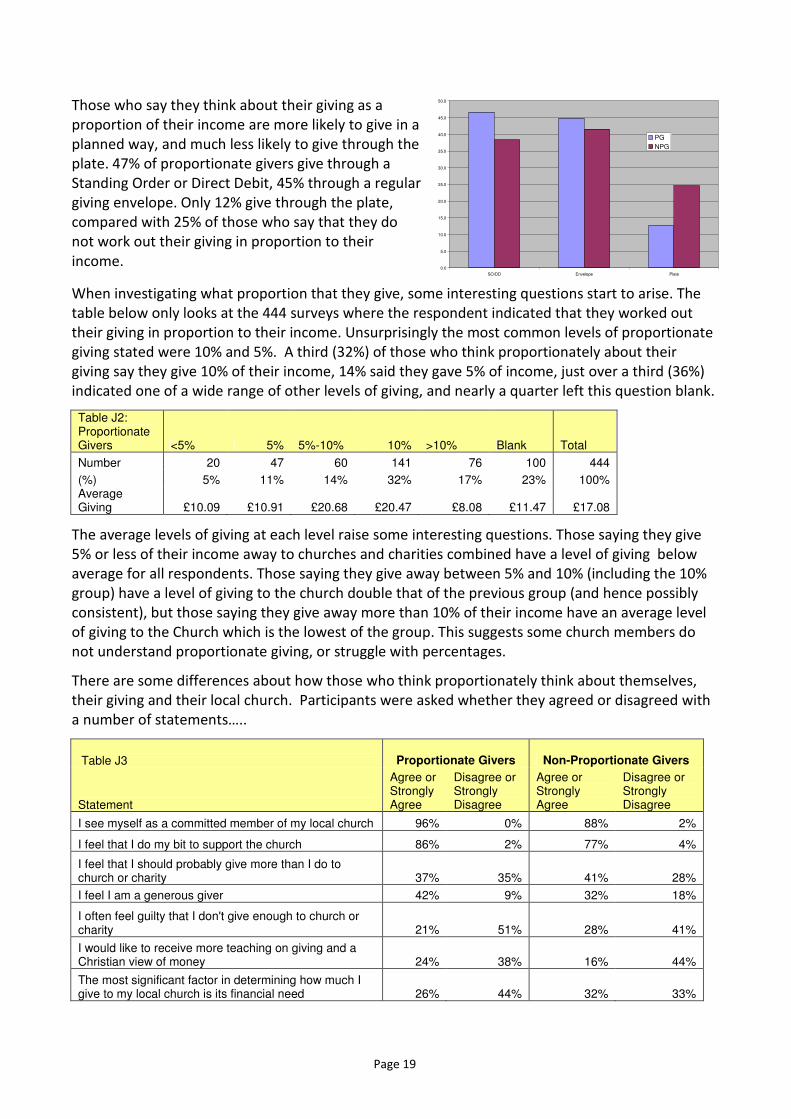
Those who say they think about their giving as a
proportion of their income are more likely to give in a
planned way, and much less likely to give through the
plate. 47% of proportionate givers give through a
Standing Order or Direct Debit, 45% through a regular
giving envelope. Only 12% give through the plate,
compared with 25% of those who say that they do
not work out their giving in proportion to their
income.
When investigating what proportion that they give, some interesting questions start to arise. The
table below only looks at the 444 surveys where the respondent indicated that they worked out
their giving in proportion to their income. Unsurprisingly the most common levels of proportionate
giving stated were 10% and 5%. A third (32%) of those who think proportionately about their
giving say they give 10% of their income, 14% said they gave 5% of income, just over a third (36%)
indicated one of a wide range of other levels of giving, and nearly a quarter left this question blank.
Table J2: Proportionate Givers <5% 5% 5%-10% 10% >10% Blank Total
Number 20 47 60 141 76 100 444
(%) 5% 11% 14% 32% 17% 23% 100% Average Giving £10.09 £10.91 £20.68 £20.47 £8.08 £11.47 £17.08
The average levels of giving at each level raise some interesting questions. Those saying they give
5% or less of their income away to churches and charities combined have a level of giving below
average for all respondents. Those saying they give away between 5% and 10% (including the 10%
group) have a level of giving to the church double that of the previous group (and hence possibly
consistent), but those saying they give away more than 10% of their income have an average level
of giving to the Church which is the lowest of the group. This suggests some church members do
not understand proportionate giving, or struggle with percentages.
There are some differences about how those who think proportionately think about themselves,
their giving and their local church. Participants were asked whether they agreed or disagreed with
a number of statements…..
Table J3 Proportionate Givers Non-Proportionate Givers
Statement
Agree or Strongly Agree
Disagree or Strongly Disagree
Agree or Strongly Agree
Disagree or Strongly Disagree
I see myself as a committed member of my local church 96% 0% 88% 2%
I feel that I do my bit to support the church 86% 2% 77% 4%
I feel that I should probably give more than I do to church or charity 37% 35% 41% 28%
I feel I am a generous giver 42% 9% 32% 18%
I often feel guilty that I don't give enough to church or charity 21% 51% 28% 41%
I would like to receive more teaching on giving and a Christian view of money 24% 38% 16% 44%
The most significant factor in determining how much I give to my local church is its financial need 26% 44% 32% 33%
0.0
5.0
10.0
15.0
20.0
25.0
30.0
35.0
40.0
45.0
50.0
SO/DD Envelope Plate
PG
NPG
Page 20
Proportionate givers are:
• More likely to see themselves as committed members of their local church.
• More likely to feel that they do their bit to support the church
• Less likely to feel that they should give more than they currently do to support church or charity
• More likely to feel that they are generous givers
• Less likely to often feel guilty about their giving
• More likely to want to receive more teaching on Christian giving and money
• Less likely to see a church’s financial need as the most significant factor in determining how
much they give.
The survey asked five questions, which together provide some insight into the coherence of these
results:
• Q7 – what proportion of your total church and charity giving would you say you give to your
local church?
• Q8 – do you work out your giving in proportion of your income?
• Q9 – if yes to Q8, what proportion of your income do you give away to church and charities
combined?
• Q5 – how much do you give to your local church?
• Q12 – how would you describe your annual household income?
In theory, giving to the church in £ (Q5) should be an approximation of the proportion given away
(Q9), multiplied by the percentage of that given away which is given to the local church (Q7),
multiplied by the household income (Q12)
When the maths is applied to the numbers who claim they are giving proportionately, then of the
444 people who say that they think proportionately about their giving, there are:
• 226 people (51%) who have supplied all of the data and their level of giving and percentages
are broadly consistent. They give on average £20.58 a week.
• 88 people (20%) who have supplied all of the data to enable the calculations, but whose giving
is less than half of that which the calculation would suggest. They give on average £13.56 a
week.
• 130 people (29%) who have not completed all of the pertinent questions, and so the calculation
cannot be carried out. They give on average £13.05 a week.
However, there are many situations where the maths will not work. Where the giving comes from
one member of a household with unequal incomes, a tithe for one individual may be considerably
less than 5% of household income. One respondent commented: “My partner isn’t a Christian
therefore I work out 10% from my pension. He does support local charities but not a church.”
Reflection
Just over a quarter of respondents said they thought about their giving proportionately. As this
sample is skewed slightly to the more committed, we can assume no more than a quarter of the
whole church population might think in this way. However, this is almost certainly an over-
estimate.
Looking at the raw forms, it is clear a reasonable number of givers just don’t “get” percentages –
supported by anecdotal data from those running the survey in some churches. Within the group
Page 21
who say they give more than 10% of their income to the church, the average level of giving (£8.08)
is less than for the survey sample as a whole, suggesting a level of income below the basic state
pension. Whilst some of them may fall into the group giving proportionately out of very little
personal income, it is likely many are not.
K. Challenging church members with a specific giving target
The three Anglican churches, to varying degrees, have challenged their members to give 5% of after
tax income to the Church. The Church of England is most explicit, with General Synod having first
agreed this over 30 years ago. The most recent resolution, in the Giving for Life debate, reads
“reconfirm its challenge to church members to assess annually their financial giving as a proportion
of income and to adopt as an initial target the giving of 5% of their after tax income to and through
the church, and a similar amount to other work that helps to build God's kingdom.”
However, when asked “do you think it is reasonable that the church should challenge its members
to give 5% of their after-tax income to the church”, there is only a minority agreement. Across all
three churches the level of agreement is very similar, with broadly a third agreeing, a third
disagreeing, and a third who are “not sure”. Interestingly, the Salvation Army, who are more likely
to teach tithing than 5%, were the denomination most in agreement, with 58% agreeing to the
statement. Unsurprisingly, the level of giving of those who agree is higher than those who are not
sure, or who disagree.
Table K1 Is 5% reasonable?
No Not Sure Yes
CE % of respondents 34% 32% 32%
Giving/Wk £7.00 £8.50 £18.93
CW % of respondents 27% 33% 35%
Giving/Wk £5.14 £6.25 £11.62
SEC % of respondents 32% 28% 36%
Giving/Wk £9.64 £9.76 £17.39
Again, unsurprisingly, there is a clear correlation between those who think proportionately about
their giving, and views on whether the church should encourage members to give 5% of income.
Table K2 Is 5% reasonable?
No Not Sure Yes
Proportionate Givers 15% 22% 60%
Non-Proportionate Givers 41% 35% 23%
There is a slight correlation between income and support for proportionate giving, but it is only
slight, mainly due to the number of blank responses. Of those who disagree or are not sure that
challenging members to give 5% of income, just over a third (35% of those saying “no” and 37% of
those saying “not sure”) have incomes over £40k. However, for those who support the suggestion,
52% have incomes over £20k.
Table K3 Income bracket
Is 5% Reasonable Under £20k £20k to £40k Over £40k Blank
No 42% 21% 14% 22%
Not Sure 45% 22% 15% 18%
Yes 40% 33% 19% 9%
Page 22
This question also had the opportunity for people to comment. 280 respondents did. Those who
said “no” were most likely to comment. Just over 30% of this group wrote a comment, just over
20% of those who said “not sure” made a comment, but only 15% of those who said “yes” left a
comment.
There are a number of themes….
22 comments supported differential levels of giving, but felt that a fixed proportion was regressive,
and that the proportion should vary with income or with disposable income. “5% is decidedly less
challenging to a high income person than it is to a low income person,” “Very difficult when a
blanket % given. To a single person or a well off couple it maybe reasonable. To someone
supporting a family it just 'piles the guilt on' “, “Yes - if income >£50k; n/s if income c £30k; no if
income £20k or less.” – (this respondent left the statement blank, and indicated that their income
was in the £20k-£40k bracket) “higher percentage of disposable income would perhaps be better”.
Respondents were more evenly split between the three different answers.
The most frequent comments were about freedom of choice in how much to give, rather than a
fixed percentage challenge. “Giving should be from the heart and depending on ones own
commitments. Should NOT be like income tax”, “it should be for each individual to determine how
much is given to church or charity according to his own wishes and financial status. It is arrogant to
suggest a value”, “It should be up to the individual to give as much or as little as they can afford.”
13 respondents commented that they felt that a tithe would be better than 5%..... “because the
Biblical requirement is 10% as a tithe and then free-will offering” or “[I'm in the] habit of being
challenged to give 10%” or “The tithe is a wonderful goal to aim for but a terrible goal to stop at.' a
quote I heard once that stuck.” Ten of these respondents agreed with the statement given.
12 respondents expressed varying degrees of outrage! (All said “no” to the statement). “That's
outrageous!”, “how dare they! It would put me and others off,” “Downright cheek to ask for this!,”
“this should be personal - not a "rate" to talk to God”, “You will alienate some people if you do. You
will REDUCE others giving if you do. It’s a matter of conscience - the church can (sensibly) only give
guidelines and can't expect (sensibly) to dominate and demand people's giving solely to the church.”
6 comments were pensioners who felt it was unrealistic. “As a pensioner with limited income, 5% is
far too high to be expected to give away”, “As an elderly widow, one's yearly income fluctuates -
therefore one gives accordingly. I think it would be wrong to put a compulsory figure on any giving.”
“At 86 years of age I no longer have the money or the energy to contribute more. Worked with
stewardship since 1959,” “How many seniors are taxpayers? The world seems out of touch with
what we live on.”
Several comments related to giving to the church in relation to other charities, and that impact is
not as easy to determine with church giving. “For some people increasing their giving to the church
might result in lower contributions to other charities (where the benefit might be greater)”, “give to
other charities that are more urgent!”, “There are other more 'worthy' causes”, “AT LEAST 5% but
church needs to "do something" worthy with it!”, “Congregation need more information as to the
the cost of running church ie building, stipends, away giving etc”.
There was little sense that church members had been familiar with this challenge for some time.
Only one response commented “We have been doing this for years.”
Page 23
L. Teaching….. who doesn’t want it?
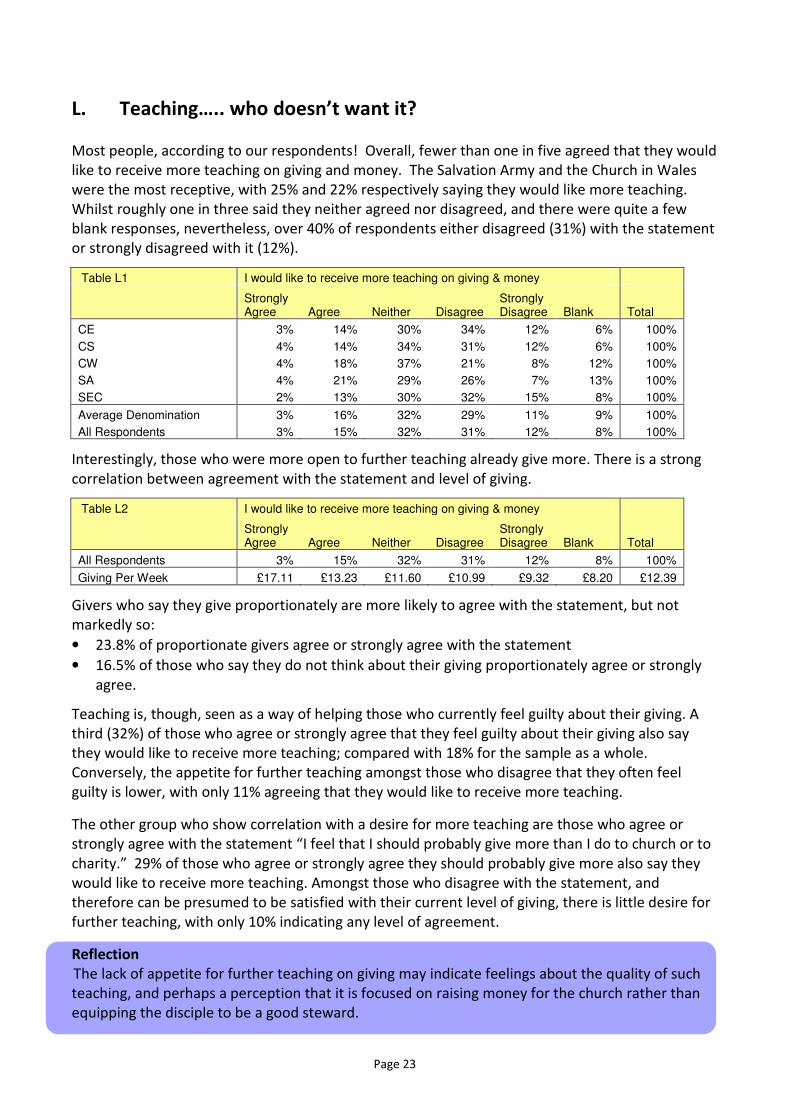
Most people, according to our respondents! Overall, fewer than one in five agreed that they would
like to receive more teaching on giving and money. The Salvation Army and the Church in Wales
were the most receptive, with 25% and 22% respectively saying they would like more teaching.
Whilst roughly one in three said they neither agreed nor disagreed, and there were quite a few
blank responses, nevertheless, over 40% of respondents either disagreed (31%) with the statement
or strongly disagreed with it (12%).
Table L1 I would like to receive more teaching on giving & money
Strongly Agree Agree Neither Disagree
Strongly Disagree Blank Total
CE 3% 14% 30% 34% 12% 6% 100%
CS 4% 14% 34% 31% 12% 6% 100%
CW 4% 18% 37% 21% 8% 12% 100%
SA 4% 21% 29% 26% 7% 13% 100%
SEC 2% 13% 30% 32% 15% 8% 100%
Average Denomination 3% 16% 32% 29% 11% 9% 100%
All Respondents 3% 15% 32% 31% 12% 8% 100%
Interestingly, those who were more open to further teaching already give more. There is a strong
correlation between agreement with the statement and level of giving.
Table L2 I would like to receive more teaching on giving & money
Strongly Agree Agree Neither Disagree
Strongly Disagree Blank Total
All Respondents 3% 15% 32% 31% 12% 8% 100%
Giving Per Week £17.11 £13.23 £11.60 £10.99 £9.32 £8.20 £12.39
Givers who say they give proportionately are more likely to agree with the statement, but not
markedly so:
• 23.8% of proportionate givers agree or strongly agree with the statement
• 16.5% of those who say they do not think about their giving proportionately agree or strongly
agree.
Teaching is, though, seen as a way of helping those who currently feel guilty about their giving. A
third (32%) of those who agree or strongly agree that they feel guilty about their giving also say
they would like to receive more teaching; compared with 18% for the sample as a whole.
Conversely, the appetite for further teaching amongst those who disagree that they often feel
guilty is lower, with only 11% agreeing that they would like to receive more teaching.
The other group who show correlation with a desire for more teaching are those who agree or
strongly agree with the statement “I feel that I should probably give more than I do to church or to
charity.” 29% of those who agree or strongly agree they should probably give more also say they
would like to receive more teaching. Amongst those who disagree with the statement, and
therefore can be presumed to be satisfied with their current level of giving, there is little desire for
further teaching, with only 10% indicating any level of agreement.
Reflection
The lack of appetite for further teaching on giving may indicate feelings about the quality of such
teaching, and perhaps a perception that it is focused on raising money for the church rather than
equipping the disciple to be a good steward.
Page 24
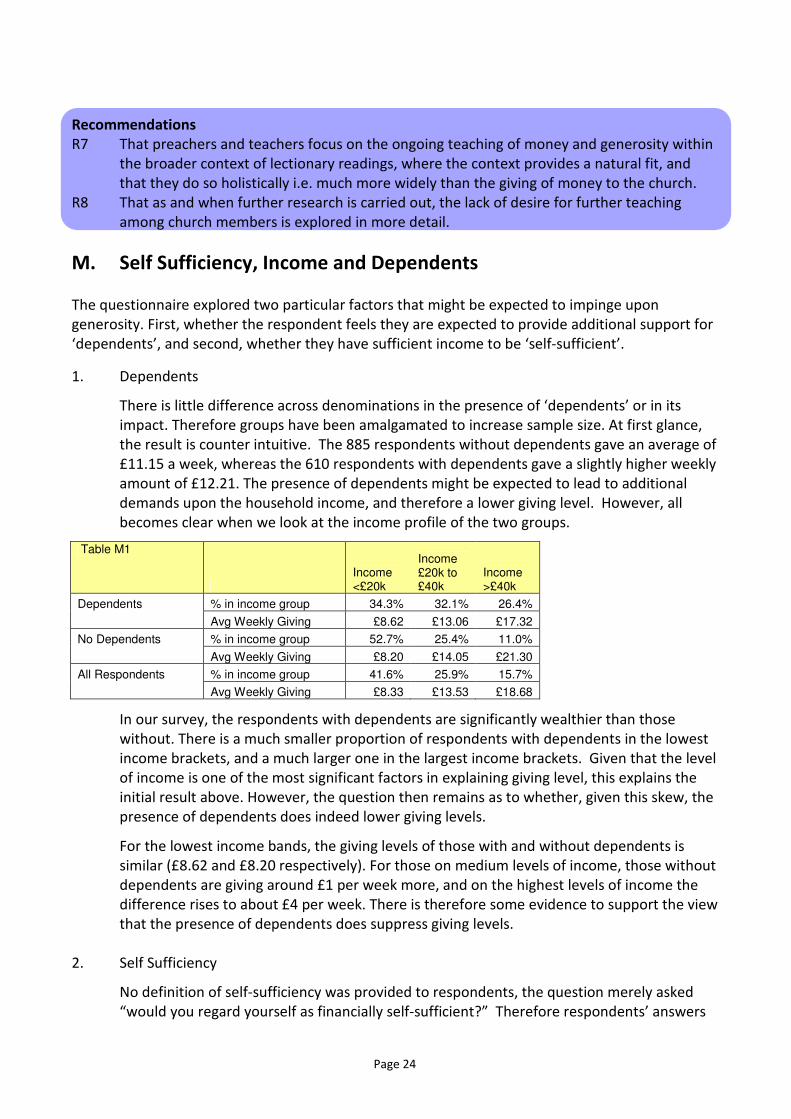
Recommendations
R7 That preachers and teachers focus on the ongoing teaching of money and generosity within
the broader context of lectionary readings, where the context provides a natural fit, and
that they do so holistically i.e. much more widely than the giving of money to the church.
R8 That as and when further research is carried out, the lack of desire for further teaching
among church members is explored in more detail.
M. Self Sufficiency, Income and Dependents
The questionnaire explored two particular factors that might be expected to impinge upon
generosity. First, whether the respondent feels they are expected to provide additional support for
‘dependents’, and second, whether they have sufficient income to be ‘self-sufficient’.
1. Dependents
There is little difference across denominations in the presence of ‘dependents’ or in its
impact. Therefore groups have been amalgamated to increase sample size. At first glance,
the result is counter intuitive. The 885 respondents without dependents gave an average of
£11.15 a week, whereas the 610 respondents with dependents gave a slightly higher weekly
amount of £12.21. The presence of dependents might be expected to lead to additional
demands upon the household income, and therefore a lower giving level. However, all
becomes clear when we look at the income profile of the two groups.
Table M1
Income <£20k
Income £20k to £40k
Income >£40k
Dependents % in income group 34.3% 32.1% 26.4%
Avg Weekly Giving £8.62 £13.06 £17.32
No Dependents % in income group 52.7% 25.4% 11.0%
Avg Weekly Giving £8.20 £14.05 £21.30
All Respondents % in income group 41.6% 25.9% 15.7%
Avg Weekly Giving £8.33 £13.53 £18.68
In our survey, the respondents with dependents are significantly wealthier than those
without. There is a much smaller proportion of respondents with dependents in the lowest
income brackets, and a much larger one in the largest income brackets. Given that the level
of income is one of the most significant factors in explaining giving level, this explains the
initial result above. However, the question then remains as to whether, given this skew, the
presence of dependents does indeed lower giving levels.
For the lowest income bands, the giving levels of those with and without dependents is
similar (£8.62 and £8.20 respectively). For those on medium levels of income, those without
dependents are giving around £1 per week more, and on the highest levels of income the
difference rises to about £4 per week. There is therefore some evidence to support the view
that the presence of dependents does suppress giving levels.
2. Self Sufficiency
No definition of self-sufficiency was provided to respondents, the question merely asked
“would you regard yourself as financially self-sufficient?” Therefore respondents’ answers
Page 25
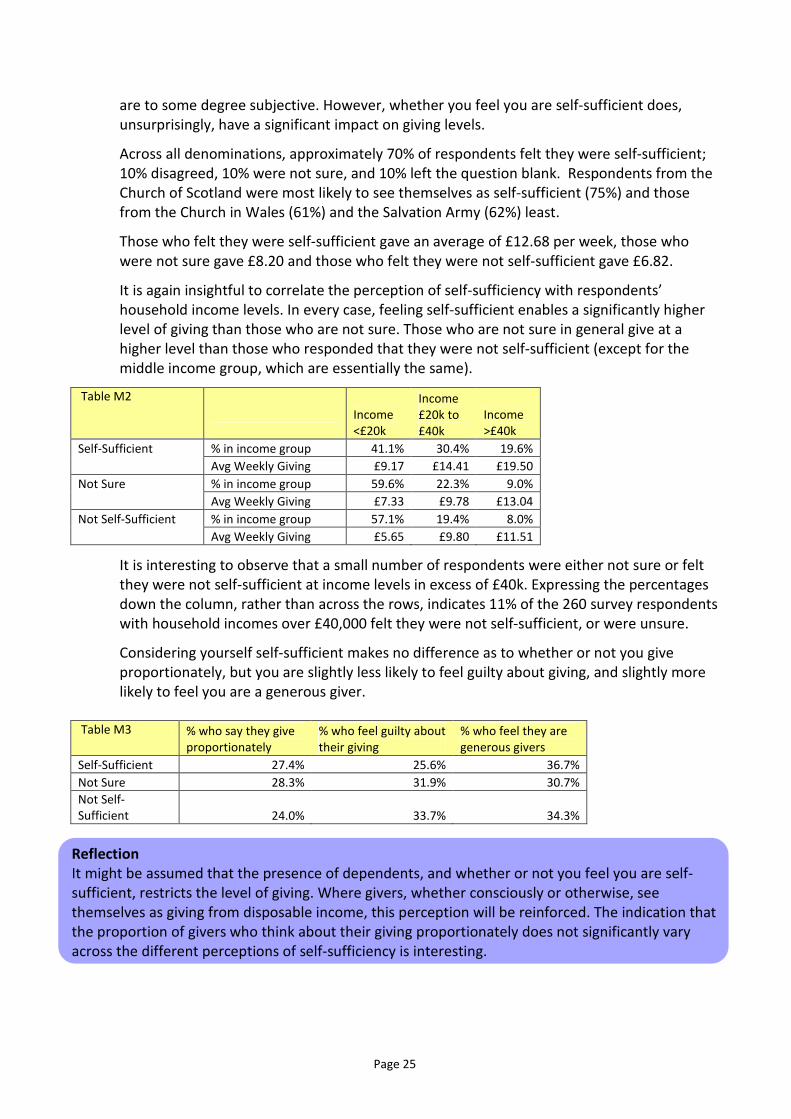
are to some degree subjective. However, whether you feel you are self-sufficient does,
unsurprisingly, have a significant impact on giving levels.
Across all denominations, approximately 70% of respondents felt they were self-sufficient;
10% disagreed, 10% were not sure, and 10% left the question blank. Respondents from the
Church of Scotland were most likely to see themselves as self-sufficient (75%) and those
from the Church in Wales (61%) and the Salvation Army (62%) least.
Those who felt they were self-sufficient gave an average of £12.68 per week, those who
were not sure gave £8.20 and those who felt they were not self-sufficient gave £6.82.
It is again insightful to correlate the perception of self-sufficiency with respondents’
household income levels. In every case, feeling self-sufficient enables a significantly higher
level of giving than those who are not sure. Those who are not sure in general give at a
higher level than those who responded that they were not self-sufficient (except for the
middle income group, which are essentially the same).
Table M2
Income
<£20k
Income
£20k to
£40k
Income
>£40k
Self-Sufficient % in income group 41.1% 30.4% 19.6%
Avg Weekly Giving £9.17 £14.41 £19.50
Not Sure % in income group 59.6% 22.3% 9.0%
Avg Weekly Giving £7.33 £9.78 £13.04
Not Self-Sufficient % in income group 57.1% 19.4% 8.0%
Avg Weekly Giving £5.65 £9.80 £11.51
It is interesting to observe that a small number of respondents were either not sure or felt
they were not self-sufficient at income levels in excess of £40k. Expressing the percentages
down the column, rather than across the rows, indicates 11% of the 260 survey respondents
with household incomes over £40,000 felt they were not self-sufficient, or were unsure.
Considering yourself self-sufficient makes no difference as to whether or not you give
proportionately, but you are slightly less likely to feel guilty about giving, and slightly more
likely to feel you are a generous giver.
Table M3 % who say they give
proportionately
% who feel guilty about
their giving
% who feel they are
generous givers
Self-Sufficient 27.4% 25.6% 36.7%
Not Sure 28.3% 31.9% 30.7%
Not Self-
Sufficient 24.0% 33.7% 34.3%
Reflection
It might be assumed that the presence of dependents, and whether or not you feel you are self-
sufficient, restricts the level of giving. Where givers, whether consciously or otherwise, see
themselves as giving from disposable income, this perception will be reinforced. The indication that
the proportion of givers who think about their giving proportionately does not significantly vary
across the different perceptions of self-sufficiency is interesting.
Page 26
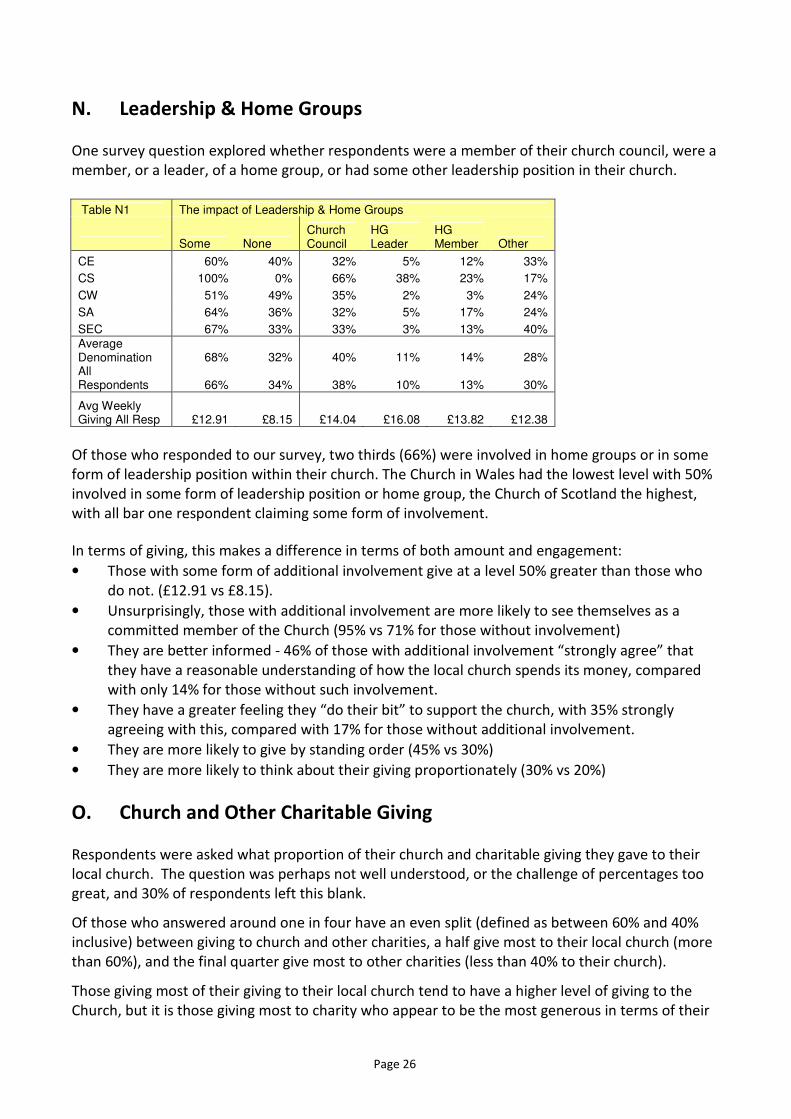
N. Leadership & Home Groups
One survey question explored whether respondents were a member of their church council, were a
member, or a leader, of a home group, or had some other leadership position in their church.
Table N1 The impact of Leadership & Home Groups
Some None Church Council
HG Leader
HG Member Other
CE 60% 40% 32% 5% 12% 33%
CS 100% 0% 66% 38% 23% 17%
CW 51% 49% 35% 2% 3% 24%
SA 64% 36% 32% 5% 17% 24%
SEC 67% 33% 33% 3% 13% 40%
Average Denomination 68% 32% 40% 11% 14% 28% All Respondents 66% 34% 38% 10% 13% 30%
Avg Weekly Giving All Resp £12.91 £8.15 £14.04 £16.08 £13.82 £12.38
Of those who responded to our survey, two thirds (66%) were involved in home groups or in some
form of leadership position within their church. The Church in Wales had the lowest level with 50%
involved in some form of leadership position or home group, the Church of Scotland the highest,
with all bar one respondent claiming some form of involvement.
In terms of giving, this makes a difference in terms of both amount and engagement:
• Those with some form of additional involvement give at a level 50% greater than those who
do not. (£12.91 vs £8.15).
• Unsurprisingly, those with additional involvement are more likely to see themselves as a
committed member of the Church (95% vs 71% for those without involvement)
• They are better informed - 46% of those with additional involvement “strongly agree” that
they have a reasonable understanding of how the local church spends its money, compared
with only 14% for those without such involvement.
• They have a greater feeling they “do their bit” to support the church, with 35% strongly
agreeing with this, compared with 17% for those without additional involvement.
• They are more likely to give by standing order (45% vs 30%)
• They are more likely to think about their giving proportionately (30% vs 20%)
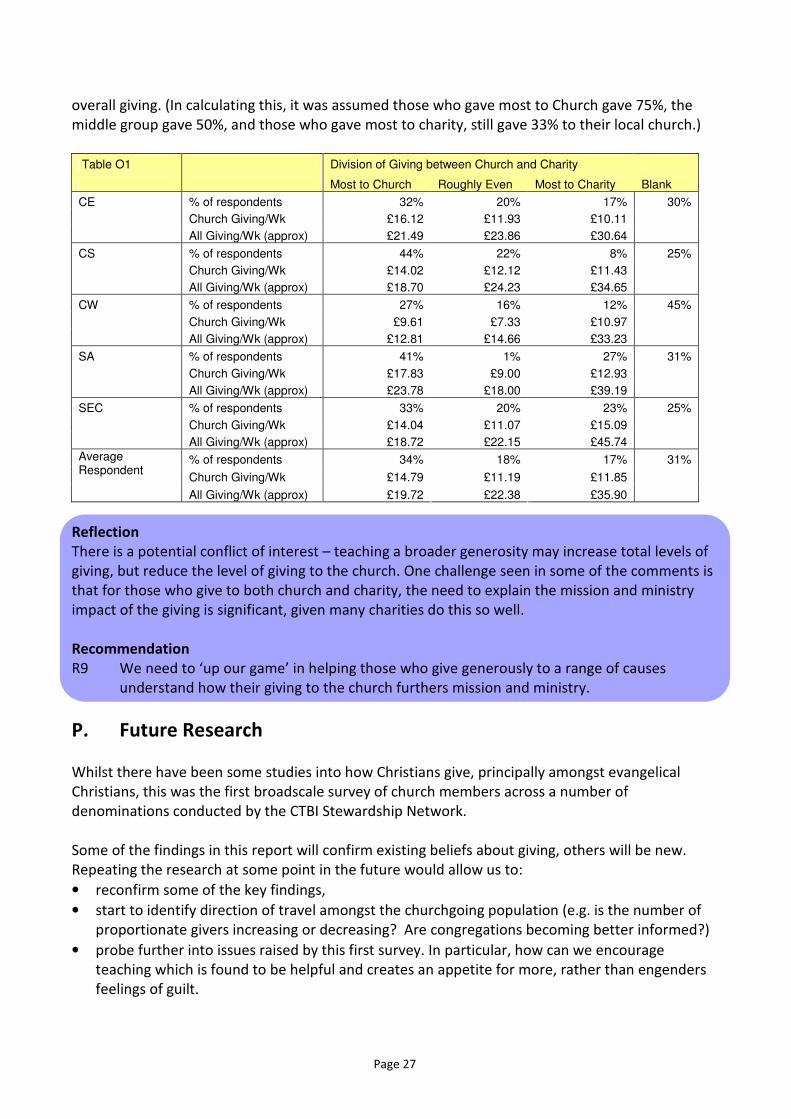
O. Church and Other Charitable Giving
Respondents were asked what proportion of their church and charitable giving they gave to their
local church. The question was perhaps not well understood, or the challenge of percentages too
great, and 30% of respondents left this blank.
Of those who answered around one in four have an even split (defined as between 60% and 40%
inclusive) between giving to church and other charities, a half give most to their local church (more
than 60%), and the final quarter give most to other charities (less than 40% to their church).
Those giving most of their giving to their local church tend to have a higher level of giving to the
Church, but it is those giving most to charity who appear to be the most generous in terms of their
Page 27
overall giving. (In calculating this, it was assumed those who gave most to Church gave 75%, the
middle group gave 50%, and those who gave most to charity, still gave 33% to their local church.)
Table O1 Division of Giving between Church and Charity
Most to Church Roughly Even Most to Charity Blank
CE % of respondents 32% 20% 17% 30%
Church Giving/Wk £16.12 £11.93 £10.11
All Giving/Wk (approx) £21.49 £23.86 £30.64
CS % of respondents 44% 22% 8% 25%
Church Giving/Wk £14.02 £12.12 £11.43
All Giving/Wk (approx) £18.70 £24.23 £34.65
CW % of respondents 27% 16% 12% 45%
Church Giving/Wk £9.61 £7.33 £10.97
All Giving/Wk (approx) £12.81 £14.66 £33.23
SA % of respondents 41% 1% 27% 31%
Church Giving/Wk £17.83 £9.00 £12.93
All Giving/Wk (approx) £23.78 £18.00 £39.19
SEC % of respondents 33% 20% 23% 25%
Church Giving/Wk £14.04 £11.07 £15.09
All Giving/Wk (approx) £18.72 £22.15 £45.74
% of respondents 34% 18% 17% 31%
Church Giving/Wk £14.79 £11.19 £11.85
Average Respondent
All Giving/Wk (approx) £19.72 £22.38 £35.90
Reflection
There is a potential conflict of interest – teaching a broader generosity may increase total levels of
giving, but reduce the level of giving to the church. One challenge seen in some of the comments is
that for those who give to both church and charity, the need to explain the mission and ministry
impact of the giving is significant, given many charities do this so well.
Recommendation
R9 We need to ‘up our game’ in helping those who give generously to a range of causes
understand how their giving to the church furthers mission and ministry.
P. Future Research
Whilst there have been some studies into how Christians give, principally amongst evangelical
Christians, this was the first broadscale survey of church members across a number of
denominations conducted by the CTBI Stewardship Network.
Some of the findings in this report will confirm existing beliefs about giving, others will be new.
Repeating the research at some point in the future would allow us to:
• reconfirm some of the key findings,
• start to identify direction of travel amongst the churchgoing population (e.g. is the number of
proportionate givers increasing or decreasing? Are congregations becoming better informed?)
• probe further into issues raised by this first survey. In particular, how can we encourage
teaching which is found to be helpful and creates an appetite for more, rather than engenders
feelings of guilt.
Page 28
Although there has been little financial cost in running the study, there has been a significant time
commitment in analysing the data, and compiling this report. A decision to run further research in
the future would need to consider this investment in ensuring it was time well spent.
Areas for further exploration might include:
• Factors motivating giving. One of the statements researched by Q11 was “the most significant
factor in determining how much I give to my local church is its financial need”. It would be
insightful to ask participants to rank several statements about motivations for giving in order of
priority.
• Explore the issue of individual giving vs giving as couples. How do couples work out their giving,
and is the anecdotal understanding that Standing Orders tend to be one per couple, whilst
Regular Envelopes are more likely to come from one per individual correct?
• Legacy Giving. Who is most likely to consider leaving a legacy to the church or to charity, and
how does this correlate with levels of regular giving, and thinking about this (e.g. proportionate
giving).
• We could explore whether the “value” created in giving to the church is as great as when giving
to charity; and whether this matters? Do givers just give to the church, or do they give to work
which has an outcome?
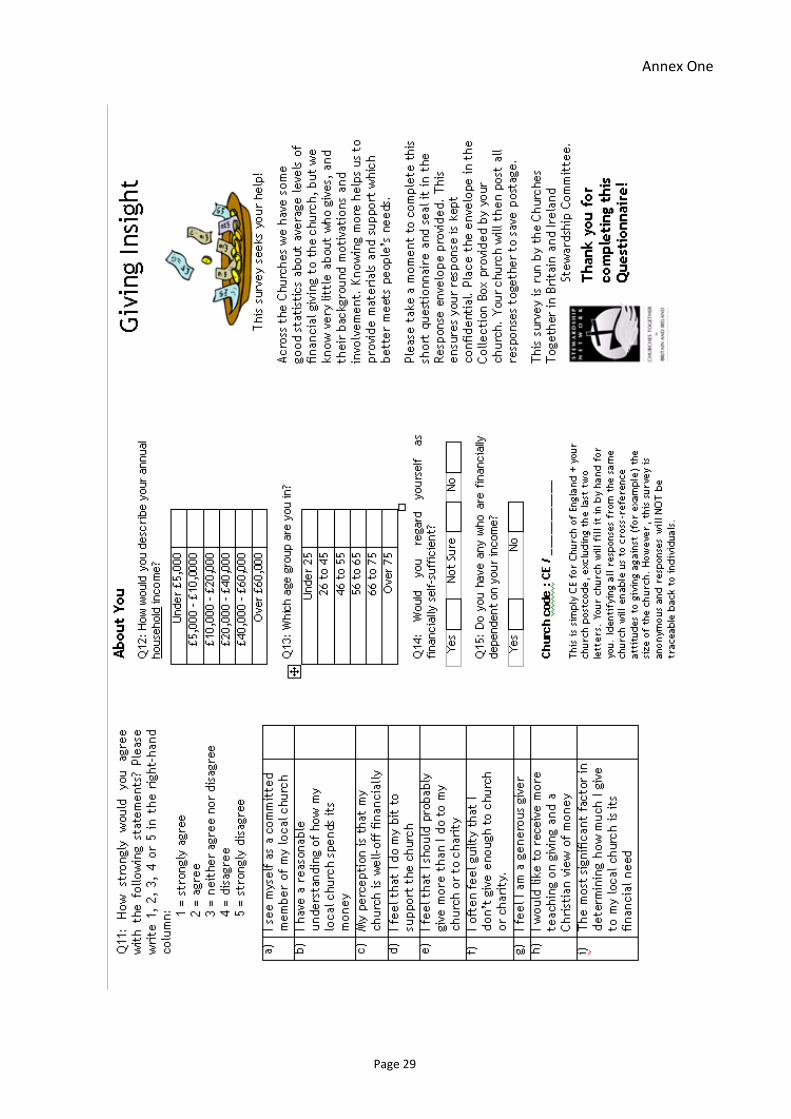
Page 29
Annex One
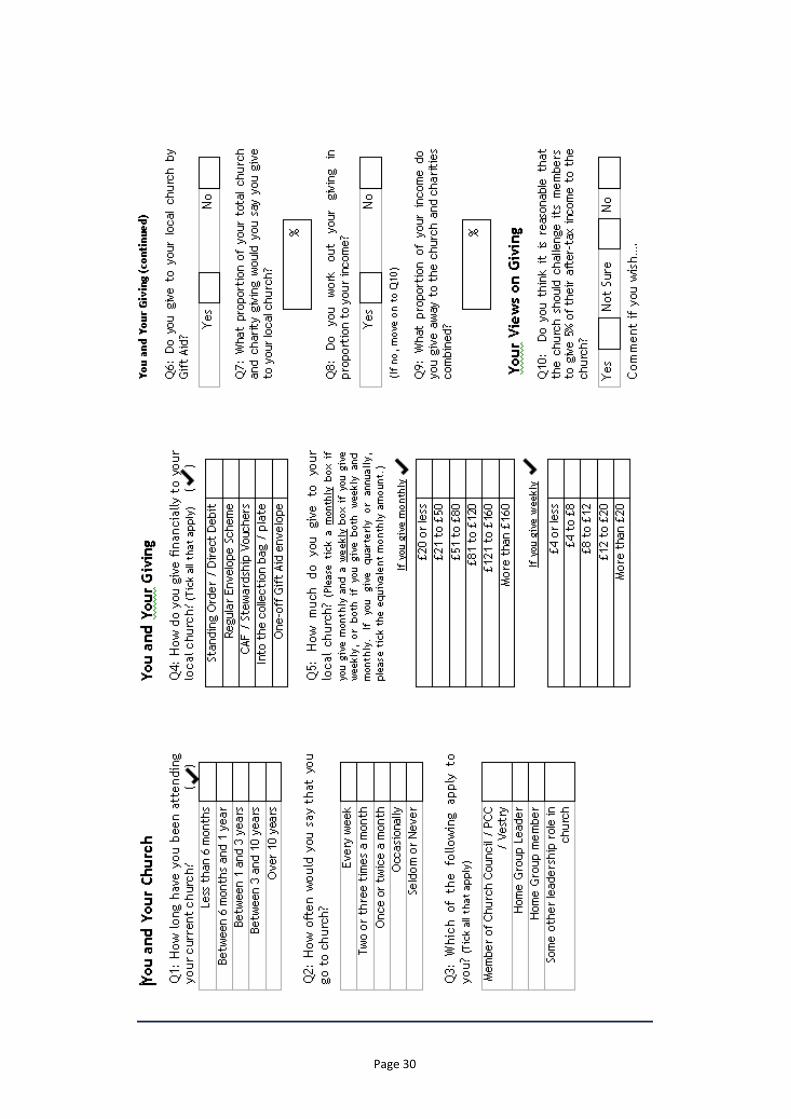
Page 30

Page 31

Page 32