Embed Size (px)
Citation preview
1
A Report from Public Health Wales
Antimicrobial Resistance Programme Surveillance Unit:
Antibacterial Usage in Secondary Care in Wales
2005-2013
Authors: Maggie Heginbothom & Robin Howe Date: 18/11/2014 Status: Final
Version: 1 Antibacterial Usage in Secondary Care in Wales 2005 - 2013
Page: 1 of 71 Antimicrobial Resistance Programme: Surveillance Unit
2
Table of Contents Table of Contents .................................................................................................... 2 Section 1: Introduction ........................................................................................... 3
Background ...........................................................................................................................3 Section 2: Key points of interest ............................................................................ 4 Section 3: Methods ................................................................................................. 5
Pharmacy data ......................................................................................................................5 Antimicrobial Groups ...........................................................................................................6 Data Interpretation ................................................................................................................7
Section 4: Antibacterial Usage ............................................................................... 8 Section 4.1: Antibacterial Usage in Secondary care ............................................. 9
All Wales Antibacterial Usage for Secondary Care in 2013 .............................................9 Comparisons between hospitals (Overall Antibacterial Use) ....................................... 15 Comparisons between hospitals (Specific Antibacterial Use) ..................................... 17
Section 4.2: Individual Hospital Usage ................................................................ 23 Morriston Hospital (Abertawe Bro Morgannwg University Health Board)................... 23 Neath Port Talbot Hospital (ABMU Health Board) .......................................................... 26 Princess of Wales Hospital (ABMU Health Board) ......................................................... 29 Nevill Hall Hospital (Aneurin Bevan Health Board) ........................................................ 32 Royal Gwent Hospital (Aneurin Bevan Health Board) ................................................... 35 Wrexham Maelor Hospital (Betsi Cadwaladr University Health Board) ....................... 38 Ysbyty Glan Clwyd (Betsi Cadwaladr University Health Board) ................................... 41 Ysbyty Gwynedd (Betsi Cadwaladr University Health Board) ...................................... 44 Llandough Hospital (Cardiff and Vale University Health Board) .................................. 47 University Hospital of Wales (CVU Health Board) .......................................................... 50 Prince Charles Hospital (Cwm Taf Health Board) .......................................................... 53 Royal Glamorgan Hospital (Cwm Taf Health Board) ...................................................... 56 Bronglais Hospital (Hywel Dda Health Board) ................................................................ 59 Glangwili Hospital (Hywel Dda Health Board) ................................................................ 62 Prince Philip Hospital (Hywel Dda Health Board) .......................................................... 65 Withybush Hospital (Hywel Dda Health Board) .............................................................. 68
Acknowledgments ................................................................................................. 71
3
Section 1: Introduction
Background
Welsh Antimicrobial Resistance Programme Surveillance Unit
This report from the Welsh Antimicrobial Resistance Programme Surveillance Unit regarding antimicrobial usage in secondary care is aimed at providing an overview of hospital antimicrobial usage in Wales. The report has had to be selective in what is presented, and concentrates on the major acute hospitals and district general hospitals in Wales.
Surveillance of Antimicrobial Usage in Secondary Care
While the use of antimicrobials has revolutionised our ability to treat infections it is associated inevitably with the risk of development and spread of antimicrobial resistance leading to infections that are increasingly difficult to treat, and antimicrobial-associated adverse events, importantly Clostridium difficile-associated disease (CDAD).
It has been estimated that 20-50% of antimicrobial use, both in the Community and in Hospitals, is “inappropriate”. This means that patients and society may be exposed to a significant unnecessary risk of resistant infections and CDAD. In addition there is a financial cost, not only in terms of unnecessary antimicrobial use, but also the additional cost of treating resistant infections and CDAD. A key step in improvement of antimicrobial use is the surveillance and assessment of current antimicrobial usage. This can be achieved using a number of complementary methods including:
Gross surveillance of antimicrobial usage at hospital, specialty or ward/unit level: This can provide comparative information regarding the choice and quantity of agents used, but does not address the indications or appropriateness of antimicrobial use. This current report provides such data at the hospital level and can be used to stimulate more detailed analysis.
Point Prevalence Survey (PPS): In this type of survey, the prescription chart of every patient in a ward or hospital on a set day is checked to see if an antibiotic has been prescribed, and the reasons for the prescription are recorded. This local information about which antibiotics are used and why can be used to target interventions. The Welsh Antimicrobial Resistance Programme is engaged with ECDC, an EU-funded collaboration that, among other projects, supports hospitals in performing comparative PPSs across Europe.
Local unit/ward audits: Audit can be used to explore in detail the indications, dose, duration etc. of antimicrobial prescriptions in order to identify areas for improvement.
It is hoped that access to this data will support:
Audit patterns of antimicrobial usage
Audit of compliance to guidelines and formularies
Monitoring the outcomes of interventions.
Educational programs
4
Section 2: Key points of interest
Antimicrobial Usage in Secondary Care
Antimicrobial usage varies between hospitals in Wales with significant changes over the last 9 years in response to the problem of C. difficile.
Total antibiotic use o In 2013, six of the sixteen individual hospitals reported showed a
decrease in total antimicrobial usage, but seven showed a significant increases in usage.
o In 2013, the upward trend in usage of beta-lactam/beta-lactamase inhibitor combinations (e.g. co-amoxiclav) continued.
o The downward trend in cephalosporin usage levelled off in 2011, and in some hospitals there was a small upward trend in 2013.
o Carbapenem usage (e.g. meropenem) showed a steady upward trend. o The downward trend fluoroquinolone usage levelled off in 2012, and
there was a small increase in usage in some sites in 2013.
In terms of total antibiotic use in secondary care across Wales in 2013 o The commonest antibiotic type was beta-lactam/beta-lactamase
inhibitor combinations (e.g. co-amoxiclav) which represented 28% of use, followed by macrolides (e.g. clarithromycin) and broad-spectrum penicillins (e.g. amoxicillin) both 10%.
o Cephalosporins and fluoroquinolones (e.g. ciprofloxacin) which have been implicated as causes of C. difficile infection represented 5.1% and 5.2% of total antibiotic use respectively.
There was significant inter-hospital variability in gross annual antimicrobial use in 2013; the lowest use was recorded at Neath Port Talbot hospital (445 DDDs/1000 BD) and highest use at Glangwili hospital (1366 DDDs/1000BD).
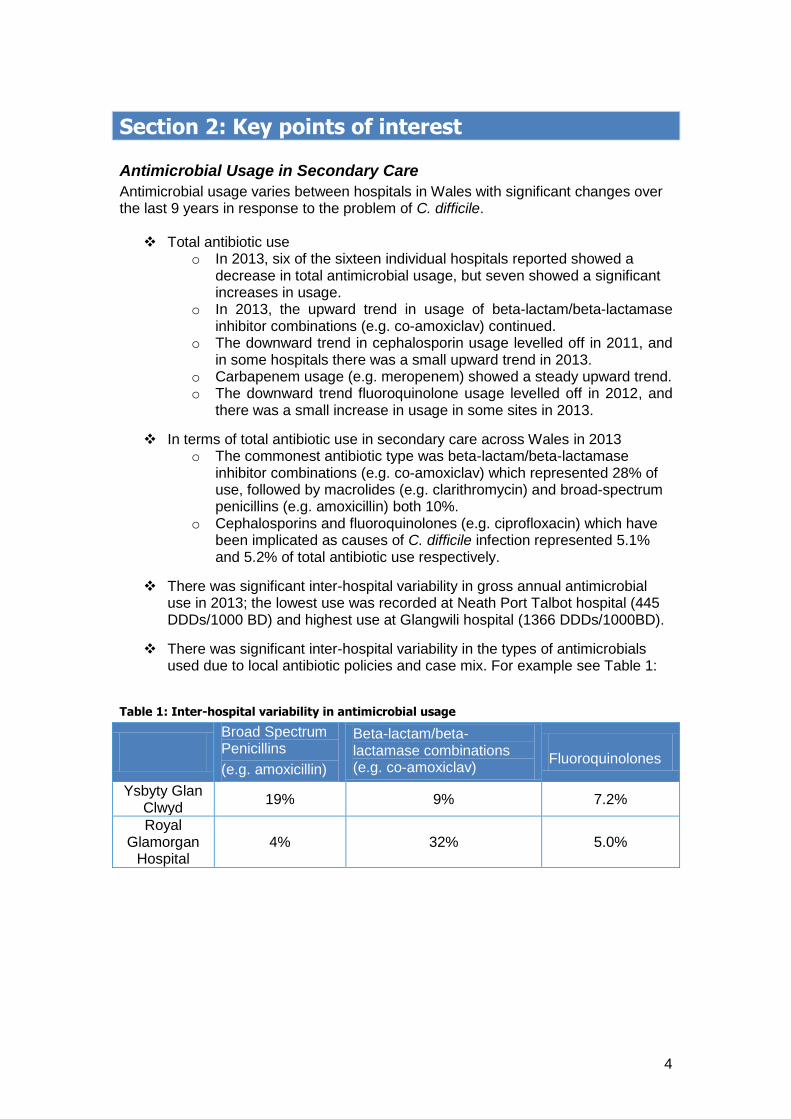
There was significant inter-hospital variability in the types of antimicrobials used due to local antibiotic policies and case mix. For example see Table 1:
Table 1: Inter-hospital variability in antimicrobial usage
Broad Spectrum Penicillins
(e.g. amoxicillin)
Beta-lactam/beta-lactamase combinations (e.g. co-amoxiclav)
Fluoroquinolones
Ysbyty Glan Clwyd
19% 9% 7.2%
Royal Glamorgan
Hospital 4% 32% 5.0%
5
Section 3: Methods
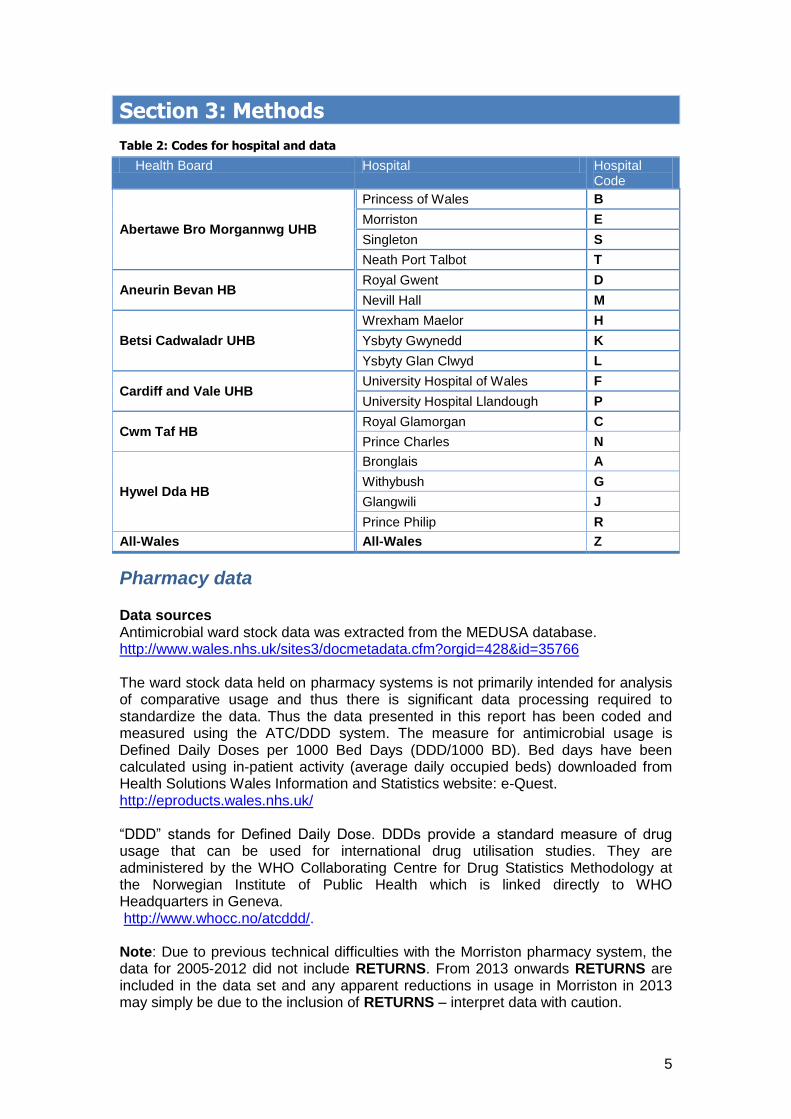
Table 2: Codes for hospital and data
Health Board Hospital Hospital Code
Abertawe Bro Morgannwg UHB
Princess of Wales B
Morriston E
Singleton S
Neath Port Talbot T
Aneurin Bevan HB Royal Gwent D
Nevill Hall M
Betsi Cadwaladr UHB
Wrexham Maelor H
Ysbyty Gwynedd K
Ysbyty Glan Clwyd L
Cardiff and Vale UHB University Hospital of Wales F
University Hospital Llandough P
Cwm Taf HB Royal Glamorgan C
Prince Charles N
Hywel Dda HB
Bronglais A
Withybush G
Glangwili J
Prince Philip R
All-Wales All-Wales Z
Pharmacy data Data sources Antimicrobial ward stock data was extracted from the MEDUSA database. http://www.wales.nhs.uk/sites3/docmetadata.cfm?orgid=428&id=35766 The ward stock data held on pharmacy systems is not primarily intended for analysis of comparative usage and thus there is significant data processing required to standardize the data. Thus the data presented in this report has been coded and measured using the ATC/DDD system. The measure for antimicrobial usage is Defined Daily Doses per 1000 Bed Days (DDD/1000 BD). Bed days have been calculated using in-patient activity (average daily occupied beds) downloaded from Health Solutions Wales Information and Statistics website: e-Quest. http://eproducts.wales.nhs.uk/ “DDD” stands for Defined Daily Dose. DDDs provide a standard measure of drug usage that can be used for international drug utilisation studies. They are administered by the WHO Collaborating Centre for Drug Statistics Methodology at the Norwegian Institute of Public Health which is linked directly to WHO Headquarters in Geneva. http://www.whocc.no/atcddd/. Note: Due to previous technical difficulties with the Morriston pharmacy system, the data for 2005-2012 did not include RETURNS. From 2013 onwards RETURNS are included in the data set and any apparent reductions in usage in Morriston in 2013 may simply be due to the inclusion of RETURNS – interpret data with caution.
6
Antimicrobial Groups Data is presented for the following antimicrobials/antimicrobial groups (ATC code):
Tetracyclines e.g. oxytetracycline (J01AA)
Amphenicols e.g. chloramphenicol (J01BA)
Broad spectrum penicillins (BSP) e.g. amoxicillin (J01CA)
Beta-lactamase sensitive penicillins (BLSP) e.g. penicillin V (J01CE)
Beta-lactamase resistant penicillins (BLRP) e.g. flucloxacillin (J01CF)
Beta-lactam/beta-lactamase inhibitor combinations (BLI) (J01CR)
Cephalosporins and carbapenems (J01D)
Cephalosporins alone (J01D*)
First generation cephalosporins e.g. cefalexin (J01DB)
Second generation cephalosporins e.g. cefuroxime (J01DC)
Third generation cephalosporins e.g. cefotaxime (J01DD)
Monobactams e.g. aztreonam (J01DF)
Carbapenems e.g. imipenem (J01DH)
Trimethoprim & sulphonamides (J01E)
Macrolides e.g. erythromycin (J01FA)
Lincosamides & streptogramins e.g. clindamycin (J01F)
Streptomycin (J01GA)
Aminoglycosides e.g. gentamicin (J01GB)
Fluoroquinolones e.g. ciprofloxacin (J01MA)
Glycopeptides e.g. vancomycin (J01XA)
Polymixins e.g. colistin (J01XB)
Fusidic Acid (J01XC)
Imidazole derivatives e.g. metronidazole (J01XD)
Nitrofuran derivatives e.g. nitrofurantoin (J01XE)
Linezolid (J01XX)
Rifampicin (J04AB)
Data presented
Pharmacy systems are primarily designed to support stock control and distribution and may be differently configured in different Trusts/Hospitals. In order to increase comparability, the antimicrobial usage data presented in this report only includes the following “issue types” from pharmacy:
In-patient Scripts (IP Scripts)
Patients’ Own Medications (POMs) or One Stop Medications
Returns
To Take Away (TTA)/Discharge Scripts
Ward Requisitions
The main objective of this report is to show trends in antimicrobial usage within the hospital. Thus the dataset does not include the issue types A&E scripts, Clinics, Day cases, Day hospital, OP scripts and Sales usage. We are unable to resolve returns against their original issue type, and only present IP scripts, POMs, returns, TTAs and ward requisitions. Therefore, data presented may be an under representation of true hospital usage if returns were for OP scripts etc. Conversely, the data may represent an over estimate of true in hospital use depending on the amount of POMs and TTA medication taken out of hospital.
7
Note: Only data for oral and parenteral antimicrobial usage are included in this report; it DOES NOT include topical, inhaled, rectal or genital preparation usage. Data for Singleton Hospital is not included in this report as their data is not available from MEDUSA, and for no other reason. It is hoped that this data will be included in future reports.
Data Interpretation In interpreting the data presented in this report it is important to appreciate the ways in which the data is collated and the factors that may drive variability in antimicrobial usage between hospitals. Important issues that should be considered include:
Data applicability. As noted above, the data is drawn from Pharmacy computer systems that are designed primarily for stock control, and which are configured slightly differently in different units. These differences may mean that some antimicrobials that are used out-of-hospital are included in the data.
The usage of antimicrobials is standardised against a denominator of patient activity (i.e. 1000 bed days) but may also be influenced by patient case-mix in different hospitals. Thus a hospital which treats significant numbers of immunocompromised patients might be expected to use comparatively larger amounts of broad-spectrum antimicrobials.
The usage of antimicrobials should normally reflect the antimicrobial policies of each unit. For example the usage of piperacillin/tazobactam rather than an alternative broad spectrum agent may be a reflection of the hospital policy for the treatment of patients presenting with neutropenic sepsis.
The data presented can be used to identify changes in usage and monitor the effect of interventions.
When interpreting graphs it is important to note that the y-axis scales vary between graphs and care should be used in interpretation.
8
Section 4: Antibacterial Usage
This section presents hospital antimicrobial stock data, and dispensed prescription data for primary care. It is important to understand the differences in the two data sets in order to interpret the data: Hospital ward stock data held on pharmacy systems is not primarily intended for analysis of comparative usage and thus there is significant data processing required to standardize the data. The data presented in this report has been coded and measured using the ATC/DDD system. The measure for hospital antimicrobial usage is Defined Daily Doses per 1000 Bed Days (DDD/1000 BD). It is important to remember that changes in DDDs may not only reflect changes in the number of patients receiving antibacterials, but also variance in dosage and duration.
9
Section 4.1: Antibacterial Usage in Secondary care
All Wales Antibacterial Usage for Secondary Care in 2013
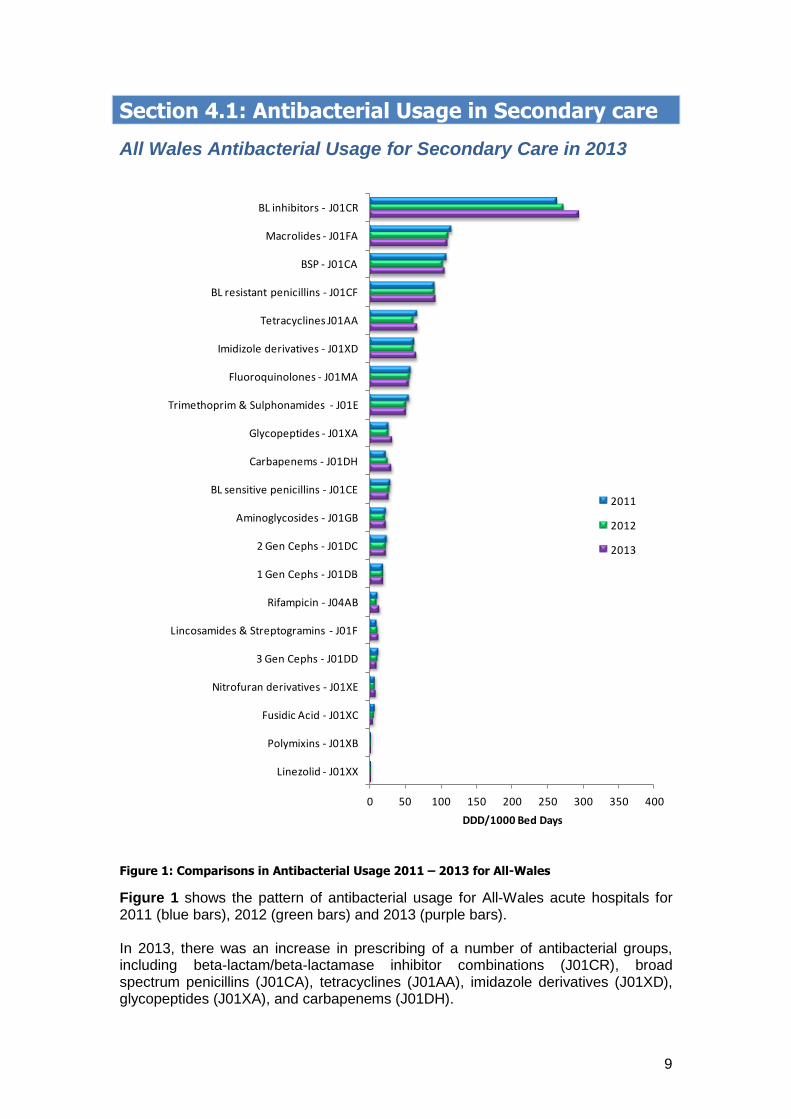
Figure 1: Comparisons in Antibacterial Usage 2011 – 2013 for All-Wales
Figure 1 shows the pattern of antibacterial usage for All-Wales acute hospitals for 2011 (blue bars), 2012 (green bars) and 2013 (purple bars). In 2013, there was an increase in prescribing of a number of antibacterial groups, including beta-lactam/beta-lactamase inhibitor combinations (J01CR), broad spectrum penicillins (J01CA), tetracyclines (J01AA), imidazole derivatives (J01XD), glycopeptides (J01XA), and carbapenems (J01DH).
0 50 100 150 200 250 300 350 400
Linezolid - J01XX
Polymixins - J01XB
Fusidic Acid - J01XC
Nitrofuran derivatives - J01XE
3 Gen Cephs - J01DD
Lincosamides & Streptogramins - J01F
Rifampicin - J04AB
1 Gen Cephs - J01DB
2 Gen Cephs - J01DC
Aminoglycosides - J01GB
BL sensitive penicillins - J01CE
Carbapenems - J01DH
Glycopeptides - J01XA
Trimethoprim & Sulphonamides - J01E
Fluoroquinolones - J01MA
Imidizole derivatives - J01XD
Tetracyclines J01AA
BL resistant penicillins - J01CF
BSP - J01CA
Macrolides - J01FA
BL inhibitors - J01CR
DDD/1000 Bed Days
2011
2012
2013
10
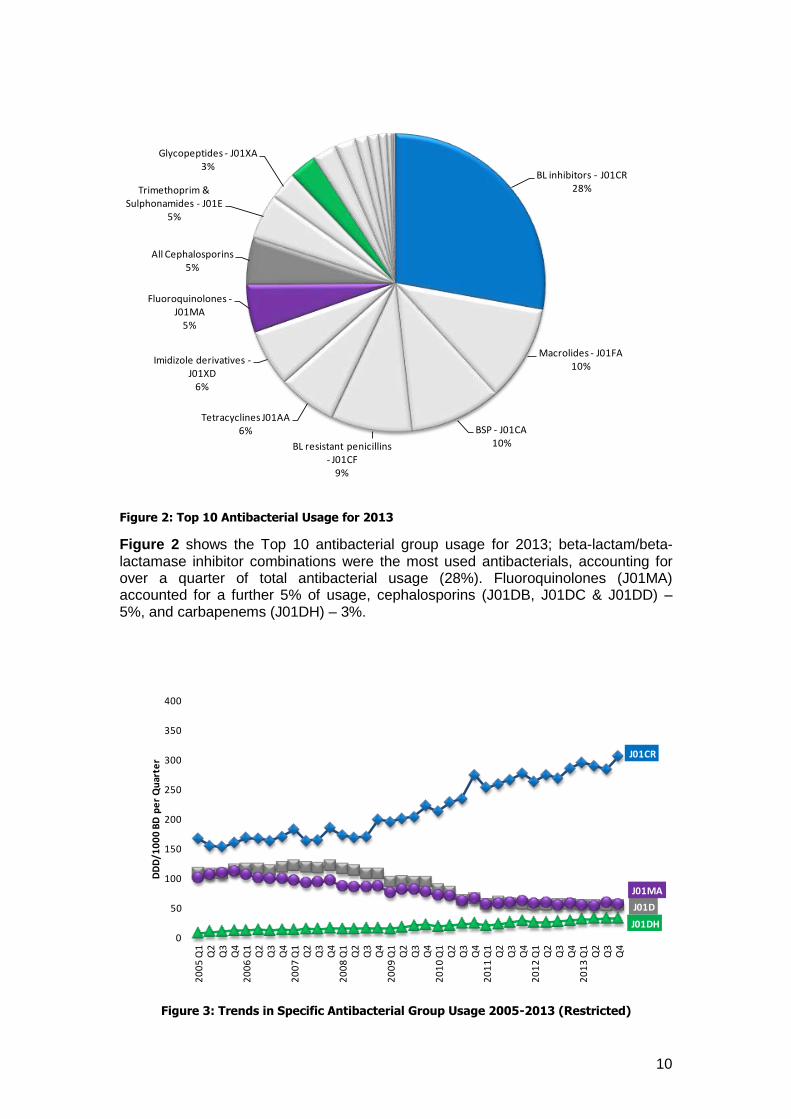
Figure 2: Top 10 Antibacterial Usage for 2013
Figure 2 shows the Top 10 antibacterial group usage for 2013; beta-lactam/beta-lactamase inhibitor combinations were the most used antibacterials, accounting for over a quarter of total antibacterial usage (28%). Fluoroquinolones (J01MA) accounted for a further 5% of usage, cephalosporins (J01DB, J01DC & J01DD) – 5%, and carbapenems (J01DH) – 3%.
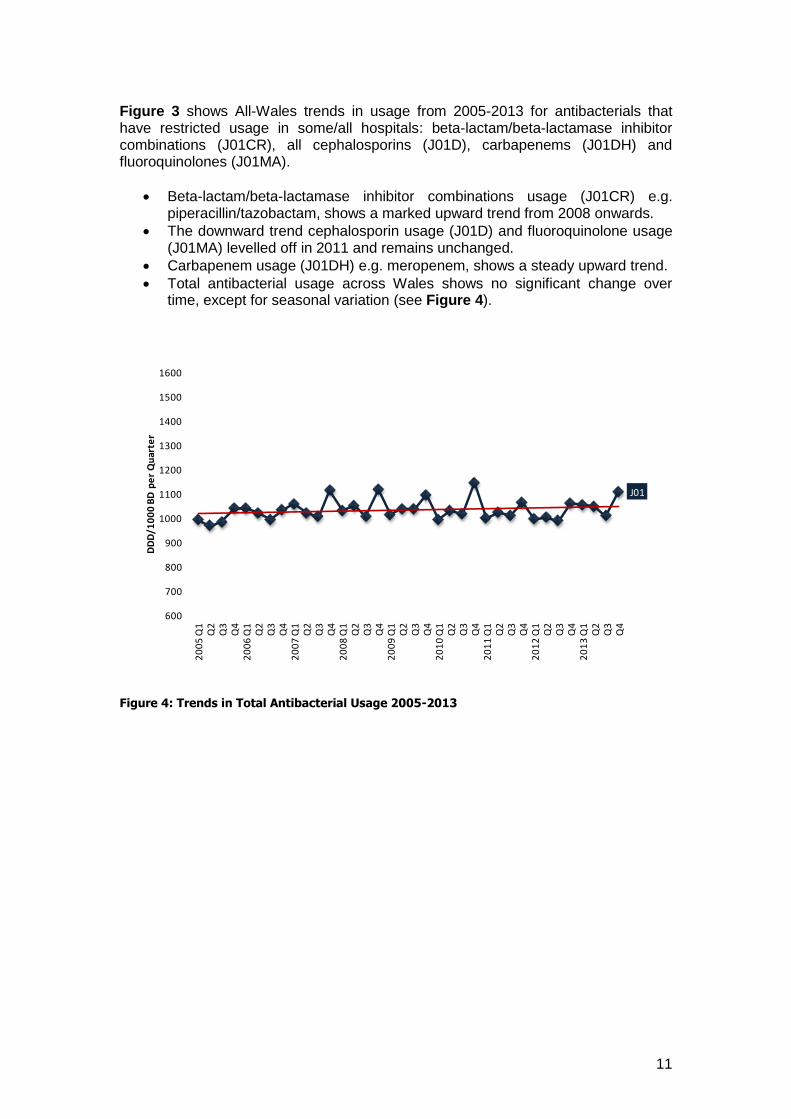
Figure 3: Trends in Specific Antibacterial Group Usage 2005-2013 (Restricted)
BL inhibitors - J01CR28%
Macrolides - J01FA10%
BSP - J01CA10%BL resistant penicillins
- J01CF9%
Tetracyclines J01AA6%
Imidizole derivatives -J01XD
6%
Fluoroquinolones -J01MA
5%
All Cephalosporins5%
Trimethoprim & Sulphonamides - J01E
5%
Glycopeptides - J01XA3%
J01CR
J01D
J01DH
J01MA
0
50
100
150
200
250
300
350
400
20
05
Q1
Q2
Q3
Q4
20
06
Q1
Q2
Q3
Q4
20
07
Q1
Q2
Q3
Q4
20
08
Q1
Q2
Q3
Q4
20
09
Q1
Q2
Q3
Q4
20
10
Q1
Q2
Q3
Q4
20
11
Q1
Q2
Q3
Q4
20
12
Q1
Q2
Q3
Q4
20
13
Q1
Q2
Q3
Q4
DD
D/1
00
0 B
D p
er
Qu
arte
r
11
Figure 3 shows All-Wales trends in usage from 2005-2013 for antibacterials that have restricted usage in some/all hospitals: beta-lactam/beta-lactamase inhibitor combinations (J01CR), all cephalosporins (J01D), carbapenems (J01DH) and fluoroquinolones (J01MA).
Beta-lactam/beta-lactamase inhibitor combinations usage (J01CR) e.g. piperacillin/tazobactam, shows a marked upward trend from 2008 onwards.
The downward trend cephalosporin usage (J01D) and fluoroquinolone usage (J01MA) levelled off in 2011 and remains unchanged.
Carbapenem usage (J01DH) e.g. meropenem, shows a steady upward trend.
Total antibacterial usage across Wales shows no significant change over time, except for seasonal variation (see Figure 4).
Figure 4: Trends in Total Antibacterial Usage 2005-2013
J01
600
700
800
900
1000
1100
1200
1300
1400
1500
1600
20
05
Q1
Q2
Q3
Q4
20
06
Q1
Q2
Q3
Q4
20
07
Q1
Q2
Q3
Q4
20
08
Q1
Q2
Q3
Q4
20
09
Q1
Q2
Q3
Q4
20
10
Q1
Q2
Q3
Q4
20
11
Q1
Q2
Q3
Q4
20
12
Q1
Q2
Q3
Q4
20
13
Q1
Q2
Q3
Q4
DD
D/1
00
0 B
D p
er
Qu
arte
r
12
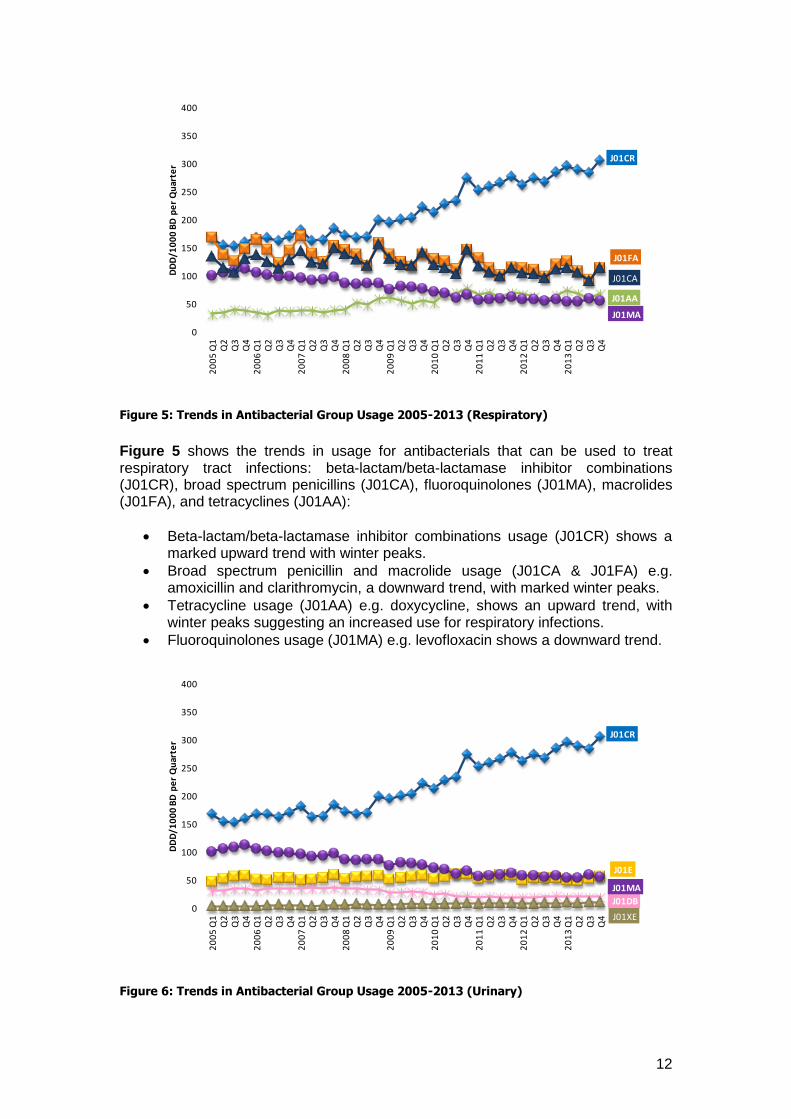
Figure 5: Trends in Antibacterial Group Usage 2005-2013 (Respiratory)
Figure 5 shows the trends in usage for antibacterials that can be used to treat respiratory tract infections: beta-lactam/beta-lactamase inhibitor combinations (J01CR), broad spectrum penicillins (J01CA), fluoroquinolones (J01MA), macrolides (J01FA), and tetracyclines (J01AA):
Beta-lactam/beta-lactamase inhibitor combinations usage (J01CR) shows a marked upward trend with winter peaks.
Broad spectrum penicillin and macrolide usage (J01CA & J01FA) e.g. amoxicillin and clarithromycin, a downward trend, with marked winter peaks.
Tetracycline usage (J01AA) e.g. doxycycline, shows an upward trend, with winter peaks suggesting an increased use for respiratory infections.
Fluoroquinolones usage (J01MA) e.g. levofloxacin shows a downward trend.
Figure 6: Trends in Antibacterial Group Usage 2005-2013 (Urinary)
J01CR
J01FA
J01AA
J01MA
J01CA
0
50
100
150
200
250
300
350
400
20
05
Q1
Q2
Q3
Q4
20
06
Q1
Q2
Q3
Q4
20
07
Q1
Q2
Q3
Q4
20
08
Q1
Q2
Q3
Q4
20
09
Q1
Q2
Q3
Q4
20
10
Q1
Q2
Q3
Q4
20
11
Q1
Q2
Q3
Q4
20
12
Q1
Q2
Q3
Q4
20
13
Q1
Q2
Q3
Q4
DD
D/1
00
0 B
D p
er
Qu
arte
r
J01CR
J01E
J01DB
J01MA
J01XE0
50
100
150
200
250
300
350
400
20
05
Q1
Q2
Q3
Q4
20
06
Q1
Q2
Q3
Q4
20
07
Q1
Q2
Q3
Q4
20
08
Q1
Q2
Q3
Q4
20
09
Q1
Q2
Q3
Q4
20
10
Q1
Q2
Q3
Q4
20
11
Q1
Q2
Q3
Q4
20
12
Q1
Q2
Q3
Q4
20
13
Q1
Q2
Q3
Q4
DD
D/1
00
0 B
D p
er
Qu
arte
r
13
Figure 6 shows the trends in usage for antibacterials that can be used to treat urinary tract infections: beta-lactam/beta-lactamase inhibitor combinations (J01CR), first generation cephalosporins (J01DB), fluoroquinolones (J01MA), nitrofurans (J01XE), and trimethoprim and sulphonamide combinations (J01E):
Beta-lactam/beta-lactamase inhibitor combinations usage (J01CR) shows a marked upward trend.
First generation cephalosporin usage (J01DB) e.g. cefalexin decreased between 2008/2009 but has levelled off since.
Nitrofurantoin usage (J01XE) and trimethoprim and combinations usage (J01E) shows an upward trend.
Fluoroquinolones usage (J01MA) e.g. ciprofloxacin shows a downward trend.
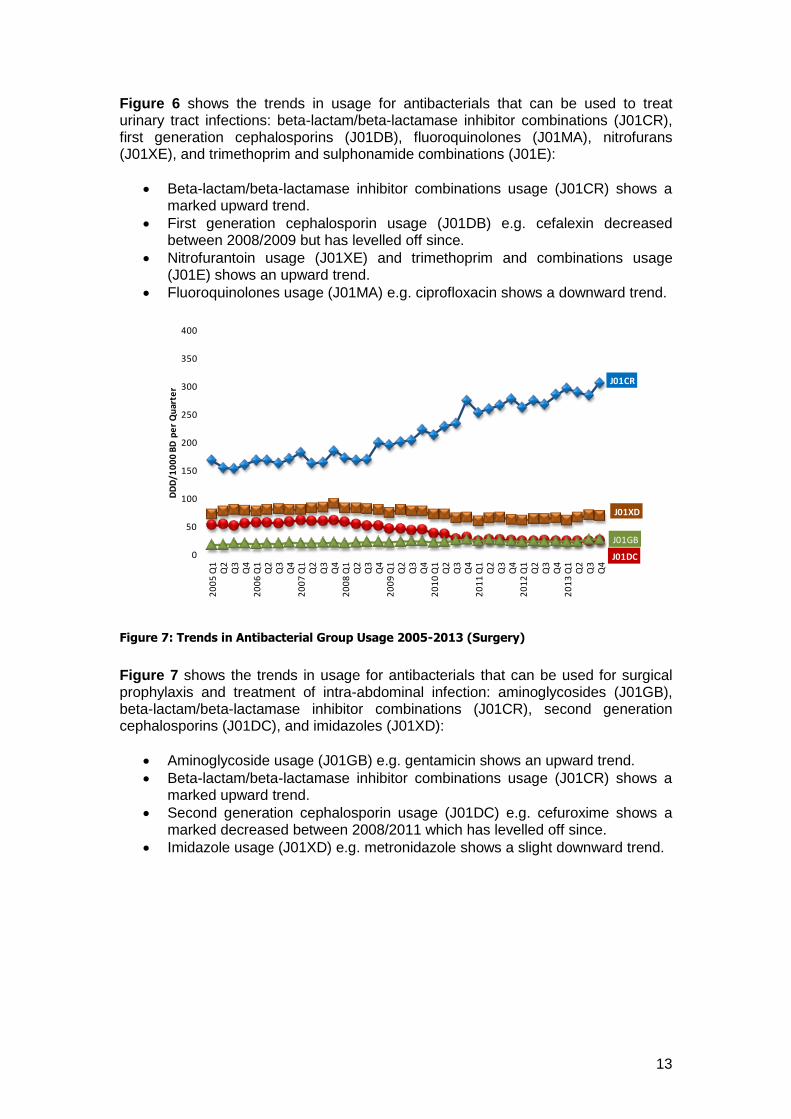
Figure 7: Trends in Antibacterial Group Usage 2005-2013 (Surgery)
Figure 7 shows the trends in usage for antibacterials that can be used for surgical prophylaxis and treatment of intra-abdominal infection: aminoglycosides (J01GB), beta-lactam/beta-lactamase inhibitor combinations (J01CR), second generation cephalosporins (J01DC), and imidazoles (J01XD):
Aminoglycoside usage (J01GB) e.g. gentamicin shows an upward trend.
Beta-lactam/beta-lactamase inhibitor combinations usage (J01CR) shows a marked upward trend.
Second generation cephalosporin usage (J01DC) e.g. cefuroxime shows a marked decreased between 2008/2011 which has levelled off since.
Imidazole usage (J01XD) e.g. metronidazole shows a slight downward trend.
J01CR
J01XD
J01DC
J01GB
0
50
100
150
200
250
300
350
400
20
05
Q1
Q2
Q3
Q4
20
06
Q1
Q2
Q3
Q4
20
07
Q1
Q2
Q3
Q4
20
08
Q1
Q2
Q3
Q4
20
09
Q1
Q2
Q3
Q4
20
10
Q1
Q2
Q3
Q4
20
11
Q1
Q2
Q3
Q4
20
12
Q1
Q2
Q3
Q4
20
13
Q1
Q2
Q3
Q4
DD
D/1
00
0 B
D p
er
Qu
arte
r
14
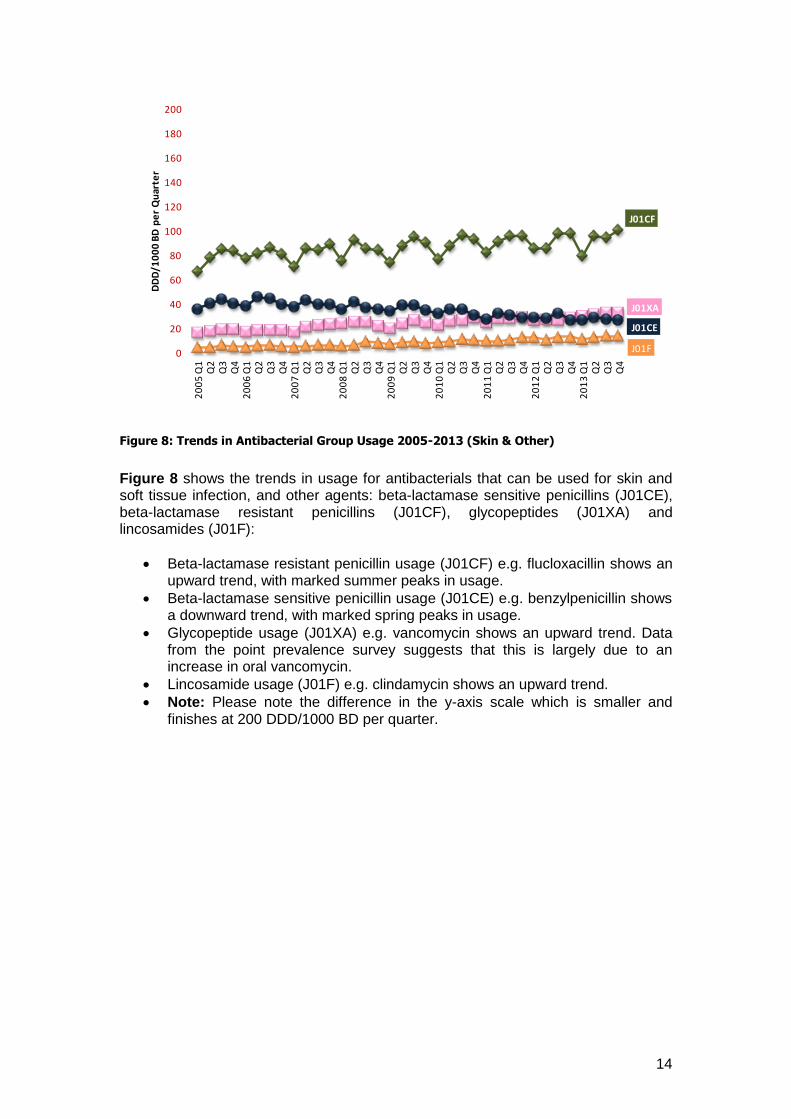
Figure 8: Trends in Antibacterial Group Usage 2005-2013 (Skin & Other)
Figure 8 shows the trends in usage for antibacterials that can be used for skin and soft tissue infection, and other agents: beta-lactamase sensitive penicillins (J01CE), beta-lactamase resistant penicillins (J01CF), glycopeptides (J01XA) and lincosamides (J01F):
Beta-lactamase resistant penicillin usage (J01CF) e.g. flucloxacillin shows an upward trend, with marked summer peaks in usage.
Beta-lactamase sensitive penicillin usage (J01CE) e.g. benzylpenicillin shows a downward trend, with marked spring peaks in usage.
Glycopeptide usage (J01XA) e.g. vancomycin shows an upward trend. Data from the point prevalence survey suggests that this is largely due to an increase in oral vancomycin.
Lincosamide usage (J01F) e.g. clindamycin shows an upward trend.
Note: Please note the difference in the y-axis scale which is smaller and finishes at 200 DDD/1000 BD per quarter.
J01CF
J01XA
J01CE
J01F0
20
40
60
80
100
120
140
160
180
200
20
05
Q1
Q2
Q3
Q4
20
06
Q1
Q2
Q3
Q4
20
07
Q1
Q2
Q3
Q4
20
08
Q1
Q2
Q3
Q4
20
09
Q1
Q2
Q3
Q4
20
10
Q1
Q2
Q3
Q4
20
11
Q1
Q2
Q3
Q4
20
12
Q1
Q2
Q3
Q4
20
13
Q1
Q2
Q3
Q4
DD
D/1
00
0 B
D p
er
Qu
arte
r
15
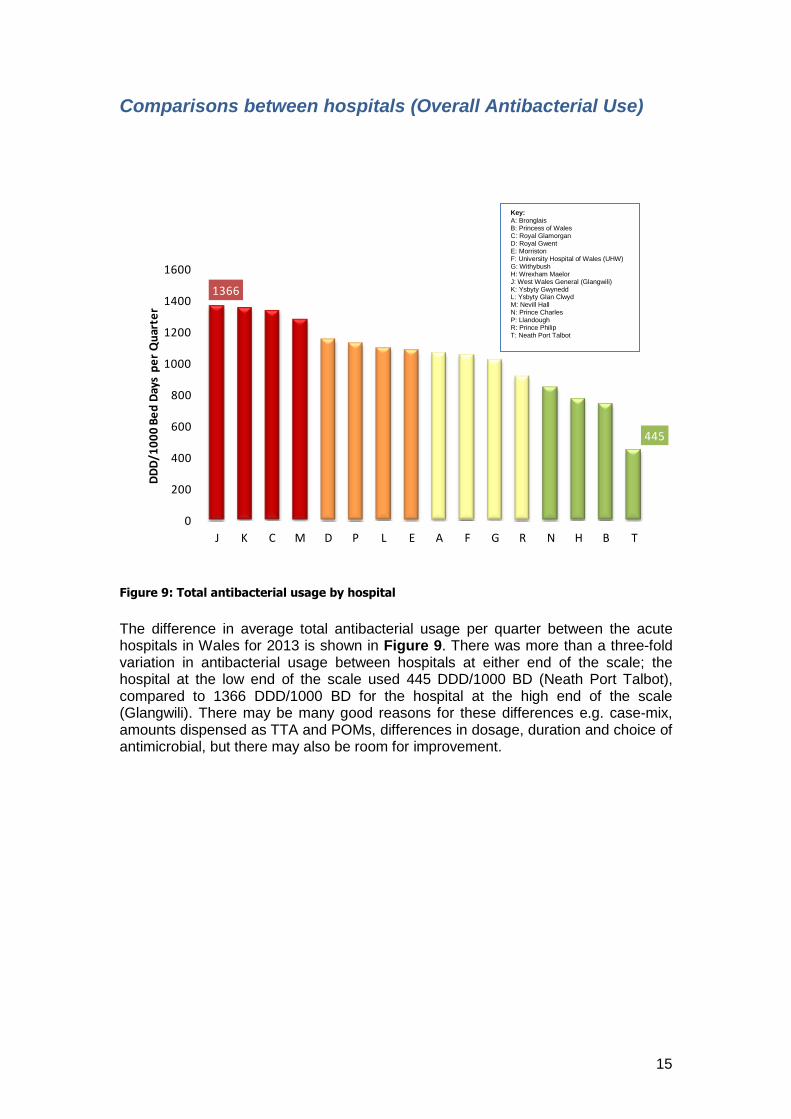
Comparisons between hospitals (Overall Antibacterial Use)
Figure 9: Total antibacterial usage by hospital
The difference in average total antibacterial usage per quarter between the acute hospitals in Wales for 2013 is shown in Figure 9. There was more than a three-fold variation in antibacterial usage between hospitals at either end of the scale; the hospital at the low end of the scale used 445 DDD/1000 BD (Neath Port Talbot), compared to 1366 DDD/1000 BD for the hospital at the high end of the scale (Glangwili). There may be many good reasons for these differences e.g. case-mix, amounts dispensed as TTA and POMs, differences in dosage, duration and choice of antimicrobial, but there may also be room for improvement.
1366
445
0
200
400
600
800
1000
1200
1400
1600
J K C M D P L E A F G R N H B T
DD
D/1
00
0 B
ed
Day
s p
er
Qu
arte
r
Key: A: Bronglais B: Princess of Wales C: Royal Glamorgan D: Royal Gwent E: Morriston F: University Hospital of Wales (UHW) G: Withybush H: Wrexham Maelor J: West Wales General (Glangwili) K: Ysbyty Gwynedd L: Ysbyty Glan Clwyd M: Nevill Hall N: Prince Charles P: Llandough R: Prince Philip T: Neath Port Talbot
16
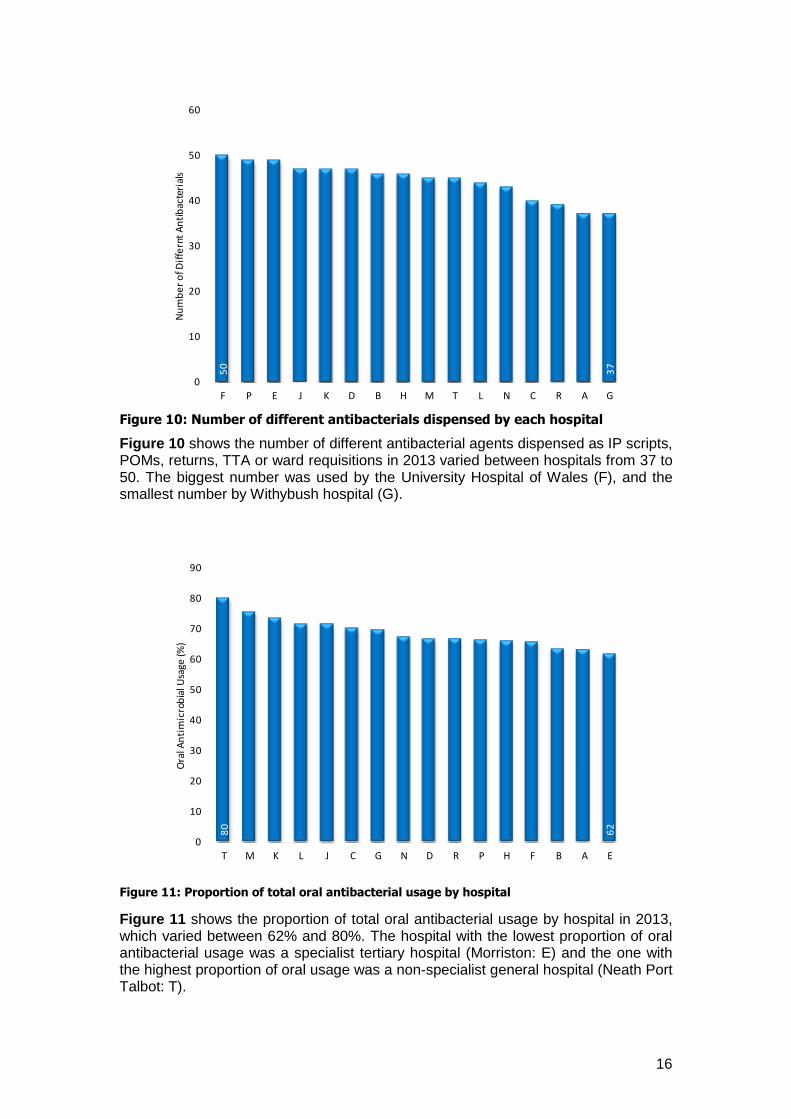
Figure 10: Number of different antibacterials dispensed by each hospital
Figure 10 shows the number of different antibacterial agents dispensed as IP scripts, POMs, returns, TTA or ward requisitions in 2013 varied between hospitals from 37 to 50. The biggest number was used by the University Hospital of Wales (F), and the smallest number by Withybush hospital (G).
Figure 11: Proportion of total oral antibacterial usage by hospital
Figure 11 shows the proportion of total oral antibacterial usage by hospital in 2013, which varied between 62% and 80%. The hospital with the lowest proportion of oral antibacterial usage was a specialist tertiary hospital (Morriston: E) and the one with the highest proportion of oral usage was a non-specialist general hospital (Neath Port Talbot: T).
50
37
0
10
20
30
40
50
60
F P E J K D B H M T L N C R A G
Nu
mb
er
of D
iffe
rnt
An
tib
acte
rial
s
80
62
0
10
20
30
40
50
60
70
80
90
T M K L J C G N D R P H F B A E
Ora
l An
tim
icro
bia
l Usa
ge (%
)
17
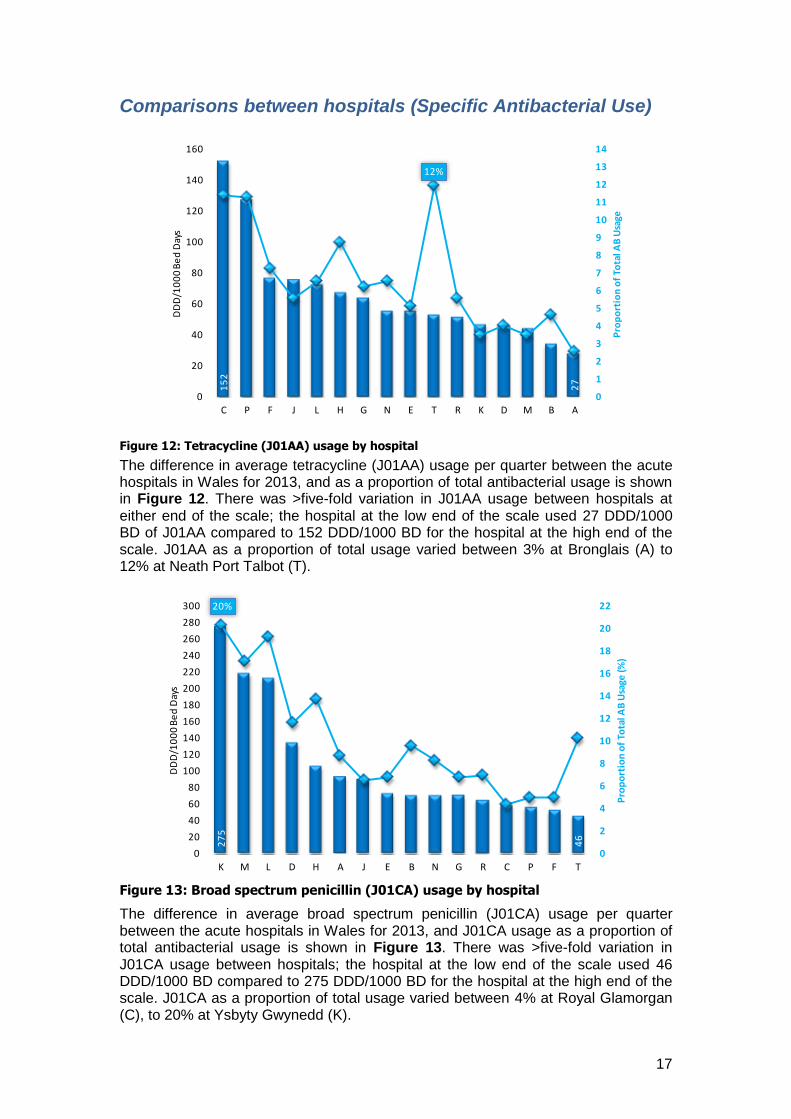
Comparisons between hospitals (Specific Antibacterial Use)
Figure 12: Tetracycline (J01AA) usage by hospital
The difference in average tetracycline (J01AA) usage per quarter between the acute hospitals in Wales for 2013, and as a proportion of total antibacterial usage is shown in Figure 12. There was >five-fold variation in J01AA usage between hospitals at either end of the scale; the hospital at the low end of the scale used 27 DDD/1000 BD of J01AA compared to 152 DDD/1000 BD for the hospital at the high end of the scale. J01AA as a proportion of total usage varied between 3% at Bronglais (A) to 12% at Neath Port Talbot (T).
Figure 13: Broad spectrum penicillin (J01CA) usage by hospital
The difference in average broad spectrum penicillin (J01CA) usage per quarter between the acute hospitals in Wales for 2013, and J01CA usage as a proportion of total antibacterial usage is shown in Figure 13. There was >five-fold variation in J01CA usage between hospitals; the hospital at the low end of the scale used 46 DDD/1000 BD compared to 275 DDD/1000 BD for the hospital at the high end of the scale. J01CA as a proportion of total usage varied between 4% at Royal Glamorgan (C), to 20% at Ysbyty Gwynedd (K).
15
2
27
12%
0
1
2
3
4
5
6
7
8
9
10
11
12
13
14
0
20
40
60
80
100
120
140
160
C P F J L H G N E T R K D M B A
Pro
po
rtio
n o
f To
tal A
B U
sage
DD
D/1
00
0 B
ed
Day
s
27
5
46
20%
0
2
4
6
8
10
12
14
16
18
20
22
0
20
40
60
80
100
120
140
160
180
200
220
240
260
280
300
K M L D H A J E B N G R C P F T
Pro
po
rtio
n o
f To
tal A
B U
sage
(%)
DD
D/1
00
0 B
ed
Day
s
18
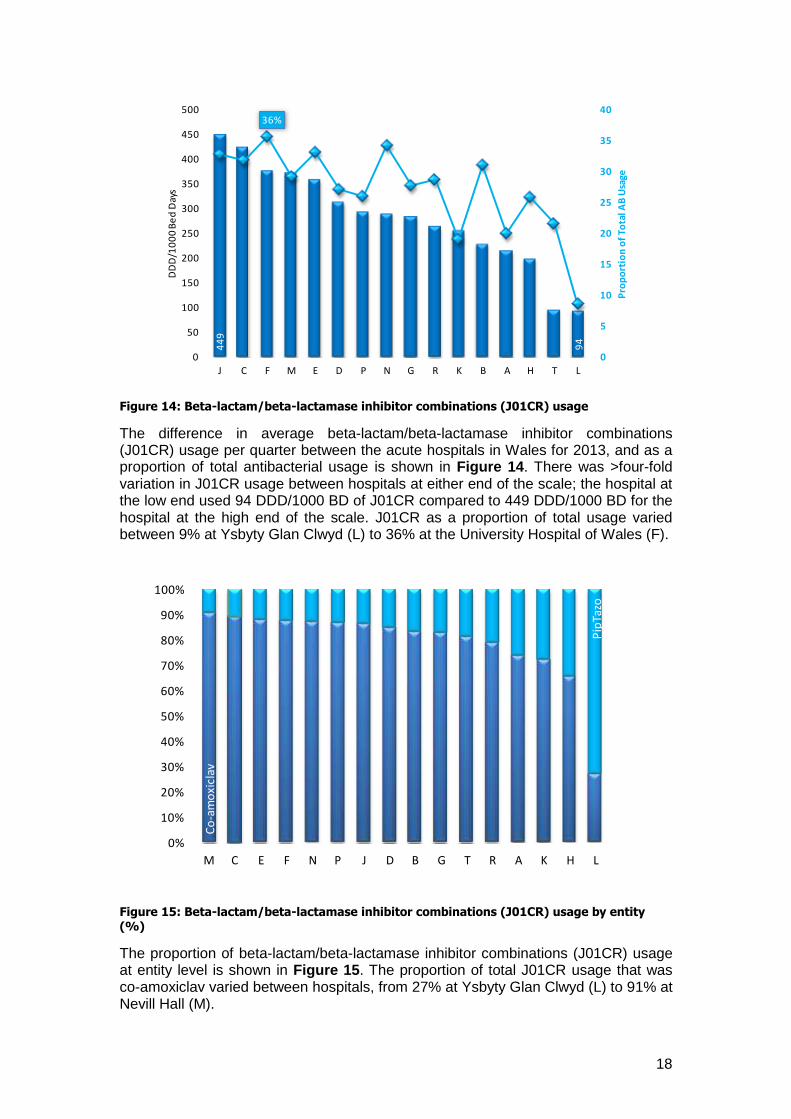
Figure 14: Beta-lactam/beta-lactamase inhibitor combinations (J01CR) usage
The difference in average beta-lactam/beta-lactamase inhibitor combinations (J01CR) usage per quarter between the acute hospitals in Wales for 2013, and as a proportion of total antibacterial usage is shown in Figure 14. There was >four-fold variation in J01CR usage between hospitals at either end of the scale; the hospital at the low end used 94 DDD/1000 BD of J01CR compared to 449 DDD/1000 BD for the hospital at the high end of the scale. J01CR as a proportion of total usage varied between 9% at Ysbyty Glan Clwyd (L) to 36% at the University Hospital of Wales (F).
Figure 15: Beta-lactam/beta-lactamase inhibitor combinations (J01CR) usage by entity
(%)
The proportion of beta-lactam/beta-lactamase inhibitor combinations (J01CR) usage at entity level is shown in Figure 15. The proportion of total J01CR usage that was co-amoxiclav varied between hospitals, from 27% at Ysbyty Glan Clwyd (L) to 91% at Nevill Hall (M).
44
9
94
36%
0
5
10
15
20
25
30
35
40
0
50
100
150
200
250
300
350
400
450
500
J C F M E D P N G R K B A H T L
Pro
po
rtio
n o
f To
tal A
B U
sage
DD
D/1
00
0 B
ed
Day
s
Co
-am
oxi
clav
Pip
Tazo
0%
10%
20%
30%
40%
50%
60%
70%
80%
90%
100%
M C E F N P J D B G T R A K H L
19
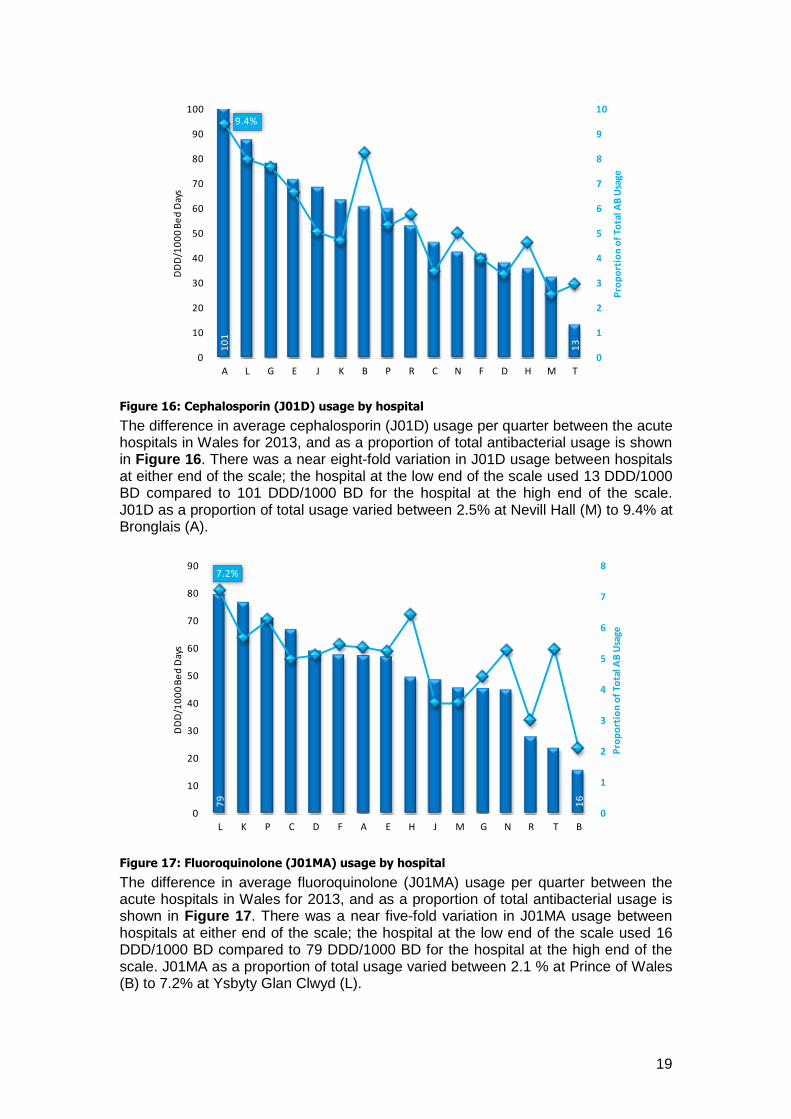
Figure 16: Cephalosporin (J01D) usage by hospital
The difference in average cephalosporin (J01D) usage per quarter between the acute hospitals in Wales for 2013, and as a proportion of total antibacterial usage is shown in Figure 16. There was a near eight-fold variation in J01D usage between hospitals at either end of the scale; the hospital at the low end of the scale used 13 DDD/1000 BD compared to 101 DDD/1000 BD for the hospital at the high end of the scale. J01D as a proportion of total usage varied between 2.5% at Nevill Hall (M) to 9.4% at Bronglais (A).
Figure 17: Fluoroquinolone (J01MA) usage by hospital
The difference in average fluoroquinolone (J01MA) usage per quarter between the acute hospitals in Wales for 2013, and as a proportion of total antibacterial usage is shown in Figure 17. There was a near five-fold variation in J01MA usage between hospitals at either end of the scale; the hospital at the low end of the scale used 16 DDD/1000 BD compared to 79 DDD/1000 BD for the hospital at the high end of the scale. J01MA as a proportion of total usage varied between 2.1 % at Prince of Wales (B) to 7.2% at Ysbyty Glan Clwyd (L).
10
1
13
9.4%
0
1
2
3
4
5
6
7
8
9
10
0
10
20
30
40
50
60
70
80
90
100
A L G E J K B P R C N F D H M T
Pro
po
rtio
n o
f To
tal A
B U
sage
DD
D/1
00
0 B
ed
Day
s
79
16
7.2%
0
1
2
3
4
5
6
7
8
0
10
20
30
40
50
60
70
80
90
L K P C D F A E H J M G N R T B
Pro
po
rtio
n o
f To
tal A
B U
sage
DD
D/1
00
0 B
ed
Day
s
20
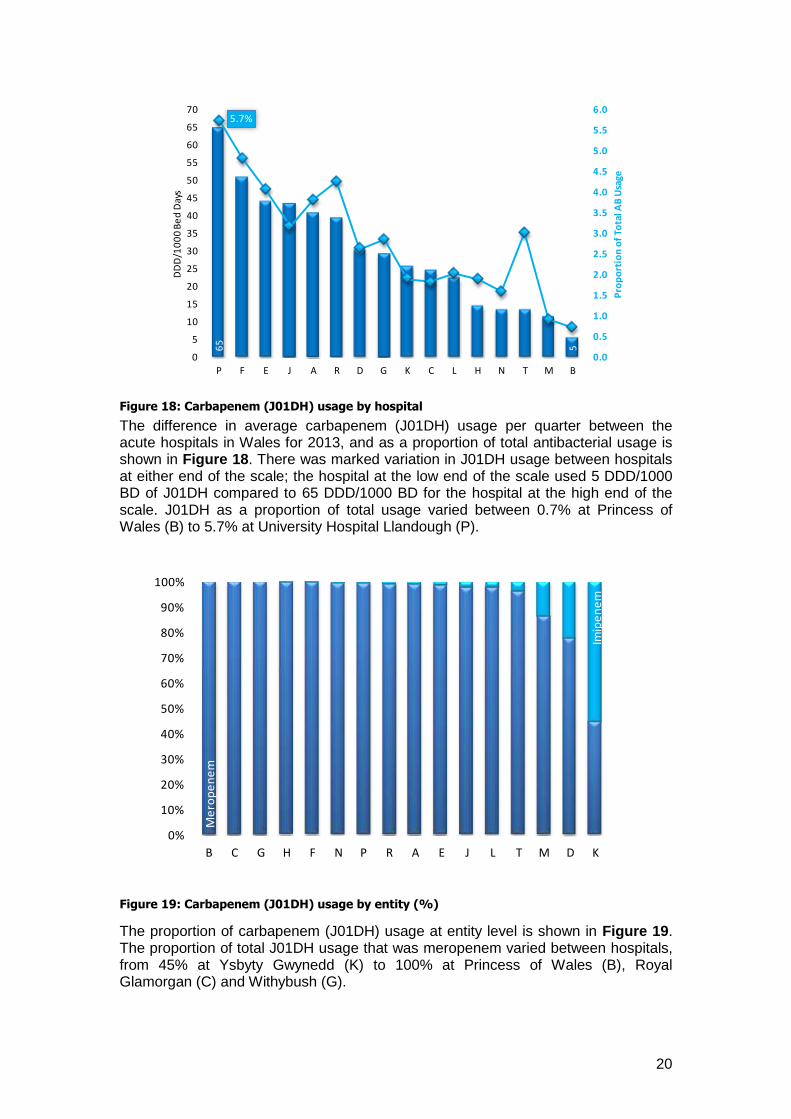
Figure 18: Carbapenem (J01DH) usage by hospital
The difference in average carbapenem (J01DH) usage per quarter between the acute hospitals in Wales for 2013, and as a proportion of total antibacterial usage is shown in Figure 18. There was marked variation in J01DH usage between hospitals at either end of the scale; the hospital at the low end of the scale used 5 DDD/1000 BD of J01DH compared to 65 DDD/1000 BD for the hospital at the high end of the scale. J01DH as a proportion of total usage varied between 0.7% at Princess of Wales (B) to 5.7% at University Hospital Llandough (P).
Figure 19: Carbapenem (J01DH) usage by entity (%)
The proportion of carbapenem (J01DH) usage at entity level is shown in Figure 19. The proportion of total J01DH usage that was meropenem varied between hospitals, from 45% at Ysbyty Gwynedd (K) to 100% at Princess of Wales (B), Royal Glamorgan (C) and Withybush (G).
65
5
5.7%
0.0
0.5
1.0
1.5
2.0
2.5
3.0
3.5
4.0
4.5
5.0
5.5
6.0
0
5
10
15
20
25
30
35
40
45
50
55
60
65
70
P F E J A R D G K C L H N T M B
Pro
po
rtio
n o
f To
tal A
B U
sage
DD
D/1
00
0 B
ed
Day
s
Me
rop
en
em
Imip
en
em
0%
10%
20%
30%
40%
50%
60%
70%
80%
90%
100%
B C G H F N P R A E J L T M D K
21
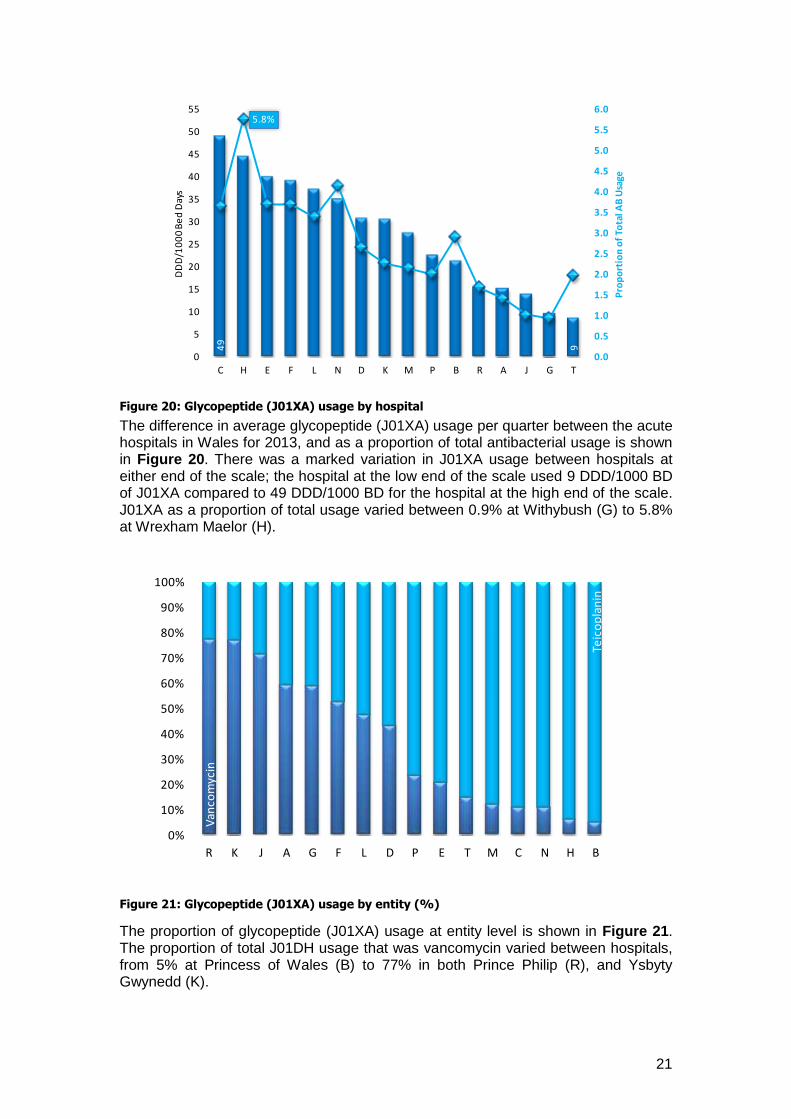
Figure 20: Glycopeptide (J01XA) usage by hospital
The difference in average glycopeptide (J01XA) usage per quarter between the acute hospitals in Wales for 2013, and as a proportion of total antibacterial usage is shown in Figure 20. There was a marked variation in J01XA usage between hospitals at either end of the scale; the hospital at the low end of the scale used 9 DDD/1000 BD of J01XA compared to 49 DDD/1000 BD for the hospital at the high end of the scale. J01XA as a proportion of total usage varied between 0.9% at Withybush (G) to 5.8% at Wrexham Maelor (H).
Figure 21: Glycopeptide (J01XA) usage by entity (%)
The proportion of glycopeptide (J01XA) usage at entity level is shown in Figure 21. The proportion of total J01DH usage that was vancomycin varied between hospitals, from 5% at Princess of Wales (B) to 77% in both Prince Philip (R), and Ysbyty Gwynedd (K).
49
9
5.8%
0.0
0.5
1.0
1.5
2.0
2.5
3.0
3.5
4.0
4.5
5.0
5.5
6.0
0
5
10
15
20
25
30
35
40
45
50
55
C H E F L N D K M P B R A J G T
Pro
po
rtio
n o
f To
tal A
B U
sage
DD
D/1
00
0 B
ed
Day
s
Van
com
ycin
Teic
op
lan
in
0%
10%
20%
30%
40%
50%
60%
70%
80%
90%
100%
R K J A G F L D P E T M C N H B
22
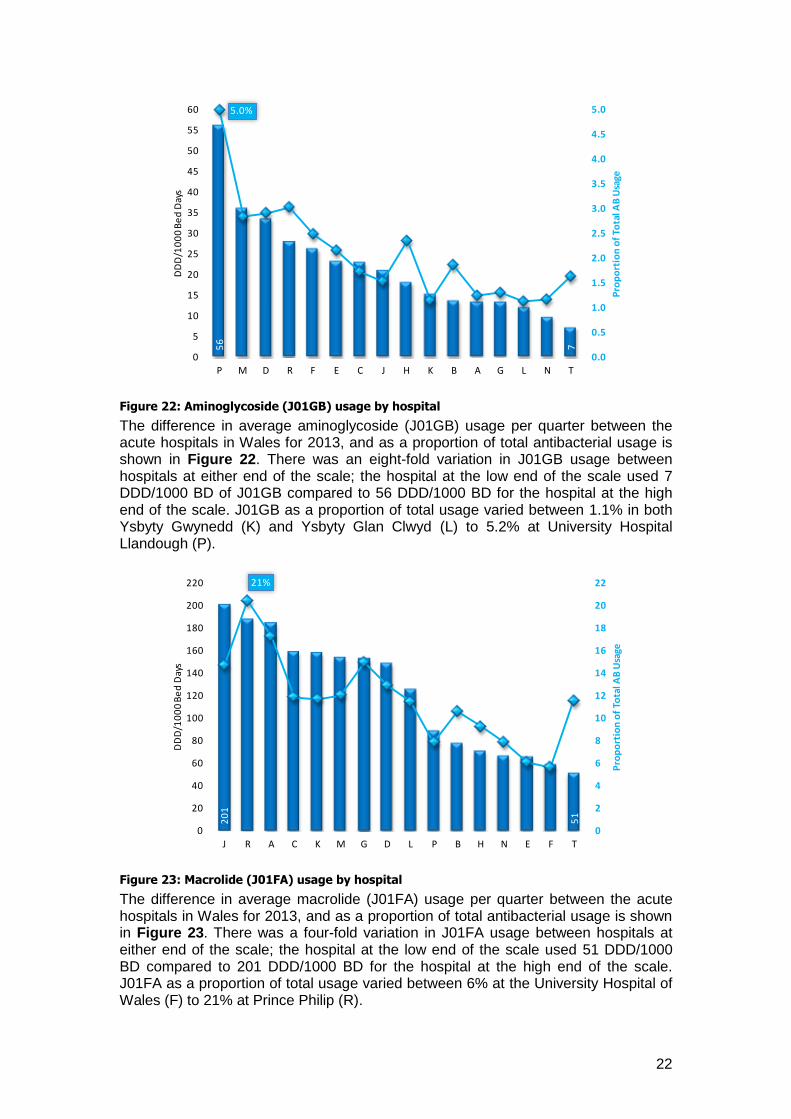
Figure 22: Aminoglycoside (J01GB) usage by hospital
The difference in average aminoglycoside (J01GB) usage per quarter between the acute hospitals in Wales for 2013, and as a proportion of total antibacterial usage is shown in Figure 22. There was an eight-fold variation in J01GB usage between hospitals at either end of the scale; the hospital at the low end of the scale used 7 DDD/1000 BD of J01GB compared to 56 DDD/1000 BD for the hospital at the high end of the scale. J01GB as a proportion of total usage varied between 1.1% in both Ysbyty Gwynedd (K) and Ysbyty Glan Clwyd (L) to 5.2% at University Hospital Llandough (P).
Figure 23: Macrolide (J01FA) usage by hospital
The difference in average macrolide (J01FA) usage per quarter between the acute hospitals in Wales for 2013, and as a proportion of total antibacterial usage is shown in Figure 23. There was a four-fold variation in J01FA usage between hospitals at either end of the scale; the hospital at the low end of the scale used 51 DDD/1000 BD compared to 201 DDD/1000 BD for the hospital at the high end of the scale. J01FA as a proportion of total usage varied between 6% at the University Hospital of Wales (F) to 21% at Prince Philip (R).
56
7
5.0%
0.0
0.5
1.0
1.5
2.0
2.5
3.0
3.5
4.0
4.5
5.0
0
5
10
15
20
25
30
35
40
45
50
55
60
P M D R F E C J H K B A G L N T
Pro
po
rtio
n o
f To
tal A
B U
sage
DD
D/1
00
0 B
ed
Day
s
20
1
51
21%
0
2
4
6
8
10
12
14
16
18
20
22
0
20
40
60
80
100
120
140
160
180
200
220
J R A C K M G D L P B H N E F T
Pro
po
rtio
n o
f To
tal A
B U
sage
DD
D/1
00
0 B
ed
Day
s
23
Section 4.2: Individual Hospital Usage
Morriston Hospital (Abertawe Bro Morgannwg University Health Board)
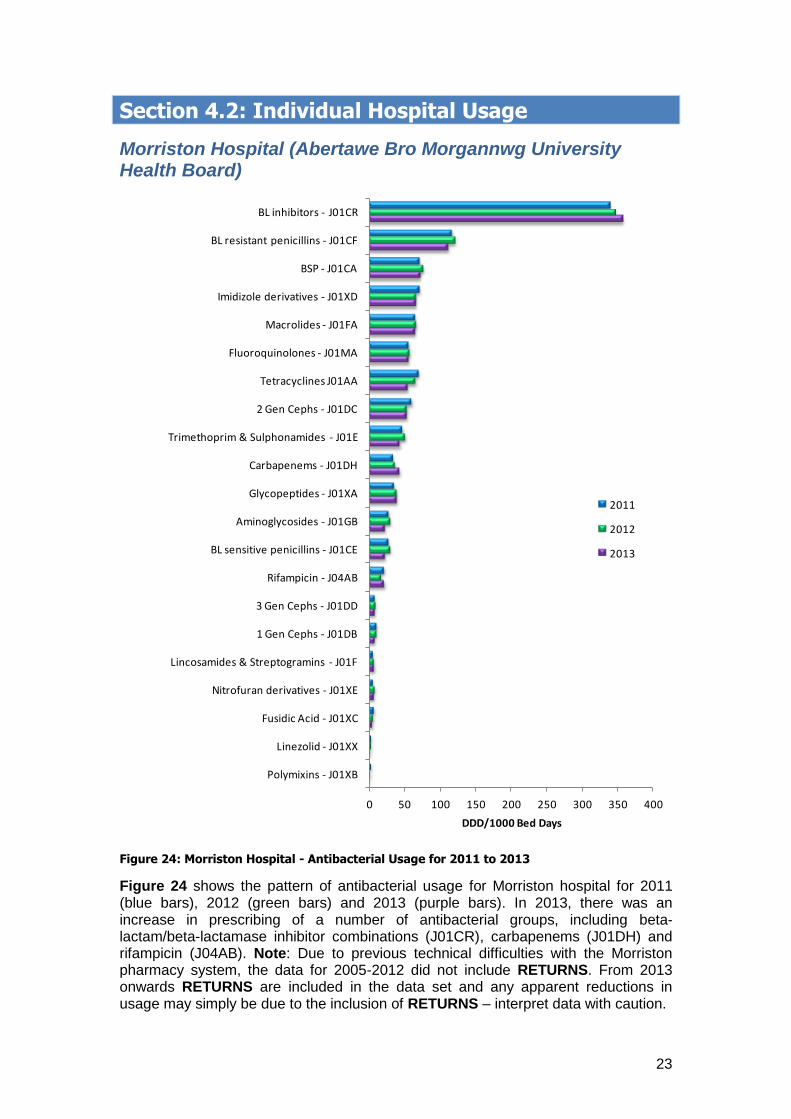
Figure 24: Morriston Hospital - Antibacterial Usage for 2011 to 2013
Figure 24 shows the pattern of antibacterial usage for Morriston hospital for 2011 (blue bars), 2012 (green bars) and 2013 (purple bars). In 2013, there was an increase in prescribing of a number of antibacterial groups, including beta-lactam/beta-lactamase inhibitor combinations (J01CR), carbapenems (J01DH) and rifampicin (J04AB). Note: Due to previous technical difficulties with the Morriston pharmacy system, the data for 2005-2012 did not include RETURNS. From 2013 onwards RETURNS are included in the data set and any apparent reductions in usage may simply be due to the inclusion of RETURNS – interpret data with caution.
0 50 100 150 200 250 300 350 400
Polymixins - J01XB
Linezolid - J01XX
Fusidic Acid - J01XC
Nitrofuran derivatives - J01XE
Lincosamides & Streptogramins - J01F
1 Gen Cephs - J01DB
3 Gen Cephs - J01DD
Rifampicin - J04AB
BL sensitive penicillins - J01CE
Aminoglycosides - J01GB
Glycopeptides - J01XA
Carbapenems - J01DH
Trimethoprim & Sulphonamides - J01E
2 Gen Cephs - J01DC
Tetracyclines J01AA
Fluoroquinolones - J01MA
Macrolides - J01FA
Imidizole derivatives - J01XD
BSP - J01CA
BL resistant penicillins - J01CF
BL inhibitors - J01CR
DDD/1000 Bed Days
2011
2012
2013
24
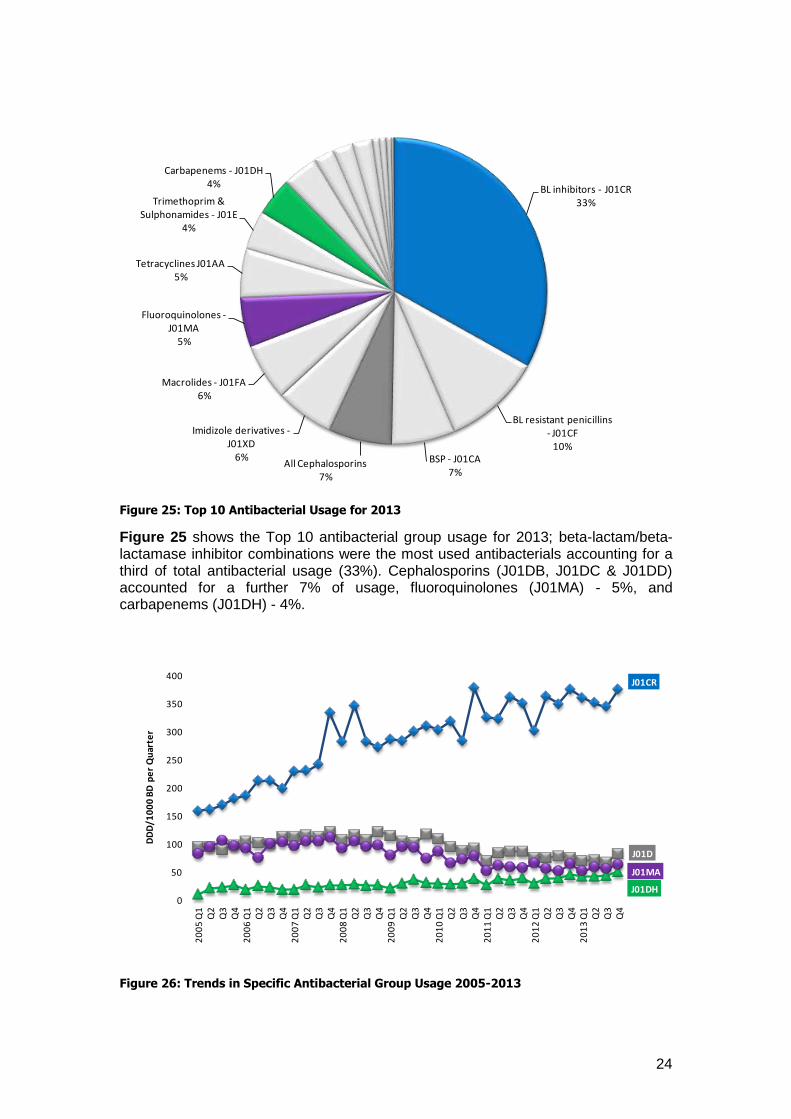
Figure 25: Top 10 Antibacterial Usage for 2013
Figure 25 shows the Top 10 antibacterial group usage for 2013; beta-lactam/beta-lactamase inhibitor combinations were the most used antibacterials accounting for a third of total antibacterial usage (33%). Cephalosporins (J01DB, J01DC & J01DD) accounted for a further 7% of usage, fluoroquinolones (J01MA) - 5%, and carbapenems (J01DH) - 4%.
Figure 26: Trends in Specific Antibacterial Group Usage 2005-2013
BL inhibitors - J01CR33%
BL resistant penicillins - J01CF
10%BSP - J01CA
7%All Cephalosporins
7%
Imidizole derivatives -J01XD
6%
Macrolides - J01FA6%
Fluoroquinolones -J01MA
5%
Tetracyclines J01AA5%
Trimethoprim & Sulphonamides - J01E
4%
Carbapenems - J01DH4%
J01CR
J01D
J01DH
J01MA
0
50
100
150
200
250
300
350
400
20
05
Q1
Q2
Q3
Q4
20
06
Q1
Q2
Q3
Q4
20
07
Q1
Q2
Q3
Q4
20
08
Q1
Q2
Q3
Q4
20
09
Q1
Q2
Q3
Q4
20
10
Q1
Q2
Q3
Q4
20
11
Q1
Q2
Q3
Q4
20
12
Q1
Q2
Q3
Q4
20
13
Q1
Q2
Q3
Q4
DD
D/1
00
0 B
D p
er
Qu
arte
r
25
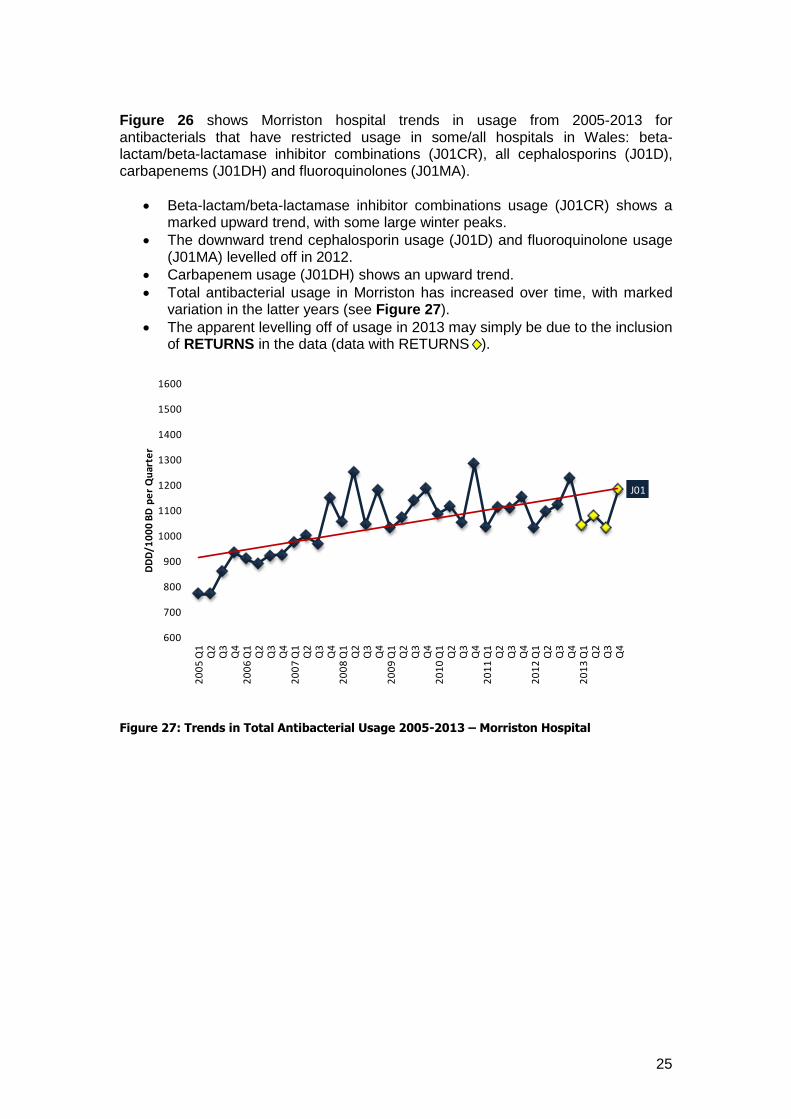
Figure 26 shows Morriston hospital trends in usage from 2005-2013 for antibacterials that have restricted usage in some/all hospitals in Wales: beta-lactam/beta-lactamase inhibitor combinations (J01CR), all cephalosporins (J01D), carbapenems (J01DH) and fluoroquinolones (J01MA).
Beta-lactam/beta-lactamase inhibitor combinations usage (J01CR) shows a marked upward trend, with some large winter peaks.
The downward trend cephalosporin usage (J01D) and fluoroquinolone usage (J01MA) levelled off in 2012.
Carbapenem usage (J01DH) shows an upward trend.
Total antibacterial usage in Morriston has increased over time, with marked variation in the latter years (see Figure 27).
The apparent levelling off of usage in 2013 may simply be due to the inclusion of RETURNS in the data (data with RETURNS ).
Figure 27: Trends in Total Antibacterial Usage 2005-2013 – Morriston Hospital
J01
600
700
800
900
1000
1100
1200
1300
1400
1500
1600
20
05
Q1
Q2
Q3
Q4
20
06
Q1
Q2
Q3
Q4
20
07
Q1
Q2
Q3
Q4
20
08
Q1
Q2
Q3
Q4
20
09
Q1
Q2
Q3
Q4
20
10
Q1
Q2
Q3
Q4
20
11
Q1
Q2
Q3
Q4
20
12
Q1
Q2
Q3
Q4
20
13
Q1
Q2
Q3
Q4
DD
D/1
00
0 B
D p
er
Qu
arte
r
26
Neath Port Talbot Hospital (ABMU Health Board)
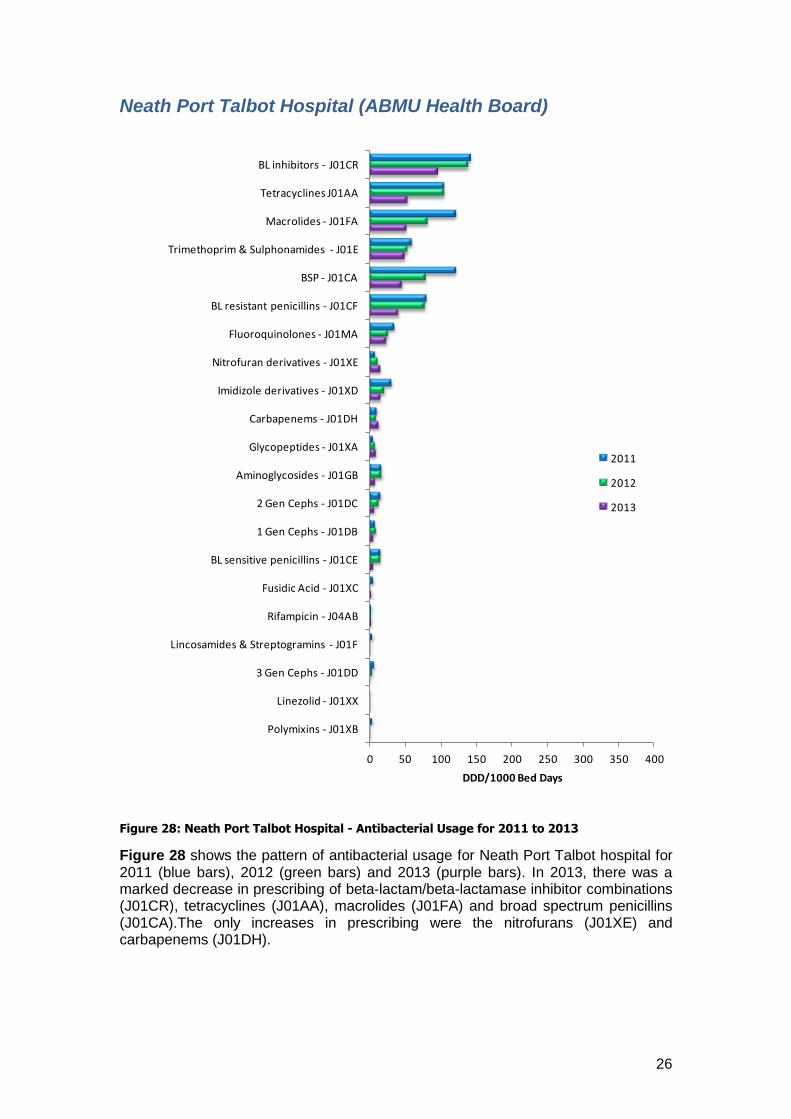
Figure 28: Neath Port Talbot Hospital - Antibacterial Usage for 2011 to 2013
Figure 28 shows the pattern of antibacterial usage for Neath Port Talbot hospital for 2011 (blue bars), 2012 (green bars) and 2013 (purple bars). In 2013, there was a marked decrease in prescribing of beta-lactam/beta-lactamase inhibitor combinations (J01CR), tetracyclines (J01AA), macrolides (J01FA) and broad spectrum penicillins (J01CA).The only increases in prescribing were the nitrofurans (J01XE) and carbapenems (J01DH).
0 50 100 150 200 250 300 350 400
Polymixins - J01XB
Linezolid - J01XX
3 Gen Cephs - J01DD
Lincosamides & Streptogramins - J01F
Rifampicin - J04AB
Fusidic Acid - J01XC
BL sensitive penicillins - J01CE
1 Gen Cephs - J01DB
2 Gen Cephs - J01DC
Aminoglycosides - J01GB
Glycopeptides - J01XA
Carbapenems - J01DH
Imidizole derivatives - J01XD
Nitrofuran derivatives - J01XE
Fluoroquinolones - J01MA
BL resistant penicillins - J01CF
BSP - J01CA
Trimethoprim & Sulphonamides - J01E
Macrolides - J01FA
Tetracyclines J01AA
BL inhibitors - J01CR
DDD/1000 Bed Days
2011
2012
2013
27
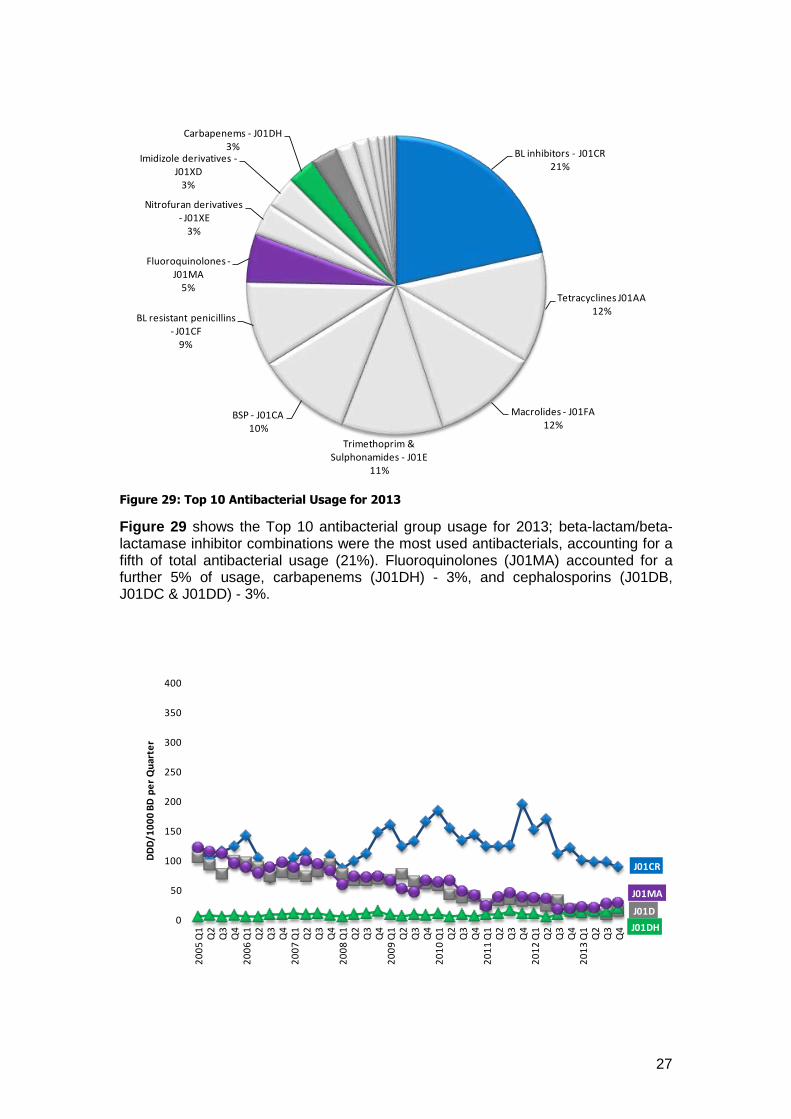
Figure 29: Top 10 Antibacterial Usage for 2013
Figure 29 shows the Top 10 antibacterial group usage for 2013; beta-lactam/beta-lactamase inhibitor combinations were the most used antibacterials, accounting for a fifth of total antibacterial usage (21%). Fluoroquinolones (J01MA) accounted for a further 5% of usage, carbapenems (J01DH) - 3%, and cephalosporins (J01DB, J01DC & J01DD) - 3%.
BL inhibitors - J01CR21%
Tetracyclines J01AA12%
Macrolides - J01FA12%
Trimethoprim & Sulphonamides - J01E
11%
BSP - J01CA10%
BL resistant penicillins - J01CF
9%
Fluoroquinolones -J01MA
5%
Nitrofuran derivatives - J01XE
3%
Imidizole derivatives -J01XD
3%
Carbapenems - J01DH3%
J01CR
J01D
J01DH
J01MA
0
50
100
150
200
250
300
350
400
20
05
Q1
Q2
Q3
Q4
20
06
Q1
Q2
Q3
Q4
20
07
Q1
Q2
Q3
Q4
20
08
Q1
Q2
Q3
Q4
20
09
Q1
Q2
Q3
Q4
20
10
Q1
Q2
Q3
Q4
20
11
Q1
Q2
Q3
Q4
20
12
Q1
Q2
Q3
Q4
20
13
Q1
Q2
Q3
Q4
DD
D/1
00
0 B
D p
er
Qu
arte
r
28
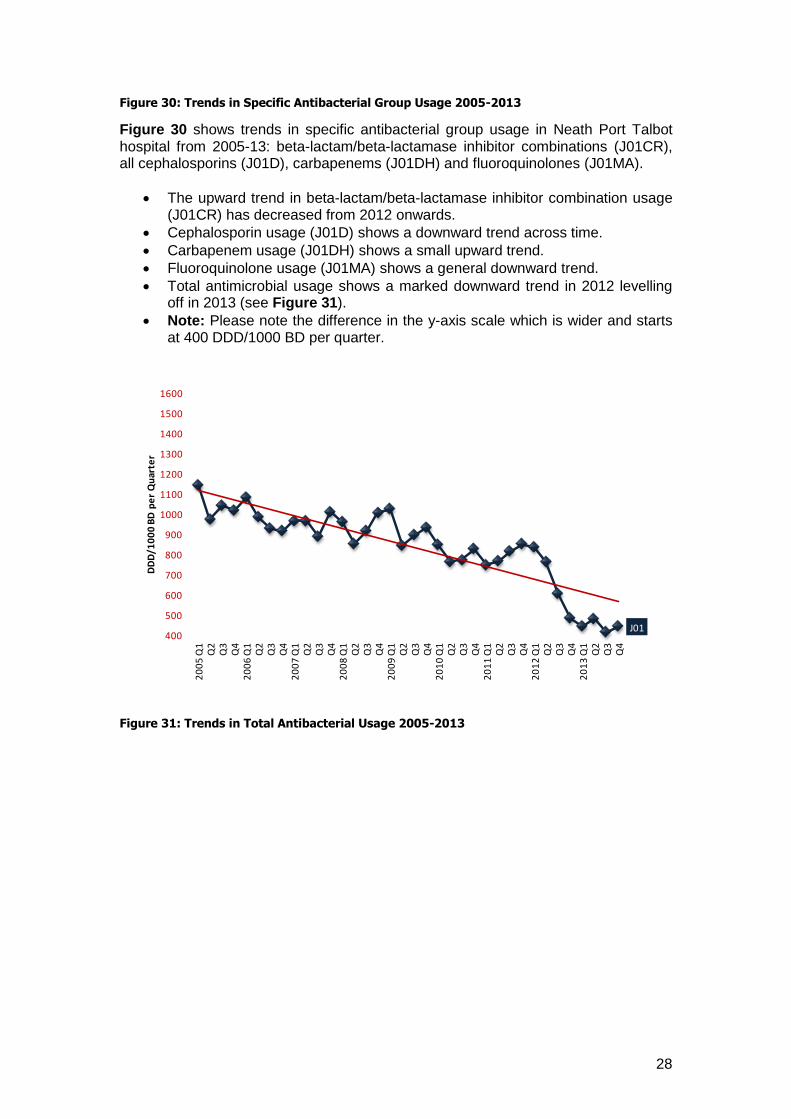
Figure 30: Trends in Specific Antibacterial Group Usage 2005-2013
Figure 30 shows trends in specific antibacterial group usage in Neath Port Talbot hospital from 2005-13: beta-lactam/beta-lactamase inhibitor combinations (J01CR), all cephalosporins (J01D), carbapenems (J01DH) and fluoroquinolones (J01MA).
The upward trend in beta-lactam/beta-lactamase inhibitor combination usage (J01CR) has decreased from 2012 onwards.
Cephalosporin usage (J01D) shows a downward trend across time.
Carbapenem usage (J01DH) shows a small upward trend.
Fluoroquinolone usage (J01MA) shows a general downward trend.
Total antimicrobial usage shows a marked downward trend in 2012 levelling off in 2013 (see Figure 31).
Note: Please note the difference in the y-axis scale which is wider and starts at 400 DDD/1000 BD per quarter.
Figure 31: Trends in Total Antibacterial Usage 2005-2013
J01400
500
600
700
800
900
1000
1100
1200
1300
1400
1500
1600
20
05
Q1
Q2
Q3
Q4
20
06
Q1
Q2
Q3
Q4
20
07
Q1
Q2
Q3
Q4
20
08
Q1
Q2
Q3
Q4
20
09
Q1
Q2
Q3
Q4
20
10
Q1
Q2
Q3
Q4
20
11
Q1
Q2
Q3
Q4
20
12
Q1
Q2
Q3
Q4
20
13
Q1
Q2
Q3
Q4
DD
D/1
00
0 B
D p
er
Qu
arte
r
29
Princess of Wales Hospital (ABMU Health Board)
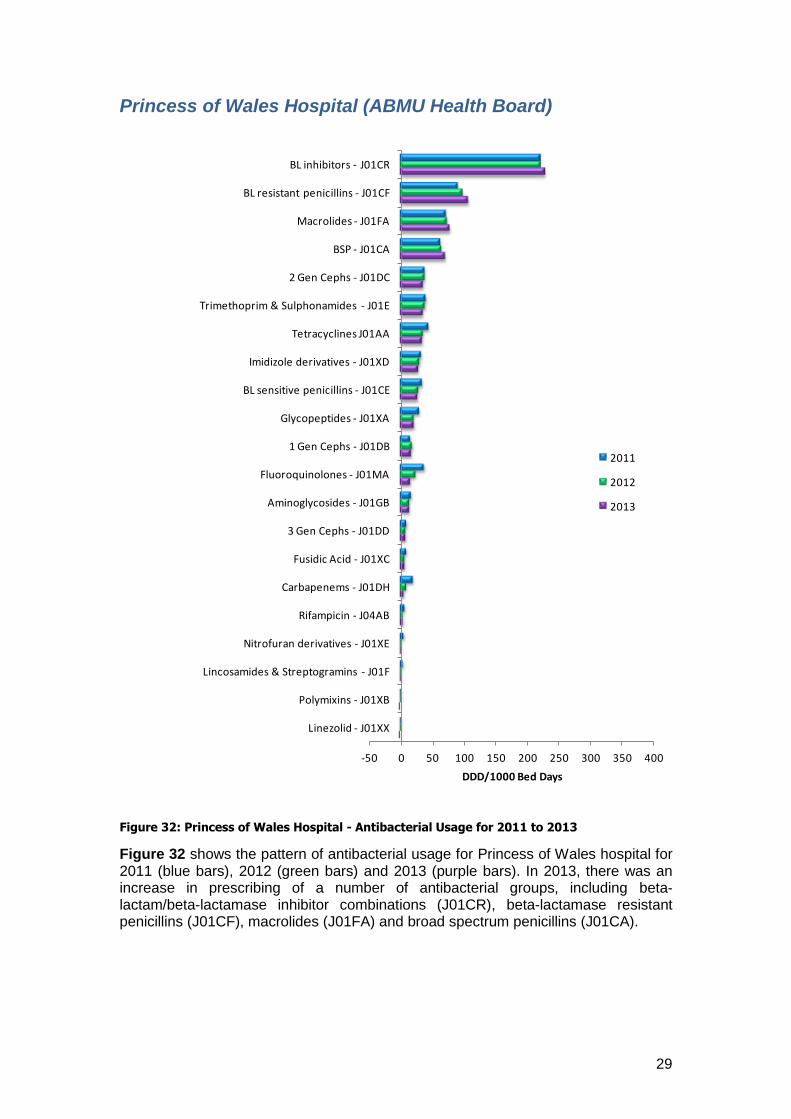
Figure 32: Princess of Wales Hospital - Antibacterial Usage for 2011 to 2013
Figure 32 shows the pattern of antibacterial usage for Princess of Wales hospital for 2011 (blue bars), 2012 (green bars) and 2013 (purple bars). In 2013, there was an increase in prescribing of a number of antibacterial groups, including beta-lactam/beta-lactamase inhibitor combinations (J01CR), beta-lactamase resistant penicillins (J01CF), macrolides (J01FA) and broad spectrum penicillins (J01CA).
-50 0 50 100 150 200 250 300 350 400
Linezolid - J01XX
Polymixins - J01XB
Lincosamides & Streptogramins - J01F
Nitrofuran derivatives - J01XE
Rifampicin - J04AB
Carbapenems - J01DH
Fusidic Acid - J01XC
3 Gen Cephs - J01DD
Aminoglycosides - J01GB
Fluoroquinolones - J01MA
1 Gen Cephs - J01DB
Glycopeptides - J01XA
BL sensitive penicillins - J01CE
Imidizole derivatives - J01XD
Tetracyclines J01AA
Trimethoprim & Sulphonamides - J01E
2 Gen Cephs - J01DC
BSP - J01CA
Macrolides - J01FA
BL resistant penicillins - J01CF
BL inhibitors - J01CR
DDD/1000 Bed Days
2011
2012
2013
30
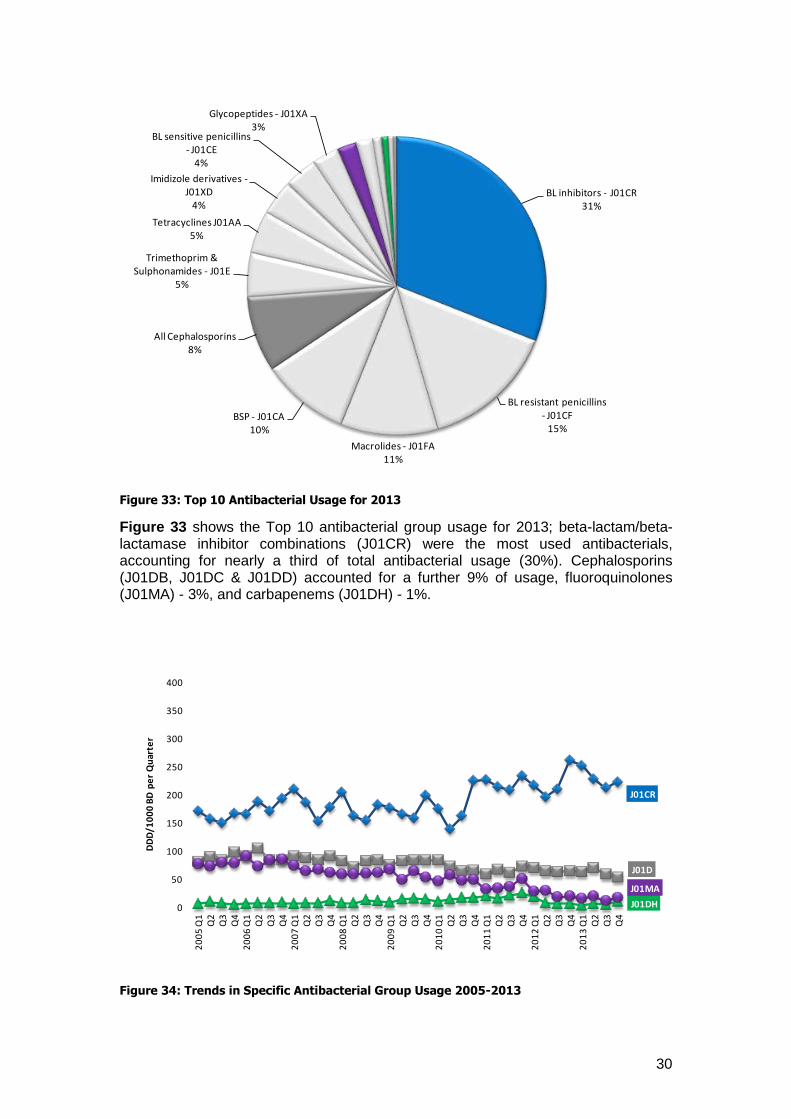
Figure 33: Top 10 Antibacterial Usage for 2013
Figure 33 shows the Top 10 antibacterial group usage for 2013; beta-lactam/beta-lactamase inhibitor combinations (J01CR) were the most used antibacterials, accounting for nearly a third of total antibacterial usage (30%). Cephalosporins (J01DB, J01DC & J01DD) accounted for a further 9% of usage, fluoroquinolones (J01MA) - 3%, and carbapenems (J01DH) - 1%.
Figure 34: Trends in Specific Antibacterial Group Usage 2005-2013
BL inhibitors - J01CR31%
BL resistant penicillins - J01CF
15%
Macrolides - J01FA11%
BSP - J01CA10%
All Cephalosporins8%
Trimethoprim & Sulphonamides - J01E
5%
Tetracyclines J01AA5%
Imidizole derivatives -J01XD
4%
BL sensitive penicillins - J01CE
4%
Glycopeptides - J01XA3%
J01CR
J01D
J01DH
J01MA
0
50
100
150
200
250
300
350
400
20
05
Q1
Q2
Q3
Q4
20
06
Q1
Q2
Q3
Q4
20
07
Q1
Q2
Q3
Q4
20
08
Q1
Q2
Q3
Q4
20
09
Q1
Q2
Q3
Q4
20
10
Q1
Q2
Q3
Q4
20
11
Q1
Q2
Q3
Q4
20
12
Q1
Q2
Q3
Q4
20
13
Q1
Q2
Q3
Q4
DD
D/1
00
0 B
D p
er
Qu
arte
r
31
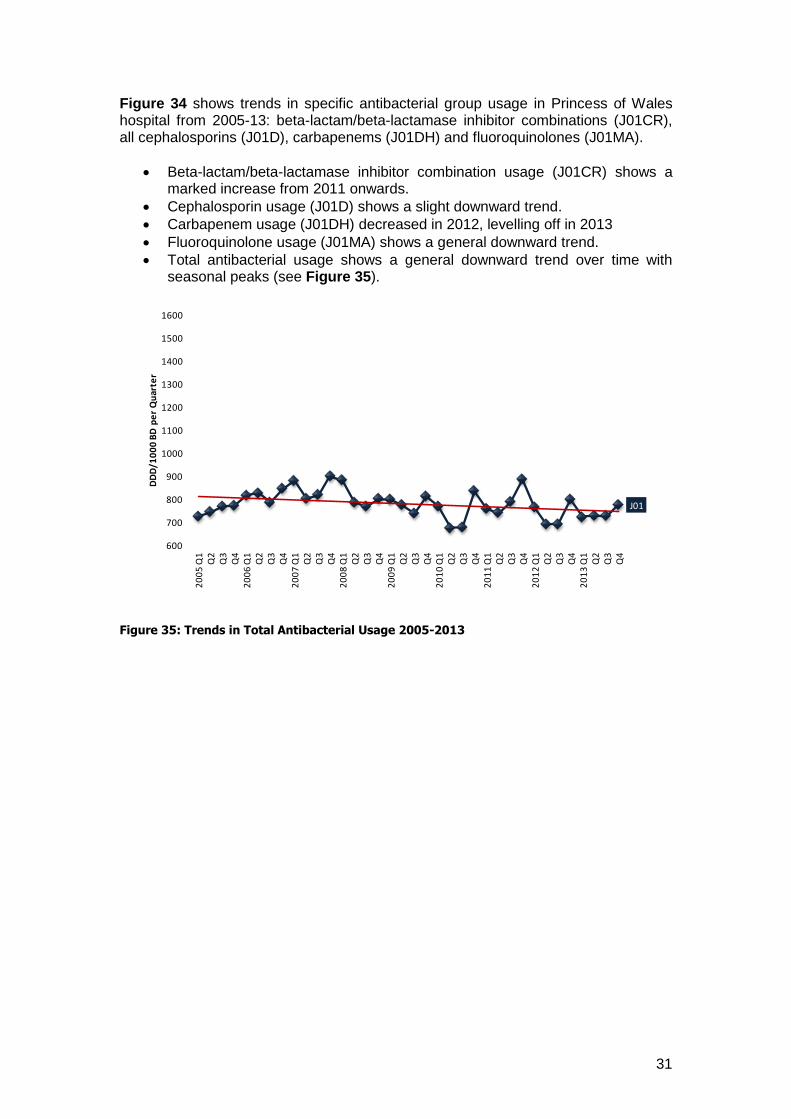
Figure 34 shows trends in specific antibacterial group usage in Princess of Wales hospital from 2005-13: beta-lactam/beta-lactamase inhibitor combinations (J01CR), all cephalosporins (J01D), carbapenems (J01DH) and fluoroquinolones (J01MA).
Beta-lactam/beta-lactamase inhibitor combination usage (J01CR) shows a marked increase from 2011 onwards.
Cephalosporin usage (J01D) shows a slight downward trend.
Carbapenem usage (J01DH) decreased in 2012, levelling off in 2013
Fluoroquinolone usage (J01MA) shows a general downward trend.
Total antibacterial usage shows a general downward trend over time with seasonal peaks (see Figure 35).
Figure 35: Trends in Total Antibacterial Usage 2005-2013
J01
600
700
800
900
1000
1100
1200
1300
1400
1500
1600
20
05
Q1
Q2
Q3
Q4
20
06
Q1
Q2
Q3
Q4
20
07
Q1
Q2
Q3
Q4
20
08
Q1
Q2
Q3
Q4
20
09
Q1
Q2
Q3
Q4
20
10
Q1
Q2
Q3
Q4
20
11
Q1
Q2
Q3
Q4
20
12
Q1
Q2
Q3
Q4
20
13
Q1
Q2
Q3
Q4
DD
D/1
00
0 B
D p
er
Qu
arte
r
32
Nevill Hall Hospital (Aneurin Bevan Health Board)
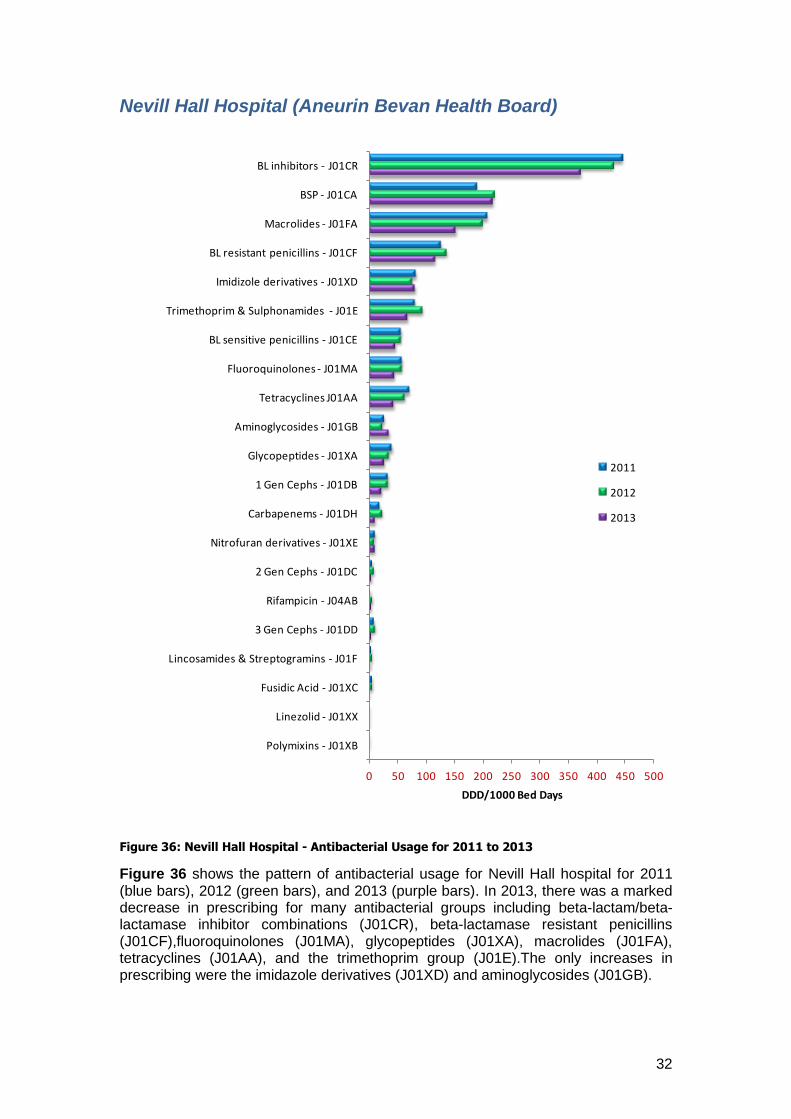
Figure 36: Nevill Hall Hospital - Antibacterial Usage for 2011 to 2013
Figure 36 shows the pattern of antibacterial usage for Nevill Hall hospital for 2011 (blue bars), 2012 (green bars), and 2013 (purple bars). In 2013, there was a marked decrease in prescribing for many antibacterial groups including beta-lactam/beta-lactamase inhibitor combinations (J01CR), beta-lactamase resistant penicillins (J01CF),fluoroquinolones (J01MA), glycopeptides (J01XA), macrolides (J01FA), tetracyclines (J01AA), and the trimethoprim group (J01E).The only increases in prescribing were the imidazole derivatives (J01XD) and aminoglycosides (J01GB).
0 50 100 150 200 250 300 350 400 450 500
Polymixins - J01XB
Linezolid - J01XX
Fusidic Acid - J01XC
Lincosamides & Streptogramins - J01F
3 Gen Cephs - J01DD
Rifampicin - J04AB
2 Gen Cephs - J01DC
Nitrofuran derivatives - J01XE
Carbapenems - J01DH
1 Gen Cephs - J01DB
Glycopeptides - J01XA
Aminoglycosides - J01GB
Tetracyclines J01AA
Fluoroquinolones - J01MA
BL sensitive penicillins - J01CE
Trimethoprim & Sulphonamides - J01E
Imidizole derivatives - J01XD
BL resistant penicillins - J01CF
Macrolides - J01FA
BSP - J01CA
BL inhibitors - J01CR
DDD/1000 Bed Days
2011
2012
2013
33
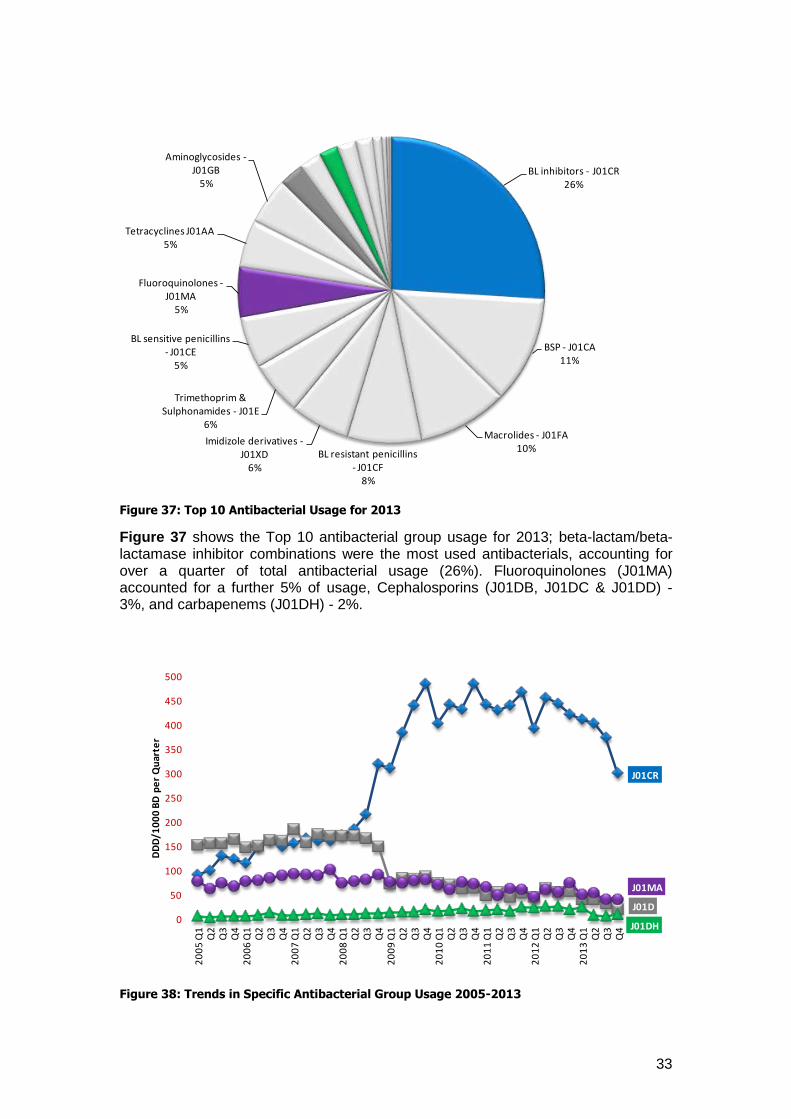
Figure 37: Top 10 Antibacterial Usage for 2013
Figure 37 shows the Top 10 antibacterial group usage for 2013; beta-lactam/beta-lactamase inhibitor combinations were the most used antibacterials, accounting for over a quarter of total antibacterial usage (26%). Fluoroquinolones (J01MA) accounted for a further 5% of usage, Cephalosporins (J01DB, J01DC & J01DD) - 3%, and carbapenems (J01DH) - 2%.
Figure 38: Trends in Specific Antibacterial Group Usage 2005-2013
BL inhibitors - J01CR26%
BSP - J01CA11%
Macrolides - J01FA10%
BL resistant penicillins - J01CF
8%
Imidizole derivatives -J01XD
6%
Trimethoprim & Sulphonamides - J01E
6%
BL sensitive penicillins - J01CE
5%
Fluoroquinolones -J01MA
5%
Tetracyclines J01AA5%
Aminoglycosides -J01GB
5%
J01CR
J01D
J01DH
J01MA
0
50
100
150
200
250
300
350
400
450
500
20
05
Q1
Q2
Q3
Q4
20
06
Q1
Q2
Q3
Q4
20
07
Q1
Q2
Q3
Q4
20
08
Q1
Q2
Q3
Q4
20
09
Q1
Q2
Q3
Q4
20
10
Q1
Q2
Q3
Q4
20
11
Q1
Q2
Q3
Q4
20
12
Q1
Q2
Q3
Q4
20
13
Q1
Q2
Q3
Q4
DD
D/1
00
0 B
D p
er
Qu
arte
r
34
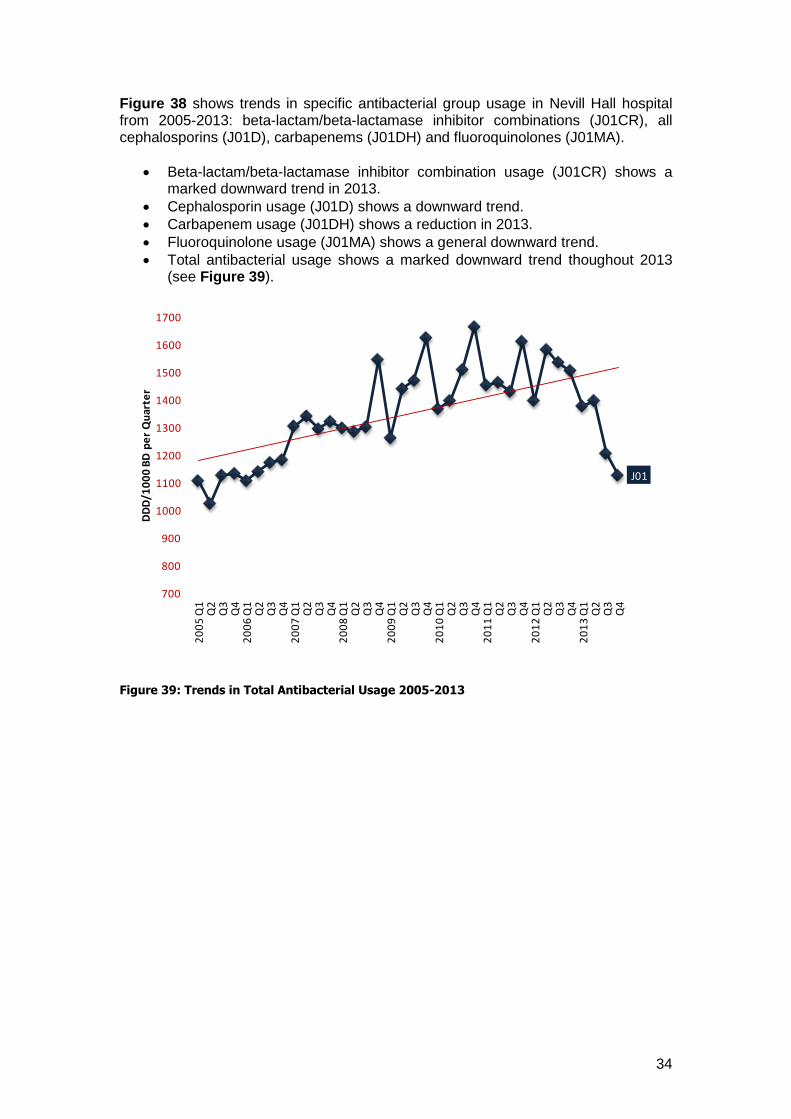
Figure 38 shows trends in specific antibacterial group usage in Nevill Hall hospital from 2005-2013: beta-lactam/beta-lactamase inhibitor combinations (J01CR), all cephalosporins (J01D), carbapenems (J01DH) and fluoroquinolones (J01MA).
Beta-lactam/beta-lactamase inhibitor combination usage (J01CR) shows a marked downward trend in 2013.
Cephalosporin usage (J01D) shows a downward trend.
Carbapenem usage (J01DH) shows a reduction in 2013.
Fluoroquinolone usage (J01MA) shows a general downward trend.
Total antibacterial usage shows a marked downward trend thoughout 2013 (see Figure 39).
Figure 39: Trends in Total Antibacterial Usage 2005-2013
J01
700
800
900
1000
1100
1200
1300
1400
1500
1600
1700
20
05
Q1
Q2
Q3
Q4
20
06
Q1
Q2
Q3
Q4
20
07
Q1
Q2
Q3
Q4
20
08
Q1
Q2
Q3
Q4
20
09
Q1
Q2
Q3
Q4
20
10
Q1
Q2
Q3
Q4
20
11
Q1
Q2
Q3
Q4
20
12
Q1
Q2
Q3
Q4
20
13
Q1
Q2
Q3
Q4
DD
D/1
00
0 B
D p
er
Qu
arte
r
35
Royal Gwent Hospital (Aneurin Bevan Health Board)
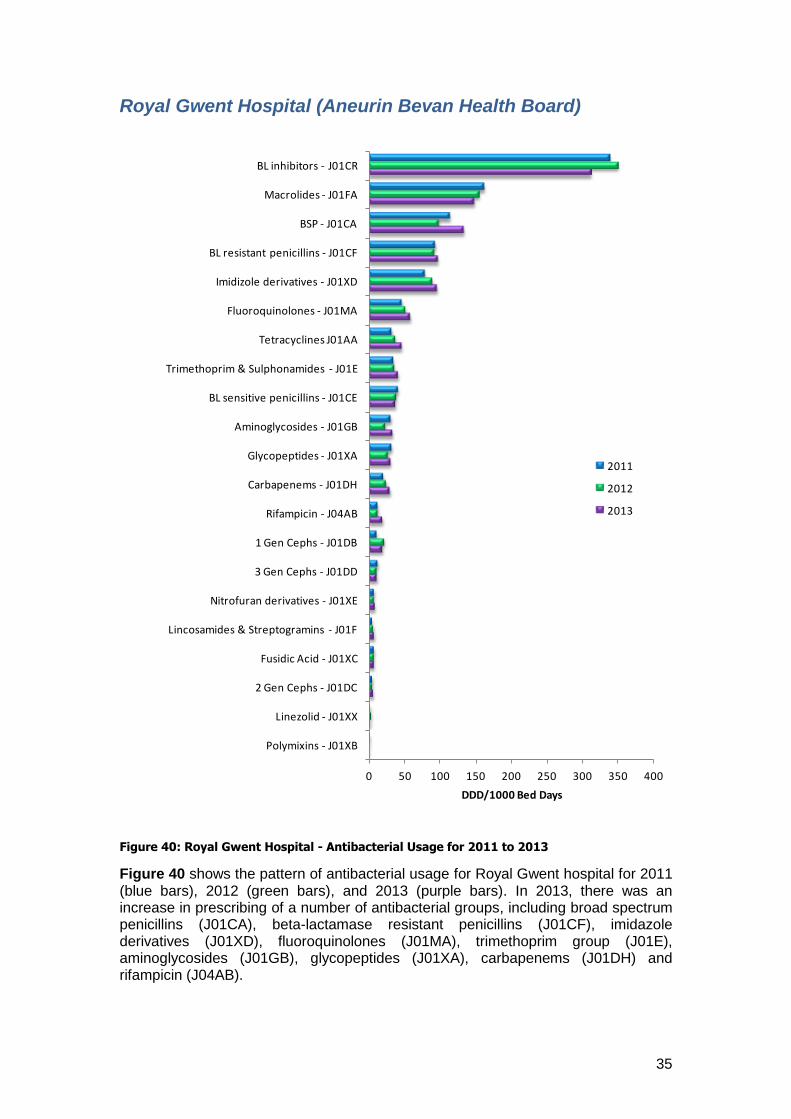
Figure 40: Royal Gwent Hospital - Antibacterial Usage for 2011 to 2013
Figure 40 shows the pattern of antibacterial usage for Royal Gwent hospital for 2011 (blue bars), 2012 (green bars), and 2013 (purple bars). In 2013, there was an increase in prescribing of a number of antibacterial groups, including broad spectrum penicillins (J01CA), beta-lactamase resistant penicillins (J01CF), imidazole derivatives (J01XD), fluoroquinolones (J01MA), trimethoprim group (J01E), aminoglycosides (J01GB), glycopeptides (J01XA), carbapenems (J01DH) and rifampicin (J04AB).
0 50 100 150 200 250 300 350 400
Polymixins - J01XB
Linezolid - J01XX
2 Gen Cephs - J01DC
Fusidic Acid - J01XC
Lincosamides & Streptogramins - J01F
Nitrofuran derivatives - J01XE
3 Gen Cephs - J01DD
1 Gen Cephs - J01DB
Rifampicin - J04AB
Carbapenems - J01DH
Glycopeptides - J01XA
Aminoglycosides - J01GB
BL sensitive penicillins - J01CE
Trimethoprim & Sulphonamides - J01E
Tetracyclines J01AA
Fluoroquinolones - J01MA
Imidizole derivatives - J01XD
BL resistant penicillins - J01CF
BSP - J01CA
Macrolides - J01FA
BL inhibitors - J01CR
DDD/1000 Bed Days
2011
2012
2013
36
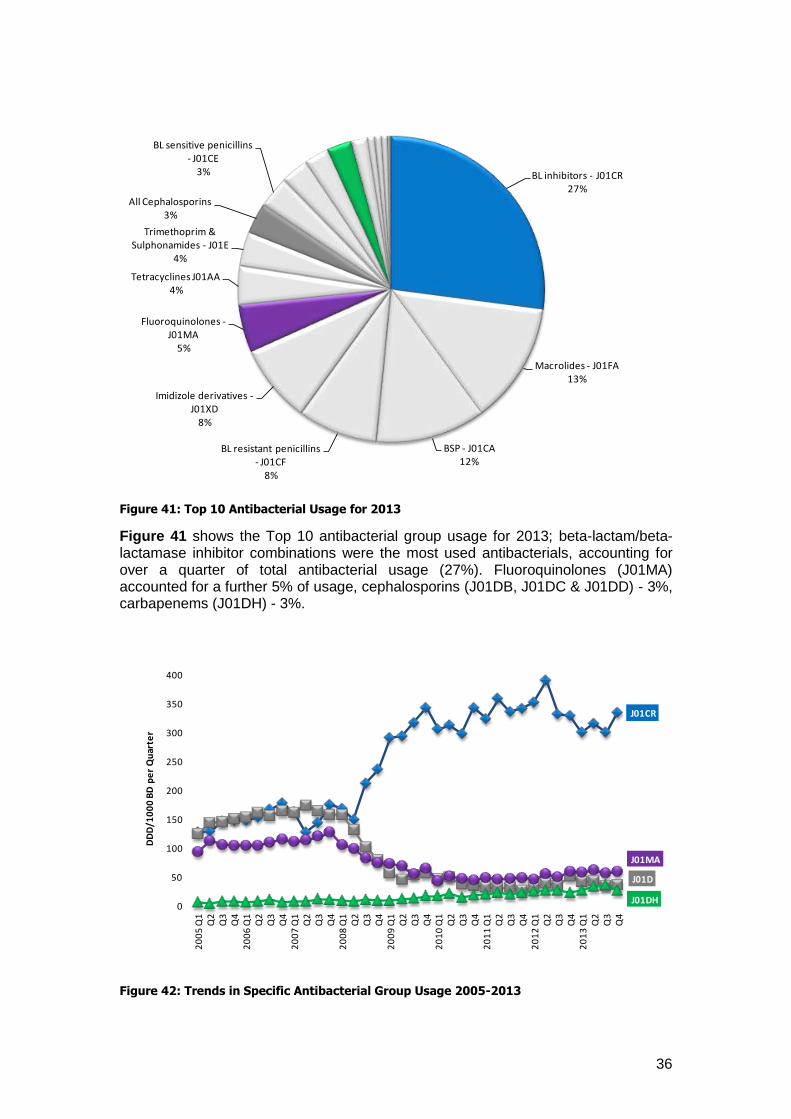
Figure 41: Top 10 Antibacterial Usage for 2013
Figure 41 shows the Top 10 antibacterial group usage for 2013; beta-lactam/beta-lactamase inhibitor combinations were the most used antibacterials, accounting for over a quarter of total antibacterial usage (27%). Fluoroquinolones (J01MA) accounted for a further 5% of usage, cephalosporins (J01DB, J01DC & J01DD) - 3%, carbapenems (J01DH) - 3%.
Figure 42: Trends in Specific Antibacterial Group Usage 2005-2013
BL inhibitors - J01CR27%
Macrolides - J01FA13%
BSP - J01CA12%
BL resistant penicillins - J01CF
8%
Imidizole derivatives -J01XD
8%
Fluoroquinolones -J01MA
5%
Tetracyclines J01AA4%
Trimethoprim & Sulphonamides - J01E
4%
All Cephalosporins3%
BL sensitive penicillins - J01CE
3%
J01CR
J01D
J01DH
J01MA
0
50
100
150
200
250
300
350
400
20
05
Q1
Q2
Q3
Q4
20
06
Q1
Q2
Q3
Q4
20
07
Q1
Q2
Q3
Q4
20
08
Q1
Q2
Q3
Q4
20
09
Q1
Q2
Q3
Q4
20
10
Q1
Q2
Q3
Q4
20
11
Q1
Q2
Q3
Q4
20
12
Q1
Q2
Q3
Q4
20
13
Q1
Q2
Q3
Q4
DD
D/1
00
0 B
D p
er
Qu
arte
r
37
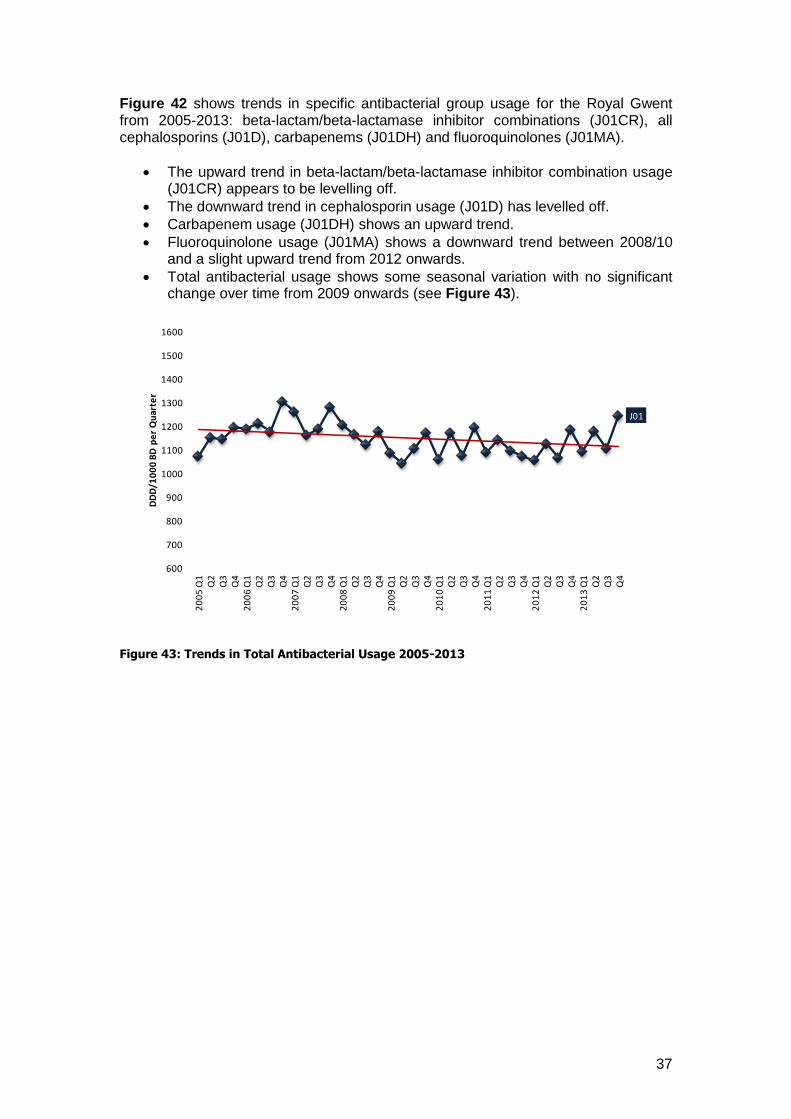
Figure 42 shows trends in specific antibacterial group usage for the Royal Gwent from 2005-2013: beta-lactam/beta-lactamase inhibitor combinations (J01CR), all cephalosporins (J01D), carbapenems (J01DH) and fluoroquinolones (J01MA).
The upward trend in beta-lactam/beta-lactamase inhibitor combination usage (J01CR) appears to be levelling off.
The downward trend in cephalosporin usage (J01D) has levelled off.
Carbapenem usage (J01DH) shows an upward trend.
Fluoroquinolone usage (J01MA) shows a downward trend between 2008/10 and a slight upward trend from 2012 onwards.
Total antibacterial usage shows some seasonal variation with no significant change over time from 2009 onwards (see Figure 43).
Figure 43: Trends in Total Antibacterial Usage 2005-2013
J01
600
700
800
900
1000
1100
1200
1300
1400
1500
1600
20
05
Q1
Q2
Q3
Q4
20
06
Q1
Q2
Q3
Q4
20
07
Q1
Q2
Q3
Q4
20
08
Q1
Q2
Q3
Q4
20
09
Q1
Q2
Q3
Q4
20
10
Q1
Q2
Q3
Q4
20
11
Q1
Q2
Q3
Q4
20
12
Q1
Q2
Q3
Q4
20
13
Q1
Q2
Q3
Q4
DD
D/1
00
0 B
D p
er
Qu
arte
r
38
Wrexham Maelor Hospital (Betsi Cadwaladr University Health Board)
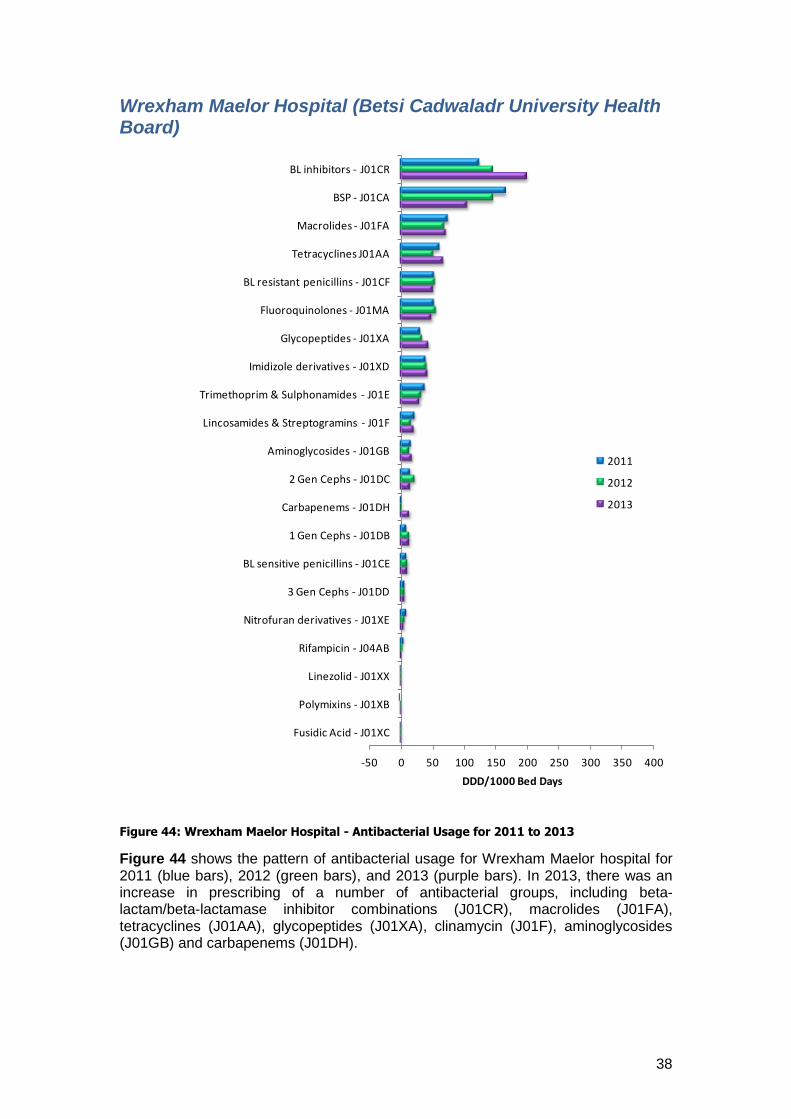
Figure 44: Wrexham Maelor Hospital - Antibacterial Usage for 2011 to 2013
Figure 44 shows the pattern of antibacterial usage for Wrexham Maelor hospital for 2011 (blue bars), 2012 (green bars), and 2013 (purple bars). In 2013, there was an increase in prescribing of a number of antibacterial groups, including beta-lactam/beta-lactamase inhibitor combinations (J01CR), macrolides (J01FA), tetracyclines (J01AA), glycopeptides (J01XA), clinamycin (J01F), aminoglycosides (J01GB) and carbapenems (J01DH).
-50 0 50 100 150 200 250 300 350 400
Fusidic Acid - J01XC
Polymixins - J01XB
Linezolid - J01XX
Rifampicin - J04AB
Nitrofuran derivatives - J01XE
3 Gen Cephs - J01DD
BL sensitive penicillins - J01CE
1 Gen Cephs - J01DB
Carbapenems - J01DH
2 Gen Cephs - J01DC
Aminoglycosides - J01GB
Lincosamides & Streptogramins - J01F
Trimethoprim & Sulphonamides - J01E
Imidizole derivatives - J01XD
Glycopeptides - J01XA
Fluoroquinolones - J01MA
BL resistant penicillins - J01CF
Tetracyclines J01AA
Macrolides - J01FA
BSP - J01CA
BL inhibitors - J01CR
DDD/1000 Bed Days
2011
2012
2013
39
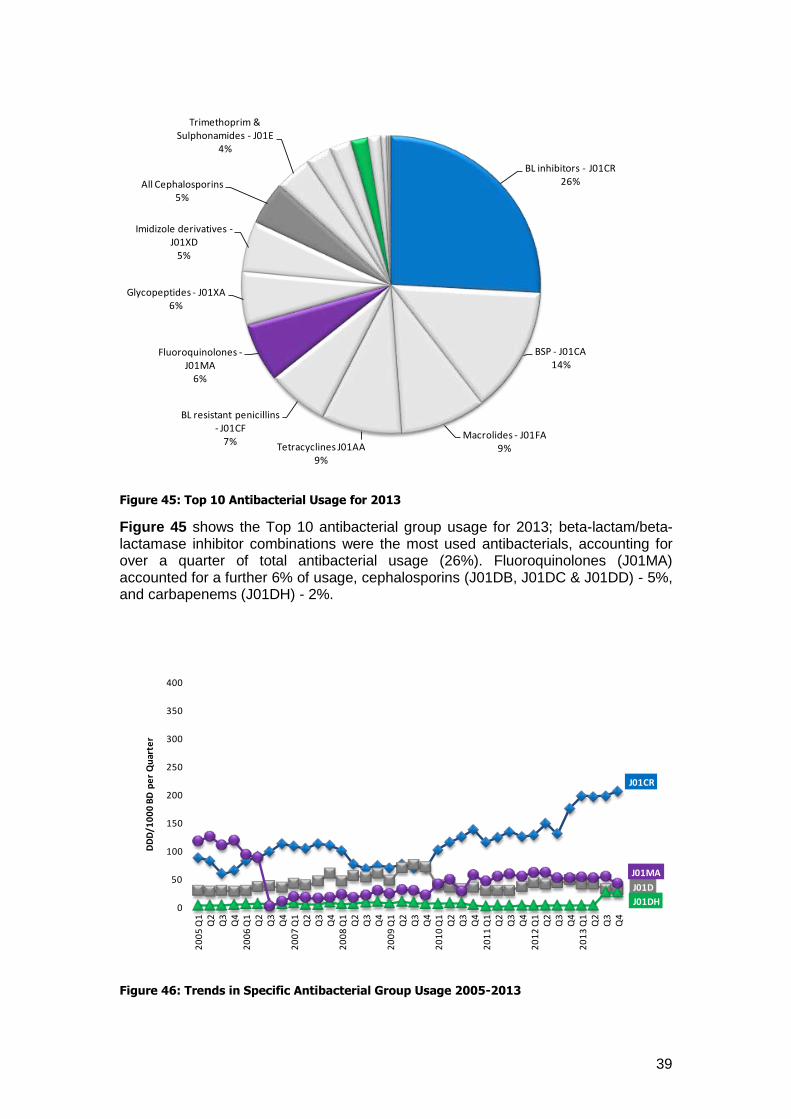
Figure 45: Top 10 Antibacterial Usage for 2013
Figure 45 shows the Top 10 antibacterial group usage for 2013; beta-lactam/beta-lactamase inhibitor combinations were the most used antibacterials, accounting for over a quarter of total antibacterial usage (26%). Fluoroquinolones (J01MA) accounted for a further 6% of usage, cephalosporins (J01DB, J01DC & J01DD) - 5%, and carbapenems (J01DH) - 2%.
Figure 46: Trends in Specific Antibacterial Group Usage 2005-2013
BL inhibitors - J01CR26%
BSP - J01CA14%
Macrolides - J01FA9%Tetracyclines J01AA
9%
BL resistant penicillins - J01CF
7%
Fluoroquinolones -J01MA
6%
Glycopeptides - J01XA6%
Imidizole derivatives -J01XD
5%
All Cephalosporins5%
Trimethoprim & Sulphonamides - J01E
4%
J01CR
J01D
J01DH
J01MA
0
50
100
150
200
250
300
350
400
20
05
Q1
Q2
Q3
Q4
20
06
Q1
Q2
Q3
Q4
20
07
Q1
Q2
Q3
Q4
20
08
Q1
Q2
Q3
Q4
20
09
Q1
Q2
Q3
Q4
20
10
Q1
Q2
Q3
Q4
20
11
Q1
Q2
Q3
Q4
20
12
Q1
Q2
Q3
Q4
20
13
Q1
Q2
Q3
Q4
DD
D/1
00
0 B
D p
er
Qu
arte
r
40
Figure 46 shows trends in specific antibacterial group usage in Wrexham Maelor from 2005-2012: beta-lactam/beta-lactamase inhibitor combinations (J01CR), all cephalosporins (J01D), carbapenems (J01DH) and fluoroquinolones (J01MA).
Beta-lactam/beta-lactamase inhibitor combination usage (J01CR) shows variation in usage over time, with an upward trend from 2010 to 2013.
Cephalosporin usage (J01D) shows a downward trend between 2012 and 2013.
Carbapenem usage (J01DH) shows a marked upward trend in 2013.
Fluoroquinolone usage (J01MA) shows a sharp decrease in 2006q3, followed by a slight upward trend from 2006q4 onwards.
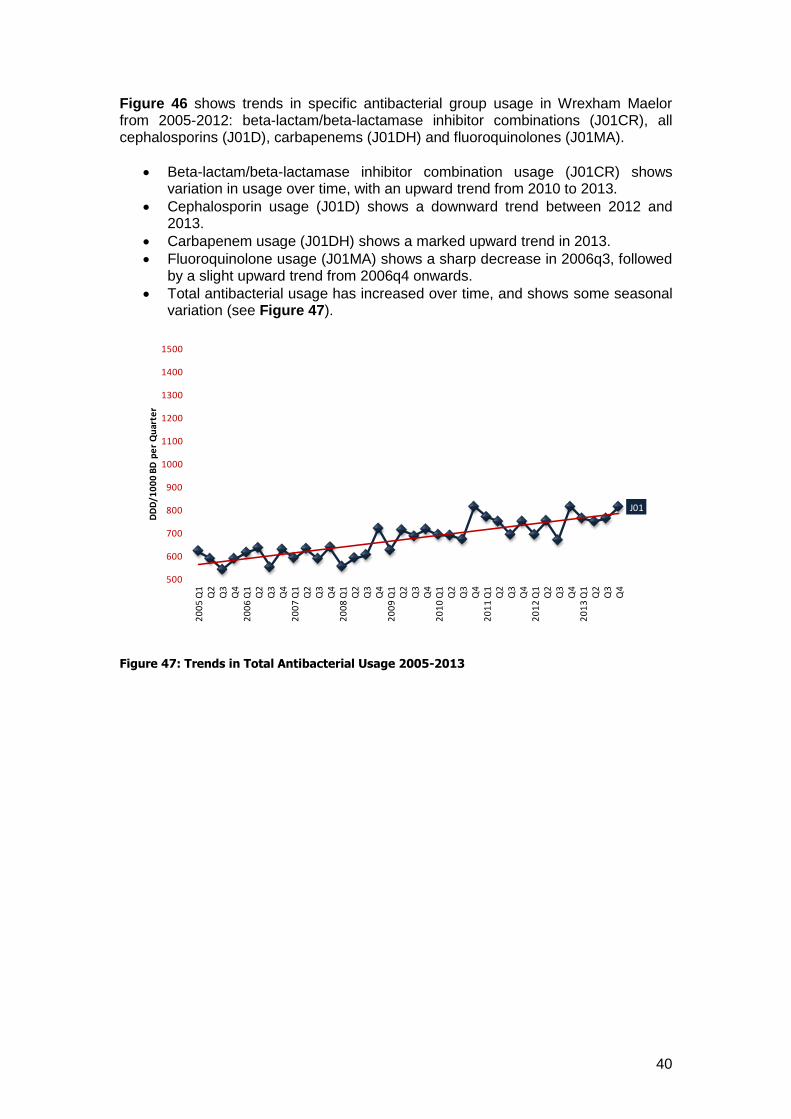
Total antibacterial usage has increased over time, and shows some seasonal variation (see Figure 47).
Figure 47: Trends in Total Antibacterial Usage 2005-2013
J01
500
600
700
800
900
1000
1100
1200
1300
1400
1500
20
05
Q1
Q2
Q3
Q4
20
06
Q1
Q2
Q3
Q4
20
07
Q1
Q2
Q3
Q4
20
08
Q1
Q2
Q3
Q4
20
09
Q1
Q2
Q3
Q4
20
10
Q1
Q2
Q3
Q4
20
11
Q1
Q2
Q3
Q4
20
12
Q1
Q2
Q3
Q4
20
13
Q1
Q2
Q3
Q4
DD
D/1
00
0 B
D p
er
Qu
arte
r
41
Ysbyty Glan Clwyd (Betsi Cadwaladr University Health Board)
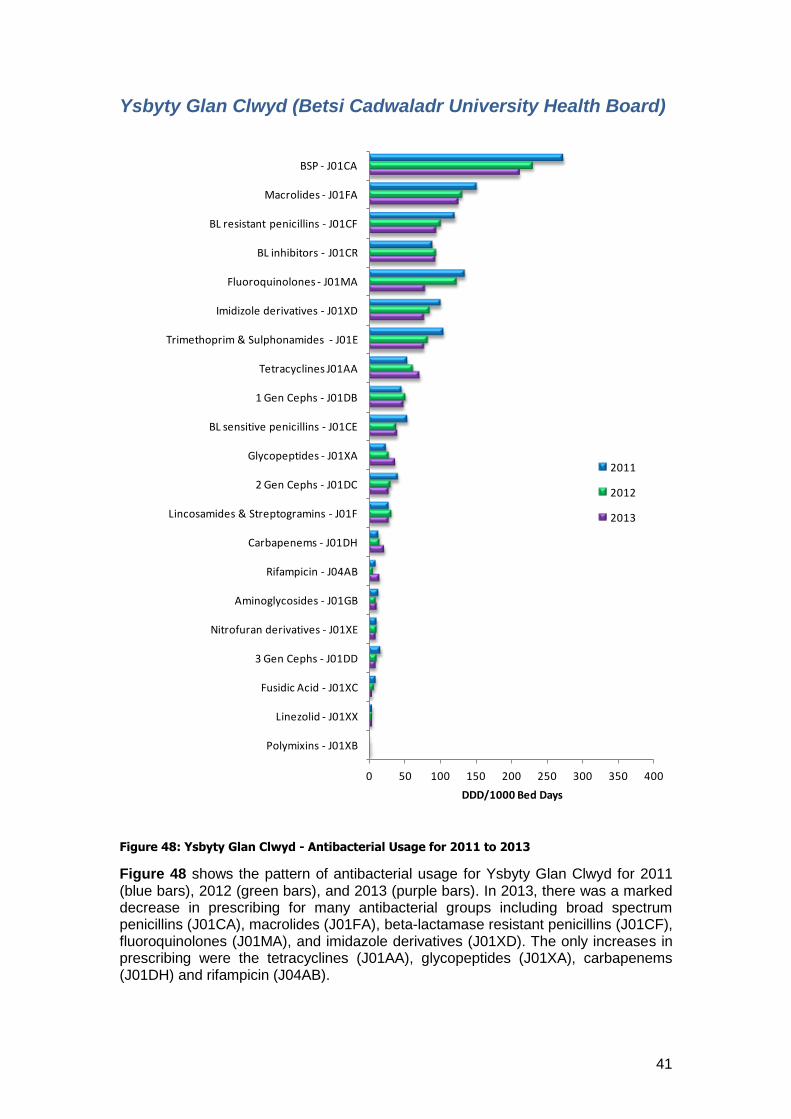
Figure 48: Ysbyty Glan Clwyd - Antibacterial Usage for 2011 to 2013
Figure 48 shows the pattern of antibacterial usage for Ysbyty Glan Clwyd for 2011 (blue bars), 2012 (green bars), and 2013 (purple bars). In 2013, there was a marked decrease in prescribing for many antibacterial groups including broad spectrum penicillins (J01CA), macrolides (J01FA), beta-lactamase resistant penicillins (J01CF), fluoroquinolones (J01MA), and imidazole derivatives (J01XD). The only increases in prescribing were the tetracyclines (J01AA), glycopeptides (J01XA), carbapenems (J01DH) and rifampicin (J04AB).
0 50 100 150 200 250 300 350 400
Polymixins - J01XB
Linezolid - J01XX
Fusidic Acid - J01XC
3 Gen Cephs - J01DD
Nitrofuran derivatives - J01XE
Aminoglycosides - J01GB
Rifampicin - J04AB
Carbapenems - J01DH
Lincosamides & Streptogramins - J01F
2 Gen Cephs - J01DC
Glycopeptides - J01XA
BL sensitive penicillins - J01CE
1 Gen Cephs - J01DB
Tetracyclines J01AA
Trimethoprim & Sulphonamides - J01E
Imidizole derivatives - J01XD
Fluoroquinolones - J01MA
BL inhibitors - J01CR
BL resistant penicillins - J01CF
Macrolides - J01FA
BSP - J01CA
DDD/1000 Bed Days
2011
2012
2013
42
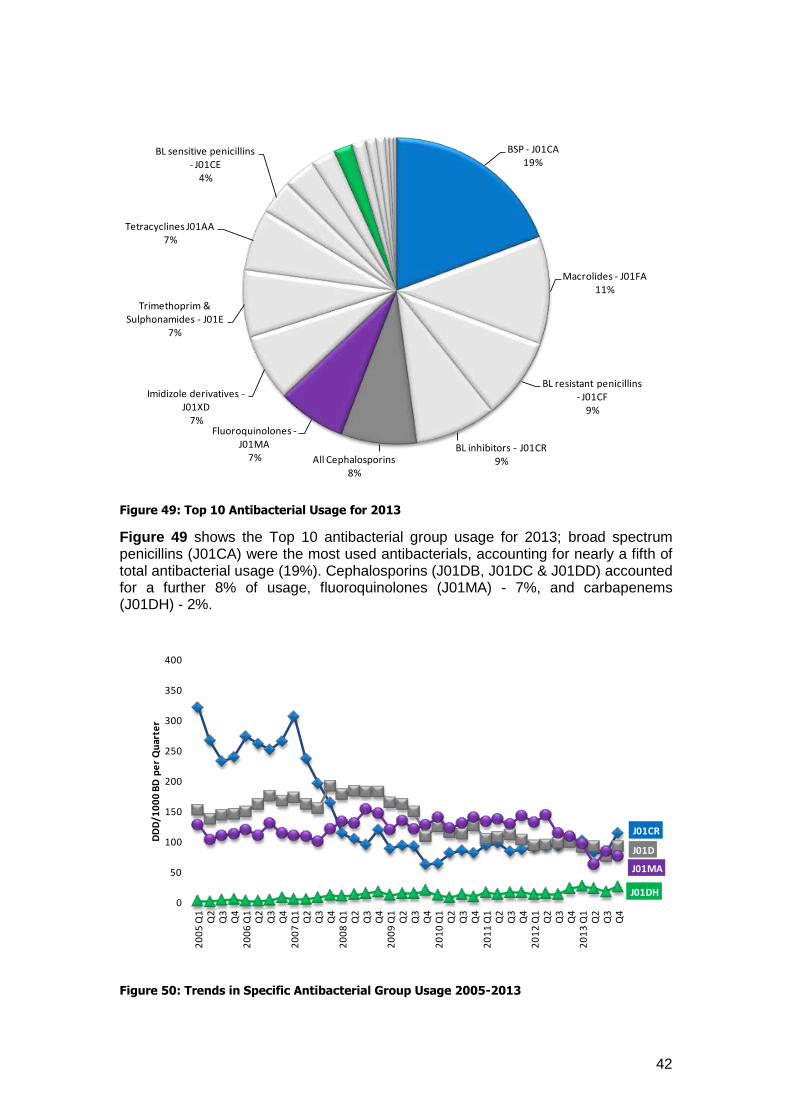
Figure 49: Top 10 Antibacterial Usage for 2013
Figure 49 shows the Top 10 antibacterial group usage for 2013; broad spectrum penicillins (J01CA) were the most used antibacterials, accounting for nearly a fifth of total antibacterial usage (19%). Cephalosporins (J01DB, J01DC & J01DD) accounted for a further 8% of usage, fluoroquinolones (J01MA) - 7%, and carbapenems (J01DH) - 2%.
Figure 50: Trends in Specific Antibacterial Group Usage 2005-2013
BSP - J01CA19%
Macrolides - J01FA11%
BL resistant penicillins - J01CF
9%
BL inhibitors - J01CR9%All Cephalosporins
8%
Fluoroquinolones -J01MA
7%
Imidizole derivatives -J01XD
7%
Trimethoprim & Sulphonamides - J01E
7%
Tetracyclines J01AA7%
BL sensitive penicillins - J01CE
4%
J01CR
J01D
J01DH
J01MA
0
50
100
150
200
250
300
350
400
20
05
Q1
Q2
Q3
Q4
20
06
Q1
Q2
Q3
Q4
20
07
Q1
Q2
Q3
Q4
20
08
Q1
Q2
Q3
Q4
20
09
Q1
Q2
Q3
Q4
20
10
Q1
Q2
Q3
Q4
20
11
Q1
Q2
Q3
Q4
20
12
Q1
Q2
Q3
Q4
20
13
Q1
Q2
Q3
Q4
DD
D/1
00
0 B
D p
er
Qu
arte
r
43
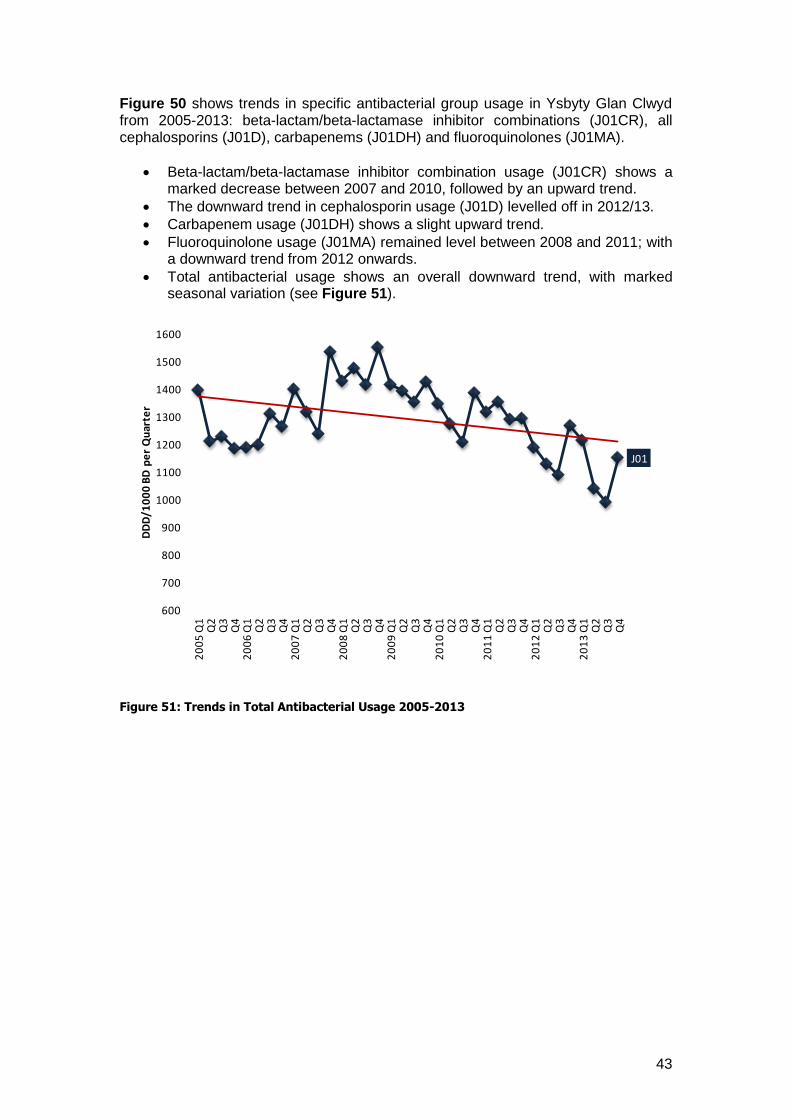
Figure 50 shows trends in specific antibacterial group usage in Ysbyty Glan Clwyd from 2005-2013: beta-lactam/beta-lactamase inhibitor combinations (J01CR), all cephalosporins (J01D), carbapenems (J01DH) and fluoroquinolones (J01MA).
Beta-lactam/beta-lactamase inhibitor combination usage (J01CR) shows a marked decrease between 2007 and 2010, followed by an upward trend.
The downward trend in cephalosporin usage (J01D) levelled off in 2012/13.
Carbapenem usage (J01DH) shows a slight upward trend.
Fluoroquinolone usage (J01MA) remained level between 2008 and 2011; with a downward trend from 2012 onwards.
Total antibacterial usage shows an overall downward trend, with marked seasonal variation (see Figure 51).
Figure 51: Trends in Total Antibacterial Usage 2005-2013
J01
600
700
800
900
1000
1100
1200
1300
1400
1500
1600
20
05
Q1
Q2
Q3
Q4
20
06
Q1
Q2
Q3
Q4
20
07
Q1
Q2
Q3
Q4
20
08
Q1
Q2
Q3
Q4
20
09
Q1
Q2
Q3
Q4
20
10
Q1
Q2
Q3
Q4
20
11
Q1
Q2
Q3
Q4
20
12
Q1
Q2
Q3
Q4
20
13
Q1
Q2
Q3
Q4
DD
D/1
00
0 B
D p
er
Qu
arte
r
44
Ysbyty Gwynedd (Betsi Cadwaladr University Health Board)
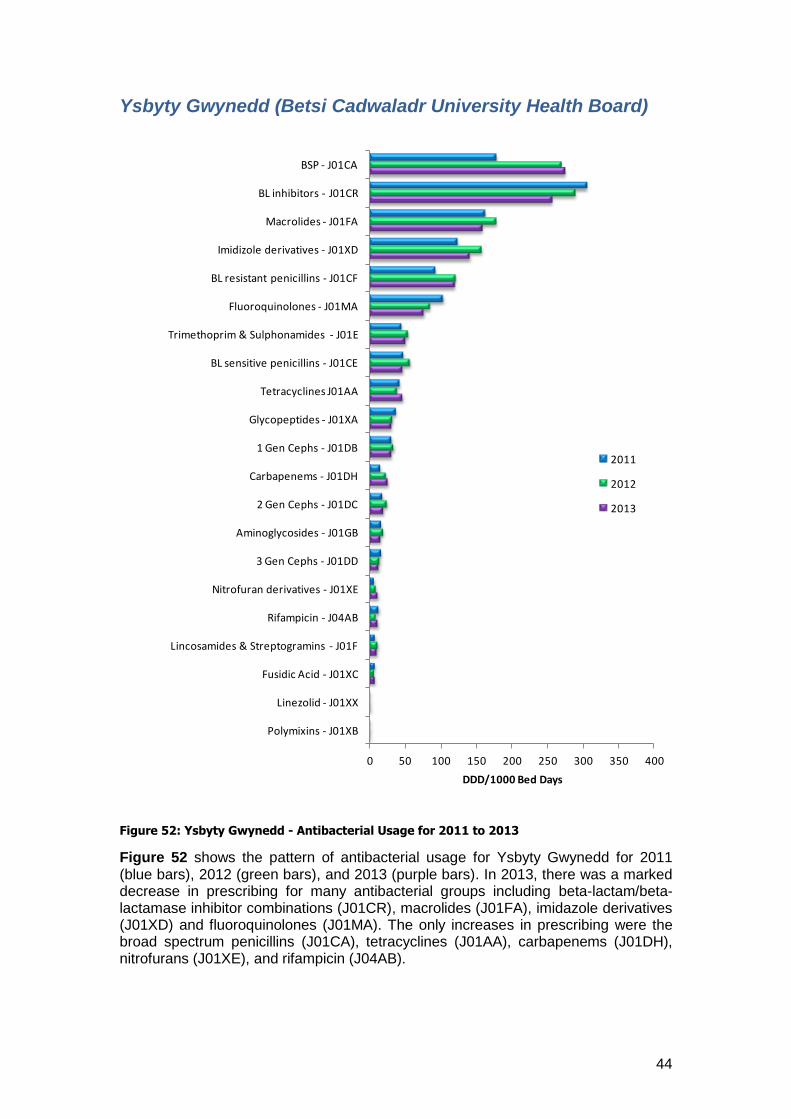
Figure 52: Ysbyty Gwynedd - Antibacterial Usage for 2011 to 2013
Figure 52 shows the pattern of antibacterial usage for Ysbyty Gwynedd for 2011 (blue bars), 2012 (green bars), and 2013 (purple bars). In 2013, there was a marked decrease in prescribing for many antibacterial groups including beta-lactam/beta-lactamase inhibitor combinations (J01CR), macrolides (J01FA), imidazole derivatives (J01XD) and fluoroquinolones (J01MA). The only increases in prescribing were the broad spectrum penicillins (J01CA), tetracyclines (J01AA), carbapenems (J01DH), nitrofurans (J01XE), and rifampicin (J04AB).
0 50 100 150 200 250 300 350 400
Polymixins - J01XB
Linezolid - J01XX
Fusidic Acid - J01XC
Lincosamides & Streptogramins - J01F
Rifampicin - J04AB
Nitrofuran derivatives - J01XE
3 Gen Cephs - J01DD
Aminoglycosides - J01GB
2 Gen Cephs - J01DC
Carbapenems - J01DH
1 Gen Cephs - J01DB
Glycopeptides - J01XA
Tetracyclines J01AA
BL sensitive penicillins - J01CE
Trimethoprim & Sulphonamides - J01E
Fluoroquinolones - J01MA
BL resistant penicillins - J01CF
Imidizole derivatives - J01XD
Macrolides - J01FA
BL inhibitors - J01CR
BSP - J01CA
DDD/1000 Bed Days
2011
2012
2013
45
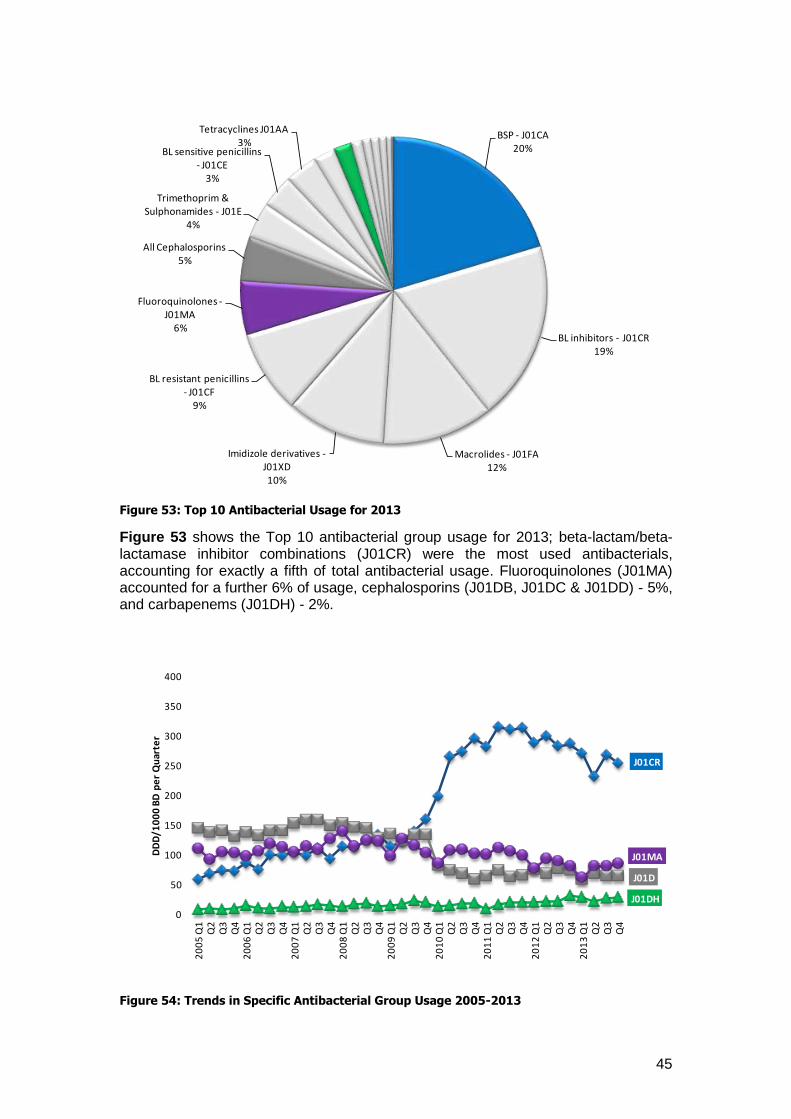
Figure 53: Top 10 Antibacterial Usage for 2013
Figure 53 shows the Top 10 antibacterial group usage for 2013; beta-lactam/beta-lactamase inhibitor combinations (J01CR) were the most used antibacterials, accounting for exactly a fifth of total antibacterial usage. Fluoroquinolones (J01MA) accounted for a further 6% of usage, cephalosporins (J01DB, J01DC & J01DD) - 5%, and carbapenems (J01DH) - 2%.
Figure 54: Trends in Specific Antibacterial Group Usage 2005-2013
BSP - J01CA20%
BL inhibitors - J01CR19%
Macrolides - J01FA12%
Imidizole derivatives -J01XD10%
BL resistant penicillins - J01CF
9%
Fluoroquinolones -J01MA
6%
All Cephalosporins5%
Trimethoprim & Sulphonamides - J01E
4%
BL sensitive penicillins - J01CE
3%
Tetracyclines J01AA3%
J01CR
J01D
J01DH
J01MA
0
50
100
150
200
250
300
350
400
20
05
Q1
Q2
Q3
Q4
20
06
Q1
Q2
Q3
Q4
20
07
Q1
Q2
Q3
Q4
20
08
Q1
Q2
Q3
Q4
20
09
Q1
Q2
Q3
Q4
20
10
Q1
Q2
Q3
Q4
20
11
Q1
Q2
Q3
Q4
20
12
Q1
Q2
Q3
Q4
20
13
Q1
Q2
Q3
Q4
DD
D/1
00
0 B
D p
er
Qu
arte
r
46
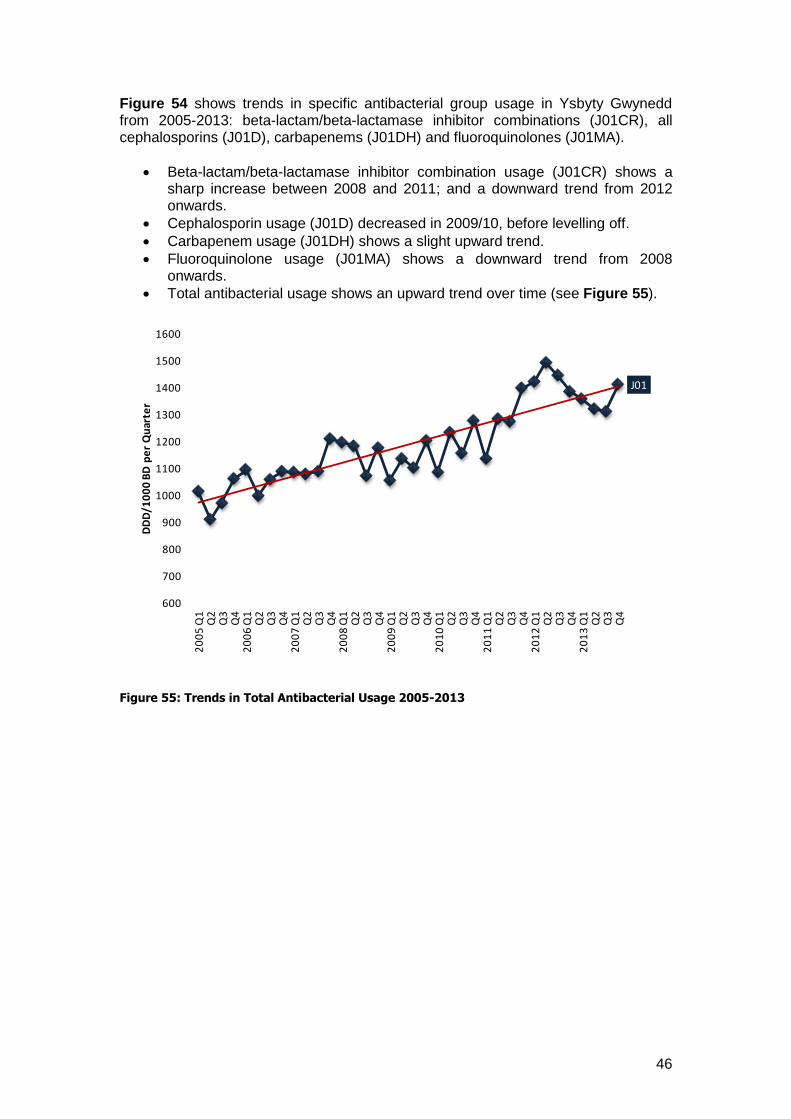
Figure 54 shows trends in specific antibacterial group usage in Ysbyty Gwynedd from 2005-2013: beta-lactam/beta-lactamase inhibitor combinations (J01CR), all cephalosporins (J01D), carbapenems (J01DH) and fluoroquinolones (J01MA).
Beta-lactam/beta-lactamase inhibitor combination usage (J01CR) shows a sharp increase between 2008 and 2011; and a downward trend from 2012 onwards.
Cephalosporin usage (J01D) decreased in 2009/10, before levelling off.
Carbapenem usage (J01DH) shows a slight upward trend.
Fluoroquinolone usage (J01MA) shows a downward trend from 2008 onwards.
Total antibacterial usage shows an upward trend over time (see Figure 55).
Figure 55: Trends in Total Antibacterial Usage 2005-2013
J01
600
700
800
900
1000
1100
1200
1300
1400
1500
1600
20
05
Q1
Q2
Q3
Q4
20
06
Q1
Q2
Q3
Q4
20
07
Q1
Q2
Q3
Q4
20
08
Q1
Q2
Q3
Q4
20
09
Q1
Q2
Q3
Q4
20
10
Q1
Q2
Q3
Q4
20
11
Q1
Q2
Q3
Q4
20
12
Q1
Q2
Q3
Q4
20
13
Q1
Q2
Q3
Q4
DD
D/1
00
0 B
D p
er
Qu
arte
r
47
Llandough Hospital (Cardiff and Vale University Health Board)
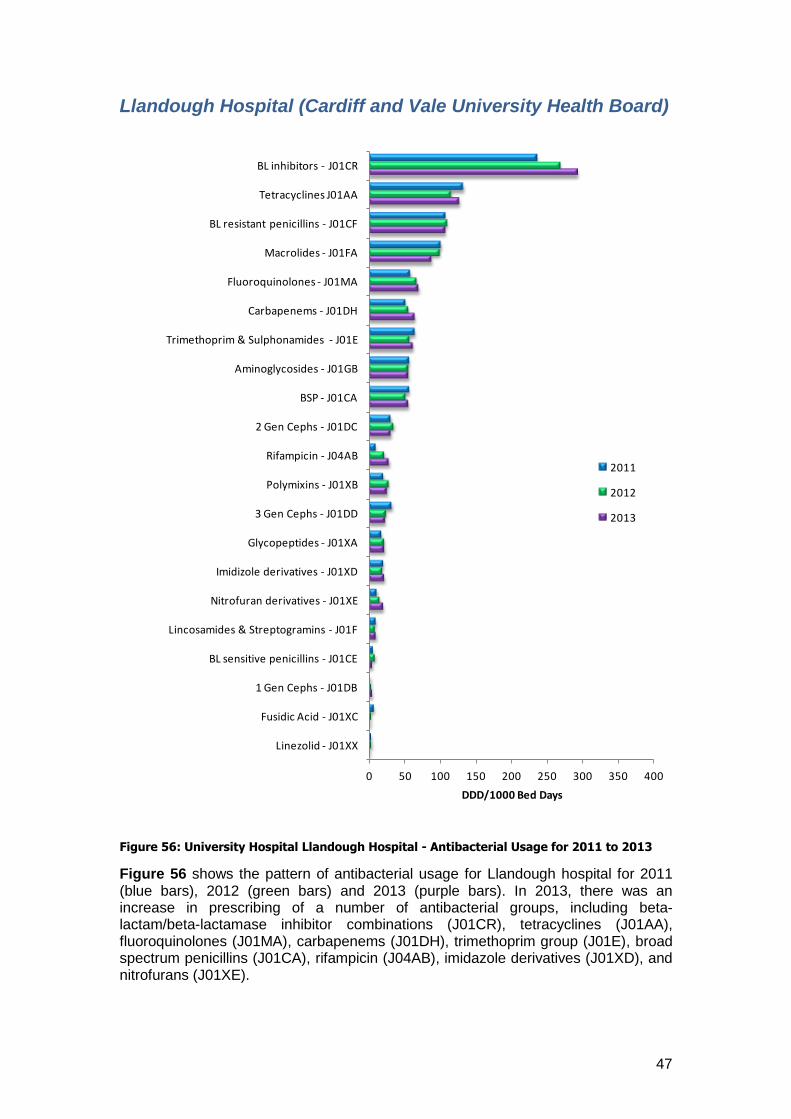
Figure 56: University Hospital Llandough Hospital - Antibacterial Usage for 2011 to 2013
Figure 56 shows the pattern of antibacterial usage for Llandough hospital for 2011 (blue bars), 2012 (green bars) and 2013 (purple bars). In 2013, there was an increase in prescribing of a number of antibacterial groups, including beta-lactam/beta-lactamase inhibitor combinations (J01CR), tetracyclines (J01AA), fluoroquinolones (J01MA), carbapenems (J01DH), trimethoprim group (J01E), broad spectrum penicillins (J01CA), rifampicin (J04AB), imidazole derivatives (J01XD), and nitrofurans (J01XE).
0 50 100 150 200 250 300 350 400
Linezolid - J01XX
Fusidic Acid - J01XC
1 Gen Cephs - J01DB
BL sensitive penicillins - J01CE
Lincosamides & Streptogramins - J01F
Nitrofuran derivatives - J01XE
Imidizole derivatives - J01XD
Glycopeptides - J01XA
3 Gen Cephs - J01DD
Polymixins - J01XB
Rifampicin - J04AB
2 Gen Cephs - J01DC
BSP - J01CA
Aminoglycosides - J01GB
Trimethoprim & Sulphonamides - J01E
Carbapenems - J01DH
Fluoroquinolones - J01MA
Macrolides - J01FA
BL resistant penicillins - J01CF
Tetracyclines J01AA
BL inhibitors - J01CR
DDD/1000 Bed Days
2011
2012
2013
48
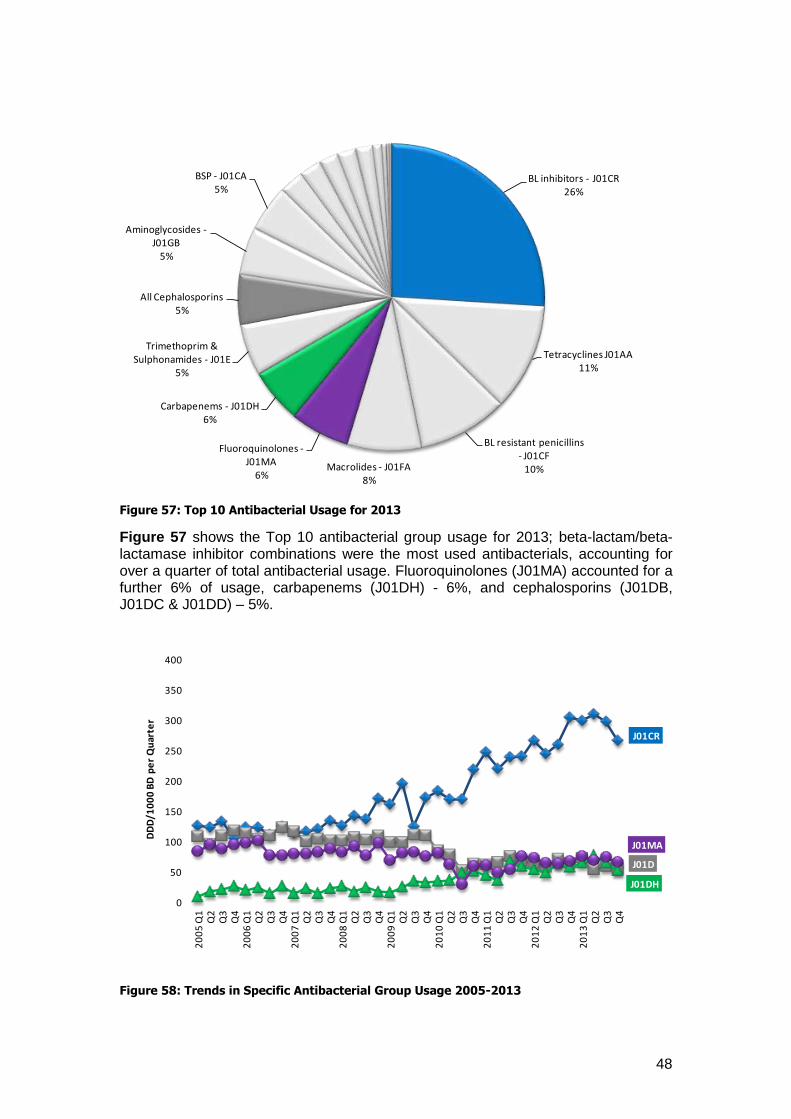
Figure 57: Top 10 Antibacterial Usage for 2013
Figure 57 shows the Top 10 antibacterial group usage for 2013; beta-lactam/beta-lactamase inhibitor combinations were the most used antibacterials, accounting for over a quarter of total antibacterial usage. Fluoroquinolones (J01MA) accounted for a further 6% of usage, carbapenems (J01DH) - 6%, and cephalosporins (J01DB, J01DC & J01DD) – 5%.
Figure 58: Trends in Specific Antibacterial Group Usage 2005-2013
BL inhibitors - J01CR26%
Tetracyclines J01AA11%
BL resistant penicillins - J01CF
10%Macrolides - J01FA8%
Fluoroquinolones -J01MA
6%
Carbapenems - J01DH6%
Trimethoprim & Sulphonamides - J01E
5%
All Cephalosporins5%
Aminoglycosides -J01GB
5%
BSP - J01CA5%
J01CR
J01D
J01DH
J01MA
0
50
100
150
200
250
300
350
400
20
05
Q1
Q2
Q3
Q4
20
06
Q1
Q2
Q3
Q4
20
07
Q1
Q2
Q3
Q4
20
08
Q1
Q2
Q3
Q4
20
09
Q1
Q2
Q3
Q4
20
10
Q1
Q2
Q3
Q4
20
11
Q1
Q2
Q3
Q4
20
12
Q1
Q2
Q3
Q4
20
13
Q1
Q2
Q3
Q4
DD
D/1
00
0 B
D p
er
Qu
arte
r
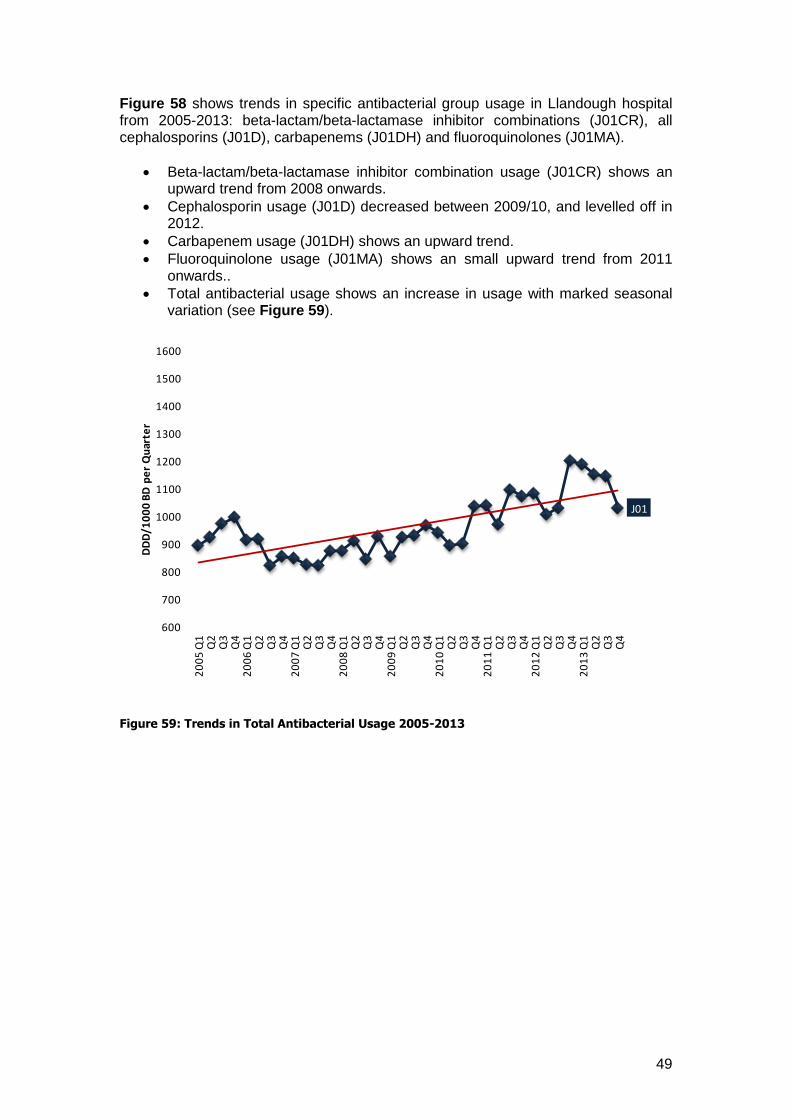
49
Figure 58 shows trends in specific antibacterial group usage in Llandough hospital from 2005-2013: beta-lactam/beta-lactamase inhibitor combinations (J01CR), all cephalosporins (J01D), carbapenems (J01DH) and fluoroquinolones (J01MA).
Beta-lactam/beta-lactamase inhibitor combination usage (J01CR) shows an upward trend from 2008 onwards.
Cephalosporin usage (J01D) decreased between 2009/10, and levelled off in 2012.
Carbapenem usage (J01DH) shows an upward trend.
Fluoroquinolone usage (J01MA) shows an small upward trend from 2011 onwards..
Total antibacterial usage shows an increase in usage with marked seasonal variation (see Figure 59).
Figure 59: Trends in Total Antibacterial Usage 2005-2013
J01
600
700
800
900
1000
1100
1200
1300
1400
1500
1600
20
05
Q1
Q2
Q3
Q4
20
06
Q1
Q2
Q3
Q4
20
07
Q1
Q2
Q3
Q4
20
08
Q1
Q2
Q3
Q4
20
09
Q1
Q2
Q3
Q4
20
10
Q1
Q2
Q3
Q4
20
11
Q1
Q2
Q3
Q4
20
12
Q1
Q2
Q3
Q4
20
13
Q1
Q2
Q3
Q4
DD
D/1
00
0 B
D p
er
Qu
arte
r
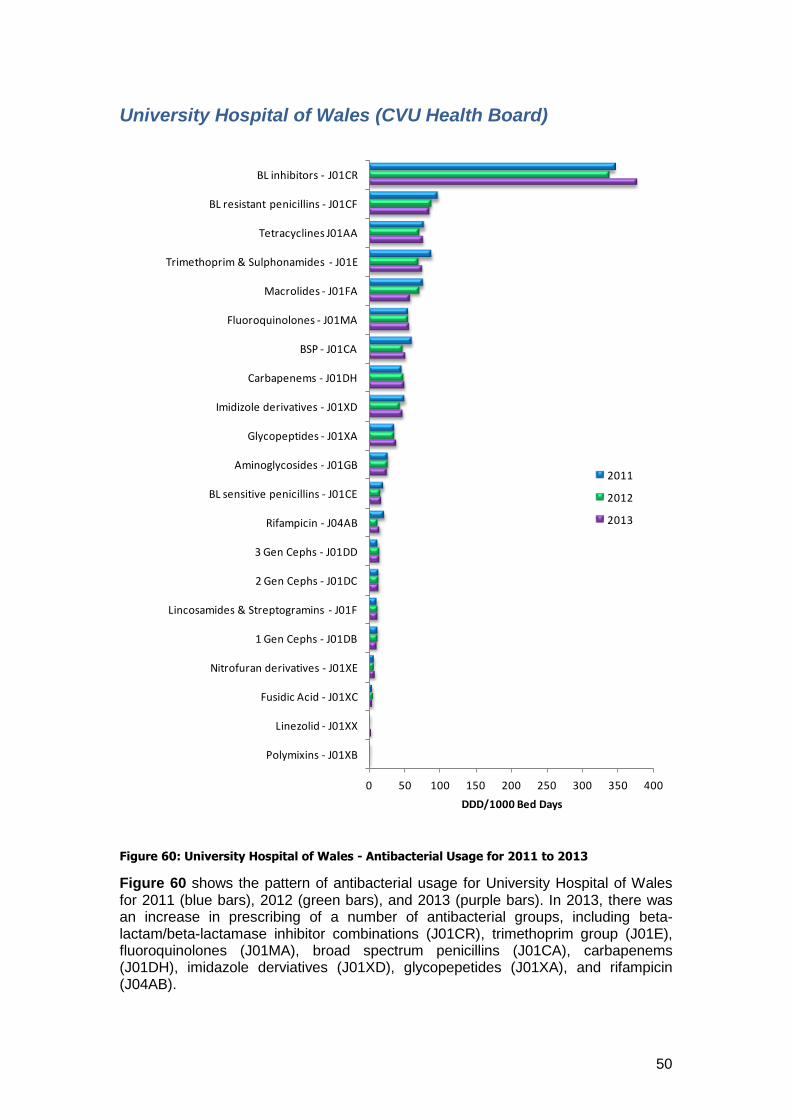
50
University Hospital of Wales (CVU Health Board)
Figure 60: University Hospital of Wales - Antibacterial Usage for 2011 to 2013
Figure 60 shows the pattern of antibacterial usage for University Hospital of Wales for 2011 (blue bars), 2012 (green bars), and 2013 (purple bars). In 2013, there was an increase in prescribing of a number of antibacterial groups, including beta-lactam/beta-lactamase inhibitor combinations (J01CR), trimethoprim group (J01E), fluoroquinolones (J01MA), broad spectrum penicillins (J01CA), carbapenems (J01DH), imidazole derviatives (J01XD), glycopepetides (J01XA), and rifampicin (J04AB).
0 50 100 150 200 250 300 350 400
Polymixins - J01XB
Linezolid - J01XX
Fusidic Acid - J01XC
Nitrofuran derivatives - J01XE
1 Gen Cephs - J01DB
Lincosamides & Streptogramins - J01F
2 Gen Cephs - J01DC
3 Gen Cephs - J01DD
Rifampicin - J04AB
BL sensitive penicillins - J01CE
Aminoglycosides - J01GB
Glycopeptides - J01XA
Imidizole derivatives - J01XD
Carbapenems - J01DH
BSP - J01CA
Fluoroquinolones - J01MA
Macrolides - J01FA
Trimethoprim & Sulphonamides - J01E
Tetracyclines J01AA
BL resistant penicillins - J01CF
BL inhibitors - J01CR
DDD/1000 Bed Days
2011
2012
2013
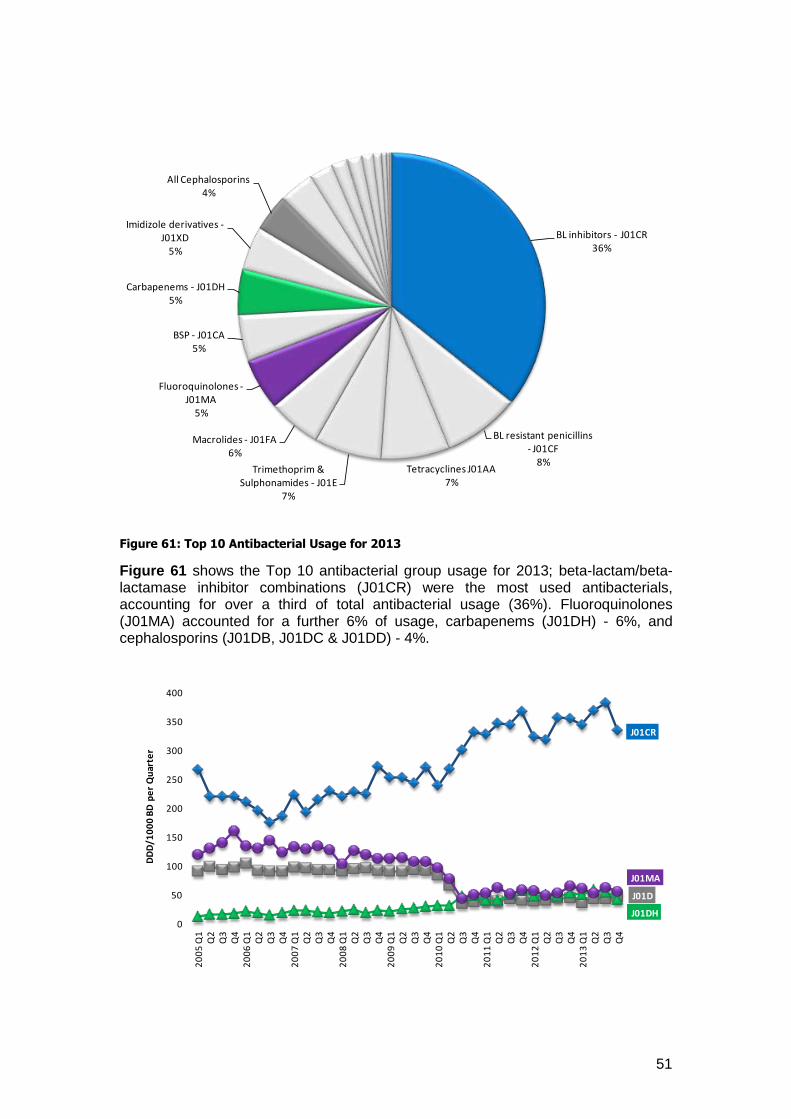
51
Figure 61: Top 10 Antibacterial Usage for 2013
Figure 61 shows the Top 10 antibacterial group usage for 2013; beta-lactam/beta-lactamase inhibitor combinations (J01CR) were the most used antibacterials, accounting for over a third of total antibacterial usage (36%). Fluoroquinolones (J01MA) accounted for a further 6% of usage, carbapenems (J01DH) - 6%, and cephalosporins (J01DB, J01DC & J01DD) - 4%.
BL inhibitors - J01CR36%
BL resistant penicillins - J01CF
8%Tetracyclines J01AA
7%Trimethoprim &
Sulphonamides - J01E7%
Macrolides - J01FA6%
Fluoroquinolones -J01MA
5%
BSP - J01CA5%
Carbapenems - J01DH5%
Imidizole derivatives -J01XD
5%
All Cephalosporins4%
J01CR
J01D
J01DH
J01MA
0
50
100
150
200
250
300
350
400
20
05
Q1
Q2
Q3
Q4
20
06
Q1
Q2
Q3
Q4
20
07
Q1
Q2
Q3
Q4
20
08
Q1
Q2
Q3
Q4
20
09
Q1
Q2
Q3
Q4
20
10
Q1
Q2
Q3
Q4
20
11
Q1
Q2
Q3
Q4
20
12
Q1
Q2
Q3
Q4
20
13
Q1
Q2
Q3
Q4
DD
D/1
00
0 B
D p
er
Qu
arte
r
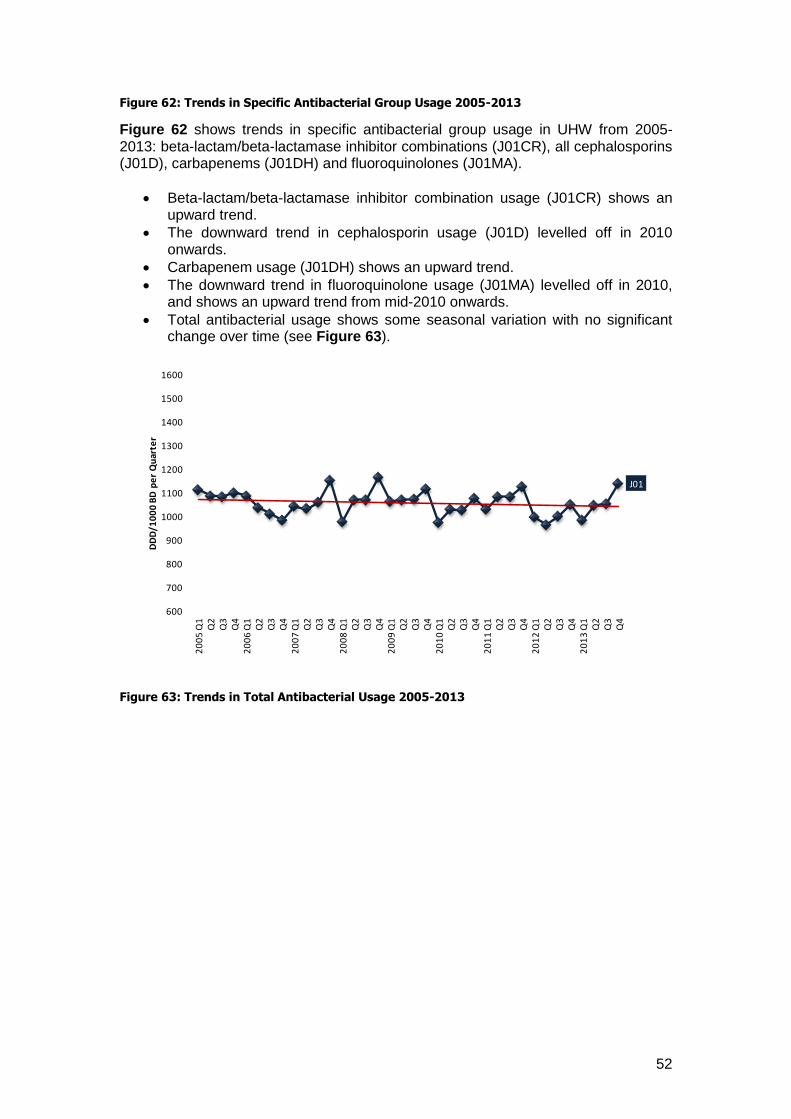
52
Figure 62: Trends in Specific Antibacterial Group Usage 2005-2013
Figure 62 shows trends in specific antibacterial group usage in UHW from 2005-2013: beta-lactam/beta-lactamase inhibitor combinations (J01CR), all cephalosporins (J01D), carbapenems (J01DH) and fluoroquinolones (J01MA).
Beta-lactam/beta-lactamase inhibitor combination usage (J01CR) shows an upward trend.
The downward trend in cephalosporin usage (J01D) levelled off in 2010 onwards.
Carbapenem usage (J01DH) shows an upward trend.
The downward trend in fluoroquinolone usage (J01MA) levelled off in 2010, and shows an upward trend from mid-2010 onwards.
Total antibacterial usage shows some seasonal variation with no significant change over time (see Figure 63).
Figure 63: Trends in Total Antibacterial Usage 2005-2013
J01
600
700
800
900
1000
1100
1200
1300
1400
1500
1600
20
05
Q1
Q2
Q3
Q4
20
06
Q1
Q2
Q3
Q4
20
07
Q1
Q2
Q3
Q4
20
08
Q1
Q2
Q3
Q4
20
09
Q1
Q2
Q3
Q4
20
10
Q1
Q2
Q3
Q4
20
11
Q1
Q2
Q3
Q4
20
12
Q1
Q2
Q3
Q4
20
13
Q1
Q2
Q3
Q4
DD
D/1
00
0 B
D p
er
Qu
arte
r
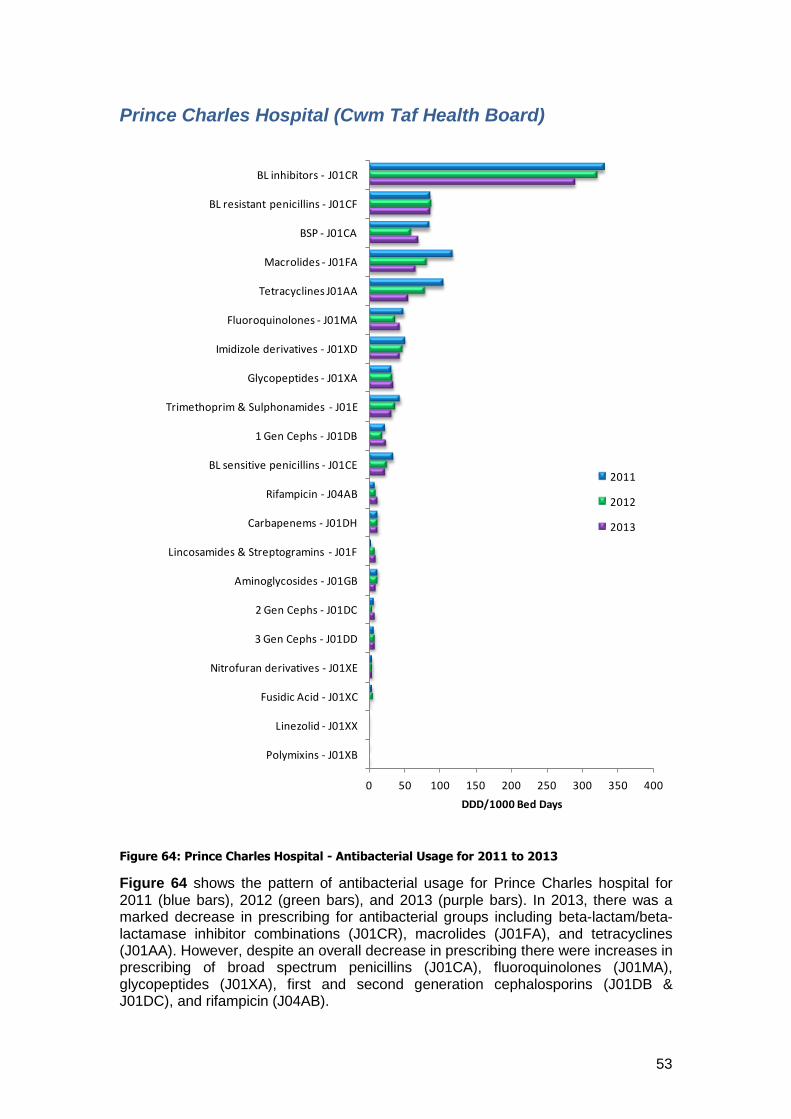
53
Prince Charles Hospital (Cwm Taf Health Board)
Figure 64: Prince Charles Hospital - Antibacterial Usage for 2011 to 2013
Figure 64 shows the pattern of antibacterial usage for Prince Charles hospital for 2011 (blue bars), 2012 (green bars), and 2013 (purple bars). In 2013, there was a marked decrease in prescribing for antibacterial groups including beta-lactam/beta-lactamase inhibitor combinations (J01CR), macrolides (J01FA), and tetracyclines (J01AA). However, despite an overall decrease in prescribing there were increases in prescribing of broad spectrum penicillins (J01CA), fluoroquinolones (J01MA), glycopeptides (J01XA), first and second generation cephalosporins (J01DB & J01DC), and rifampicin (J04AB).
0 50 100 150 200 250 300 350 400
Polymixins - J01XB
Linezolid - J01XX
Fusidic Acid - J01XC
Nitrofuran derivatives - J01XE
3 Gen Cephs - J01DD
2 Gen Cephs - J01DC
Aminoglycosides - J01GB
Lincosamides & Streptogramins - J01F
Carbapenems - J01DH
Rifampicin - J04AB
BL sensitive penicillins - J01CE
1 Gen Cephs - J01DB
Trimethoprim & Sulphonamides - J01E
Glycopeptides - J01XA
Imidizole derivatives - J01XD
Fluoroquinolones - J01MA
Tetracyclines J01AA
Macrolides - J01FA
BSP - J01CA
BL resistant penicillins - J01CF
BL inhibitors - J01CR
DDD/1000 Bed Days
2011
2012
2013
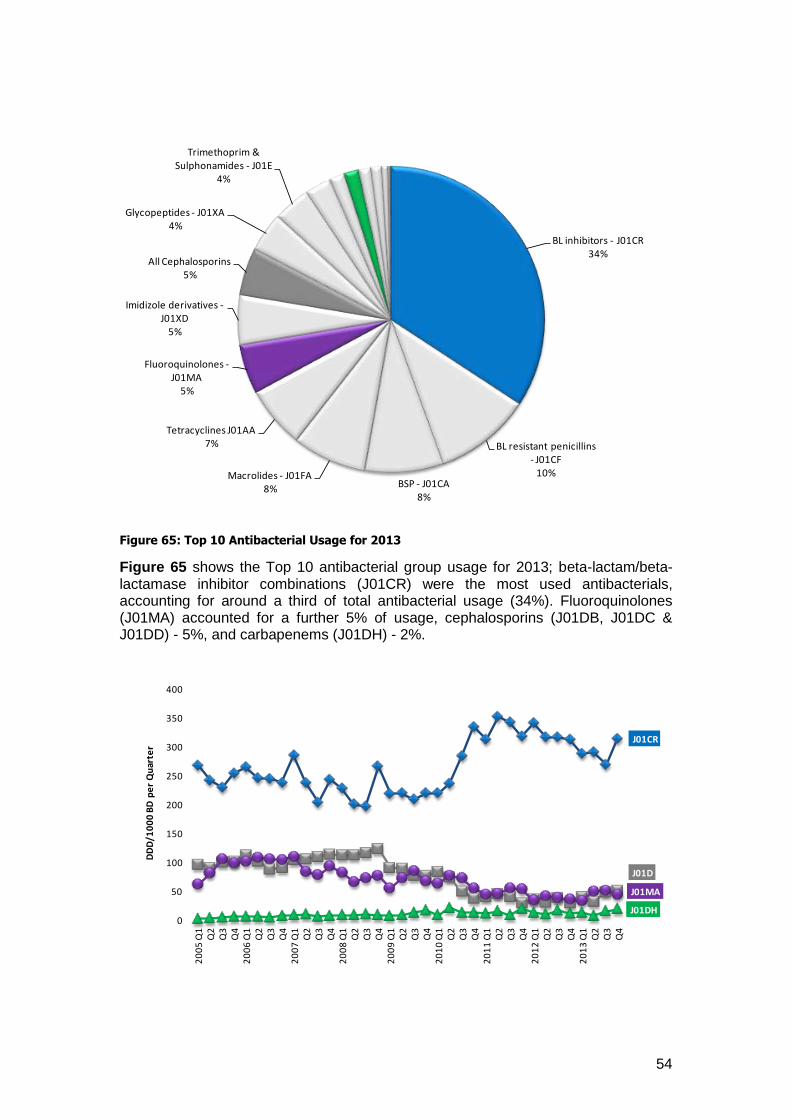
54
Figure 65: Top 10 Antibacterial Usage for 2013
Figure 65 shows the Top 10 antibacterial group usage for 2013; beta-lactam/beta-lactamase inhibitor combinations (J01CR) were the most used antibacterials, accounting for around a third of total antibacterial usage (34%). Fluoroquinolones (J01MA) accounted for a further 5% of usage, cephalosporins (J01DB, J01DC & J01DD) - 5%, and carbapenems (J01DH) - 2%.
BL inhibitors - J01CR34%
BL resistant penicillins - J01CF
10%BSP - J01CA
8%
Macrolides - J01FA8%
Tetracyclines J01AA7%
Fluoroquinolones -J01MA
5%
Imidizole derivatives -J01XD
5%
All Cephalosporins5%
Glycopeptides - J01XA4%
Trimethoprim & Sulphonamides - J01E
4%
J01CR
J01D
J01DH
J01MA
0
50
100
150
200
250
300
350
400
20
05
Q1
Q2
Q3
Q4
20
06
Q1
Q2
Q3
Q4
20
07
Q1
Q2
Q3
Q4
20
08
Q1
Q2
Q3
Q4
20
09
Q1
Q2
Q3
Q4
20
10
Q1
Q2
Q3
Q4
20
11
Q1
Q2
Q3
Q4
20
12
Q1
Q2
Q3
Q4
20
13
Q1
Q2
Q3
Q4
DD
D/1
00
0 B
D p
er
Qu
arte
r
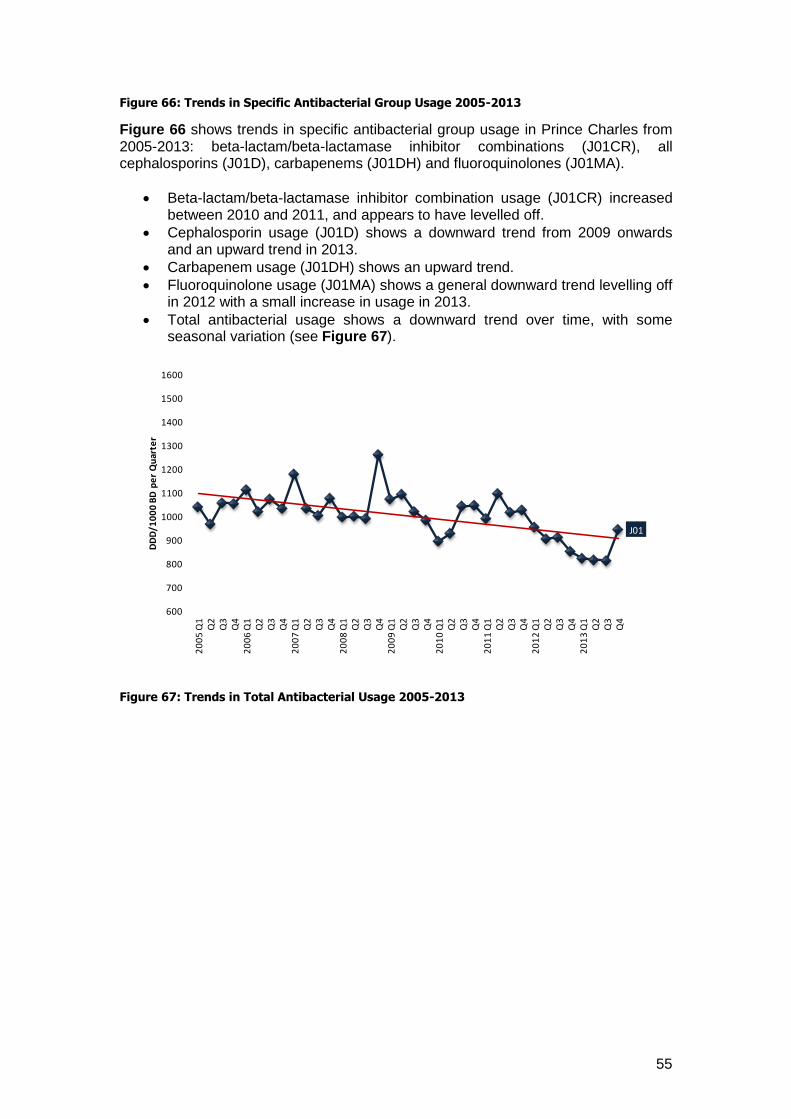
55
Figure 66: Trends in Specific Antibacterial Group Usage 2005-2013
Figure 66 shows trends in specific antibacterial group usage in Prince Charles from 2005-2013: beta-lactam/beta-lactamase inhibitor combinations (J01CR), all cephalosporins (J01D), carbapenems (J01DH) and fluoroquinolones (J01MA).
Beta-lactam/beta-lactamase inhibitor combination usage (J01CR) increased between 2010 and 2011, and appears to have levelled off.
Cephalosporin usage (J01D) shows a downward trend from 2009 onwards and an upward trend in 2013.
Carbapenem usage (J01DH) shows an upward trend.
Fluoroquinolone usage (J01MA) shows a general downward trend levelling off in 2012 with a small increase in usage in 2013.
Total antibacterial usage shows a downward trend over time, with some seasonal variation (see Figure 67).
Figure 67: Trends in Total Antibacterial Usage 2005-2013
J01
600
700
800
900
1000
1100
1200
1300
1400
1500
1600
20
05
Q1
Q2
Q3
Q4
20
06
Q1
Q2
Q3
Q4
20
07
Q1
Q2
Q3
Q4
20
08
Q1
Q2
Q3
Q4
20
09
Q1
Q2
Q3
Q4
20
10
Q1
Q2
Q3
Q4
20
11
Q1
Q2
Q3
Q4
20
12
Q1
Q2
Q3
Q4
20
13
Q1
Q2
Q3
Q4
DD
D/1
00
0 B
D p
er
Qu
arte
r
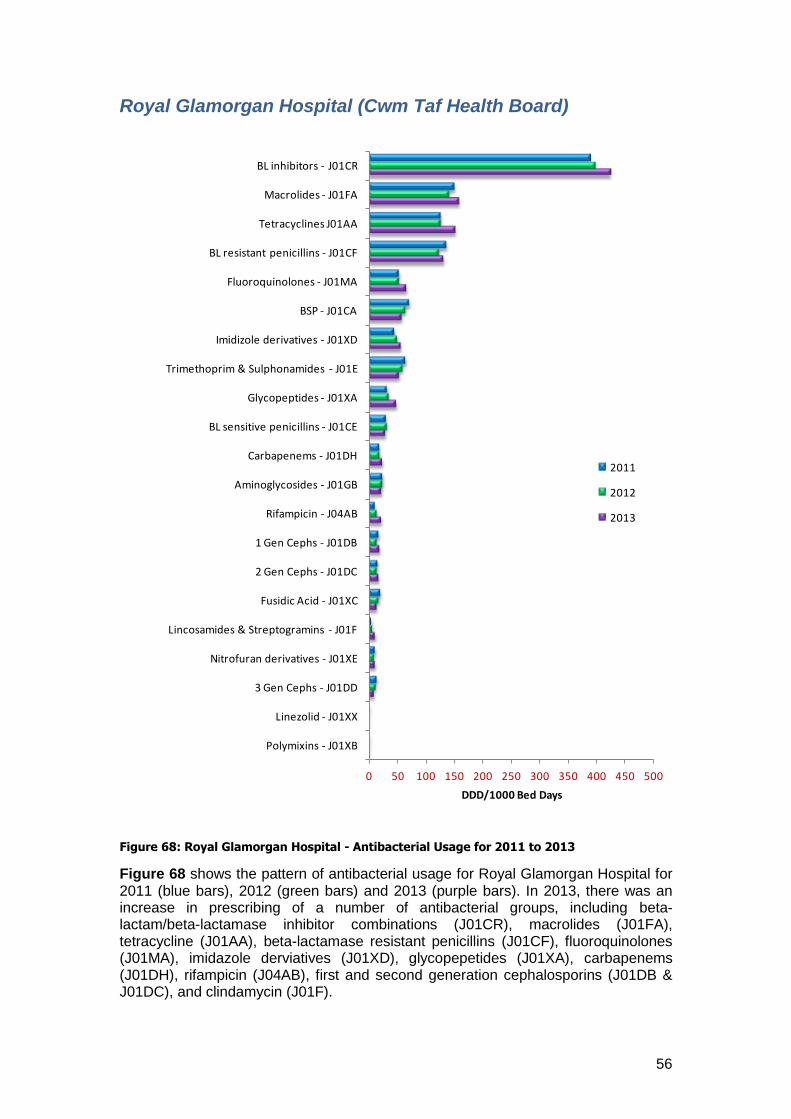
56
Royal Glamorgan Hospital (Cwm Taf Health Board)
Figure 68: Royal Glamorgan Hospital - Antibacterial Usage for 2011 to 2013
Figure 68 shows the pattern of antibacterial usage for Royal Glamorgan Hospital for 2011 (blue bars), 2012 (green bars) and 2013 (purple bars). In 2013, there was an increase in prescribing of a number of antibacterial groups, including beta-lactam/beta-lactamase inhibitor combinations (J01CR), macrolides (J01FA), tetracycline (J01AA), beta-lactamase resistant penicillins (J01CF), fluoroquinolones (J01MA), imidazole derviatives (J01XD), glycopepetides (J01XA), carbapenems (J01DH), rifampicin (J04AB), first and second generation cephalosporins (J01DB & J01DC), and clindamycin (J01F).
0 50 100 150 200 250 300 350 400 450 500
Polymixins - J01XB
Linezolid - J01XX
3 Gen Cephs - J01DD
Nitrofuran derivatives - J01XE
Lincosamides & Streptogramins - J01F
Fusidic Acid - J01XC
2 Gen Cephs - J01DC
1 Gen Cephs - J01DB
Rifampicin - J04AB
Aminoglycosides - J01GB
Carbapenems - J01DH
BL sensitive penicillins - J01CE
Glycopeptides - J01XA
Trimethoprim & Sulphonamides - J01E
Imidizole derivatives - J01XD
BSP - J01CA
Fluoroquinolones - J01MA
BL resistant penicillins - J01CF
Tetracyclines J01AA
Macrolides - J01FA
BL inhibitors - J01CR
DDD/1000 Bed Days
2011
2012
2013
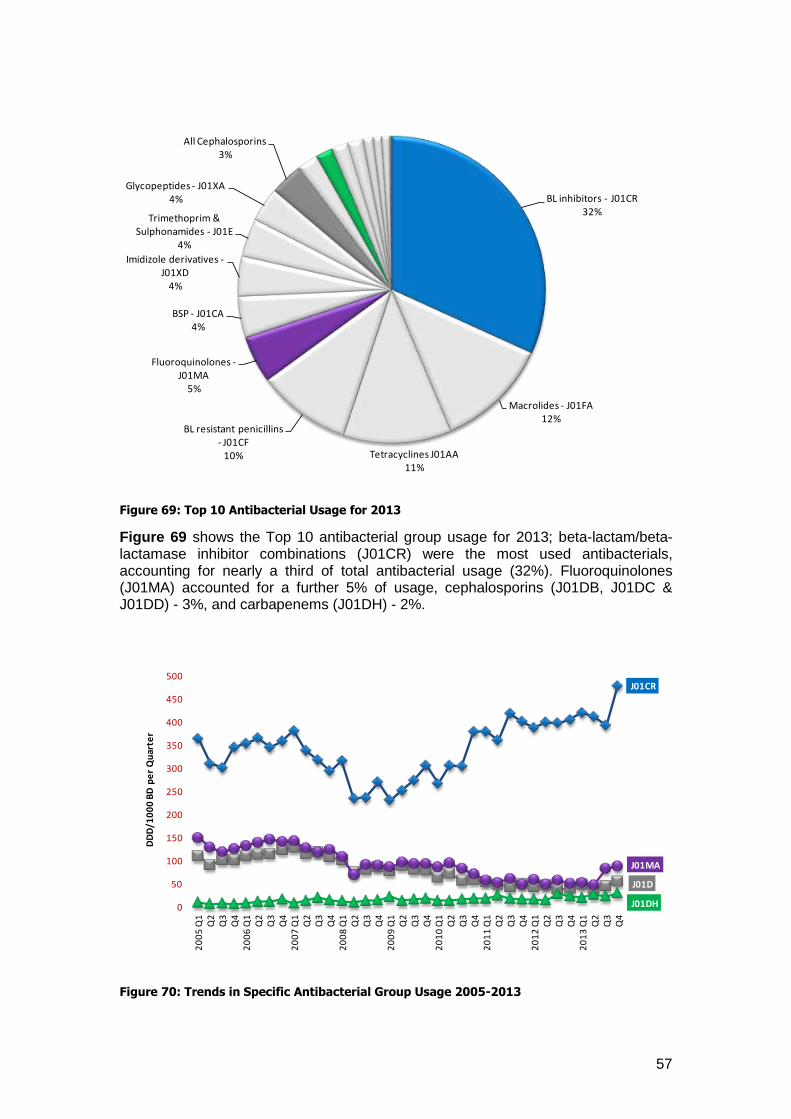
57
Figure 69: Top 10 Antibacterial Usage for 2013
Figure 69 shows the Top 10 antibacterial group usage for 2013; beta-lactam/beta-lactamase inhibitor combinations (J01CR) were the most used antibacterials, accounting for nearly a third of total antibacterial usage (32%). Fluoroquinolones (J01MA) accounted for a further 5% of usage, cephalosporins (J01DB, J01DC & J01DD) - 3%, and carbapenems (J01DH) - 2%.
Figure 70: Trends in Specific Antibacterial Group Usage 2005-2013
BL inhibitors - J01CR32%
Macrolides - J01FA12%
Tetracyclines J01AA11%
BL resistant penicillins - J01CF
10%
Fluoroquinolones -J01MA
5%
BSP - J01CA4%
Imidizole derivatives -J01XD
4%
Trimethoprim & Sulphonamides - J01E
4%
Glycopeptides - J01XA4%
All Cephalosporins3%
J01CR
J01D
J01DH
J01MA
0
50
100
150
200
250
300
350
400
450
500
20
05
Q1
Q2
Q3
Q4
20
06
Q1
Q2
Q3
Q4
20
07
Q1
Q2
Q3
Q4
20
08
Q1
Q2
Q3
Q4
20
09
Q1
Q2
Q3
Q4
20
10
Q1
Q2
Q3
Q4
20
11
Q1
Q2
Q3
Q4
20
12
Q1
Q2
Q3
Q4
20
13
Q1
Q2
Q3
Q4
DD
D/1
00
0 B
D p
er
Qu
arte
r
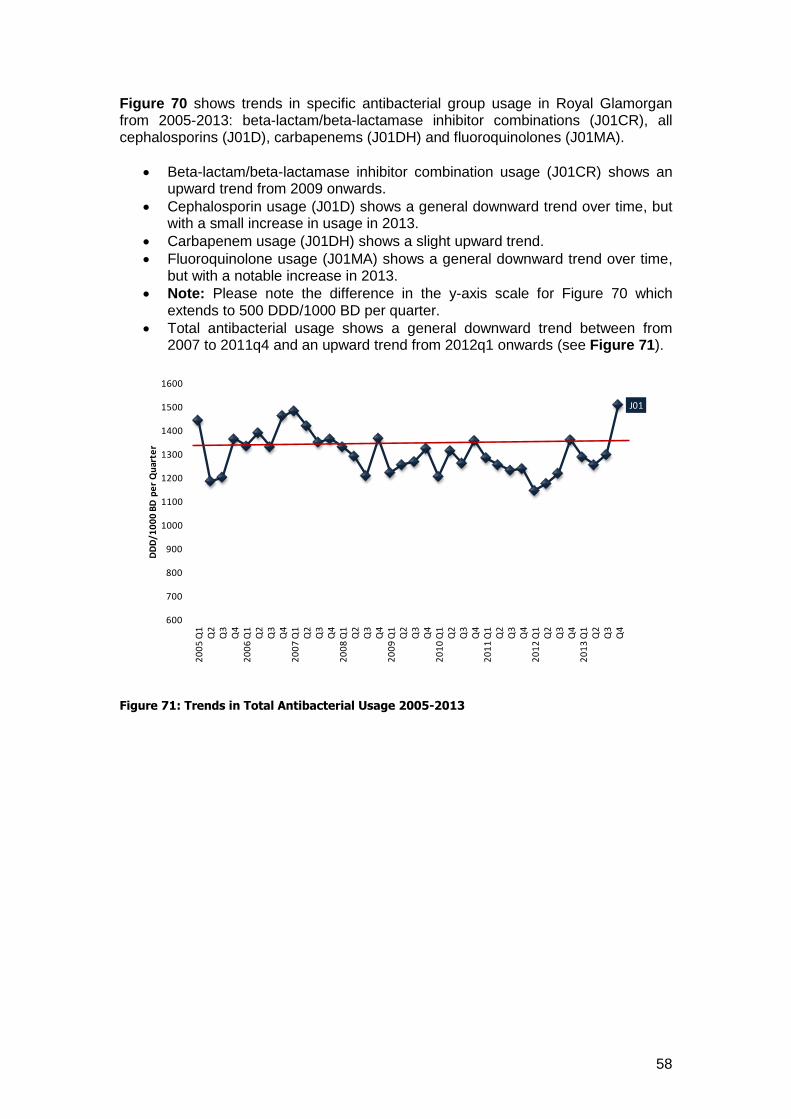
58
Figure 70 shows trends in specific antibacterial group usage in Royal Glamorgan from 2005-2013: beta-lactam/beta-lactamase inhibitor combinations (J01CR), all cephalosporins (J01D), carbapenems (J01DH) and fluoroquinolones (J01MA).
Beta-lactam/beta-lactamase inhibitor combination usage (J01CR) shows an upward trend from 2009 onwards.
Cephalosporin usage (J01D) shows a general downward trend over time, but with a small increase in usage in 2013.
Carbapenem usage (J01DH) shows a slight upward trend.
Fluoroquinolone usage (J01MA) shows a general downward trend over time, but with a notable increase in 2013.
Note: Please note the difference in the y-axis scale for Figure 70 which extends to 500 DDD/1000 BD per quarter.
Total antibacterial usage shows a general downward trend between from 2007 to 2011q4 and an upward trend from 2012q1 onwards (see Figure 71).
Figure 71: Trends in Total Antibacterial Usage 2005-2013
J01
600
700
800
900
1000
1100
1200
1300
1400
1500
1600
20
05
Q1
Q2
Q3
Q4
20
06
Q1
Q2
Q3
Q4
20
07
Q1
Q2
Q3
Q4
20
08
Q1
Q2
Q3
Q4
20
09
Q1
Q2
Q3
Q4
20
10
Q1
Q2
Q3
Q4
20
11
Q1
Q2
Q3
Q4
20
12
Q1
Q2
Q3
Q4
20
13
Q1
Q2
Q3
Q4
DD
D/1
00
0 B
D p
er
Qu
arte
r
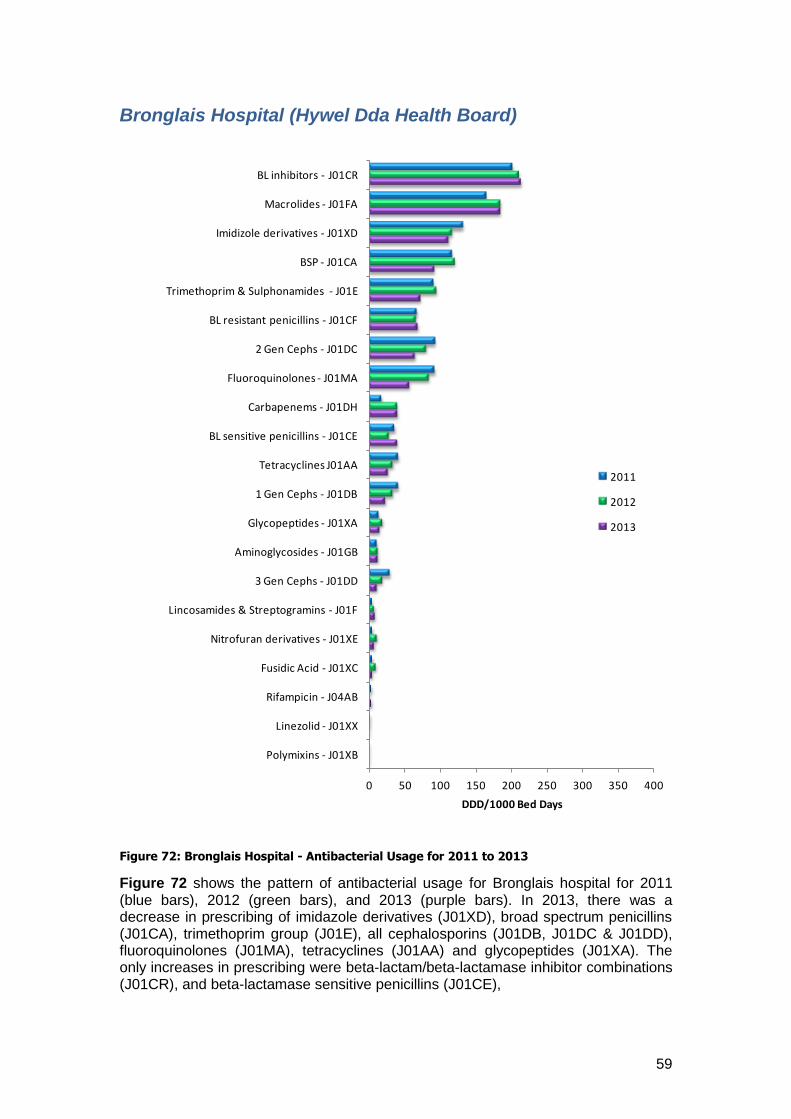
59
Bronglais Hospital (Hywel Dda Health Board)
Figure 72: Bronglais Hospital - Antibacterial Usage for 2011 to 2013
Figure 72 shows the pattern of antibacterial usage for Bronglais hospital for 2011 (blue bars), 2012 (green bars), and 2013 (purple bars). In 2013, there was a decrease in prescribing of imidazole derivatives (J01XD), broad spectrum penicillins (J01CA), trimethoprim group (J01E), all cephalosporins (J01DB, J01DC & J01DD), fluoroquinolones (J01MA), tetracyclines (J01AA) and glycopeptides (J01XA). The only increases in prescribing were beta-lactam/beta-lactamase inhibitor combinations (J01CR), and beta-lactamase sensitive penicillins (J01CE),
0 50 100 150 200 250 300 350 400
Polymixins - J01XB
Linezolid - J01XX
Rifampicin - J04AB
Fusidic Acid - J01XC
Nitrofuran derivatives - J01XE
Lincosamides & Streptogramins - J01F
3 Gen Cephs - J01DD
Aminoglycosides - J01GB
Glycopeptides - J01XA
1 Gen Cephs - J01DB
Tetracyclines J01AA
BL sensitive penicillins - J01CE
Carbapenems - J01DH
Fluoroquinolones - J01MA
2 Gen Cephs - J01DC
BL resistant penicillins - J01CF
Trimethoprim & Sulphonamides - J01E
BSP - J01CA
Imidizole derivatives - J01XD
Macrolides - J01FA
BL inhibitors - J01CR
DDD/1000 Bed Days
2011
2012
2013
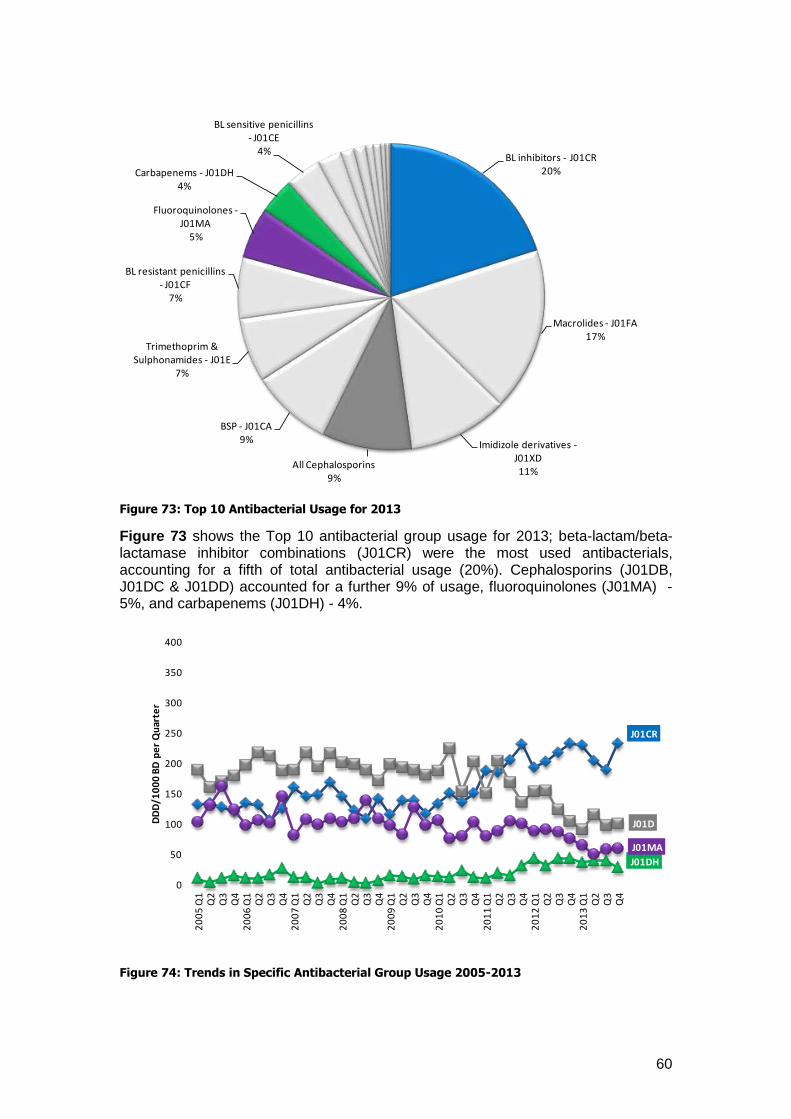
60
Figure 73: Top 10 Antibacterial Usage for 2013
Figure 73 shows the Top 10 antibacterial group usage for 2013; beta-lactam/beta-lactamase inhibitor combinations (J01CR) were the most used antibacterials, accounting for a fifth of total antibacterial usage (20%). Cephalosporins (J01DB, J01DC & J01DD) accounted for a further 9% of usage, fluoroquinolones (J01MA) - 5%, and carbapenems (J01DH) - 4%.
Figure 74: Trends in Specific Antibacterial Group Usage 2005-2013
BL inhibitors - J01CR20%
Macrolides - J01FA17%
Imidizole derivatives -J01XD11%
All Cephalosporins9%
BSP - J01CA9%
Trimethoprim & Sulphonamides - J01E
7%
BL resistant penicillins - J01CF
7%
Fluoroquinolones -J01MA
5%
Carbapenems - J01DH4%
BL sensitive penicillins - J01CE
4%
J01CR
J01D
J01DH
J01MA
0
50
100
150
200
250
300
350
400
20
05
Q1
Q2
Q3
Q4
20
06
Q1
Q2
Q3
Q4
20
07
Q1
Q2
Q3
Q4
20
08
Q1
Q2
Q3
Q4
20
09
Q1
Q2
Q3
Q4
20
10
Q1
Q2
Q3
Q4
20
11
Q1
Q2
Q3
Q4
20
12
Q1
Q2
Q3
Q4
20
13
Q1
Q2
Q3
Q4
DD
D/1
00
0 B
D p
er
Qu
arte
r
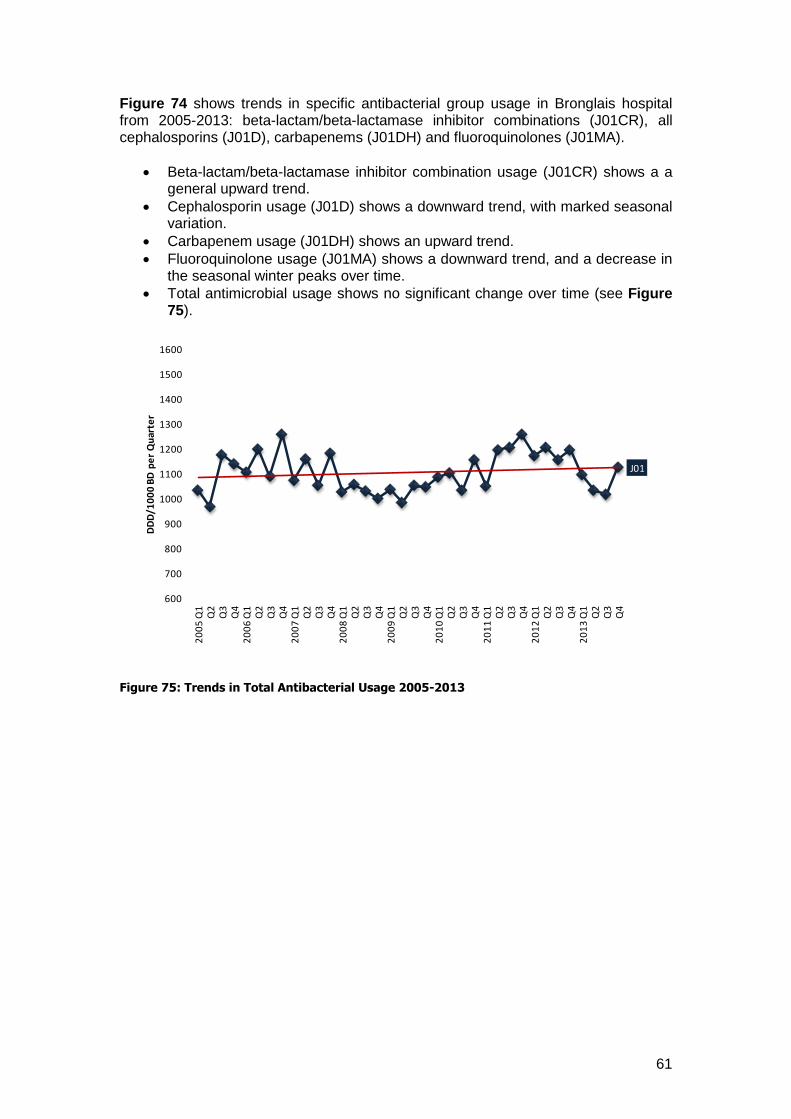
61
Figure 74 shows trends in specific antibacterial group usage in Bronglais hospital from 2005-2013: beta-lactam/beta-lactamase inhibitor combinations (J01CR), all cephalosporins (J01D), carbapenems (J01DH) and fluoroquinolones (J01MA).
Beta-lactam/beta-lactamase inhibitor combination usage (J01CR) shows a a general upward trend.
Cephalosporin usage (J01D) shows a downward trend, with marked seasonal variation.
Carbapenem usage (J01DH) shows an upward trend.
Fluoroquinolone usage (J01MA) shows a downward trend, and a decrease in the seasonal winter peaks over time.
Total antimicrobial usage shows no significant change over time (see Figure 75).
Figure 75: Trends in Total Antibacterial Usage 2005-2013
J01
600
700
800
900
1000
1100
1200
1300
1400
1500
1600
20
05
Q1
Q2
Q3
Q4
20
06
Q1
Q2
Q3
Q4
20
07
Q1
Q2
Q3
Q4
20
08
Q1
Q2
Q3
Q4
20
09
Q1
Q2
Q3
Q4
20
10
Q1
Q2
Q3
Q4
20
11
Q1
Q2
Q3
Q4
20
12
Q1
Q2
Q3
Q4
20
13
Q1
Q2
Q3
Q4
DD
D/1
00
0 B
D p
er
Qu
arte
r
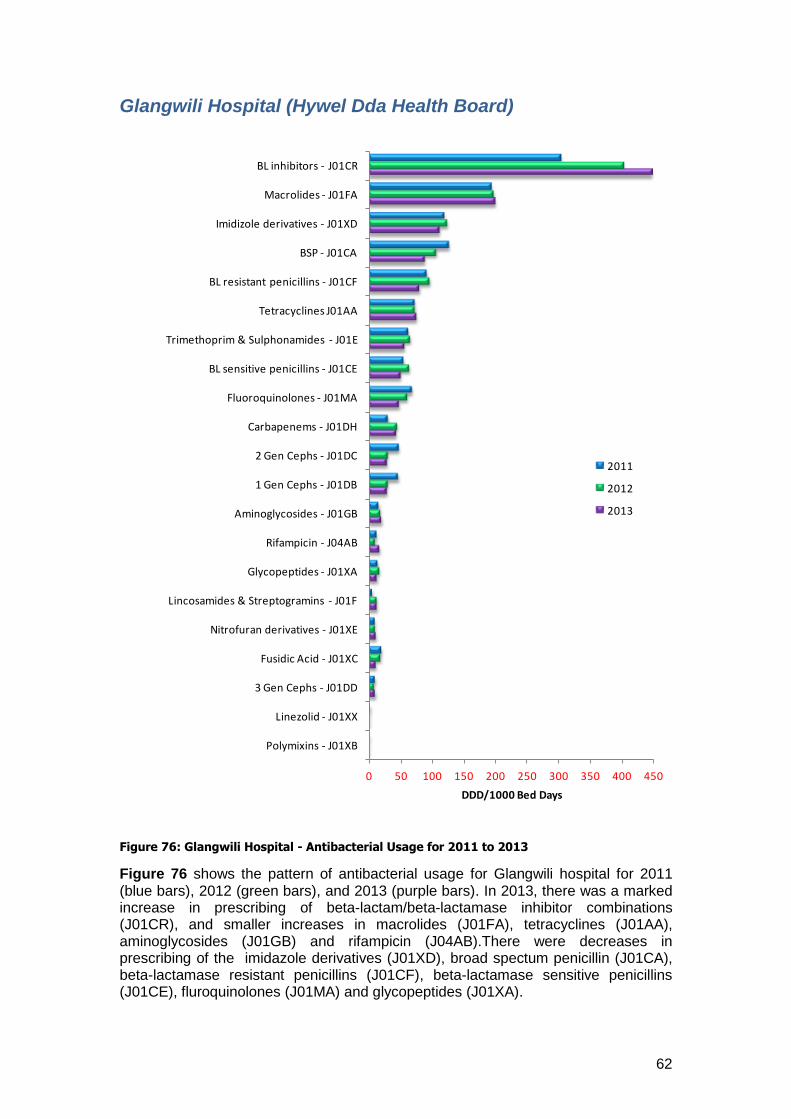
62
Glangwili Hospital (Hywel Dda Health Board)
Figure 76: Glangwili Hospital - Antibacterial Usage for 2011 to 2013
Figure 76 shows the pattern of antibacterial usage for Glangwili hospital for 2011 (blue bars), 2012 (green bars), and 2013 (purple bars). In 2013, there was a marked increase in prescribing of beta-lactam/beta-lactamase inhibitor combinations (J01CR), and smaller increases in macrolides (J01FA), tetracyclines (J01AA), aminoglycosides (J01GB) and rifampicin (J04AB).There were decreases in prescribing of the imidazole derivatives (J01XD), broad spectum penicillin (J01CA), beta-lactamase resistant penicillins (J01CF), beta-lactamase sensitive penicillins (J01CE), fluroquinolones (J01MA) and glycopeptides (J01XA).
0 50 100 150 200 250 300 350 400 450
Polymixins - J01XB
Linezolid - J01XX
3 Gen Cephs - J01DD
Fusidic Acid - J01XC
Nitrofuran derivatives - J01XE
Lincosamides & Streptogramins - J01F
Glycopeptides - J01XA
Rifampicin - J04AB
Aminoglycosides - J01GB
1 Gen Cephs - J01DB
2 Gen Cephs - J01DC
Carbapenems - J01DH
Fluoroquinolones - J01MA
BL sensitive penicillins - J01CE
Trimethoprim & Sulphonamides - J01E
Tetracyclines J01AA
BL resistant penicillins - J01CF
BSP - J01CA
Imidizole derivatives - J01XD
Macrolides - J01FA
BL inhibitors - J01CR
DDD/1000 Bed Days
2011
2012
2013
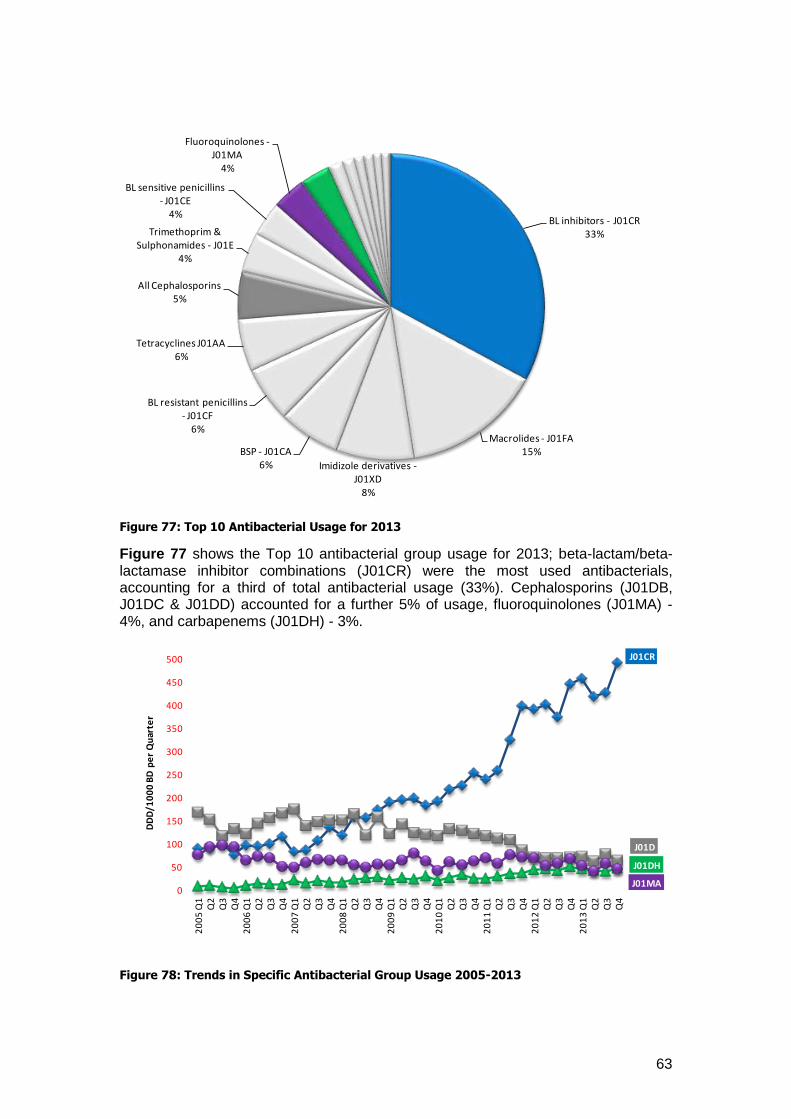
63
Figure 77: Top 10 Antibacterial Usage for 2013
Figure 77 shows the Top 10 antibacterial group usage for 2013; beta-lactam/beta-lactamase inhibitor combinations (J01CR) were the most used antibacterials, accounting for a third of total antibacterial usage (33%). Cephalosporins (J01DB, J01DC & J01DD) accounted for a further 5% of usage, fluoroquinolones (J01MA) - 4%, and carbapenems (J01DH) - 3%.
Figure 78: Trends in Specific Antibacterial Group Usage 2005-2013
BL inhibitors - J01CR33%
Macrolides - J01FA15%
Imidizole derivatives -J01XD
8%
BSP - J01CA6%
BL resistant penicillins - J01CF
6%
Tetracyclines J01AA6%
All Cephalosporins5%
Trimethoprim & Sulphonamides - J01E
4%
BL sensitive penicillins - J01CE
4%
Fluoroquinolones -J01MA
4%
J01CR
J01D
J01DH
J01MA0
50
100
150
200
250
300
350
400
450
500
20
05
Q1
Q2
Q3
Q4
20
06
Q1
Q2
Q3
Q4
20
07
Q1
Q2
Q3
Q4
20
08
Q1
Q2
Q3
Q4
20
09
Q1
Q2
Q3
Q4
20
10
Q1
Q2
Q3
Q4
20
11
Q1
Q2
Q3
Q4
20
12
Q1
Q2
Q3
Q4
20
13
Q1
Q2
Q3
Q4
DD
D/1
00
0 B
D p
er
Qu
arte
r
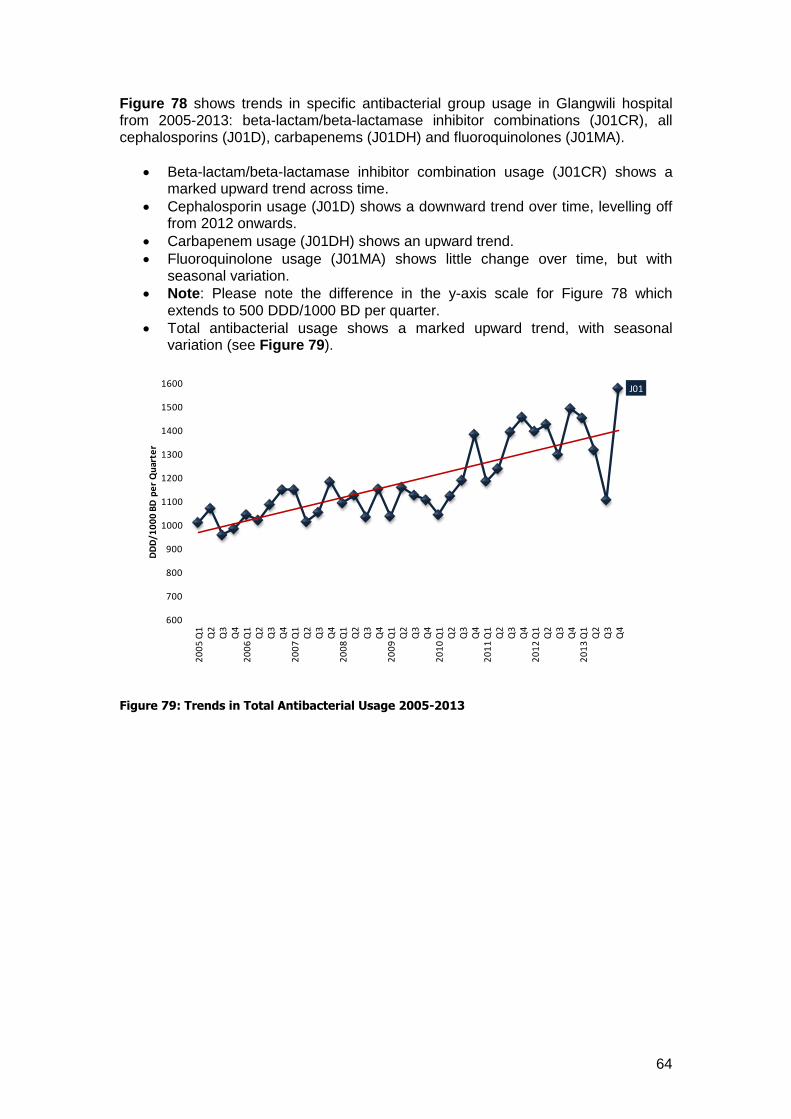
64
Figure 78 shows trends in specific antibacterial group usage in Glangwili hospital from 2005-2013: beta-lactam/beta-lactamase inhibitor combinations (J01CR), all cephalosporins (J01D), carbapenems (J01DH) and fluoroquinolones (J01MA).
Beta-lactam/beta-lactamase inhibitor combination usage (J01CR) shows a marked upward trend across time.
Cephalosporin usage (J01D) shows a downward trend over time, levelling off from 2012 onwards.
Carbapenem usage (J01DH) shows an upward trend.
Fluoroquinolone usage (J01MA) shows little change over time, but with seasonal variation.
Note: Please note the difference in the y-axis scale for Figure 78 which extends to 500 DDD/1000 BD per quarter.
Total antibacterial usage shows a marked upward trend, with seasonal variation (see Figure 79).
Figure 79: Trends in Total Antibacterial Usage 2005-2013
J01
600
700
800
900
1000
1100
1200
1300
1400
1500
1600
20
05
Q1
Q2
Q3
Q4
20
06
Q1
Q2
Q3
Q4
20
07
Q1
Q2
Q3
Q4
20
08
Q1
Q2
Q3
Q4
20
09
Q1
Q2
Q3
Q4
20
10
Q1
Q2
Q3
Q4
20
11
Q1
Q2
Q3
Q4
20
12
Q1
Q2
Q3
Q4
20
13
Q1
Q2
Q3
Q4
DD
D/1
00
0 B
D p
er
Qu
arte
r
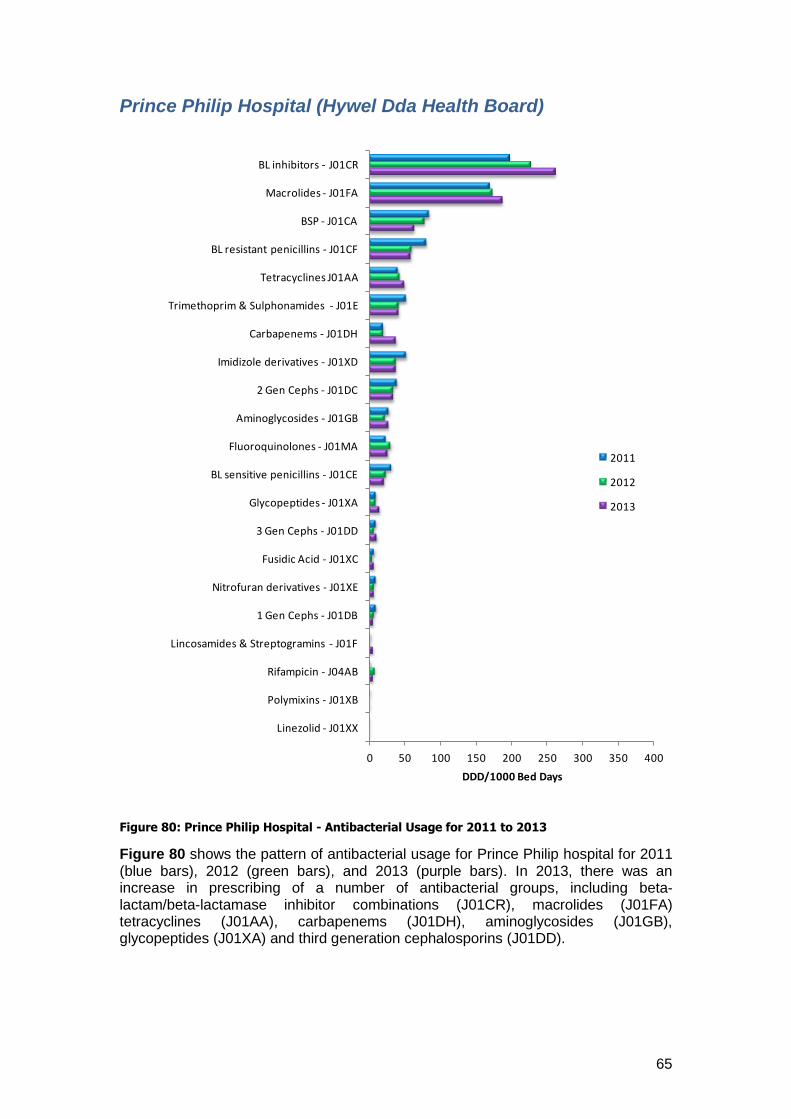
65
Prince Philip Hospital (Hywel Dda Health Board)
Figure 80: Prince Philip Hospital - Antibacterial Usage for 2011 to 2013
Figure 80 shows the pattern of antibacterial usage for Prince Philip hospital for 2011 (blue bars), 2012 (green bars), and 2013 (purple bars). In 2013, there was an increase in prescribing of a number of antibacterial groups, including beta-lactam/beta-lactamase inhibitor combinations (J01CR), macrolides (J01FA) tetracyclines (J01AA), carbapenems (J01DH), aminoglycosides (J01GB), glycopeptides (J01XA) and third generation cephalosporins (J01DD).
0 50 100 150 200 250 300 350 400
Linezolid - J01XX
Polymixins - J01XB
Rifampicin - J04AB
Lincosamides & Streptogramins - J01F
1 Gen Cephs - J01DB
Nitrofuran derivatives - J01XE
Fusidic Acid - J01XC
3 Gen Cephs - J01DD
Glycopeptides - J01XA
BL sensitive penicillins - J01CE
Fluoroquinolones - J01MA
Aminoglycosides - J01GB
2 Gen Cephs - J01DC
Imidizole derivatives - J01XD
Carbapenems - J01DH
Trimethoprim & Sulphonamides - J01E
Tetracyclines J01AA
BL resistant penicillins - J01CF
BSP - J01CA
Macrolides - J01FA
BL inhibitors - J01CR
DDD/1000 Bed Days
2011
2012
2013
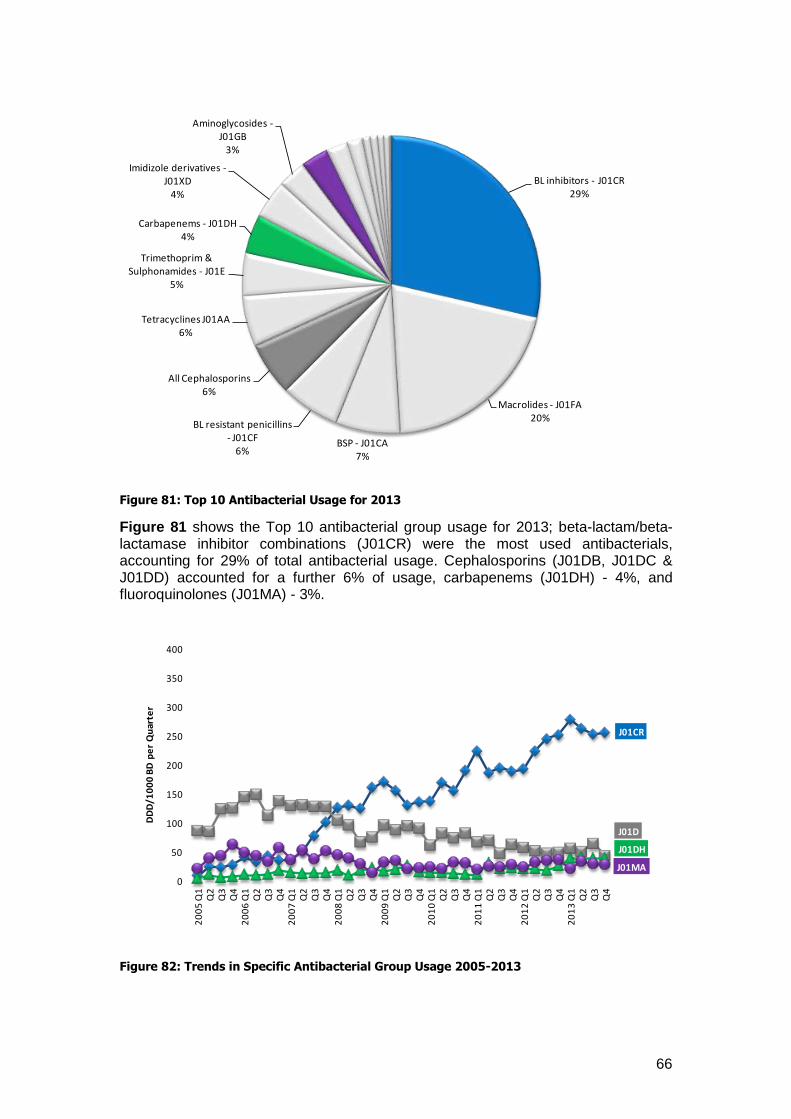
66
Figure 81: Top 10 Antibacterial Usage for 2013
Figure 81 shows the Top 10 antibacterial group usage for 2013; beta-lactam/beta-lactamase inhibitor combinations (J01CR) were the most used antibacterials, accounting for 29% of total antibacterial usage. Cephalosporins (J01DB, J01DC & J01DD) accounted for a further 6% of usage, carbapenems (J01DH) - 4%, and fluoroquinolones (J01MA) - 3%.
Figure 82: Trends in Specific Antibacterial Group Usage 2005-2013
BL inhibitors - J01CR29%
Macrolides - J01FA20%
BSP - J01CA7%
BL resistant penicillins - J01CF
6%
All Cephalosporins6%
Tetracyclines J01AA6%
Trimethoprim & Sulphonamides - J01E
5%
Carbapenems - J01DH4%
Imidizole derivatives -J01XD
4%
Aminoglycosides -J01GB
3%
J01CR
J01D
J01DH
J01MA
0
50
100
150
200
250
300
350
400
20
05
Q1
Q2
Q3
Q4
20
06
Q1
Q2
Q3
Q4
20
07
Q1
Q2
Q3
Q4
20
08
Q1
Q2
Q3
Q4
20
09
Q1
Q2
Q3
Q4
20
10
Q1
Q2
Q3
Q4
20
11
Q1
Q2
Q3
Q4
20
12
Q1
Q2
Q3
Q4
20
13
Q1
Q2
Q3
Q4
DD
D/1
00
0 B
D p
er
Qu
arte
r
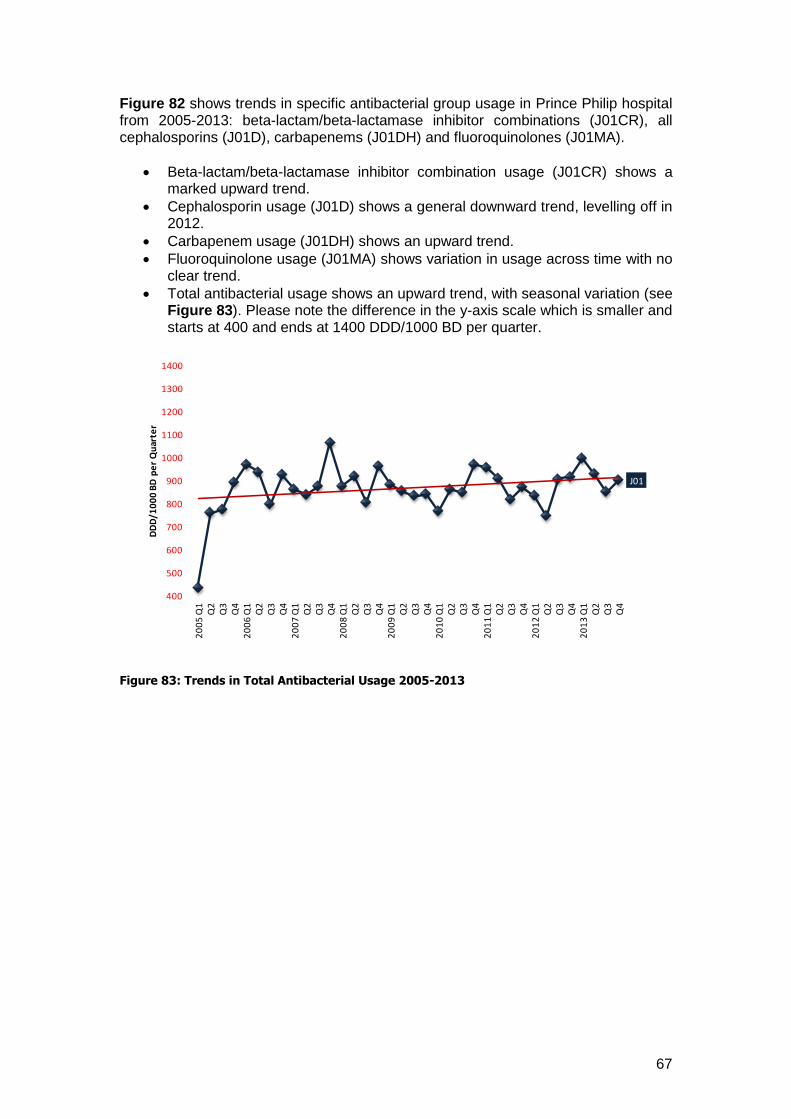
67
Figure 82 shows trends in specific antibacterial group usage in Prince Philip hospital from 2005-2013: beta-lactam/beta-lactamase inhibitor combinations (J01CR), all cephalosporins (J01D), carbapenems (J01DH) and fluoroquinolones (J01MA).
Beta-lactam/beta-lactamase inhibitor combination usage (J01CR) shows a marked upward trend.
Cephalosporin usage (J01D) shows a general downward trend, levelling off in 2012.
Carbapenem usage (J01DH) shows an upward trend.
Fluoroquinolone usage (J01MA) shows variation in usage across time with no clear trend.
Total antibacterial usage shows an upward trend, with seasonal variation (see Figure 83). Please note the difference in the y-axis scale which is smaller and starts at 400 and ends at 1400 DDD/1000 BD per quarter.
Figure 83: Trends in Total Antibacterial Usage 2005-2013
J01
400
500
600
700
800
900
1000
1100
1200
1300
1400
20
05
Q1
Q2
Q3
Q4
20
06
Q1
Q2
Q3
Q4
20
07
Q1
Q2
Q3
Q4
20
08
Q1
Q2
Q3
Q4
20
09
Q1
Q2
Q3
Q4
20
10
Q1
Q2
Q3
Q4
20
11
Q1
Q2
Q3
Q4
20
12
Q1
Q2
Q3
Q4
20
13
Q1
Q2
Q3
Q4
DD
D/1
00
0 B
D p
er
Qu
arte
r

68
Withybush Hospital (Hywel Dda Health Board)
Figure 84: Withybush Hospital - Antibacterial Usage for 2011 to 2013
Figure 84 shows the pattern of antibacterial usage for Withybush hospital for 2011 (blue bars), 2012 (green bars), and 2013 (purple bars). In 2013, there was an increase in prescribing of a number of antibacterial groups, including beta-lactam/beta-lactamase inhibitor combinations (J01CR), macrolides (J01FA), imidazole derivatives (J01XD), tetracyclines (J01AA), trimethoprim group (J01E), first and second generation cephalosporins (J01DB & J01DC), carbapenems (J01DH), aminoglycosides (J01GB) and glycopeptides (J01XA).
0 50 100 150 200 250 300 350 400
Linezolid - J01XX
Polymixins - J01XB
Nitrofuran derivatives - J01XE
Fusidic Acid - J01XC
3 Gen Cephs - J01DD
Glycopeptides - J01XA
Rifampicin - J04AB
Aminoglycosides - J01GB
BL sensitive penicillins - J01CE
Carbapenems - J01DH
Lincosamides & Streptogramins - J01F
1 Gen Cephs - J01DB
2 Gen Cephs - J01DC
Trimethoprim & Sulphonamides - J01E
Fluoroquinolones - J01MA
Tetracyclines J01AA
BSP - J01CA
BL resistant penicillins - J01CF
Imidizole derivatives - J01XD
Macrolides - J01FA
BL inhibitors - J01CR
DDD/1000 Bed Days
2011
2012
2013
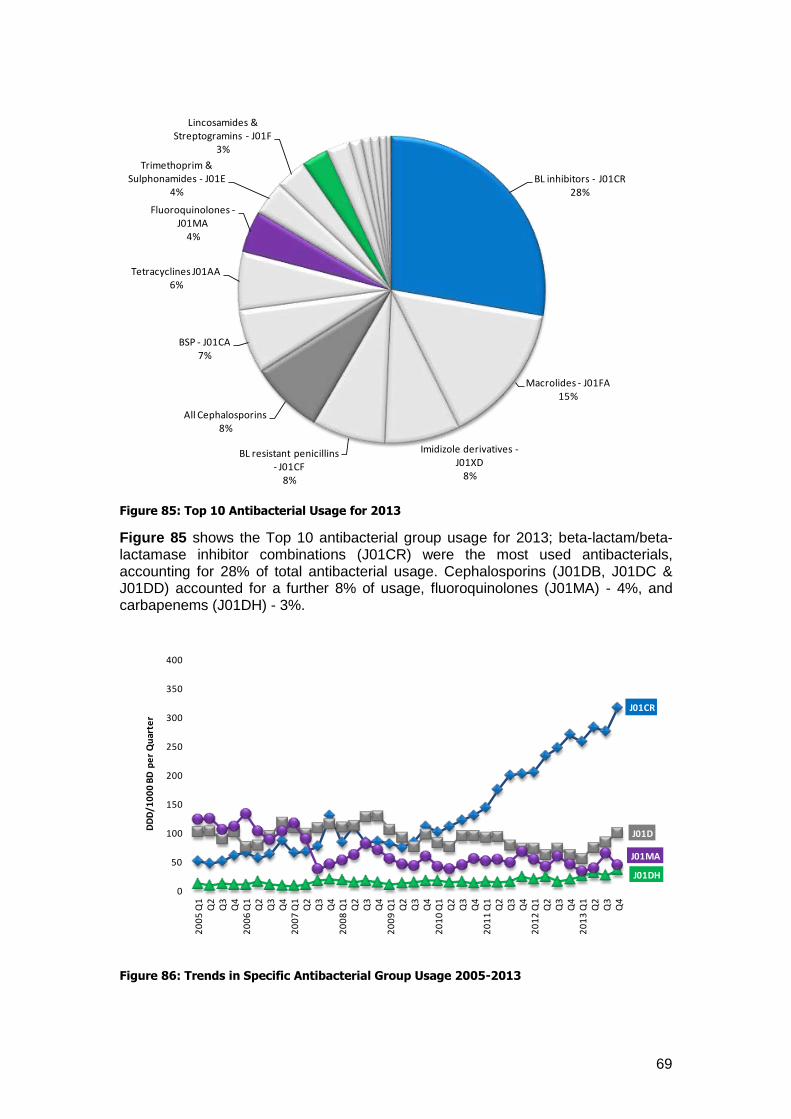
69
Figure 85: Top 10 Antibacterial Usage for 2013
Figure 85 shows the Top 10 antibacterial group usage for 2013; beta-lactam/beta-lactamase inhibitor combinations (J01CR) were the most used antibacterials, accounting for 28% of total antibacterial usage. Cephalosporins (J01DB, J01DC & J01DD) accounted for a further 8% of usage, fluoroquinolones (J01MA) - 4%, and carbapenems (J01DH) - 3%.
Figure 86: Trends in Specific Antibacterial Group Usage 2005-2013
BL inhibitors - J01CR28%
Macrolides - J01FA15%
Imidizole derivatives -J01XD
8%
BL resistant penicillins - J01CF
8%
All Cephalosporins8%
BSP - J01CA7%
Tetracyclines J01AA6%
Fluoroquinolones -J01MA
4%
Trimethoprim & Sulphonamides - J01E
4%
Lincosamides & Streptogramins - J01F
3%
J01CR
J01D
J01DH
J01MA
0
50
100
150
200
250
300
350
400
20
05
Q1
Q2
Q3
Q4
20
06
Q1
Q2
Q3
Q4
20
07
Q1
Q2
Q3
Q4
20
08
Q1
Q2
Q3
Q4
20
09
Q1
Q2
Q3
Q4
20
10
Q1
Q2
Q3
Q4
20
11
Q1
Q2
Q3
Q4
20
12
Q1
Q2
Q3
Q4
20
13
Q1
Q2
Q3
Q4
DD
D/1
00
0 B
D p
er
Qu
arte
r
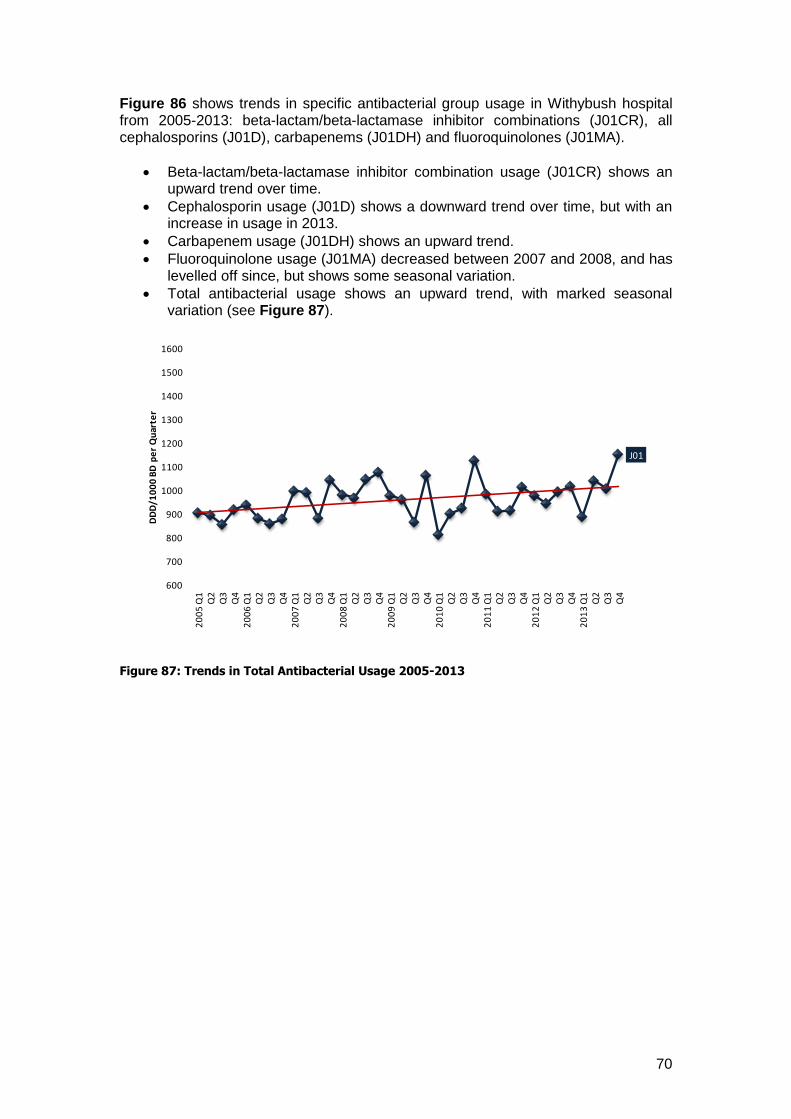
70
Figure 86 shows trends in specific antibacterial group usage in Withybush hospital from 2005-2013: beta-lactam/beta-lactamase inhibitor combinations (J01CR), all cephalosporins (J01D), carbapenems (J01DH) and fluoroquinolones (J01MA).
Beta-lactam/beta-lactamase inhibitor combination usage (J01CR) shows an upward trend over time.
Cephalosporin usage (J01D) shows a downward trend over time, but with an increase in usage in 2013.
Carbapenem usage (J01DH) shows an upward trend.
Fluoroquinolone usage (J01MA) decreased between 2007 and 2008, and has levelled off since, but shows some seasonal variation.
Total antibacterial usage shows an upward trend, with marked seasonal variation (see Figure 87).
Figure 87: Trends in Total Antibacterial Usage 2005-2013
J01
600
700
800
900
1000
1100
1200
1300
1400
1500
1600
20
05
Q1
Q2
Q3
Q4
20
06
Q1
Q2
Q3
Q4
20
07
Q1
Q2
Q3
Q4
20
08
Q1
Q2
Q3
Q4
20
09
Q1
Q2
Q3
Q4
20
10
Q1
Q2
Q3
Q4
20
11
Q1
Q2
Q3
Q4
20
12
Q1
Q2
Q3
Q4
20
13
Q1
Q2
Q3
Q4
DD
D/1
00
0 B
D p
er
Qu
arte
r
71
Acknowledgments We would like to acknowledge our colleagues in Wales for their encouragement, support and help in the production of this report. In particular our thanks go to: The Heads of Pharmacy and pharmacy staff at:
Bronglais Hospital, Aberystwyth
Glangwili Hospital, Carmarthen
Llandough Hospital, Cardiff
Morriston Hospital, Swansea
Neath Port Talbot Hospital, Port Talbot
Nevill Hall Hospital, Abergavenny
Prince Charles Hospital, Merthyr
Prince Philip Hospital, Llanelli
Princess of Wales Hospital, Bridgend
Royal Glamorgan Hospital, Llantrisant
Royal Gwent Hospital, Newport
Singleton Hospital, Swansea
University Hospital of Wales, Cardiff
Withybush General Hospital, Haverfordwest
Wrexham Maelor Hospital, Wrexham
Ysbyty Gwynedd Bangor
Ysbyty Glan Clwyd Rhyl Special thanks to:
Robin Burfield, MEDUSA project, NWIS
Chris Ollier, Public Health Wales Informatics, Cardiff