Embed Size (px)
Citation preview
High-amylose wheat lowers the postprandial glycemic response to bread in healthy adults
A report for Arista Cereal Technologies
Final report 25th April 2018
Damien Belobrajdic, Bradley Klingner and Anthony Bird.
Commercial-in-confidence
HEALTH AND BIOSECURITY
CSIRO Health and Biosecurity
Citation
Belobrajdic DP, Klingner B, Bird AR (2018) High-amylose wheat lowers the postprandial glycemic
response to bread in healthy adults. CSIRO, Australia.
Copyright
© Commonwealth Scientific and Industrial Research Organisation 2018. To the extent permitted
by law, all rights are reserved and no part of this publication covered by copyright may be
reproduced or copied in any form or by any means except with the written permission of CSIRO.
Important disclaimer
CSIRO advises that the information contained in this publication comprises general statements
based on scientific research. The reader is advised and needs to be aware that such information
may be incomplete or unable to be used in any specific situation. No reliance or actions must
therefore be made on that information without seeking prior expert professional, scientific and
technical advice. To the extent permitted by law, CSIRO (including its employees and consultants)
excludes all liability to any person for any consequences, including but not limited to all losses,
damages, costs, expenses and any other compensation, arising directly or indirectly from using this
publication (in part or in whole) and any information or material contained in it.
CSIRO is committed to providing web accessible content wherever possible. If you are having
difficulties with accessing this document please contact [email protected].
High-amylose wheat lowers the postprandial glycemic response to bread in healthy adults | i
Contents
Executive summary ......................................................................................................................... 1
1 Background ......................................................................................................................... 2
2 Methods .............................................................................................................................. 3
2.1 Study population ................................................................................................... 3
2.2 Recruitment and screening ................................................................................... 5
2.3 Study design and intervention .............................................................................. 5
2.4 Biochemical measures ........................................................................................... 7
2.5 Satiety and craving measurement ......................................................................... 7
2.6 Statistical analyses ................................................................................................. 8
3 Results ............................................................................................................................... 9
3.1 Baseline characteristics of study participants ....................................................... 9
3.2 Amylose content of bread altered glycemic, insulinemic and incretin response . 9
3.3 Refinement of flour did not influence glycemic, insulinemic and incretin
response in breads .............................................................................................................. 9
3.4 Amylose content did not affect satiety ................................................................. 9
3.5 Intestinal fermentation ....................................................................................... 10
3.6 Amylose content and flour processing did not affect markers of oxidative stress
and inflammation ............................................................................................................. 10
4 Discussion ......................................................................................................................... 23
5 Summary ........................................................................................................................... 26
Acknowledgments ......................................................................................................................... 27
References ............................................................................................................................. 28
High-amylose wheat lowers the postprandial glycemic response to bread in healthy adults | ii
Tables
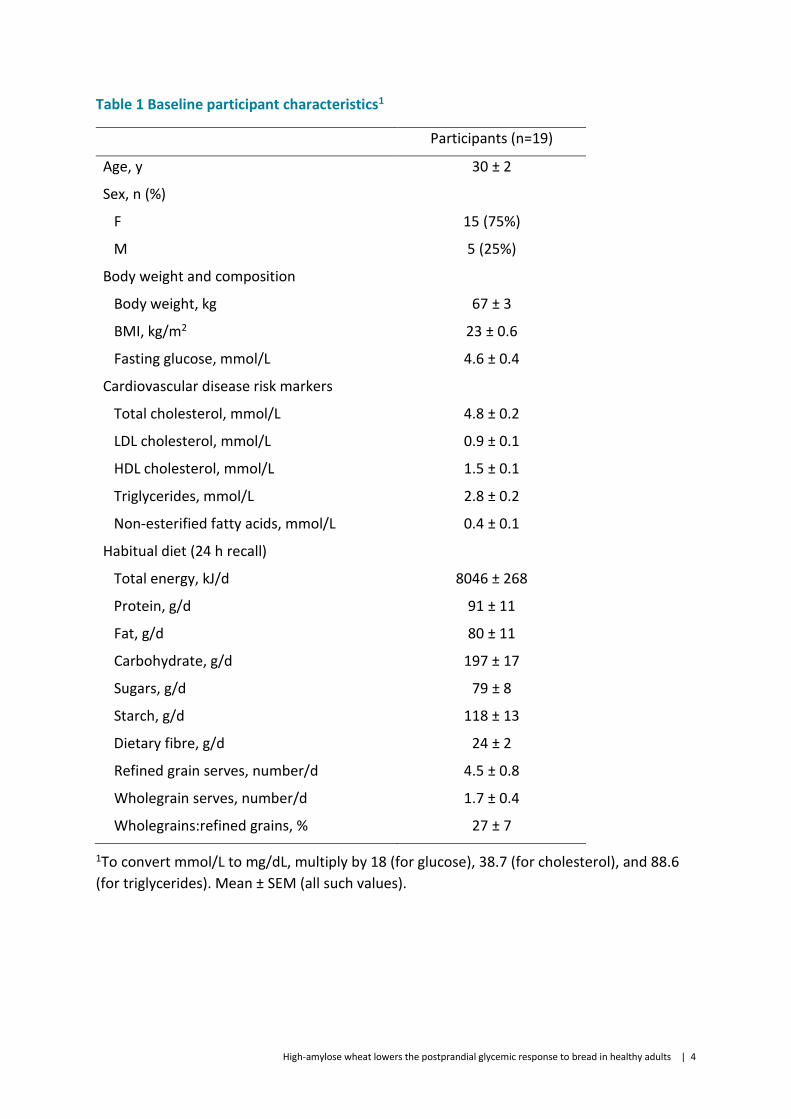
Table 1 Baseline participant characteristics1 .................................................................................. 4
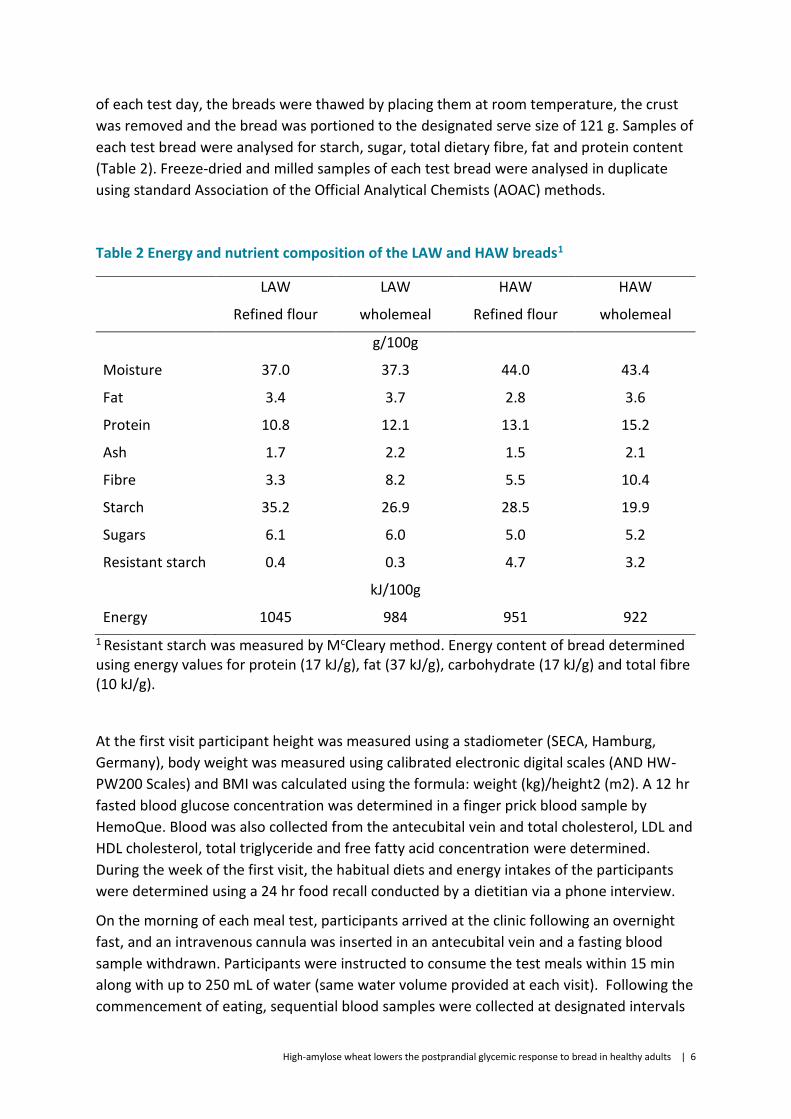
Table 2 Energy and nutrient composition of the LAW and HAW breads1 ...................................... 6
Figures
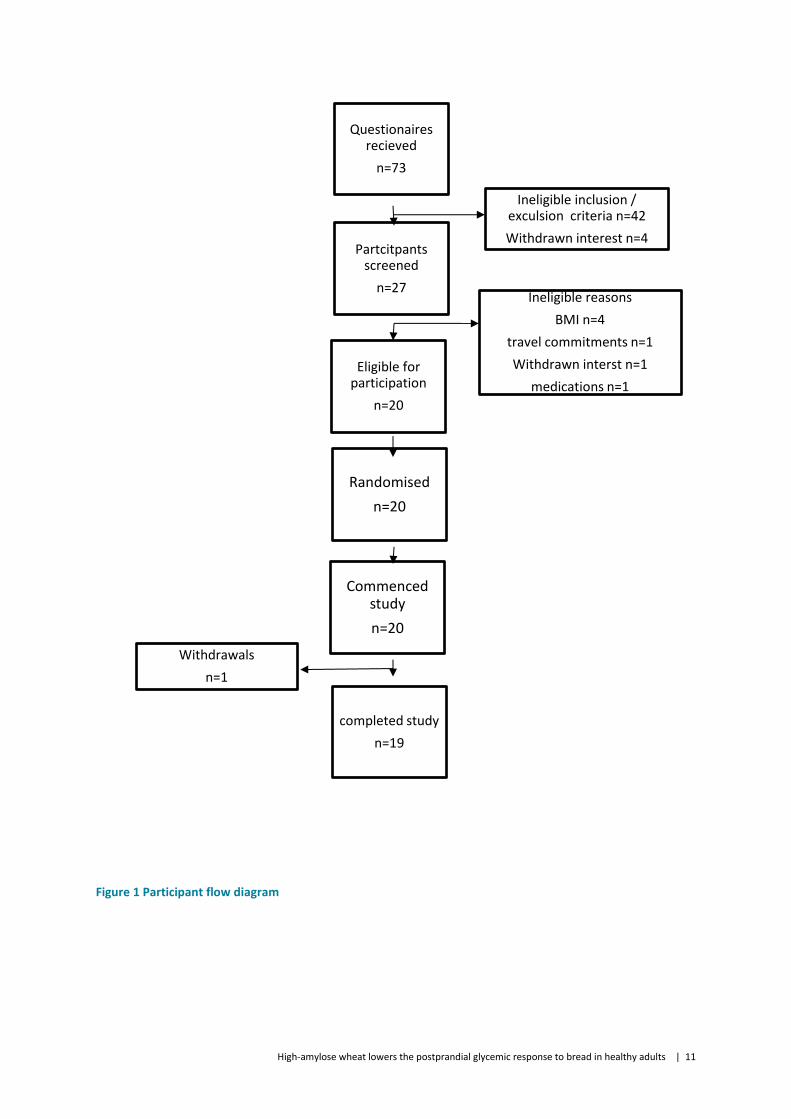
Figure 1 Participant flow diagram ................................................................................................. 11
Figure 2 Mean ± SE glycemic response after consumption of breads made from LAW or HAW
flour. .............................................................................................................................................. 12
Figure 3 Mean ± SE insulinemic response after the consumption of breads made from LAW or
HAW flour. ..................................................................................................................................... 13
Figure 4 Mean ± SE gastric inhibitory peptide (GIP) response after the consumption of breads
made from LAW or HAW flour. ..................................................................................................... 14
Figure 5 Mean ± SE glucagon-like peptide-1 (GLP-1) response after the consumption of breads
made from LAW or HAW flour. ..................................................................................................... 15
Figure 6 Changes in satiety at (a) 30, (b) 60, (c) 120 and (d) 180 min after the consumption of
breads made from LAW or HAW flour. ......................................................................................... 16
Figure 7 Changes in cravings at 30 and 60 min after the consumption of breads made from LAW
or HAW flour. ................................................................................................................................ 17
Figure 8 Mean ± SE ghrelin responses (a) and area-under-the-curve (b) after the consumption of
breads made from low amylose wheat (LAW) or high amylose wheat (HAW) flour. .................. 18
Figure 9 Mean ± SE breath hydrogen response after the consumption of breads made from LAW
or HAW flour. ................................................................................................................................ 19
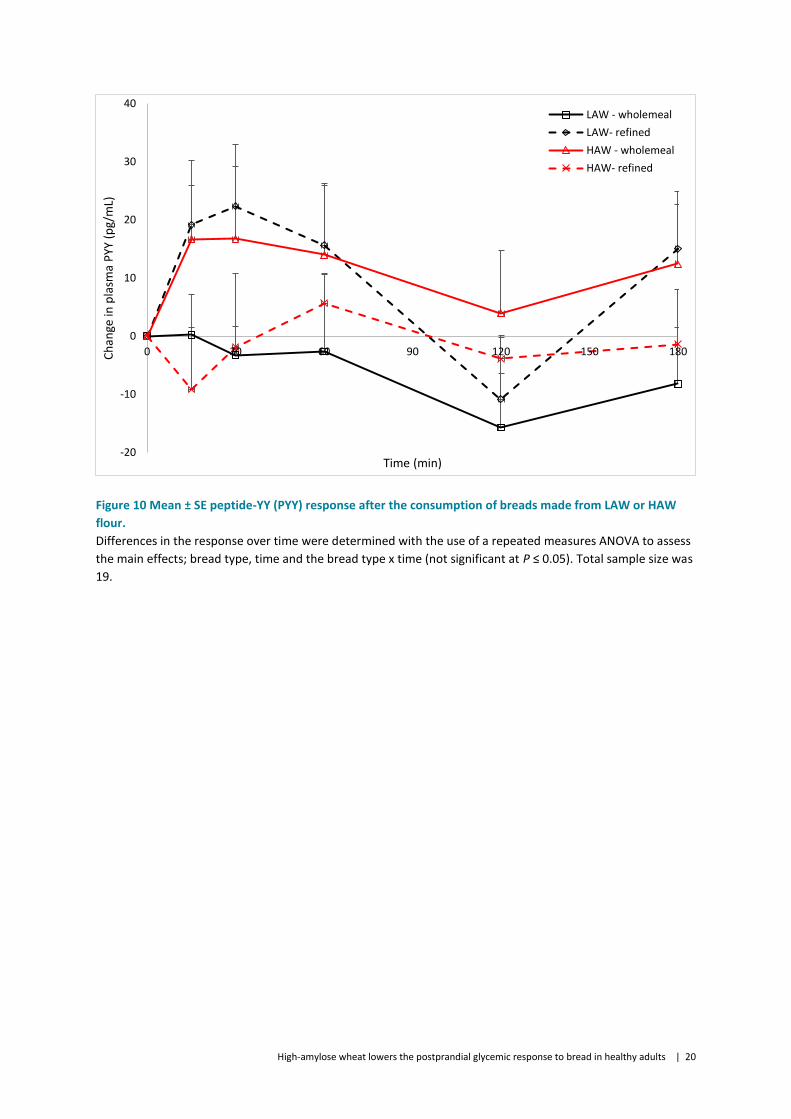
Figure 10 Mean ± SE peptide-YY (PYY) response after the consumption of breads made from
LAW or HAW flour. ........................................................................................................................ 20
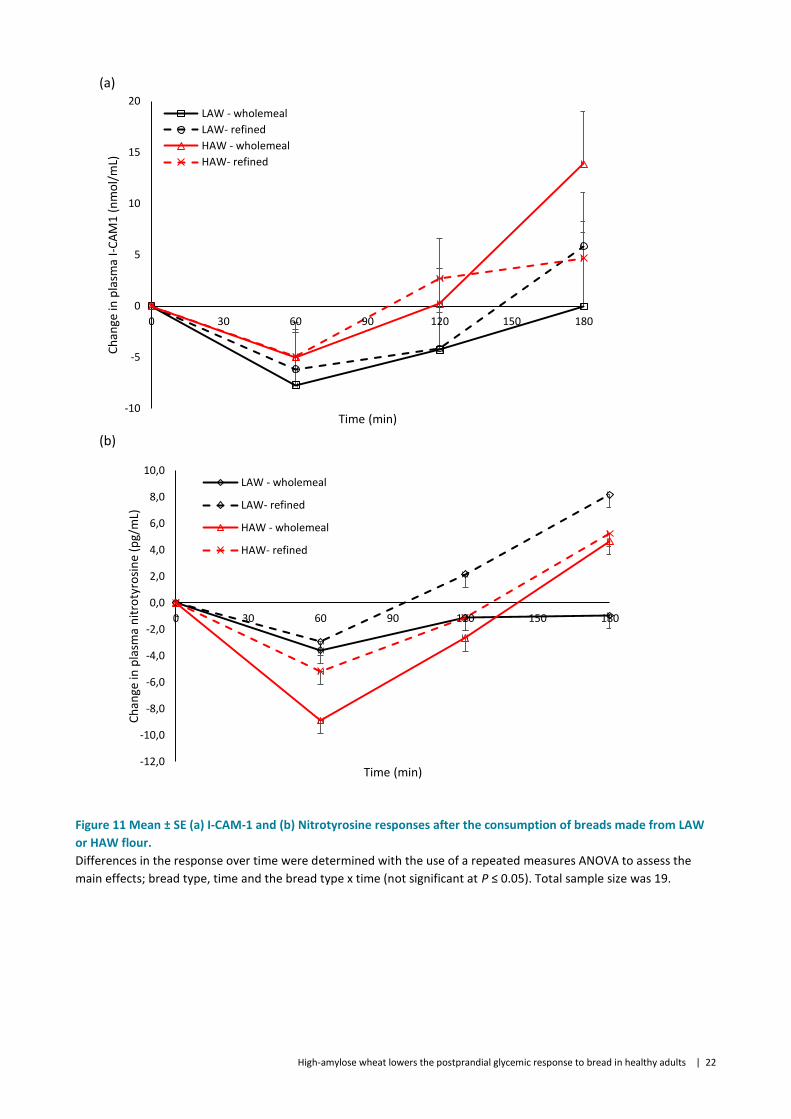
Figure 11 Mean ± SE (a) I-CAM-1 and (b) Nitrotyrosine responses after the consumption of
breads made from LAW or HAW flour. ......................................................................................... 22
High-amylose wheat lowers the postprandial glycemic response to bread in healthy adults | 1
Executive summary
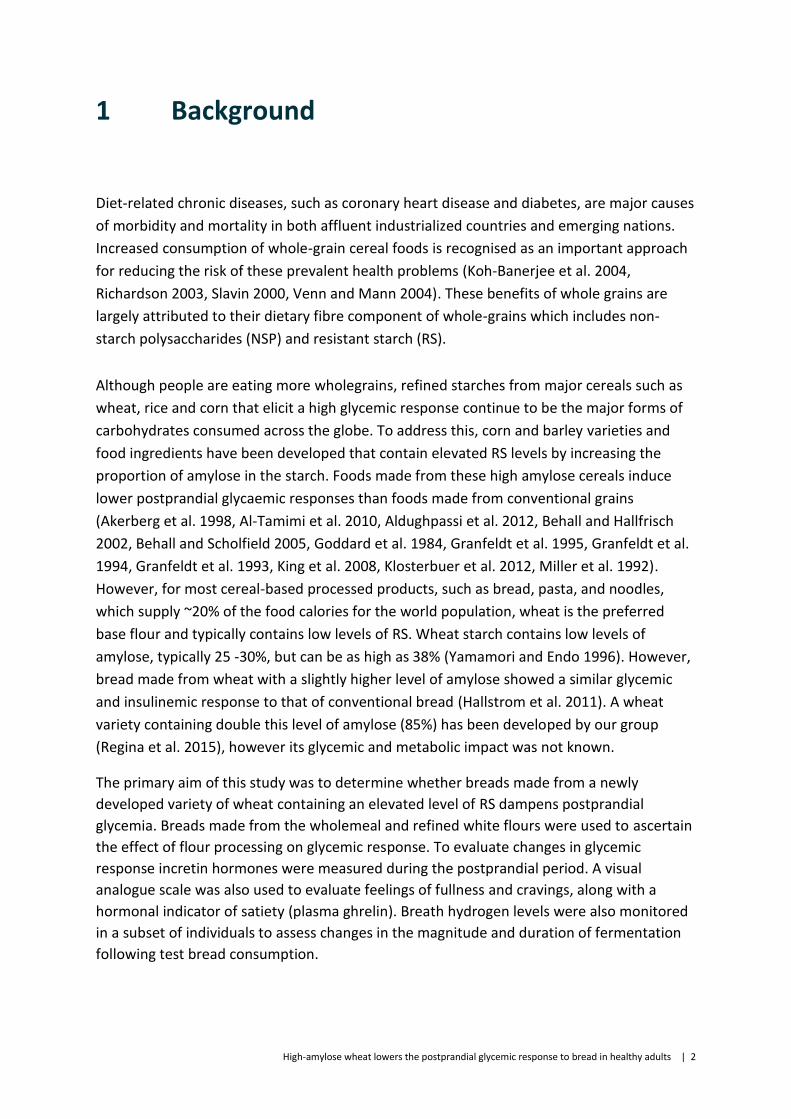
This report describes a randomised, double-blinded, crossover controlled study that
determined whether breads made from High Amylose Wheat (HAW) dampen postprandial
glycemia compared to conventional wheat (Low Amylose Wheat, LAW) breads.
Replacing conventional with high amylose wheat flour is an effective strategy for lowering
postprandial glycemic and insulinemic responses to bread.
Substitution of refined flour for wholemeal, had no effect on glycemia or any of the other
metabolic endpoints measured.
The amylose contents of the breads did not affect markers of satiety.
Further benefit from using high amylose flour in other wheat based food products such as
ready-to-eat breakfast cereals and bars, noodles and doughs may result in the lowering of
the glycemic impact of a range of different foods and deserves further investigation.
High-amylose wheat lowers the postprandial glycemic response to bread in healthy adults | 2
1 Background
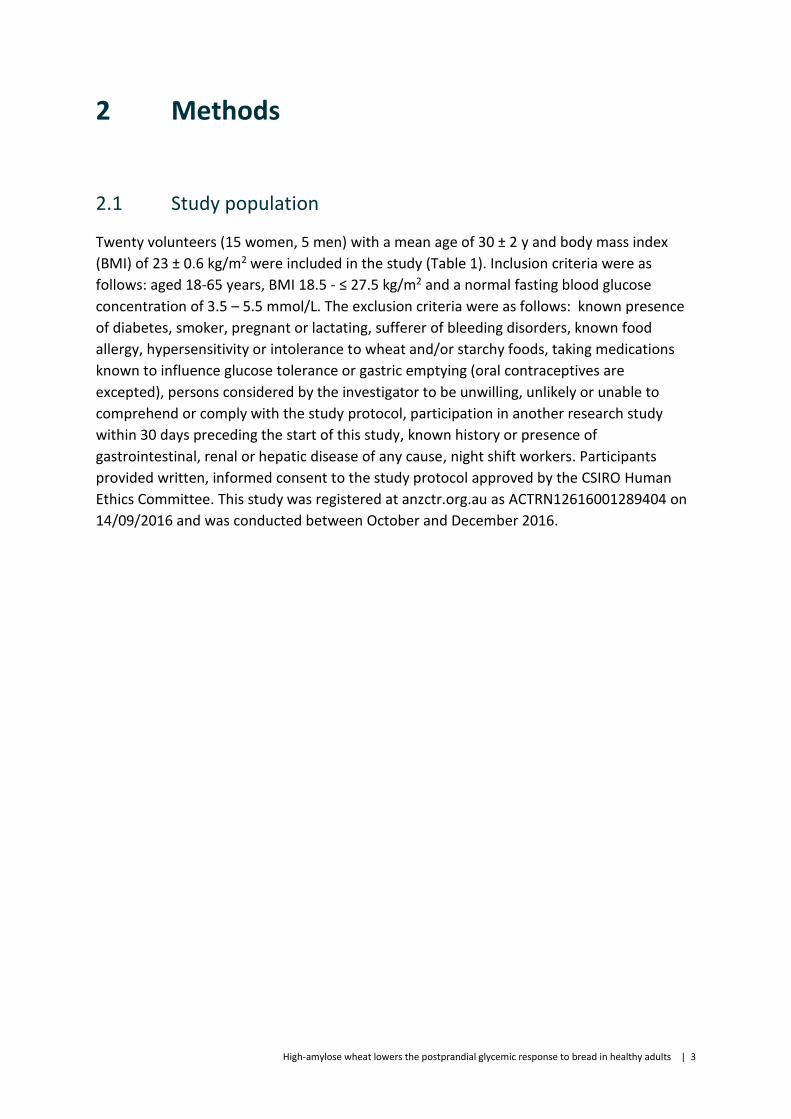
Diet-related chronic diseases, such as coronary heart disease and diabetes, are major causes
of morbidity and mortality in both affluent industrialized countries and emerging nations.
Increased consumption of whole-grain cereal foods is recognised as an important approach
for reducing the risk of these prevalent health problems (Koh-Banerjee et al. 2004,
Richardson 2003, Slavin 2000, Venn and Mann 2004). These benefits of whole grains are
largely attributed to their dietary fibre component of whole-grains which includes non-
starch polysaccharides (NSP) and resistant starch (RS).
Although people are eating more wholegrains, refined starches from major cereals such as
wheat, rice and corn that elicit a high glycemic response continue to be the major forms of
carbohydrates consumed across the globe. To address this, corn and barley varieties and
food ingredients have been developed that contain elevated RS levels by increasing the
proportion of amylose in the starch. Foods made from these high amylose cereals induce
lower postprandial glycaemic responses than foods made from conventional grains
(Akerberg et al. 1998, Al-Tamimi et al. 2010, Aldughpassi et al. 2012, Behall and Hallfrisch
2002, Behall and Scholfield 2005, Goddard et al. 1984, Granfeldt et al. 1995, Granfeldt et al.
1994, Granfeldt et al. 1993, King et al. 2008, Klosterbuer et al. 2012, Miller et al. 1992).
However, for most cereal-based processed products, such as bread, pasta, and noodles,
which supply ~20% of the food calories for the world population, wheat is the preferred
base flour and typically contains low levels of RS. Wheat starch contains low levels of
amylose, typically 25 -30%, but can be as high as 38% (Yamamori and Endo 1996). However,
bread made from wheat with a slightly higher level of amylose showed a similar glycemic
and insulinemic response to that of conventional bread (Hallstrom et al. 2011). A wheat
variety containing double this level of amylose (85%) has been developed by our group
(Regina et al. 2015), however its glycemic and metabolic impact was not known.
The primary aim of this study was to determine whether breads made from a newly
developed variety of wheat containing an elevated level of RS dampens postprandial
glycemia. Breads made from the wholemeal and refined white flours were used to ascertain
the effect of flour processing on glycemic response. To evaluate changes in glycemic
response incretin hormones were measured during the postprandial period. A visual
analogue scale was also used to evaluate feelings of fullness and cravings, along with a
hormonal indicator of satiety (plasma ghrelin). Breath hydrogen levels were also monitored
in a subset of individuals to assess changes in the magnitude and duration of fermentation
following test bread consumption.
High-amylose wheat lowers the postprandial glycemic response to bread in healthy adults | 3
2 Methods
2.1 Study population
Twenty volunteers (15 women, 5 men) with a mean age of 30 ± 2 y and body mass index
(BMI) of 23 ± 0.6 kg/m2 were included in the study (Table 1). Inclusion criteria were as
follows: aged 18-65 years, BMI 18.5 - ≤ 27.5 kg/m2 and a normal fasting blood glucose
concentration of 3.5 – 5.5 mmol/L. The exclusion criteria were as follows: known presence
of diabetes, smoker, pregnant or lactating, sufferer of bleeding disorders, known food
allergy, hypersensitivity or intolerance to wheat and/or starchy foods, taking medications
known to influence glucose tolerance or gastric emptying (oral contraceptives are
excepted), persons considered by the investigator to be unwilling, unlikely or unable to
comprehend or comply with the study protocol, participation in another research study
within 30 days preceding the start of this study, known history or presence of
gastrointestinal, renal or hepatic disease of any cause, night shift workers. Participants
provided written, informed consent to the study protocol approved by the CSIRO Human
Ethics Committee. This study was registered at anzctr.org.au as ACTRN12616001289404 on
14/09/2016 and was conducted between October and December 2016.
High-amylose wheat lowers the postprandial glycemic response to bread in healthy adults | 4
Table 1 Baseline participant characteristics1
Participants (n=19)
Age, y 30 ± 2
Sex, n (%)
F 15 (75%)
M 5 (25%)
Body weight and composition
Body weight, kg 67 ± 3
BMI, kg/m2 23 ± 0.6
Fasting glucose, mmol/L 4.6 ± 0.4
Cardiovascular disease risk markers
Total cholesterol, mmol/L 4.8 ± 0.2
LDL cholesterol, mmol/L 0.9 ± 0.1
HDL cholesterol, mmol/L 1.5 ± 0.1
Triglycerides, mmol/L 2.8 ± 0.2
Non-esterified fatty acids, mmol/L 0.4 ± 0.1
Habitual diet (24 h recall)
Total energy, kJ/d 8046 ± 268
Protein, g/d 91 ± 11
Fat, g/d 80 ± 11
Carbohydrate, g/d 197 ± 17
Sugars, g/d 79 ± 8
Starch, g/d 118 ± 13
Dietary fibre, g/d 24 ± 2
Refined grain serves, number/d 4.5 ± 0.8
Wholegrain serves, number/d 1.7 ± 0.4
Wholegrains:refined grains, % 27 ± 7
1To convert mmol/L to mg/dL, multiply by 18 (for glucose), 38.7 (for cholesterol), and 88.6
(for triglycerides). Mean ± SEM (all such values).
High-amylose wheat lowers the postprandial glycemic response to bread in healthy adults | 5
2.2 Recruitment and screening
The participants were recruited from the CSIRO Biosecurity and Health Research database and the CSIRO website. To facilitate compliance, participants were provided with gift vouchers on the completion of the study to an amount corresponding to time spent in the study.
Any volunteer who responded to the study advertisements via e-mail or a telephone call
was contacted to determine further interest in study participation. Volunteers were
provided with information about the study design and, if interested, a first screening
telephone questionnaire was administered to determine general eligibility. If eligibility was
established, a pre-screening appointment was scheduled to acquaint them with study
procedures and establish whether their fasting blood glucose level was in the normal range
(3.5 – 5.5 mmol/L). If a potential participant’s characteristics fell within the predetermined
criteria, the individual was invited to commence the study. Seventy-three volunteers were
screened, and 20 participants were enrolled in the study (Figure 1). One volunteer withdrew
on the first visit of the study because they would not allow the nurse to insert the
intravenous cannula into their forearm for blood collection.
2.3 Study design and intervention
A single-centre, randomised, double-blinded, crossover controlled study that involved seven
food challenges was conducted over seven consecutive weeks. Three of the challenges
consisted of a 300 mL glucose drink (Carbotest, Lomb Scientific) that contained 50 g glucose
and was consumed on visits 1, 4 and 7. On visits 2, 3, 5 and 6 there were four bread
challenges. The order of test breads were randomly allocated to each individual using a
Latin square randomisation sequence which included four unique sequences; ABDC, BCAD,
CDBA and DACB. The participants were instructed to maintain their dietary habits and daily
routine for the duration of study (approximately 8 wk), avoiding eating foods high in fibre on
the evening prior to testing and also to avoid heavy exercise on the day before and morning
of each test. Consumption of alcohol was restricted on the day prior to testing.
Participants and clinic staff were blinded to the composition of each test bread and the test
breads were only decoded once data clean up and preliminary statistical analysis were
completed.
The four different wholemeal or refined wheat breads were made from conventional or high
amylose wheat flour using a standard bread recipe. The flour and others ingredients (water,
oil, sugar, salt, yeast and improver) were mixed at low speed for 3 min then at high speed
for 7 min in a spiral kneader (Diosna, Osnabrück, Germany). After 15 min at ambient
temperature, doughs were divided into 560g portions, then shaped, placed into a pan and
proofed at 38°C with 80% humidity for 50 min. Breads were baked at 220°C for 37 min in a
retail oven then allowed to cool for 2 hr before they were packaged. The breads were made
by Limagrain Cereal Ingredients in France and shipped to Australia at -20°C. On the morning
High-amylose wheat lowers the postprandial glycemic response to bread in healthy adults | 6
of each test day, the breads were thawed by placing them at room temperature, the crust
was removed and the bread was portioned to the designated serve size of 121 g. Samples of
each test bread were analysed for starch, sugar, total dietary fibre, fat and protein content
(Table 2). Freeze-dried and milled samples of each test bread were analysed in duplicate
using standard Association of the Official Analytical Chemists (AOAC) methods.
Table 2 Energy and nutrient composition of the LAW and HAW breads1
LAW LAW HAW HAW
Refined flour wholemeal Refined flour wholemeal
g/100g
Moisture 37.0 37.3 44.0 43.4
Fat 3.4 3.7 2.8 3.6
Protein 10.8 12.1 13.1 15.2
Ash 1.7 2.2 1.5 2.1
Fibre 3.3 8.2 5.5 10.4
Starch 35.2 26.9 28.5 19.9
Sugars 6.1 6.0 5.0 5.2
Resistant starch 0.4 0.3 4.7 3.2
kJ/100g
Energy 1045 984 951 922
1 Resistant starch was measured by McCleary method. Energy content of bread determined using energy values for protein (17 kJ/g), fat (37 kJ/g), carbohydrate (17 kJ/g) and total fibre (10 kJ/g).
At the first visit participant height was measured using a stadiometer (SECA, Hamburg,
Germany), body weight was measured using calibrated electronic digital scales (AND HW-
PW200 Scales) and BMI was calculated using the formula: weight (kg)/height2 (m2). A 12 hr
fasted blood glucose concentration was determined in a finger prick blood sample by
HemoQue. Blood was also collected from the antecubital vein and total cholesterol, LDL and
HDL cholesterol, total triglyceride and free fatty acid concentration were determined.
During the week of the first visit, the habitual diets and energy intakes of the participants
were determined using a 24 hr food recall conducted by a dietitian via a phone interview.
On the morning of each meal test, participants arrived at the clinic following an overnight
fast, and an intravenous cannula was inserted in an antecubital vein and a fasting blood
sample withdrawn. Participants were instructed to consume the test meals within 15 min
along with up to 250 mL of water (same water volume provided at each visit). Following the
commencement of eating, sequential blood samples were collected at designated intervals
High-amylose wheat lowers the postprandial glycemic response to bread in healthy adults | 7
(15, 30, 45, 60, 90, 120, 150, 180 min) via the indwelling cannula in the following tubes;
sodium fluoride coated tubes (Vacuette, Greiner bio-one, Austria) for measurement of
glucose, P800 tubes (BD Biosciences, North Ryde, Australia) for measurement of insulin, GIP,
active GLP-1, ghrelin and PYY and serum tubes (Vacuette, Greiner bio-one, Austria) for
measurement of nitrotyrosine and I-CAM-1. Perceived appetite, satiety and mood were
assessed using a visual analogue scale which was completed by participants at 30 min
intervals for 3 h from baseline. Following completion of the sampling phase, the cannula
was removed and participants were provided with light refreshments prior to leaving the
Clinical Research Unit.
Six of the 20 subjects were randomly selected to also provide breath samples so that breath
hydrogen levels could be determined (4 test breads only) using a Gastro+ Gastrolyser
(Bedfont, Rochester, England). Breath hydrogen was measured at baseline and at 30 min
intervals during the blood sampling period (0-180 min). Once the last blood sample was
collected at 3 hr, participants continued to measure their breath hydrogen levels at 30 min
intervals for a further 7 hr (total 10 hr).
2.4 Biochemical measures
Plasma was prepared by centrifugation (GS-6R centrifuge; Beckman Coulter Inc, Brea, CA,
USA) at 2095g for 10 min at 4°C, within 30 min of collection. Serum was left at room
temperature for 30 min to allow for clot formation and then centrifuged at 2850g for 15 min
at 4°C. The resulting plasma/serum was collected and stored at -80°C until analysed.
Samples from each subject were analysed within the same analytic run to reduce variation.
Plasma glucose and serum total cholesterol, triglycerides, HDL-cholesterol, LDL-cholesterol
and NEFA were measured using commercial enzymatic kits (Beckman Coulter Inc, Brea, CA,
USA and Randox Laboratories Ltd, County Antrim, UK) on a Beckman AU480 clinical analyser
(Beckman Coulter Inc, Brea, CA, USA). Plasma insulin, GIP, active GLP-1, ghrelin and PYY
were measured using a magnetic bead Milliplex Human Metabolic Hormone Assay kit
(Millipore), with intra- and inter-assay variability < 10 and <15% respectively. Plasma
nitrotyrosine was measured by ELISA (Immun Diagnostik) with intra- and inter-assay
variability of 6.2 and 7.9%. Plasma sICAM1 was measured by a Human sICAM-1 Platnium
ELISA (EBioscience) with intra- and inter-assay variability of 4.1 and 7.7%.
2.5 Satiety and craving measurement
Satiety was measured via a four-item survey including general hunger, satisfaction, fullness
and desire to eat scales. Each question was answered via a 10-point likert response scale
with higher scores indicating higher satiety levels (i.e., decreased hunger). Total satiety was
calculated as the mean response across all four items at each time point.
Cravings were measured via a four-item survey assessing desire to eat sweet, salty, savoury
and fatty scales. Each question was answered via a 10-point likert response scale with
High-amylose wheat lowers the postprandial glycemic response to bread in healthy adults | 8
higher scores indicating higher cravings (i.e., increased hunger). Total cravings was
calculated as the mean response across all four items at each time point.
2.6 Statistical analyses
The sample size calculation used previous data on glucose incremental areas under the
curves (IAUC, mmol glucose min/L) from low fibre and high fibre foods with an average
standard deviation of 35 mmol and correlation for repeated measures of 0.5, a sample size
of 20 was calculated at 80% power (at P<0.05, two-tailed) to detect a change of 23 units.
Withdrawal of up to 5 participants during the intervention has been allowed whilst
maintaining the ability to detect an acceptable change in IAUC.
All statistical analyses were performed using SPSS (version 23.0), with P ≤ 0.05 considered to
be significant.
Participant characteristic data along with energy and nutrient intake data from visit 1 were
averaged at baseline, data was presented as means ± sem.
The postprandial plasma glucose, hormones, I-CAM-1 and nitrotyrosine response for each
test bread were compared by repeated-measures ANOVA. The IAUCs were calculated for
these analytes using the trapezoidal rule and ignoring the area below the baseline. The
IAUCs were compared by ANOVA using a 2x2 model (amylose x flour processing). The
maximal concentration, time to reach maximal concentration and postprandial response
curves were also calculated for plasma glucose and the data was assessed by ANOVA using a
2x2 model (amylose x flour processing). Breath hydrogen levels were reported as change
from baseline (3 ½ hr following meal consumption) and the change from baseline was
compared between each test bread by a repeated measures ANOVA and Tukey’s pot-hoc
test.
Change in satiety and hunger was assessed at 30, 60, 120 and 180 min post consumption.
At each time point, change was assessed using Analysis of Covariance (ANCOVA). The
relevant hunger or satiety scores were entered as the dependent variable with the baseline
(0 min) entered as a covariate. Treatment (including Glucose) was entered as the
independent factor, with Bonferroni post-hoc comparisons used to explore main treatment
effects when present. A second set of 2x2 models (amylose x flour processing) were also
conducted using ANCOVAs.
High-amylose wheat lowers the postprandial glycemic response to bread in healthy adults | 9
3 Results
3.1 Baseline characteristics of study participants
Participants had fasted blood cholesterol, lipids and glucose in the healthy range (Table 1). The macronutrient composition of the participants’ habitual diet was 25% protein, 22% fat and 53% carbohydrate. The habitual diet was low in fibre (24 g/d) and only 27% of the grain-based foods consumed were wholegrain, which equated to an average of 1.7 wholegrain serves per day (Table 1).
3.2 Amylose level of bread altered glycemic, insulinemic and incretin response
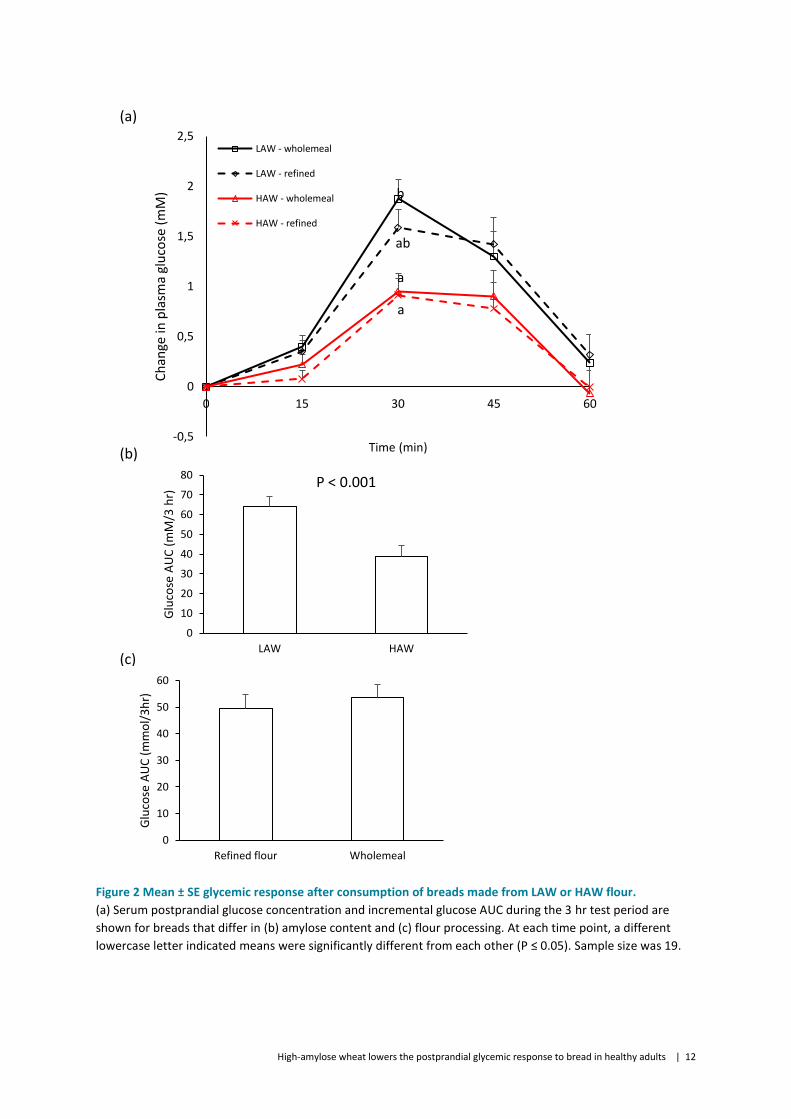
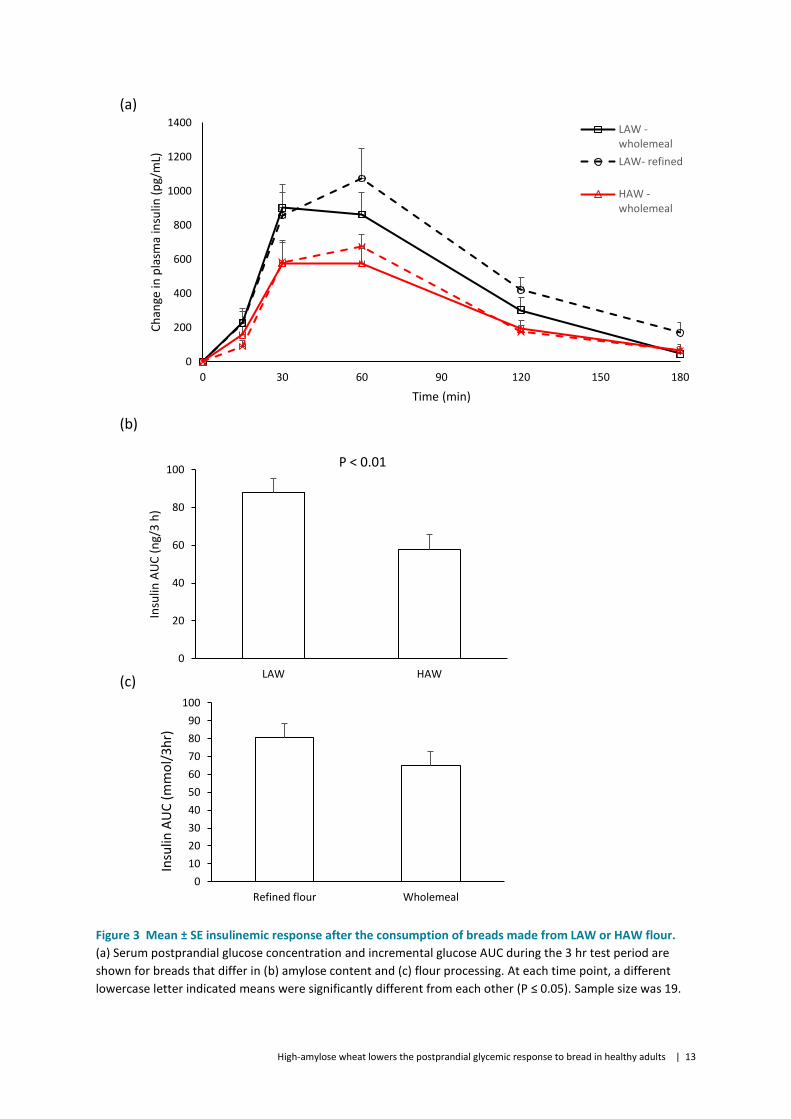
During the 3 hr test period, the HAW breads had a 39% lower glycemic response (Figure 2) and 24% lower insulinemic response (Figure 3) compared to the LAW breads. The reduction in glycemic response for the HAW breads was most evident at 30 min at which the HAW breads had a lower rise in plasma glucose level compared with the wholemeal LAW bread (Figure 2). The insulinemic response was similar for all breads at 15 and 30 min.
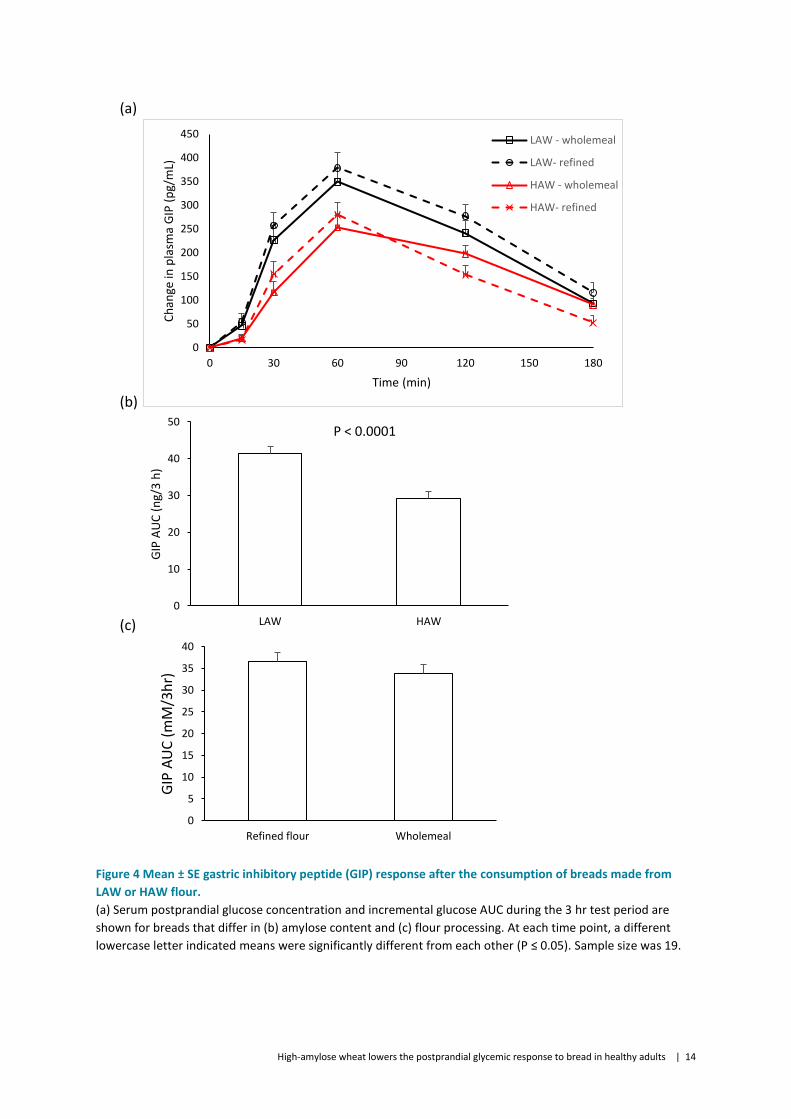
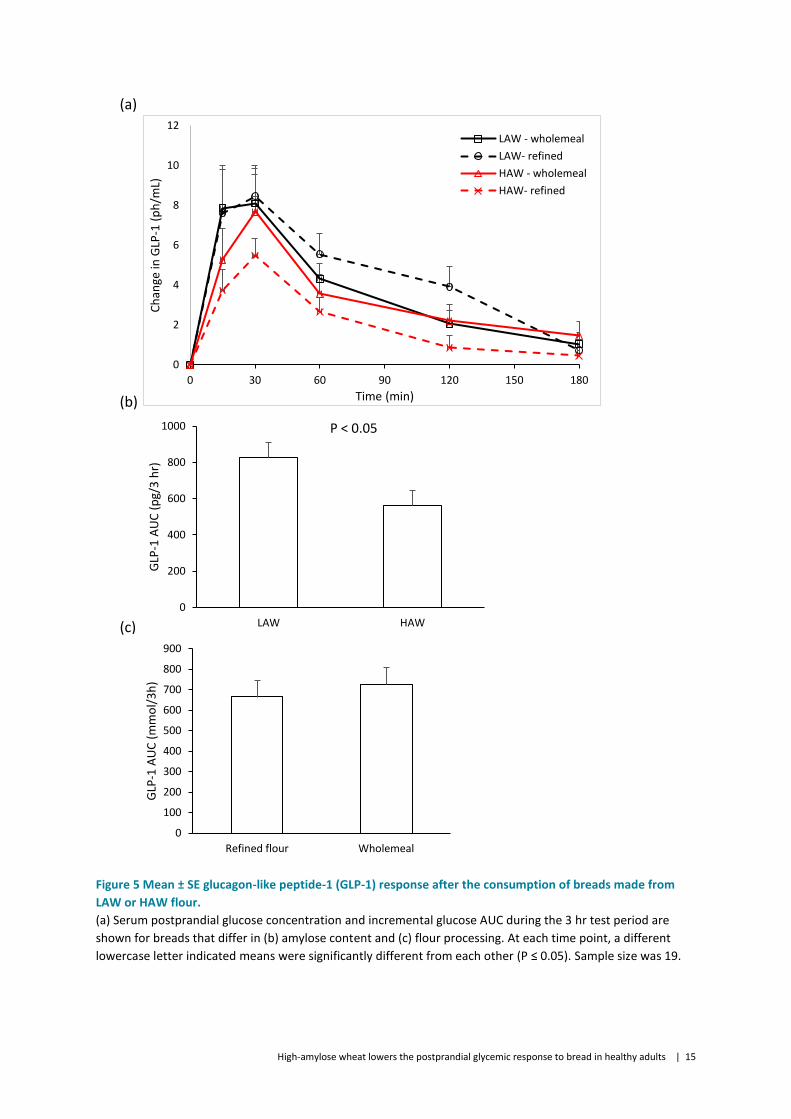
At each time point during the 3 hr test period, the plasma GIP and GLP-1 concentrations were similar for all test breads (Figure 4 and 5). However, the HAW breads had a 30% lower GIP and GLP-1 AUC compared to the LAW breads (Figure 4 and 5).
3.3 Refinement of flour did not influence glycemic, insulinemic and incretin response in breads
The wholemeal and refined flour breads showed similar glycemic and insulinemic response (Figure 2 and 3). The incretin response (GIP and GLP-1) was also similar for the wholemeal and refined flour breads (Figure 4 and 5).
3.4 Amylose content did not affect satiety
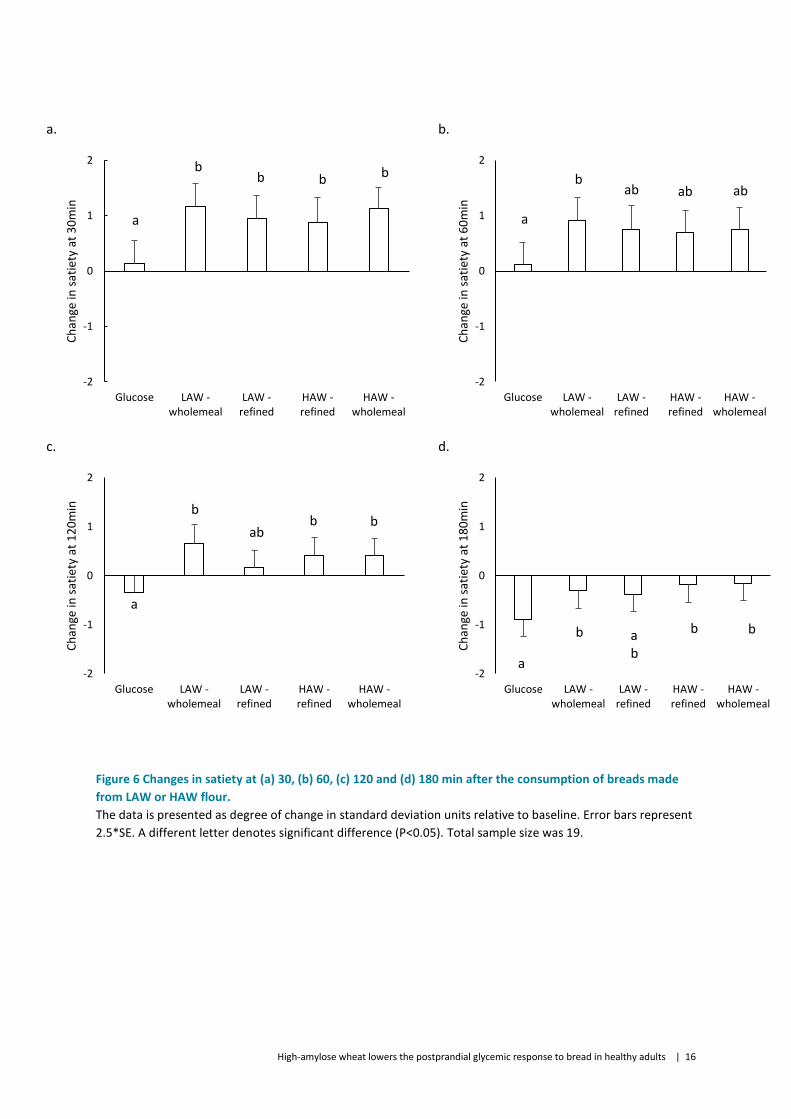
Measures of subjective satiety were different between the treatment groups at 30 min [F(4,79)=6.73,p<.001], 60 min [F(4,82)=3.81,p<.01], 120 min [F(4,83)=7.18,p<.001] and 180 min [F(4,83)=4.63,p<.01] post consumption (Figure 6). At 30 min, satiety was highest following consumption of all test breads compared to the glucose drink (all p<.05). At 60 min, satiety levels remained higher for LAW wholemeal bread compared to the glucose drink (p<.01), but was similar for the other test breads. At 120 and 180 min, satiety levels were higher than glucose for the wholemeal breads (LAW and HAW) and refined wheat breads made from HAW flour. However, during the postprandial period satiety was similar for the four test breads (P>0.05). In addition, flour processing and amylose content had no effect on satiety.
High-amylose wheat lowers the postprandial glycemic response to bread in healthy adults | 10
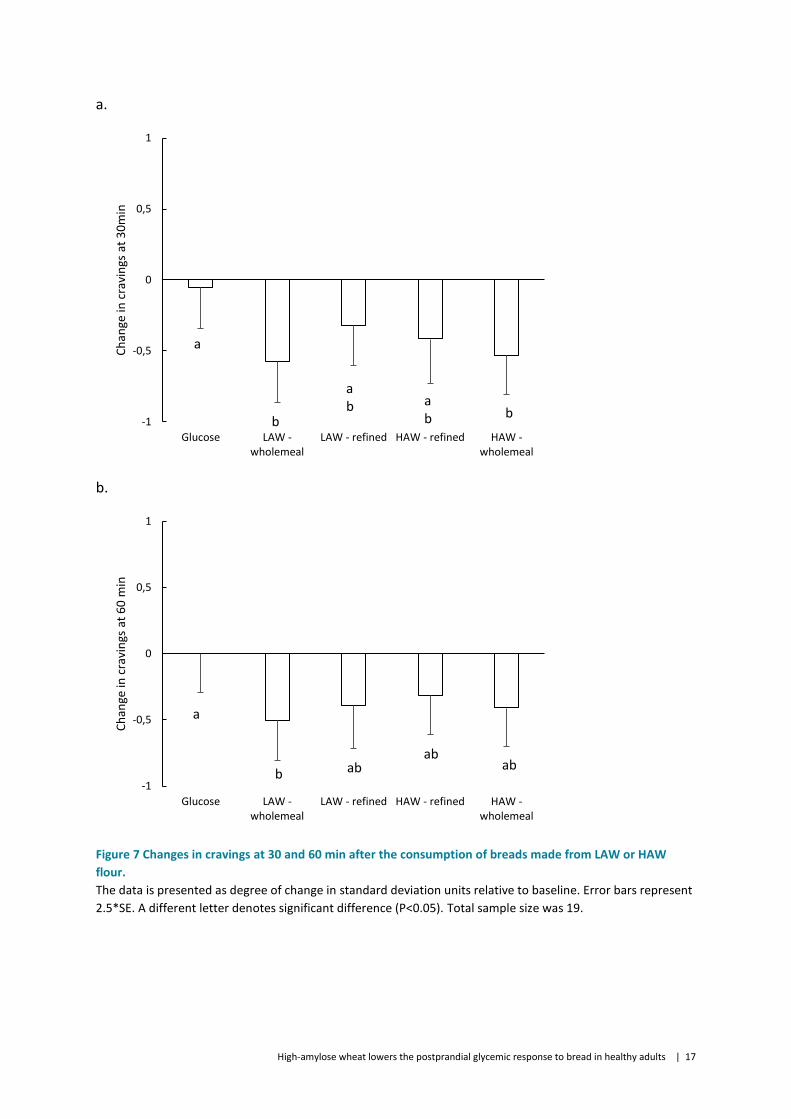
Subjective craving measures at 30 min [F(4,79)=3.34,p<.05] and 60 min [F(4,82)=2.67,p<.05] were different between groups (Figure 7). At 30 min, craving levels were lower only for the LAW and HAW wholegrain breads compared to the glucose drink (all p<.05). At 60 min, only the LAW wholegrain bread had lower craving levels than the glucose drink (p<.05). However, during the postprandial period cravings were similar for the four test breads (all p>.05). Additionally, flour processing and amylose content had no effect on craving levels (all p>.05).
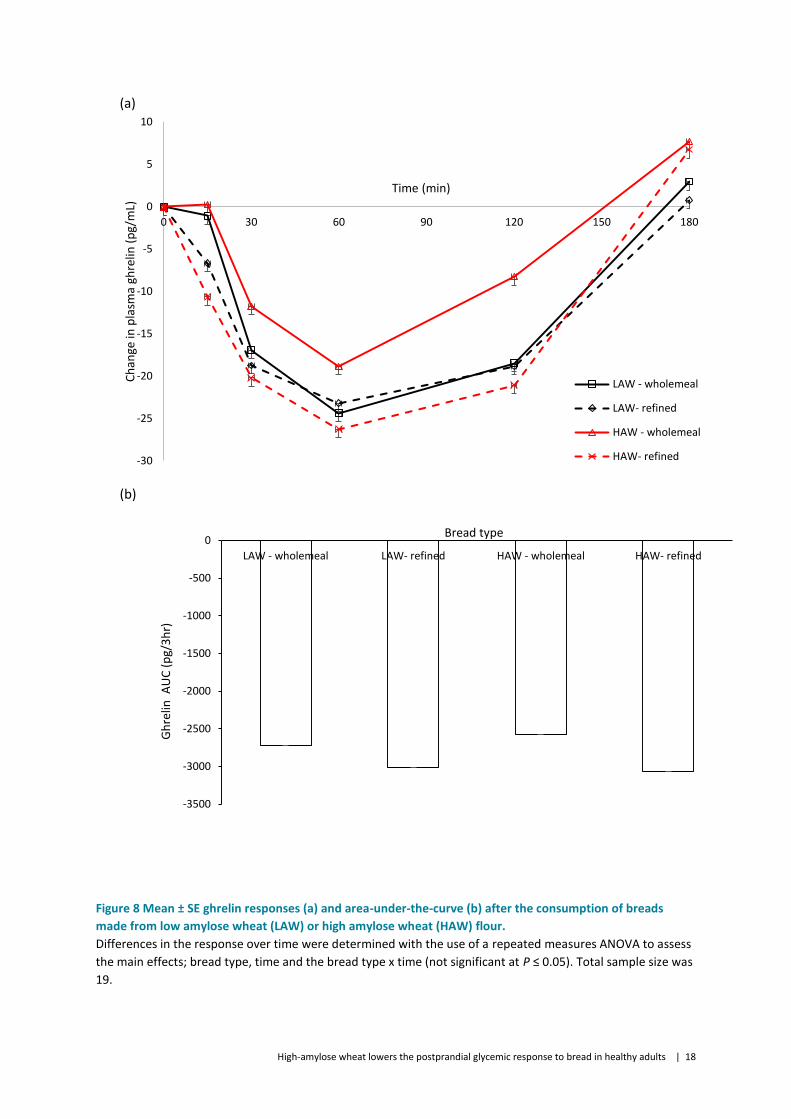
Plasma ghrelin levels decreased following test bread consumption, reaching nadir after 60 min, before returning to levels above baseline by 180 min (Figure 5). The amylose content and flour processing (wholemeal or refined) did not differentially affect the ghrelin response of the test breads (Figure 8).
3.5 Intestinal fermentation
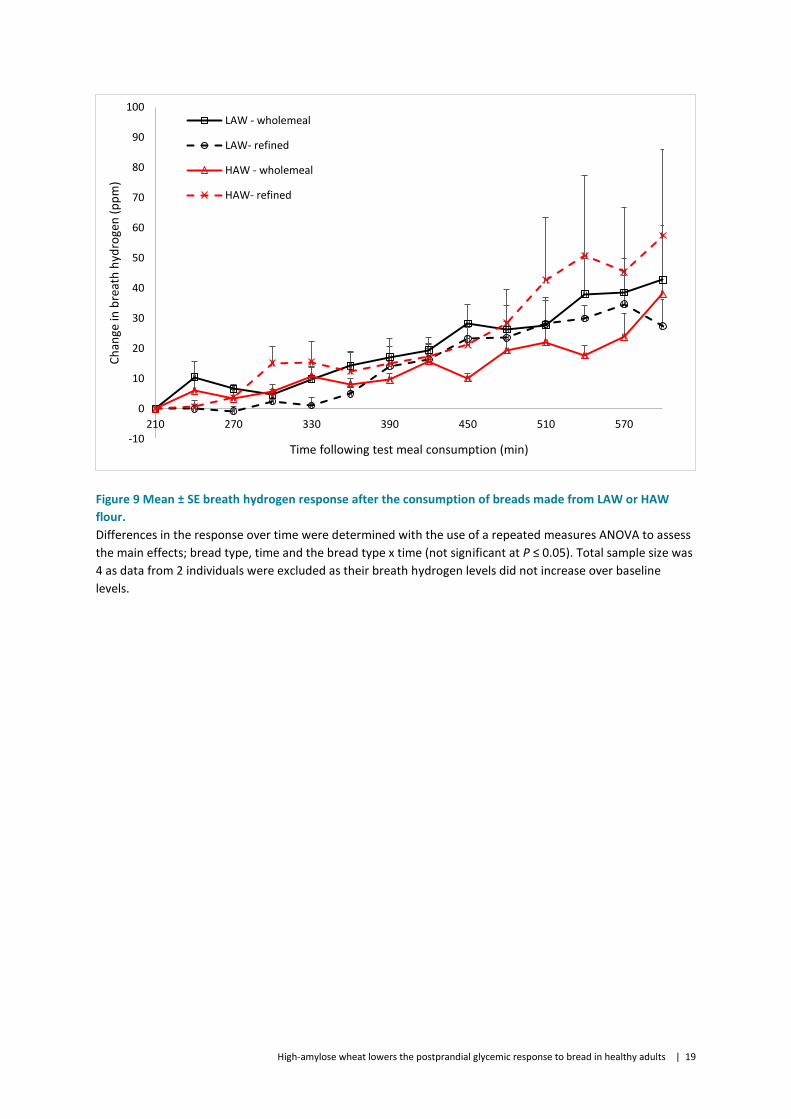
Breath hydrogen levels started to increase 3 ½ h after the test breads were consumed (Figure 9). They continued to rise for the duration of the testing period (10 hr) however there was no differential effect of amylose content or flour processing (wholemeal or refined) on breath hydrogen levels.
Plasma PYY, a hormone secreted from enteroendocrine cells in response to short chain fatty acids production in the large intestine, did not change during the 3 hr postprandial period (Figure 10). Differences in the amylose content and processing (wholemeal or refined) of the flour used to make the test breads had no effect on plasma PYY levels during the 3 hr postprandial period (Figure 10).
3.6 Amylose content and flour processing did not affect markers of oxidative stress and inflammation
I-CAM-1 and nitrotyrosine levels showed a small decrease 60 min after the test breads were consumed, but by 180 min levels had returned to baseline or increased above baseline (Figure 11). Plasma I-CAM-1 and nitrotyrosine levels were not differentially affected by the amylose content of the bread or flour processing (wholemeal or refined) (Figure 11).
High-amylose wheat lowers the postprandial glycemic response to bread in healthy adults | 11
Figure 1 Participant flow diagram
Withdrawals
n=1
Questionaires recieved
n=73
Partcitpants screened
n=27
Ineligible inclusion / exculsion criteria n=42
Withdrawn interest n=4
Commenced study
n=20
Randomised
n=20
Eligible for participation
n=20
Ineligible reasons
BMI n=4
travel commitments n=1
Withdrawn interst n=1
medications n=1
completed study
n=19
High-amylose wheat lowers the postprandial glycemic response to bread in healthy adults | 12
(a)
(b)
(c)
Figure 2 Mean ± SE glycemic response after consumption of breads made from LAW or HAW flour.
(a) Serum postprandial glucose concentration and incremental glucose AUC during the 3 hr test period are
shown for breads that differ in (b) amylose content and (c) flour processing. At each time point, a different
lowercase letter indicated means were significantly different from each other (P ≤ 0.05). Sample size was 19.
-0,5
0
0,5
1
1,5
2
2,5
0 15 30 45 60
Ch
ange
in p
lasm
a gl
uco
se (
mM
)
Time (min)
LAW - wholemeal
LAW - refined
HAW - wholemeal
HAW - refined
b
ab
a
a
0
10
20
30
40
50
60
70
80
LAW HAW
Glu
cose
AU
C (
mM
/3 h
r)
P < 0.001
0
10
20
30
40
50
60
Refined flour Wholemeal
Glu
cose
AU
C (
mm
ol/
3h
r)
High-amylose wheat lowers the postprandial glycemic response to bread in healthy adults | 13
(a)
(b)
(c)
Figure 3 Mean ± SE insulinemic response after the consumption of breads made from LAW or HAW flour.
(a) Serum postprandial glucose concentration and incremental glucose AUC during the 3 hr test period are
shown for breads that differ in (b) amylose content and (c) flour processing. At each time point, a different
lowercase letter indicated means were significantly different from each other (P ≤ 0.05). Sample size was 19.
0
200
400
600
800
1000
1200
1400
0 30 60 90 120 150 180
Ch
ange
in p
lasm
a in
sulin
(p
g/m
L)
Time (min)
LAW -wholemeal
LAW- refined
HAW -wholemeal
0
20
40
60
80
100
LAW HAW
Insu
lin A
UC
(n
g/3
h)
P < 0.01
0
10
20
30
40
50
60
70
80
90
100
Refined flour Wholemeal
Insu
lin A
UC
(m
mo
l/3h
r)
High-amylose wheat lowers the postprandial glycemic response to bread in healthy adults | 14
(a)
(b)
(c)
Figure 4 Mean ± SE gastric inhibitory peptide (GIP) response after the consumption of breads made from
LAW or HAW flour.
(a) Serum postprandial glucose concentration and incremental glucose AUC during the 3 hr test period are
shown for breads that differ in (b) amylose content and (c) flour processing. At each time point, a different
lowercase letter indicated means were significantly different from each other (P ≤ 0.05). Sample size was 19.
0
50
100
150
200
250
300
350
400
450
0 30 60 90 120 150 180
Ch
ange
in p
lasm
a G
IP (
pg/
mL)
Time (min)
LAW - wholemeal
LAW- refined
HAW - wholemeal
HAW- refined
0
10
20
30
40
50
LAW HAW
GIP
AU
C (
ng/
3 h
)
P < 0.0001
0
5
10
15
20
25
30
35
40
Refined flour Wholemeal
GIP
AU
C (
mM
/3h
r)
High-amylose wheat lowers the postprandial glycemic response to bread in healthy adults | 15
(a)
(b)
(c)
Figure 5 Mean ± SE glucagon-like peptide-1 (GLP-1) response after the consumption of breads made from
LAW or HAW flour.
(a) Serum postprandial glucose concentration and incremental glucose AUC during the 3 hr test period are
shown for breads that differ in (b) amylose content and (c) flour processing. At each time point, a different
lowercase letter indicated means were significantly different from each other (P ≤ 0.05). Sample size was 19.
0
2
4
6
8
10
12
0 30 60 90 120 150 180
Ch
ange
in G
LP-1
(p
h/m
L)
Time (min)
LAW - wholemeal
LAW- refined
HAW - wholemeal
HAW- refined
0
200
400
600
800
1000
LAW HAW
GLP
-1 A
UC
(p
g/3
hr)
P < 0.05
0
100
200
300
400
500
600
700
800
900
Refined flour Wholemeal
GLP
-1 A
UC
(m
mo
l/3
h)
High-amylose wheat lowers the postprandial glycemic response to bread in healthy adults | 16
a.
b.
c.
d.
Figure 6 Changes in satiety at (a) 30, (b) 60, (c) 120 and (d) 180 min after the consumption of breads made
from LAW or HAW flour.
The data is presented as degree of change in standard deviation units relative to baseline. Error bars represent
2.5*SE. A different letter denotes significant difference (P<0.05). Total sample size was 19.
-2
-1
0
1
2
Glucose LAW -wholemeal
LAW -refined
HAW -refined
HAW -wholemeal
Ch
ange
in s
atie
ty a
t 3
0m
in
a
bb b b
-2
-1
0
1
2
Glucose LAW -wholemeal
LAW -refined
HAW -refined
HAW -wholemeal
Ch
ange
in s
atie
ty a
t 6
0m
in
bab ab ab
a
-2
-1
0
1
2
Glucose LAW -wholemeal
LAW -refined
HAW -refined
HAW -wholemeal
Ch
ange
in s
atie
ty a
t 1
20
min
a
bb b
ab
-2
-1
0
1
2
Glucose LAW -wholemeal
LAW -refined
HAW -refined
HAW -wholemeal
Ch
ange
in s
atie
ty a
t 1
80
min
b b bab
a
High-amylose wheat lowers the postprandial glycemic response to bread in healthy adults | 17
a.
b.
Figure 7 Changes in cravings at 30 and 60 min after the consumption of breads made from LAW or HAW
flour.
The data is presented as degree of change in standard deviation units relative to baseline. Error bars represent
2.5*SE. A different letter denotes significant difference (P<0.05). Total sample size was 19.
-1
-0,5
0
0,5
1
Glucose LAW -wholemeal
LAW - refined HAW - refined HAW -wholemeal
Ch
ange
in c
ravi
ngs
at
30
min
bb
a
ab a
b
-1
-0,5
0
0,5
1
Glucose LAW -wholemeal
LAW - refined HAW - refined HAW -wholemeal
Ch
ange
in c
ravi
ngs
at
60
min
b
a
abab
ab
High-amylose wheat lowers the postprandial glycemic response to bread in healthy adults | 18
(a)
(b)
Figure 8 Mean ± SE ghrelin responses (a) and area-under-the-curve (b) after the consumption of breads
made from low amylose wheat (LAW) or high amylose wheat (HAW) flour.
Differences in the response over time were determined with the use of a repeated measures ANOVA to assess
the main effects; bread type, time and the bread type x time (not significant at P ≤ 0.05). Total sample size was
19.
-30
-25
-20
-15
-10
-5
0
5
10
0 30 60 90 120 150 180
Ch
ange
in p
lasm
a gh
relin
(p
g/m
L)
Time (min)
LAW - wholemeal
LAW- refined
HAW - wholemeal
HAW- refined
-3500
-3000
-2500
-2000
-1500
-1000
-500
0
LAW - wholemeal LAW- refined HAW - wholemeal HAW- refined
Gh
relin
AU
C (
pg/
3h
r)
Bread type
High-amylose wheat lowers the postprandial glycemic response to bread in healthy adults | 19
Figure 9 Mean ± SE breath hydrogen response after the consumption of breads made from LAW or HAW
flour.
Differences in the response over time were determined with the use of a repeated measures ANOVA to assess
the main effects; bread type, time and the bread type x time (not significant at P ≤ 0.05). Total sample size was
4 as data from 2 individuals were excluded as their breath hydrogen levels did not increase over baseline
levels.
-10
0
10
20
30
40
50
60
70
80
90
100
210 270 330 390 450 510 570
Ch
ange
in b
reat
h h
ydro
gen
(p
pm
)
Time following test meal consumption (min)
LAW - wholemeal
LAW- refined
HAW - wholemeal
HAW- refined
High-amylose wheat lowers the postprandial glycemic response to bread in healthy adults | 20
Figure 10 Mean ± SE peptide-YY (PYY) response after the consumption of breads made from LAW or HAW
flour.
Differences in the response over time were determined with the use of a repeated measures ANOVA to assess
the main effects; bread type, time and the bread type x time (not significant at P ≤ 0.05). Total sample size was
19.
-20
-10
0
10
20
30
40
0 30 60 90 120 150 180Ch
ange
in p
lasm
a P
YY (
pg/
mL)
Time (min)
LAW - wholemeal
LAW- refined
HAW - wholemeal
HAW- refined

High-amylose wheat lowers the postprandial glycemic response to bread in healthy adults | 22
(a)
(b)
Figure 11 Mean ± SE (a) I-CAM-1 and (b) Nitrotyrosine responses after the consumption of breads made from LAW
or HAW flour.
Differences in the response over time were determined with the use of a repeated measures ANOVA to assess the
main effects; bread type, time and the bread type x time (not significant at P ≤ 0.05). Total sample size was 19.
-10
-5
0
5
10
15
20
0 30 60 90 120 150 180
Ch
ange
in p
lasm
a I-
CA
M1
(n
mo
l/m
L)
Time (min)
LAW - wholemeal
LAW- refined
HAW - wholemeal
HAW- refined
-12,0
-10,0
-8,0
-6,0
-4,0
-2,0
0,0
2,0
4,0
6,0
8,0
10,0
0 30 60 90 120 150 180
Ch
ange
in p
lasm
a n
itro
tyro
sin
e (p
g/m
L)
Time (min)
LAW - wholemeal
LAW- refined
HAW - wholemeal
HAW- refined
High-amylose wheat lowers the postprandial glycemic response to bread in healthy adults | 23
4 Discussion
Findings from the current study show that substitution of conventional wheat flour with HAW flour lowered the postprandial glycemic response of bread by 30%. This reduced glycemic response for HAW bread is consistent with a concomitant lowering of circulating levels of the incretin hormones, GIP and GLP-1 that are secreted in response to the presence of glucose in the duodenum and small intestine. Consistent with these changes in glycemia and incretin hormones during the postprandial period, the insulinemic response for HAW bread was 30% lower than LAW bread. HAW-induced dampening of postprandial glycemia could be due to a number of factors, including less available carbohydrate in these breads compared to control (conventional) breads. The compact structure of starch with elevated amylose content may also restrict starch swelling and gelatinisation, reducing the rate and extent of digestion (Akerberg et al. 1998, Panlasigui et al. 1991). Additionally, changes in the amylopectin structure in high amylose wheat could also contribute to reduced starch digestion rates. The lower glycemic and insulinemic response of the HAW breads seen in the current study are consistent with a range of foods that have used other types of cereals that contain high levels of amylose (Al-Tamimi et al. 2010, Aldughpassi et al. 2012, Behall and Scholfield 2005, Ekstrom et al. 2013, Granfeldt et al. 1995, King et al. 2008, Klosterbuer et al. 2012). For instance, arepas made from high amylose corn starch (70% amylose) had a lower glycemic and insulinemic response than arepas made from conventional corn starch (25% amylose). A similar lowering of glycemia and insulinemia in men and women was also observed when high amylose maize starch was added to wheat-based breads. Importantly, amylose had to comprise at least 50% of total starch for this functional effect to occur (Behall and Hallfrisch 2002). When bread was made from wholegrain wheat containing only slightly elevated levels of amylose (38%) the glycemic response was essentially no different to that of bread made from conventional wholegrain wheat (Hallstrom et al. 2011). If incorporated into the regular diet, substitution of conventional wheat with HAW could contribute to the prevention and/or management of type-2 diabetes. In relation to glucose sensitivity, a study showed a reduced glucose AUC in adults with prediabetes or type-2 diabetes after consumption of rice or bagels that contained higher levels of RS (Kwak et al. 2012). However, other studies have shown that glucose sensitivity is not improved following RS food interventions conducted in healthy (Behall and Howe 1995, Behall et al. 1989, Robertson et al. 2005, Weickert et al. 2005), overweight (Noakes et al. 1996) or hyperinsulinemic adults (Behall and Howe 1995). There are a number of factors that may explain the variable findings, including food form, type of processing, amount of RS and study duration. Long term consumption of foods high in RS may also improve insulin sensitivity by lowering the amount of insulin needed to stimulate glucose uptake. A study by Dainty et al (Dainty et al. 2016) showed that daily consumption of a bagel containing 25 g of high amylose maize starch improved glycemic disposal by reducing the amount of insulin required to manage postprandial glucose while improving fasting insulin sensitivity in adults at risk of diabetes. An earlier study by Behall et al (Behall et al. 1989) also showed that consumption of foods containing high amylose corn starch for five weeks reduced glycemic and insulinemic postprandial responses.
High-amylose wheat lowers the postprandial glycemic response to bread in healthy adults | 24
In the current study, processing of flour had little effect on glycemic response, even though the wholemeal breads had more than double the fibre content and up to 30% less starch than breads made from refined flour. This is consistent with previous studies which have shown that white and wholemeal breads have similar postprandial glycaemic responses in both diabetic volunteers and healthy adults (Jenkins et al. 1986, Kristensen et al. 2010, Scazzina et al. 2009). In addition, dietary intervention studies showed that conventional markers of glycemic control were similar when whole-grain or refined-grain products (predominantly bread made with milled whole wheat) were consumed by volunteers for 6 to 12 weeks (Andersson et al. 2007, Jenkins et al. 2002). Unlike other cereals such as oat and barley, the fibre content of wheat is predominately insoluble fibre which has limited functionality in modulating the glycemic impact of bread and other strategies are required to modulate starch digestion and/or absorption (Scazzina et al. 2013). In the current study, the similar glycaemic and insulinemic response for the HAW breads made from refined and wholemeal flours is likely due to complementary differences in the total amount of starch and resistant starch; compared to refined HAW bread, wholemeal HAW bread had less starch (refined 28.5 g/100g, wholemeal 19.9 g/100g) and less of this starch was resistant starch (refined 4.7 g/100g, wholemeal 3.2 g/100g). Importantly, this study demonstrates that substitution of conventional wheat flours with either refined or wholemeal wheat can be an effective approach to lower the glycemic response of bread. In the current study we observed that certain test breads elicited greater satiety and reduced cravings at some time points during the postprandial period compared to the glucose control. However, throughout this period, satiety and cravings were similar between the four breads, which suggests that the amylose content of the breads and flour processing had no effect on these endpoints. This finding is consistent with a previous acute study that evaluated breakfast meals containing resistant starch and pullulan that lowered postprandial glucose, insulin, and GLP-1 response, but had no effect on satiety (Klosterbuer et al. 2012). Another study showed improvements in subjective appetite ratings, but this only occurred when white wheat bread was used as a control and medium weight guar gum was combined with a high amylose whole grain corn flour (Ekstrom et al. 2013). Importantly, the HAW breads used in the current study provided less energy (9 - 12% less kJ/100g) than the LAW control bread, which suggests that ongoing consumption could contribute to reducing total daily energy intake and the subsequent weight gain. RS may provide the additional benefits of improving bowel health as short-chain fatty acids (SCFA) are major end products of the fermentation of NSP and RS by the microflora (Topping and Clifton 2001), and they promote important aspects of large bowel function. RS intakes are low in populations at high risk of the diseases of affluence, and there is a case for increasing RS consumption as an effective means of improving nutrition for public health at the population level. The current study had limited power to determine the effects of amylose content and flour
processing on intestinal fermentation as only a small subset of individuals provided breath hydrogen samples. Furthermore, as bloods were only collected during the 3 hr postprandial period the RS in the test meals had not commenced fermentation in the large intestine, thus circulating peptides such as PYY remained at background levels. Subsequently, a clinical trial designed to thoroughly assess the prolonged effects of consuming high amylose wheat on a range of measures of fermentation and gut health is warranted. Markers of inflammation and oxidative stress also remained unchanged during the postprandial period which was surprising given that a comparable study showed significant changes in these markers (Dickinson et al. 2008). Further examination of these and other related markers of inflammation and oxidative stress are warranted in studies of
High-amylose wheat lowers the postprandial glycemic response to bread in healthy adults | 25
longer duration given the high levels of phytochemicals in wholegrains which may have enhanced bioavailability following intestinal fermentation (Belobrajdic and Bird 2013). Although the long term effects of resistant starch have been consistently demonstrated for improving glucose control, this could not be evaluated as this study was only designed to measure the acute effects of a food made from HAW. Furthermore, bread was the only test food used in this study, therefore it is not certain whether substituting conventional flour with HAW in other food products would result in a similar magnitude of lowering of glycemic and insulinemic response.
High-amylose wheat lowers the postprandial glycemic response to bread in healthy adults | 26
5 Summary
• This randomised, double-blinded, crossover controlled study determined whether breads made
from High Amylose Wheat (HAW) dampen postprandial glycemia compared to conventional wheat
(Low Amylose Wheat, LAW).
• On separate mornings, 20 healthy non-diabetic men and women consumed four different
wholemeal or refined wheat breads made from conventional or high amylose wheat flour (serving
size of 121 g).
• High amylose wheat breads had lower glycemic, insulinemic and incretin (GIP and GLP-1)
responses than conventional wheat breads (P<0.05).
• Processing of the flour (wholemeal or refined) did not affect glycemic or other metabolic
endpoints measured.
• Flour processing and amylose content of the breads did not affect plasma ghrelin or subjective
measures of satiety or cravings during the postprandial period.
• Breath hydrogen levels started to increase 3 ½ hr after the test breads were consumed and
continued to rise for the duration of the testing period (10 hr) however there was no differential
effects of amylose content or flour processing (wholemeal or refined) on breath hydrogen levels.
• Amylose content and flour processing did not affect markers of oxidative stress (nitrotyrosine) or
inflammation (I-CAM-1).
• These findings demonstrate that replacing conventional with high amylose wheat flour is an
effective strategy for lowering postprandial glycemic and insulinemic responses to bread.
• Follow up clinical studies that examine prolonged consumption of foods containing HAW on
improving glucose control in healthy individuals and adults with pre-diabetes is warranted.
• Further benefit from using high amylose flour in other wheat based food products such as ready-
to-eat breakfast cereals and bars, noodles and doughs may result in the lowering of the glycemic
impact of a range of different foods and deserves further investigation.
High-amylose wheat lowers the postprandial glycemic response to bread in healthy adults | 27
Acknowledgments
We thank the following individuals at the Commonwealth Scientific and Industrial Research Organisation (CSIRO) – Health and Biosecurity, Adelaide, South Australia (SA) for their work: Jessica Southwood for coordinating the trial; Genevieve James-Martin for performing the diet history assessments; Ian Zajac for formulating the satiety and cravings questionnaires and analysing the data; the Nutrition and Health Research Clinic Team for assisting with the clinical assessments; Cathryn Pape, Michael Adams, Bruce May and Paul Orchard for performing biochemical assays. We also thank Regina Ahmed from CSIRO – Food and Agriculture, Canberra for project oversight and Pierre Berbezy and Sophie Chapron from Group Limagrain for formulating and manufacturing the breads used in this trial.
High-amylose wheat lowers the postprandial glycemic response to bread in healthy adults | 28
References
Akerberg A, Liljeberg H and Bjorck I. 1998. Effects of amylose/amylopectin ratio and baking conditions on resistant starch formation and glycaemic indices. Journal of Cereal Science. 28: 71-80.
Al-Tamimi EK, Seib PA, Snyder BS and Haub MD. 2010. Consumption of Cross-Linked Resistant
Starch (RS4(XL)) on Glucose and Insulin Responses in Humans. J Nutr Metab. 2010.
Aldughpassi A, Abdel-Aal E-SM and Wolever TMS. 2012. Barley Cultivar, Kernel Composition, and
Processing Affect the Glycemic Index. J Nutr. 142: 1666-1671.
Andersson A, Tengblad S, Karlstrom B, Kamal-Eldin A, Landberg R, Basu S, Aman P and Vessby B.
2007. Whole-grain foods do not affect insulin sensitivity or markers of lipid peroxidation and inflammation in healthy, moderately overweight subjects. J Nutr. 137: 1401-7.
Behall KM and Hallfrisch J. 2002. Plasma glucose and insulin reduction after consumption of
breads varying in amylose content. Eur J Clin Nutr. 56: 913-20.
Behall KM and Howe JC. 1995. Effect of long-term consumption of amylose vs amylopectin starch
on metabolic variables in human subjects. Am J Clin Nutr. 61: 334-40.
Behall KM and Scholfield DJ. 2005. Food amylose content affects postprandial glucose and insulin
responses. Cereal Chemistry. 82: 654-659.
Behall KM, Scholfield DJ, Yuhaniak I and Canary J. 1989. Diets containing high amylose vs
amylopectin starch: effects on metabolic variables in human subjects. Am J Clin Nutr. 49: 337-44.
Belobrajdic DP and Bird AR. 2013. The potential role of phytochemicals in wholegrain cereals for
the prevention of type-2 diabetes. Nutr J. 12: 62.
Dainty SA, Klingel SL, Pilkey SE, McDonald E, McKeown B, Emes MJ and Duncan AM. 2016.
Resistant Starch Bagels Reduce Fasting and Postprandial Insulin in Adults at Risk of Type 2 Diabetes. J Nutr. 146: 2252-2259.
Dickinson S, Hancock DP, Petocz P, Ceriello A and Brand-Miller J. 2008. Am J Clin Nutr. Am J Clin
Nutr. 87: 1188-93.
Ekstrom LM, Bjorck IM and Ostman EM. 2013. On the possibility to affect the course of glycaemia,
insulinaemia, and perceived hunger/satiety to bread meals in healthy volunteers. Food Funct. 4.
High-amylose wheat lowers the postprandial glycemic response to bread in healthy adults | 29
Goddard MS, Young G and Marcus R. 1984. The Effect of Amylose Content on Insulin and Glucose
Responses to Ingested Rice. American Journal of Clinical Nutrition. 39: 388-392.
Granfeldt Y, Drews A and Bjorck I. 1995. Arepas made from high amylose corn flour produce
favorably low glucose and insulin responses in healthy humans. J Nutr. 125: 459-65.
Granfeldt Y, Liljeberg H, Drews A, Newman R and Bjorck I. 1994. Glucose and insulin responses to
barley products: influence of food structure and amylose-amylopectin ratio. Am J Clin Nutr. 59: 1075-82.
Granfeldt YE, Drews AW and Bjorck IME. 1993. Starch Bioavailability in Arepas Made from
Ordinary or High Amylose Corn - Concentration and Gastrointestinal Fate of Resistant Starch in Rats. Journal of Nutrition. 123: 1676-1684.
Hallstrom E, Sestili F, Lafiandra D, Bjorck I and Ostman E. 2011. A novel wheat variety with
elevated content of amylose increases resistant starch formation and may beneficially influence glycaemia in healthy subjects. Food Nutr Res. 55.
Jenkins DJ, Kendall CW, Augustin LS, Martini MC, Axelsen M, Faulkner D, Vidgen E, Parker T, Lau H,
Connelly PW, Teitel J, Singer W, Vandenbroucke AC, Leiter LA and Josse RG. 2002. Effect of wheat bran on glycemic control and risk factors for cardiovascular disease in type 2 diabetes. Diabetes Care. 25: 1522-8.
Jenkins DJ, Wolever TM, Jenkins AL, Giordano C, Giudici S, Thompson LU, Kalmusky J, Josse RG and
Wong GS. 1986. Low glycemic response to traditionally processed wheat and rye products: bulgur and pumpernickel bread. Am J Clin Nutr. 43: 516-20.
King RA, Noakes M, Bird AR, Morell MK and Topping DL. 2008. Journal of Cereal Science. Journal of
Cereal Science. 48: 526-530.
Klosterbuer AS, Thomas W and Slavin JL. 2012. Resistant starch and pullulan reduce postprandial
glucose, insulin, and GLP-1, but have no effect on satiety in healthy humans. J Agric Food Chem. 60: 11928-34.
Koh-Banerjee P, Franz M, Sampson L, Liu S, Jacobs DR, Jr., Spiegelman D, Willett W and Rimm E.
2004. Am J Clin Nutr. Am J Clin Nutr. 80: 1237-45.
Kristensen M, Jensen MG, Riboldi G, Petronio M, Bugel S, Toubro S, Tetens I and Astrup A. 2010.
Wholegrain vs. refined wheat bread and pasta. Effect on postprandial glycemia, appetite, and subsequent ad libitum energy intake in young healthy adults. Appetite. 54: 163-9.
Kwak JH, Paik JK, Kim HI, Kim OY, Shin DY, Kim H-J, Lee JH and Lee JH. 2012. Dietary treatment with
rice containing resistant starch improves markers of endothelial function with reduction of
High-amylose wheat lowers the postprandial glycemic response to bread in healthy adults | 30
postprandial blood glucose and oxidative stress in patients with prediabetes or newly diagnosed type 2 diabetes. Atherosclerosis. 224: 457-464.
Miller JB, Pang E and Bramall L. 1992. Rice - a High or Low Glycemic Index Food. American Journal
of Clinical Nutrition. 56: 1034-1036.
Noakes M, Clifton PM, Nestel PJ, Le Leu R and McIntosh G. 1996. Effect of high-amylose starch and
oat bran on metabolic variables and bowel function in subjects with hypertriglyceridemia. Am J Clin Nutr. 64: 944-51.
Panlasigui LN, Thompson LU, Juliano BO, Perez CM, Yiu SH and Greenberg GR. 1991. Rice Varieties
with Similar Amylose Content Differ in Starch Digestibility and Glycemic Response in Humans. American Journal of Clinical Nutrition. 54: 871-877.
Regina A, Berbezy P, Kosar-Hashemi B, Li SZ, Cmiel M, Larroque O, Bird AR, Swain SM, Cavanagh C,
Jobling SA, Li ZY and Morell M. 2015. A genetic strategy generating wheat with very high amylose content. Plant Biotechnology Journal. 13: 1276-1286.
Richardson DP. 2003. Wholegrain health claims in Europe. Proc Nutr Soc. 62: 161-9.
Robertson MD, Bickerton AS, Dennis AL, Vidal H and Frayn KN. 2005. Insulin-sensitizing effects of
dietary resistant starch and effects on skeletal muscle and adipose tissue metabolism. Am J Clin Nutr. 82: 559-67.
Scazzina F, Del Rio D, Pellegrini N and Brighenti F. 2009. Sourdough bread: Starch digestibility and
postprandial glycemic response. Journal of Cereal Science. 49: 419-421.
Scazzina F, Siebenhandl-Ehn S and Pellegrini N. 2013. The effect of dietary fibre on reducing the
glycaemic index of bread. Br J Nutr. 109: 1163-74.
Slavin JL. 2000. Mechanisms for the impact of whole grain foods on cancer risk. J Am Coll Nutr. 19:
300S-307S.
Topping DL and Clifton PM. 2001. Physiol Rev. Physiol Rev. 81: 1031-64.
Venn BJ and Mann JI. 2004. Eur J Clin Nutr. Eur J Clin Nutr. 58: 1443-61.
Weickert MO, Mohlig M, Koebnick C, Holst JJ, Namsolleck P, Ristow M, Osterhoff M, Rochlitz H,
Rudovich N, Spranger J and Pfeiffer AF. 2005. Impact of cereal fibre on glucose-regulating factors. Diabetologia. 48: 2343-53.
Yamamori M and Endo TR. 1996. Variation of starch granule proteins and chromosome mapping of
their coding genes in common wheat. Theoretical and Applied Genetics. 93: 275-281.

High-amylose wheat lowers the postprandial glycemic response to bread in healthy adults | 31
CONTACT US
t 1300 363 400 +61 3 9545 2176 e [email protected] w www.csiro.au
AT CSIRO, WE DO THE EXTRAORDINARY EVERY DAY
We innovate for tomorrow and help improve today – for our customers, all Australians and the world.
Our innovations contribute billions of dollars to the Australian economy every year. As the largest patent holder in the nation, our vast wealth of intellectual property has led to more than 150 spin-off companies.
With more than 5,000 experts and a burning desire to get things done, we are Australia’s catalyst for innovation.
CSIRO. WE IMAGINE. WE COLLABORATE. WE INNOVATE.
FOR FURTHER INFORMATION
Dr Tony Bird t +61 8 8303 8902 e [email protected] w http://my.csiro.au/Business-Units/Health-Biosecurity.aspx Dr Damien Belobrajdic t +61 8 8303 8815 e [email protected] w http://my.csiro.au/Business-Units/Health-Biosecurity.aspx Dr Ahmed Regina t +61 2 6246 5488 e [email protected] w http://my.csiro.au/Business-Units/Agriculture-Flagship.aspx