Embed Size (px)
Citation preview

1

2
CONTENTS
S.No. TOPIC PAGE N.
A Background 3
B Scientific studies confirming increased cyclone hazard in Arabian Sea 3
C Cyclone Vulnerability Profile of Gujarat State
C1: Study on Cyclone hazard proneness of districts of India by M. Mohapatra, IMD 2015 4
C2: Gujarat Wind Hazard Map Published by BMTPC in 2015 6
C3: Cyclone Occurrence Map of India published by BMTPC in 2019 7
C4: Hazard Risk Vulnerability Atlas of Gujarat state prepared in 2005 by GSDMA 8
D Historical Record of Major Cyclonic Activity effect ing Gujarat State (1975 -2000) 9
E Year-wise record of all cyclonic activity effecting Gujarat State between 2001 – 2019 10
F Year-wise Frequency of cyclonic activity in Arabian Sea (2001 – 2019) 11
G Year-wise Weighted Intensity of cyclonic activity in Arabian Sea (2001 – 2019) 11
H Role of Shelterbelt and Mangroves in Cyclone Risk Mitigation 12
H1: Mangroves and Shelterbelt reducing cyclone risk 13
H2: Literature review of role of shelterbelts and mangroves in cyclone risk mitigation 13
I Conclusion 15
References 16
3
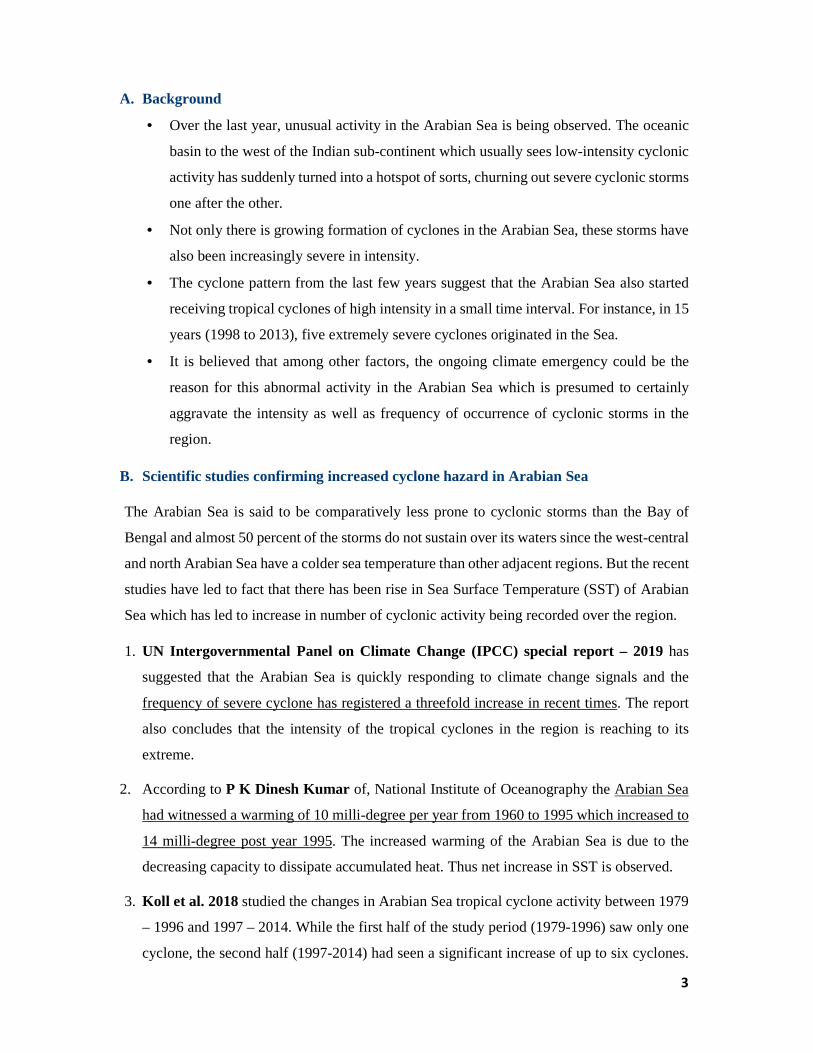
A. Background
• Over the last year, unusual activity in the Arabian Sea is being observed. The oceanic
basin to the west of the Indian sub-continent which usually sees low-intensity cyclonic
activity has suddenly turned into a hotspot of sorts, churning out severe cyclonic storms
one after the other.
• Not only there is growing formation of cyclones in the Arabian Sea, these storms have
also been increasingly severe in intensity.
• The cyclone pattern from the last few years suggest that the Arabian Sea also started
receiving tropical cyclones of high intensity in a small time interval. For instance, in 15
years (1998 to 2013), five extremely severe cyclones originated in the Sea.
• It is believed that among other factors, the ongoing climate emergency could be the
reason for this abnormal activity in the Arabian Sea which is presumed to certainly
aggravate the intensity as well as frequency of occurrence of cyclonic storms in the
region.
B. Scientific studies confirming increased cyclone hazard in Arabian Sea
The Arabian Sea is said to be comparatively less prone to cyclonic storms than the Bay of
Bengal and almost 50 percent of the storms do not sustain over its waters since the west-central
and north Arabian Sea have a colder sea temperature than other adjacent regions. But the recent
studies have led to fact that there has been rise in Sea Surface Temperature (SST) of Arabian
Sea which has led to increase in number of cyclonic activity being recorded over the region.
1. UN Intergovernmental Panel on Climate Change (IPCC) special report – 2019 has
suggested that the Arabian Sea is quickly responding to climate change signals and the
frequency of severe cyclone has registered a threefold increase in recent times. The report
also concludes that the intensity of the tropical cyclones in the region is reaching to its
extreme.
2. According to P K Dinesh Kumar of, National Institute of Oceanography the Arabian Sea
had witnessed a warming of 10 milli-degree per year from 1960 to 1995 which increased to
14 milli-degree post year 1995. The increased warming of the Arabian Sea is due to the
decreasing capacity to dissipate accumulated heat. Thus net increase in SST is observed.
3. Koll et al. 2018 studied the changes in Arabian Sea tropical cyclone activity between 1979
– 1996 and 1997 – 2014. While the first half of the study period (1979-1996) saw only one
cyclone, the second half (1997-2014) had seen a significant increase of up to six cyclones.

4
It was found that La Niña-like conditions in Pacific during the recent decades have resulted
in an anomalous cyclonic circulation throughout the middle troposphere, along with
increased relative humidity over the Arabian Sea, thereby providing favourable conditions
for cyclogenesis. [1]
4. Murakami et al. 2017 suggested that anthropogenic warming is changing cyclone
behaviour over Arabian Sea and if continued it will further amplify the risk of cyclones in
the region, with corresponding socio-economic implications. The findings revealed that 64
per cent of the cyclone risk in the Arabian Sea was due to climate change. [2]
5. Evan et al. 2011 suggested that the usual monsoon circulation and associated strong vertical
wind shear limited the cyclone development and intensification, only permitting a pre-
monsoon and post-monsoon cyclone period. But the weakening of the climatological
vertical wind shear and increased anthropogenic emissions of aerosols (which has led to
weakening of the winds that define the monsoonal circulation over the Arabian Sea) have
led to increase cyclonic activity over Arabian Sea. [3]
6. Sun et al. 2019 have also confirmed that Arabian Sea warming has been significantly
accelerated since the 1990s, in particular in the spring season leading to increase cyclonic
activity. [4]
C. Cyclone Vulnerability Profile of Gujarat State
Cyclone Vulnerability analysis has been performed by India Meteorological Department
(IMD), Building Materials and Technology Promotion Council (BMTPC) and Gujarat State
Disaster Management Authority (GSDMA). In the present report four such analysis are
studied.
C1: Study on Cyclone hazard proneness of districts of India by M. Mohapatra, IMD
2015
Degree of cyclone hazard proneness of districts was analysed by Mohapatra 2015 based
on the frequency and intensity of land-falling tropical cyclones along with all other hazards
like rainfall, wind, and storm surge. [5]
The categorization of districts was based on the degree of proneness i.e. P4 (Low), P3
(Moderate), P2 (High) and P1 (Very high).

5
Out of 16 coastal districts of Gujarat within 100 km from the coast line, 12 districts came
under P2 (Highly Prone) and 2-2 districts came under P3 (Moderately Prone) and P4 (Low
Prone) each. List of the districts with their degree of proneness is listed in Table 1.
Note: The study was conducted in the year 2015 therefore Table 1 doesn’t list the proneness
of Morbi, Devbhoomi Dwarka and Gir Somnath districts. The information regarding the
same is listed in Table 2.
DISTRICT NAME
CATEGORY OF PRONENESS
Junagadh
P2
Ahmedabad
Kutch
Bhavnagar
Jamnagar
Anand
Navsari
Surat
Bharuch
Valsad
Rajkot
Porbandar
Vadodara
P3 Amreli
Surendra Nagar
P4 Kheda
Table 1: Costal Districts of Gujarat with degree of proneness to Cyclone Hazard
Morbi P2
Devbhoomi Dwarka b/w P2-P3
Gir Somnath P2
Table 2: New Costal Districts of Gujarat with degree of proneness to Cyclone Hazard

6
THE AREA UNDER CONSIDERATION i.e. COASTAL REGIONS F ROM
BHAVNAGAR TO NAVSARI COMES UNDER PRONENESS DEGREE P2 (HIGHLY
PRONE)
C2: Gujarat Wind Hazard Map Published by BMTPC in 2015
BMTPC in 2015 published Wind Hazard Map of Gujarat State which divided the state into
Very High Damage Risk Zone – B (Basic Wind Speed = 180 kmph), High Damage Risk Zone
(Basic Wind Speed = 169 kmph), Moderate Damage Risk Zone – A (Basic Wind Speed = 158
kmph) and Moderate Damage Risk Zone – B (Basic Wind Speed = 140 kmph).
The Wind Hazard Map of Gujarat State is depicted in Figure 1.
Figure 1: Wind Hazard Map of Gujarat State
THE AREA UNDER CONSIDERATION IS THE COASTAL REGION FROM
BHAVNAGAR TO NAVSARI. BHAVNAGAR AND AHMEDABAD COME UNDER
VERY HIGH DAMAGE RISK ZONE AND THE REST OF THE DIST RICTS UNDER
CONSIDERATION COMES UNDER HIGH DAMAGE RISK ZONE.

7
C3: Cyclone Occurrence Map of India published by BMTPC in 2019
BMTPC in 2019 published Cyclone Occurrence Map of India. Figure 2 depicts the same and
Figure 3 reveals a zoomed out version over Gujarat state.
THE AREA UNDER CONSIDERATION i.e. COASTAL REGIONS F ROM
BHAVNAGAR TO NAVSARI MOSTLY HAS MAXIMUM SUSTAINED W IND OF
MAGNITUDE 64 – 90 KNOTS (119 – 167 KMPH) EXCEPT NAVSARI DISTRICT
WHICH COMES UNDER MAXIMUM SUSTAINED WINDS OF MAGNIT UDE 34 – 47
KNOTS (63 – 87 KMPH).
Figure 2: Cyclone Occurrence Map (BMTPC 2019)

8
Figure 3: Zoomed out Cyclone Occurrence Map of Gujarat State (BMTPC 2019)
C4: Hazard Risk Vulnerability Atlas of Gujarat stat e prepared in 2005 by GSDMA
The Hazard Risk Vulnerability Atlas prepared by GSDMA shows the cyclone hazard zonation
along with basic wind speed at Taluka level. The Figure 4 reveals:
• Maximum wind speed class of more than 198 kmph is observed along the Saurashtra
coast, specifically in Porbandar, Jamnagar and Junagadh districts, which are exposed to
high intensity cyclonic and storm impact.
• The 184 to 198 kmph class extends further inland to cover much of Jamnagar, part of
Rajkot, Junagadh and Kutch districts.
• The 173 to 180 kmph class extends to most of Rajkot, part of Amreli and Jamnagar
districts including Jamnagar, Rajkot cities and parts of Kutch.
• The 162 to 169 kmph class covers much of Saurashtra and all of Kutch.
• This is followed by the 144 to 158 kmph class that gets its swathe from Kutch through
northern Saurashtra all the way to the coast of Gulf of Khambhat and southern Gujarat.
• The rest of the State falls into the 122 to 140 kmph class.

9
Figure 4: Cyclone Hazard Zonation 100 year returns period Map (Taluka Level)
D: Historical Record of Major Cyclonic Activity eff ecting Gujarat State (1975 -2000)
(Source: Cyclone Preparedness & Response Plan of Gujarat 2014)
S.N. Landfall Date Affected District
1 22 Oct 1975 Porbandar
2 3 June 1976 Saurashtra coast
3 1 Nov 1989 Veraval & Porbandar
4 8 Nov 1982 Veraval
5 18 June 1992 Diu
6 9 June 1998 Porbandar
7 20 May 1999 Kutch

10
E: Year-wise record of all cyclonic activity effecting Gujarat State between 2001 – 2019
Year
Activity Duration
Classification
Affected Region(s)
2001
21 – 29 May
Extremely Severe Cyclonic Storm
2001 India Cyclone
Kandla, Kosamba, Jamnagar, Valsad
7 – 13 Oct
Cyclonic Storm
Southern Gujarat
2004
30 Sept.– 10 Oct.
Severe Cyclonic Storm Onil
Porbandar
2005
21 – 22 June
Depression
Western Gujarat
14 – 16 Sept
Depression
Western Gujarat
2006
21 – 24 Sept
Severe Cyclonic Storm Mudka
Porbandar, Rajkot
2008
23 – 24 June
Depression
Diu
2010
30 May – 7 June
Very Severe Cyclonic Storm Phet
Rajkot, Kutch, Surendranagar,
Jamnagar, Mehsana
2011
11-12 June
Depression
Gir Somnath, Veraval, Kodinar, Talala,
Upleta
2014
10-14 June
Cyclonic Storm
South Coast of Gujarat
25-31 October
Extremely Severe Cyclonic Storm Nilofar
Kutch, Saurashtra
2015
22-24 June
Deep Depression
Gir-Somnath, Amreli, Rajkot
2016
27-29 June
Depression
Western Gujarat
2017
29 Nov – 6 Dec
Very Severe Cyclonic Storm Ockhi
Surat, Dahanu
2019
10-17 June
Very Severe Cyclonic Storm Vayu
Saurashtra, Kutch, Diu
30 Sept – 01 Oct
Depression
Kandla (Kutch)
22-25 Dec
Very Severe Cyclonic Storm Hikaa
South Coast of Gujarat
30 Oct. – 7 Nov.
Extremely Severe Cyclonic Storm Maha
Diu

11
F: Year-wise Frequency of cyclonic activity in Arabian Sea (2001 – 2019)
In the following plot all cyclonic activity that incepted in Arabian Sea is plotted against their
year of inception (Annexure 1).
Graph 1: Year-wise Frequency of cyclonic activity in Arabian Sea
The trend line in Graph 1 reveals increase in the number of cyclonic activity over the period
of time.
G: Year-wise Weighted Intensity of cyclonic activity in Arabian Sea (2001 – 2019)
In order to have an idea of the intensity of cyclonic activity, weight is assigned to each cyclonic
activity in following manner:
India Meteorological Department Tropical Cyclone
Classification
Weight
Cyclonic Activity
Sustained
Winds
Depression (D) 31–50 km/h 1
Deep Depression (DD) 51–62 km/h 2
Cyclonic Storm (CS) 63–88 km/h 3
Severe Cyclonic Storm (SCS) 89–117 km/h 4
Very Severe Cyclonic Storm (VSCS) 118–165 km/h 5
Extremely Severe Cyclonic Storm (ESCS) 166–220 km/h 6
Super Cyclonic Storm (SuCS) ≥221 km/h 7

12
In order to calculate weighted intensity of cyclonic activity of each year summation of weights is performed.
Ex: Number of Cyclonic activity observed in year 2015 was 5 (Number of Deep Depression in 2015 – 2, Number of Cyclonic Storm in 2015– 1, Number of Extremely Severe Cyclonic Storm in 2015 – 2)
Therefore, Weighted Intensity of Cyclonic Activity for year 2015 is: 2*2 + 1*3 + 2*6 = 19
Weighted intensity of all cyclonic activity of Arabian Sea between 2001 – 2019 is calculated (Annexure 1) and plotted against year of inception as follows:
Graph 2: Year-wise Weighted Intensity of cyclonic activity in Arabian Sea (2001 – 2019)
The trend line in Graph 2 reveals increase in intensity of cyclonic activity over the period of time.
H: Role of Shelterbelts and Mangroves in Cyclone Risk Mitigation
Nature has provided biological mechanisms for protecting coastal communities from the fury
of cyclones. Mangrove forests safeguards the ecological security of coastal areas and the
livelihood security of fishing and farming communities. Recently the ecological, economic and
social value of mangroves has increased because of projected rise in sea level due to anticipated
global warming.
In addition to mangroves that grow only in the estuarine environment, there are many other
tree species which constitute as a valuable component in safeguarding the ecological security
13
of coastal regions which are known as coastal shelterbelts. Shelterbelts are non-mangrove
strips of vegetation composed of trees mostly casuarina & cashew and shrubs grown along the
coasts to protect coastal areas from high velocity winds. The mangroves and shelterbelt are
powerful tool to mitigate the impact of strong cyclonic activity. They also help in checking the
soil erosion and inward sand drift, thereby protecting cultivated fields, houses and homesteads
near the coast.
H 1: Mangroves and Shelterbelt reducing cyclone risk
Mangroves and Shelterbelts contribute to reducing loss of life and damage to property from
storms and cyclones as they reduce the impacts of waves, storm surges and high winds.
Waves: Mangroves and Shelterbelt rapidly diminish the height of wind and swell waves. Even
during relatively large storm surges the leaves and branches of the forest canopy will help to
reduce wave energy providing the trees are tall enough.
Storm surges: Where mangroves are extensive they are able to reduce storm surge water
depths as the surge flows inland. While storm surge depths may only be reduced by 5-50 cm
per kilometre width of mangroves, nevertheless a small reduction in water level can already
greatly reduce the extent of flooding in low lying areas behind the mangroves.
Debris movement: Debris movement can also be reduced by mangrove as the complex
network of roots and branches can serve to trap even large moving objects.
High wind speeds: The dense mangrove forest and shelterbelts canopies also reduce wind
speeds locally. This prevents further development of wind and swell waves in and immediately
behind the mangroves, potentially reducing damage to nearby infrastructure.
Aftermath: In the aftermath of a storm, mangroves and shelterbelts enhance recovery by
providing food, fuel wood and construction wood.
H2: Literature review of role of shelterbelts and mangroves in cyclone risk mitigation
Following is the brief summary of the studies that were conducted to reveal the role of bio-
shield (mangroves and shelterbelts) in mitigating cyclone risk.
Study 1: Role of forests and trees in protecting coastal areas against cyclones
Fritz et. al 2007 performed a study to identify the role of mangroves in cyclone risk mitigation
in 1999 Orissa Super Cyclonic Storm. Three situations were identified: (1) A village in the
shadow of mangroves; (2) a village not in the shadow of mangroves and with no embankment;
14
and (3) a village not in the shadow of mangroves, but with an embankment on the seaward
side. The study revealed that the damage attributed to the cyclone was more extensive in the
village further away from the mangrove shadow. The village, with no mangrove cover and no
embankment, suffered the highest level of field inundation. The village, which was in the
shadow of mangrove forest and had minimal embankment around it, suffered the least. [6]
Study 2: Socio-economic and environmental impacts of casuarina shelterbelt in the
Chittagong coast of Bangladesh
The study found that the casuarina shelterbelt reduced wind speed, increased the size of sand
dunes, improved the aesthetic value, increased the protection facilities against cyclones, and
enhanced the attractiveness of the beach for tourism. The study found the casuarina shelterbelt
as a successful initiative against cyclones. It enhanced protection facilities significantly against
cyclonic storm from low level to moderate level. [7]
Study 3: Mangroves as protection from storm surges in Bangladesh
Dasgupta et al. 2017 confirmed the protective role of mangroves during cyclones and
highlighted that the extent of reduction of the risk depends on mangrove species, width of
mangrove area as well as the density of planting. Among the species of mangrove considered
in the analysis, Sonneratia apetala caused maximum friction and hindrance to water flow
caused by the storm surges. [8]
Study 4: Cyclone Hudhud: Strategies and Lessons for Preparing Better & Strengthening
Risk Resilience in Coastal Regions of India, 2015
This report was compiled by NDMA as an effort to document good practices and identify
various issues which may need to be considered for effective and coordinated response for
cyclone disaster risk management. This document takes into account the efforts made by the
States of Andhra Pradesh and Odisha in managing Cyclone Hudhud in 2014. The report
mentions that mangroves led to protection of coastal areas from storm surge and recommended
that there is acute need to maintain more shelterbelts and mangrove plantations in coastal areas.
Study 5: Role of Mangroves in mitigating cyclone Gaja’s impact
Muthupet in Tiruvarur district was among the coastal towns that faced the wrath of Cyclone
Gaja. But considering the extent of the damage elsewhere, this town seems to have been spared
the worst, thanks to its mangrove forests. The forest functioned as a shield and curtailed the

15
velocity of the wind. Known as Alaiyathi Kadugal (forests that cool the waves), mangrove
forests are spread across 12,000 hectares and are populated by six plant species. The most
common species is Avicennia Marina, followed by Excoecaria Agallocha, Aegiceras
corniculatum, Acanthus ilicifolius, Suaeda maritima and Suaeda monoica. Since the force of
the wind was deflected by the mangrove forests, it couldn’t uproot coconut trees in Muthupet
in the same manner as it did in other areas. It is believed that if the mangrove bio-shield was
not there, point Calimere (wildlife and bird sanctuary) would have been completely destroyed.
Study 6: Study of Coastal Shelterbelt plantation in cyclone mitigation in the Coastal
regions of Orissa
The MOEF, GOI under the scheme of Integrated Afforestation and Eco-development Project
Scheme, had taken up afforestation activity in the coastal area with suitable tree species to form
a shelterbelt along the coast line to mitigate the impact of strong cyclonic winds. The Govt. of
Orissa undertook shelterbelt plantation in the district of Jagatsinghpur. The district which was
previously severely affected by the cyclone benefited from the coastal shelterbelt plantation.
The study recorded ensured reduced loss from any such activity. [9]
I: Conclusion
The purpose of this report was to understand the frequency of cyclones hitting Gujarat and role
of mangroves and shelterbelts in cyclone risk mitigation.
1. With reference to the scientific studies mentioned in the report it can be reckoned that there
is increase in cyclonic activity in Arabian Sea which is mainly due to the increase in the
temperature of the water body caused by anthropogenic warming from various factors.
2. The vulnerability profile of Gujarat State revealed that the area under consideration i.e.
the coastal regions from Bhavnagar to Navsari are highly prone to cyclone risks.
Bhavnagar and Ahmedabad come under ‘very-high damage risk zone’ and rest of
the districts under consideration comes under ‘high damage risk zone’.
3. The frequency and intensity analysis of cyclonic activity incepting in Arabian Sea have
shown positive trend over the period of time (2001 – 2019) which means that number of
cyclones is going to increase per year and so is their intensity and destructive potential.
4. Role of mangroves and shelterbelts in mitigating cyclone risk was analysed and was found
that they are powerful tool to mitigate the impact of strong cyclonic activity and also help
in checking the soil erosion and inward sand drift, thereby protecting cultivated fields,

16
houses and homesteads near the coast. It was also found that the reduction of the risk
depends on mangrove species, width of mangrove area as well as the density of planting.
Reference
1. Koll, R. M.; Singh, V. K. 2018: Changes in Arabian Sea Tropical Cyclone Activity in Response
to Changing ENSO Conditions, American Geophysical Union, Fall Meeting 2018 Abstract
#A43Q-3372.
2. Murakami Hiroyuki, Vecchi G.A. 2017: Increasing frequency of extremely severe cyclonic
storms over the Arabian Sea, Nature Climate Change, Vol. 7 885 – 889.
3. Evan, Amato T.; Kossin, James P.; `Eddy'chung, Chul; Ramanathan, V. 2011: Arabian Sea
tropical cyclones intensified by emissions of black carbon and other aerosols, Nature, Volume
479, Issue 7371, pp. 94-97 (2011).
4. Sun C., Li J. 2019: Recent Acceleration of Arabian Sea Warming Induced by the Atlantic
Western Pacific Trans basin Multi decadal variability, Geophysical Research Letters, Volume
46, Issue 3.
5. Mohapatra M. 2015: Cyclone hazard proneness of districts of India, J. Earth Syst. Sci. 124, No.
3, pp. 515–526.
6. Fritz H.M. and Blount C. 2007: Role of forests and trees in protecting coastal areas against
cyclones, Chapter 2 Protection from cyclones. pp. 37 – 63.
7. Miah M.D., Siddik M.A. and Shin M. Y. 2013: Socio-economic and environmental impacts of
casuarina shelterbelt in the Chittagong coast of Bangladesh, Forest Science and Technology
Vol. 9, No. 3, 156–163
8. Dasgupta S., Islam M. S. and Huq M. 2017: Mangroves as Protection from Storm Surges in
Bangladesh, Policy Research Working Paper; Vol. 1.
9. Patnaik, S. and Sinha V.K. 2013: Study of Coastal Shelterbelt plantation in cyclone mitigation
in the Coastal regions of Orissa.

17