Embed Size (px)
Citation preview
A Repartitioning Hypergraph Model for
Dynamic Load Balancing ?
Umit V. Catalyurek a,b,∗ Erik G. Boman c,1, Karen D. Devine c,1,Doruk Bozdag b, Robert T. Heaphy c,1, Lee Ann Riesen c,1
aThe Ohio State University, Department of Biomedical InformaticsbThe Ohio State University, Department of Electrical and Computer Engineering
cSandia National Laboratories, Department of Scalable Algorithms
Abstract
In parallel adaptive applications, the computational structure of the applicationschanges over time, leading to load imbalances even though the initial load distribu-tions were balanced. To restore balance and to keep communication volume low infurther iterations of the applications, dynamic load balancing (repartitioning) of thechanged computational structure is required. Repartitioning differs from static loadbalancing (partitioning) due to the additional requirement of minimizing migrationcost to move data from an existing partition to a new partition. In this paper, wepresent a novel repartitioning hypergraph model for dynamic load balancing thataccounts for both communication volume in the application and migration costto move data, in order to minimize the overall cost. Use of a hypergraph-basedmodel allows us to accurately model communication costs rather than approximat-ing them with graph-based models. We show that the new model can be realizedusing hypergraph partitioning with fixed vertices and describe our parallel multi-level implementation within the Zoltan load-balancing toolkit. To the best of ourknowledge, this is the first implementation for dynamic load balancing based onhypergraph partitioning. To demonstrate the effectiveness of our approach, we con-ducted experiments on a Linux cluster with 1024 processors. The results show that,in terms of reducing total cost, our new model compares favorably to the graph-based dynamic load balancing approaches, and multilevel approaches improve therepartitioning quality significantly.
Key words: Dynamic load balancing, hypergraph partitioning, parallel algorithms,scientific computing, distributed memory computers
Preprint submitted to Elsevier 16 July 2008
1 Introduction
An important component of many scientific computing applications is theassignment of computational load onto a set of processors. The problem offinding a task-to-processor mapping that minimizes the total execution timeis known as the mapping problem [5,6,10,12,13,15,25,46,47,52,53,57]. Althoughefficient optimal solutions exist for certain restricted cases, such as chain- ortree-structured programs [35], the general mapping problem is NP-hard [40]. Inthis paper we consider the general problem where any task can potentially beassigned to any processor. In the literature, a two-step approach is commonlyemployed to solve the problem: first tasks are partitioned into load-balancedclusters of tasks, then these clusters are mapped to processors [10,47]. In thepartitioning step, a common goal is to minimize the interprocessor commu-nication while maintaining a computational load balance among processors.Partitioning occurs at the start of a computation (static partitioning), butoften, reassignment of work is done during a computation (dynamic partition-ing or repartitioning) as the work distribution changes over the course of thecomputation. time. For instance, a computational mesh in an adaptive meshrefinement simulation is updated between time steps. Therefore, after severalsteps, even an initially balanced assignment of work to processors may suf-fer serious imbalances. To maintain the balance in subsequent computationsteps, a repartitioning procedure that moves data among processors needs tobe applied periodically.
Repartitioning is a well-studied problem [19,20,24,27,32,33,42,43,50,51,55,53,58,61,62]that has multiple objectives with complicated trade-offs among them:
(1) balanced load in the new data distribution;(2) low communication cost within the application (as determined by the
new distribution);(3) low data migration cost to move data from the old to the new distribution;
and
? The research was supported in part by the National Science Foundation un-der Grants #CNS-0643969, #CCF-0342615, #CNS-0426241, #CNS-0403342, NIHNIBIB BISTI #P20EB000591, Ohio Supercomputing Center #PAS0052, and by theDepartment of Energy’s Office of Science through the CSCAPES SciDAC Institute.∗ Corresponding author. Tel: 614-292-0914, Fax: 614-688-6600.
Email addresses: [email protected] (Umit V. Catalyurek),[email protected] (Erik G. Boman), [email protected] (Karen D. Devine),[email protected] (Doruk Bozdag), [email protected] (RobertT. Heaphy), [email protected] (Lee Ann Riesen).1 Sandia is a multiprogram laboratory operated by Sandia Corporation, a LockheedMartin company, for the U.S. Department of Energy’s National Nuclear SecurityAdministration under contract DE-AC04-94AL85000.
2
(4) short repartitioning time.
Total application execution time is commonly modeled [39,50] as follows toaccount for these objectives:
ttot = α(tcomp + tcomm) + tmig + trepart. (1)
Here, tcomp and tcomm denote the application’s computation and communica-tion times, respectively, in a single iteration of the application; tmig is the datamigration time from existing to new partitions; and trepart is the repartition-ing time. The parameter α indicates how many iterations (e.g., time stepsin a simulation) of the application are executed between each load-balanceoperation.
The computation time tcomp of a parallel application is minimized when thecomputational load is evenly distributed on the set of processors. Since achiev-ing load balance is the main constraint on repartitioning algorithms, we cansafely assume that the computational load will be balanced; hence tcomp isinherently minimized by the repartitioning algorithm. Furthermore, the timerequired by state-of-the-art repartitioning programs to produce a new parti-tioning is typically much smaller than αtcomp. As a result, tcomp and trepart
in (1) can be ignored; the cost function to be minimized by the repartitioningalgorithm reduces to
costtime = αtcomm + tmig (2)
Because time for communication depends on a number of architecture-specificfactors (e.g., network topology, message latency), general partitioning modelstypically assume the time spent in communication is proportional to the “vol-ume” of communication, i.e., the amount of data being sent [29]. Thus, thecost function to be minimized by the repartitioning algorithm becomes
costvol = αbcomm + bmig (3)
where bcomm is the amount of data sent in each iteration of the applicationand bmig is the amount of data sent during migration.
In this work, we present a repartitioning-hypergraph model that minimizes thesum of total communication volume in the application and migration cost tomove data, as stated in (3). The repartitioning-hypergraph model is first in-troduced in our preliminary work in [14]. Hypergraphs accurately model theactual application communication cost and have greater applicability thangraphs (e.g., hypergraphs can represent non-symmetric and/or non-square sys-tems) [16]. Therefore, the actual value of bcomm is considered in the proposed
3
model, rather than its approximation as in the case of graph-based models [29].Furthermore, in our repartitioning-hypergraph model, communication and mi-gration costs are appropriately combined to allow reuse of existing hypergraphpartitioners for repartitioning. The new model can be realized effectively witha hypergraph partitioning tool that provides hypergraph partitioning withfixed vertices. Although serial hypergraph partitioners with this feature exist([3,17]), to the best of our knowledge our implementation in Zoltan [7] is thefirst parallel hypergraph partitioner that can handle fixed vertices.
The remainder of this paper is organized as follows. In Section 2, we discussprevious work on dynamic load balancing. We present preliminaries for hy-pergraph partitioning and multilevel partitioning in Section 3. The detailsof the proposed repartitioning-hypergraph model are presented in Section 4.Section 5 describes the parallel hypergraph-based repartitioning algorithm de-veloped within the Zoltan [63] toolkit. Section 6 includes a detailed empiricalcomparison of various graph- and hypergraph-based repartitioning approaches.Finally, in Section 7, we give our conclusions and suggest future work.
2 Related Work
Dynamic load-balancing approaches can be classified into three main cate-gories: scratch-remap, incremental and repartitioning. In scratch-remap meth-ods, the computational model representing the modified structure of the appli-cation is partitioned from scratch without accounting for existing part assign-ments. Then, old and new partitions are remapped to minimize the migrationcost [51,42]. In incremental methods, existing part assignments are used asinitial assignments and incrementally improved by using a sub-optimal costfunction that minimizes either data migration cost (diffusive methods) or ap-plication communication cost (refinement methods). In repartitioning meth-ods, existing part assignments are taken into account to minimize both datamigration cost and application communication cost as stated in (3).
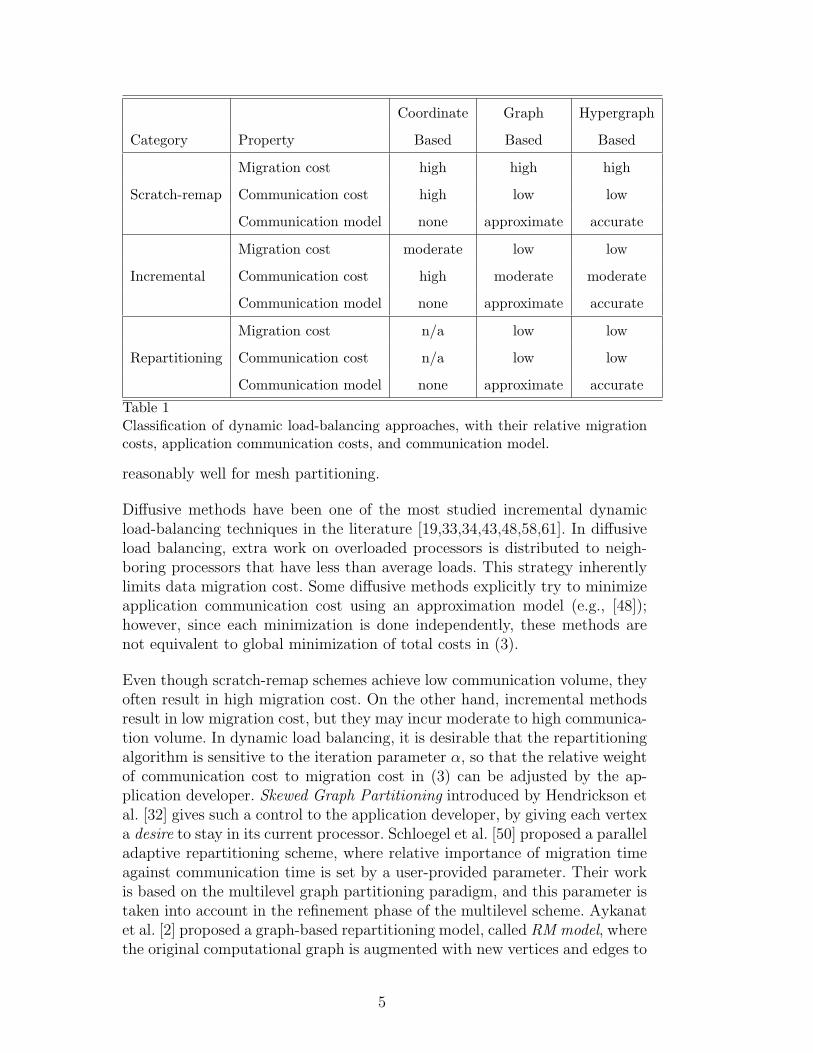
Another way of classifying dynamic load balancing methods is with respectto the computational models they use. There are three computational mod-els commonly used in the literature. These are coordinate-based, graph-basedand hypergraph-based models. Table 1 summarizes properties of dynamic loadbalancing approaches in each category.
Some of the early dynamic load-balancing techniques are coordinate-based ap-proaches such as Recursive Coordinate Bisection [4] and Space-Filling Curves [44,45,60].These approaches can be applied either from scratch or incrementally. Theyrequire geometric coordinates and do not model communication or migrationcosts explicitly. Still, due to structure of the application data, they often work
4
Coordinate Graph Hypergraph
Category Property Based Based Based
Migration cost high high high
Scratch-remap Communication cost high low low
Communication model none approximate accurate
Migration cost moderate low low
Incremental Communication cost high moderate moderate
Communication model none approximate accurate
Migration cost n/a low low
Repartitioning Communication cost n/a low low
Communication model none approximate accurate
Table 1Classification of dynamic load-balancing approaches, with their relative migrationcosts, application communication costs, and communication model.
reasonably well for mesh partitioning.
Diffusive methods have been one of the most studied incremental dynamicload-balancing techniques in the literature [19,33,34,43,48,58,61]. In diffusiveload balancing, extra work on overloaded processors is distributed to neigh-boring processors that have less than average loads. This strategy inherentlylimits data migration cost. Some diffusive methods explicitly try to minimizeapplication communication cost using an approximation model (e.g., [48]);however, since each minimization is done independently, these methods arenot equivalent to global minimization of total costs in (3).
Even though scratch-remap schemes achieve low communication volume, theyoften result in high migration cost. On the other hand, incremental methodsresult in low migration cost, but they may incur moderate to high communica-tion volume. In dynamic load balancing, it is desirable that the repartitioningalgorithm is sensitive to the iteration parameter α, so that the relative weightof communication cost to migration cost in (3) can be adjusted by the ap-plication developer. Skewed Graph Partitioning introduced by Hendrickson etal. [32] gives such a control to the application developer, by giving each vertexa desire to stay in its current processor. Schloegel et al. [50] proposed a paralleladaptive repartitioning scheme, where relative importance of migration timeagainst communication time is set by a user-provided parameter. Their workis based on the multilevel graph partitioning paradigm, and this parameter istaken into account in the refinement phase of the multilevel scheme. Aykanatet al. [2] proposed a graph-based repartitioning model, called RM model, wherethe original computational graph is augmented with new vertices and edges to
5

account for migration cost. Then, repartitioning with fixed vertices is appliedto the graph using RM-METIS, a serial repartitioning tool that the authorsdeveloped by modifying the graph partitioning tool METIS [36]. Althoughthe approaches of Hendrickson et al. [32], Schloegel et al. [50] and Aykanat etal. [2] attempt to minimize both communication and migration costs, their ap-plicability is limited to problems with symmetric, bi-directional dependencies.A hypergraph-based model is proposed in a concurrent work of Cambazogluand Aykanat [11] for the adaptive screen partitioning problem in the contextof image-space-parallel direct volume rendering of unstructured grids. Despitethe fact that the limitations mentioned above for graph-based models do notapply, their model accounts only for migration cost since communication oc-curs merely for data replication (migration) in that problem.
3 Preliminaries
In this section, we present a brief description of hypergraph partitioning withfixed vertices as well as the multilevel partitioning paradigm.
3.1 Hypergraph Partitioning with Fixed Vertices
Hypergraphs can be viewed as generalizations of graphs where an edge is notrestricted to connect only two vertices. Formally, a hypergraph H = (V, N) isdefined by a set of vertices V and a set of nets (hyperedges) N , where eachnet nj ∈ N is a non-empty subset of vertices. A weight wi can be assigned toeach vertex vi ∈ V , and a cost cj can be assigned to each net nj ∈ N .
P = {V1, V2, . . . , Vk} is called a k-way partition of H if each part Vp, p =1, 2, . . . , k, is a non-empty, pairwise-disjoint subset of V and ∪k
p=1Vp = V . Apartition is said to be balanced if
Wp ≤ Wavg(1 + ε) for p = 1, 2, . . . , k, (4)
where part weight Wp =∑
vi∈Vpwi and Wavg =
(∑vi∈V wi
)/k, and ε > 0 is a
predetermined maximum tolerable imbalance.
In a given partition P , a net that has at least one vertex in a part is consideredto be connected to that part. The connectivity λj of a net nj denotes thenumber of parts connected by nj under the partition P of H. A net nj is saidto be cut if it connects more than one part (i.e., λj > 1).
6

Let CutCost(H, P ) denote the cost associated with a partition P of hyper-graph H. There are various ways to define CutCost(H, P ) [41]. The relevantone for our context is known as connectivity-1 (or k-1) metric, defined asfollows:
CutCost(H, P ) =∑
nj∈N
cj(λj − 1) (5)
We prefer this cost metric because it exactly corresponds to communicationvolume in parallel computing for important operations like matrix-vector mul-tiplication [16]. The standard hypergraph partitioning problem [41] can thenbe stated as the task of dividing a hypergraph into k parts such that thecost (5) is minimized while the balance criterion (4) is maintained.
Hypergraph partitioning with fixed vertices is a more constrained version ofthe standard hypergraph partitioning problem. In this problem, in additionto the input hypergraph H and the requested number of parts k, a fixed-partfunction f(v) is also provided as an input to the problem. A vertex is said tobe free (denoted by f(v) = −1) if it is allowed to be in any part in the solutionP , and it is said to be fixed in part q (f(v) = q for 1 ≤ q ≤ k) if it is requiredto be in Vq in the final solution P . If a significant portion of the vertices arefixed, it is expected that the partitioning problem becomes easier. Clearly,in the extreme case where all the vertices are fixed (i.e., f(v) 6= −1 for allv ∈ V ), the solution is trivial. Empirical studies of Alpert et al. [1] verify thatthe presence of fixed vertices can make a partitioning instance considerablyeasier. However, to the best of our knowledge, there is no theoretical workon the complexity of the problem. Experience shows that if only a very smallfraction of vertices are fixed, the problem is almost as “hard” as the standardhypergraph partitioning problem.
3.2 Multilevel Partitioning Paradigm
Although graph and hypergraph partitioning are NP-hard [28,41], several al-gorithms based on multilevel paradigms [9,31,37] have been shown to com-pute high quality partitions in reasonable time. In addition to serial partition-ers for graphs [30,36,56] and hypergraphs [17,38], the multilevel partitioningparadigm has been adopted by parallel graph [56,39] and, quite recently, hy-pergraph [22,54] partitioners as well.
Multilevel partitioning consists of three phases: coarsening, coarse partition-ing and refinement. Instead of partitioning the original hypergraph directly, ahierarchy of smaller hypergraphs that approximate the original one is gener-ated during the coarsening phase. The smallest hypergraph obtained at the
7

end of the coarsening phase is partitioned in the coarse partitioning phase.Finally, in the refinement phase, the coarse partition is projected back to thelarger hypergraphs in the hierarchy and improved using a local optimizationmethod. The same procedure applies to graphs as well.
In Section 5, we describe a technique for parallel multilevel hypergraph par-titioning with fixed vertices [14]. The implementation is based on the parallelhypergraph partitioner in Zoltan [22].
4 Repartitioning Hypergraph Model
In this section, we present our novel hypergraph model and explain how itaccounts for the trade-off between communication and migration costs due todifferent values of α. By representing these costs appropriately in a reparti-tioning hypergraph, the proposed approach allows use of existing hypergraphpartitioning tools to optimize the composite objective defined in (3).
We call the period between two subsequent load-balancing operations an epochof the application. An epoch consists of one or more computation iterationsand the computational structure and dependencies of an epoch can be accu-rately modeled with a computational hypergraph [16]. Even though computa-tions in the application are of the same type, a different hypergraph is neededto represent each epoch due to changes in the structure of the hypergraphacross epochs. We denote the hypergraph that models the jth epoch of theapplication by Hj = (V j, N j) and the number of computation iterations inthat epoch by αj.
Load balancing for the first epoch is achieved by partitioning H1 using astatic partitioner. For the remaining epochs, data redistribution cost betweenthe previous and current epochs should also be included during load balancing.Therefore, the actual cost (3) is the sum of the communication cost bcomm forHj with the new data distribution, scaled by αj, and the migration cost bmig
for moving data between the distributions in epoch j − 1 and j.
Our new repartitioning hypergraph model appropriately captures both appli-cation communication and data migration costs associated with an epoch. Tomodel migration costs in epoch j, we construct a repartitioning hypergraphHj = (V j, N j) by augmenting Hj with k new vertices corresponding to eachof the k parts, and |V j| new hyperedges using the following procedure:
• Scale each net’s cost (representing application communication) in N j by αj
while keeping the vertex weights intact.• Add a new part vertex ui with zero weight for each part i, and fix those
8
vertices in respective parts; i.e., f(ui) = i for i = 1, 2, . . . , k. Hence V j
becomes V j ∪ {ui|i = 1, 2, . . . , k}.• For each vertex v ∈ V j, add a migration net nv between v and ui if v is
assigned to part i at the beginning of epoch j. Set the migration net’s cost cv
to the size of the data associated with v, since this migration net representsthe cost of moving vertex v to a different part.
Once the new repartitioning hypergraph Hj that encodes both communica-tion and migration costs is constructed, the repartitioning problem reduces tohypergraph partitioning with fixed vertices using connectivity-1 metric (5).
Let P = {V1, V2, . . . , Vk} be a valid partition of Hj. Since fixed part verticeshave zero weights, part weights are equal to the sum of the computationalvertices’ weights. Therefore, maintaining the balance criterion (4) in this par-tition corresponds to having a balanced computation in epoch j. Minimizingthe connectivity-1 cost metric (5) exactly corresponds to minimizing the repar-titioning cost costvol in (3). That is, for epoch j,
costvol = CutCost(Hj, P j). (6)
Since we obtained Hj by augmenting Hj we can further expand this formulaas
costvol = αjCutCost(Hj, P j) +∑
nv∈(Nj−Nj)
cv(λv − 1), (7)
where P j = {V1, V2, . . . , Vk} is the same as P j except it does not contain partvertices. In (7), the first term, αjCutCost(Hj, P j), corresponds to the amountof data sent in each iteration of the application [16] (i.e., bcomm in (3)) and thesecond term corresponds to the amount of data sent during migration (i.e.,bmig in (3)).
Assume that a vertex v is assigned to part p in epoch j − 1 and part q inepoch j, where p 6= q. Then, the migration net nv between v and up thatrepresents the migration cost of vertex v’s data is cut with connectivity ofλv = 2 (note that up is fixed in part p). Therefore, the cost of moving vertexv from part p to q, cv, is appropriately included in the total cost. If a netthat represents communication during the computation phase is cut, the costincurred by communicating the associated data in all αj iterations in epoch j isalso accounted for since the net’s weight has already been scaled by αj. Hence,our repartitioning hypergraph accurately models the sum of communicationduring computation phase and migration cost due to moved data.
Figure 1(a) illustrates a sample computational hypergraph Hj at the begin-ning of epoch j. The corresponding repartitioning hypergraph Hj is displayedin Figure 1(b). A nice feature of our model is that no distinction is required
9
P1 P2
P3
7 3
6
3
4
3
46
46 7
7
(a)
P1 P2
P3
7 3
6
3
4
3
46
46 7
7
u1
u2
u3
(b)P1 P2
P3
7 3
6
3
4
3
4
646
7
7
u1
u2
u3
(c)
P1 P2
P3
73
63
4
3
4
6
46 7
7
u1
u2
u3
(d)
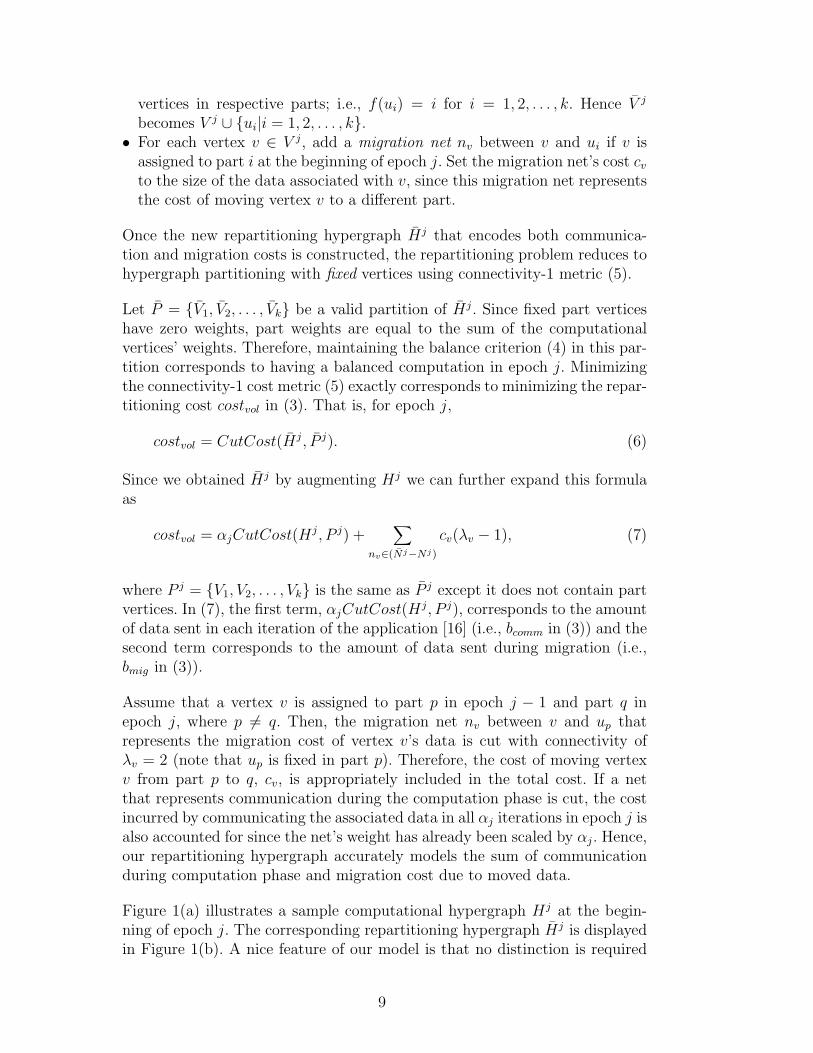
Fig. 1. (a): A sample computational hypergraph representation at the beginningof epoch j. Nets are depicted as squares and vertices are depicted as circles. Thenumbers inside the circles are the computational loads of each vertex. (b): Reparti-tioning hypergraph for epoch j; for simplicity in the presentation, migration nets aredepicted as diamonds and part vertices are depicted as octagons. (c) and (d): Twosample solutions with bcomm = 4, bmig = 2, and bcomm = 3, bmig = 4, respectively,under the assumption that the migration cost of each computation vertex and theapplication communication cost per net are one (i.e., each net’s cost is one).
between communication and migration nets as well as computation and partvertices. However, for clarity in this figure, we represent computation verticeswith circles and part vertices with octagons. Similarly, application communi-cation nets are represented with squares, and migration nets are representedwith diamonds. In this example, at the beginning of epoch j, there are twelve
10
computation vertices with various computational loads (represented by thenumbers inside the circles). Computational load is initially in three highly im-balanced parts. Three cut nets represent data that need to be communicatedamong the parts. Two of these nets have connectivity λ = 3 and one hasλ = 2. Assuming unit cost for each net, total communication cost (5) is five.In other words, if the application chooses to continue with this partitioning,each iteration of epoch j incurs a communication cost of five units.
In Figure 1(b), to construct the repartitioning hypergraph Hj from Hj, threepart vertices u1, u2 and u3 are added and net weights in Hj are scaled by αj.Then, each of the twelve computation vertices is connected via a migration netto the part vertex associated with the part to which the computation vertexwas assigned at the beginning of epoch j.
Two balanced sample solutions for the repartitioning problem are depictedin Figures 1(c) and 1(d). Assume that the sizes of the data associated witheach computation vertex and application communication net are the same; i.e.,communication and migration nets have unit costs. In Figure 1(c), two verticeswith weights three and six are migrated from part 1 to part 2, resulting inmigration cost of two and communication cost of four units at each iteration,due to four cut nets with connectivity two. In Figure 1(d), while two verticeswith weights three and six are migrated from part 1 to part 3, two vertices ofpart 3 are migrated to part 2. This distribution results in migration cost of fourand communication cost of three units at each iteration. These two solutionspresent an example of the trade-off between communication and migrationcosts in the repartitioning problem. Assume that epoch j consists of only oneiteration (αj = 1). Then the solution presented in Figure 1(c) is better thanthe solution presented in Figure 1(d), because the former has a total cost ofsix, whereas the latter has a total cost of seven. However, if epoch j consistsof ten iterations (αj = 10), the solution presented in Figure 1(d) is betterbecause it has a total cost of 34, whereas Figure 1(c) has a total cost of 42.With the user-specified αj parameter, our repartitioning hypergraph modelaccurately accounts for this trade-off.
5 Parallel Repartitioning Tool
The dynamic repartitioning model presented in the previous section can beimplemented using parallel hypergraph partitioning with fixed vertices. Insuch an implementation, the multilevel algorithms commonly used for hyper-graph partitioning (as described in Section 3) are adapted to handle fixedvertices [3,17]. In each phase of the multilevel partitioning, the fixed part con-straints defined by f(v) must be maintained for each vertex v and its resultingcoarse vertices. In this section, we describe our approach for parallel multilevel
11

hypergraph partitioning with fixed vertices [14] using the parallel hypergraphpartitioner in Zoltan [22]. We first assume that we partition directly into kparts, and later discuss how fixed vertices are handled when recursive bisectionis used to obtain k parts.
5.1 Coarsening Phase
In the coarsening phase of the multilevel algorithms, we approximate the orig-inal hypergraph with a succession of smaller hypergraphs with similar con-nectivity and equal total vertex and edge weight. Coarsening ends when thecoarsest hypergraph is “small enough” (e.g., it has fewer than 2k vertices)or when the last coarsening step fails to reduce the hypergraph’s size by aspecified amount (typically 10%). To reduce the hypergraph’s size, we mergesimilar vertices, i.e., vertices whose hyperedge connectivity overlaps signifi-cantly. In this paper, we use an agglomerative matching technique that hasbeen called as heavy-connectivity clustering in PaToH [17,16].
Parallel matching is performed in rounds. In each round, each processor broad-casts a subset of candidate vertices that will be matched in that round. Then,all processors concurrently compute their best match for those candidates andthe global best match for each candidate is selected. In agglomerative match-ing, candidate vertices are allowed to join already matched vertices to form alarger cluster as long as the final cluster’s size is not larger than a quarter ofa target part size.
For fixed-vertex partitioning, we constrain matching to propagate fixed-vertexconstraints to coarser hypergraphs so that coarser hypergraphs truly approxi-mate the finer hypergraphs and their constraints. We do not allow vertices tomatch if they are fixed to different parts. Thus, there are three scenarios inwhich two vertices match: 1) both vertices are fixed to the same part, 2) onlyone of the vertices is fixed to a part, or 3) both are not fixed to any parts (i.e.,both are free vertices). In cases 1 and 2, the resulting coarse vertex is fixedto the part in which either of its constituent vertices was fixed. In case 3, theresulting coarse vertex remains free.
5.2 Coarse Partitioning Phase
In the coarse partitioning phase, we construct an initial partition of the coars-est hypergraph available. If the coarsest hypergraph is small enough, we repli-cate it on every processor. Each processor then runs a randomized greedyhypergraph growing algorithm to compute a different partition into k parts,and the partition with the lowest cost is selected. If the coarsest hypergraph is
12
not small enough, each processor contributes to computation of an initial par-tition using a localized version of the greedy hypergraph algorithm. In eithercase, we maintain the fixed part constraints by assigning fixed coarse verticesto their respective parts.
5.3 Refinement Phase
In the refinement phase, we project our coarse partition to finer hypergraphsand improve it using a local optimization method. Our code is based on alocalized version of the successful Fiduccia–Mattheyses [26] method, as de-scribed in [22]. The algorithm performs multiple pass-pairs and in each pass,each free vertex is considered to move to another part to reduce the cut metric.We enforce the fixed vertex constraints simply; we do not allow fixed verticesto be moved out of their fixed part.
5.4 Handling Fixed Vertices in Recursive Bisection
Zoltan uses recursive bisection (repeated subdivision of parts into two parts) toobtain a k-way partition. This recursive bisection approach can be extendedeasily to accommodate fixed vertices. For example, in the first bisection ofrecursive bisection, the fixed vertex information of each vertex can be updatedso that vertices that are originally fixed to parts 1 ≤ p ≤ k/2 are fixed to part1, and vertices originally fixed to parts k/2 < p ≤ k are fixed to part 2. Then,the multilevel partitioning algorithm with fixed vertices described above canbe executed without any modifications. This scheme is applied recursively ineach bisection.
6 Experimental Results
In this section we present detailed comparisons of various graph- and hypergraph-based repartitioning approaches using dynamic datasets that are syntheticallygenerated using real application base cases, as well as real dynamic data fromapplications in data mining and adaptive mesh refinement simulations. Formost experiments, we select square, structurally symmetric data to allow com-parisons between graph and hypergraph methods; the data mining application,however, demonstrates the greater applicability of hypergraph methods tonon-symmetric, rectangular data — in this case, term-by-document matrices.
13

6.1 Repartitioning Approaches
We consider three aspects of repartitioning methods and compare differentoptions provided by various algorithms as well as the algorithms themselves.
• Repartitioning technique: Following the discussion in Section 2, we classifyrepartitioning techniques into three categories: scratch-remap, incrementaland repartitioning. Repartitioning approaches have been shown to outper-form diffusive methods in [50]; therefore, we consider only refinement ap-proaches within the incremental techniques category.
• Cost model: Hypergraph models accurately represent communication andmigration costs for multi-way interactions, while graph models representapproximate costs. We do not consider coordinate-based models here, sincethey are not general (e.g., they cannot be applied to data without coordi-nates) and they do not model communication and migration costs explicitly.
• Optimization method: We also make a distinction between single-level versusmulti-level partitioners and compare their performance.
Repartitioning Cost Optimization
Partitioner technique model method Software
Z-repart repartitioning hypergraph multilevel Zoltan
Z-SL-repart repartitioning hypergraph single level Zoltan
Z-scratch scratch-remap hypergraph multilevel Zoltan
Z-SL-refine iterative hypergraph single level Zoltan
M-repart repartitioning graph multilevel ParMETIS
M-scratch scratch-remap graph multilevel ParMETIS
Table 2Properties of the partitioners used in the experimental evaluation.
We compare six different partitioners given in Table 2 that collectively coverall options with respect to each of the three aspects considered. In our exper-iments, we use ParMETIS version 3.1 [39] for graph partitioning and Zoltanversion 3.0 [7,14,22] for hypergraph partitioning. For the scratch methods,we used a maximal matching heuristic in Zoltan to map part numbers be-tween old and new partitions to reduce migration cost. We do not expect thepartitioning-from-scratch methods to be competitive for dynamic problems,but include them as a useful baseline.
14
6.2 Dynamically Perturbed Data Experiments
To perform experiments on large numbers of processors, we collected staticdata from three real applications and dynamically perturbed the data over aseries of time-steps. The properties of the application datasets are shown inTable 3. These datasets provide a range of sparsity and regularity representa-tive of different applications.
Two different methods are used to dynamically perturb the data in the exper-iments. The first method introduces biased random perturbations that changethe structure of the data. In this method, a certain fraction of vertices inthe original data is randomly deleted along with the incident edges. At eachrepartitioning iteration, this operation is repeated independently from previ-ous iterations; hence, a different subset of vertices from the original data isdeleted. This operation simulates dynamically changing data that can bothlose and gain vertices and edges. The results presented in this section corre-spond to the case where half of the parts lose or gain 25% of the total numberof vertices at each iteration. We tested several other configurations by vary-ing the fraction of vertices lost or gained. The results we obtained in theseexperiments were similar to the ones presented in this section.
The second method simulates adaptive mesh refinement. Starting with the ini-tial data, a certain fraction of the parts at each iteration is randomly selected.Then, the sub-domain corresponding to the selected parts performs a simu-lated mesh refinement, where the weight and size of each vertex are increasedby a constant factor. In the experiments in this section, 10% of the parts areselected at each iteration and the weight and size of each vertex in these partsare randomly increased to between 1.5 and 7.5 of their original value. Similarto the previous method, we tested several other configurations by varying thefactor that scales the size and weight of vertices. The results obtained in theseexperiments were similar to the ones presented here.
We performed the dynamically perturbed data experiments on Sandia’s Thun-derbird cluster. Each node of Thunderbird has dual 3.6GHz Intel EM64T pro-cessors with 6GB of RAM. The nodes are interconnected with an Infinibandnetwork. We use Intel v10.0 compilers with -O0 optimization flag and Open-MPI v1.2.4. All experiments were run on 64, 256, and 1024 processors.
(Note to Reviewers: Several ParMETIS experiments failed on Thunderbirdunder this configuration. We suspect the problem lies not in ParMETIS but inThunderbird’s compiler/configuration. Before final publication, we will workwith the Thunderbird system administrators to obtain the missing ParMETISresults.)
In Figures 2 through 7, the parameter α, the number of iterations in an epoch,
15

Table 3Properties of the test datasets; |V | and |E| are the numbers of vertices and graphedges, respectively.
Name |V | |E| vertex degree Application Area
min max avg
xyce680s 682,712 823,232 1 209 2.4 VLSI design
slac6M 5,955,366 11,766,788 2 4 4.0 Finite element mesh
cage15 5,154,859 47,022,346 2 46 18.2 DNA electrophoresis
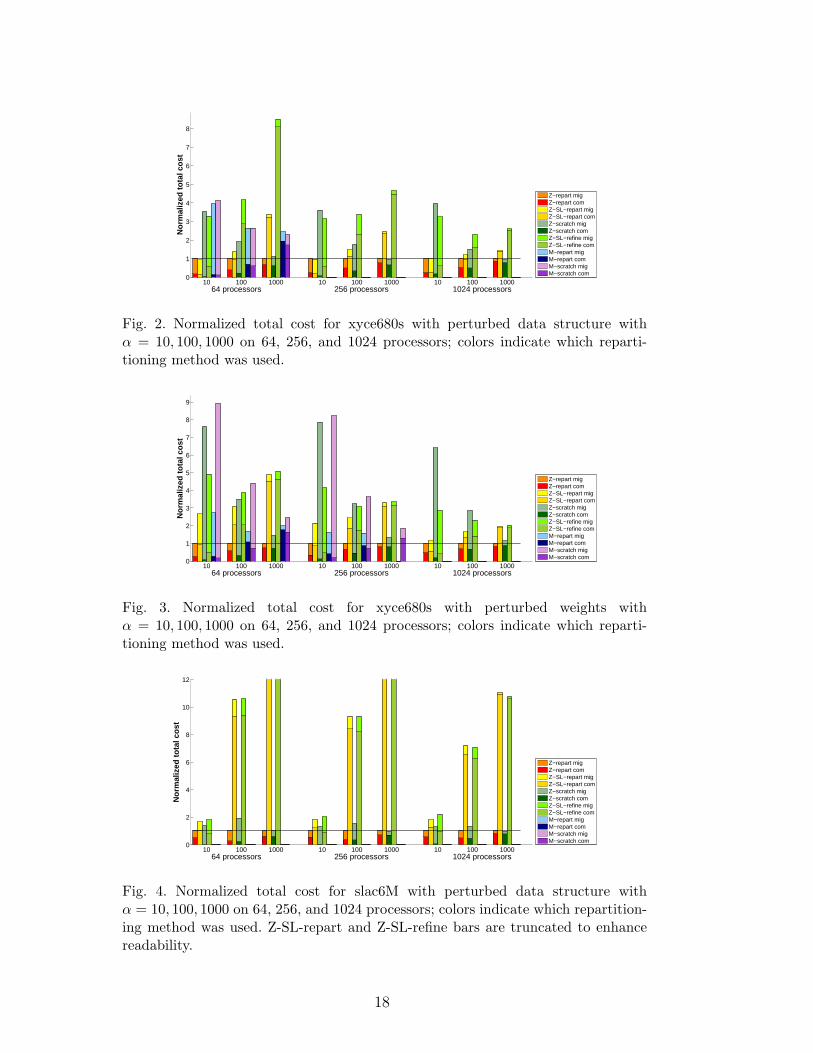
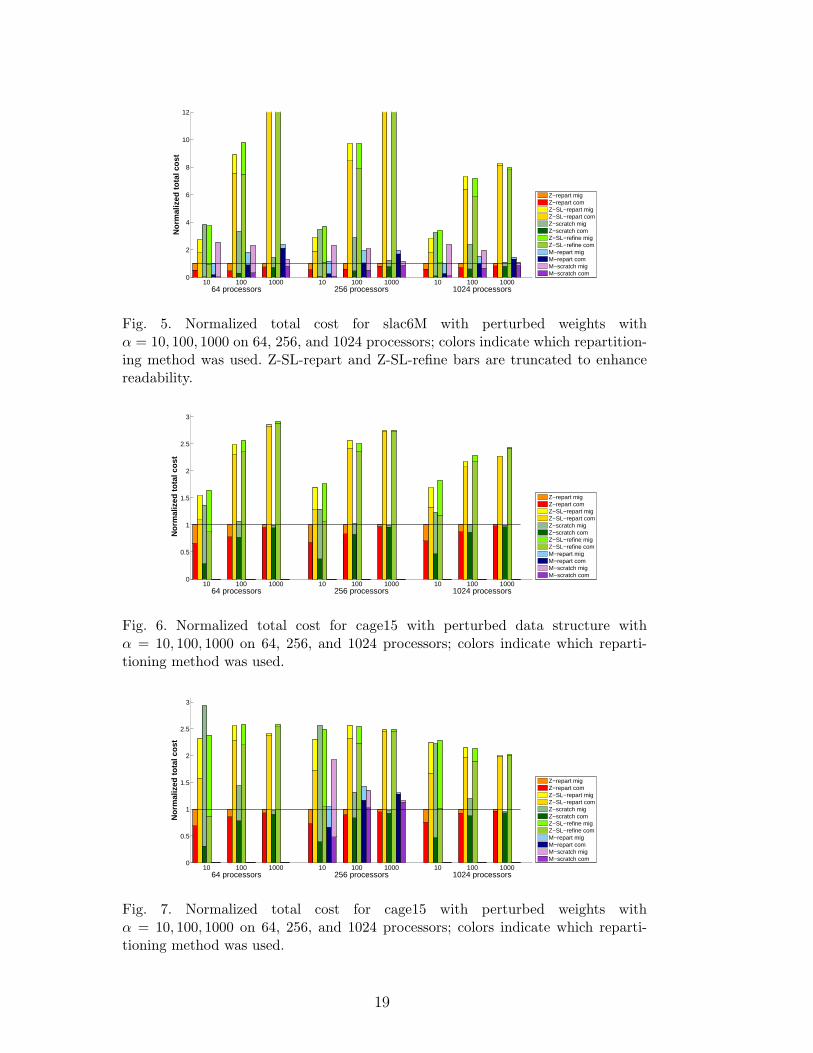
is varied from 10 to 1000, and total cost (3) is reported for 64, 256 and 1024processors (parts). Each result is averaged over a sequence of 20 trials for eachexperiment. For each configuration, there are six bars representing total costfor Z-repart, Z-SL-repart, Z-scratch, Z-SL-refine, M-repart, and M-scratch,from left to right respectively. The total cost in each bar is normalized bythe total cost of Z-repart in the respective configuration and consists of twocomponents: application communication costs (scaled by α) on the bottom(darker shade) and migration costs on the top (lighter shade). Results areshown for both the dynamic structure perturbations and the dynamic weightperturbations.
The results indicate that our new hypergraph repartitioning method Z-repartperforms better than M-repart in terms of minimizing the total cost in themajority of the test cases. This can be explained by the fact that the migrationcost minimization objective is completely integrated into the multilevel schemerather than handled in only the refinement phase. Therefore, Z-repart providesa more accurate trade-off between communication and migration costs thanM-repart to minimize the total cost. This is more clearly seen for small andmoderate α values where these two costs are comparable. On the other hand,for large α values, the migration cost is less important relative to communi-cation cost, and the problem essentially reduces to minimizing the commu-nication cost alone. Therefore, in such cases, Z-repart and M-repart behavesimilarly to partitioners using scratch methods.
Similar arguments hold when comparing Z-repart against scratch-remap repar-titioning methods. Since minimization of migration cost is ignored in Z-scratchand M-scratch, migration cost gets extremely large and dominates the totalcost as α gets smaller. Total cost with Z-scratch and M-scratch is comparableto Z-repart only when α is greater than 100, where communication cost startsto dominate. Z-repart still performs as well as the scratch methods in thisrange to minimize the total cost.
As the number of parts (processors) increases, there is a noticeable increasein migration cost relative to communication cost when using M-repart. Onthe other hand, with Z-repart the increase in migration cost is smaller at the
16

expense of a modest increase in communication cost. This shows that Z-repartachieves a better balance between communication and migration costs, andconsequently results in a smaller total cost than M-repart with increasingnumber of parts. This suggests that in addition to minimization of the totalcost, Z-repart is superior to M-repart in terms of scalability of the solutionquality.
Z-refine and Z-SL-repart attempt to minimize communication volume withrelatively fewer vertex movements due to the constrained initial partition.Therefore, the communication cost of these methods is higher than other par-titioners, resulting in a relatively higher total cost for large α values. On theother hand, both methods produce lower migration costs compared to scratchmethods for small α values. Both Z-refine and Z-SL-repart, however, are out-performed by Z-repart in all of our test cases. Indeed, the benefit of multi-levelmethods is clearly shown in the comparisons of Z-repart and Z-SL-repart.
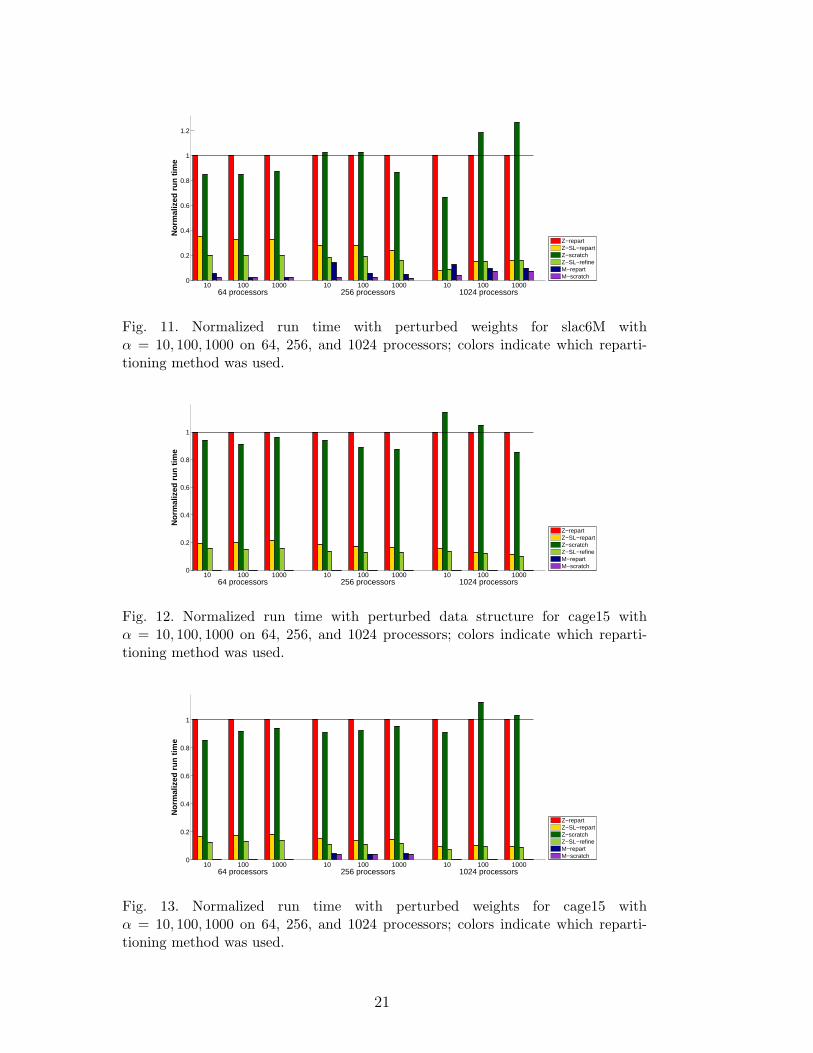
Run times of the tested partitioners normalized by that of Z-repart for theperturbed structure and weight experiments are given in Figures 8–13. We ob-served two different run time profiles in our test cases. The first one is shown inFigures 8 and 9 for the xyce680s dataset, where multilevel hypergraph-basedmethods Z-repart and Z-scratch are at least as fast as their graph-based coun-terparts M-repart and M-scratch. In some cases (e.g. perturbed data structure,running on 64 processors) hypergraph-based approaches are up to five timesfaster than graph-based approaches. Z-SL-repart is significantly faster thanmost other methods in this dataset with relatively low total cost; therefore, itbecomes a viable option for applications that require a very fast repartitionerfor small α values. The second run time profile is observed in Figures 10-13for the slac6M and cage15 datasets. The results show that hypergraph-basedrepartitioning can be up ten times slower than graph-based approaches. Asthese results show, there is no clear conclusion on which approach is faster.Furthermore, since the application run time is often far greater than the par-titioning time, this enhancement may not be important in practice.
6.3 Adaptive Mesh Refinement Experiments
Adaptive mesh refinement is a decades-old technique used in finite elementanalysis to obtain desired solution resolution with an optimal number of de-grees of freedom. At each time step, the finite element code computes boththe solution and an estimate of the error in the solution. Elements in regionswith high error are subdivided into many smaller elements, while elementsin regions with low error are coalesced into fewer large elements. Subsequentsolves, then, obtain greater resolution in the high-error regions without addingunnecessary degrees of freedom in low-error regions.
17
10 100 1000 10 100 1000 10 100 10000
1
2
3
4
5
6
7
8
64 processors 256 processors 1024 processors
No
rmal
ized
to
tal c
ost
Z−repart migZ−repart comZ−SL−repart migZ−SL−repart comZ−scratch migZ−scratch comZ−SL−refine migZ−SL−refine comM−repart migM−repart comM−scratch migM−scratch com
Fig. 2. Normalized total cost for xyce680s with perturbed data structure withα = 10, 100, 1000 on 64, 256, and 1024 processors; colors indicate which reparti-tioning method was used.
10 100 1000 10 100 1000 10 100 10000
1
2
3
4
5
6
7
8
9
64 processors 256 processors 1024 processors
No
rmal
ized
to
tal c
ost
Z−repart migZ−repart comZ−SL−repart migZ−SL−repart comZ−scratch migZ−scratch comZ−SL−refine migZ−SL−refine comM−repart migM−repart comM−scratch migM−scratch com
Fig. 3. Normalized total cost for xyce680s with perturbed weights withα = 10, 100, 1000 on 64, 256, and 1024 processors; colors indicate which reparti-tioning method was used.
10 100 1000 10 100 1000 10 100 10000
2
4
6
8
10
12
64 processors 256 processors 1024 processors
No
rmal
ized
to
tal c
ost
Z−repart migZ−repart comZ−SL−repart migZ−SL−repart comZ−scratch migZ−scratch comZ−SL−refine migZ−SL−refine comM−repart migM−repart comM−scratch migM−scratch com
Fig. 4. Normalized total cost for slac6M with perturbed data structure withα = 10, 100, 1000 on 64, 256, and 1024 processors; colors indicate which repartition-ing method was used. Z-SL-repart and Z-SL-refine bars are truncated to enhancereadability.
18
10 100 1000 10 100 1000 10 100 10000
2
4
6
8
10
12
64 processors 256 processors 1024 processors
No
rmal
ized
to
tal c
ost
Z−repart migZ−repart comZ−SL−repart migZ−SL−repart comZ−scratch migZ−scratch comZ−SL−refine migZ−SL−refine comM−repart migM−repart comM−scratch migM−scratch com
Fig. 5. Normalized total cost for slac6M with perturbed weights withα = 10, 100, 1000 on 64, 256, and 1024 processors; colors indicate which repartition-ing method was used. Z-SL-repart and Z-SL-refine bars are truncated to enhancereadability.
10 100 1000 10 100 1000 10 100 10000
0.5
1
1.5
2
2.5
3
64 processors 256 processors 1024 processors
No
rmal
ized
to
tal c
ost
Z−repart migZ−repart comZ−SL−repart migZ−SL−repart comZ−scratch migZ−scratch comZ−SL−refine migZ−SL−refine comM−repart migM−repart comM−scratch migM−scratch com
Fig. 6. Normalized total cost for cage15 with perturbed data structure withα = 10, 100, 1000 on 64, 256, and 1024 processors; colors indicate which reparti-tioning method was used.
10 100 1000 10 100 1000 10 100 10000
0.5
1
1.5
2
2.5
3
64 processors 256 processors 1024 processors
No
rmal
ized
to
tal c
ost
Z−repart migZ−repart comZ−SL−repart migZ−SL−repart comZ−scratch migZ−scratch comZ−SL−refine migZ−SL−refine comM−repart migM−repart comM−scratch migM−scratch com
Fig. 7. Normalized total cost for cage15 with perturbed weights withα = 10, 100, 1000 on 64, 256, and 1024 processors; colors indicate which reparti-tioning method was used.
19

10 100 1000 10 100 1000 10 100 10000
1
2
3
4
5
64 processors 256 processors 1024 processors
No
rmal
ized
ru
n t
ime
Z−repartZ−SL−repartZ−scratchZ−SL−refineM−repartM−scratch
Fig. 8. Normalized run time with perturbed data structure for xyce680s withα = 10, 100, 1000 on 64, 256, and 1024 processors; colors indicate which reparti-tioning method was used.
10 100 1000 10 100 1000 10 100 10000
0.5
1
1.5
2
2.5
64 processors 256 processors 1024 processors
No
rmal
ized
ru
n t
ime
Z−repartZ−SL−repartZ−scratchZ−SL−refineM−repartM−scratch
Fig. 9. Normalized run time with perturbed weights for xyce680s withα = 10, 100, 1000 on 64, 256, and 1024 processors; colors indicate which reparti-tioning method was used.
10 100 1000 10 100 1000 10 100 10000
0.2
0.4
0.6
0.8
1
1.2
64 processors 256 processors 1024 processors
No
rmal
ized
ru
n t
ime
Z−repartZ−SL−repartZ−scratchZ−SL−refineM−repartM−scratch
Fig. 10. Normalized run time with perturbed data structure for slac6M withα = 10, 100, 1000 on 64, 256, and 1024 processors; colors indicate which reparti-tioning method was used.
20
10 100 1000 10 100 1000 10 100 10000
0.2
0.4
0.6
0.8
1
1.2
64 processors 256 processors 1024 processors
No
rmal
ized
ru
n t
ime
Z−repartZ−SL−repartZ−scratchZ−SL−refineM−repartM−scratch
Fig. 11. Normalized run time with perturbed weights for slac6M withα = 10, 100, 1000 on 64, 256, and 1024 processors; colors indicate which reparti-tioning method was used.
10 100 1000 10 100 1000 10 100 10000
0.2
0.4
0.6
0.8
1
64 processors 256 processors 1024 processors
No
rmal
ized
ru
n t
ime
Z−repartZ−SL−repartZ−scratchZ−SL−refineM−repartM−scratch
Fig. 12. Normalized run time with perturbed data structure for cage15 withα = 10, 100, 1000 on 64, 256, and 1024 processors; colors indicate which reparti-tioning method was used.
10 100 1000 10 100 1000 10 100 10000
0.2
0.4
0.6
0.8
1
64 processors 256 processors 1024 processors
No
rmal
ized
ru
n t
ime
Z−repartZ−SL−repartZ−scratchZ−SL−refineM−repartM−scratch
Fig. 13. Normalized run time with perturbed weights for cage15 withα = 10, 100, 1000 on 64, 256, and 1024 processors; colors indicate which reparti-tioning method was used.
21

(a) (b) (c)
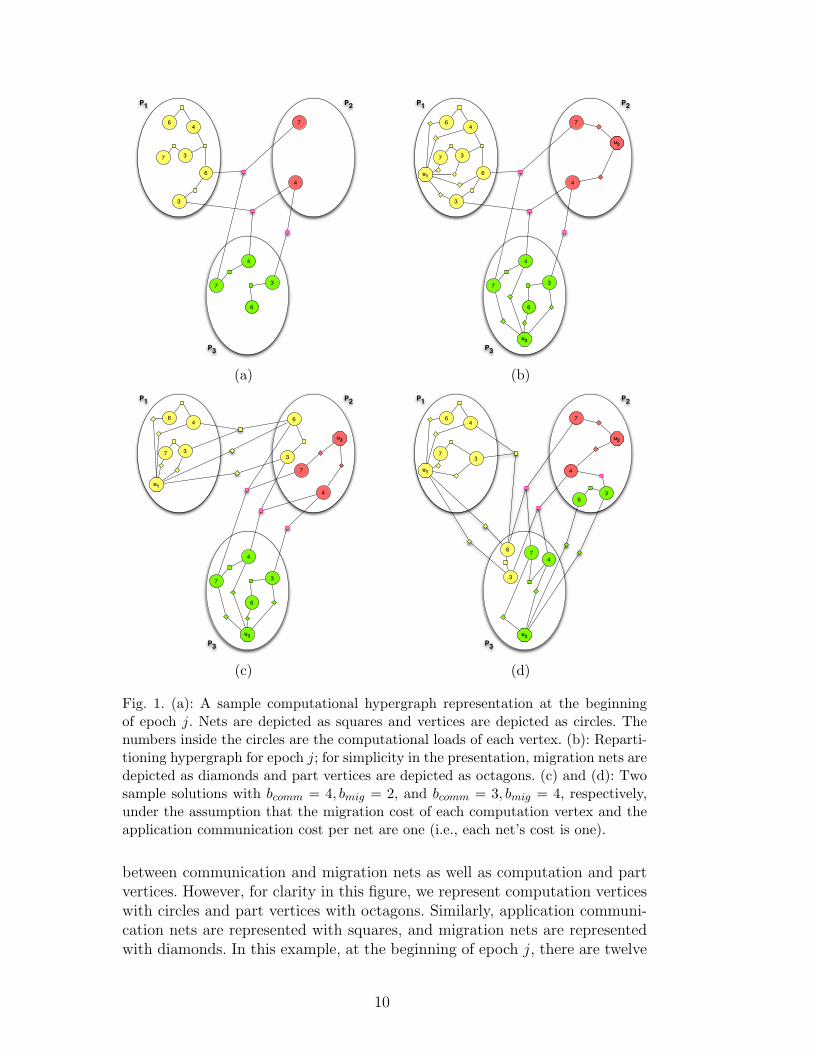
Fig. 14. Hexahedral finite element meshes with adaptive mesh refinement attime-steps 0, 54, and 108, respectively.
In parallel simulations with adaptive mesh refinement, the refinement andcoalescing of elements causes significant load imbalance. As processors addor remove elements due to refinement, their workloads change. Dynamic loadbalancing has played an important role in enabling parallel adaptive meshrefinement simulations, redistributing work to accommodate evolving meshes;see, e.g., [4,18,44,23,27,59,49,42]. Coordinate- and graph-based methods havebeen used with great success, due to mesh data’s relatively regular structureand low vertex degrees. In these experiments, we compare our repartitioninghypergraph model to commonly used graph-based repartitioners.
Our adaptive mesh data is a series of 109 hexahedral meshes from the ALE-GRA shock physics explicit finite element code [8]. The series of meshes rep-resents time-steps of the simulation; the mesh refinement tracks the shockmoving across the domain and its reflections. (Figure 14 shows the mesh atthe time-steps 0, 54, and 108, respectively.) The smallest mesh (time-step0) has 132,209 nodes and 103,100 elements; the largest (time-step 108) has1,380,266 nodes and 1,247,000 elements.
We represent mesh nodes with vertices of the graph and hypergraph models,and create a graph edge between nodes that share a mesh element. Thesegraph edges are used directly in the graph methods, and combined into asingle hyperedge per node in the hypergraph methods. The smallest mesh has1,527,841 graph edges; the largest has 17,391,840 graph edges.
In our experiments, we performed an initial partitioning of the initial mesh(time-step 0). Then at each time-step T > 0, we assign each node of mesh Tto the same part as its closest node in mesh T − 1 — “closeness” is measuredby two nodes’ proximity along a space-filling curve through the nodes of bothmeshes — and repartition mesh T using one of the methods in Table 2.
We ran experiments over 109 meshes with α = 100 on 16, 32, and 64 processorsof Sandia’s Odin cluster. Each node of Odin has two AMD Opteron 2.2GHzprocessors and 4 GB of RAM. Nodes are connected with a Myrinet network.
22

0
1
2
3
4
5
6
16 processors 32 processors 64 processors
No
rmal
ized
to
tal c
ost
Z−repart migZ−repart comZ−SL−repart migZ−SL−repart comZ−scratch migZ−scratch comZ−SL−refine migZ−SL−refine comM−repart migM−repart comM−scratch migM−scratch com
Fig. 15. Normalized total cost for adaptive mesh refinement experiments withα = 100 on 16, 32 and 64 processors; colors indicate which repartitioning methodwas used.
0
0.1
0.2
0.3
0.4
0.5
0.6
0.7
0.8
0.9
1
16 processors 32 processors 64 processors
No
rmal
ized
ru
n t
ime
Z−repartZ−SL−repartZ−scratchZ−SL−refineM−repartM−scratch
Fig. 16. Normalized run time for adaptive mesh refinement experiments withα = 100 on 16, 32, and 64 processors; colors indicate which repartitioning methodwas used.
We used MPICH v1.2.7 and gcc v3.4.3.
Total cost (3) and run times for each method are shown in Figures 15 and 16,respectively. The repartitioning hypergraph method Z-repart produced lowertotal cost than all other methods, although the graph repartitioning methodM-repart was competitive on small numbers of processors. The performancegap between hypergraph and graph methods increases in favor of hypergraphmodel with increasing number of processors. Execution time for Z-repart wasgreater than M-repart, indicating the need for faster heuristics in the hyper-graph implementation for applications with relatively low and homogeneousconnectivity.
23
0
0.2
0.4
0.6
0.8
1
1.2
1.4
16 processors 32 processors 64 processors
No
rmal
ized
to
tal c
ost
Z−repart migZ−repart comZ−SL−repart migZ−SL−repart comZ−scratch migZ−scratch comZ−SL−refine migZ−SL−refine com
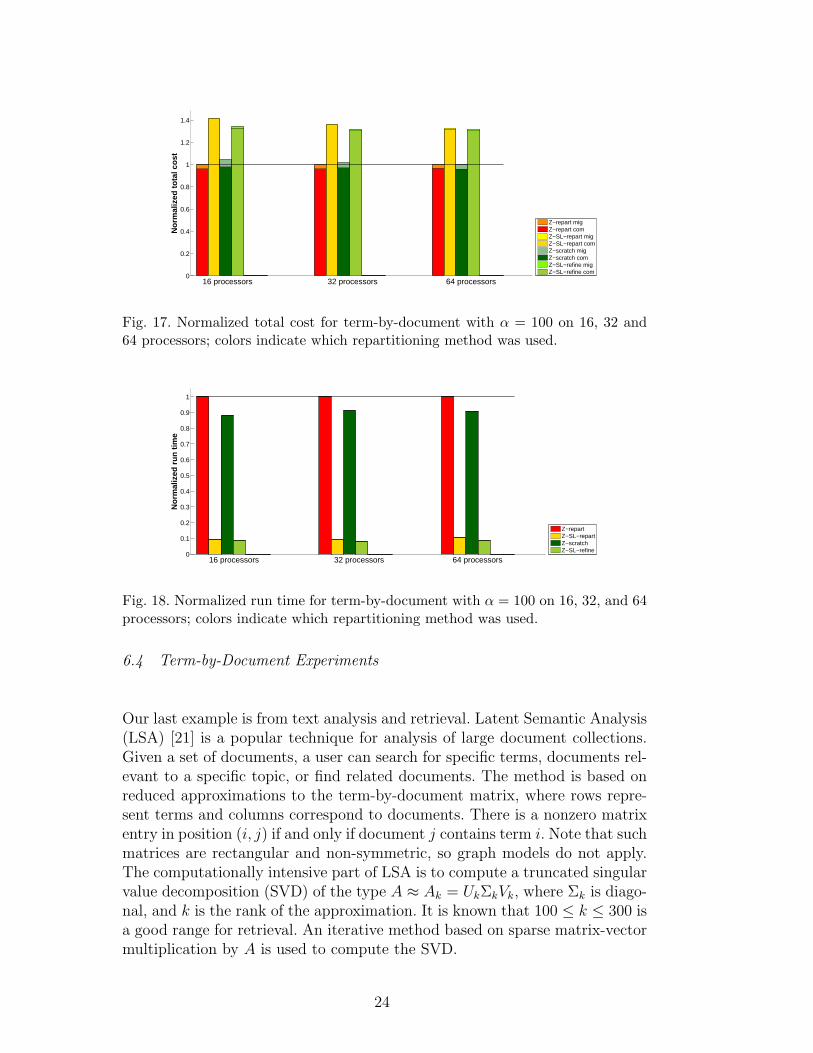
Fig. 17. Normalized total cost for term-by-document with α = 100 on 16, 32 and64 processors; colors indicate which repartitioning method was used.
0
0.1
0.2
0.3
0.4
0.5
0.6
0.7
0.8
0.9
1
16 processors 32 processors 64 processors
No
rmal
ized
ru
n t
ime
Z−repartZ−SL−repartZ−scratchZ−SL−refine
Fig. 18. Normalized run time for term-by-document with α = 100 on 16, 32, and 64processors; colors indicate which repartitioning method was used.
6.4 Term-by-Document Experiments
Our last example is from text analysis and retrieval. Latent Semantic Analysis(LSA) [21] is a popular technique for analysis of large document collections.Given a set of documents, a user can search for specific terms, documents rel-evant to a specific topic, or find related documents. The method is based onreduced approximations to the term-by-document matrix, where rows repre-sent terms and columns correspond to documents. There is a nonzero matrixentry in position (i, j) if and only if document j contains term i. Note that suchmatrices are rectangular and non-symmetric, so graph models do not apply.The computationally intensive part of LSA is to compute a truncated singularvalue decomposition (SVD) of the type A ≈ Ak = UkΣkVk, where Σk is diago-nal, and k is the rank of the approximation. It is known that 100 ≤ k ≤ 300 isa good range for retrieval. An iterative method based on sparse matrix-vectormultiplication by A is used to compute the SVD.
24
We focus on a parallel strategy for LSA with a dynamic document collectionwhere documents are added over time. (This is motivated by a project at San-dia led by Danny Dunlavy using the LSALIB software.) Our goal is to findan efficient parallel distribution of documents to processors, to ensure loadbalance and reduce communication. As an example, we use a large term-by-document matrix corresponding to the Citeseer database up to 2004. Eachmonth, a new set of documents are added, and the SVD must be recomputed.The number of documents added will vary from month to month. By default,documents are assigned to processors in a cyclic fashion. There is a cost asso-ciated with moving documents between processors. We seek load balance withrespect to the number of nonzeros in the term-by-document matrix, whichcorresponds to memory usage.
We started with all the documents that existed on Jan. 1, 1994, and ran a tenyear simulation (120 months). The full matrix has about 700,000 documentsand 57 million nonzeros. In this application, α should be in the range 100−600;we tested α = 100. Experiments were run on Sandia’s Odin cluster using 16,32, and 64 processors; results are presented in Figures 17 and 18. We compareonly hypergraph-based approaches since graph-based methods (ParMETIS)do not apply directly. We see from Figure 17 that the multilevel methods areclearly performing better than the single-level methods, in terms of solutionquality. Since in this application, migration cost becomes very small comparedto application communication cost, there is only a little difference betweenrepartitioning and scratch-remap.
7 Conclusion
In this paper, we presented a new approach to dynamic load balancing basedon a single hypergraph model that incorporates both communication volumein the application and data migration cost. Detailed comparison of graph-and hypergraph-based repartitioning using datasets from a range of applica-tion areas showed that hypergraph-based repartitioning produces partitionswith similar or lower cost than the graph-based repartitioning. The full ben-efit of hypergraph partitioning is realized on non-symmetric and non-squareproblems that cannot be represented easily with graph models [16,22].
Our hypergraph-based repartitioning model uses a single user-defined param-eter α to control trade-off between communication cost and migration cost.Experiments show that the approach works particularly well when migrationcost is more important, and does not degrade quality when communicationcost is more important. Therefore, we recommend the presented approach asa universal method for dynamic load balancing. The best choice of α will de-pend on the application, and can be estimated easily. Reasonable values arein the range 1− 1000.
25
The experiments showed that the hypergraph-based repartitioning approachimplemented in Zoltan is scalable. However, in many cases it required moretime than its graph-based counterpart due to the greater richness of the hy-pergraph model. We will further investigate exploiting locality given by thedata distribution in order to improve the execution time of the hypergraph-based repartitioning implementation. However, since the application run timeis often far greater than the partitioning time, this enhancement may not beimportant in practice.
Acknowledgments
We thank Danny Dunlavy for providing the Citeseer data; Richard Drake andJohan Steensland for the adaptive mesh refinement data; and Rich Lee, MarkShephard, and Xiaojuan Luo for the slac6M data.
References
[1] C. J. Alpert, A. E. Caldwell, A. B. Kahng, and I. L. Markov. Hypergraphpartitioning with fixed vertices [vlsi cad]. IEEE Trans. on CAD of IntegratedCircuits and Systems, 19(2):267–272, 2000.
[2] C. Aykanat, B. B. Cambazoglu, F. Findik, and T. Kurc. Adaptivedecomposition and remapping algorithms for object-space-parallel directvolume rendering of unstructured grids. Journal of Parallel and DistributedComputing, 67(1):77–99, Jan 2007.
[3] C. Aykanat, B. B. Cambazoglu, and B. Ucar. Multi-level direct k-wayhypergraph partitioning with multiple constraints and fixed vertices. Journal ofParallel and Distributed Computing, 2008. In Press, Available online 7 October2007.
[4] M. J. Berger and S. H. Bokhari. A partitioning strategy for nonuniformproblems on multiprocessors. IEEE Trans. Computers, C-36(5):570–580, 1987.
[5] S. H. Bokhari. On the mapping problem. IEEE Transactions on Computers,30(3):207–214, 1981.
[6] S. H. Bokhari. Assignment Problems in Parallel and Distributed Computing.Kluwer Academic Publishers, Norwell, MA, USA, 1987.
[7] E. Boman, K. Devine, R. Heaphy, B. Hendrickson, V. Leung, L. A. Riesen,C. Vaughan, U. Catalyurek, D. Bozdag, W. Mitchell, and J. Teresco. Zoltan 3.0:Parallel Partitioning, Load Balancing, and Data-Management Services; User’sGuide. Sandia National Laboratories, Albuquerque, NM, 2007. Tech. ReportSAND2007-4748W http://www.cs.sandia.gov/Zoltan/ug html/ug.html.
26
[8] E. A. Boucheron, K. H. Brown, K. G. Budge, S. P. Burns, D. E. Carroll, S. K.Carroll, M. A. Christon, R. R. Drake, C. G. Garasi, T. A. Haill, J. S. Peery,S. V. Petney, J. Robbins, A. C. Robinson, R. Summers, T. E. Voth, and M. K.Wong. ALEGRA: User Input and Physics Descriptions Version 4.2. SandiaNational Laboratories, Albuquerque, NM, 2002. Tech. Report SAND2002-2775.
[9] T. N. Bui and C. Jones. A heuristic for reducing fill-in sparse matrixfactorization. In Proc. 6th SIAM Conf. Parallel Processing for ScientificComputing, pages 445–452. SIAM, 1993.
[10] T. Bultan and C. Aykanat. A new mapping heuristic based on mean fieldannealing. Journal of Parallel and Distributed Computing, 16:292–305, 1992.
[11] B. B. Cambazoglu and C. Aykanat. Hypergraph-partitioning-based remappingmodels for image-space-parallel direct volume rendering of unstructured grids.IEEE Transactions on Parallel and Distributed Systems, 18(1):3–16, Jan 2007.
[12] B. B. Cambazoglu and C. Aykanat. Remapping models for scientific computingvia graph and hypergraph partitioning. In Proceedings of the SIAM Workshopon Combinatorial Scientific Computing (CSC07), Costa Mesa, CA, 2007.
[13] W. Camp, S. J. Plimpton, B. Hendrickson, and R. W. Leland. Massivelyparallel methods for engineering and science problems. Communication ofACM, 37(4):31–41, April 1994.
[14] U. V. Catalyurek, E. G. Boman, K. D. Devine, D. Bozdag, R. Heaphy, andL. A. Fisk. Hypergraph-based dynamic load balancing for adaptive scientificcomputations. In Proceedings of 21st International Parallel and DistributedProcessing Symposium (IPDPS). IEEE, 2007.
[15] U. V. Catalyurek and C. Aykanat. A hypergraph model for mappingrepeated sparse matrix-vector product computations onto multicomputers. InProceedings of International Conference on High Performance Computing, Dec.1995.
[16] U. V. Catalyurek and C. Aykanat. Hypergraph-partitioning baseddecomposition for parallel sparse-matrix vector multiplication. IEEETransactions on Parallel and Distributed Systems, 10(7):673–693, 1999.
[17] U. V. Catalyurek and C. Aykanat. PaToH: A Multilevel HypergraphPartitioning Tool, Version 3.0. Bilkent University, Department of ComputerEngineering, Ankara, 06533 Turkey. PaToH is available at http://bmi.osu.edu/∼umit/software.htm, 1999.
[18] N. Chrisochoides. Multithreaded model for dynamic load balancing paralleladaptive PDE computations. ICASE Report 95-83, ICASE, NASA LangleyResearch Center, Hampton, VA 23681-0001, Dec. 1995.
[19] G. Cybenko. Dynamic load balancing for distributed memory multiprocessors.J. Parallel Distrib. Comput., 7:279–301, 1989.
27

[20] H. deCougny, K. Devine, J. Flaherty, R. Loy, C. Ozturan, and M. Shephard.Load balancing for the parallel adaptive solution of partial differentialequations. Appl. Numer. Math., 16:157–182, 1994.
[21] S. C. Deerwester, S. T. Dumais, T. K. Landauer, G. W. Furnas, and R. A.Harshman. Indexing by latent semantic analysis. J. of the American Societyfor Information Science, 41(6):391–407, 1990.
[22] K. Devine, E. Boman, R. Heaphy, R. Bisseling, and U. Catalyurek. Parallelhypergraph partitioning for scientific computing. In Proc. of 20th InternationalParallel and Distributed Processing Symposium (IPDPS’06). IEEE, 2006.
[23] K. Devine and J. Flaherty. Parallel adaptive hp-refinement techniques forconservation laws. Appl. Numer. Math., 20:367–386, 1996.
[24] P. Diniz, S. Plimpton, B. Hendrickson, and R. Leland. Parallel algorithms fordynamically partitioning unstructured grids. In Proc. 7th SIAM Conf. ParallelProcessing for Scientific Computing, pages 615–620. SIAM, 1995.
[25] J. Faik, L. G. Gervasio, J. E. Flaherty, J. Chang, J. D. Teresco, E. G. Boman,and K. D. Devine. A model for resource-aware load balancing on heterogeneousclusters. Technical Report CS-03-03, Williams College Dept. Computer Science,2003. http://www.cs.williams.edu/drum/.
[26] C. M. Fiduccia and R. M. Mattheyses. A linear-time heuristic for improvingnetwork partitions. In Proc. 19th IEEE Design Automation Conf., pages 175–181, 1982.
[27] J. Flaherty, R. Loy, M. Shephard, B. Szymanski, J. Teresco, and L. Ziantz.Adaptive local refinement with octree load-balancing for the parallel solutionof three-dimensional conservation laws. J. Parallel Distrib. Comput., 47(2):139–152, 1998.
[28] M. R. Garey and D. S. Johnson. Computers and Intractability. W.H. Freemanand Co., New York, New York, 1979.
[29] B. Hendrickson and T. G. Kolda. Graph partitioning models for parallelcomputing. Parallel Computing, 26:1519 – 1534, 2000.
[30] B. Hendrickson and R. Leland. The Chaco user’s guide, version 2.0. SandiaNational Laboratories, Alburquerque, NM, 87185, 1995.
[31] B. Hendrickson and R. Leland. A multilevel algorithm for partitioning graphs.In Proc. Supercomputing ’95. ACM, December 1995.
[32] B. Hendrickson, R. Leland, and R. Van Driessche. Skewed graph partitioning.In Proc. Eighth SIAM Conf. Parallel Processing for Scientific Computation,March 1997.
[33] Y. F. Hu and R. J. Blake. An optimal dynamic load balancing algorithm.Technical Report DL-P-95-011, Daresbury Laboratory, Warrington, UK, 1995.
28

[34] Y. F. Hu, R. J. Blake, and D. R. Emerson. An optimal migration algorithm fordynamic load balancing. Concurrency: Practice and Experience, 10:467 – 483,1998.
[35] M. A. Iqbal and S. H. Bokhari. Efficient algorithms for a class of partitioningproblems. IEEE Trans. Parallel Distrib. Syst., 6(2):170–175, 1995.
[36] G. Karypis and V. Kumar. MeTiS A Software Package for PartitioningUnstructured Graphs, Partitioning Meshes, and Computing Fill-ReducingOrderings of Sparse Matrices Version 4.0. University of Minnesota, Departmentof Comp. Sci. and Eng., Army HPC Research Center, Minneapolis, 1998.
[37] G. Karypis and V. Kumar. A fast and high quality multilevel scheme forpartitioning irregular graphs. SIAM Journal on Scientific Computing, 20(1),1999.
[38] G. Karypis, V. Kumar, R. Aggarwal, and S. Shekhar. hMeTiS A HypergraphPartitioning Package Version 1.0.1. University of Minnesota, Department ofComp. Sci. and Eng., Army HPC Research Center, Minneapolis, 1998.
[39] G. Karypis, K. Schloegel, and V. Kumar. Parmetis: Parallel graph partitioningand sparse matrix ordering library, version 3.1. Technical report, Dept.Computer Science, University of Minnesota, 2003. http://www-users.cs.umn.edu/∼karypis/metis/parmetis/download.html.
[40] H. Kasahara and S. Narita. Practical multiprocessor scheduling algorithms forefficient parallel processing. IEEE Transactions on Computers, C-33(11):1023–1029, Nov 1984.
[41] T. Lengauer. Combinatorial Algorithms for Integrated Circuit Layout. Willey–Teubner, Chichester, U.K., 1990.
[42] L. Oliker and R. Biswas. PLUM: Parallel load balancing for adaptiveunstructured mesh es. J. Parallel Distrib. Comput., 51(2):150–177, 1998.
[43] C.-W. Ou and S. Ranka. Parallel incremental graph partitioning using linearprogramming. Technical report, Syracuse University, Syracuse, NY, 1992.
[44] A. Patra and J. T. Oden. Problem decomposition for adaptive hp finite elementmethods. J. Computing Systems in Engg., 6(2), 1995.
[45] J. R. Pilkington and S. B. Baden. Partitioning with spacefilling curves.CSE Technical Report CS94–349, Dept. Computer Science and Engineering,University of California, San Diego, CA, 1994.
[46] P. Sadayappan and F. Ercal. Nearest-neigbour mapping of finite element graphsonto processor meshes. IEEE Transactions on Computers, 36(12):1408–1424,1987.
[47] P. Sadayappan, F.Ercal, and J. Ramanujam. Cluster partitioning aproaches tomapping parallel programs onto hypercube. Parallel Computing, 13:1–16, 1990.
29
[48] K. Schloegel, G. Karypis, and V. Kumar. Multilevel diffusion algorithms forrepartitioning of adaptive meshes. J. Parallel Distrib. Comput., 47(2):109–124,1997.
[49] K. Schloegel, G. Karypis, and V. Kumar. Multilevel diffusion algorithms forrepartitioning of adaptive meshes. J. Parallel Distrib. Comput., 47(2):109–124,1997. Also available on WWW at URL http://www.cs.umn.edu/˜karypis.
[50] K. Schloegel, G. Karypis, and V. Kumar. A unified algorithm for load-balancingadaptive scientific simulations. In Proc. Supercomputing, Dallas, 2000.
[51] K. Schloegel, G. Karypis, and V. Kumar. Wavefront diffusion and LMSR:Algorithms for dynamic repartitioning of adaptive meshes. IEEE Trans. ParallelDistrib. Syst., 12(5):451–466, 2001.
[52] S. Sinha and M. Parashar. Adaptive system partitioning of AMR applicationson heterogeneous clusters. Cluster Computing, 5(4):343–352, October 2002.
[53] J. D. Teresco, M. W. Beall, J. E. Flaherty, and M. S. Shephard. A hierarchicalpartition model for adaptive finite element computation. Comput. MethodsAppl. Mech. Engrg., 184:269–285, 2000.
[54] A. Trifunovic and W. J. Knottenbelt. Parkway 2.0: A parallel multilevelhypergraph partitioning tool. In Proc. 19th International Symposium onComputer and Information Sciences (ISCIS 2004), volume 3280 of LNCS, pages789–800. Springer, 2004.
[55] R. Van Driessche and D. Roose. Dynamic load balancing with a spectralbisection algorithm for the constrained graph partitioning problem. In High-Performance Computing and Networking, number 919 in Lecture Notes inComputer Science, pages 392–397. Springer, 1995. Proc. Int’l Conf. andExhibition, Milan, Italy, May 1995.
[56] C. Walshaw. The Parallel JOSTLE Library User’s Guide, Version 3.0.University of Greenwich, London, UK, 2002.
[57] C. Walshaw and M. Cross. Multilevel mesh partitioning for heterogeneouscommunication networks. Future Generation Computer Systems, 17:601–623,2001.
[58] C. Walshaw, M. Cross, and M. Everett. Parallel dynamic graph-partitioningfor adaptive unstructured meshes. J. Par. Dist. Comput., 47(2):102–108, 1997.
[59] C. Walshaw, M. Cross, and M. G. Everett. Parallel dynamic graph partitioningfor adaptive unstructured meshes. J. Parallel Distrib. Comput., 47(2):102–108,1997.
[60] M. S. Warren and J. K. Salmon. A parallel hashed oct-tree n-body algorithm.In Proc. Supercomputing ’93, Portland, OR, Nov. 1993.
[61] M. Willebeek-LeMair and A. P. Reeves. Strategies for dynamic load balancingon highly parallel computers. IEEE Trans. Parallel Distrib. Syst., 4(9):979–993,1993.
30

[62] R. Williams. Performance of dynamic load balancing algorithms forunstructured mesh calculations. Concurrency, 3:457–481, October 1991.
[63] Zoltan: Data management services for parallel applications. http://www.cs.sandia.gov/Zoltan/.
31

![Ageometric theory for hypergraph matchingpeople.maths.ox.ac.uk/keevash/papers/geom-match-final.pdf · hypergraph regularity theory independently developed by Gowers [17] and Ro¨dl](https://img.pdfslide.us/doc/110x75/5fba3b7d9c157c52df19dcbb/ageometric-theory-for-hypergraph-hypergraph-regularity-theory-independently-developed.jpg)