Embed Size (px)
Citation preview
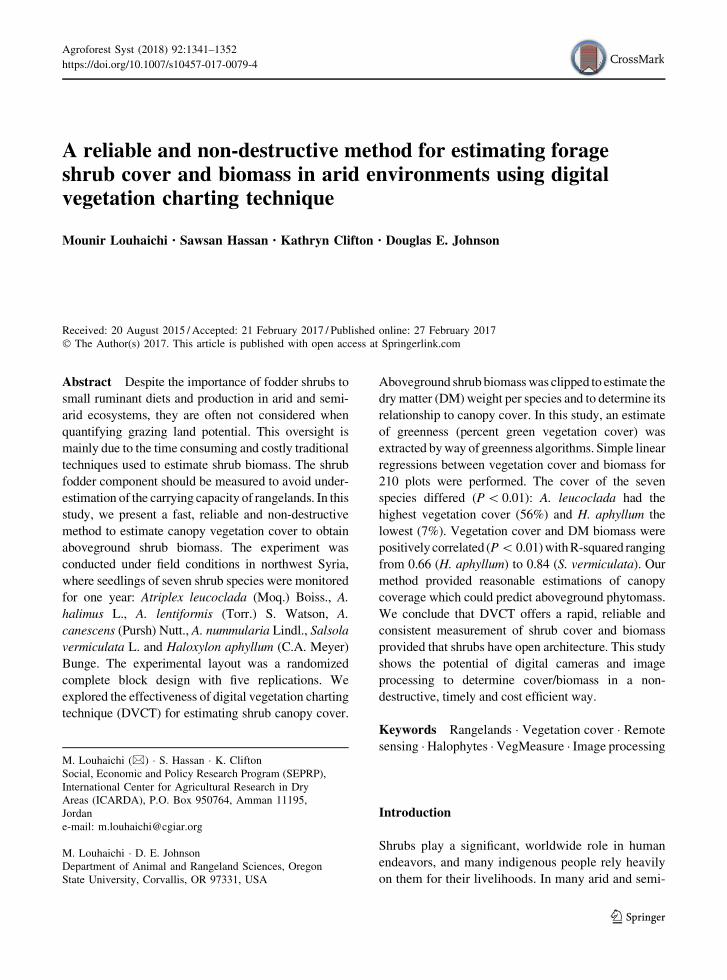
A reliable and non-destructive method for estimating forageshrub cover and biomass in arid environments using digitalvegetation charting technique
Mounir Louhaichi . Sawsan Hassan . Kathryn Clifton . Douglas E. Johnson
Received: 20 August 2015 / Accepted: 21 February 2017 / Published online: 27 February 2017
� The Author(s) 2017. This article is published with open access at Springerlink.com
Abstract Despite the importance of fodder shrubs to
small ruminant diets and production in arid and semi-
arid ecosystems, they are often not considered when
quantifying grazing land potential. This oversight is
mainly due to the time consuming and costly traditional
techniques used to estimate shrub biomass. The shrub
fodder component should be measured to avoid under-
estimation of the carrying capacity of rangelands. In this
study, we present a fast, reliable and non-destructive
method to estimate canopy vegetation cover to obtain
aboveground shrub biomass. The experiment was
conducted under field conditions in northwest Syria,
where seedlings of seven shrub species were monitored
for one year: Atriplex leucoclada (Moq.) Boiss., A.
halimus L., A. lentiformis (Torr.) S. Watson, A.
canescens (Pursh) Nutt., A. nummularia Lindl., Salsola
vermiculata L. and Haloxylon aphyllum (C.A. Meyer)
Bunge. The experimental layout was a randomized
complete block design with five replications. We
explored the effectiveness of digital vegetation charting
technique (DVCT) for estimating shrub canopy cover.
Aboveground shrub biomasswas clipped to estimate the
dry matter (DM)weight per species and to determine its
relationship to canopy cover. In this study, an estimate
of greenness (percent green vegetation cover) was
extracted byway of greenness algorithms. Simple linear
regressions between vegetation cover and biomass for
210 plots were performed. The cover of the seven
species differed (P\0.01): A. leucoclada had the
highest vegetation cover (56%) and H. aphyllum the
lowest (7%). Vegetation cover and DM biomass were
positively correlated (P\ 0.01)withR-squared ranging
from 0.66 (H. aphyllum) to 0.84 (S. vermiculata). Our
method provided reasonable estimations of canopy
coverage which could predict aboveground phytomass.
We conclude that DVCT offers a rapid, reliable and
consistent measurement of shrub cover and biomass
provided that shrubs have open architecture. This study
shows the potential of digital cameras and image
processing to determine cover/biomass in a non-
destructive, timely and cost efficient way.
Keywords Rangelands � Vegetation cover � Remote
sensing �Halophytes �VegMeasure � Image processing
Introduction
Shrubs play a significant, worldwide role in human
endeavors, and many indigenous people rely heavily
on them for their livelihoods. In many arid and semi-
M. Louhaichi (&) � S. Hassan � K. CliftonSocial, Economic and Policy Research Program (SEPRP),
International Center for Agricultural Research in Dry
Areas (ICARDA), P.O. Box 950764, Amman 11195,
Jordan
e-mail: [email protected]
M. Louhaichi � D. E. JohnsonDepartment of Animal and Rangeland Sciences, Oregon
State University, Corvallis, OR 97331, USA
123
Agroforest Syst (2018) 92:1341–1352
https://doi.org/10.1007/s10457-017-0079-4(0123456789().,-volV)(0123456789().,-volV)
arid ecosystems, fodder shrubs are vital for small
ruminant production and particularly goats. Their
major value is that they provide protein, vitamins and
frequently mineral elements, which are lacking in
grassland pastures during the dry season (Le Houerou
1980; Breman and De Ridder 1991; Breman and
Kessler 1995; Ahamefule et al. 2006). Despite their
importance, they are often not considered when
quantifying grazing land potential. This oversight is
mainly due to the time consuming and costly tradi-
tional techniques used to estimate shrub biomass. The
shrub fodder component should be measured to avoid
underestimation of the carrying capacity of
rangelands.
Researchers have developed methods for measur-
ing vegetation changes that are cost effective, reliable
and repeatable (Stoddard and Smith 1943; Floyd and
Anderson 1987; Brady et al. 1995; Brakenhielm and
Liu 1995; Seefeldt and Booth 2006). Traditional
methods involve using quadrats to analyze plant cover,
density and aboveground biomass (Cooper 1924;
Barbour et al. 1987; Magill 1989; Cox et al. 1990;
Hill et al. 2005; Hoover 2008; Louhaichi et al. 2009;
Gayton 2014).
Shrub biomass can be estimated using direct
(destructive) or indirect (non-destructive) techniques.
The most accurate method for estimating biomass is
by destructive sampling—clipping and weighing the
grazable portion in the field (Gibbs et al. 2007;
Chojnacky and Milton 2008). Costs and logistics
associated with field measurements always limit the
number of destructive samples, the number of shrubs
harvested, the parts of the shrub measured and the size
of shrubs harvested (Clark et al. 2001). In addition,
destructive techniques prevent repeated measures over
time with the same plant, leading to increased
variability between observations. To avoid total plant
harvest, a semi-destructive shrub biomass estimation
technique was developed using representative samples
or ‘reference units’, which reduced the need to clip the
entire grazable biomass for each shrub. Use of
reference units increases the number of shrubs that
can be sampled, allowing monitoring to capture the
variability of shrubland (Andrew et al. 1981).
As an alternative to destructive techniques, shrub
biomass can be estimated using variables that are
correlated with it, such as rainfall. Thus, in the 1980s
there were several attempts to develop regressions
between seasonal rainfall and biomass at peak
standing crop. In most cases, the response to rainfall
increases positively with the total amount per season
(Le Houerou and Hoste 1977; Deshmukh 1984).
Unfortunately, this relationship works best with
herbaceous strata and not with other life forms such
as shrubs. With a similar aim, shrub biomass equations
were developed as a function of shrub dimensions
such as diameter and height. Equations were usually
developed for particular species, and most generated
equations were for temperate coniferous forest types
(Cannell 1984). Shrub size biomass relationships can
be established per species; however, shrubs have to be
destroyed and regression formulas created (Ludwig
et al. 1975; Chojnacky and Milton 2008). Once this is
completed and the relationship has been established,
future destruction would be limited.
Vegetation canopy cover is another variable used as
a non-destructive surrogate for biomass estimates
(Montes et al. 2000; Sala and Austin 2000). In fact,
canopy cover is an important ecological characteristic
and is generally calculated as the percentage of ground
surface covered by vegetation. Cover can be expressed
in absolute terms (m2/ha) but is most often expressed
simply as a percentage. Visual plant cover estimates
are often used because they are more rapid, much
easier and, therefore, cheaper to measure (Sykes et al.
1983). In particular, the line-intercept method (Can-
field 1941; Gayton 2014; Montalvo et al. 2014), which
records the length of canopy overlap along a stretched
tape laid out on the ground, has been widely used in
grasslands and steppes.
With the recent advances in geo-spatial technolo-
gies, remote sensing (RS) techniques have been used
at a much broader scale to estimate shrub biomass
(Franklin and Hiernaux 1991; Roy and Ravan 1996;
Lu 2006). In fact, satellite imagery is a common tool to
generate monitoring and forage prediction maps (Al-
Bakri and Taylor 2003; Frank and Karn 2003;
Kawamura et al. 2005). However, broad-scale satellite
images are often too course or have inaccuracies in
semi-arid and arid areas (Smith et al. 1990). High-
resolution satellite RS imagery, as well as aerial
photography (Sivanpillai and Booth 2008) and
unmanned air vehicles (Rango et al. 2009; Zhang
and Kovacs 2012), have been used for fine-scale
mapping but are often restricted by the higher cost and
security concerns (Anderson and Gaston 2013).
Landsat imagery with 30 m spatial resolution has
difficulty estimating vegetation cover that is less than
1342 Agroforest Syst (2018) 92:1341–1352
123
40% and has limited use in measuring variations in
semi-arid and arid environments (Smith et al. 1990).
Abdullah et al. (2011) reported that physical mea-
surements of phytomass of different plant types/
species at ground reference sites are necessary for
biomass estimation using high-resolution satellite
imagery.
More recently, digital cameras have been shown to
be fast, affordable and reliable for measuring biomass
and Leaf Area Index (Casadesus and Villegas 2014).
There are a number of software packages capable of
measuring cover and bare ground from an image
(Lamari 2002; Louhaichi et al. 2010). Digital images
can be classified and interpolated to give overall cover
maps for the site of interest. The digital vegetative
charting technique (DVCT) uses digital cameras in a
standardized manner to classify and measure vegeta-
tion on the ground and requires specialized software to
process digital images. VegMeasure� is software that
processes images that are collected in a standardized
manner to provide classification of imagery and
measure changes over time (Louhaichi et al. 2010).
Variability in the estimates from DVCT was less than
the variability of estimates across personnel who
collected data using traditional methods (Booth et al.
2005). DVCT also provided greater accuracy than
visual estimates (Olmstead et al. 2004). The fine-scale
information provided through high-resolution detailed
imagery at local scale when coupled with large-scale
satellite RS can be used as reference data or training
sites to produce detailed classification maps that have
greater detail and accuracy than could be provided
from low resolution remote sensing alone.
Remote sensing techniques employ regression/cor-
relation of the canopy area recorded by the sensor
against the biomass measured directly or estimated
indirectly on the ground. For instance, vegetation
indices convert reflectance, and sometimes shrub size
and roughness, to biomass based on statistical rela-
tionships established by destructive sampling (Bar
Massada et al. 2006). By transforming remote sensing
data into index values, researchers can generate
surrogate information that give a rough measure of
vegetation type, amount and condition on land
surfaces (Jensen 2007; Lillesand et al. 2008). Remote
sensing imagery, such as the Normalized Difference
Vegetation Index (Tucker 1978; Steven et al. 2003),
that show overall greenness are commonly used in
monitoring and to provide predictions and estimates of
plant biomass (Tucker et al. 1983; Sannier et al. 2002;
Kawamura et al. 2005; Mata et al. 2007). Unfortu-
nately, most algorithms and regressions relating
remote sensing data to biomass are site and date
specific or difficult to transfer to other locations due to
the limitations of the model itself, and often contain
substantial standard errors (Lu 2006). Therefore, it is
important to make simultaneous ground measure-
ments to increase the accuracy of remotely sensed
data.
This study tested the measurement of shrub canopy
cover of multiple species through DVCT. We also
investigated the relationship between canopy cover
and biomass production of seven shrub species
commonly used for rehabilitation of degraded range-
lands in arid environments using simple linear regres-
sion. Such information could contribute to the
incorporation of biomass estimates for shrubs and be
potentially useful for the incorporation of shrubs in the
REDD ? (Reducing emissions from deforestation
and forest degradation) carbon payment scheme.
Materials and methods
Study site
The field experiment was conducted at the Interna-
tional Center for Agricultural Research in the Dry
Areas (ICARDA Tel Hadya station) located in Aleppo
in northwest Syria (36�1015.6100N, 36�57020.2300E;300 m above sea level). The soil at the station is
generally deep (over 1 m) and has a heavy clay texture
(fine clay, montmorillonitic, thermic Calcixerollic
Xerochrept). pH 8.0; CaCO3 240 g kg-1 organic
matter 8.4 g kg-1. The soil saturated hydraulic con-
ductivity is moderate to low rate (Ryan et al. 1997).
The climate of the site is cool semi-arid Mediterranean
with an average annual rainfall of 340 mm and the
growing season during October–May. During the
study period which lasted from the 18th of November
2009 to the 28th of April 2010, the total amount of
rainfall received was 327.1 mm in 2009 and
129.2 mm in 2010.
Target shrub species
A total of seven halophyte shrub species important for
rangeland rehabilitation and livestock feeding in the
Agroforest Syst (2018) 92:1341–1352 1343
123
arid Mediterranean basin and Central Asia (Winter
1981; Le Houerou 1992a) were tested in the current
study: Atriplex leucoclada (Moq.) Boiss., A. halimus
L., A. lentiformis (Torr.) S. Watson, A. canescens
(Pursh) Nutt., A. nummularia Lindl., Salsola vermic-
ulata L. and H. aphyllum (C.A. Meyer). More detailed
description of these species is presented below:
Atriplex leucoclada, an important rangeland plant
species. It grows in arid and semi-arid areas. It is
drought resistant and halophytic, tolerating soil salin-
ity levels as high as 30 dS/m (Al-Oudat and Qadir
2011). The plant exhibits high forage value qualities
and provides part of animal requirements, especially in
autumn and winter for all livestock classes. Atriplex
leucoclada has been shown to readily establish from
seed (Le Houerou 1996) enhancing restoration efforts.
Atriplex halimus is a perennial native shrub of the
Mediterranean basin with an excellent tolerance to
drought, salinity, and alkaline soils. It is known for its
remediation of degraded rangelands and salt-affected
areas. It is used as a phytoremediation plant in highly
saline sodic clay loam soils. Atriplex Halimus grows
well with high evapotranspiration and low mean
annual precipitation of 100–400 mm and 400–600
mm for arid and semi-arid areas respectively (Walker
et al. 2014). Optimal soil textures for growth include
silty, loamy, and clayey soils whereas coarse sandy
and heavy clay soils produce poor results and should
be avoided completely (Le Houerou 2010).
Atriplex lentiformis grows well under saline-sodic
soils with heavy clay textures (Le Houerou 2010).
Atriplex lentiformis is an erect medium sized Atriplex
plant with silvery-green leaves and a well-developed
root system that can reach water tables down to 10 m
depth (Le Houerou 1992b).
Atriplex canescens is adapted to semiarid condi-
tions (Garza and Fulbright 1988). It can grow on deep,
halophytic, sandy soils with 150 and 400 mm annual
rainfall. Salty soil salts improve growth of A.
canescens by improving organic matter production,
water use efficiency, and increasing the ability to
extract water through osmotic adjustments (Glenn and
Brown 1998).
Atriplex nummularia is used as a forage crop in arid
and semi-arid areas due to its high palatability
compared to other Atriplex species, but is prone to
over-browsing and may fail to re-grow. Atriplex
nummularia grows in arid and semi-arid areas with
150-400 mm mean annual precipitation and tolerates
moderate drought. The roots of nummularia can go as
deep as 10 m reaching a deep-lying water table (Le
Houerou 1992b, 2010). Medium textured soils are
most suitable for cultivation and sandy soils should be
avoided completely (Le Houerou 1992b).
Salsola vermiculata is a perennial shrub and
perhaps the most valuable browse species in arid
rangelands of WANA. Typical of dry soils under arid
climates (Rivas-Martınez et al. 2001). It grows in
sandy or clay soils with variable salinity, above tide
level, and is frequent along roadsides, abandoned crop
fields, rocky slopes, disturbed sites and maritime
habitats (Reyes-Betancort et al. 2001).
Haloxylon aphyllum is an important perennial plant
in Asia. It tolerates arid and semi-arid conditions with
less than 200 mm annual rainfall (Arabzadeh and
Emadian 2010). It grows in topographic depressions
on sandy, solonchak, or gypsum soils (Gintzburger
et al. 2003). The plant is widely used to rehabilitate
degraded rangelands (Shamsutdinov and Shamsutdi-
nov 2008).
Experimental design
Seeds of selected shrub species were germinated in
pots in a greenhouse. The pots were filled with a
mixture of 1/3 soil, 1/3 sand, and 1/3 of organic
manure (applied as a top layer). The resulting soil was
alkaline with a pH of 8.4; an organic matter content of
0.29%. Once the seedlings reached maturity stage, the
pots were placed outside to mimic natural field
conditions. Contiguous research plots (2 m 9 2 m)
were prepared by cultivation. The shrub seedlings
were transplanted into the center of its assigned
2 m 9 2 m area in the field in March using a
randomized complete block design (RCBD) with five
replications. A total of 210 seedlings were planted, six
of each species in each of the five replicates. Plants
were then monitored for canopy cover and biomass
production over the duration of the experiment.
Monitoring techniques
To test the efficacy of digital photography for ground
cover estimations, straight down images from 1.5 to
6 m above the ground were obtained using a high-
resolution digital camera following the DVCT proto-
cols (Louhaichi et al. 2010). The digital camera used
in this study was a Samsung Techwin (model
1344 Agroforest Syst (2018) 92:1341–1352
123
NV100HD, VLUU NV100HD, LANDIAO NV100
HD, TL34HD) equipped with a 28-mm lens. The
dimensions of each image were 4384 9 3288 pixels
and the size was about 3434 kb in JPG format. On
three occasions after transplanting (at day 296, 406
and 458) photos were taken from both 1.5 m above the
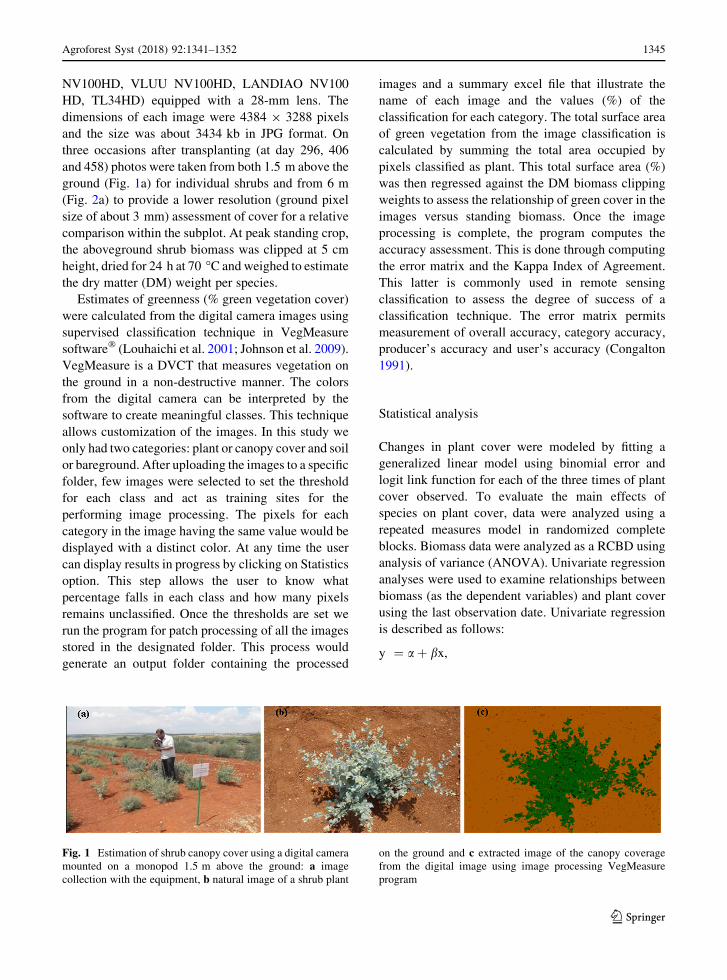
ground (Fig. 1a) for individual shrubs and from 6 m
(Fig. 2a) to provide a lower resolution (ground pixel
size of about 3 mm) assessment of cover for a relative
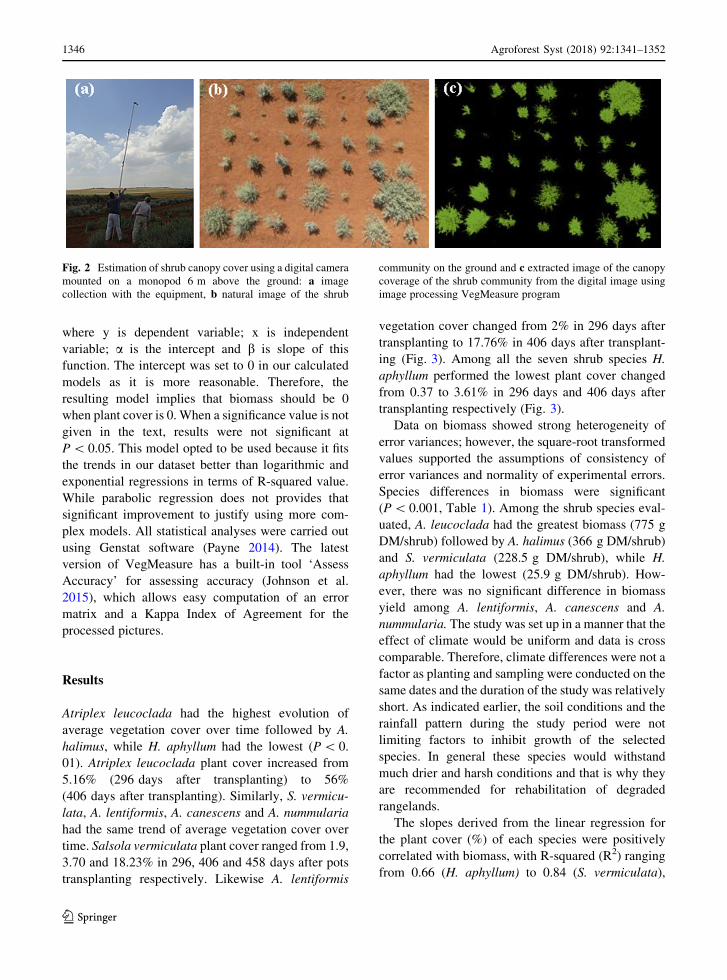
comparison within the subplot. At peak standing crop,
the aboveground shrub biomass was clipped at 5 cm
height, dried for 24 h at 70 �C and weighed to estimate
the dry matter (DM) weight per species.
Estimates of greenness (% green vegetation cover)
were calculated from the digital camera images using
supervised classification technique in VegMeasure
software� (Louhaichi et al. 2001; Johnson et al. 2009).
VegMeasure is a DVCT that measures vegetation on
the ground in a non-destructive manner. The colors
from the digital camera can be interpreted by the
software to create meaningful classes. This technique
allows customization of the images. In this study we
only had two categories: plant or canopy cover and soil
or bareground. After uploading the images to a specific
folder, few images were selected to set the threshold
for each class and act as training sites for the
performing image processing. The pixels for each
category in the image having the same value would be
displayed with a distinct color. At any time the user
can display results in progress by clicking on Statistics
option. This step allows the user to know what
percentage falls in each class and how many pixels
remains unclassified. Once the thresholds are set we
run the program for patch processing of all the images
stored in the designated folder. This process would
generate an output folder containing the processed
images and a summary excel file that illustrate the
name of each image and the values (%) of the
classification for each category. The total surface area
of green vegetation from the image classification is
calculated by summing the total area occupied by
pixels classified as plant. This total surface area (%)
was then regressed against the DM biomass clipping
weights to assess the relationship of green cover in the
images versus standing biomass. Once the image
processing is complete, the program computes the
accuracy assessment. This is done through computing
the error matrix and the Kappa Index of Agreement.
This latter is commonly used in remote sensing
classification to assess the degree of success of a
classification technique. The error matrix permits
measurement of overall accuracy, category accuracy,
producer’s accuracy and user’s accuracy (Congalton
1991).
Statistical analysis
Changes in plant cover were modeled by fitting a
generalized linear model using binomial error and
logit link function for each of the three times of plant
cover observed. To evaluate the main effects of
species on plant cover, data were analyzed using a
repeated measures model in randomized complete
blocks. Biomass data were analyzed as a RCBD using
analysis of variance (ANOVA). Univariate regression
analyses were used to examine relationships between
biomass (as the dependent variables) and plant cover
using the last observation date. Univariate regression
is described as follows:
y ¼ aþ bx,
Fig. 1 Estimation of shrub canopy cover using a digital camera
mounted on a monopod 1.5 m above the ground: a image
collection with the equipment, b natural image of a shrub plant
on the ground and c extracted image of the canopy coverage
from the digital image using image processing VegMeasure
program
Agroforest Syst (2018) 92:1341–1352 1345
123
where y is dependent variable; x is independent
variable; a is the intercept and b is slope of this
function. The intercept was set to 0 in our calculated
models as it is more reasonable. Therefore, the
resulting model implies that biomass should be 0
when plant cover is 0. When a significance value is not
given in the text, results were not significant at
P\ 0.05. This model opted to be used because it fits
the trends in our dataset better than logarithmic and
exponential regressions in terms of R-squared value.
While parabolic regression does not provides that
significant improvement to justify using more com-
plex models. All statistical analyses were carried out
using Genstat software (Payne 2014). The latest
version of VegMeasure has a built-in tool ‘Assess
Accuracy’ for assessing accuracy (Johnson et al.
2015), which allows easy computation of an error
matrix and a Kappa Index of Agreement for the
processed pictures.
Results
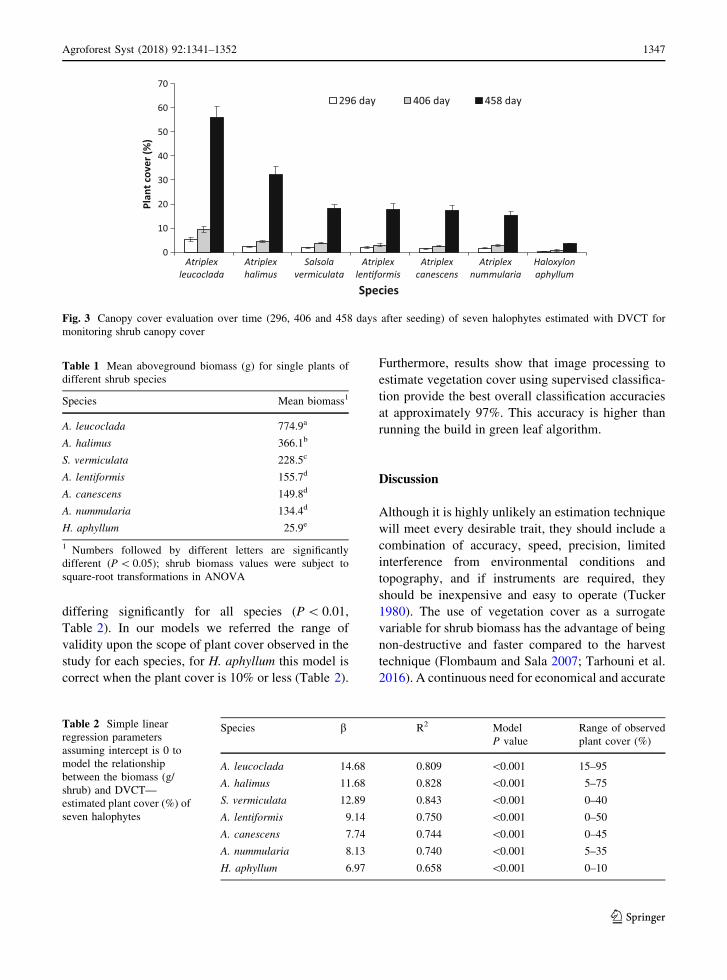
Atriplex leucoclada had the highest evolution of
average vegetation cover over time followed by A.
halimus, while H. aphyllum had the lowest (P\ 0.
01). Atriplex leucoclada plant cover increased from
5.16% (296 days after transplanting) to 56%
(406 days after transplanting). Similarly, S. vermicu-
lata, A. lentiformis, A. canescens and A. nummularia
had the same trend of average vegetation cover over
time. Salsola vermiculata plant cover ranged from 1.9,
3.70 and 18.23% in 296, 406 and 458 days after pots
transplanting respectively. Likewise A. lentiformis
vegetation cover changed from 2% in 296 days after
transplanting to 17.76% in 406 days after transplant-
ing (Fig. 3). Among all the seven shrub species H.
aphyllum performed the lowest plant cover changed
from 0.37 to 3.61% in 296 days and 406 days after
transplanting respectively (Fig. 3).
Data on biomass showed strong heterogeneity of
error variances; however, the square-root transformed
values supported the assumptions of consistency of
error variances and normality of experimental errors.
Species differences in biomass were significant
(P\ 0.001, Table 1). Among the shrub species eval-
uated, A. leucoclada had the greatest biomass (775 g
DM/shrub) followed by A. halimus (366 g DM/shrub)
and S. vermiculata (228.5 g DM/shrub), while H.
aphyllum had the lowest (25.9 g DM/shrub). How-
ever, there was no significant difference in biomass
yield among A. lentiformis, A. canescens and A.
nummularia. The study was set up in a manner that the
effect of climate would be uniform and data is cross
comparable. Therefore, climate differences were not a
factor as planting and sampling were conducted on the
same dates and the duration of the study was relatively
short. As indicated earlier, the soil conditions and the
rainfall pattern during the study period were not
limiting factors to inhibit growth of the selected
species. In general these species would withstand
much drier and harsh conditions and that is why they
are recommended for rehabilitation of degraded
rangelands.
The slopes derived from the linear regression for
the plant cover (%) of each species were positively
correlated with biomass, with R-squared (R2) ranging
from 0.66 (H. aphyllum) to 0.84 (S. vermiculata),
Fig. 2 Estimation of shrub canopy cover using a digital camera
mounted on a monopod 6 m above the ground: a image
collection with the equipment, b natural image of the shrub
community on the ground and c extracted image of the canopy
coverage of the shrub community from the digital image using
image processing VegMeasure program
1346 Agroforest Syst (2018) 92:1341–1352
123
differing significantly for all species (P\ 0.01,
Table 2). In our models we referred the range of
validity upon the scope of plant cover observed in the
study for each species, for H. aphyllum this model is
correct when the plant cover is 10% or less (Table 2).
Furthermore, results show that image processing to
estimate vegetation cover using supervised classifica-
tion provide the best overall classification accuracies
at approximately 97%. This accuracy is higher than
running the build in green leaf algorithm.
Discussion
Although it is highly unlikely an estimation technique
will meet every desirable trait, they should include a
combination of accuracy, speed, precision, limited
interference from environmental conditions and
topography, and if instruments are required, they
should be inexpensive and easy to operate (Tucker
1980). The use of vegetation cover as a surrogate
variable for shrub biomass has the advantage of being
non-destructive and faster compared to the harvest
technique (Flombaum and Sala 2007; Tarhouni et al.
2016). A continuous need for economical and accurate
0
10
20
30
40
50
60
70
Atriplexleucoclada
Atriplexhalimus
Salsolavermiculata
Atriplexlen�formis
Atriplexcanescens
Atriplexnummularia
Haloxylonaphyllum
Plan
t cov
er (%
)
Species
296 day 406 day 458 day
Fig. 3 Canopy cover evaluation over time (296, 406 and 458 days after seeding) of seven halophytes estimated with DVCT for
monitoring shrub canopy cover
Table 1 Mean aboveground biomass (g) for single plants of
different shrub species
Species Mean biomass1
A. leucoclada 774.9a
A. halimus 366.1b
S. vermiculata 228.5c
A. lentiformis 155.7d
A. canescens 149.8d
A. nummularia 134.4d
H. aphyllum 25.9e
1 Numbers followed by different letters are significantly
different (P\ 0.05); shrub biomass values were subject to
square-root transformations in ANOVA
Table 2 Simple linear
regression parameters
assuming intercept is 0 to
model the relationship
between the biomass (g/
shrub) and DVCT—
estimated plant cover (%) of
seven halophytes
Species b R2 Model
P value
Range of observed
plant cover (%)
A. leucoclada 14.68 0.809 \0.001 15–95
A. halimus 11.68 0.828 \0.001 5–75
S. vermiculata 12.89 0.843 \0.001 0–40
A. lentiformis 9.14 0.750 \0.001 0–50
A. canescens 7.74 0.744 \0.001 0–45
A. nummularia 8.13 0.740 \0.001 5–35
H. aphyllum 6.97 0.658 \0.001 0–10
Agroforest Syst (2018) 92:1341–1352 1347
123
measurements of shrub biomass that can be repeated
with precision has led to the progressive development
of the DVCT. Thus, biomass can be estimated over
time in the same location to assess temporal response
patterns. Such monitoring would assist researchers
and ecologists in future assessments to better under-
stand and test hypotheses about change or stability of
ecosystems. Changes in shrub density and size would
be easily detected. Digital records can be kept
permanently to observe trends over long periods.
DVCT has primarily been used in rangelands to
monitor and measure changes over time and to
evaluate the effectiveness of restoration (Louhaichi
et al. 2013) and managerial techniques. For example,
DVCT was used to monitor impact of herbicide on
native forbs in the sagebrush/bunchgrass steppe
(Louhaichi et al. 2012). DVCT applications have been
proven to be a successful method for agronomic
researches in particular to estimate the ground cover of
the monocultures (Preuss et al. 2012). This current
study confirmed that the DVCT technique is valuable
and reliable for estimating forage cover and biomass
of young shrubs. DVCTmethod provided a reasonable
estimation of canopy coverage for the shrub species
that were tested in the current study. A positive
relationship between vegetation cover and DM
biomass with R2 of 0.658–0.843 was found.
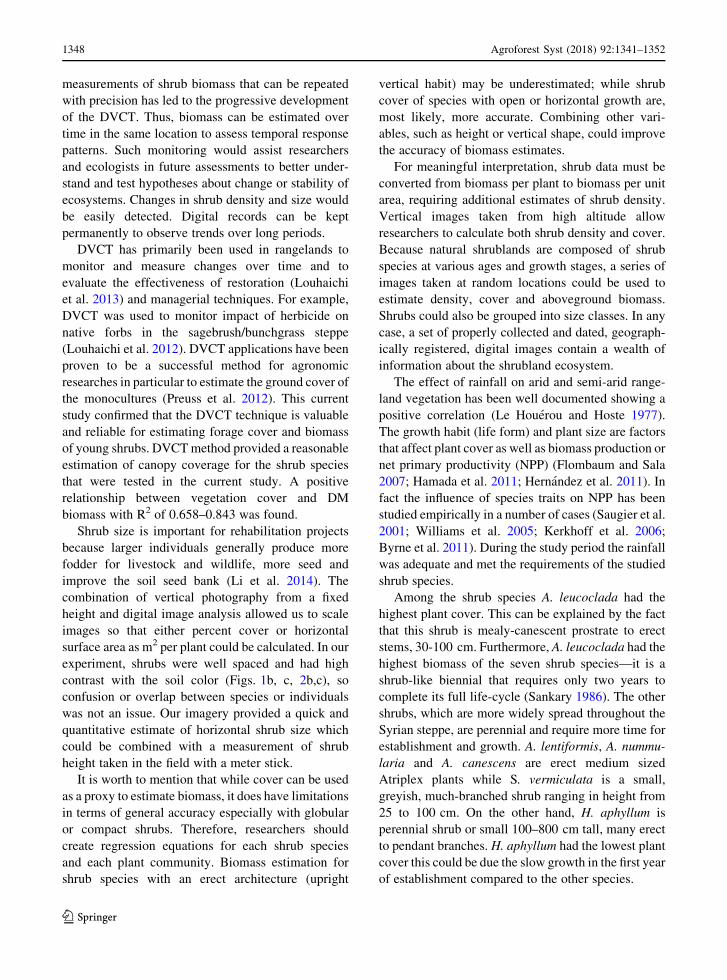
Shrub size is important for rehabilitation projects
because larger individuals generally produce more
fodder for livestock and wildlife, more seed and
improve the soil seed bank (Li et al. 2014). The
combination of vertical photography from a fixed
height and digital image analysis allowed us to scale
images so that either percent cover or horizontal
surface area as m2 per plant could be calculated. In our
experiment, shrubs were well spaced and had high
contrast with the soil color (Figs. 1b, c, 2b,c), so
confusion or overlap between species or individuals
was not an issue. Our imagery provided a quick and
quantitative estimate of horizontal shrub size which
could be combined with a measurement of shrub
height taken in the field with a meter stick.
It is worth to mention that while cover can be used
as a proxy to estimate biomass, it does have limitations
in terms of general accuracy especially with globular
or compact shrubs. Therefore, researchers should
create regression equations for each shrub species
and each plant community. Biomass estimation for
shrub species with an erect architecture (upright
vertical habit) may be underestimated; while shrub
cover of species with open or horizontal growth are,
most likely, more accurate. Combining other vari-
ables, such as height or vertical shape, could improve
the accuracy of biomass estimates.
For meaningful interpretation, shrub data must be
converted from biomass per plant to biomass per unit
area, requiring additional estimates of shrub density.
Vertical images taken from high altitude allow
researchers to calculate both shrub density and cover.
Because natural shrublands are composed of shrub
species at various ages and growth stages, a series of
images taken at random locations could be used to
estimate density, cover and aboveground biomass.
Shrubs could also be grouped into size classes. In any
case, a set of properly collected and dated, geograph-
ically registered, digital images contain a wealth of
information about the shrubland ecosystem.
The effect of rainfall on arid and semi-arid range-
land vegetation has been well documented showing a
positive correlation (Le Houerou and Hoste 1977).
The growth habit (life form) and plant size are factors
that affect plant cover as well as biomass production or
net primary productivity (NPP) (Flombaum and Sala
2007; Hamada et al. 2011; Hernandez et al. 2011). In
fact the influence of species traits on NPP has been
studied empirically in a number of cases (Saugier et al.
2001; Williams et al. 2005; Kerkhoff et al. 2006;
Byrne et al. 2011). During the study period the rainfall
was adequate and met the requirements of the studied
shrub species.
Among the shrub species A. leucoclada had the
highest plant cover. This can be explained by the fact
that this shrub is mealy-canescent prostrate to erect
stems, 30-100 cm. Furthermore, A. leucoclada had the
highest biomass of the seven shrub species—it is a
shrub-like biennial that requires only two years to
complete its full life-cycle (Sankary 1986). The other
shrubs, which are more widely spread throughout the
Syrian steppe, are perennial and require more time for
establishment and growth. A. lentiformis, A. nummu-
laria and A. canescens are erect medium sized
Atriplex plants while S. vermiculata is a small,
greyish, much-branched shrub ranging in height from
25 to 100 cm. On the other hand, H. aphyllum is
perennial shrub or small 100–800 cm tall, many erect
to pendant branches. H. aphyllum had the lowest plant
cover this could be due the slow growth in the first year
of establishment compared to the other species.
1348 Agroforest Syst (2018) 92:1341–1352
123
Accuracy assessment of vegetation cover derived
from remote sensing data has been documented as a
valuable tool in evaluating the fitness of these data for
estimating biomass production (Congalton 1991).
Accuracy assessment mostly generates one single
measure such as proportion of pixels correctly clas-
sified. The contrast encountered between the color of
soil and vegetation cover was so distinct. This factor
facilitated the image processing which led to a high
overall accuracy. Other factors which should be
considered for reaching remarkable results include
resolution of the digital camera. In this regards the
camera should be set on the finest resolution possible.
Timing during the day also may interfere with the
quality of the output. In general, it is recommended to
avoid early and late afternoon. Also make sure there is
no shadow in the ground where the image will be taken
(Johnson et al. 2015).
Conclusion
Various techniques have been developed to take
indirect measurements of biomass, including modify-
ing previous methods, developing different measure-
ments and creating new tools for measurements. It is
difficult to explicitly declare one method superior to
another, because each was developed for a specific
need; consequently, each method has strengths and
weaknesses in certain situations. The ability to quickly
measure shrub cover to determine biomass has global
implications. Understanding shrub cover/biomass
relations on drylands is a valuable tool to monitor
conservation, rehabilitation and improved manage-
ment. DVCT was a robust and cost effective method
for estimating cover and aboveground biomass of
shrubs in in our arid ecosystem. We suggest that this
technique can provide quantitative information to aid
understanding of shrub ecosystem dynamics, change
in the shrub carbon pool and identify climate change
mitigation opportunities. It could facilitate small-
holder farmers’ ability to verify improvement and
capitalize on the emerging green economy.
Digital imagery collection can speed up data
collection over larger areas, lowering the cost of
monitoring while reducing destruction of shrub
species. Our study identified relationships between
DVCT-measured shrub cover and biomass for seven
species and found acceptable estimates useful for
managerial decisions for six shrubs (R2[ 0.85).
These equations permit aboveground biomass estima-
tion from digital image analysis without the need for
vegetative destruction, providing a quick and cost
efficient way to estimate carrying capacity for live-
stock and wildlife as well as to monitor shrubland
condition and trend on a larger scale.
Acknowledgements The authors acknowledge ICARDA, the
CGIAR Research Program on Livestock Agri-Food Systems
(CRP Livestock) and Oregon State University (OSU),
Department of Animal and Rangeland Sciences for their
support and funding. Special thanks go to Dr. Jay Angerer
(Texas A & M University) for his critical review of this
manuscript.
Open Access This article is distributed under the terms of the
Creative Commons Attribution 4.0 International License (http://
creativecommons.org/licenses/by/4.0/), which permits unrest-
ricted use, distribution, and reproduction in any medium, pro-
vided you give appropriate credit to the original author(s) and
the source, provide a link to the Creative Commons license, and
indicate if changes were made.
References
Abdullah HM, Akiyama T, Shibayama M, Awaya Y (2011)
Estimation and validation of biomass of a mountainous
agroecosystem by means of sampling, spectral data and
QuickBird satellite image. Int J Sustain Dev World Ecol
18:384–392
Ahamefule FO, Obua BE, Ibeawuchi JA, Udosen NR (2006)
The nutritive value of some plants browsed by cattle in
Umudike, Southeastern Nigeria. Pak J Nutr 5(5):404–409
Al-Bakri JT, Taylor JC (2003) Application of NOAA AVHRR
for monitoring vegetation conditions and biomass in Jor-
dan. J Arid Environ 54:579–593
Al-Oudat M, Qadir M (2011) The halophytic flora of Syria.
International Center for Agricultural Research in the Dry
Areas, Aleppo
Anderson K, Gaston KH (2013) Lightweight unmanned aerial
vehicles will revolutionize spatial ecology. Front Ecol
Environ 11:138–146
Andrew MH, Noble IR, Lange RT, Johnson AW (1981) The
measurement of shrub forage weight: three methods com-
pared. Rangel J 3:74–82
Arabzadeh N, Emadian SF (2010) Effect of water (drought)
stress on water relations of Haloxylon aphyllum and H.
persicum. Iran J Sci Technol Trans A Sci 34(A3):245–255
Bar Massada A, Carmel Y, Tzur GE, Grunzweig JM, Yakir D
(2006) Assessment of temporal changes in aboveground
forest tree biomass using aerial photographs and allometric
equations. Can J Forest Res 36:2585–2594
BarbourMG, Burk JH, PittsWD (1987) Terrestrial plant ecology.
Benjamin/Cummings Publishing Company, Mento Park
Agroforest Syst (2018) 92:1341–1352 1349
123
Booth DT, Cox SE, Johnson DE (2005) Detection-threshold
calibration and other factors influencing digital measure-
ments of ground cover. Rangel Ecol Manag 58(6):598–604
Brady WW, Mitchell JE, Bonham CD, Cook JW (1995)
Assessing the power of the point-line transect to monitor
changes in plant basal cover. J Range Manag 87:187–190
Brakenhielm S, Liu QH (1995) Comparison of field methods in
vegetation monitoring. Water Air Soil Pollut 79:75–87
Breman H, De Ridder N (1991) Manuel sur les Paturages des
Pays Saheliens. Karthala, Paris
Breman H, Kessler JJ (1995) Woody plants in agro-ecosystems
of semiarid regions with emphasis on the Sahelian coun-
tries. Advanced series in agricultural sciences, vol 23.
Springer, Berlin
Byrne KM, Lauenroth WK, Adler PB, Byrne CM (2011) Esti-
mating aboveground net primary production in grasslands:
a comparison of nondestructive methods. Rangel Ecol
Manag 64:498–505
Canfield RH (1941) Application of the line interception method
in sampling range vegetation. J For 39(4):388–394
Cannell MGR (1984) Woody biomass of forest stands. For Ecol
Manag 8:299–312
Casadesus J, Villegas D (2014) Conventional digital cameras as
a tool for assessing leaf area index and biomass for cereal
breeding. J Integr Plant Biol 56:7–14
Chojnacky DC, Milton M (2008) Measuring carbon in shrubs.
In: Hoover CM (ed) Field measurements for forest carbon
monitoring. Springer, New York, pp 45–72
ClarkDA,BrownS,Kicklighter DW,Chambers JQ, Thomlinson
JR, Ni J (2001) Measuring net primary production in for-
ests: concepts and field methods. Ecol Appl 11(2):356–370
Congalton RG (1991) A review of assessing the accuracy of
classification of remotely sensed data. Remote Sens
Environ 37:35–46
Cooper WS (1924) An apparatus for photographic recording of
quadrats. J Ecol 12:317–321
Cox JR, Ruyle GB, Roundy BA (1990) Lehmann lovegrass in
southeastern Arizona: biomass production and disappear-
ance. J Range Manag 43:367–372
Deshmukh IK (1984) A common relationship between precip-
itation and Grassland peak biomass for East and Southern
Africa. Afr J Ecol 22:181–186
Flombaum P, Sala OE (2007) A non-destructive and rapid
method to estimate biomass and aboveground net primary
production in arid environments. J Arid Environ
69:352–358
Floyd DA, Anderson JE (1987) A comparison of three methods
for estimating plant cover. J Ecol 75(1):221–228
Frank AB, Karn JF (2003) Vegetation indices, CO2 flux, and
biomass for northern plains grasslands. J Range Manag
56:382–387
Franklin J, Hiernaux HY (1991) Estimating foliage and woody
biomass in Sahelian and Sudanian woodlands using a
remote sensing model. Int J Remote Sens 12:1387–1404
Garza A Jr, Fulbright TE (1988) Comparative chemical com-
position of armed saltbush and fourwing saltbush. J Range
Manag 41:401–403
Gayton D (2014) Grassland and forest understory vegetation
monitoring: an introduction to field methods. J Ecosyst
Manag 14(3) http://jem.forrex.org/index.php/jem/article/
viewFile/173/494. Accessed 14 Aug 2015
Gibbs HK, Brown S, Niles JO, Foley JA (2007) Monitoring and
estimating tropical forest carbon stocks: making REDD a
reality. Environ Res Lett 2(4):1–13
Gintzburger G, Toderich KN, Mardonov BK, Makhmudov MM
(2003) Rangelands of the arid and semiarid zones in
Uzbekistan. CIRAD, Montpellier
Glenn EP, Brown JJ (1998) Effects of salt levels on the growth
and water use efficiency of Atriplex canescens
(Chenopodicaceae) varieties in drying soil. Am J Bot
85:10–16
Hamada Y, Stow DA, Roberts DA (2011) Estimating life-form
cover factions in California sage scrub communities using
multispectral remote sensing. Remote Sens Environ
115(12):3056–3068
Hernandez L, Laundre JW, Gonzalez-Romero A, Lopez-Portillo
J, Grajales YKM (2011) Tale of two metrics: density and
biomass in a desert rodent community. J Mammal
92:840–851
Hill MJ, Braaten R, Lees B, Veitch SM, Sharma S (2005) Multi-
criteria decision analysis in spatial decision support: the
ASSESS analytic hierarchy process and the role of quan-
titative methods and spatially explicit analysis. Environ
Model Softw 20:955–976
Hoover CM (2008) Field measurements for forest carbon mon-
itoring: a landscape-scale approach. Springer, New York
Jensen JR (2007) Remote sensing of the environment: an earth
resources perspective. Prentice Hall Inc., Upper Saddle
River
Johnson MD, Louhaichi M, Woerz AL, Clark PE, Johnson DE
(2009) VegMeasure 2 User’s Manual. Department of
Rangeland Ecology & Management, Oregon State
University. Corvallis, Oregon
Johnson MD, Louhaichi M, Johnson DE, Pearson A (2015)
VegMeasure 2. Version 2.2. International Center for
Agricultural Research in Dry Areas (ICARDA), Amman,
Jordan. http://www.vegmeasure.org/download/252/.
Accessed 25 May 2016
Kawamura K, Akiyama T, Yokota H, Tsutsumi M, Yasuda T,
Watanabe O, Wang G, Wang S (2005) Monitoring of
forage conditions with MODIS imagery in the Xilingol
steppe, Inner Mongolia. Int J Remote Sens 26:1423–
1436
Kerkhoff AJ, Brian J, Enquist JB (2006) Ecosystem allometry:
the scaling of nutrient stocks and primary productivity
across plant communities. Ecol Lett 9:419–427
Lamari L (2002) Assess: image analysis software for plant
disease quantification. The American Phytopathological
Society Press, St. Paul
Le Houerou HN (1980) Chemical composition and nutritive
value of browse in tropical West Africa. In: Le Houerou
HN (ed) Browse in Africa: the current state of knowledge.
International Livestock Center for Africa, Addis Ababa,
pp 55–82
Le Houerou HN (1992a) An overview of vegetation and land
degradation in world arid lands. In: Dregne HE (ed)
Degradation and restoration of arid lands. International
Center for Arid and Semi-Arid Lands Studies (ICASALS),
Texas Tech University, Lubbock, Texas, pp 127–163
Le Houerou HN (1992b) The role of saltbushes (Atriplex spp.) in
arid land rehabilitation in the Mediterranean Basin: a
review. Agrofor Syst 18(2):107–148
1350 Agroforest Syst (2018) 92:1341–1352
123
Le Houerou HN (1996) Use of fodder trees and shrubs (trubs) in
the arid and semi-arid zones of West Asia and North
Africa: history and perspectives. In: Gintzburger G,
Bounejmate M, Nefzaoui A (eds) Fodder shrub develop-
ment in arid and semiarid zones. International Center for
Agricultural Research in the Dry Areas, Aleppo, pp 9–53
Le Houerou HN (2010) Utilization of fodder trees and shrubs in
the arid and semiarid zones of West Asia and North Africa.
Arid Soil Res Rehabil 14:101–135
Le Houerou HN, Hoste CH (1977) Rangeland production and
annual rainfall relations in the Mediterranean basin and in
the African Sahelo-Sudanian zone. J Range Manag
30:163–178
Li X, Jiang D, Zhou Q, Oshida T (2014) Soil seed bank char-
acteristics beneath an age sequence of Caragana micro-
phylla shrubs in the Horqin sandy land region of
northeastern China. Land Degrad Dev 25(3):236–243
Lillesand T, Kiefer RW, Chipman J (2008) Remote sensing and
image interpretation. Wiley, Toronto
Louhaichi M, Borman MM, Johnson DE (2001) Spatially
located platform and aerial photography for documentation
of grazing impacts on wheat. Geocarto Int 16:63–68
Louhaichi M, Salkini AK, Petersen SL (2009) Effect of small
ruminant grazing on the plant community characteristics of
semiarid Mediterranean ecosystems. Int J Agric Biol
11:681–689
Louhaichi M, Johnson MD, Woerz AL, Jasra AW, Johnson DE
(2010) Digital charting technique for monitoring rangeland
vegetation cover at local scale. Int J Agric Biol 12:406–410
Louhaichi M, Carpinelli MF, Richman LM, Johnson DE (2012)
Native forb response to sulfometuron methyl on medusa-
head-invaded rangeland in Eastern Oregon. Rangel J
34(1):47–53
Louhaichi M, Pyke DA, Shaff SE, Johnson DE (2013) Moni-
toring restoration Impacts to endemic plant communities in
soil inclusions of arid environments. Int J Agric Biol
15:767–771
Lu DS (2006) The potential and challenge of remote sensing-
based biomass estimation. Int J Remote Sens
27:1297–1328
Ludwig JA, Reynolds JF, Whitson PD (1975) Size-biomass
relationships of several Chihuahuan desert shrubs. Am
Midl Nat 94:451–461
Magill AW (1989)Monitoring environmental change with color
slides. General Technical Report. PSW-117. Berkeley,
California http://www.fs.fed.us/psw/publications/documents/
psw_gtr117/psw_gtr117a.pdf. Accessed 25 May 2016
Mata M, Clark DA, Edirisinghe A, Waugh D, Minnee E,
Gherardi SG (2007) Predicting accurate paddock average
pasture cover in Waikato dairy farms using satellite ima-
ges. Proc NZ Grassl Assoc 69:23–28
Montalvo AE, JrD Ransom, Lopez RR (2014) Modeling greater
roadrunners’ (Geococcyx californianus) habitat use in
West Texas. Wilson J Ornithol 126(2):359–366
Montes N, Gauquelin T, Badri W, Bertaudiere V, Zaoui EH
(2000) A non-destructive method for estimating above-
ground forest biomass in threatened woodlands. For Ecol
Manag 130:37–46
Olmstead MA, Wample R, Greene S, Tarara J (2004) Nonde-
structive measurement of vegetative cover using digital
image analysis. HortScience 39(1):55–59
Payne RW (2014) The guide to GenStat� release 17. Part 2:
Statistics. VSN International, Hemel Hempstead, United
Kingdom
Preuss CP, Louhaichi M, Huang CY, Ogbonnaya FC (2012)
Genetic variation in the early vigor of twenty elite spring
wheat under phosphate stress as characterized through
digital charting. Field Crops Res 127:71–78
Rango A, Laliberte A, Herrick JE, Winters C, Havstad K, Steele
C, Browning D (2009) Unmanned aerial vehicle-based
remote sensing for rangeland assessment, monitoring, and
management. J Appl Remote Sens 3:033542
Reyes-Betancort JA, Wildpret W, Leon Arencibia MC (2001)
The vegetation of Lanzarote (Canary Islands). Phyto-
coenologia 31(2001):185–247
Rivas-Martınez S, Fernandez-Gonzalez F, Loidi J, Lousa M,
Penas A (2001) Syntaxonomical checklist of vascular plant
communities of Spain and Portugal to association level.
Itinera Geobot 14(2001):5–341
Roy P, Ravan S (1996) Biomass estimation using satellite
remote sensing data: an investigation on possible approa-
ches for natural forest. J Biosci 21:535–561
Ryan J, Masri S, Garabet S, Diekmann J, Habib H (1997) Soils
of ICARDA’s agricultural experiment stations and sites:
climate, classification, physical and chemical properties,
and land use. Technical Bulletin, International Center for
Agricultural Research in the Dry Areas (ICARDA),
Aleppo, Syria
Sala OE, Austin AT (2000) Methods of estimating aboveground
net primary productivity. In: Sala OE, Jackson RB,
Mooney HA, Howarth R (eds) Methods in ecosystem sci-
ence. Springer, New York, pp 31–43
Sankary MN (1986) Species distribution and growth in salt
effected land of Syria. Reclam Reveg Res 5:125–143
Sannier CAD, Taylor JC, Du Plessis W (2002) Real-time
monitoring of vegetation biomass with NOAA-AVHRR in
Etosha National Park, Namibia, for fire risk assessment. Int
J Remote Sens 23:71–89
Saugier B, Roy J, Mooney HA (2001) Estimations of global ter-
restrial productivity: converging towards a single number?
In: Roy J, Saugier B, Mooney HA (eds) Terrestrial global
productivity. Academic Press, San Diego, pp 543–557
Seefeldt SS, Booth DT (2006) Measuring plant cover in sage-
brush steppe rangelands: a comparison of methods. J En-
viron Manag 37:703–711
Shamsutdinov NZ, Shamsutdinov ZSh (2008) Biotic meliora-
tion of saline-saltish soils using halophytes. Aridnye Eko-
sist 14(35–36):18–33
Sivanpillai R, Booth DT (2008) Characterizing rangeland veg-
etation using landsat and 1-mm VLSA data in central
Wyoming (USA). Agrofor Syst 73:55–64
Smith MO, Ustin SL, Adams JB, Gillespie AR (1990) Vegeta-
tion in deserts: I. A regional measure of abundance from
multispectral images. Remote Sens Environ 31:1–26
Steven MD, Malthus TJ, Baret F, Xu H, Chopping MJ (2003)
Intercalibration of vegetation indices from different sensor
systems. Remote Sens Environ 88(4):412–422
Stoddard LA, Smith AD (1943) Rangeland management.
McGraw Hill Book Co., Inc., New York
Sykes JM, Horrill AD, Mountford MD (1983) Use of visual
cover assessments as quantitative estimators of some Bri-
tish woodland taxa. J Ecol 71:437–450
Agroforest Syst (2018) 92:1341–1352 1351
123
Tarhouni M, Ben Salem F, Tlili A, Ouled Belgacem A, Neffati
M, Louhaichi M (2016) Measurement of the aboveground
biomass of some rangeland species using a digital non-
destructive technique. Bot Lett 163(3):281–287
Tucker CJ (1978) Comparison of satellite sensor bands for
vegetation monitoring. Photogram Eng Remote Sens
44:1369–1380
Tucker CJ (1980) A critical review of remote sensing and other
methods for nondestructive estimating of standing crop
biomass. Grass Forage Sci 35:177–182
Tucker CJ, Vanpraet C, Boerwinkel E, Gaston A (1983) Satellite
remote-sensing of total dry-matter production in the
Senegalese sahel. Remote Sens Environ 13(6):461–474
Walker DJ, Lutts S, Sanchez-Garcıa M, Correal E (2014) Atri-
plex halimus L.: its biology and uses. J Arid Environ
100–101:111–121
Williams J, Eric W, Seabloom A, Slayback D, Stoms DM,
Viersm JH (2005) Anthropogenic impacts upon plant
species richness and net primary productivity in California.
Ecol Lett 8:127–137
Winter K (1981) C4 plants of high biomass in arid regions of
Asia-occurrence of C4 photosynthesis in Chenopodiaceae
and Polygonaceae from the Middle East and USSR.
Oecologia 48(1):100–106
Zhang C, Kovacs JM (2012) The application of small unmanned
aerial systems for precision agriculture: a review. Precision
Agric 13:693–712
1352 Agroforest Syst (2018) 92:1341–1352
123