Embed Size (px)
Citation preview
ORIGINAL RESEARCH
A reliability-based maintenance technicians’ workloadsoptimisation model with stochastic consideration
D. E. Ighravwe1,2 • S. A. Oke1 • K. A. Adebiyi2
Received: 27 November 2014 / Accepted: 5 December 2015 / Published online: 18 December 2015
� The Author(s) 2015. This article is published with open access at Springerlink.com
Abstract The growing interest in technicians’ workloads
research is probably associated with the recent surge in
competition. This was prompted by unprecedented tech-
nological development that triggers changes in customer
tastes and preferences for industrial goods. In a quest for
business improvement, this worldwide intense competition
in industries has stimulated theories and practical frame-
works that seek to optimise performance in workplaces. In
line with this drive, the present paper proposes an opti-
misation model which considers technicians’ reliability
that complements factory information obtained. The
information used emerged from technicians’ productivity
and earned-values using the concept of multi-objective
modelling approach. Since technicians are expected to
carry out routine and stochastic maintenance work, we
consider these workloads as constraints. The influence of
training, fatigue and experiential knowledge of technicians
on workload management was considered. These work-
loads were combined with maintenance policy in optimis-
ing reliability, productivity and earned-values using the
goal programming approach. Practical datasets were uti-
lised in studying the applicability of the proposed model in
practice. It was observed that our model was able to gen-
erate information that practicing maintenance engineers
can apply in making more informed decisions on techni-
cians’ management.
Keywords Experiential knowledge � Stochastic
workloads � Goal programming � Technician’s reliability �Technician’s fatigue
Introduction
Maintenance workload optimisation scheduling problem has
witnessed the application of different modelling approaches
in improving equipment availability (Safaei et al. 2008).
Performance metrics, methodologies and tools used to
ascertain the control of technicians’ workload during the
plant’s operating hours have evolved for decades. The
pressure and growing interest in technicians’ workload
practices and research seems to be associated strongly with
the recent surge in competition globally. It was also triggered
by the increasingly difficulty in economic growth of indus-
tries. Current research trends in this area therefore match
technicians’ characteristics with workloads and other con-
siderations. There are immense benefits in understanding the
reliability of technicians (Gregoriades and Sutcliffe 2008).
This will help in the integration of technicians’ reliability
into technicians’ work performance evaluation. All these
efforts are to minimise maintenance job rework and reduce
overtime. It also aids making the overhaul activity more
effective and reduce equipment breakdown to an accept-
able level. This study is motivated by lack of information on
how to optimise the technicians’ costs, workloads, sizes and
reliability of technicians. Most theoretical accounts of reli-
ability have been skewed towards machines.
An organisation with an effective and efficient group of
technicians experiences several benefits. These benefits are
& S. A. Oke
1 Department of Mechanical Engineering, Faculty of
Engineering, University of Lagos, Room 10, Mezzanine
Complex, Akoka-Yaba, Lagos, Nigeria
2 Department of Mechanical Engineering, Faculty of
Engineering, Ladoke Akintola University of Technology,
Ogbomosho, Nigeria
123
J Ind Eng Int (2016) 12:171–183
DOI 10.1007/s40092-015-0134-6

improved productivity, elevated sales, enhanced customer
service, reduced labour costs, improved employee
engagement and satisfaction (Bartels and Richey 2008).
Focusing on the maintenance department as a major area
for driving the above-mentioned benefits is important
because of its interrelationships with other departments.
Maintenance problems in manufacturing systems are
diverse. Technicians’ workload and reliability problems,
which are key problems in solving other problems in
maintenance system, are least considered in literature.
Several contributions on spare parts management, machine
availability (Safaei et al. 2008) and maintenance budget
(Mansour 2011; Ighravwe and Oke 2014; Ighravwe et al.
2015) have been documented. Within the last few decades,
researchers and industrial practitioners have started con-
sidering human factors in maintenance systems with a view
of ensuring robust maintenance management systems.
Dealing with the maximisation of a multi-objective
problem that is nonlinear in formulation, a single objective
model with weights for each objective was considered.
Such a model can be solved easily using metaheuristics
(evolutionary algorithms and swarm algorithms) in order to
generate compromise solutions. Currently, there exists
sparse documentation on big-bang–big-crunch (BB–BC)
and EP algorithms as solution methods for technicians’
parameters optimisation.
Studying fatigue during the design of technicians’
workload and reliability for planned operations will help in
improving work-plans. Another aspect of technician’s
problem, which has been sparingly considered in the lit-
erature, is experiential knowledge of the technicians who
engage in rework activities.
The objective of this study was to develop a mixed-
integer optimisation model that optimises technicians’
sizes, workloads (service times), reliability, availability,
performance (efficiency) and quality of workdone. A per-
formance comparative analysis of EP and BB–BC algo-
rithms when used in solving the proposed model was also
carried out. The selection of these algorithms was moti-
vated by their low computation time.
Literature review
Maintenance system operations are often executed using
maintenance teams (Hedjazi 2015). These teams are
formed based on the skills of technicians (Hedjazi 2015)
and the types of maintenance activities (Ighravwe and Oke
2014; Ighravwe et al. 2015) in an organisation. Tohidi and
Tarokh (2005) reported that when forming teams, there is
the need to ensure proper communication systems. These
help in improving the productivity of teams. Thus, the
interest of researchers and practitioners in maintenance
systems is on the analysis of types of maintenance activi-
ties, policies, technicians’ attributes (productivity, service
time and skills) and cost of operating maintenance systems
(Lai et al. 2015). The core reason for studying maintenance
departmental performance is to improve organisation’s
profitability (Alsyouf 2007). This has stimulated different
scientific methods in analysing maintenance systems.
Maintenance workload management helps in determin-
ing equipment downtime. When workload is optimally
shared among the team members, low amounts of equip-
ment downtime will be experienced. For example, the
concern of Oladokun et al. (2006) was how to predict
equipment downtime. In their study, a predictive model
was designed to predict equipment downtime using
machine breakdown periods and maintenance repair time
as dependent variable. The issue of how to determine
maintenance repair times was not exhaustively addressed
in their study. Rana and Purohit (2012) investigated the
application of critical path method in addressing the
problems of technician’s productivity, maintenance time
and tasks balancing. One drawback of their study is the
assumption that technicians are capable of doing any
maintenance work in an organisation. In practice, this
assumption is feasible for small-scale organisations.
However, for large-scale systems, the assumption may be
violated. This study relaxed the assumption of Rana and
Purohit (2012) by considering technicians for different
sections (mechanical, electrical and instrumentation). The
scope of Ighravwe and Oke’s (2014) study limited main-
tenance activities to routine maintenance. Ighravwe and
Oke (2014) modelled maintenance time utilisation problem
by considering the allocated and actual maintenance time
used by technicians. No mention of technician’s training
and fatigue experienced during the execution of mainte-
nance activities was mentioned in their work. In the work
of He et al. (2014), the issue of technician’s reliability and
cost were addressed using nonlinear programming tech-
niques. Their proposed model can be applied in a mainte-
nance system. However, consideration was not given to the
impact of technician’s fatigue, experiential knowledge and
training on technician’s reliability.
Huge amount of funds are usually invested in mainte-
nance systems of organisations. This is necessary avert
machine breakdowns, which could be more costly. Fajardo
and Drekic (2015) pointed out that cost-effective mainte-
nance checks could be achieved during close-down peri-
ods. The problem of technician cost and equipment
availability was studied by Safaei et al. (2008). The
application of simulated annealing as a solution method for
handling multi-objective technicians’ problem was
demonstrated. They considered the management of regular,
outsourcing and overtime maintenance activities. Man-
sour’s (2011) studied maintenance cost minimisation
172 J Ind Eng Int (2016) 12:171–183
123

problem by proposing a mixed-integer programming model
that incorporates equipment complexity. Their work
investigated the suitability of genetic algorithm as a solu-
tion method for technicians’ parametric optimisation.
Kaufman and Lewis (2007) considered the application
of repair and replacement models for maintenance work-
load management. In their study, information on service
rates and failures, fixed maintenance times and random
replacement times was generated. A model that minimised
the total cost of technicians used for maintenance activities
was developed by De Bruecker et al. (2015) using mixed-
integer programming approach. In their study, a model
enhancement heuristic was proposed as solution method for
their model. The heuristic considered stochastic service
levels.
Knapp and Mahajan (1998) conducted a comparative
analysis between centralised and decentralised organisa-
tional structure as it affects maintenance systems. Con-
sideration was given to technician-type (in-house and sub-
contracted technicians) and training levels of technicians.
The results of their study demonstrated how optimal allo-
cation of technicians can be achieved. A study which
considered organisational policies on technicians’ capacity
was presented by Mjema (2002). The challenge of
managing the switches of technicians for mechanical and
electrical workloads was considered. Their analysis was
based on the technicians’ utilisation and through-put time,
work-order requirement and prioritisation rules.
Manzini et al. (2015) presented a nonlinear model which
minimises cost of preventive and corrective maintenance as
well as technicians’ workload and spare parts cost. These
maintenance costs were optimised under total expected and
probabilistic costs. Hervet and Chardy (2012) reported the
use of mixed-integer programming approach in addressing
the problem of preventive maintenance workforce needs
during the design of passive optical network. Jarugumill
(2011) studied workforce problem by considering regular
and overtime activities as well as workers’ skills.
Research methodology
This section presents the proposed model (‘‘Model for-
mulation’’ section) and discussed the solution methods
used in solving the proposed model (‘‘Solution methods’’
section). The development of the proposed model was
based on the following assumptions:
1. Technicians in the same group can be categorised
differently, and these categories are known in advance;
2. Available maintenance work is carried out by in-house
maintenance crew only; and
3. Inventories for maintenance work are available and
released when needed.
Some of the notations used in formulating the proposed
model are given as follows:
Indices
i Maintenance activity
j Maintenance section
k Technicians category
t Planning period
M Total number of types of maintenance activities
N Total number of maintenance sections
K Total number of technicians categories
T Total number of sub-planning periods
Decision variables
xijkt Number of technicians required for maintenance
activity i from maintenance section j belonging to
technician category k at period t
Rijkt Reliability of a technician required for maintenance
activity i from maintenance section j belonging to
technician category k at period t
dijkt Amount of maintenance time required by technician
to carry out maintenance activity i from
maintenance section j belonging to technician
category k at period t (h)
Parameters
vijkt Earned-value of a technician that carries out
maintenance activity i from maintenance section
j belonging to technician category k at period t (N)
cijkt Unit cost of technician that carries out maintenance
activity i from maintenance section j belonging to
technician category k at period t (N)
rit Expected value of technicians’ reliability for
maintenance activity i at period t
vit Total cost of technicians required to carry out
maintenance activity i at period t (N)
vt Total cost of technicians required to carry out
available maintenance activities at period t (N)
aijt Actual number of days a technician in section
j from technicians category k at period t is available
in a maintenance system (days)
pijt Actual performance of a technician in section
j from technician’s category k at period t
qijt Actual quality of workdone by a technician in
section j from technician’s category k at period
t (kg)
J Ind Eng Int (2016) 12:171–183 173
123

aijt Expected days a technician in section j from
technician’s category k at period t is available at a
maintenance system (days)
pijt Expected performance of a worker in section j from
technician’s category k at period t
qijt Expected quality of workdone by a technicians in
section j from technician’s category k at period t (kg)
bijk 1 The minimum value of fatigue experienced during
maintenance activity i by a technician from
maintenance section j belonging to technicians’
category k (h)
bijk 2 The maximum value of fatigue experienced during
maintenance activity i by a technician from
maintenance section j belonging to technicians’
category k (h)
cjk 1 The minimum value of extra fatigue on technicians
for overtime activities by technicians from
maintenance section j belonging to technician’s
category k (h)
cjk 2 The maximum value of extra fatigue on technicians
for overtime activities by technicians from
maintenance section j belonging to technician’s
category k (h)
ejk 1 The minimum value of experiential on technicians
for reworked activities by technicians from
maintenance section j belonging to technician’s
category k (h)
ejk 2 The maximum value of experiential on technicians for
reworked activities by technicians from maintenance
section j belonging to technician’s category k (h)
Vijk 2 The minimum value of training impact on
technicians for maintenance activity i by
technicians from maintenance section j belonging
to technician’s category k (h)
Vijk 2 The maximum value of training impact on
technicians for maintenance activity i by
technicians from maintenance section j belonging
to technician’s category k (h)
f bð Þ Probability density function of fatigue on
technicians for maintenance activities
f vð Þ Probability density function of training impact on
technicians service times
f eð Þ Probability density function of extra fatigue
experience by technicians during overtime
maintenance activity
f cð Þ Probability density function of experience gain by
technicians during reworked maintenance activity
Model formulation
This study presented two technicians’ objectives (earned-
value and reliability) which were subjected to technician’s
cost, service time, reliability, availability, performance and
quality of workdone.
The cost of keeping a particular level of technician in a
system depends largely on the expected contributions from
the technicians. Using the concept of earned-value from
engaging technicians in planned and unplanned mainte-
nance activities in an organisation, the total earned-value
from scheduling the different technicians for stochastic
maintenance activities in a maintenance system was
expressed as Eq. (1). The technician’s earned-value is a
function of the size of technicians assigned to carry out
maintenance activities ðxijktÞ; time spent on maintenance
activities ðdijktÞ and the unit earned-value expected from
each technician ðvijktÞ: Technician’s earned-value could be
defined as a measure of the value of utilising a technician
for maintenance activities with respect to maintenance
time.
Max f1 ¼XT
t¼1
XM
i¼1
XN
j¼1
XK
K¼1
vijktdijktxijkt ð1Þ
By looking beyond the concept of earned-value of
technicians, technicians scheduling analysis may be
improved on using the average expected technician relia-
bility ðRijkÞ over a planning period. The study of techni-
cian’s reliability provides a means of estimating the degree
to which the expected earned-value of technicians will be
achieved. Since technicians work in groups, we considered
their reliability as being parallel. The expected average
technicians’ reliability is expressed as Eq. (2).
Max f2 ¼1
T
XT
t¼1
YM
i¼1
1� 1�YN
j¼1
YK
k¼1
1� 1�Rijkt
� �xijkt� � ! !" #
ð2Þ
The volume of maintenance work from overtime,
overtime and rework maintenance activities in a system
varies from one period to another. This variation may be
attributed to equipment usage, equipment age, organisa-
tion’s maintenance policy and quantity of spare parts used.
Furthermore, factors such as fatigue, training and experi-
ential knowledge affect technicians performance when
restoring equipment to acceptable functional state.
The issue of routine maintenance activities has been
studied in the literature (Mansour 2011). However, the
concerns of researchers have been on equipment. Infor-
mation on factors which affect technicians’ performance is
sparse in maintenance literature. This study considered the
issue of fatigue and training on technician’s service time.
Since it is often difficult to measure fatigue in qualitative
terms, a continuous function was used to capture the
amounts of fatigue a technician experience during the
maintenance activities. This is possible by considering two
174 J Ind Eng Int (2016) 12:171–183
123
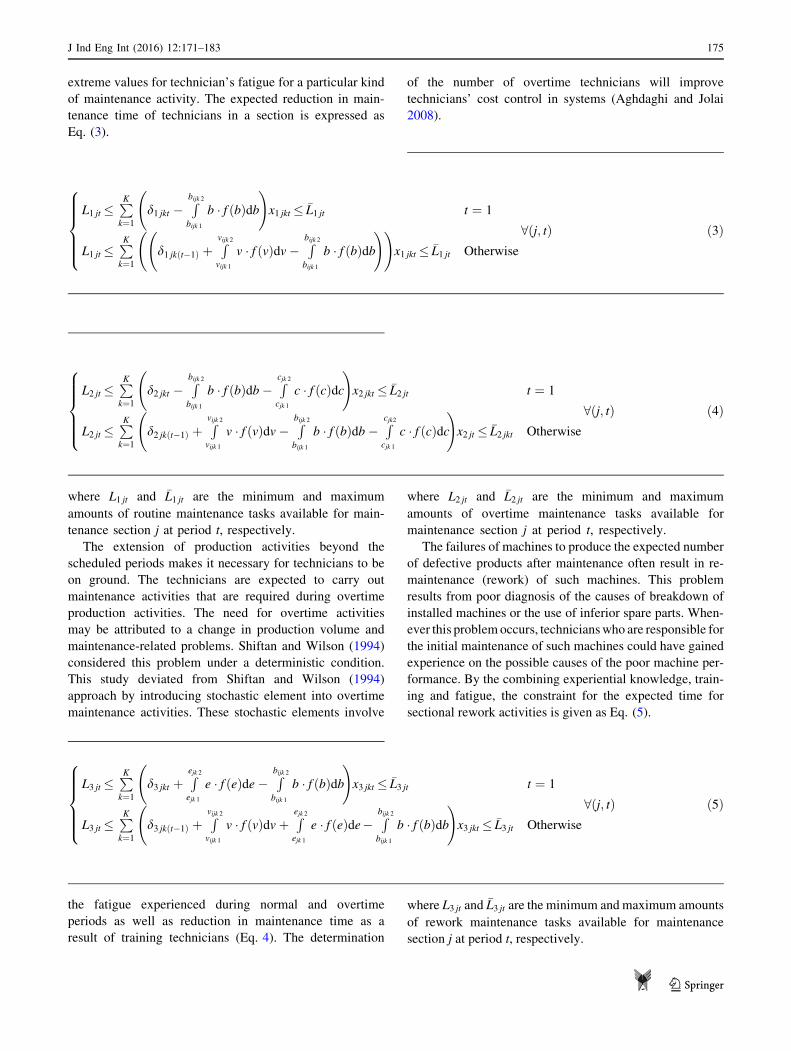
extreme values for technician’s fatigue for a particular kind
of maintenance activity. The expected reduction in main-
tenance time of technicians in a section is expressed as
Eq. (3).
where L1 jt and �L1 jt are the minimum and maximum
amounts of routine maintenance tasks available for main-
tenance section j at period t, respectively.
The extension of production activities beyond the
scheduled periods makes it necessary for technicians to be
on ground. The technicians are expected to carry out
maintenance activities that are required during overtime
production activities. The need for overtime activities
may be attributed to a change in production volume and
maintenance-related problems. Shiftan and Wilson (1994)
considered this problem under a deterministic condition.
This study deviated from Shiftan and Wilson (1994)
approach by introducing stochastic element into overtime
maintenance activities. These stochastic elements involve
the fatigue experienced during normal and overtime
periods as well as reduction in maintenance time as a
result of training technicians (Eq. 4). The determination
of the number of overtime technicians will improve
technicians’ cost control in systems (Aghdaghi and Jolai
2008).
where L2 jt and �L2 jt are the minimum and maximum
amounts of overtime maintenance tasks available for
maintenance section j at period t, respectively.
The failures of machines to produce the expected number
of defective products after maintenance often result in re-
maintenance (rework) of such machines. This problem
results from poor diagnosis of the causes of breakdown of
installed machines or the use of inferior spare parts. When-
ever this problem occurs, technicians who are responsible for
the initial maintenance of such machines could have gained
experience on the possible causes of the poor machine per-
formance. By the combining experiential knowledge, train-
ing and fatigue, the constraint for the expected time for
sectional rework activities is given as Eq. (5).
where L3 jt and �L3 jt are the minimum and maximum amounts
of rework maintenance tasks available for maintenance
section j at period t, respectively.
L1 jt �PK
k¼1
d1 jkt �Rbijk 2
bijk 1
b � f bð Þdb !
x1 jkt � �L1 jt t ¼ 1
L1 jt �PK
k¼1
d1 jkðt�1Þ þRvijk 2
vijk 1
v � f vð Þdv�Rbijk 2
bijk 1
b � f bð Þdb ! !
x1 jkt � �L1 jt Otherwise
8>>>><
>>>>:
8 j; tð Þ ð3Þ
L2 jt �PK
k¼1
d2 jkt �Rbijk 2
bijk 1
b � f bð Þdb�Rcjk 2
cjk 1
c � f cð Þdc !
x2 jkt � �L2 jt t ¼ 1
L2 jt �PK
k¼1
d2 jkðt�1Þ þRvijk 2
vijk 1
v � f vð Þdv�Rbijk 2
bijk 1
b � f bð Þdb�Rcjk2
cjk 1
c � f cð Þdc !
x2 jt � �L2 jkt Otherwise
8>>>><
>>>>:
8 j; tð Þ ð4Þ
L3 jt �PK
k¼1
d3 jkt þRejk 2
ejk 1
e � f eð Þde�Rbijk 2
bijk 1
b � f bð Þdb !
x3 jkt � �L3 jt t ¼ 1
L3 jt �PK
k¼1
d3 jkðt�1Þ þRvijk 2
vijk 1
v � f vð ÞdvþRejk 2
ejk 1
e � f eð Þde�Rbijk 2
bijk 1
b � f bð Þdb !
x3 jkt � �L3 jt Otherwise
8>>>><
>>>>:
8 j; tð Þ ð5Þ
J Ind Eng Int (2016) 12:171–183 175
123
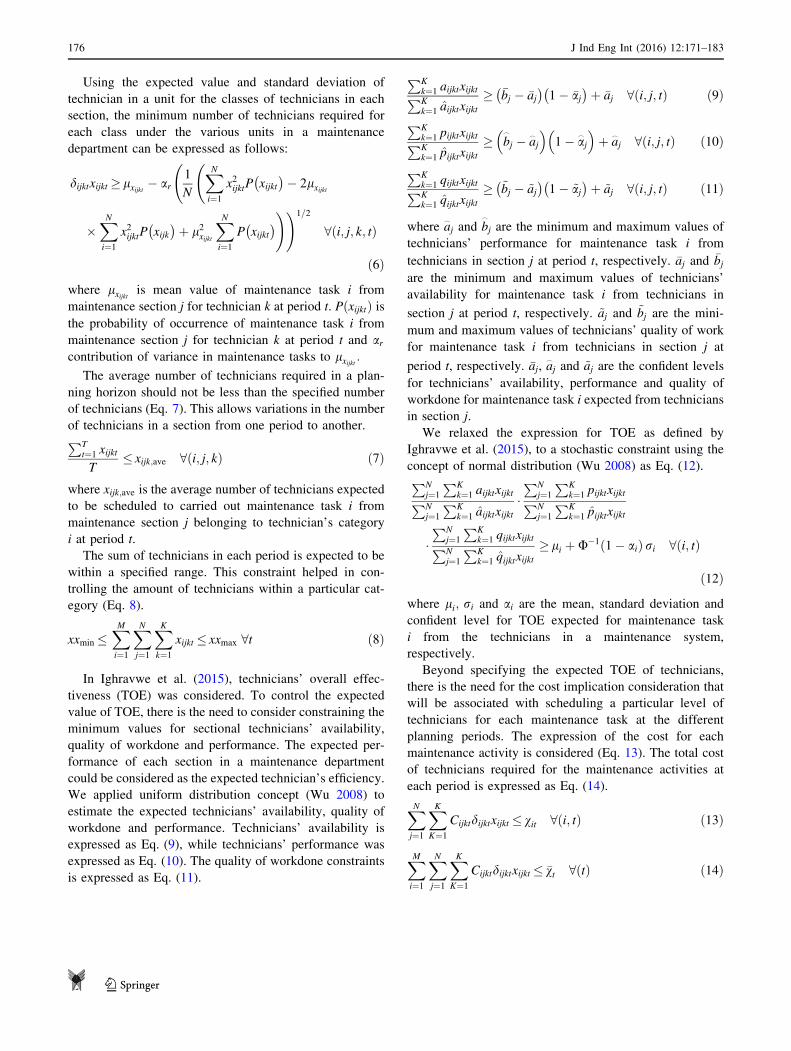
Using the expected value and standard deviation of
technician in a unit for the classes of technicians in each
section, the minimum number of technicians required for
each class under the various units in a maintenance
department can be expressed as follows:
dijktxijkt � lxijkt � ar1
N
XN
i¼1
x2ijktP xijkt
� �� 2lxijkt
�XN
i¼1
x2ijktP xijk
� �þ l2
xijkt
XN
i¼1
P xijkt� �
!!1=2
8 i; j; k; tð Þ
ð6Þ
where lxijkt is mean value of maintenance task i from
maintenance section j for technician k at period t. PðxijktÞ is
the probability of occurrence of maintenance task i from
maintenance section j for technician k at period t and arcontribution of variance in maintenance tasks to lxijkt :
The average number of technicians required in a plan-
ning horizon should not be less than the specified number
of technicians (Eq. 7). This allows variations in the number
of technicians in a section from one period to another.PT
t¼1 xijkt
T� xijk;ave 8 i; j; kð Þ ð7Þ
where xijk;ave is the average number of technicians expected
to be scheduled to carried out maintenance task i from
maintenance section j belonging to technician’s category
i at period t.
The sum of technicians in each period is expected to be
within a specified range. This constraint helped in con-
trolling the amount of technicians within a particular cat-
egory (Eq. 8).
xxmin �XM
i¼1
XN
j¼1
XK
k¼1
xijkt � xxmax 8t ð8Þ
In Ighravwe et al. (2015), technicians’ overall effec-
tiveness (TOE) was considered. To control the expected
value of TOE, there is the need to consider constraining the
minimum values for sectional technicians’ availability,
quality of workdone and performance. The expected per-
formance of each section in a maintenance department
could be considered as the expected technician’s efficiency.
We applied uniform distribution concept (Wu 2008) to
estimate the expected technicians’ availability, quality of
workdone and performance. Technicians’ availability is
expressed as Eq. (9), while technicians’ performance was
expressed as Eq. (10). The quality of workdone constraints
is expressed as Eq. (11).
PKk¼1 aijktxijktPKk¼1 aijktxijkt
� �bj � �aj� �
1 � �aj� �
þ �aj 8ði; j; tÞ ð9Þ
PKk¼1 pijktxijktPKk¼1 pijktxijkt
� b_
j � a_
j
� �1 � a
_
j
� �þ a
_
j 8ði; j; tÞ ð10Þ
PKk¼1 qijktxijktPKk¼1 qijktxijkt
� ~bj � ~aj� �
1 � ~aj� �
þ ~aj 8ði; j; tÞ ð11Þ
where a_
j and b_
j are the minimum and maximum values of
technicians’ performance for maintenance task i from
technicians in section j at period t, respectively. �aj and �bjare the minimum and maximum values of technicians’
availability for maintenance task i from technicians in
section j at period t, respectively. ~aj and ~bj are the mini-
mum and maximum values of technicians’ quality of work
for maintenance task i from technicians in section j at
period t, respectively. �aj, a_
j and ~aj are the confident levels
for technicians’ availability, performance and quality of
workdone for maintenance task i expected from technicians
in section j.
We relaxed the expression for TOE as defined by
Ighravwe et al. (2015), to a stochastic constraint using the
concept of normal distribution (Wu 2008) as Eq. (12).PN
j¼1
PKk¼1 aijktxijktPN
j¼1
PKk¼1 aijktxijkt
�PN
j¼1
PKk¼1 pijktxijktPN
j¼1
PKk¼1 pijktxijkt
�PN
j¼1
PKk¼1 qijktxijktPN
j¼1
PKk¼1 qijktxijkt
� li þ U�1 1 � aið Þ ri 8ði; tÞ
ð12Þ
where li; ri and ai are the mean, standard deviation and
confident level for TOE expected for maintenance task
i from the technicians in a maintenance system,
respectively.
Beyond specifying the expected TOE of technicians,
there is the need for the cost implication consideration that
will be associated with scheduling a particular level of
technicians for each maintenance task at the different
planning periods. The expression of the cost for each
maintenance activity is considered (Eq. 13). The total cost
of technicians required for the maintenance activities at
each period is expressed as Eq. (14).
XN
j¼1
XK
K¼1
Cijktdijktxijkt � vit 8ði; tÞ ð13Þ
XM
i¼1
XN
j¼1
XK
K¼1
Cijktdijktxijkt � �vt 8ðtÞ ð14Þ
176 J Ind Eng Int (2016) 12:171–183
123

To further constraint the proposed model, the issue of
the expected reliability from each maintenance section is
considered. The reliability of each section in a maintenance
department is expressed as Eq. (15).
1 �YN
j¼1
YK
k¼1
1 � 1 � Rijk
� �xijkt� � !
� rit 8ði; tÞ ð15Þ
Solution methods
The handling of the multi-objective is carried out using the
weights of each of the objectives and deviational variables
for the objective functions (Wu 2008). The new objective
function is given as Eq. (16).
Fig. 1 Flow chart for the solution methods (Wong and Yuryevich 1997; Sakthivel and Mary 2013)
J Ind Eng Int (2016) 12:171–183 177
123

Minimisew1 dþ1 þ d�1� �
f1;max � f1þw2 dþ2 þ d�2� �
f2;max � f2ð16Þ
where f1,max and f2,max are the maximum values for the
technicians earned-value and reliability, respectively.
The summary of the proposed mixed-integer program-
ming model is presented as follows:
Minimisew1 dþ1 þ d�1� �
f1;max � f1þw2 dþ2 þ d�2� �
f2;max � f2
Subject to the following constraints:
f1 þ d�1 ¼ f1;max ð17Þ
f2 þ d�2 ¼ f2;max ð18Þ
Equations (3)–(15).
Non-negativity constraints
The flow chart for the evolutionary programming and big-
bang–big-crunch algorithms is depicted in Fig. 1. The
termination of each of these algorithms was taken as the
maximum epoch. EP algorithms are different from other
evolutionary algorithms (genetic algorithm, differential
evolution and genetic programming) because it does not
require crossover operation. The first EP algorithm was
proposed by Fogel (1962). The quest to improve the
mutation operation in EP algorithms has led to different
versions of the EP algorithms.
The potentials of EP and BB–BC algorithms in gen-
erating optimal solution for computational problems are
due to their stochastic-populate-based capacity. For the
EP algorithm, the mutation introduced randomness into a
current solution. In the BB–BC algorithm (Osman and
Eksin 2006), randomness to current solution is intro-
duced through the generation of centre of mass (big-
crunch) and the new variable (big-bang). In Fig. 1, zgij is
the value of solution i decision variable j at epoch g and
zgj the centre of mass for decision variable j at epoch g.
The variable zgj is the value of global solution variable j
in a current epoch. Some authors have considered zgj as
the centre of mass during the implementation of BB–BC
algorithm. The variable fgi is the quality of solution i at
epoch g. In the EP section, w1 is a uniform random
number which lies between (0, 1). This variable helps in
controlling the influence of the difference between cur-
rent global and local optimal solutions in a population at
a particular epoch g. The variable w2 in the BB–BC
algorithm is a random variable which lies at ±1, and #
is a constant parameter that helps in controlling the
search capacity of the BB–BC algorithm. The variables
zj;min and zj; are the minimum and maximum values of
decision variable j.
Model application
The proposed model and algorithms (BB–BC and EP) were
coded using C# programming language on a Windows 8
computer with installed memory (RAM) of 4.00 GB,
1.80 GHz processor and 64 bit operating system. To
demonstrate the applicability of the proposed model,
datasets from Ighravwe and Oke (2014) were used and
complemented with simulated data. The datasets that were
simulated are technician’s reliability, earned-value, quality
of workdone, availability and performance as well as the
amount of rework and overtime maintenance activities.
The amount planned maintenance work in Ighravwe and
Oke (2014) was increased by 20 %. This enables us to
generate upper bounds for the various planned maintenance
activities.
The minimum value for the amounts of overtime was
about 40 % of minimum planned maintenance workload.
We considered the amount of rework maintenance activi-
ties as 30 % of the amounts of minimum planned mainte-
nance workload. Table 1 shows the amount of planned,
rework and overtime maintenance activities for the system.
By observing the total amounts of workloads for the dif-
ferent sections, available maintenance time and
Table 1 Simulated maintenance time for the different maintenance
activities
Technician t = 1 t = 2 t = 3 t = 4
Planned maintenance (h)
x111t 3132.95 2950.99 3182.18 2889.25
x112t 2545.74 2490.33 2338.70 2371.24
x121t 1472.62 1395.36 1389.03 1358.50
x122t 1082.14 1060.97 1040.93 1152.72
x131t 581.39 629.68 579.78 627.42
x132t 592.05 574.70 533.63 545.71
Overtime maintenance (h)
x211t 1253.18 1180.40 1272.87 1155.70
x212t 1018.30 996.13 935.48 948.50
x221t 589.05 558.15 555.61 543.40
x222t 432.85 424.39 416.37 461.09
x231t 232.56 251.87 231.91 250.97
x232t 236.82 229.88 213.45 218.29
Rework maintenance (h)
x311t 939.89 885.30 954.65 866.78
x312t 763.72 747.10 701.61 711.37
x321t 441.79 418.61 416.71 407.55
x322t 324.64 318.29 312.28 345.82
x331t 174.42 188.91 173.94 188.23
x332t 177.62 172.41 160.09 163.71
178 J Ind Eng Int (2016) 12:171–183
123

technician’s categories, the bounds for the numbers of
technicians in the different maintenance sections were
estimated. The unit cost for overtime maintenance activi-
ties was about 110 % of unit cost of engaging them in
normal maintenance activities. The unit cost of rework
maintenance activities was about 30 % of the unit cost of
engaging them in normal maintenance activities.
The proposed model was solved using pre-emptive goal
programming approach. This enabled us to determine the
bounds for the objective functions. We considered the
technicians’ earned-valued goal as being a higher priority
than the technicians’ reliability goal. However, some
organisations may consider the technicians’ reliability goal
as being a higher priority than the technicians’ earned-
valued goal. To address priority determination, priority
scored performance measurement can be used (Tarokh and
Nazemi 2006). The minimum value of the expected relia-
bility of the total scheduled technicians was 85 %. During
the testing of the proposed model, the minimum accept-
able reliability of the technicians was 60 %. The maximum
acceptable reliability of the technicians was 95 %.
For the EP algorithm, the selection between parents and
off-springs was based on Boltzmann–Gibbs approach in
simulated annealing (Engelbrecht 2007). The total number
of epochs for the EP and BB–BC algorithms was 200. The
limiting parameter ðwÞ for the BB–BC algorithm was 0.2.
The Pareto solutions obtained for at the initial implemen-
tation of EP and BB–BC algorithms are in Table 2.
Based on the objective functions results in Table 2, the
differences between the upper and lower bounds for the
technicians’ earned-value objective are N54,264.00 and
N71,990.22 for the EP and BB–BC algorithms,
respectively. For the reliability objective, the differences
between the upper and lower bounds for the EP and BB–
BC algorithms are 0.1 and 0.3, respectively. Equal
importance was given to the objective functions (i.e.
w1 = 0.5 and w2 = 0.5). The values of the Pareto solutions
obtained for the objective functions are in Table 3.
From the values for the two objective functions obtained
from the two solution methods presented in Table 2, the dif-
ferences between the upper and lower bounds for the mainte-
nance technicians’ earned-value objective areN54,264.00 and
N71,990.22, for the EP and BB–BC algorithms, respec-
tively. For the reliability objective, the differences between
the upper and lower bounds for the EP and BB–BC algo-
rithms are 0.1 and 0.3, respectively. To obtain optimal
solution from the proposed model using the EP and BB–BC
algorithms, equal importance was assigned to maintenance
technicians earned-value and reliability objectives (i.e.
w1 = 0.5 and w2 = 0.5). By using Eq. (16) as objective
function for the proposed model and Eqs. (17) and (18) as
soft constraints, the values of the Pareto solutions obtained
for the two objective functions are presented in Table 3.
Based on the information in Table 3, the BB–BC algo-
rithm performed better than the EP algorithm. By using the
BB–BC algorithm as solution method for the proposed
model, the number of maintenance technicians required to
be scheduled to carry out the available maintenance work
are shown in Table 4. In addition, the breakdown of
maintenance time and reliability associated with each
scheduled technicians for the various maintenance activi-
ties are in Table 4.
Discussion of results
The total number of technicians required for routine
maintenance was 121 technicians, while 101 technicians
were required for overtime maintenance activities. Rework
maintenance activities required 84 technicians (Table 3).
For routine maintenance activities, the system required 66
mechanical technicians and 32 electrical technicians. A
total of 23 instrumentation technicians were required for
routine maintenance activities. During the scheduling of
technicians for overtime maintenance activities, the
required mechanical technicians were 50. A total of 19
instrumentation technicians were required for overtime
maintenance activities. The number of electrical techni-
cians required for overtime electrical maintenance activi-
ties was 32 technicians.
The number of instrumentation technicians required for
rework maintenance activities was the same as the number
of workers for overhaul maintenance (19 technicians). The
number of technicians for rework mechanical maintenance
Table 2 Results of each objective minimum and maximum bounds
solution method-wise
Priority EP algorithm BB–BC algorithm
Goal 1 (N) Goal 2 Goal 1 (N) Goal 2
Goal 1 1,539,809.6 0.98 1,368,011.02 0.97
Goal 2 1,485,545.60 0.97 1,296,020.80 0.94
Table 3 Optimal values for the objective functions
Objectives EP algorithm BB–BC
algorithm
Technicians’ earned-value (N) 1,435,598.40 1,415,878.40
Technicians’ reliability 0.96 0.98
Computation time (s) 1.4500 0.9246
J Ind Eng Int (2016) 12:171–183 179
123

was 41 technicians. The company’s electrical section
required about 24 technicians for rework maintenance
activities.
The importance of this information is that it will assist
maintenance managers in preparing logistics required to
carry out successful maintenance tasks. For instance, in si-
tuations where production facilities are not on the same
site, adequate arrangement for technician and spare parts
transportation logistics will be made (Yuceer 2013).
Another benefit of the above information is that business
owners will have the opportunity to know how much of
their working capital will be devoted to technicians’
expenses. For instance, the highest number of technicians
required for the routine and the overtime maintenance tasks
was at period 3. For the routine maintenance tasks, 31
technicians are required, while 26 technicians are required
to cover the available overtime maintenance tasks. The
highest number of technicians for rework maintenance
tasks was at periods 1 and 2.
To further simplify the above analysis, the pattern for
the average number of the different categories of techni-
cians is shown in Fig. 2. This provides an overview of the
Table 4 Optimal distribution of selected technicians’ variables for different maintenance activities
Technicians Technicians’ size Maintenance time Technicians’ reliability
t = 1 t = 2 t = 3 t = 4 t = 1 t = 2 t = 3 t = 4 t = 1 t = 2 t = 3 t = 4
Routine maintenance (h)
x111t 11 10 11 10 269 269 269 269 0.82 0.85 0.85 0.81
x112t 6 6 6 6 229 226 229 228 0.83 0.85 0.84 0.83
x121t 5 5 5 5 269 269 266 266 0.83 0.84 0.83 0.84
x122t 3 3 3 3 223 225 224 226 0.81 0.83 0.86 0.84
x131t 2 3 3 3 269 268 269 267 0.84 0.86 0.80 0.82
x132t 3 3 3 3 232 225 225 219 0.83 0.86 0.82 0.85
Overtime maintenance (h)
x211t 7 7 6 6 211 206 216 202 0.81 0.85 0.82 0.82
x212t 6 6 6 6 176 176 176 178 0.82 0.82 0.83 0.84
x221t 5 5 5 5 208 216 204 213 0.84 0.84 0.85 0.82
x222t 3 3 3 3 171 172 181 172 0.79 0.84 0.83 0.85
x231t 2 2 3 2 211 212 209 208 0.80 0.83 0.83 0.83
x232t 2 3 3 2 177 177 177 174 0.84 0.84 0.87 0.78
Rework maintenance (h)
x311t 6 6 5 5 178 179 179 178 0.84 0.84 0.84 0.84
x312t 5 5 4 5 177 173 174 179 0.83 0.83 0.82 0.81
x321t 3 3 3 3 177 179 178 173 0.83 0.82 0.82 0.80
x322t 3 3 3 3 176 176 177 174 0.84 0.83 0.84 0.84
x331t 2 3 3 2 178 179 177 179 0.82 0.83 0.85 0.82
x332t 3 2 2 2 173 175 174 175 0.83 0.80 0.79 0.83
Fig. 2 Average technicians’
size
180 J Ind Eng Int (2016) 12:171–183
123

trend of the required average number of the technicians for
the system.
The organisation will need about N107, 694,516 for the
technicians’ expense for four periods. The total amount of
funds required to cater for the technicians’ expenses at
period 1 was N8, 274,106, while a sum of N8, 212,776
was required at period 2. At period 3, N8, 322,675 was
required for technicians’ expenses. The technicians’
expense at period 4 was less than that of period 3 with
about 4 % (N335, 716). The company’s management can
decide to budget funds for each period or for all the peri-
ods. Since resources are scare, the decision markers will
prefer to plan for technicians’ expenses at each period.
Beyond the issue of cost management, how the allocated
time for maintenance activities (time management) will be
utilised is equal of importance to the decision markers. The
amounts of maintenance time for rework maintenance
activities are relative the same for the maintenance sections
(Fig. 3). There are differences in the amounts of mainte-
nance times for routine and overtime maintenance activi-
ties required for the maintenance sections (Fig. 3). The
combination of the different maintenance times will help in
analysing production line availability whenever there is
fluctuation in product demand. At period 1, the unavail-
ability of the production line was 3704 h, while the pro-
duction line was unavailable for 3702 h at period 2. The
amount of time of the production line unavailability for
period 3 was the same as that of period 2 (3704 h). Period 4
had the least production line unavailability (3680 h).
The question of how reliable the scheduled technicians
are when carrying out assignment based on the allocated
maintenance times is displayed in Table 3. By providing
answer to this question, the problem of how to manage a
maintenance system will be reduced to other areas such as
spare management and design of technicians’ motivational
schemes. A summary of the average technician’s reliability
for the different technician’s categories is in Table 4. The
average reliability expected from the technicians during
routine maintenance is relatively stable when compared
with the average reliability during rework activities
(Fig. 4).
Conclusions
This study has succeeded in proposing a multi-objective
technician’s scheduling model using mixed-integer pro-
gramming approach. The integer aspect of the proposed
model deals with the technicians’ size and time, while the
technicians’ reliability is considered as a real-value deci-
sion variable. We demonstrated how the proposed model
can be used in obtaining Pareto solutions for technicians’
earned-value and reliability. Also, the proposed model
results for different planning periods technicians size,
maintenance time and reliability for the different kinds of
Fig. 3 Average technicians’
time
Fig. 4 Average technicians’
reliability
J Ind Eng Int (2016) 12:171–183 181
123
maintenance task and technician’s categories are presented.
The computational results from EP and BB–BC algorithms
as solution methods are compared, and the suitability of
these algorithms has been shown from the results obtained.
It was observed that the BB–BC algorithm performed
better than the EP algorithm. The value of Pareto optimal
solution obtained using the BB–BC algorithm from is N1,
415,878.40 and 98 % for the total technicians earned-value
and reliability.
The main benefit of the proposed model is that it can be
used to select technicians’ matrix for the different kinds of
maintenance tasks in a system. Another benefit of the
model is that the information it generates can be used in
estimating the productivity of technicians assigned for the
different maintenance activities.
The contributions of this study are as follows: First, the
introduction of training, fatigue and experimental knowl-
edge in designing technicians’ schedule plan is presented.
Second, an integrated platform for determining the number
of technicians for routine, rework and overtime mainte-
nance tasks was contributed to technicians’ allocation lit-
erature. Third, the use of technicians’ earned-value in a
technician’s optimisation was added to literature. Lastly,
the application of BB–BC algorithm as a promising solu-
tion method for technician’s optimisation models has been
explored.
However, we acknowledge some limitations of the
proposed model. The proposed model lacks the capacity to
deal with the problem of technician’s transfers from one
section to another. Also, our model cannot be used to
address workers’ preferences for particular types of main-
tenance activities and the effects of technician’s absen-
teeism on work-plans.
The use of swarm algorithm in obtaining Pareto solution
when applying the proposed model can be investigated as a
further study. Also, the application of system dynamic
modelling approach in establishing the interrelations
among technicians’ variables (time, size and reliability)
and other maintenance parameters (spare parts) can be
investigated as a further study.
Open Access This article is distributed under the terms of the
Creative Commons Attribution 4.0 International License (http://crea
tivecommons.org/licenses/by/4.0/), which permits unrestricted use,
distribution, and reproduction in any medium, provided you give
appropriate credit to the original author(s) and the source, provide a
link to the Creative Commons license, and indicate if changes were
made.
References
Aghdaghi M, Jolai F (2008) A goal programming model for vehicle
routing problem with backhauls and soft time windows. J Ind
Eng Int 4(6):7–18
Alsyouf I (2007) The role of maintenance in improving companies’
productivity and profitability. Int J Prod Econ 105(1):70–78
Bartels S, Richey J (2008) Workforce management—impacting the
bottom-line, an oracle white paper. Oracle Corporation, Red-
wood Shores, CA, pp 1–10
De Bruecker P, Van den Bergh J, Belien J, Demeulemeester E (2015)
A model enhancement heuristic for building robust air craft
maintenance personnel rosters with stochastic constraints. Eur J
Oper Res 246:661–673
Engelbrecht AP (2007) Computational intelligence: an introduction.
Wiley, London
Fajardo VA, Drekic S (2015) Controlling the workload of M/G/1
queues via the q-policy. Eur J Oper Res 243:607–617
Fogel LJ (1962) Autonomous automata. Ind Res Mag 4(2):14–19
Gregoriades A, Sutcliffe A (2008) Workload prediction for improved
design and reliability of complex systems. Reliab Eng Syst Saf
93:530–549
He M, Hu Q, Wu X, Jing P (2014) A combination algorithm for
selecting functional logistics service vendors based on SQP and
BNB. J Chem Pharm Res 6(5):2013–2018
Hedjazi D (2015) Scheduling a maintenance activity under skills
constraints to minimise total weighted tardiness and late tasks.
Int J Ind Eng Comput 6:135–144
Hervet C, Chardy M (2012) Passive optical network design under
operations administration and maintenance considerations.
J Appl Oper Res 4(3):152–172
Ighravwe DE, Oke SA (2014) A non-zero integer non-linear
programming model for maintenance workforce sizing. Int J
Prod Econ 150:204–214
Ighravwe DE, Oke SA, Adebiyi KA (2015) Maintenance workload
optimisation with accident occurrence considerations and absen-
teeism from work using genetic algorithms. Int J Manag Sci Eng
Manag. doi:10.1080/17509653.2015.1065208
Jarugumill S (2011) Integrated workforce planning considering
regular and overtime decisions. In: Doolen T, Van Aken E
(eds) Proceedings of the 2011 industrial engineering research
conference
Kaufman DL, Lewis ME (2007) Machine maintenance with workload
considerations. Naval Res Logist 54(7):750–766
Knapp GM, Mahajan M (1998) Optimisation of maintenance
organisation and manpower in process industries. J Qual Maint
Eng 4(3):168–183
Lai Y-C, Fan D-C, Huang K-W (2015) Optimising rolling stock
assignment and maintenance plan for passenger railway opera-
tions. Comput Ind Eng 85:284–295
Mansour MAA-F (2011) Solving the periodic maintenance schedul-
ing problem via genetic algorithm to balance workforce levels
and maintenance cost. Ame J Eng Appl Sci 4(2):223–234
Manzini R, Accorsi R, Cennerazzo T, Ferrari E, Maranesi F (2015)
The scheduling of maintenance. A resource-constraints mixed
integer linear programming model. Comput Ind Eng 87:561–568
Mjema EAM (2002) An analysis of personnel capacity requirement in
maintenance department by using simulation method. J Qual
Maint Eng 8(3):253–273
Oladokun VO, Charles-Owaba OE, Nwaouzru CS (2006) An
application of artificial neural network to maintenance manage-
ment. J Ind Eng Int 2(3):19–26
Osman KE, Eksin I (2006) New optimisation method: big-bang big-
crunch. Adv Eng Softw 37:106–111
Rana RS, Purohit R (2012) Balancing of maintenance task during
maintenance of four wheeler. Int J Eng Res Appl 2(3):496–504
Safaei N, Banjevic D, Jardine AKS (2008) Multi-objective simulated
annealing for a maintenance workforce scheduling problem: a
case study. In: Tan CM (ed) Simulated annealing. I-Tech
Education and Publishing, Vienna, pp 27–48
182 J Ind Eng Int (2016) 12:171–183
123

Sakthivel S, Mary D (2013) Big bang-big crunch algorithm for
voltage stability limits improvement by coordinated control of
svc settings. Res J Appl Sci Eng Technol 6(7):1209–1217
Shiftan Y, Wilson NHM (1994) Absence, overtime, and reliability
relationships in transit workforce planning. Transp Res Part A:
Policy and Pract 28(3):245–258
Tarokh MJ, Nazemi E (2006) Performance measurement in industrial
organisations case study: Zarbal Complex. J Ind Eng Int
2(3):54–69
Tohidi H, Tarokh MJ (2005) Team size effect on teamwork
productivity using information technology. J Ind Eng Int
1(1):37–42
Wong KP, Yuryevich PD (1997) Evolutionary programming-based
algorithms for environmentally-constrained economic dispatch.
IEEE Trans Power Syst 13(2):301–316
Wu Z (2008) Hybrid multi-objective optimisation models for
managing pavement assets. Ph.D. Thesis, Virginia Polytechnic
Institute and State University
Yuceer U (2013) An employee transporting problem. J Ind Eng Int
9:3
J Ind Eng Int (2016) 12:171–183 183
123