Embed Size (px)
Citation preview
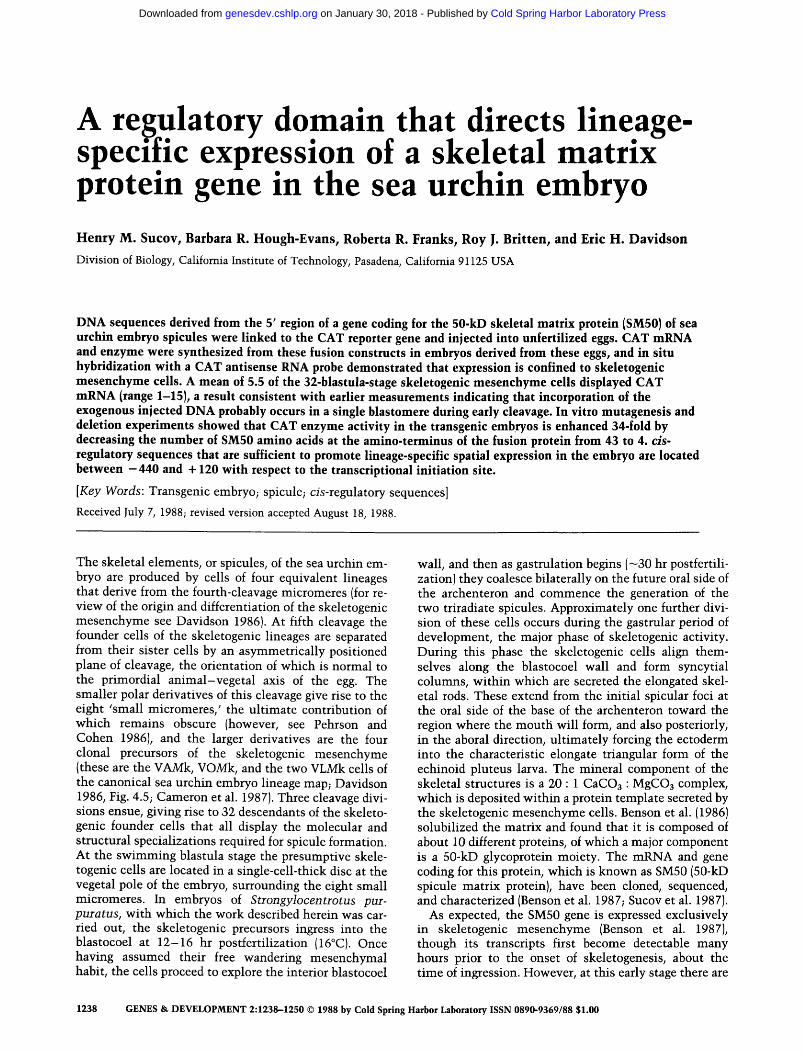
A regulatory domain that directs lineage- specific expression of a skeletal matrix protein gene in the sea urchin embryo Henry M. Sucov, Barbara R. Hough-Evans, Roberta R. Franks, Roy J. Britten, and Eric H. Davidson
Division of Biology, California Institute of Technology, Pasadena, Califomia 91125 USA
DNA sequences derived from the 5' region of a gene coding for the 50-kD skeletal matrix protein (SM50) of sea urchin embryo spicules were linked to the CAT reporter gene and injected into unfertilized eggs. CAT mRNA and enzyme were synthesized from these fusion constructs in embryos derived from these eggs, and in situ hybridization with a CAT antisense RNA probe demonstrated that expression is confined to skeletogenic mesenchyme cells. A mean of 5.5 of the 32-blastula-stage skeletogenic mesenchyme cells displayed CAT mRNA (range 1-15), a result consistent with earlier measurements indicating that incorporation of the exogenous injected DNA probably occurs in a single blastomere during early cleavage. In vitro mutagenesis and deletion experiments showed that CAT enzyme activity in the transgenic embryos is enhanced 34-fold by decreasing the number of SM50 amino acids at the amino-terminus of the fusion protein from 43 to 4. cis- regulatory sequences that are sufficient to promote lineage-specific spatial expression in the embryo are located between - 4 4 0 and + 120 with respect to the transcriptional initiation site.
[Key Words: Transgenic embryo; spicule; cis-regnlatory sequences]
Received July 7, 1988; revised version accepted August 18, 1988.
The skeletal elements, or spicules, of the sea urchin em- bryo are produced by cells of four equivalent lineages that derive from the fourth-cleavage micromeres (for re- view of the origin and differentiation of the skeletogenic mesenchyme see Davidson 1986). At fifth cleavage the founder cells of the skeletogenic lineages are separated from their sister cells by an asymmetrically positioned plane of cleavage, the orientation of which is normal to the primordial animal-vegetal axis of the egg. The smaller polar derivatives of this cleavage give rise to the eight 'small micromeres,' the ultimate contribution of which remains obscure (however, see Pehrson and Cohen 1986), and the larger derivatives are the four clonal precursors of the skeletogenic mesenchyme (these are the VAMk, VOMk, and the two VLMk cells of the canonical sea urchin embryo lineage map; Davidson 1986, Fig. 4.5; Cameron et al. 1987). Three cleavage divi- sions ensue, giving rise to 32 descendants of the skeleto- genic founder cells that all display the molecular and structural specializations required for spicule formation. At the swimming blastula stage the presumptive skele- togenic cells are located in a single-cell-thick disc at the vegetal pole of the embryo, surrounding the eight small micromeres. In embryos of Strongylocentrotus pur- puratus, with which the work described herein was car- ried out, the skeletogenic precursors ingress into the blastocoel at 12-16 hr postfertilization (16°C). Once having assumed their free wandering mesenchymal habit, the cells proceed to explore the interior blastocoel
wall, and then as gastrulation begins ( -30 hr postfertili- zation) they coalesce bilaterally on the future oral side of the archenteron and commence the generation of the two triradiate spicules. Approximately one further divi- sion of these cells occurs during the gastrular period of development, the major phase of skeletogenic activity. During this phase the skeletogenic cells align them- selves along the blastocoel wall and form syncytial columns, within which are secreted the elongated skel- etal rods. These extend from the initial spicular foci at the oral side of the base of the archenteron toward the region where the mouth will form, and also posteriorly, in the aboral direction, ultimately forcing the ectoderm into the characteristic elongate triangular form of the echinoid pluteus larva. The mineral component of the skeletal structures is a 20 : 1 CaCOa : MgCO3 complex, which is deposited within a protein template secreted by the skeletogenic mesenchyme cells. Benson et al. (1986) solubilized the matrix and found that it is composed of about 10 different proteins, of which a major component is a 50-kD glycoprotein moiety. The mRNA and gene coding for this protein, which is known as SMS0 {50-kD spicule matrix protein), have been cloned, sequenced, and characterized (Benson et al. 1987; Sucov et al. 1987).
As expected, the SM50 gene is expressed exclusively in skeletogenic mesenchyme (Benson et al. 1987), though its transcripts first become detectable many hours prior to the onset of skeletogenesis, about the time of ingression. However, at this early stage there are
1238 GENES & DEVELOPMENT 2:1238-1250 © 1988 by Cold Spring Harbor Laboratory ISSN 0890-9369/88 $1.00
Cold Spring Harbor Laboratory Press on January 30, 2018 - Published by genesdev.cshlp.orgDownloaded from

Expression of a sea urchin skeletogenic transgene
~10 SMS0 mRNA molecules per skeletogenic mesen- chyme cell, while in postgastrular stages, when these cells are executing their climax skeletogenic function, the prevalence of SM50 message approaches 200 mole- cules per cell (Killian and Wilt 1988). The SM50 gene can be regarded as a cardinal molecular marker for the specific and particular process of differentiation under- gone by the skeletogenic mesenchyme lineages. It is likely a member of a battery of similarly regulated genes, including those genes coding for the other spicule ma- trix proteins; a gene coding for a mesenchyme cell-sur- face glycoprotein known as mspl30, which may be re- quired for normal migration and/or for Ca 2+ uptake (Carson et al. 1985; Wessel and McClay 1985; Anstrom et al. 1987; Leaf et al. 1987); and genes coding for several unidentified mesenchyme-specific mRNAs and proteins (Harkey and Whiteley 1983; Harkey 1985; Harkey et al. 1988).
The differentiation of skeletogenic mesenchyme is from the beginning an autonomous process. Thus, in culture, isolated fourth-cleavage micromeres display a succession of activities that correspond to the phases of their normal development in situ. They divide several times, acquire motility, and display the changes in adhe- sive properties expected from their behavior in the em- bryo. They then carry out skeletogenesis in vitro with good efficiency, though they tend to produce straight rather than brachiated skeletal rods (Okazaki 1975; Harkey and Whiteley 1980, 1983; McCarthy and Spiegel 1983; Carson et al. 1985). Many changes in the synthesis of specific proteins that are correlated with the differen- tiation of these ceils also take place in vitro in cultures originated with micromeres (Harkey and Whiteley 1983; Pit tman and Ernst 1984). Most significantly for our present purpose, expression of the SM50 gene occurs au- tonomously in cultures of dissociated micromeres, and it has been shown rigorously by Stephens et al. (1988) that SM50 expression requires no intercellular contact. Thus, blastomeres isolated at second cleavage, i.e., prior to micromere formation, and maintained in culture under conditions in which no contact of the mitotic progeny is permitted, begin to produce SM50 mRNA on schedule. SM50 transcripts accumulate in these single cell cultures in an appropriate number of cells, and to within 50% of the normal level of expression in vivo. It follows that the pattern of expression of this lineage-spe- cific gene depends entirely on factors inherited spatially in the course of the geometrically predetermined se- quence of cleavages by which the founder cells are segre- gated. The lack of requirement for intercellular induc- tive interaction for differentiation of the skeletogenic mesenchyme is unusual among known sea urchin em- bryo lineages, most of which require specific interac- tions for their normal fates to be realized (see Discussion for references). The micromeres themselves derive from an element of egg cytoplasm which is defined by its polar location with respect to the primordially organized animal-vegetal axis of the egg. A reasonable interpreta- tion is that spatial regulation of genes such as SM50 that are expressed exclusively in the skeletogenic lineage
occurs by cis-trans interactions of localized maternal factors with regulatory regions of that gene, or of other genes which produce factors that have this function (Da- vidson and Britten 1971). In this paper we report initial steps toward the requisite experimental analysis. We have made use of a gene transfer system (Flytzanis et al. 1985; McMahon et al. 1985; Hough-Evans et al. 1987, 1988) to demonstrate correct spatial regulation of a fu- sion construct driven by the regulatory domain of the SM50 gene. These experiments show that sequences in- cluded within 440 nucleotides of the transcription initi- ation site suffice to promote active expression that is confined to the skeletogenic mesenchyme cells.
Results
A fusion gene under control of SM50 regulatory sequences is expressed specifically in skeletogenic mesenchyme cells
The organization of the SM50 gene and of several con- structs used in these experiments, in which the CAT re- porter gene was fused to various 5' regions of the SM50 gene sequence, is displayed schematically in Figure 1, a and b. The body of the SM50 gene consists of two exons, 213 and 1682 nucleotides long, respectively, separated by a 7.1-kb intron. Translation begins within the first exon at position + 110 with respect to the transcription initiation site. The first 15 of the 34 amino acids en- coded by the initial exon apparently specify a signal pep- tide, and the splice site divides the 35th codon. An ini- tial series of studies was carried out with the construct designated SM50. CAT in Figure lb. This construct contains 2.2 kb of 5'-flanking sequence from the SM50 gene, plus the entire first exon and intron, fused just within the second exon to the coding region of the vector pSVOCAT (Gorman et al. 1982), so as to maintain a continuous open reading frame. As shown in Figure 1 c the predicted fusion protein is expected to contain 43 amino acids derived from the SMS0 gene (including the 15-amino-acid signal peptide), 14 amino acids from the vector sequence preceding the CAT coding region, and then the 231 residues of the CAT enzyme protein.
The SM50 • CAT fusion was linearized at the unique BamHI site, and microinjected into unfertilized S. pur- puratus eggs. The embryos were harvested 48-50 hr after fertilization, at the early pluteus stage, for CAT en- zyme assay. At this stage the skeletal rods are length- ening rapidly and the endogenous SM50 RNA is present at maximum level (Benson et al. 1987; Killian and Wilt 1988). Table 1 demonstrates that CAT enzyme activity in the transgenic embryos was present at two to three times the background level of the assay, measured in uninjected control embryos. The absolute level of CAT activity measured in these experiments is, of course, an arbitrary function of the number of embryos pooled for each sample, which was set at a relatively low level (25-40/sample) so as to minimize the number of in- jected embryos required. However, CAT activity would be expected to be low on a per embryo basis if the con-
GENES & DEVELOPMENT 1239
Cold Spring Harbor Laboratory Press on January 30, 2018 - Published by genesdev.cshlp.orgDownloaded from

Sucov et al.
a)
R Bg I I
B¢.
b) S R BQ
S M S O - C A T ' ' ' - ms
S R B g S | i .,m.-. S M 5 O A - C A T ,
s R B g S B 2.2 - C A T ' ' ' ='/////////~
Sp/S R Bg S B 2.2 P L - C A T ' ' ' ~///////////l
S B ~/////////.J
S B ~,//////////l
I I 1 Kb
c) 5'UT.--~CA~CCATGAACCCA~TTTTGTTTATTGTGGCTAGTCTTATACCCTTTGCTACGGGTCAA~ACT~CCCAGcATACTAC~TCCCCAGTCAATCCGGTCAATCATCTTACAGgt.~.intr~n
MetL~sG1yVa~LeuPheI1eVa~A~a~erLeuI1e~aPheA~aThrG~y~nAsp~y~Pr~aT~rTyrVa~Arg~er~tnserC~G~n~erC~sTyrAr 1 2 3 4 5 6 7 8 9 10 11 12 13 14 15 16 17 18 19 20 21 22 23 24 25 26 27 28 29 30 31 32 33 34
• l SMSO exon I
SalI
in t r~n~gATACTTCAACATGCGC~TTCCCTG~GTCGAC~GCTT~C~A~ATTTTCAGGAGCTAAGGAAGCTAA~-~..~CAT coding region gTyrPheAsnMetArgVaIProTrpSerThrSerLeuA1nArgPheSerGlyA1aLysG[uAlaLy~e.~J
_~5 36 37 38 39 40 41 42 4~44_ 4s 46 47 4a 49 50 51 52 53 54 55 56 _~7 5a SM50 exon I I pSVO.CAT vec tor
d)
TT GA TC TG
• • -GAGAAGCAGCCATGAAGGGAGT T TCCGCACTCAATCCGGTCAATCATGTTACAGEt... intron 5 J UT
GCAGCCATGAAGGGAGTCGACCGCAGTCAATC CGGTC
SalI
Me tLysGl yVal As pArg Se rG In Se rG lyGl nS er Cy sTyrAr
1 2 3 4 5/ 25 26 27 28 29 30 31 32 33 34 (35)
Figure 1. Structure of SM50 gene and of CAT gene fusions. (a) Organization of the SMS0 gene. Exons of the SM50 gene are depicted as solid rectangles. The genomic clone from which the CAT constructs were derived is shown above (see Materials and methods). Restriction sites: (Bg) BgllI; (K) KpnI; (R) EcoRV~ (S) Sail. (b) SM50. CAT constructs. Regions derived from exons of the SM50 gene are depicted as filled rectangles; flanking and intron sequences as thin lines. The CAT coding region and SV40 polyadenylation region derived from pSV40CAT are depicted as a striped box. The vector and nonessential SV40 sequences appended to the 5' end of each construct are not shown. (B} BamHI; (Sp} SphI. The scale in a and b is the same. (c) Amino-terminal sequence of the expected fusion protein, and nucleotide sequence of the junction region of SM50. CAT. The protein coding region derived from the first exon of the SM50 gene is shown at the top. Below is shown the junction between sequences of the second SM50 exon and the CAT vector, which were ligated together at the indicated Sail site. The boxed ATG codon (codon 58} is the original translation initiation codon of the bacterial CAT protein. The first 43 amino acids of the open reading frame of the construct derive from SM50, and residues 44-57 are from translation of vector sequences preceding the beginning of the CAT coding region. Numbering begins with the SMS0 initiation codon. {d I Oligonucleotide-directed mutagenesis and deletion of the sequence coding for the signal peptide. The coding strand of the first exon is shown on the top line of sequence. Below is the 37-nucleotide oligomer used for mutagenesis. The location of the introduced Sail restriction site and the translation product of the resultant open reading frame are shown.
1240 GENES & DEVELOPMENT
Cold Spring Harbor Laboratory Press on January 30, 2018 - Published by genesdev.cshlp.orgDownloaded from

Expression of a sea urchin skeletogenic transgene
Table 1. CAT enzyme activity in transgenic S. purpuratus embryos bearing various SM50. CAT fusion constructs
Experiment 1 Experiment 2 Experiment 3 percent units percent units percent units
Construct acetylation CAT/embryo acetylation CAT/embryo acetylation CAT/embryo
SM50-CAT 0.13 3.6 x 10 -7 0.24 3.0 x 10 -7 0.14 1.3 × 10 - 7
SM50A- CAT 0.24 1.0 x 10 -6 2.2. CAT 1.20 9.5 x 10 -6 1.81 3.3 x 10 -6 0.98 1.7 x 10 -6 Uninjected controls 0.07 -- 0.08 -- 0.08 - -
In experiment 1 each value represents the average of two samples (SM50. CAT, 2.2. CAT, uninjected controls) or three samples (SM50A • CAT), each sample containing 25-45 injected embryos. In experiments 2 and 3 each value represents one sample of 46 injected embryos.
struct is expressed only in skeletogenic mesenchyme cells, as these constitute only - 6 % of total cells in the pluteus-stage embryo.
To determine what cell types in the transgenic em- bryos express the SM50. CAT fusion gene, we carried out in situ hybridization using a CAT antisense [3H]- RNA probe (Hough-Evans et al. 1987, 1988). For this ex- periment the embryos were harvested at the early mes- enchyme blastula stage, when skeletogenic mesen- chyme cells are the sole occupants of the blastocoel, and are hence easy to identify. The embryo at this stage con- sists of approximately 500 cells, of which about 400 are ectodermal, 60 comprise the vegetal plate from which will later derive secondary mesenchyme, gut, muscle, and the larval rudiment, and 32 are cells belonging to the skeletogenic mesenchyme lineages (Davidson 1986, Fig. 4.5). Complete or nearly complete series of sections of 77 embryos derived from eggs that had been injected with SMS0. CAT and retained good morphology were examined, and of these 61 showed autoradiographic signal. For the purposes of these experiments, a positive signal was one in which five or more grains were clus- tered over any given cell. This level of signal is easily visualized over background, which on the average was less than 0.4 grains/cell, as observed over uninjected control embryo sections. With the exception of four questionable cases, labeling was clearly confined to ske- letogenic mesenchyme cells already in the blastocoel, or to the polar region of the thickened vegetal wall from which the presumptive skeletogenic mesenchyme cells ingress. Representative examples of these in situ hybrid- izations are reproduced in Figure 2. Expression over cells of the polar ectoderm wall was expected, as the endoge- nous SM50 gene is active prior to ingression of the ske- letogenic mesenchyme, as early as the 120-cell stage (Benson et al. 1987; Killian and Wilt 1988), and the em- bryos were collected while some were in the process of ingression. Of the 61 embryos which contained CAT mRNA, 30 displayed label only in the primary mesen- chyrne, 10 only in the polar vegetal region of the ecto- derm, and 21 in both. The four embryos that showed some low level labeling over cells that were possibly not of the correct lineage included two in which labeling was marginally above background over a single cell at what appeared to be the lateral side of the vegetal plate; a third in which what appeared to be a single animal pole ectodermal cell was labeled; and one embryo in
which three cells were labeled, one each in three adja- cent sections, at the lateral side of the vegetal plate and at the animal pole. The significance of these cases is doubtful, since occasional uninjected control embryo sections contained adventitious grain clusters that could have been counted as positive labeling over individual cells, and in addition it is possible to misidentify mesen- chyme cells if they have applied themselves closely to the ectoderm wall or have been crushed against it in the course of sectioning. These examples notwithstanding, the results of the in situ hybridization experiments dem- onstrate clearly that the SM50 sequence included in SM50. CAT suffices to promote expression specifically in the skeletogenic mesenchyme lineages.
Mosaic expression of the exogenous fusion gene
DNA microinjected into unfertilized sea urchin egg cy- toplasm is ligated rapidly into a concatenated form prior to first cleavage (McMahon et al. 1985). The DNA then enters the nuclear compartment, and in most embryos is stably incorporated into at least one blastomere during the first several cleavages (Hough-Evans et al. 1988). In- corporation appears to occur randomly with respect to cell lineage. Thereafter the exogenous sequences are be- queathed to all the progeny of the blastomere in which the incorporation event occurred, and it replicates at about the same rate as does the DNA of its host cell lineage (Franks et al. 1988; Hough-Evans et al. 1988). The mosaic incorporation pattern is ultimately manifest in a mosaic pattern of expression, the fraction of cells within a given tissue that express the transgene de- pending upon the timing and location of the initial inte- gration event.
In the 77 embryos examined by in situ hybridization in the experiment just described, the median number of ingressed skeletogenic mesenchyme cells clearly identi- fied in the sections was 19. This value ranged from zero to 52, the latter probably representing embryos that had completed ingression, in which many mesenchyme cells had been sectioned and were represented in successive sections. In the following analysis, only ingressed mes- enchyme cells were considered, as their progenitors are difficult to distinguish while they are still resident within the vegetal ectodermal wall. Mesenchyme cells within the blastocoel could in most cases be distin- guished easily. Eleven embryos that retained five or less
GENES & DEVELOPMENT 1241
Cold Spring Harbor Laboratory Press on January 30, 2018 - Published by genesdev.cshlp.orgDownloaded from

Sucov et al.
Figure 2. In situ hybridizations of embryos expressing SM50. CAT. Sections of six different embryos at mesenchyme blastula stage are shown. The sections are oriented so that the vegetal pole is at bottom. The embryo in b was distorted during sectioning~ its vegetal pole is at bottom right. The number of labeled mesenchyme ceils, and the number of mesenchyme cells present in each panel is: {a) 5 of 6, {b} 4 of 13, {c} 3 of 5, {d) 5 of 9, {el 3 of 14, and If) 1 of 9. The single labeled cell in the section shown in f was the only labeled mesenchyme cell Iof a total of 43} labeled in this embryo. Labeling at the vegetal pole is seen (slightly out of focusl in the embryo section of c.
ingressed mesenchyme cells were excluded from the analysis. The remaining 66 embryos were examined in- dividually to determine the fraction of ingressed mesen- chyme cells that displayed label on hybridization with the CAT antisense [3HIRNA probe. Results are pre- sented in Figure 3a, where, for ease of comparison, data for all embryos are normalized to 32 cells. Seventeen of the 66 embryos did not show label in any of their mesen- chyme cells, either because they had integrated the ex- ogenous DNA exclusively into nonskeletogenic lineages or had failed to incorporate it at all. Generally only a few mesenchyme cells were labeled in each embryo, al- though in some a significant fraction displayed autora- diographic grains. For labeled embryos the mean fraction of labeled mesenchyme cells was 5.5/32, or 17.2%. These numbers could be underestimated, as we do not know whether all the cells that expressed the transgene displayed significant autoradiographic label at the expo- sure used. Reference to the lineage from which the ske- letogenic mesenchyme derives shows that incorporation of the DNA into a single ancestral blastomere of this lineage from the 4-cell to the 32-cell stage would result in labeling of 25 % of the mesenchyme cells, while inte- gration into a single blastomere of this lineage at the 64- cell stage would result in 12.5% of the mesenchyme cells labeled. In the inset in Figure 3a the same data are classed in such a way that each bar represents embryos
in which the DNA could have entered the skeletogenic mesenchyme lineage at a given cleavage, e.g., for the class labeled 6.3%, or 2/32 cells labeled, the implication would be that the DNA was incorporated at the seventh cleavage~ for the class labeled 12.5%, or 4/32, at the sixth cleavage~ and for the class labeled 25%, at any time between the second and fifth cleavages. However, a fur- ther labeled restriction is imposed by the high fraction of embryos displaying some label in mesenchyme cells, i.e., 49/66. A single random incorporation event any- where in the embryo after the horizontal third cleavage would result in no more than 50% embryos with any labeled mesenchyme cells, since only the lower four cells of the eight-cell embryo contribute to the skeleto- genic mesenchyme. In addition, three embryos fall in the class labeled 50%, probably indicating incorporation at the two-cell stage. Thus, it is unlikely that the large 25% class in the inset in Figure 3a is due to incorpora- tion as late as the fifth cleavage. We may conclude that incorporation occurred in about two-thirds of the em- bryos {i.e., those falling in the classes labeled 12.5% and 25%1 sometime between the second cleavage and sixth cleavage, with a few earlier and some later incorpora- tions as well.
A similar analysis was carried out with embryos de- rived from eggs injected with a slightly different con- struct which displays the same spatial expression pat-
1242 GENES & DEVELOPMENT
Cold Spring Harbor Laboratory Press on January 30, 2018 - Published by genesdev.cshlp.orgDownloaded from

Expression of a sea urchin skeletogenic transgene
¢0
~017 c- G) 16
L
.D E Z
a)
3.12% 16.25% I
2O
.6~ 16
z ~ 4
o
% of 32
It I Norm.,,z.d t.rtTtT1. T TT tilt :l ,T T,Tt, T t NumberLabeledOf ~t ~ 6 ~ 8 § 1'0 11 1~ 1'3 1~4 1"5 Mesanchyme
I , ... Cells 12.5% 25% 50%
20 19 18
o 5 Normalized Number of Labeled Mesenchyme
,TTIT T T I TTT T iT ~T 4 t Ce .s
Figure 3. Mosaic expression of SM50-CAT constructs in mesenchyme cells labeled by in situ hybridization. The fraction of labeled mes- enchyme cells in 66 embryos grown from eggs injected with SM50-CAT (a) or 35 embryos grown from eggs injected with 2.2PL • CAT (b) is shown. The fraction of labeled cells for each em- bryo was normalized to 32 cells, rounded to the nearest 0.2. Of the labeled embryos, the mean normalized number of labeled cells is 5.5 (a) and 6.4 (b) (arrows). Below the horizontal axis of a is shown the boundaries that were used to group the embryos into mosaicism classes as shown in the inset. The model used to group the embryos assumes that all of the injected CAT DNA is stably integrated into a single cell during early cleavage (see Hough-Evans et al. 1988) and de- tectably expressed in all the progeny which be- come primary mesenchyme. The theoretical number of labeled cells can be described by the function 2 -n, where n = 1 for an integration event at the two-cell stage; n = 2 for the 4- through 32-cell stage; and n = 3, 4, 5 for the 64-, 120-, and 240-cell stages. The range used to group the experimental data of a for the inset was 2 -n(-+°-sl.
tern as SM50. CAT (viz. the BglII-BamHI fragment of 2.2PL • CAT; see Fig. 1 and below). Thirty-five of 37 em- bryos in this experiment displayed six or more ingressed mesenchyme cells, and the mean number of mesen- chyme cells per embryo was 16. The distr ibution of la- beled mesenchyme cells in this sample is shown in Figure 3b. This distr ibution is obviously almost the same as that of Figure 3a (the mean of Fig. 3b is 6.4/32 cells vs. 5.5/32 cells for Fig. 3a). A detailed analysis of incorporation frequency of D N A injected into S. pur- puratus egg cytoplasm was recently carried out by Hough-Evans et al. (1988), in which a different construct was used, and the fraction of all embryo cells bearing the exogenous D N A was determined directly by DNA in situ hybridization. This study indicated that in about three-fourths of the embryos the exogenous D N A could have been incorporated in a single second-, third-, or fourth-cleavage blastomere. While incorporation into the skeletogenic mesenchyme lineage certainly occurs during these same stages, the largest class of labeled em- bryos in this study is that in which incorporation appar- ent ly occurred at the sixth cleavage. Thus, micromeres and their descendants may be slightly more refractory to incorporation than is the remainder of the embryo, or, because they individual ly include severalfold less cyto- p lasmic volume than do the meso- or macromeres (Ernst et al. 1980), they may s imply have a smaller chance of inher i t ing the exogenous D N A concatenate.
Deletion of SM50 amino acid sequence from the fusion gene product
As shown in Figure l c the fusion product of the SM50. CAT construct contains 43 amino acids derived
from the amino- terminus of the SM50 protein, including the putat ive signal peptide. As described in the fol- lowing section, we measured the amount of CAT m R N A generated in embryos bearing the SM50. CAT fusion, and comparison wi th earlier studies carried out wi th a different CAT fusion (Flytzanis et al. 1987) indi- cated that the level of enzyme activity measured in the present experiments was over 10-fold lower than would be expected from the level of transcript observed. A pos- sible explanation was that the signal peptide might lead to secretion into the endoplasmic reticulum, and/or modif icat ion and loss of the CAT enzyme activity. The sequence coding for the signal peptide was thus deleted by oligonucleotide-directed mutagenesis, as indicated in Figure ld and Materials and methods. The fusion protein coded by the deletion SM50A. CAT now includes only 23 SM50 amino acids. However, as shown in Table 1, SM50A" CAT produces only about twofold more CAT enzyme activi ty than does the parental construct. Thus, there is no evidence that the intracellular trafficking presumably mediated by the signal peptide significantly affects extractable CAT enzyme activity.
The SM50A. CAT construct contains a new SalI re- striction site at the point of the deletion, as shown in Figure ld. This site was fused in frame to the SalI site immedia te ly preceding the CAT coding sequence, to produce a third construct, called 2.2. CAT (Fig. lb). This includes the same upstream SM50 gene sequences as does SM50-CAT, but codes for only four amino-ter- mina l SM50 amino acid residues. The remainder of the first exon, the large intron, and the fragment of the second exon included in the other constructs so far con- sidered have been removed. A three-way comparison of
GENES & DEVELOPMENT 1243
Cold Spring Harbor Laboratory Press on January 30, 2018 - Published by genesdev.cshlp.orgDownloaded from

Sucov et al.
the constructs indicates that 2.2. CAT generates 25-fold greater CAT activi ty per average embryo than does SM50. CAT {Table 1, experiment 1). In other experi- ments , 2.2. CAT produced 11-fold and 13-fold greater act ivi ty than did SM50. CAT {Table 1, experiments 2 and 3). As shown below, the SM50 regulatory sequences required for proper spatial regulation are retained in 2.2. CAT, and therefore the m u c h higher level of CAT activi ty displayed by this construct is not a result of ec- topic expression of the transgene in additional cell types of the embryo.
On the evidence thus far, this enhanced CAT enzyme activi ty could result either from removal of an intra- genic site of transcriptional repression located wi th in the intron or exon sequences deleted wi th the Sa/I frag- men t in the construction of 2.2 • CAT, or from removal of an amino- terminal protein sequence that in some way interferes wi th CAT enzyme funct ion or accumulation. We show in the following that the latter is the correct explanation.
Probe excess titration of CAT m R N A in transgenic embryos
The amount of CAT m R N A generated in early pluteus- stage embryos bearing S M 5 0 - C A T or 2 . 2 - C A T was
measured by single-strand probe excess titration, to assay directly the transcriptional productivity of these constructs. Two experiments were carried out in which u_n_fertilized eggs were injected wi th SM50. CAT and 2.2. CAT, and samples were taken at 50 hr postfertiliza- t ion for measurement of CAT enzyme activity, CAT D N A content, and CAT m R N A content. The CAT assays from these samples are those already discussed (experiments 2 and 3, Table 1 I. A measurement of CAT D N A content in the embryos of experiment 2 is shown in Figure 4a, obtained by slot blot hybridizat ion of D N A extracted from transgenic embryos, to a probe consisting of the sense strand of the CAT m R N A sequence. In this exper iment the average embryo in the sample injected wi th SM50. CAT contained 8 x 10⁴ molecules of the exogenous construct, and the corresponding average value for the 2.2. CAT sample was 1.8 x 10⁴ exogenous D N A molecules per embryo. The difference may have been due to inadvertent introduction of more SM50. CAT D N A during injection. Previous studies have shown that for a given batch of eggs the amount of D N A retained and replicated during development de- pends ma in ly on the amount injected and not at all on the sequence, providing that the injected molecules are > 1 - 2 kb long (McMahon et al. 1985; Flytzanis et al. 1987; Livant et al. 19881.
a) b) c)
2 2 0 0 -- ' I ' I ' I ' I ' 3 6 0 0 I I
2 0 0 0 -- 3 2 0 0 - -
1
1 8 0 0 ~e 2 2800
~ 3 E 1 6 0 0 E ~" ~. CL 2 4 0 0
* 0 1 4 0 0 0 4 ... m- 5 ~ 12oo- o ~ 2000 . 1ooo 16oo
o • 8 0 0 - _ 7 r r 1 2 0 0
~ 8 6 0 0 i ° 8 0 0 9 4 0 0 . . . .
2 0 0 4 0 0 - -
0 0 J I I I I I I I I 0 0 . 4 0 . 8 1.2 1.6 0 3 . 5 7 .0 1 0 . 5 1 4 . 0
Input Mass (/¢g) Input Mass (p.g) Figure 4. Titration of fusion gene transcripts. (a) Quantitation of CAT DNA in experimental embryos. DNA was extracted from 612 carrier embryos plus 30 experimental embryos grown 50 hr {early pluteusl from eggs injected with SMS0. CAT or 2.2. CAT. The yield of DNA, determined by DAPI fluorescence measurement, was 1.5 g.g [approximately complete] for each experimental sample. Next, 1.25 ~g of DNA from the SMS0. CAT sample {slot 1) or the 2.2- CAT sample [slot 2), or a known amount of linearized CAT DNA mixed with 1.25 ~g of carrier embryo DNA (slots 4-9) was denatured, affixed to nitrocellulose, and hybridized with a probe specific for CAT sequences. Standards in slots 4-9 are 0, 0.5, 1, 2, 5, and 10 x 106 molecules of CAT DNA, respectively. Slot 3 contains no DNA. Conversion of hybridized counts per minute, measured by scintillation counting of excised bands, to molecules of CAT DNA and indicates that the SMS0. CAT sample contained 2 x 10⁶ molecules of CAT DNA and the 2.2. CAT sample 0.4 x 10⁶ molecules CAT DNA. (b) Titration of the CyIIIa message. Increasing amounts of RNA extracted from 18,800 50-hr carrier embryos plus 1455 50-hr experimental embryos expressing SMS0. CAT (o) or 2.2. CAT (A), or from control (unin/ected) embryos (e) were hybridized in solution to an excess of a2P-labeled antisense Cyllla RNA probe. Unhybridized RNA was digested with RNase A and T1, and TCA-pre- cipitable counts per minute measured and plotted versus input mass of sea urchin RNA. The slope of the line is a function of message prevalence and is independent of RNA recovery between the samples. Lines were fitted to data points by linear least squares regres- sion. (c) Titration of the SM50. CAT message. Symbols and method are as in b, except that RNA samples were hybridized to an antisense CAT RNA probe.
1244 GENES & DEVELOPMENT
Cold Spring Harbor Laboratory Press on January 30, 2018 - Published by genesdev.cshlp.orgDownloaded from

Expression of a sea urchin skeletogenic transgene
The samples of transgenic embryos to be used for CAT mRNA measurement were collected together with a 13- fold excess of carrier embryos grown in parallel from un- injected eggs, and total RNA was extracted (see Mate- rials and methods). To control for recovery and integrity of the extracted RNA, the quantity of CyIIIa cytoskel- etal actin mRNA was determined, as the number of transcripts of this mRNA species had been measured by titration in S. purpuratus embryos in an earlier study (Lee et al. 1986). The CyIIIa titrations are shown in Figure 4b, and the parallel CAT mRNA titrations in Figure 4c. As shown in Figure 4b, the SM50. CAT and 2.2. CAT samples contained almost equivalent concen- trations of CyIIIa message, corresponding to 4.4 x 10 4
and 4.1 x 10⁴ CyIIIa transcripts per embryo, respec- tively, while the uninjected embryo control indi- cated 2.7 x 10⁴ transcripts per embryo. Lee et al. (1986) found 5.8 x 10 4 CyIIIa transcripts per embryo at 36 hr and 8.8 x 10⁴ at 65 hr. Interpolating, we would expect from these measurements about 7 x 1 0 4 CyIIIa tran- scripts per embryo at 50 hr. We assume the measure- ments of Lee et al. (1986) to be the more accurate since they were carried out on relatively large rather than mi- croscale samples of embryos, and thus conclude that we recovered about 60% of the correct number of CyIIIa transcripts. However, since this factor would cause an underestimate in the actual amount of CAT mRNA in the experimental samples of less than a factor of 2, and since the two experimental samples are in this respect indistinguishable, we have not normalized the CAT mRNA measurements shown in Figure 4c to a level that would assume 100% CyIIIa mRNA recovery. A direct conversion of the CAT mRNA titration shown to tran- script prevalence yields a value of 1.8 x 10⁴ CAT mRNA molecules per embryo in the SM50. CAT sample, and 6.4 x 10³ CAT mRNA molecules per em- bryo in the 2.2. CAT sample. As expected there is no CAT mRNA in the uninjected control, though this sample is undegraded, since it displays ample CyIIIa mRNA (Fig. 4b). The 2.8-fold greater amount of CAT mRNA in the SM50. CAT sample may be accounted for by the fourfold greater average content of CAT DNA re- tained in the SMS0. CAT embryos in this experiment, and certainly does not explain the 12-fold lower recovery of CAT enzyme activity. In any case, assuming that the two message species are translated with equal efficiency, since they share the same 5' untranslated region and translation initiation codon, then either the fusion pro- tein derived from SM50- CAT is 34-fold less active than the enzyme derived from 2.2. CAT (i.e., 2.8 x 12, the average ratio of CAT enzyme activity per embryo in the 2.2. CAT sample to that in the SMS0- CAT sample), or it is turned over in the cell 34 times more rapidly, or a combination of both. The extraneous amino-terminal SMS0 polypeptide sequence could be responsible for ei- ther phenomenon. However, it may seem a less than probable explanation that a portion of the normal SM50 protein sequence would result in an increase in turnover rate in cells that also express this protein endogenously. The more likely alternative is that the larger amino-ter-
minal SM50 sequence causes steric hindrance of the en- zyme, resulting in >10 x lower acetylation activity compared to the fusion protein produced by 2.2. CAT, which includes but four SM50 amino acids.
Thus, a conclusion from these CAT mRNA measure- ments is that quantitatively significant negative tran- scriptional regulatory sites are unlikely to be present in the large intron of the SM50 gene. We have seen that if anything the SM50. CAT gene is more active than the 2.2. CAT gene, though the severalfold difference in transcript concentration is probably due simply to the subsaturation level of exogenous genes in this particular sample of 2.2. CAT embryos. An ancillary, though indi- rect argument to this effect, is that in experiment 1 of Table 1, for which there are neither CAT DNA nor CAT mRNA measurements, the ratio of CAT enzyme ac- tivity per embryo between the SM50. CAT and the 2.2 • CAT constructs, i.e., 25 x, is close to the apparent ratio of CAT enzyme activity per transcript, i.e., 34 x. This is what would be expected were the exogenous DNA saturating in experiment 1, as is usually the case in sea urchin embryos raised from eggs injected in the cytoplasm by this method (Flytzanis et al. 1987; Lai et al. 1988; Livant et al. 1988), and were the two constructs exactly equal in transcriptional activity. In any case, the minimum qualitative conclusion is that these experi- ments provide no evidence for important regulatory se- quences located in the intron or in the exon sequences deleted in 2.2. CAT. As we now show, the necessary and sufficient sequences can be identified in the flanking upstream region of the SM50 gene.
Subdivision of the upstream regulatory domain
The 2.2-kb SalI fragment of 2.2. CAT was subcloned into a slightly different CAT vector known as pUC" PL. CAT (Bond-Matthews and Davidson 1988), to generate 2.2PL. CAT (Fig. lb). This construct is iden- tical to 2.2 • CAT in the SM50 upstream and coding se- quences it includes, and these SM50 sequences are fused to the parental CAT vector at the same SalI restriction site. The rationale for this construct is the presence in 2.2PL • CAT of polylinker restriction sites at the 5' end of the SM50 sequence, permitting the entire insert of 2.2PL. CAT to be excised as a SphI-BamHI fragment (Fig. lb). After gel purification the insert could then be injected without appended plasmid vector sequences. Several additional restriction fragments were likewise derived from 2.2PL • CAT that include progressively less 5' SM50 promoter sequence, all of which terminate with the identical CAT-SV40 vector sequence (see Fig. lb). Injection of fragments bordered at the 5' end by the SphI site (at position -2200), the EcoRV site (at -1100), or the BglII site (at -440) resulted in a mild difference in CAT activity that was not statistically significant (Table 2). The BglII-BamHI fragment was subcloned separately and again gel-purified to preclude the possibility of con- tamination, again with no difference observed in CAT activity compared to the SphI-BamHI fragment (Table 2, experiment 2). Thus, the sequences upstream of the
GENES & DEVELOPMENT 1245
Cold Spring Harbor Laboratory Press on January 30, 2018 - Published by genesdev.cshlp.orgDownloaded from

Sucov et al.
Table 2. CAT enzyme activity in transgenic embryos bearing various 5' SM50. CAT deletions
Fragment of 2.2PL • CAT CAT enzyme units/embryo (avJ b injected a expt. 1 expt. 2
SphI-BamHI 1.6 x 10 -s 1.1 x 10 -s EcoRV-BamHI 1.8 x 10 -s BgRI-BamHI 1.9 x 10 -s 1.4 x 10 -s
a See Fig. lb. b Each value represents the average of t w o or three samples, ex- cept for the EcoRV-BamHI fragment (one sample}. Each sample contained 45-60 injected embryos.
BgllI site of the SM50 promoter are dispensable, as as- sayed by CAT activi ty at the early pluteus stage. Further deletions do result in a significant decrease in CAT ac- tivity, confirming that important regulatory sequences required for SM50 funct ion are found wi th in the BgllI site {data not shown).
To determine whether spatial regulation is main- tained after deletion of the SM50 promoter to the BglII site, embryos injected wi th the BglII-BamHI fragment were collected at mesenchyme blastula stage and pre- pared for in situ hybridization. Representative examples of sections are shown in Figure 5. Expression of this transgene is again l imi ted to ingressed mesen- chyme cells and to the polar region of the vegetal ecto- derm wall, i.e., the identical pa t tem observed wi th SM50. CAT. complete sections of 13 embryos were re- covered, and partial series {at least three sections) of an additional 24 embryos were examined as well. Fourteen displayed no labeled cells. Eight embryos showed label in ingressed mesenchyme cells only, seven showed label over polar regions of the vegetal ectoderm wall only, and eight showed label over both. As seen in a few sections from embryos expressing SM50. CAT, several sections displayed label over regions of the embryo that were pos- sibly not mesenchyme or vegetal mesenchyme pre-
Figure 5. In situ hybridization of embryos expressing the BgIII-BamHI fragment of 2.2PL • CAT. (a-c} Embryos collected at mesen- chyme blastula stage; (d-e} embryo at early pluteus stage (60 hr of development}, seen in darkfield {d) and phase contrast {e). Mesen- chyme blastula-stage embryos are oriented with the vegetal pole at the bottom. In b, labeling can be seen in cells still within the vegetal wall that would shortly have ingressed into the blastocoel. The number of labeled mesenchyme cells, and the number of mesenchyme cells present is: (al 2 of 4, {b) 3 of 5, and (cl 3 of 7. The pluteus-stage embryo (which is slightly distorted from sectioning} is oriented with the vegetal pole down and the future site of the mouth at the top left. The cluster of mesenchyme cells labeled in this section are located at the future apex of the pluteus.
1246 GENES & DEVELOPMENT
Cold Spring Harbor Laboratory Press on January 30, 2018 - Published by genesdev.cshlp.orgDownloaded from

Expression of a sea urchin skeletogenic transgene
cursors. In one case, two cells at the animal pole of the embryo were labeled, and in second case, a single cell at the lateral side of the vegetal plate was labeled. How- ever, the vast majority of embryos clearly demonstrated the correct expression pattern. As noted above (Fig. 3b), the observed frequency of labeled cells in the mesen- chyme population of these embryos was similar to that observed in embryos injected with SM50. CAT.
Embryos bearing the BglII-BamHI fragment were also raised to early pluteus stage, and then collected for in situ hybridization. At this stage, the skeletogenic mes- enchyme cells have for the most part distributed them- selves along the length of the growing spicules, although small clusters of these cells persist at the ends of the spicule rods (Gustafson and Wolpert 1963). The ecto- derm and intestinal tract are close to fully differentiated, and migratory derivatives of the nonskeletogenic sec- ondary mesenchyme are apparent within the blastocoel. In sectioned embryos that displayed CAT mRNA, the label was again seen over mesenchyme cells, and was not present over gut or ectoderm cells. One example is shown in Figure 5, d-e . However, it is not possible to determine whether the labeled cells surround a spicule in vivo, in since the mineral elements of the skeleton are dissolved during fixation, and therefore it remains un- known whether the labeled cells were skeletogenic or secondary mesenchyme cells. It can be excluded, none- theless, that widespread ectopic expression of the trans- gene occurs in highly differentiated embryos. The unam- biguous results obtained with mesenchyme blastula stage embryos (Fig. 5a-c)provide the major conclusion from this initial dissection of the SM50 regulatory do- main. This is that the region which lies between the BglII site at position - 4 4 0 and the SalI site at position + 120 includes regulatory sequences that suffice to pro- mote correct spatial activation of this gene.
Discussion
Regulated expression of the SM50. CAT fusion in transgenic embryos
This study demonstrates that the lineage-specific ex- pression of a gene required for mesenchymal skeleto- genesis in the embryo is mediated by cis-regulatory se- quences within a few hundred nucleotides of the initia- tion site of the gene. There could be additional quantitative regulatory sites that we did not assay either upstream of -2200, or within the body of the gene that was replaced by the CAT reporter gene sequence in the fusion we studied. We have no way of directly com- paring the transcriptional activity of the CAT fusions with that of the native SM50 gene. This is because mul- tiple copies of the gene are incorporated, due to the ini- tial concatenation of the injected molecules, and the subsequent replication of the concatenates along with the host cell genomes (Flytzanis et al. 1985; McMahon et al. 1985; Franks et al. 1988; Hough-Evans et al. 1988). However, the amount of expression obtained from the SM50. CAT fusions is consistent with expectation, were
the number of exogenous genes saturating with respect to endogenous regulatory factors (Flytzanis et al. 1987). The measurements shown in Figure 4a indicate about 8 x 10 4 molecules of the exogenous construct per em- bryo for the SM50 • CAT sample, or - 1 0 s in those em- bryos that show SM50. CAT expression. The measure- ments of Figure 3 indicate that on the average these are located in 5.5/32 or 17.2% of the mesenchyme cells. Ac- cepting this as an estimate for the whole embryo, in the -1000 cell early pluteus there would be about 500 fu- sion genes per cell, versus the two copies of the native SM50 gene per cell (Sucov et al. 1987). For comparison, Livant et al. (1988) showed that half-saturation of the expression of a fusion construct under control of the CyIIIa regulatory sequence occurs at - 5 0 - 2 0 0 fusion genes per cell depending on the batch of eggs. The amount of CAT mRNA we measured in the present work is about nine-fold greater than the amount of en- dogenous SM50 mRNA per cell. Thus, there would be about 1760 CAT mRNA molecules per active cell (1.8 X 10⁴ CAT mRNA transcripts per embryo, divided by 60 skeletogenic mesenchyme cells x 0.17), compared with about 200 SM50 mRNA molecules per skeleto- genic mesenchyme cell (Killian and Wilt 1988). The equivalent ratio for the CyIIIa. CAT fusion indicates that at saturation with exogenous genes about 20-fold more CAT mRNA is produced per aboral ectoderm cell bearing the CyIIIa • CAT fusion than endogenous CyIIIa mRNA (Flytzanis et al. 1987; Hough-Evans et al. 1988). Of course, to demonstrate that the incorporated SM50 fusions do in fact titrate out the available factor(s) that interact with them would require direct in vivo satura- tion and competition measurements, as have been car- ried out with the CyIIIa gene (Flytzanis et al. 1987; Li- vant et al. 1988; R. Franks, unpubl.). We here rely, at least in part, on the quantitative similarity displayed by these two systems with respect to these measurements of reported gene activity. In summary, the level of ac- tivity observed in embryos bearing SM50. CAT con- structs is clearly not an inconsequential trickle, and could represent the maximum level of expression per- mitted by the concentrations of the available transcrip- tion factors.
The main focus of this work has been the spatial rather than the quantitative regulation of the SMS0 gene, as this displays so striking a lineage specificity. The preservation of this lineage specificity in the ex- pression of the SM50" CAT fusions implies that trans- acting factors recognizing the necessary regulatory ele- ments included in the fusion constructs must be local- ized, or activated, exclusively in the skeletogenic mesenchyme cell lineages, and that the causal basis of SMS0 expression in skeletogenic mesenchyme cells is the interaction of the factors with the cis-regulatory re- gions of this gene. We showed earlier that the identical CAT reporter construct is activated in a wholly exclu- sive set of embryonic lineages, the aboral ectoderm, when placed under the control of cis-regulatory se- quences of the CyIIIa cytoskeletal actin gene, which is normally expressed only in aboral ectoderm (Flytzanis et
GENES & DEVELOPMENT 1247
Cold Spring Harbor Laboratory Press on January 30, 2018 - Published by genesdev.cshlp.orgDownloaded from

Sucov et al.
al. 1987; Hough-Evans et al. 1987, 1988). The compar- ison provides a strong argument that it is simply the spatial distribution of active forms of the respective reg- ulatory factors amongst the lineages of the early embryo that determines the initial pattern of differential gene expression.
Autonomous and regulative differentiation of skeletogenic mesenchyme
The simple paradigm just derived fits the normal differ- entiation of the skeletogenic mesenchyme lineage from its fifth-cleavage founder cells, since this lineage differ- entiates autonomously in vitro (see introductory section for references), and since experimental test excludes any requirement for (inductive) intercellular interactions in SMS0 expression by cells of this lineage {Stephens et al. 1988). Thus, it is difficult to avoid the conclusion that localized maternal cytoplasmic factors that directly or indirectly cause skeletogenic gene expression are segre- gated to the skeletogenic mesenchyme founder cells in the course of the geometrically programmed cleavage di- visions by which they arise. On the other hand there have been reported many observations, classical and modern, that demonstrate a regulative potential for ske- letogenesis in lineages of the sea urchin embryo that never in normal development contribute to the skeleto- genic mesenchyme. H6rstadius and his school of experi- mentalists produced a number of different chimeric blastomere recombinations in which skeletogenesis ap- parently is carried out by progeny of tiers of cells not normally ancestral to skeletogenic mesenchyme (for re- view, see H6rstadius 1939, 1973). In addition, isolated animal-half embryos, which consist exclusively of cells that in normal development are ancestral to oral and aboral ectoderm, and to their neurogenic derivatives, can be induced to give rise to complete pluteus larvae that include normal formed skeletal structures, by treatment with LiC1 (yon Ubisch 1925a, b, 1929; H6rstadius 1973, Fig. 34). Furthermore, removal of ingressed skeletogenic mesenchyme cells from within the blastocoel induces a quantitative, compensatory conversion of nonskeleto- genic secondary mesenchyme cells to the function of a skeletogenic lineage (Fukushi 1962; Et tensohn and McClay 1988). An apparent paradox arises from this evi- dence of widespread nonlocalized potential to produce skeletogenic cells, in considering results such as those presented here, that by logic generate the conclusion that normal specification of skeletogenic function is caused by the localization of regulatory factors which result in lineage-specific, differential gene expression.
An interpretation of embryonic development that might afford a resolution of this elementary problem can be summarized in a few words as follows (space does not permit a detailed exposition, which is presented else- where). It is proposed that regulatory factors controlling spatial expression of lineage-specific genes may be dis- tributed globally in the embryo, but generally in an in- active state; that the location of cleavage planes (which in sea urchin embryos is per se a fixed property of the
maternal cytoskeletal organization} sets up the lineage founder cell domains; and that specific ligand-receptor [inductivel interactions occurring during cleavage at the membranes separating founder cells result by signal transduction, in alteration of regulatory factor state from inactive to active. In the unusual case of the normal ske- letogenic founder cells, the responsible factors would be in an active state irrespective of such interactions. The effects of the ectopic blastomere rearrangements, or of LiC1 treatment, can be interpreted as short-circuiting or abnormally stimulating the signal transduction appa- ratus normally utilized for other purposes, in those blas- tomeres whose lineages are transformed by such treat- ment. The mysterious phenomenon of regulative devel- opment, which has puzzled observers ever since its discovery in the initial phase of experimental embry- ology a century ago (for review, see Wilson 1925, Chapters 13 and 14; Davidson 1986, Chapter 6), may be explained generally in a similar way. That is, the regula- tive capacity of given portions of an early embryo simply could reflect the distribution of trans-regulators that can be converted to active forms through the ectopic opera- tion of cell signaling systems utilized normally for founder cell specification.
M a t e r i a l s and m e t h o d s
Construction of SM50. CAT
A genomic clone was isolated from the same sea urchin EMBL3 genomic library as those described previously (Sucov et al. 1987), and selected for its longer 5' end. The SalI-KpnI frag- ment containing the 5' portion of the SM50 gene was subcloned into pUC18, restricted at the KpnI site, and digested with Bal31. SalI linkers were added, the DNA restricted with SalI, and the fragments containing the SM50 gene sequences were cloned into pUC18. One clone terminated at the 3' end just within the SM50 second exon. Its insert was excised with SalI and cloned into a version of pSVOCAT (Gorman et al. 1982) modified so as to contain a SalI site at the junction of the CAT coding region (Katula et al. 1987}. The relevant sequence of this clone is shown in Figure lc.
Construction of SM5OA. CAT
A region of SM50. CAT containing the first exon was sub- cloned into Bluescfipt (Stratagene), and single-strand DNA was isolated according to recommended procedures. The 37-mer used for mutagenesis (Fig. ld) was synthesized at the Caltech Microchemical Facility, and phosphorylated with polynucleo- tide kinase. An equimolar amount of template and oligo were mixed, denatured at 65°C for 5 min, and rehybridized at 37°C for 10 min. Extension with Klenow polymerase and deoxynu- cleotides, and recircularization by ligation were as recom- mended (Stratagene). The DNA was used to transform JM101. Following chloramphenicol amplification, colonies on replicate filters were screened with the 37-mer, labeled with polynucleo- tide kinase and [~/-a2P]ATP. Hybridization was at 65°C in 4 x SET, 5 x Denhardt's solution, 0.1% SDS, 25 mM phosphate buffer (pH 6.8}, and 50 v.g/ml denatured calf thymus DNA; the final wash was at 65°C in 0.3 x SET, 0.1% SDS, 25 mM phos- phate buffer, and 0.1% NaPPi. Approximately 1% of the recom- binant colonies had been mutagenized successfully.
1248 GENES & DEVELOPMENT
Cold Spring Harbor Laboratory Press on January 30, 2018 - Published by genesdev.cshlp.orgDownloaded from

Construction of 2.2. CAT and 2.2PL. CAT
The 2.2-kb SalI fragment from SM50A. CAT was subcloned into pSVOCAT, modified to contain a SalI site by Flytzanis et al. (1987), to generate 2.2. CAT. The same fragment was in- serted into the CAT vector pUC. PL. CAT (Bond-Matthews and Davidson 1988), modified to create a SalI site by fill-in of the BglII site and attachment of SalI linkers, to generate 2.2PL • CAT.
Embryos
S. purpuratus eggs were microinjected as described (McMahon et al. 1985) with either BamHI-linearized plasmid DNA or gel- purified fragments. Approximately 1500 molecules of CAT- containing DNA were introduced per egg, with a fourfold molar excess of PstI restricted carrier sea urchin genomic DNA par- tially digested to an average length of 10 kb. The inclusion of carrier DNA augments expression (R. Franks, unpubl.). For CAT assays, embryos were collected at prism stage and assayed by standard procedures, as described by Franks et al. (1988). For in situ analysis, a method to simplify the collection of the rela- tively small number of injected embryos was developed. Thirty microliters of molten 1.5% agarose in seawater was allowed to harden in the bottom of a siliconized 200-~1 yellow pipet tip. Embryos were transferred into approximately 100 ~l of sea- water overlying the agarose cushion, then spun in a Beckman microfuge with an Eppendorf tube as a holder at setting 3 for 2 min. As much of the overlying seawater as possible was aspi- rated with a drawn-out Pasteur pipette under a dissecting mi- croscope. Seven microliters of molten agarose in seawater was used to resuspend the loose embryo pellet. The yellow tip was held in ice-cold seawater for 20 sec to harden the agarose, then cut with a razor. The chunk containing the embryos was pushed into glutaraldehyde fix buffer and further processed and paraffin-embedded as described by Hough-Evans et al. (1987). All sections were cut at 5 ~m. Hybridization was as described by Hough-Evans et al. (1987).
Probe excess RNA titration
Embryos were harvested 50 hr after injection, at the early pluteus stage of development. Aliquots were removed for anal- ysis of CAT activity (quantitated in Table 1 as experiments 2 and 3) and of DNA content, the latter measured by a procedure described by Franks et al. (1988). Briefly, DNA was isolated from embryo pellets by proteinase K digestion and organic ex- traction, then denatured and affixed to nitrocellulose using a slot blot apparatus. The filter was hybridized with a single- strand SP6-derived RNA probe containing only CAT sequences at 42°C in 50% formamide, 5 x SSC, 1 x Denhardt's solution, 20 rnM phosphate buffer, and 50 ~g/ml calf thymus DNA; the final wash was at 60°C in 1 x SSC, 0.2% SDS. For isolation of RNA, 1455 experimental embryos were mixed with a 13-fold excess of uninjected embryos, pelleted, and frozen dry. Eighty percent of the experimental embryos are derived from experi- ment 2 of Table 1, the remainder from experiment 3. Embryo pellets were resuspended in a urea sarcosine buffer and digested with proteinase K as described by Lee et al. (1986), followed by organic extraction and ethanol precipitation. Nucleic acids were twice digested for 1 hr with 4 units of RNase-free DNase {RQ1, Promega) with the addition of 40 units RNasin (Promega) and 5 mM DTT, extracted, and precipitated. RNA recovery was 40-50 ~g. Probe excess titration was exactly as described by Lee et al. (1986), using SP6-transcribed RNA probes labeled with 800 Ci/mmole [32p]rUTP. The 131-nucleotide CyIIIa probe is described by Lee et al. (1986); the CAT probe was derived
Expression of a sea urchin skeletogenic transgene
from the SalI-BalI fragment of pSVOCAT and contains only CAT sequences. Data reduction was as described by Lee et al. (1986).
A c k n o w l e d g m e n t s
This research was supported by National Institutes of Health Grant HD-05753. H.M.S. was supported by NIH Training Grant GM-07616.
R e f e r e n c e s
Anstrom, J.A., J.E. Chin, D.S. Leaf, A.L. Parks, and R.A. Raft. 1987. Localization and expression of mspl30, a primary mesenchyme lineage-specific cell surface protein of the sea urchin embryo. Development 101: 255-265.
Benson, S.C., N.C. Benson, and F. Wilt. 1986. The organic ma- trix of the skeletal spicule of sea urchin embryos. J. Cell Biol. 102: 1878-1886.
Benson, S.C., H. Sucov, L. Stephens, E. Davidson, and F. Wilt. 1987. A lineage-specific gene encoding a major matrix pro- tein of the sea urchin embryo spicule. I. Authentication of the cloned gene and its developmental expression. Dev. Biol. 120: 499-506.
Bond-Matthews, B. and N. Davidson. 1988. Transcription from each of the Drosophila actin 5c leader exons is driven by a separate functional promoter. Gene 62: 289-300.
Cameron, R.A., B.R. Hough-Evans, R.J. Britten, and E.H. Da- vidson. 1987. Lineage and fate of each blastomere of the eight-cell sea urchin embryo. Genes Dev. 1: 75-85.
Carson, D.D., M.C. Farach, D.S. Earles, G.L. Decker, and W.J. Lennarz. 1985. A monoclonal antibody inhibits calcium ac- cumulation and skeleton formation in cultured embryonic cells of the sea urchin. Cell 41: 639-648.
Davidson, E.H. 1986. Gene activity in early development, 3rd ed., pp. 218-228, 498-501. Academic Press, Orlando, Florida.
Davidson, E.H. and R.J. Britten. 1971. Note on the control of gene expression during development. J. Theoret. Biol. 32: 123-130.
Ernst, S.G., B.R. Hough-Evans, R.J. Britten, and E.H. Davidson. 1980. Limited complexity of the RNA in micromeres of six- teen-cell sea urchin embryos. Dev. Biol. 79:119-127.
Ettensohn, C.A. and D.R. McClay. 1988. Cell lineage conver- sion in the sea urchin embryo. Dev. Biol. 125: 396-409.
Flytzanis, C.N., A.P. McMahon, B.R. Hough-Evans, K.S. Katula, R.J. Britten, and E.H. Davidson. 1985. Persistence and inte- gration of cloned DNA in postembryonic sea urchins. Dev. Biol. 108: 431-442.
Flytzanis, C.N., R.J. Britten, and E.H. Davidson. 1987. Onto- genic activation of a fusion gene introduced into sea urchin eggs. Proc. Natl. Acad. Sci. 84: 151-155.
Franks, R.R., B.R. Hough-Evans, R.J. Britten, and E.H. Da- vidson. 1988. Direct introduction of cloned DNA into the sea urchin zygote nucleus, and fate of injected DNA. Devel- opment 102: 287-299.
Fukushi, T. 1962. The fates of isolated blastoderm cells of sea urchin blastulae and gastrulae inserted into the blastocoel. Bull. Mar. Biol. Station of Asamushi. 11: 21-30.
Gorman, C., G. Merlino, M. Willingham, I. Pastan, and B. Howard. 1982. The Rous sarcoma virus long terminal repeat is a strong promoter when introduced into a variety of eu- karyotic cells by DNA-mediated transfection. Proc. Natl. Acad. Sci. 79: 6777-6781.
Gustafson, T. and L. Wolpert. 1963. The cellular basis of mor-
GENES & DEVELOPMENT 1249
Cold Spring Harbor Laboratory Press on January 30, 2018 - Published by genesdev.cshlp.orgDownloaded from

Sucov et al.
phogenesis and sea urchin development. Int. Rev. Cytol. 15: 139-214.
Harkey, M.A. and A.H. Whiteley. 1980. Isolation, culture, and differentiation of echinoid primary mesenchyme cells. Wilhem Roux's Arch. 189:111-122.
Harkey, M. and A.H. Whiteley. 1983. The program of protein synthesis during the development of the micromere-primary mesenchyme cell line in the sea urchin embryo. Dev. Biol. 100: 12-28.
Harkey, M.A. 1985. Aspects of gene expression in the sea ur- chin micromere-primary mesenchyme cell line. In The cel- lular and molecular biology of invertebrate development (ed. R.H. Sawyer and R.M. Showman), The Bell W. Baruch Library in Marine Science No. 15, pp. 311-327. University of South Carolina Press, Columbia, South Carolina.
Harkey, M.A., H.R. Whiteley, and A.H. Whiteley. 1988. Coordi- nate accumulation of five transcripts in the primary mesen- chyme during skeletogenesis in the sea urchin embryo. Dev. Biol. 125: 381-395.
H6rstadius, S. 1939. The mechanics of sea urchin development, studied by operative methods. Biol. Rev. Cambr. Phil. Soc. 14: 132-179.
1973. Experimental embryology of echinoderms. Clar- endon Press, Oxford.
Hough-Evans, B.R., R.R. Franks, R.A. Cameron, R.J. Britten, and E.H. Davidson. 1987. Correct cell type-specific expres- sion of a fusion gene injected into sea urchin eggs. Dev. Biol. 121: 576-579.
Hough-Evans, B.R., R.J. Britten, and E.H. Davidson. 1988. Mo- saic incorporation of an exogenous fusion gene expressed ex- clusively in aboral ectoderm cells of the sea urchin embryo. Dev. Biol. 129: 198-208.
Katula, K.S., B.R. Hough-Evans, R.J. Britten, and E.H. Davidson. 1987. Ontogenic expression of a Cyl actin fusion gene in- jected into sea urchin eggs. Development 101: 437-447.
Killian, C.E. and F.H. Wilt. 1988. The accumulation and trans- lation of a spicule matrix protein mRNA during sea urchin embryo development. Dev. Biol. (in press).
Lai, Z., R. Maxson, and G. Childs. 1988. Both basal and onto- genic promoter elements affect the timing and level of ex- pression of a sea urchin H1 gene during early embryo- genesis. Genes Dev. 2: 173-183.
Leaf, D.S., J.A. Showman, J.E. Chin, M.A. Harkey, R.M. Showman, and R.A. Raff. 1987. Antibodies to a fusion pro- tein identify a eDNA clone encoding mspl30, a primary mesenchyme-specific cell surface protein of the sea urchin embryo. Dev. Biol. 121: 29-40.
Lee, J.J., F.J. Calzone, R.J. Britten, R.C. Angerer, and E.H. Da- vidson. 1986. Activation of sea urchin actin genes during embryogenesis. Measurement of transcript accumulation from five different genes in Strongylocentrotus purpuratus. J. Mol. Biol. 188: 173-183.
Livant, D.L., A.E. Cutting, R.J. Britten, and E.H. Davidson. 1988. An in vivo titration of regulatory factors required for expression of a fusion gene in transgenic sea urchin em- bryos. Proc. Natl. Acad. Sci. 85: (in press).
McCarthy, R.A. and M. Spiegel. 1983. Protein composition of the hyaline layer of sea urchin embryos and reaggregating cells. Cell Diff. 13: 93-102.
McMahon, A.P., C.N. Flytzanis, B.R. Hough-Evans, K.S. Katula, R.J. Britten, and E.H. Davidson. 1985. Introduction of cloned DNA into sea urchin egg cytoplasm: Replication and persis- tence during embryogenesis. Dev. Biol. 108: 420-430.
Okazaki, K. 1975. Spicule formation by isolated micromeres of the sea urchin embryo. Am. Zool. 15: 567-581.
Pehrson, J.R. and L.H. Cohen. 1986. The fate of the small mi-
cromeres in sea urchin development. Dev. Biol. 113: 522- 526.
Pittman, D. and S.C. Ernst. 1984. Developmental time, cell lin- eage and the environment regulate the newly synthesized proteins in sea urchin embryos. Dev. Biol. 106: 236-242.
Stephens, L., T. Kitajima, and F. Wilt. 1988. The role of cell interactions in tissue-specific gene expression of sea urchin embryos. Dev. Biol. (mpress).
Sucov, H.M., S. Benson, 1.1. Robinson, R.J. Britten, F. Wilt, and E.H. Davidson. 1987. A lineage-specific gene encoding a major matrix protein of the sea urchin embryo spicule. II. Structure of the gene and derived sequence of the protein. Dev. Biol. 120: 507-519.
von Ubisch, I. 1925a. Entwicklungsphysiologishe Studien an Seeigelkeimen. I-III. Z. Wiss. Zoo1. 124: 361-381; 457-468; 469-486.
von Ubisch, L. 1925b. Uber die Entodermisierung ektodermaler Bezirke des Echinoiden-Keimes und die Reversion dieses Vorganges. Verb. Pbys.-Med. Ges. Wiirzburg 50: 13-19.
yon Ubisch, L. 1929. Uber die Determination der larvalen Or- gane under die Imaginalanlage bei Seeigelen. Wilhelm Roux's Arch. 117: 81-122.
Wessel, G.M. and D.R. McClay. 1985. Sequential expression of germ-layer specific molecules in the sea urchin embryo. Dev. Biol. 111: 451-463.
Wilson, E.H. 1925. The cell in development and heredity, 3rd ed. Macmillan, New York.
1250 GENES & DEVELOPMENT
Cold Spring Harbor Laboratory Press on January 30, 2018 - Published by genesdev.cshlp.orgDownloaded from

10.1101/gad.2.10.1238Access the most recent version at doi: 2:1988, Genes Dev.
H M Sucov, B R Hough-Evans, R R Franks, et al. skeletal matrix protein gene in the sea urchin embryo.A regulatory domain that directs lineage-specific expression of a
References
http://genesdev.cshlp.org/content/2/10/1238.full.html#ref-list-1
This article cites 35 articles, 8 of which can be accessed free at:
License
ServiceEmail Alerting
click here.right corner of the article or
Receive free email alerts when new articles cite this article - sign up in the box at the top
Copyright © Cold Spring Harbor Laboratory Press
Cold Spring Harbor Laboratory Press on January 30, 2018 - Published by genesdev.cshlp.orgDownloaded from