Embed Size (px)
Citation preview
A REFERENCE DOCUMENT FOR THE PRELIMINARY
ASSESSMENT OF CHLOROPRENE LEVELS
IN ST. JOHN THE BAPTIST PARISH:
Evaluation of Potential Health Risks for Elementary School Students
based on Early Sampling Results following Emissions Reductions
June 14, 2018
Louisiana Department of Health
Office of Public Health
Section of Environmental Epidemiology and Toxicology
Preliminary Chloroprene Assessment Page 2
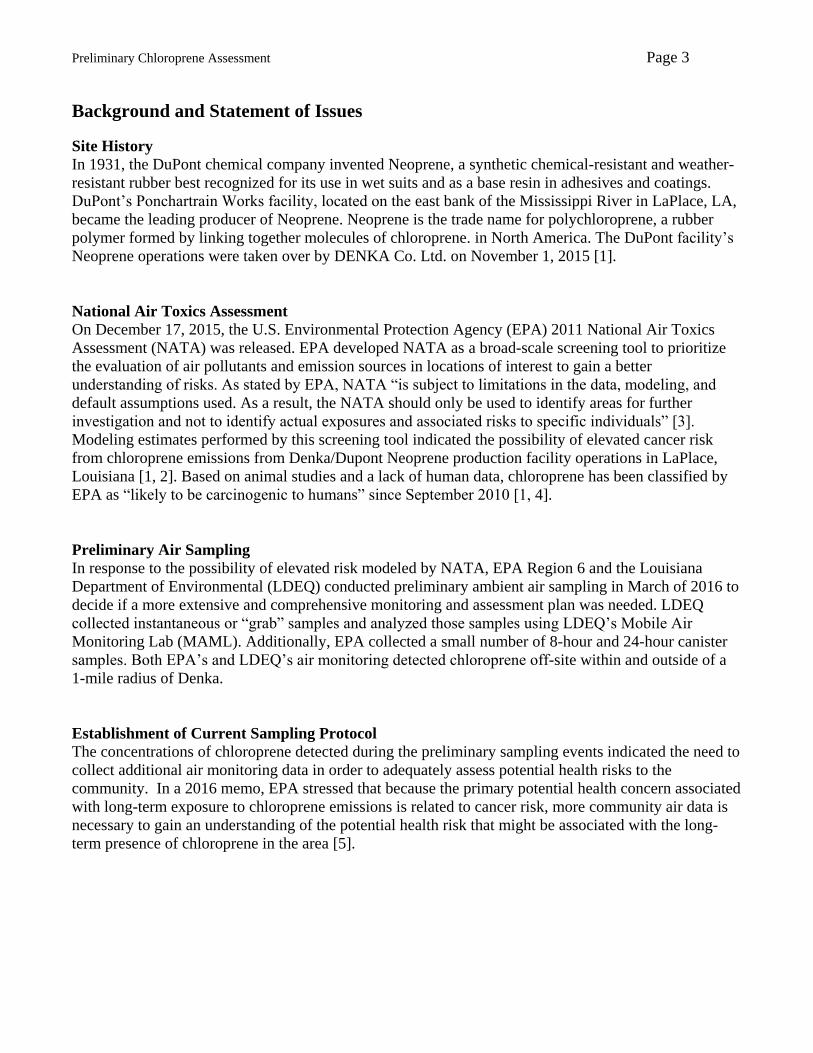
Table of Contents
Background and Statement of Issues ............................................................................................................................. 3
Site History ............................................................................................................................................................................ 3
National Air Toxics Assessment ................................................................................................................................... 3
Preliminary Air Sampling ............................................................................................................................................... 3
Establishment of Current Sampling Protocol ......................................................................................................... 3
Administrative Order on Consent ............................................................................................................................... 5
Demographics ...................................................................................................................................................................... 5
Data Summary Results ......................................................................................................................................................... 8
Toxicology Evaluation .......................................................................................................................................................... 8
Cancer Statistics Reviews .................................................................................................................................................. 10
Risk Assessment for Elementary School Students ................................................................................................. 10
Methodology ....................................................................................................................................................................... 10
Results ................................................................................................................................................................................... 13
Limitations .......................................................................................................................................................................... 15
Preliminary Evaluation ...................................................................................................................................................... 15
References ................................................................................................................................................................................ 16
APPENDIX A: Chloroprene Data ..................................................................................................................................... 18
APPENDIX B: Evaluation of Chloroprene Data, May 2016-May 2018 ........................................................... 25
APPENDIX C: Statistical Analyses of Chloroprene Data ....................................................................................... 31
Preliminary Chloroprene Assessment Page 3
Background and Statement of Issues
Site History
In 1931, the DuPont chemical company invented Neoprene, a synthetic chemical-resistant and weather-
resistant rubber best recognized for its use in wet suits and as a base resin in adhesives and coatings.
DuPont’s Ponchartrain Works facility, located on the east bank of the Mississippi River in LaPlace, LA,
became the leading producer of Neoprene. Neoprene is the trade name for polychloroprene, a rubber
polymer formed by linking together molecules of chloroprene. in North America. The DuPont facility’s
Neoprene operations were taken over by DENKA Co. Ltd. on November 1, 2015 [1].
National Air Toxics Assessment
On December 17, 2015, the U.S. Environmental Protection Agency (EPA) 2011 National Air Toxics
Assessment (NATA) was released. EPA developed NATA as a broad-scale screening tool to prioritize
the evaluation of air pollutants and emission sources in locations of interest to gain a better
understanding of risks. As stated by EPA, NATA “is subject to limitations in the data, modeling, and
default assumptions used. As a result, the NATA should only be used to identify areas for further
investigation and not to identify actual exposures and associated risks to specific individuals” [3].
Modeling estimates performed by this screening tool indicated the possibility of elevated cancer risk
from chloroprene emissions from Denka/Dupont Neoprene production facility operations in LaPlace,
Louisiana [1, 2]. Based on animal studies and a lack of human data, chloroprene has been classified by
EPA as “likely to be carcinogenic to humans” since September 2010 [1, 4].
Preliminary Air Sampling
In response to the possibility of elevated risk modeled by NATA, EPA Region 6 and the Louisiana
Department of Environmental (LDEQ) conducted preliminary ambient air sampling in March of 2016 to
decide if a more extensive and comprehensive monitoring and assessment plan was needed. LDEQ
collected instantaneous or “grab” samples and analyzed those samples using LDEQ’s Mobile Air
Monitoring Lab (MAML). Additionally, EPA collected a small number of 8-hour and 24-hour canister
samples. Both EPA’s and LDEQ’s air monitoring detected chloroprene off-site within and outside of a
1-mile radius of Denka.
Establishment of Current Sampling Protocol
The concentrations of chloroprene detected during the preliminary sampling events indicated the need to
collect additional air monitoring data in order to adequately assess potential health risks to the
community. In a 2016 memo, EPA stressed that because the primary potential health concern associated
with long-term exposure to chloroprene emissions is related to cancer risk, more community air data is
necessary to gain an understanding of the potential health risk that might be associated with the long-
term presence of chloroprene in the area [5].
Preliminary Chloroprene Assessment Page 4
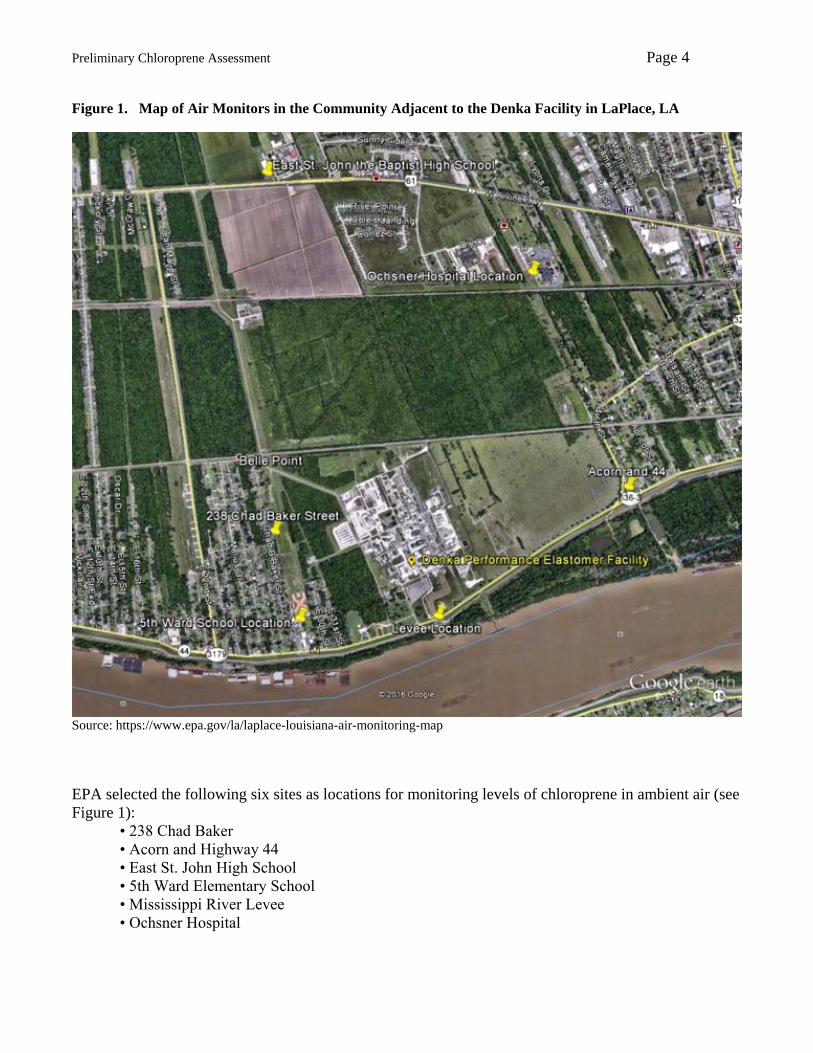
Figure 1. Map of Air Monitors in the Community Adjacent to the Denka Facility in LaPlace, LA
Source: https://www.epa.gov/la/laplace-louisiana-air-monitoring-map
EPA selected the following six sites as locations for monitoring levels of chloroprene in ambient air (see
Figure 1):
• 238 Chad Baker
• Acorn and Highway 44
• East St. John High School
• 5th Ward Elementary School
• Mississippi River Levee
• Ochsner Hospital
Preliminary Chloroprene Assessment Page 5
The ongoing ambient air sampling follows a 1-in-3 schedule (once every third day) with each sampling
event occurring over a 24-hour period. Samples are collected using SUMMA canisters calibrated for 24-
hour sampling [6].The EPA set up an informational website at https://www.epa.gov/la/laplace-st-john-
baptist-parish-louisiana to keep the community updated on ambient air sampling results.
Administrative Order on Consent
On January 6, 2017, LDEQ and Denka signed an Administrative Order on Consent (AOC) outlining
Denka’s voluntary commitment to reduce emissions of chloroprene at the LaPlace facility by 85 percent
from the facility’s 2014 baseline chloroprene emissions [2]. Installation of emissions controls at the
facility began in February 2017 and was completed in December 2017.
Demographics
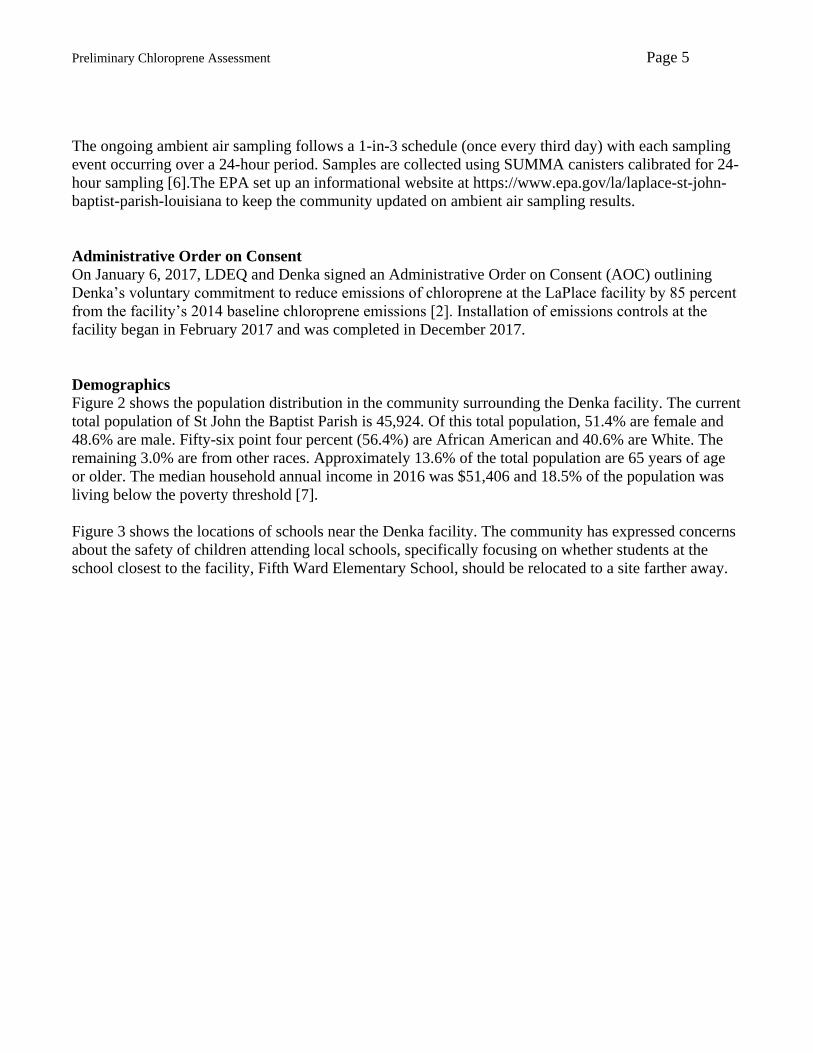
Figure 2 shows the population distribution in the community surrounding the Denka facility. The current
total population of St John the Baptist Parish is 45,924. Of this total population, 51.4% are female and
48.6% are male. Fifty-six point four percent (56.4%) are African American and 40.6% are White. The
remaining 3.0% are from other races. Approximately 13.6% of the total population are 65 years of age
or older. The median household annual income in 2016 was $51,406 and 18.5% of the population was
living below the poverty threshold [7].
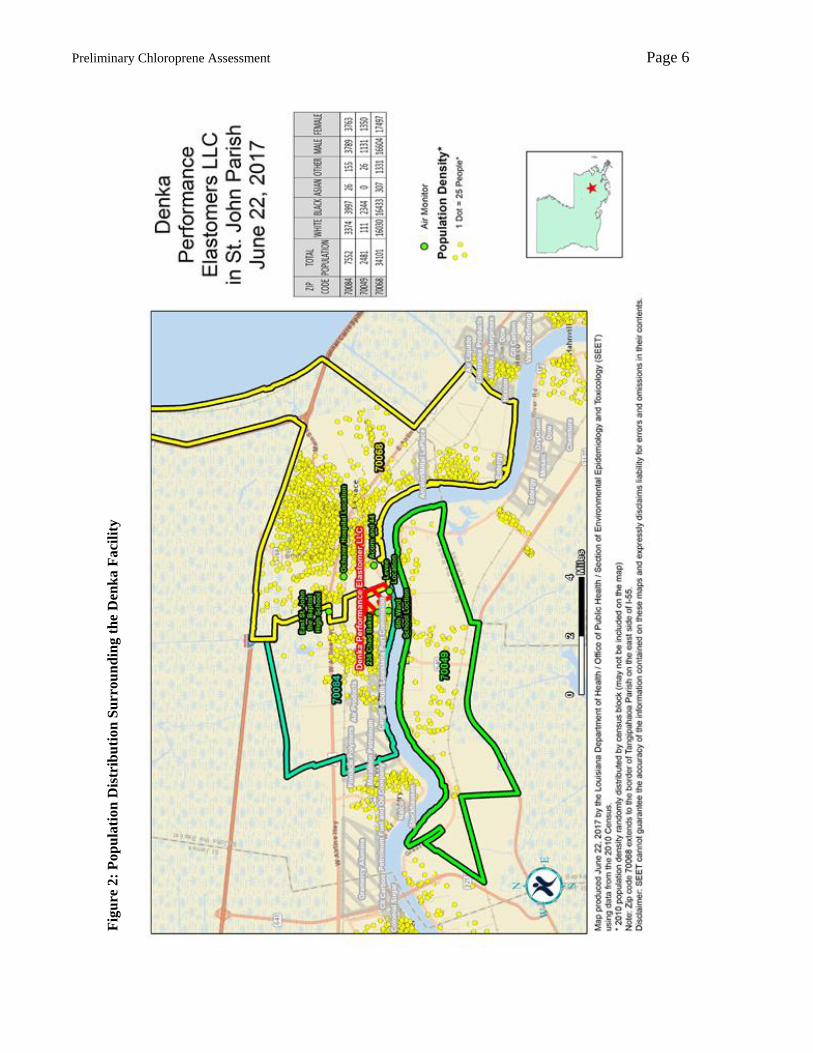
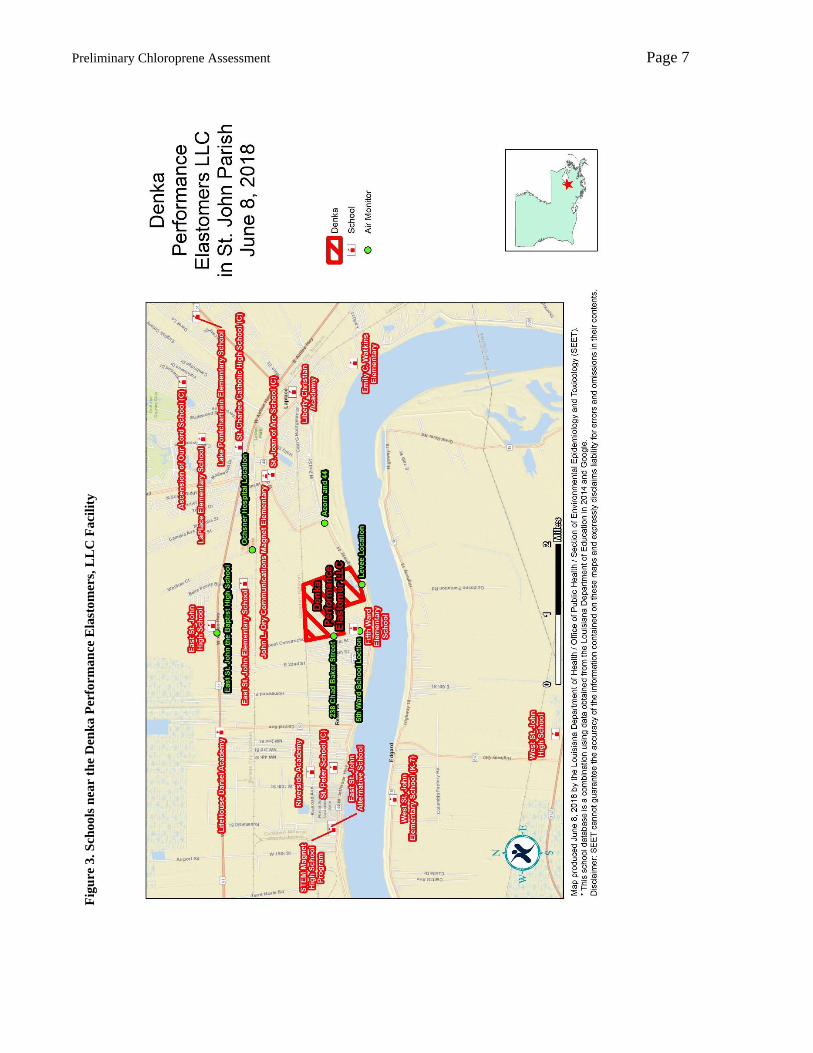
Figure 3 shows the locations of schools near the Denka facility. The community has expressed concerns
about the safety of children attending local schools, specifically focusing on whether students at the
school closest to the facility, Fifth Ward Elementary School, should be relocated to a site farther away.
Preliminary Chloroprene Assessment Page 6
Fig
ure
2:
Po
pu
lati
on
Dis
trib
uti
on
Su
rrou
nd
ing t
he
Den
ka
Fa
cili
ty
Preliminary Chloroprene Assessment Page 7
Fig
ure
3.
Sch
ools
nea
r th
e D
enk
a P
erfo
rma
nce
Ela
sto
mer
s, L
LC
Fa
cili
ty
Preliminary Chloroprene Assessment Page 8
Data Summary Results
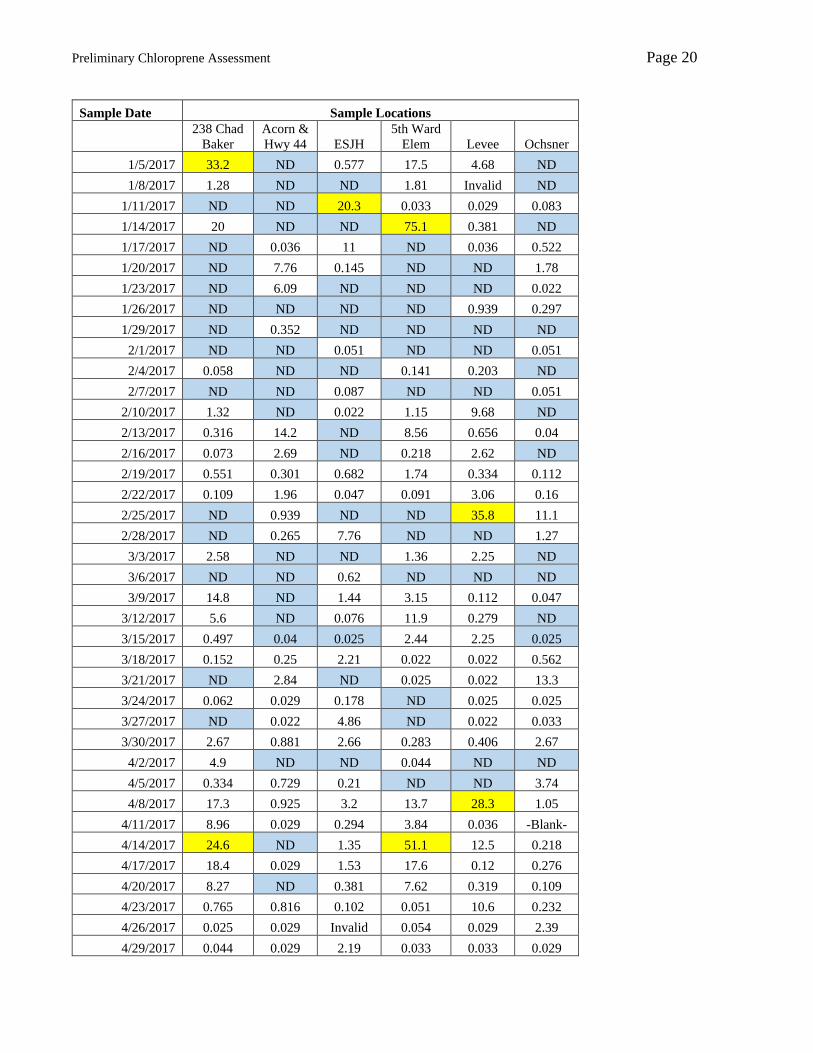
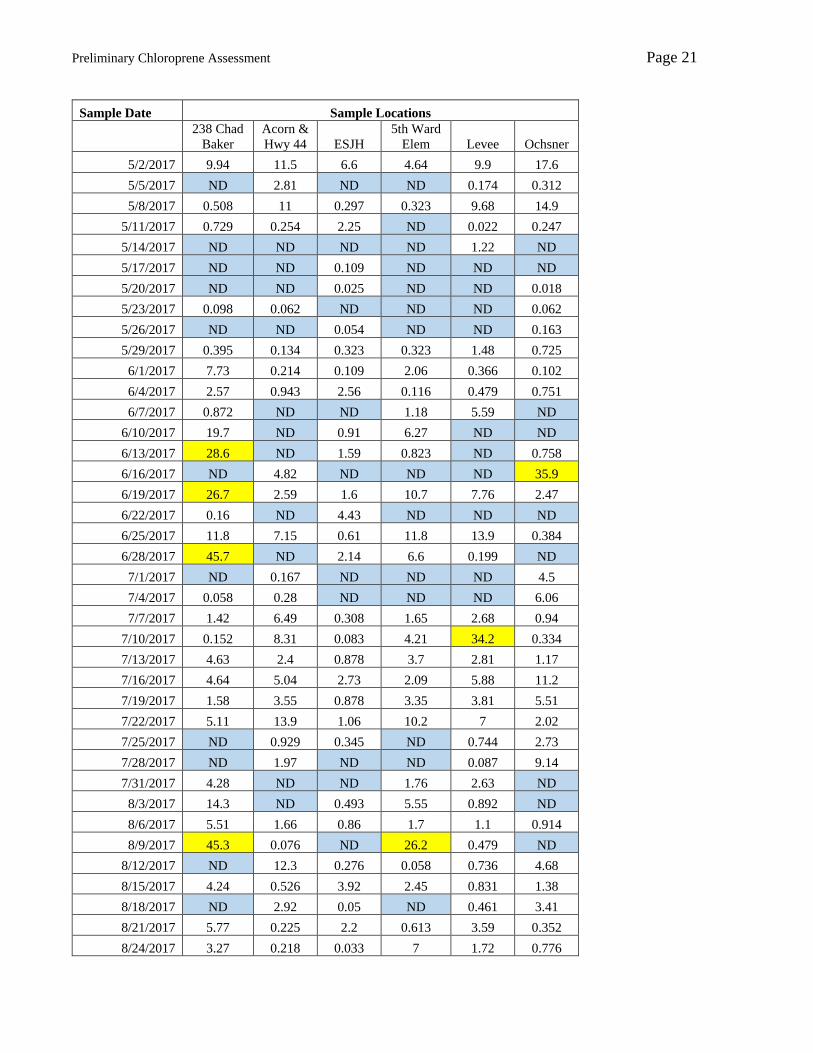
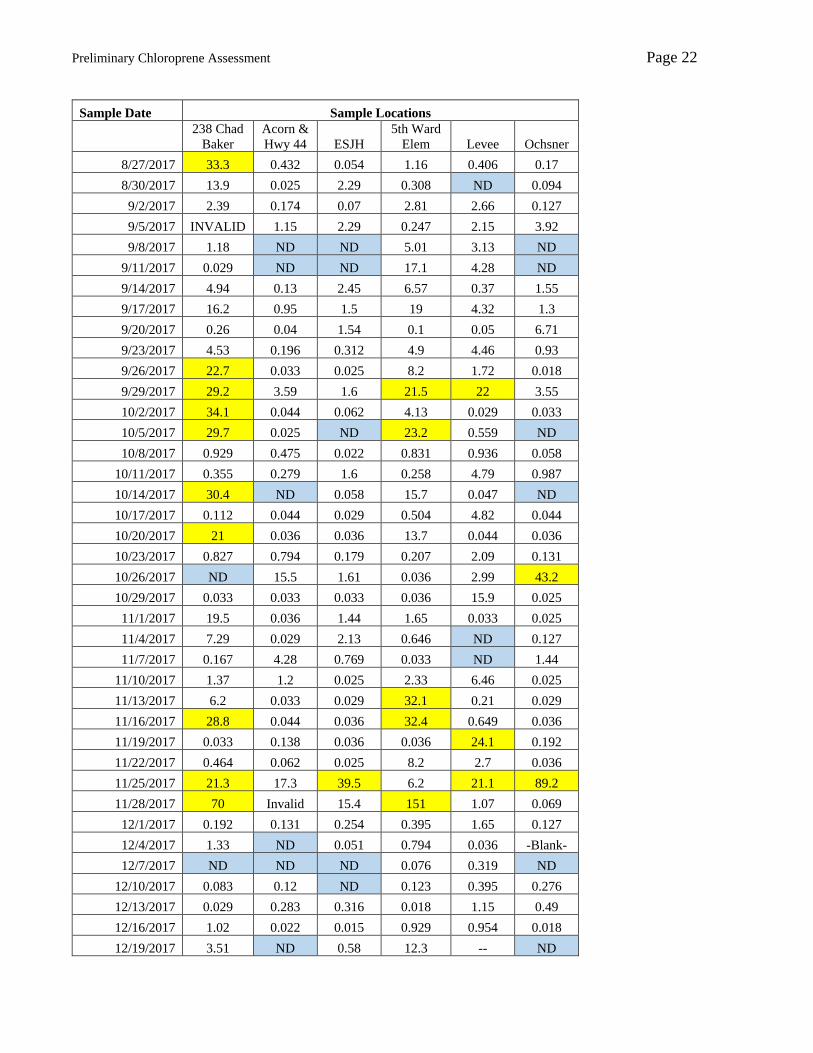
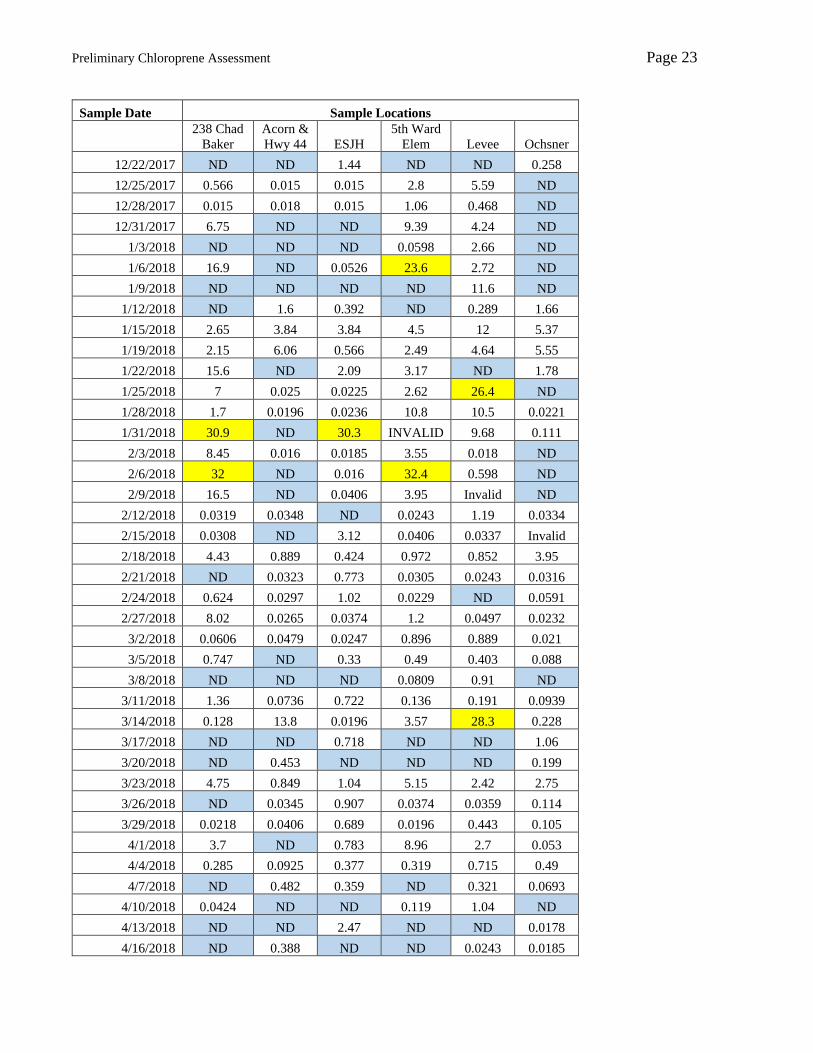
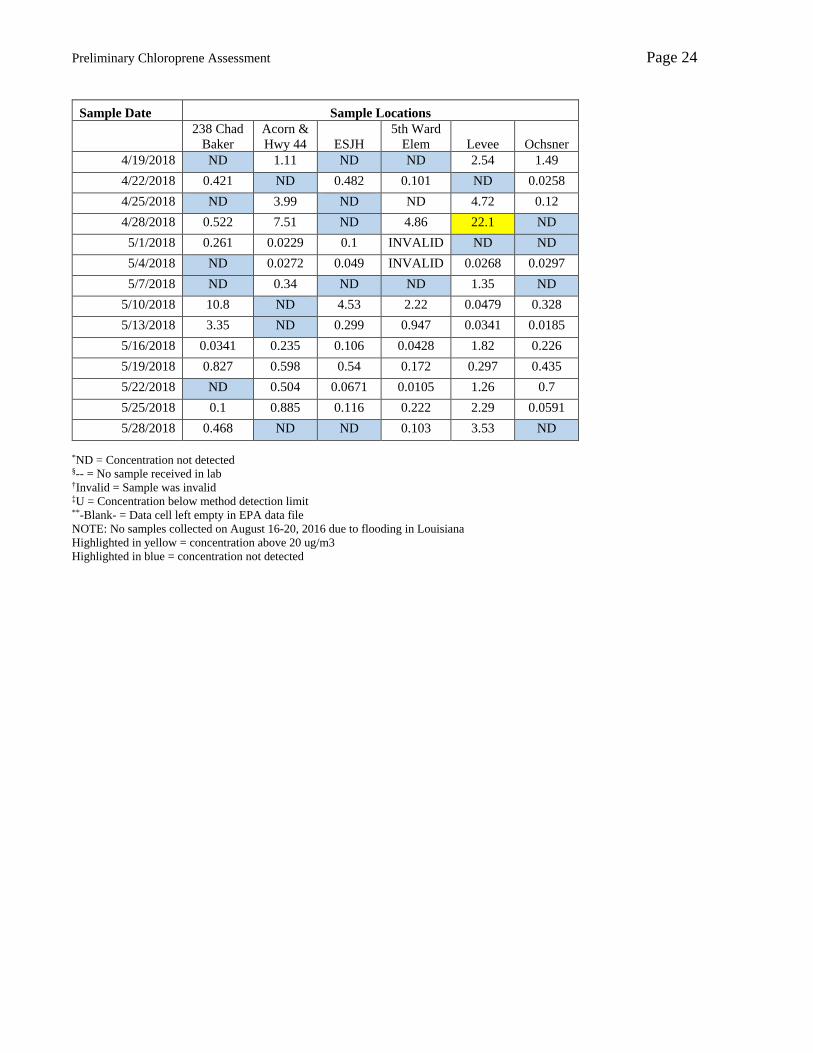
Results from validated ambient air data sampled from May 2016 to May 2018 are listed in Appendix A,
Table A-1. A total of 1,431 samples, excluding those with invalid results or no results reported, were
collected during this period. Results reported as not detected (ND) are highlighted in blue.
The full dataset is evaluated in Appendix B:
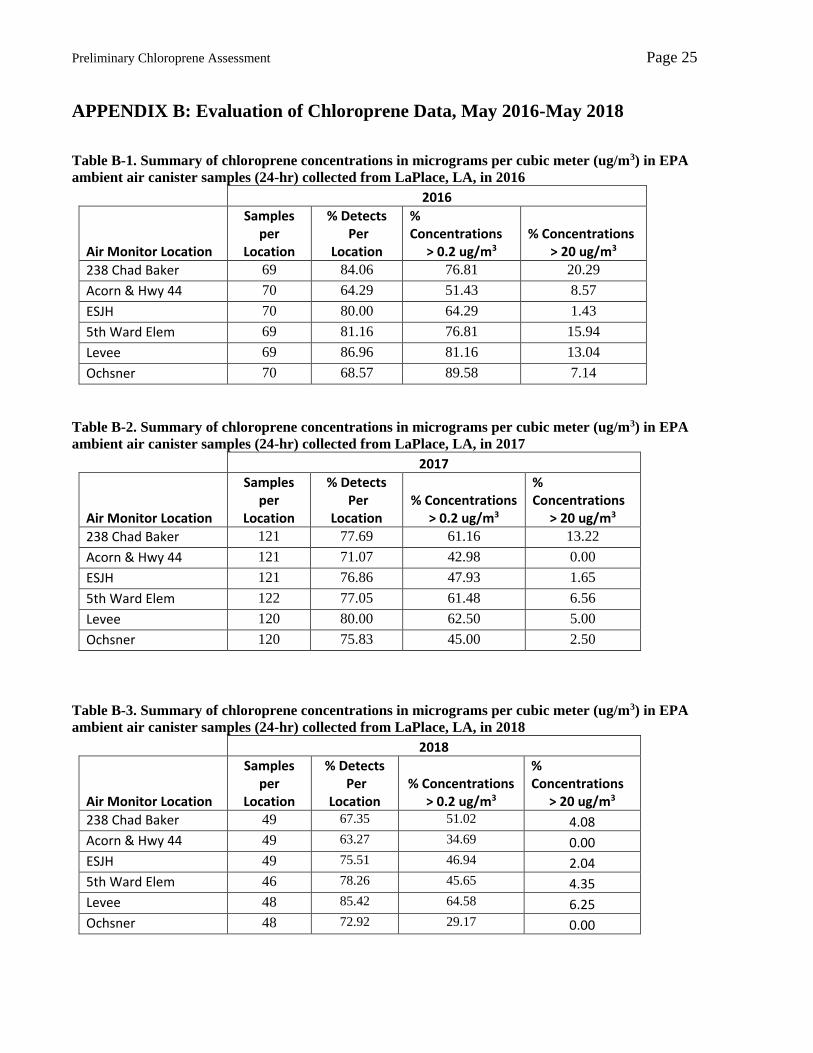
Tables B-1 through B-4 summarize the chloroprene concentrations detected in air sampled from
the community during 2016, 2017, and 2018.
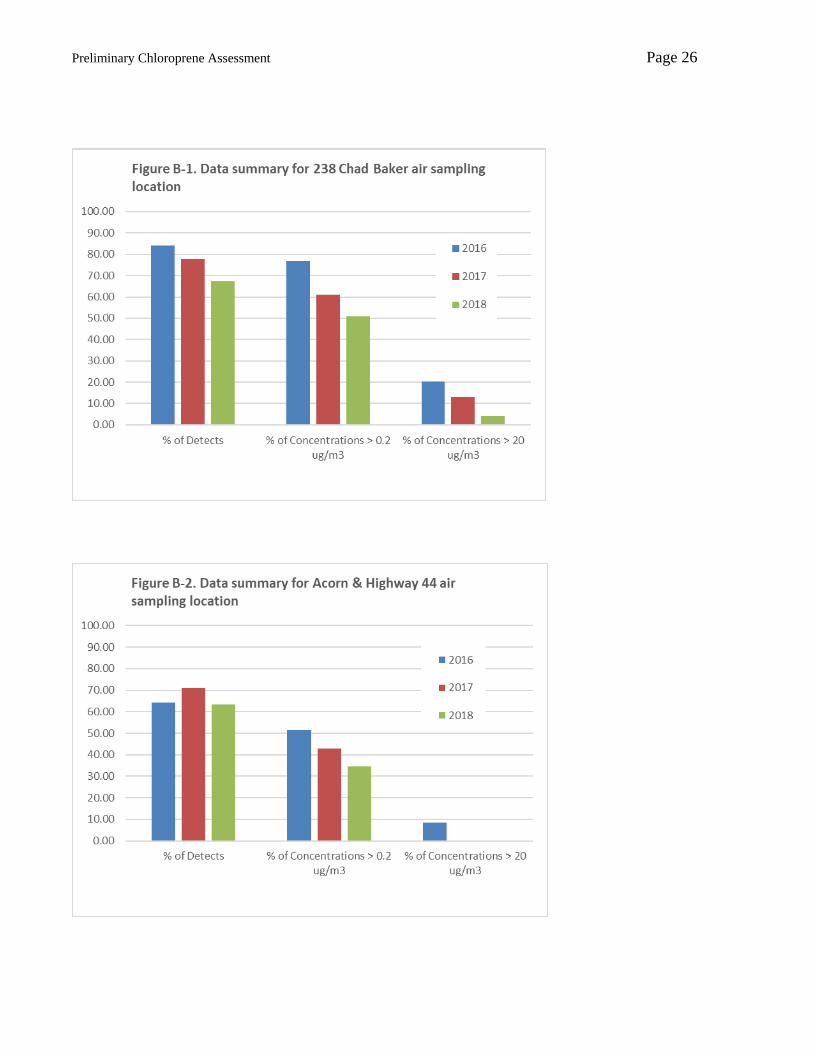
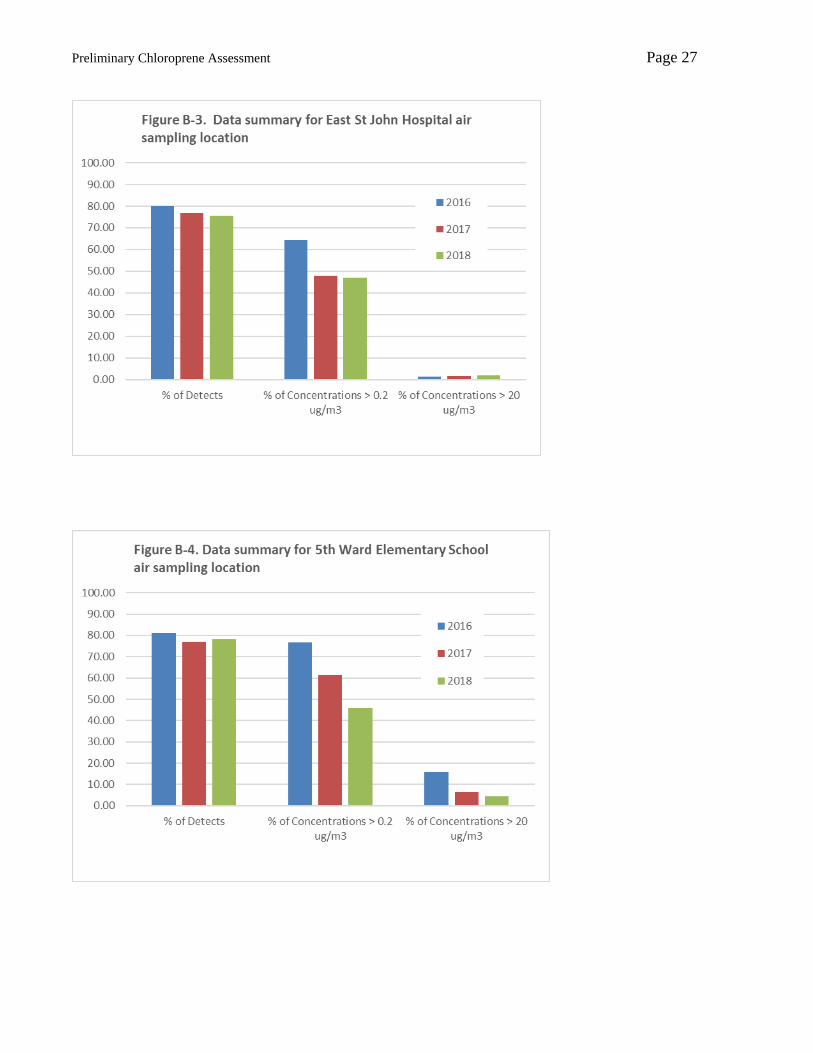
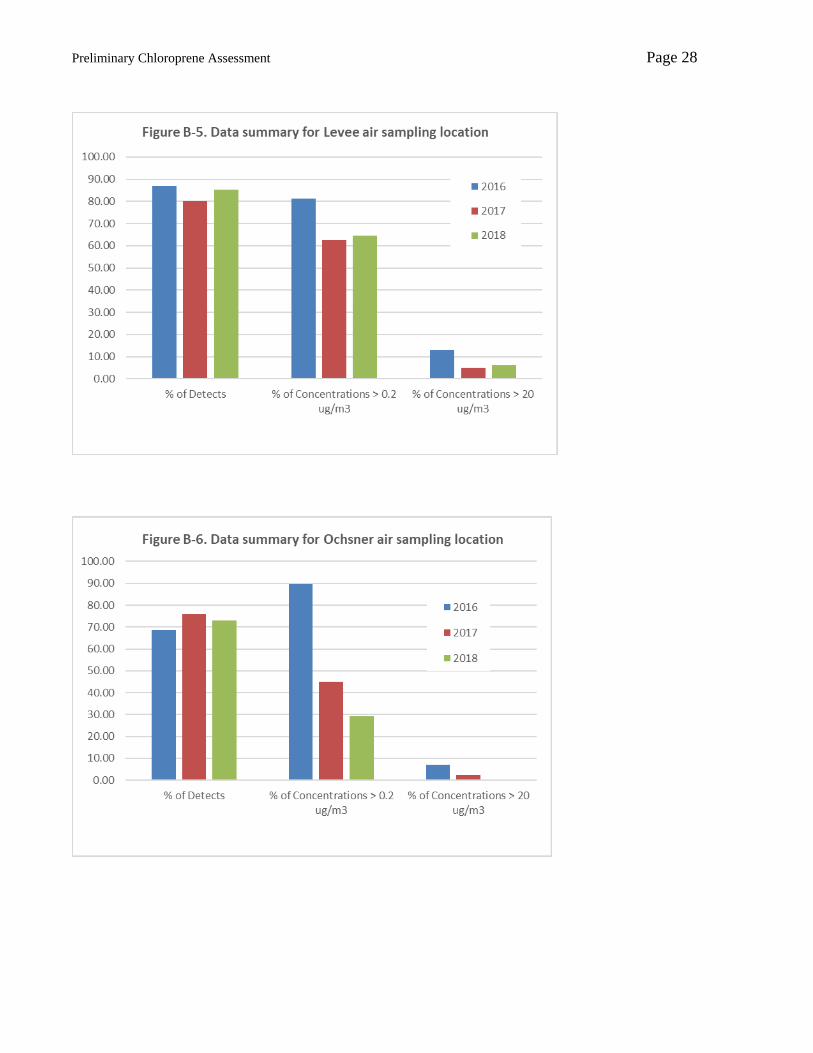
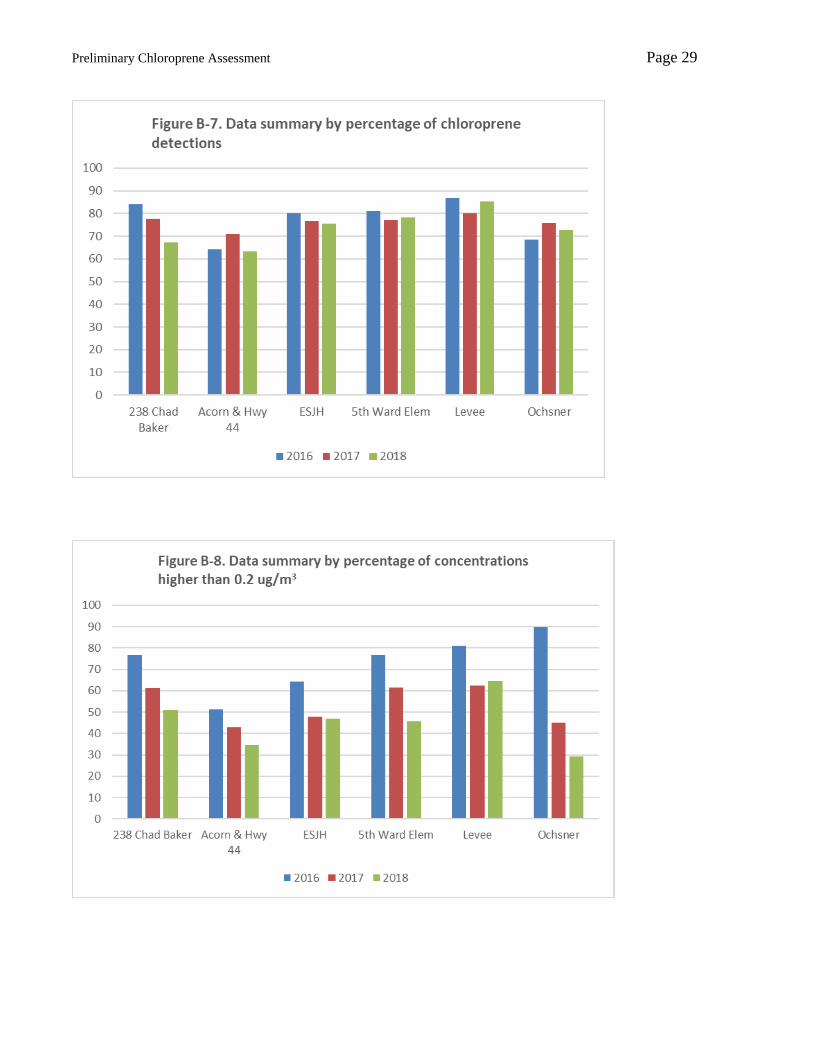
Figures B-1 through B-6 display the following information for each air sampling site:
• the percentages of samples in which chloroprene was found at levels above the method
detection limit at each location,
• the percentage of samples with chloroprene concentrations below the non-cancer
comparison value (20 ug/m3 ), and
• the percentage of samples with chloroprene concentrations below the EPA’s 100-in-1
million preliminary cancer risk-based comparison level (0.2 ug/m3 ).
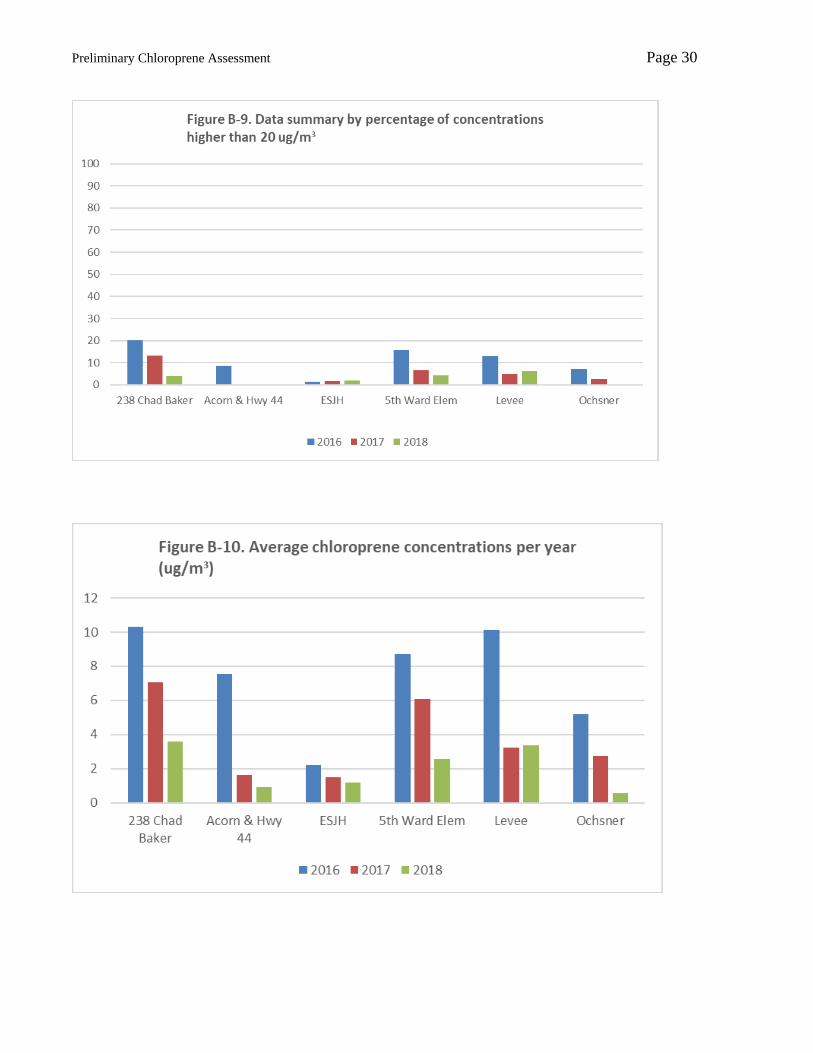
Figures B-7 – B-9 summarize the above mentioned information across all of the air sampling
sites.
Figure B-10 displays the average chloroprene concentrations at each site from 2016-2018.
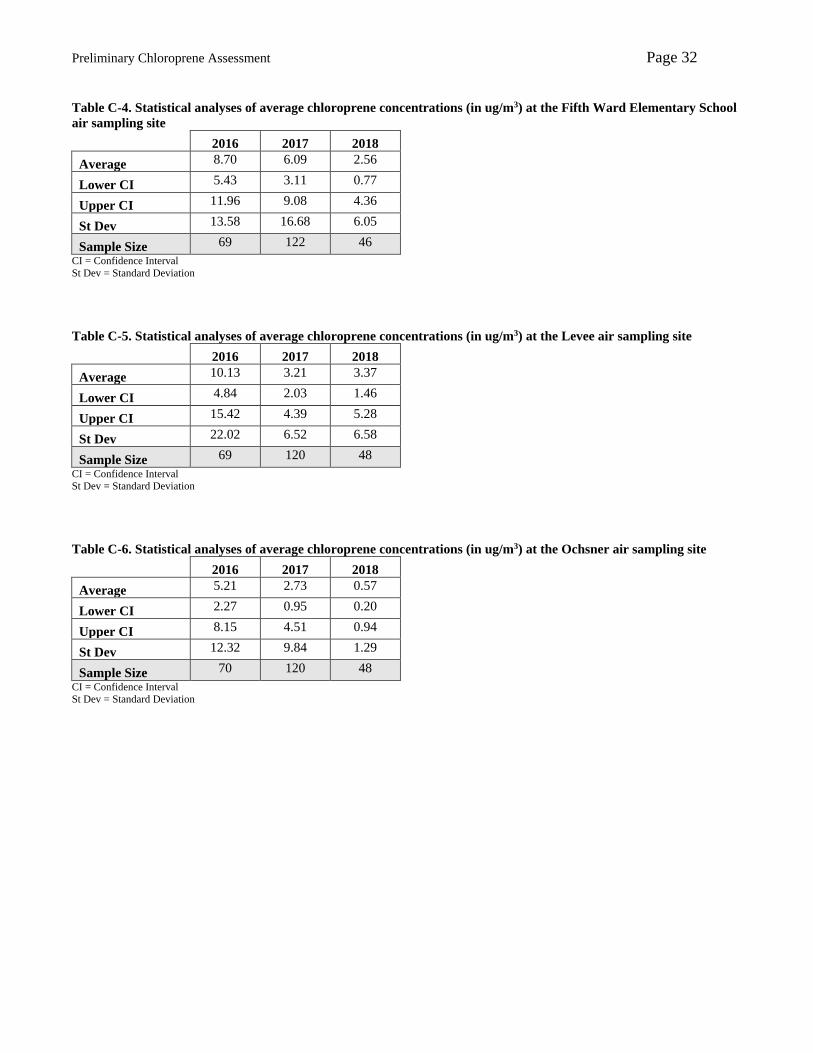
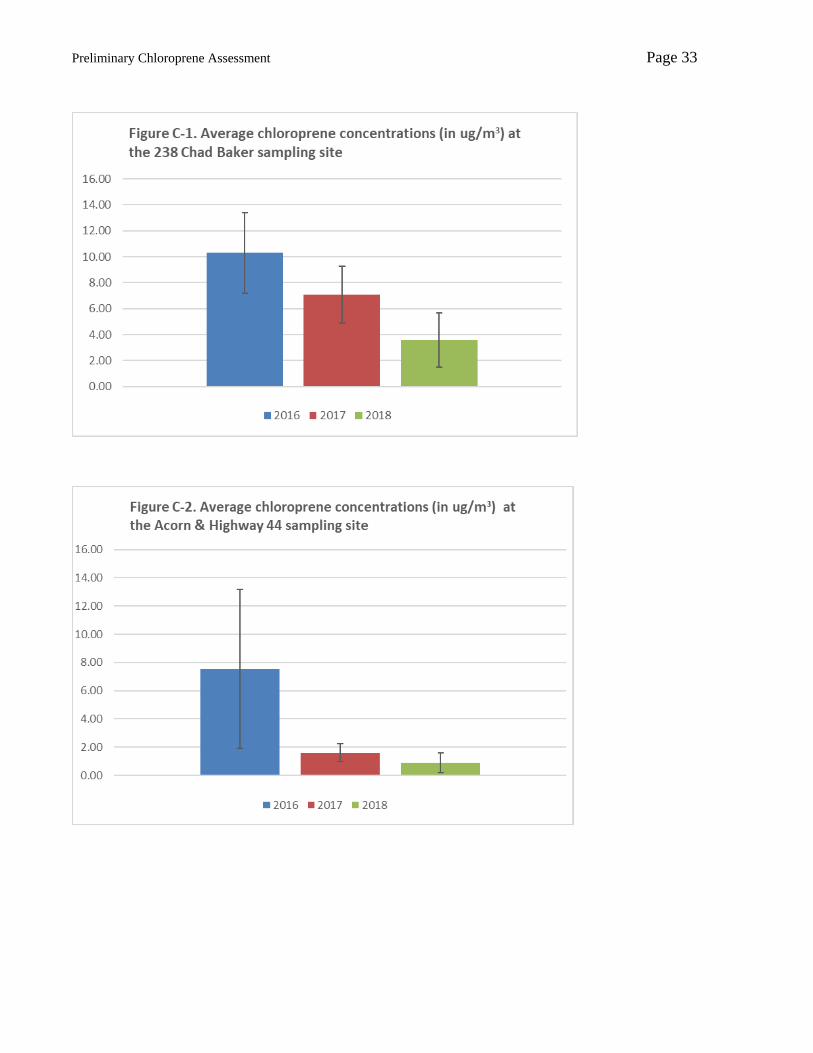
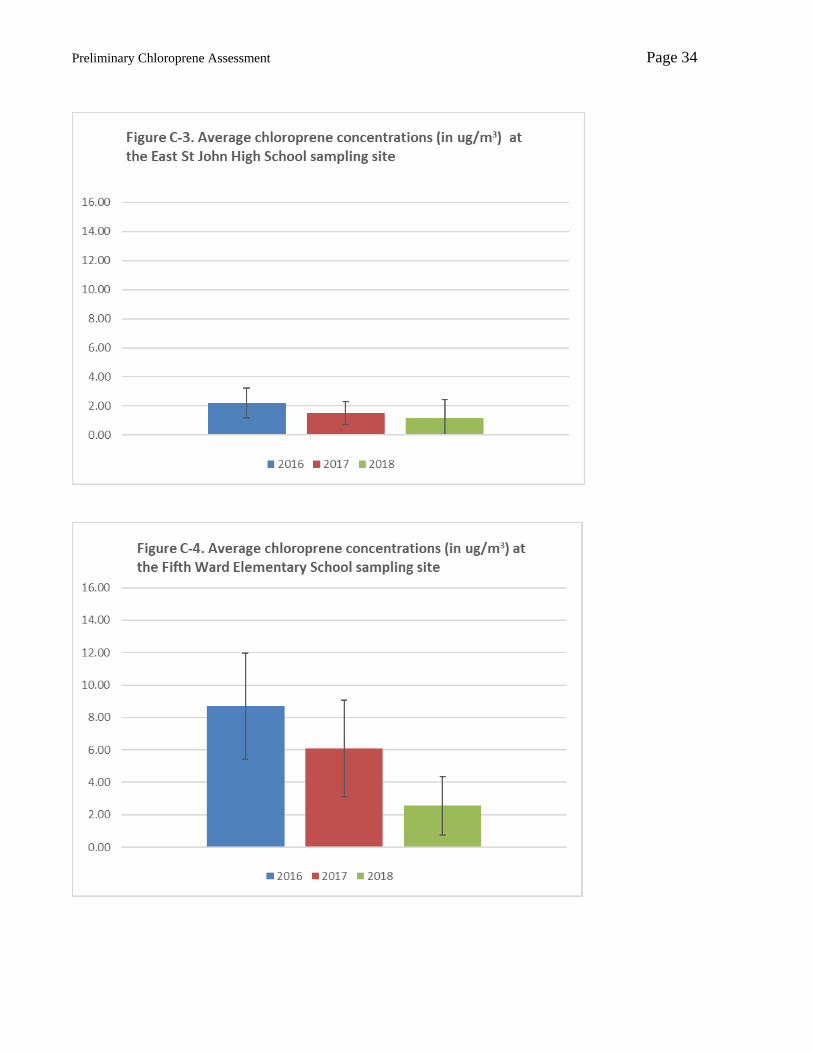
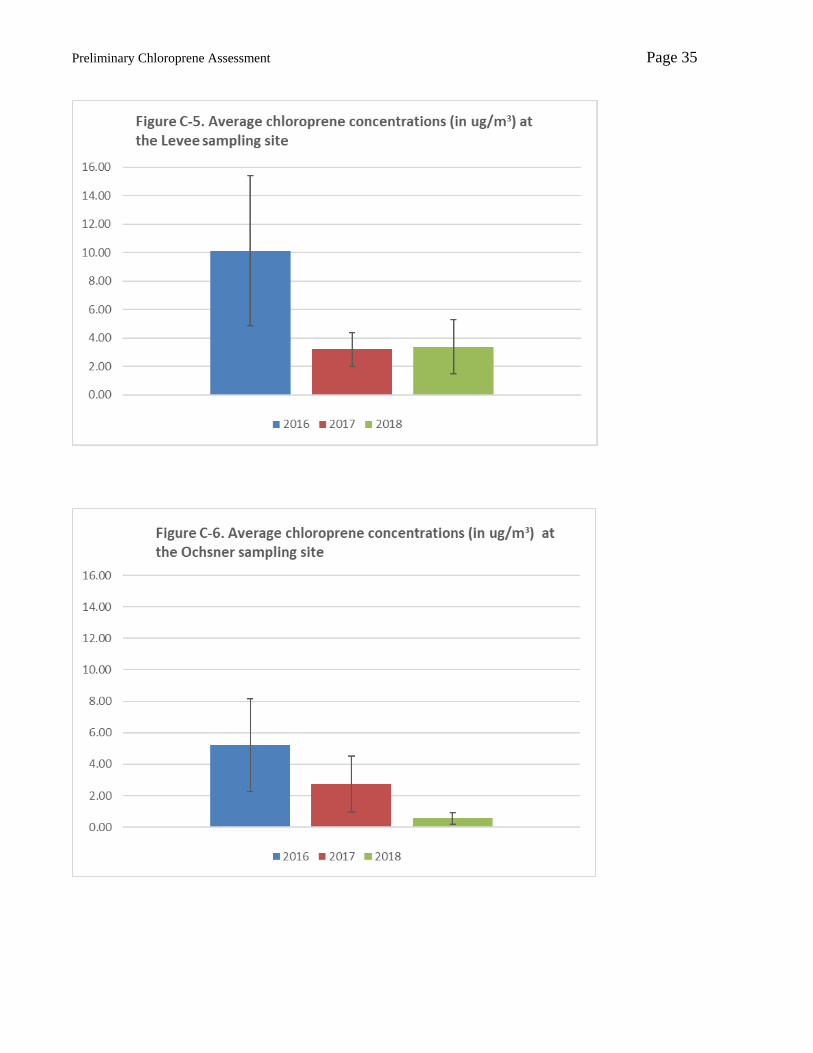
Statistical analyses of chloroprene concentrations measured at each sampling site are included in
Appendix C. Tables C-1 to C-6 and Figures C-1 to C-6 display the averages for each site during each
year, with the confidence interval whiskers on each bar marking the range of values that are certain to
contain the true mean 95% of the time. A trend of decreasing chloroprene concentrations in ambient air
was observed at all sites from the initial sampling year (2016) until 2018. LDH cannot predict how
chloroprene concentrations will continue to trend in the community as more data is collected.
Toxicology Evaluation
Chloroprene (2-chlorobutadiene): Much of the toxicological information on chloroprene is derived from
occupational exposures in workers. The Occupational Safety and Health Administration (OSHA) time
weighed average (TWA) is 25 parts per million (ppm) (90,500 ug/m3) (skin); the American Conference
of Governmental Industrial Hygienists (ACGIH) has a 10 ppm (36,200 ug/m3) threshold limit value-time
weighed average (TLV-TWA); and the National Institute for Occupational Safety and Health (NIOSH)
recommended exposure limit (REL) is 1 ppm (3,620 ug/m3). Acute (short term) occupational exposures
above the standards may cause headache, irritability, giddiness, dizziness, respiratory irritation, nausea,
gastrointestinal disorders, skin and eye irritation and fatigue in workers. Chronic exposures (longer
Preliminary Chloroprene Assessment Page 9
term) in the work place in ppm concentration levels may contribute to liver function abnormalities,
disorders of the cardiovascular system and depression of the immune system. Animal studies have
found an increased risk of tumors and are the evidence for the classification of chloroprene as a likely
carcinogen. The few studies on the carcinogenic effects in humans are inconclusive because of co-
exposure to other occupational chemicals, smoking, and other risk factors for cancer.
For non-occupational exposures, EPA derives a chronic RfC (reference concentration) for continuous
inhalation exposure to the human population (including sensitive subgroups) that is likely to be without
an appreciable risk of deleterious effects during a lifetime. Animal studies that derived a LOAEL
(lowest observed adverse effect level) was determined to be 12.8 ppm (46.3 mg/m3). The RfC was
derived using a 10% benchmark dose (BMD) of 2 mg/m3 (5.5 ppm) to which uncertainty factors, lack of
data, and interspecies extrapolations of 100 were applied to derived the RfC of 0.02 mg/m3 or 20 ug/m3
(55 ppb).
When inhaled, chloroprene enters the body through the respiratory system, is absorbed into the
bloodstream, and distributed throughout the body. Chloroprene is rapidly metabolized, which makes it
difficult to measure in the body. During metabolism, chloroprene may generate reactive intermediates
that are a mechanism of its toxicity and are a factor in its being considered a potential carcinogen. There
are insufficient data on the toxicokinetics to describe how chloroprene acts in the body.
Chloroprene is oxidized in the liver through the cytochrome P-450 system (CYP2E1) to form a
monoepoxide free radical which is the reactive intermediate which may react for the carcinogenic
effects. Further metabolism serves to detoxify the reactive intermediate: epoxide hydrolase rapidly
hydrolyzes the epoxide to much less toxic metabolites; these metabolites are then rapidly conjugated
with glutathione to form the 3-chloro-2-hydroxy-3-butenyl mercapturic acid (Cl-MA III) which is a
unique metabolite of chloroprene. Other chloroprene metabolites such as DHBMA (3,4-
dihyrdroxybutyl-MA) and HOBMA (4-hydroxy-3-oxybutyl–MA) are also metabolites of butadiene and
other compounds that are found in cigarette smoke and gasoline.
These metabolites are excreted in urine. The urinary metabolites may serve as biomarkers to indicate
exposure to chloroprene but are not biomarkers of effect or indications of potential damage that may
result in a cell mutation in future years. The Cl-MA III is a metabolic conjugate of chloroprene that has
been detoxified and excreted.
The concentrations of chloroprene detected in air monitoring in St. John the Baptist parish are in the
parts per billion (ppb) range and more than 1000 times less (10-3) than occupational levels and
concentrations used in the animal studies. At this low level, health effects (including cancer) will not be
directly observed in people. For this reason, risk assessment modeling is used to provide information to
regulatory agencies for determining standards and remedial actions. Risk assessment modeling does not
provide information on the prediction or estimation of direct effects, but is a useful tool for comparison
of risks using standardized conditions.
Preliminary Chloroprene Assessment Page 10
Cancer Statistics Reviews
In a previous Letter Health Consultation dated March 2, 2018, LDH evaluated the Louisiana Tumor
Registry’s (LTR) cancer rate incidence data (1988-2014) for St. John the Baptist Parish for lung and
liver cancers, which are both related to chloroprene exposure. Overall, cancer incidence rates of the lung
and liver in St. John the Baptist Parish from 1988-2014 did not differ significantly from those in
Louisiana [8].
Act 373 of the 2017 Louisiana Legislative Session requires that the Louisiana Tumor Registry deliver
yearly census tract data to local parish governments. Upon review of this recently published census tract
cancer incidence data (March 2018) for St. John the Baptist Parish, all cancers combined and prostate
cancer have significantly higher incidence rates than state rates for the years 2006-2014 based on the
Census 2010 state population. Prostate cancer is not related to chloroprene exposure [9]. The cancer
incidence rates for all cancers combined is not very useful for explaining or exploring potential
etiologies since there are many known risk factors for cancer such as smoking, occupational exposures,
etc. that are not controlled in the cancer incidence rates
Risk Assessment for Elementary School Students
Methodology
ATSDR’s Partnership to Promote Local Efforts to Reduce Environmental Exposure (APPLETREE)
Program Project Officer arranged a conference call between LDH, DEQ, and two ATSDR Air Subject
Matter Experts. Factors influencing air monitoring and data limitations were discussed. The lack of
sample points since the implementation of emissions controls was emphasized. Following the call, LDH
reached out to EPA Region 6 to request an increase in the frequency of community air monitoring. In
addition to the phone consultation on the limited air monitoring dataset, ATSDR has been providing
technical support on the evaluation and interpretation of cancer incidence data.
The Ambient Air Standard listed for chloroprene (classified as a Louisiana Toxic Air Pollutant, or TAP)
under the Louisiana Administrative Code is 857 ug/m3 (an 8-hour average) [10].
The EPA has established a non-cancer comparison value for long-term exposure of 20 ug/m3. A
continuous inhalation exposure to chloroprene at this concentration for humans, including sensitive
individuals, is likely to be without a significant risk of harmful effects during a lifetime. Assessment of
non-cancer health risks was not evaluated because ambient chloroprene concentrations in the community
surrounding the Denka facility did not exceed 20 ug/m3 for prolonged periods of time during the March-
May 2018 interval.
Assessment of the theoretical excess cancer risks posed to elementary school students in the community
surrounding the Denka facility were performed using data limited to the March – May 2018 sampling
Preliminary Chloroprene Assessment Page 11
events. Although installation of the emissions controls was completed in December 2017, the upgraded
system was not fully functional until March 2018.
To determine whether concentrations of chloroprene detected in ambient air in LaPlace, LA would
increase an individual’s risk of developing cancer, LDH estimated the excess cancer risk for exposure to
the reported chloroprene sampling result concentrations. The theoretical excess cancer risk represents
the increase in the probability of an individual developing cancer as a result of being exposed to a
contaminant over a lifetime. Because of the uncertainties involved in estimating carcinogenic risk, a
weight-of-evidence approach is used to describe carcinogenic risk in words as well as numeric terms.
The results of the carcinogenic risk calculations estimate the worst-case maximum increase in the risk of
developing cancer after exposure to the contaminant. This estimation is accurate within one order of
magnitude greater or less than calculated. In other words, a calculated cancer risk of 2 excess cancers
per 10,000 people might actually be 2 excess cancers per 1,000 people or 2 excess cancers per 100,000
people. The lifetime excess cancer risk of 10-4 (or 1.0E-04), which is 1 excess cancer per 10,000 people,
is the upper bound of the range used by EPA’s Superfund program to make decisions about the need to
take action at contaminated sites . Estimates of theoretical cancer risks that fall below 1.0E-06 (or one in
1,000,000) are considered to pose no significant increase in cancer risk [11].
The increases in theoretical excess cancer risk potentially associated with exposures to chloroprene in
the community were estimated separately for children attending school at the current Fifth Ward
Elementary School campus and for children attending school at another location within the parish. To
ensure that sufficient data points were available for evaluation, the ambient air data collected by EPA
from March–May 2018 was separated into two “campus locations”, excluding the Acorn & Highway 44
location:
1. Data from the three air sampling sites closest to the Denka facility, 238 Chad Baker, Fifth Ward
Elementary School, and Mississippi River Levee, were combined to represent exposures for
students at the current Fifth Ward Elementary School campus,
2. Data from the two sites furthest from the Denka facility, East St. John High School and Ochsner
Hospital, were chosen to represent exposures for students attending schools at another location.
For the purpose of this assessment, the other location is identified as East St John Elementary
School, which is the campus located between these two monitors
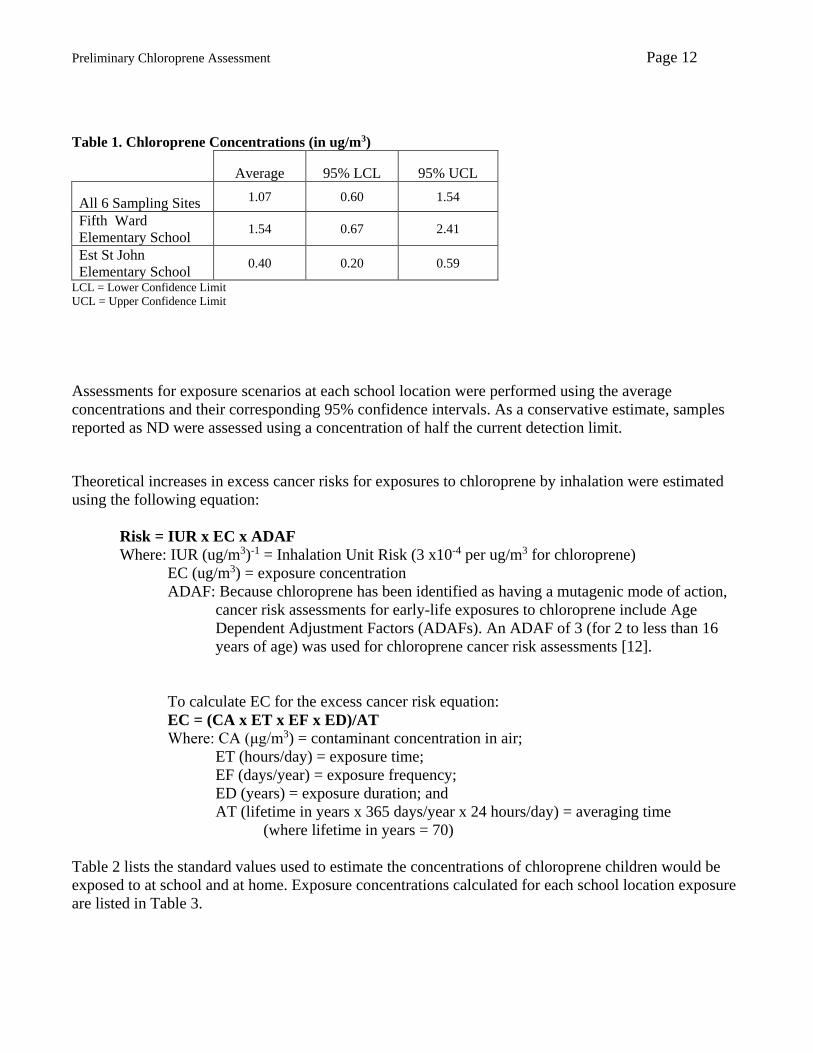
Chloroprene concentrations averaged for each campus location were used to calculate exposure
concentrations for children during school hours at each location; all other exposure concentrations were
calculated using averages from all six sampling sites in the community. Table 1 lists the concentrations
and lower and upper 95% confidence limits used for risk assessment at each school location and for all
six sampling sites together.
Preliminary Chloroprene Assessment Page 12
Table 1. Chloroprene Concentrations (in ug/m3)
Average 95% LCL 95% UCL
All 6 Sampling Sites 1.07 0.60 1.54
Fifth Ward
Elementary School 1.54 0.67 2.41
Est St John
Elementary School 0.40 0.20 0.59
LCL = Lower Confidence Limit
UCL = Upper Confidence Limit
Assessments for exposure scenarios at each school location were performed using the average
concentrations and their corresponding 95% confidence intervals. As a conservative estimate, samples
reported as ND were assessed using a concentration of half the current detection limit.
Theoretical increases in excess cancer risks for exposures to chloroprene by inhalation were estimated
using the following equation:
Risk = IUR x EC x ADAF
Where: IUR (ug/m3)-1 = Inhalation Unit Risk (3 x10⁻⁴ per ug/m3 for chloroprene)
EC (ug/m3) = exposure concentration
ADAF: Because chloroprene has been identified as having a mutagenic mode of action,
cancer risk assessments for early-life exposures to chloroprene include Age
Dependent Adjustment Factors (ADAFs). An ADAF of 3 (for 2 to less than 16
years of age) was used for chloroprene cancer risk assessments [12].
To calculate EC for the excess cancer risk equation:
EC = (CA x ET x EF x ED)/AT
Where: CA (μg/m3) = contaminant concentration in air;
ET (hours/day) = exposure time;
EF (days/year) = exposure frequency;
ED (years) = exposure duration; and
AT (lifetime in years x 365 days/year x 24 hours/day) = averaging time
(where lifetime in years = 70)
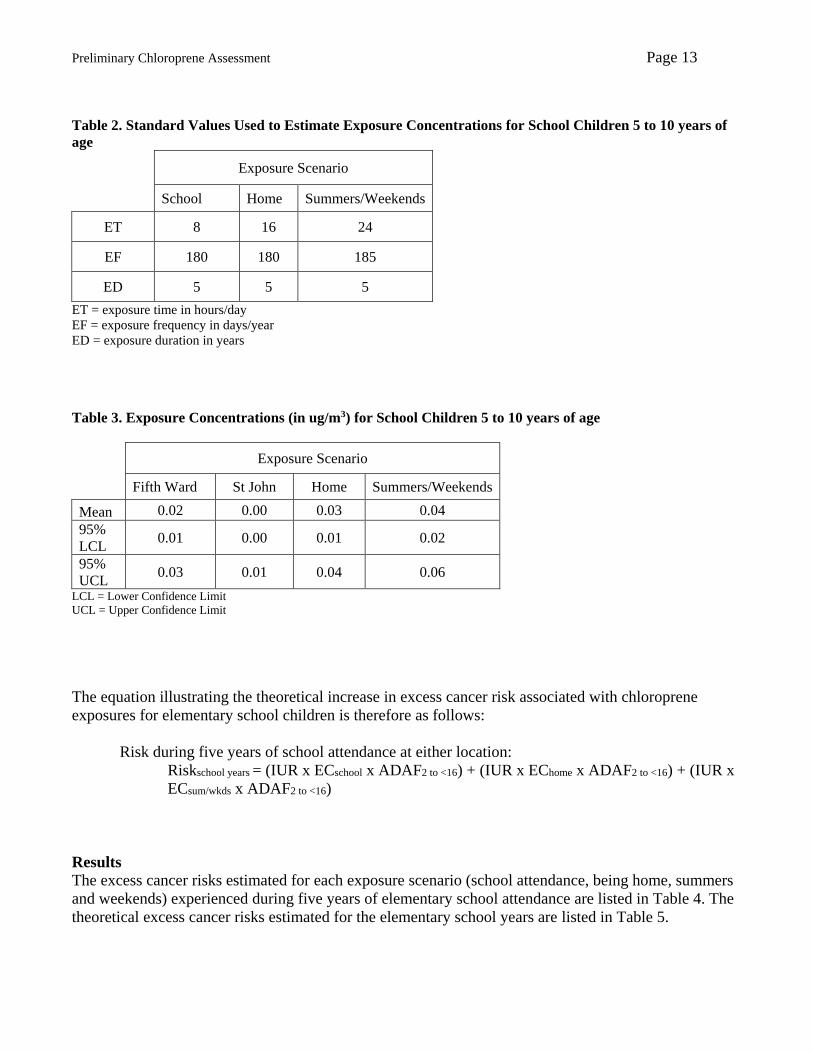
Table 2 lists the standard values used to estimate the concentrations of chloroprene children would be
exposed to at school and at home. Exposure concentrations calculated for each school location exposure
are listed in Table 3.
Preliminary Chloroprene Assessment Page 13
Table 2. Standard Values Used to Estimate Exposure Concentrations for School Children 5 to 10 years of
age
Exposure Scenario
School Home Summers/Weekends
ET 8 16 24
EF 180 180 185
ED 5 5 5
ET = exposure time in hours/day
EF = exposure frequency in days/year
ED = exposure duration in years
Table 3. Exposure Concentrations (in ug/m3) for School Children 5 to 10 years of age
Exposure Scenario
Fifth Ward St John Home Summers/Weekends
Mean 0.02 0.00 0.03 0.04
95%
LCL 0.01 0.00 0.01 0.02
95%
UCL 0.03 0.01 0.04 0.06
LCL = Lower Confidence Limit
UCL = Upper Confidence Limit
The equation illustrating the theoretical increase in excess cancer risk associated with chloroprene
exposures for elementary school children is therefore as follows:
Risk during five years of school attendance at either location:
Riskschool years = (IUR x ECschool x ADAF2 to <16) + (IUR x EChome x ADAF2 to <16) + (IUR x
ECsum/wkds x ADAF2 to <16)
Results
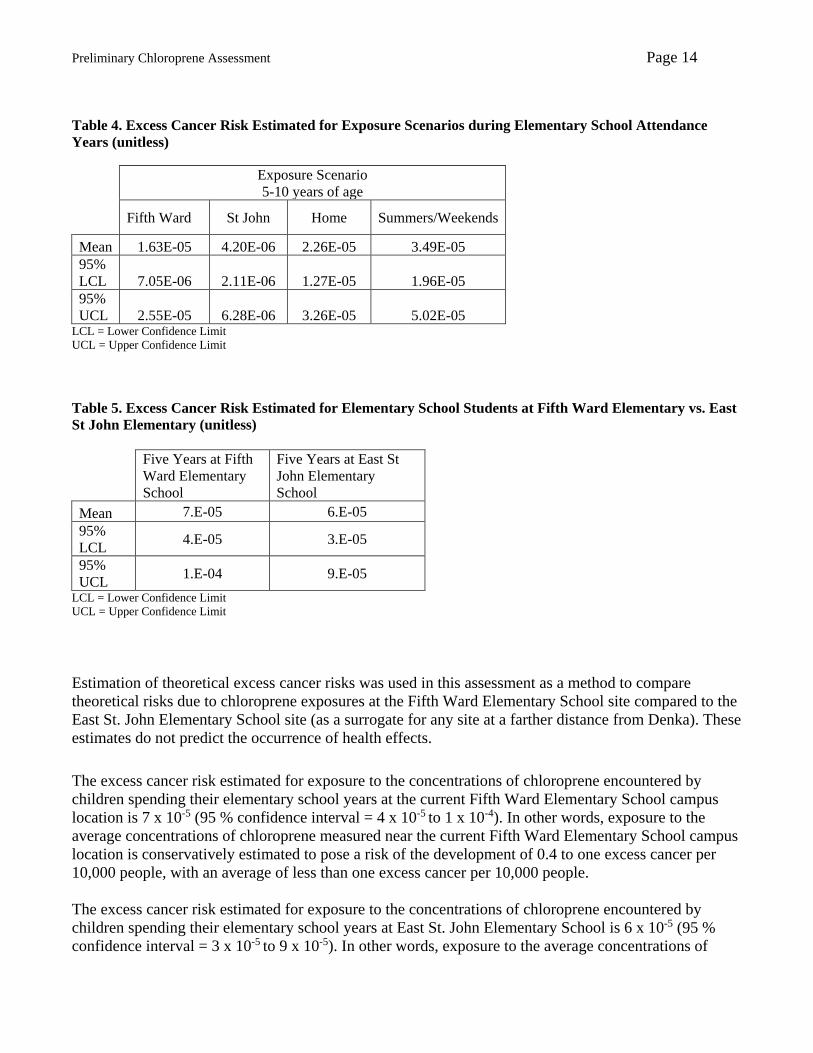
The excess cancer risks estimated for each exposure scenario (school attendance, being home, summers
and weekends) experienced during five years of elementary school attendance are listed in Table 4. The
theoretical excess cancer risks estimated for the elementary school years are listed in Table 5.
Preliminary Chloroprene Assessment Page 14
Table 4. Excess Cancer Risk Estimated for Exposure Scenarios during Elementary School Attendance
Years (unitless)
Exposure Scenario
5-10 years of age
Fifth Ward St John Home Summers/Weekends
Mean 1.63E-05 4.20E-06 2.26E-05 3.49E-05
95%
LCL 7.05E-06 2.11E-06 1.27E-05 1.96E-05
95%
UCL 2.55E-05 6.28E-06 3.26E-05 5.02E-05 LCL = Lower Confidence Limit
UCL = Upper Confidence Limit
Table 5. Excess Cancer Risk Estimated for Elementary School Students at Fifth Ward Elementary vs. East
St John Elementary (unitless)
Five Years at Fifth
Ward Elementary
School
Five Years at East St
John Elementary
School
Mean 7.E-05 6.E-05
95%
LCL 4.E-05 3.E-05
95%
UCL 1.E-04 9.E-05
LCL = Lower Confidence Limit
UCL = Upper Confidence Limit
Estimation of theoretical excess cancer risks was used in this assessment as a method to compare
theoretical risks due to chloroprene exposures at the Fifth Ward Elementary School site compared to the
East St. John Elementary School site (as a surrogate for any site at a farther distance from Denka). These
estimates do not predict the occurrence of health effects. The excess cancer risk estimated for exposure to the concentrations of chloroprene encountered by
children spending their elementary school years at the current Fifth Ward Elementary School campus
location is 7 x 10⁻⁵ (95 % confidence interval = 4 x 10⁻⁵ to 1 x 10⁻⁴). In other words, exposure to the
average concentrations of chloroprene measured near the current Fifth Ward Elementary School campus
location is conservatively estimated to pose a risk of the development of 0.4 to one excess cancer per
10,000 people, with an average of less than one excess cancer per 10,000 people.
The excess cancer risk estimated for exposure to the concentrations of chloroprene encountered by
children spending their elementary school years at East St. John Elementary School is 6 x 10⁻⁵ (95 %
confidence interval = 3 x 10⁻⁵ to 9 x 10⁻⁵). In other words, exposure to the average concentrations of
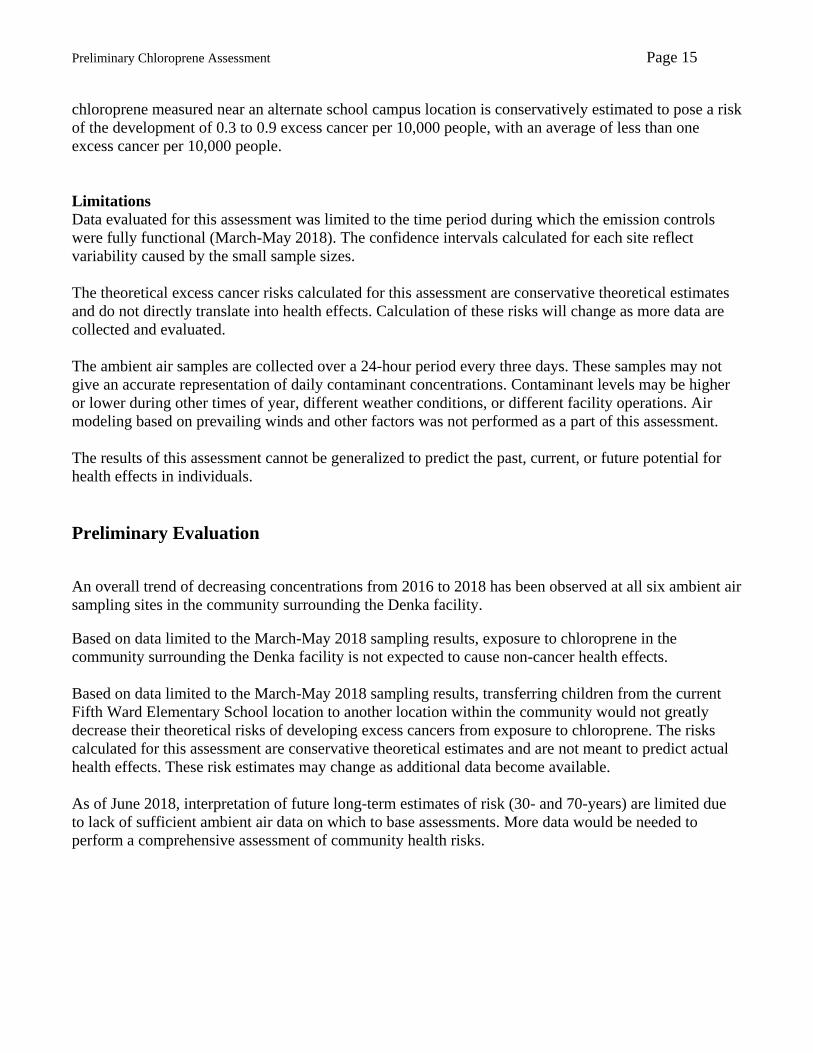
Preliminary Chloroprene Assessment Page 15
chloroprene measured near an alternate school campus location is conservatively estimated to pose a risk
of the development of 0.3 to 0.9 excess cancer per 10,000 people, with an average of less than one
excess cancer per 10,000 people.
Limitations
Data evaluated for this assessment was limited to the time period during which the emission controls
were fully functional (March-May 2018). The confidence intervals calculated for each site reflect
variability caused by the small sample sizes.
The theoretical excess cancer risks calculated for this assessment are conservative theoretical estimates
and do not directly translate into health effects. Calculation of these risks will change as more data are
collected and evaluated.
The ambient air samples are collected over a 24-hour period every three days. These samples may not
give an accurate representation of daily contaminant concentrations. Contaminant levels may be higher
or lower during other times of year, different weather conditions, or different facility operations. Air
modeling based on prevailing winds and other factors was not performed as a part of this assessment.
The results of this assessment cannot be generalized to predict the past, current, or future potential for
health effects in individuals.
Preliminary Evaluation
An overall trend of decreasing concentrations from 2016 to 2018 has been observed at all six ambient air
sampling sites in the community surrounding the Denka facility.
Based on data limited to the March-May 2018 sampling results, exposure to chloroprene in the
community surrounding the Denka facility is not expected to cause non-cancer health effects.
Based on data limited to the March-May 2018 sampling results, transferring children from the current
Fifth Ward Elementary School location to another location within the community would not greatly
decrease their theoretical risks of developing excess cancers from exposure to chloroprene. The risks
calculated for this assessment are conservative theoretical estimates and are not meant to predict actual
health effects. These risk estimates may change as additional data become available.
As of June 2018, interpretation of future long-term estimates of risk (30- and 70-years) are limited due
to lack of sufficient ambient air data on which to base assessments. More data would be needed to
perform a comprehensive assessment of community health risks.
Preliminary Chloroprene Assessment Page 16
References
1. United States Environmental Protection Agency. LaPlace, Louisiana – Background Information.
EPA in Louisiana website. Accessed 2017 July 18 at: https://www.epa.gov/la/laplace-louisiana-
background-information .
2. Louisiana Department of Environmental Quality. “LDEQ and Denka sign AOC designed to
reduce chloroprene emissions at LaPlace facility”. Water News, LDEQ Newsroom. 2017 Jan.
Accessed 2017 July 20 at: http://deq.louisiana.gov/news/ldeq-and-denka-sign-aoc-designed-to-
reduce-chloroprene-emissions-at-laplace-facility .
3. United States Environmental Protection Agency. “Action Plan: Denka Performance Elastomer,
LLC – Pontchartrain Facility (formerly the Dupont Neoprene Facility, Pontchartrain Works)”.
2016 June. Accessed 2018 June 1 at: https://www.epa.gov/sites/production/files/2016-
06/documents/epa-laplace-action-plan.pdf
4. United States Environmental Protection Agency. Toxicological Review of Chloroprene (CAS No.
126-99-8). In Support of Summary Information on the Integrated Risk Information System (IRIS).
EPA/635/R-09/01F. U.S. Environmental Protection Agency, Washington, DC. 2010 Sept.
Accessed 2017 July 19 at: http://www.epa.gov/iris/toxreviews/1021tr.pdf .
5. United States Environmental Protection Agency. “Memorandum: Evaluation of Ambient Air
Sampling Results From Areas Surrounding the Denka/DuPont Facility in LaPlace, LA in March
2016”. Accessed 2017 July 19 at: https://www.epa.gov/sites/production/files/2016-
06/documents/laplace-prelim-sampling-results051016.pdf .
6. United States Environmental Protection Agency. “Ambient Air Sampling/Monitoring Plan for
Chloroprene in the Area Near Denka Performance Elastomer Pontchartrain Facility, LaPlace,
Louisiana (Formerly the DuPont Neoprene Facility, Pontchartrain Works)”. 2016 May. Accessed
2017 July 19 at: https://www.epa.gov/sites/production/files/2016-
07/documents/final_ambient_air_monitoring_plan_for_dpe_laplace_la_may_2016.pdf .
7. United States Census Bureau. “St John the Baptist Louisiana Quick Facts 2017”.
8. Louisiana Department of Health. “Denka Letter Health Consult – Cancer Review”. 2018 March
3.
9. Louisiana Tumor Registry. Cancer Incidence in Louisiana by Census Tract: 2006 – 2014. 2018
March. Accessed 2018 Jun 4 at: https://sph.lsuhsc.edu/wp-content/uploads/2018/04/01_Cancer-
Incidence-in-Louisiana-by-Census-Tract-2006-2014.pdf
10. Louisiana Administrative Code Title 33: Environmental Quality Part III: Air. Section 5112-Table
51.2. 2014 April. Accessed 2018 June 11 at:
Preliminary Chloroprene Assessment Page 17
http://deq.louisiana.gov/assets/docs/Air/Asbestos/AsbestosRegulations.pdf .
11. Agency for Toxic Substances and Disease Registry. Cancer policy framework. Atlanta: US
Department of Health and Human Services; 1993.
12. US EPA. Risk Assessment Guidance for Superfund: Volume I - Human Health Evaluation
Manual (Part B, Development of Risk-based Preliminary Remediation Goals). Accessed 2018
May 31 at http://epa-prgs.ornl.gov/radionuclides/HHEMB.pdf .
Preliminary Chloroprene Assessment Page 18
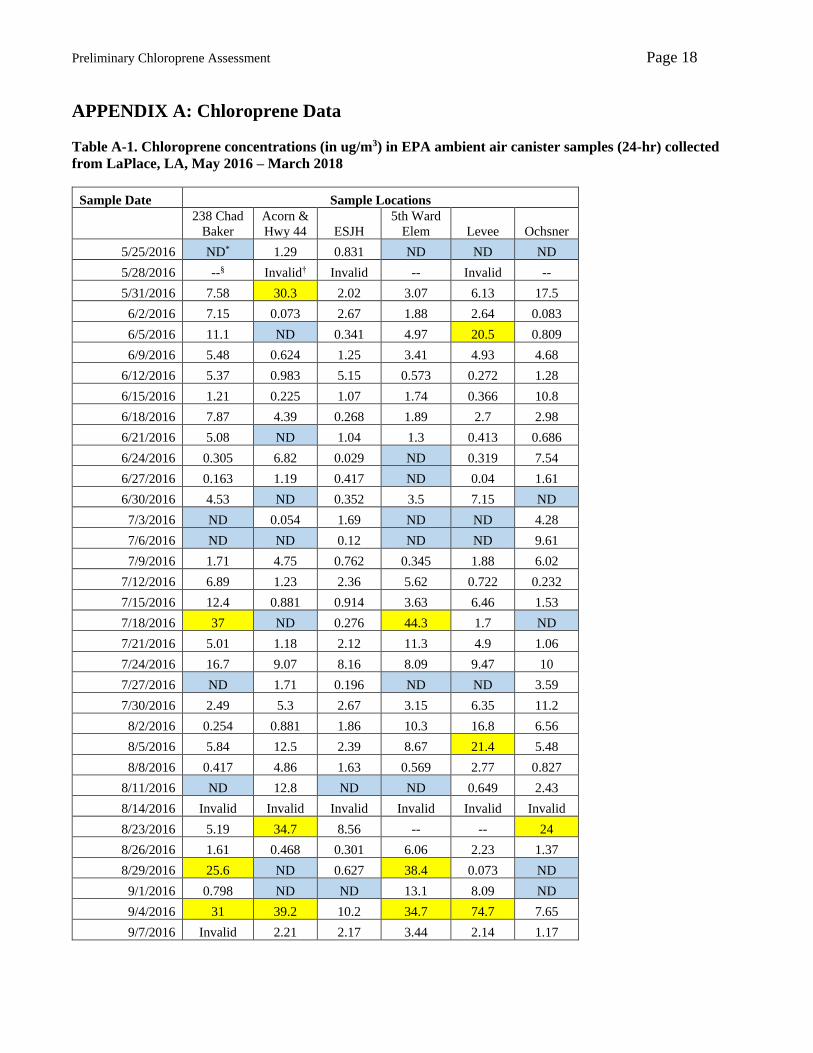
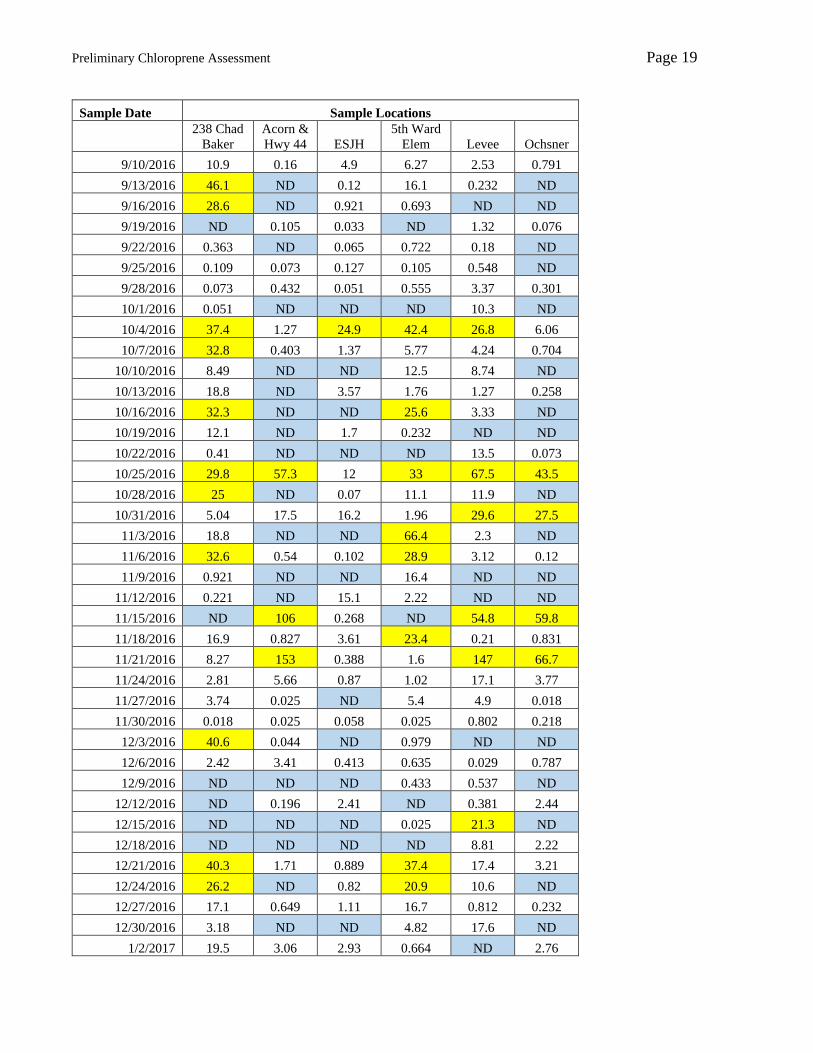
APPENDIX A: Chloroprene Data
Table A-1. Chloroprene concentrations (in ug/m3) in EPA ambient air canister samples (24-hr) collected
from LaPlace, LA, May 2016 – March 2018
Sample Date Sample Locations
238 Chad
Baker
Acorn &
Hwy 44 ESJH
5th Ward
Elem Levee Ochsner
5/25/2016 ND* 1.29 0.831 ND ND ND
5/28/2016 --§ Invalid† Invalid -- Invalid --
5/31/2016 7.58 30.3 2.02 3.07 6.13 17.5
6/2/2016 7.15 0.073 2.67 1.88 2.64 0.083
6/5/2016 11.1 ND 0.341 4.97 20.5 0.809
6/9/2016 5.48 0.624 1.25 3.41 4.93 4.68
6/12/2016 5.37 0.983 5.15 0.573 0.272 1.28
6/15/2016 1.21 0.225 1.07 1.74 0.366 10.8
6/18/2016 7.87 4.39 0.268 1.89 2.7 2.98
6/21/2016 5.08 ND 1.04 1.3 0.413 0.686
6/24/2016 0.305 6.82 0.029 ND 0.319 7.54
6/27/2016 0.163 1.19 0.417 ND 0.04 1.61
6/30/2016 4.53 ND 0.352 3.5 7.15 ND
7/3/2016 ND 0.054 1.69 ND ND 4.28
7/6/2016 ND ND 0.12 ND ND 9.61
7/9/2016 1.71 4.75 0.762 0.345 1.88 6.02
7/12/2016 6.89 1.23 2.36 5.62 0.722 0.232
7/15/2016 12.4 0.881 0.914 3.63 6.46 1.53
7/18/2016 37 ND 0.276 44.3 1.7 ND
7/21/2016 5.01 1.18 2.12 11.3 4.9 1.06
7/24/2016 16.7 9.07 8.16 8.09 9.47 10
7/27/2016 ND 1.71 0.196 ND ND 3.59
7/30/2016 2.49 5.3 2.67 3.15 6.35 11.2
8/2/2016 0.254 0.881 1.86 10.3 16.8 6.56
8/5/2016 5.84 12.5 2.39 8.67 21.4 5.48
8/8/2016 0.417 4.86 1.63 0.569 2.77 0.827
8/11/2016 ND 12.8 ND ND 0.649 2.43
8/14/2016 Invalid Invalid Invalid Invalid Invalid Invalid
8/23/2016 5.19 34.7 8.56 -- -- 24
8/26/2016 1.61 0.468 0.301 6.06 2.23 1.37
8/29/2016 25.6 ND 0.627 38.4 0.073 ND
9/1/2016 0.798 ND ND 13.1 8.09 ND
9/4/2016 31 39.2 10.2 34.7 74.7 7.65
9/7/2016 Invalid 2.21 2.17 3.44 2.14 1.17
Preliminary Chloroprene Assessment Page 19
Sample Date Sample Locations
238 Chad
Baker
Acorn &
Hwy 44 ESJH
5th Ward
Elem Levee Ochsner
9/10/2016 10.9 0.16 4.9 6.27 2.53 0.791
9/13/2016 46.1 ND 0.12 16.1 0.232 ND
9/16/2016 28.6 ND 0.921 0.693 ND ND
9/19/2016 ND 0.105 0.033 ND 1.32 0.076
9/22/2016 0.363 ND 0.065 0.722 0.18 ND
9/25/2016 0.109 0.073 0.127 0.105 0.548 ND
9/28/2016 0.073 0.432 0.051 0.555 3.37 0.301
10/1/2016 0.051 ND ND ND 10.3 ND
10/4/2016 37.4 1.27 24.9 42.4 26.8 6.06
10/7/2016 32.8 0.403 1.37 5.77 4.24 0.704
10/10/2016 8.49 ND ND 12.5 8.74 ND
10/13/2016 18.8 ND 3.57 1.76 1.27 0.258
10/16/2016 32.3 ND ND 25.6 3.33 ND
10/19/2016 12.1 ND 1.7 0.232 ND ND
10/22/2016 0.41 ND ND ND 13.5 0.073
10/25/2016 29.8 57.3 12 33 67.5 43.5
10/28/2016 25 ND 0.07 11.1 11.9 ND
10/31/2016 5.04 17.5 16.2 1.96 29.6 27.5
11/3/2016 18.8 ND ND 66.4 2.3 ND
11/6/2016 32.6 0.54 0.102 28.9 3.12 0.12
11/9/2016 0.921 ND ND 16.4 ND ND
11/12/2016 0.221 ND 15.1 2.22 ND ND
11/15/2016 ND 106 0.268 ND 54.8 59.8
11/18/2016 16.9 0.827 3.61 23.4 0.21 0.831
11/21/2016 8.27 153 0.388 1.6 147 66.7
11/24/2016 2.81 5.66 0.87 1.02 17.1 3.77
11/27/2016 3.74 0.025 ND 5.4 4.9 0.018
11/30/2016 0.018 0.025 0.058 0.025 0.802 0.218
12/3/2016 40.6 0.044 ND 0.979 ND ND
12/6/2016 2.42 3.41 0.413 0.635 0.029 0.787
12/9/2016 ND ND ND 0.433 0.537 ND
12/12/2016 ND 0.196 2.41 ND 0.381 2.44
12/15/2016 ND ND ND 0.025 21.3 ND
12/18/2016 ND ND ND ND 8.81 2.22
12/21/2016 40.3 1.71 0.889 37.4 17.4 3.21
12/24/2016 26.2 ND 0.82 20.9 10.6 ND
12/27/2016 17.1 0.649 1.11 16.7 0.812 0.232
12/30/2016 3.18 ND ND 4.82 17.6 ND
1/2/2017 19.5 3.06 2.93 0.664 ND 2.76
Preliminary Chloroprene Assessment Page 20
Sample Date Sample Locations
238 Chad
Baker
Acorn &
Hwy 44 ESJH
5th Ward
Elem Levee Ochsner
1/5/2017 33.2 ND 0.577 17.5 4.68 ND
1/8/2017 1.28 ND ND 1.81 Invalid ND
1/11/2017 ND ND 20.3 0.033 0.029 0.083
1/14/2017 20 ND ND 75.1 0.381 ND
1/17/2017 ND 0.036 11 ND 0.036 0.522
1/20/2017 ND 7.76 0.145 ND ND 1.78
1/23/2017 ND 6.09 ND ND ND 0.022
1/26/2017 ND ND ND ND 0.939 0.297
1/29/2017 ND 0.352 ND ND ND ND
2/1/2017 ND ND 0.051 ND ND 0.051
2/4/2017 0.058 ND ND 0.141 0.203 ND
2/7/2017 ND ND 0.087 ND ND 0.051
2/10/2017 1.32 ND 0.022 1.15 9.68 ND
2/13/2017 0.316 14.2 ND 8.56 0.656 0.04
2/16/2017 0.073 2.69 ND 0.218 2.62 ND
2/19/2017 0.551 0.301 0.682 1.74 0.334 0.112
2/22/2017 0.109 1.96 0.047 0.091 3.06 0.16
2/25/2017 ND 0.939 ND ND 35.8 11.1
2/28/2017 ND 0.265 7.76 ND ND 1.27
3/3/2017 2.58 ND ND 1.36 2.25 ND
3/6/2017 ND ND 0.62 ND ND ND
3/9/2017 14.8 ND 1.44 3.15 0.112 0.047
3/12/2017 5.6 ND 0.076 11.9 0.279 ND
3/15/2017 0.497 0.04 0.025 2.44 2.25 0.025
3/18/2017 0.152 0.25 2.21 0.022 0.022 0.562
3/21/2017 ND 2.84 ND 0.025 0.022 13.3
3/24/2017 0.062 0.029 0.178 ND 0.025 0.025
3/27/2017 ND 0.022 4.86 ND 0.022 0.033
3/30/2017 2.67 0.881 2.66 0.283 0.406 2.67
4/2/2017 4.9 ND ND 0.044 ND ND
4/5/2017 0.334 0.729 0.21 ND ND 3.74
4/8/2017 17.3 0.925 3.2 13.7 28.3 1.05
4/11/2017 8.96 0.029 0.294 3.84 0.036 -Blank-
4/14/2017 24.6 ND 1.35 51.1 12.5 0.218
4/17/2017 18.4 0.029 1.53 17.6 0.12 0.276
4/20/2017 8.27 ND 0.381 7.62 0.319 0.109
4/23/2017 0.765 0.816 0.102 0.051 10.6 0.232
4/26/2017 0.025 0.029 Invalid 0.054 0.029 2.39
4/29/2017 0.044 0.029 2.19 0.033 0.033 0.029
Preliminary Chloroprene Assessment Page 21
Sample Date Sample Locations
238 Chad
Baker
Acorn &
Hwy 44 ESJH
5th Ward
Elem Levee Ochsner
5/2/2017 9.94 11.5 6.6 4.64 9.9 17.6
5/5/2017 ND 2.81 ND ND 0.174 0.312
5/8/2017 0.508 11 0.297 0.323 9.68 14.9
5/11/2017 0.729 0.254 2.25 ND 0.022 0.247
5/14/2017 ND ND ND ND 1.22 ND
5/17/2017 ND ND 0.109 ND ND ND
5/20/2017 ND ND 0.025 ND ND 0.018
5/23/2017 0.098 0.062 ND ND ND 0.062
5/26/2017 ND ND 0.054 ND ND 0.163
5/29/2017 0.395 0.134 0.323 0.323 1.48 0.725
6/1/2017 7.73 0.214 0.109 2.06 0.366 0.102
6/4/2017 2.57 0.943 2.56 0.116 0.479 0.751
6/7/2017 0.872 ND ND 1.18 5.59 ND
6/10/2017 19.7 ND 0.91 6.27 ND ND
6/13/2017 28.6 ND 1.59 0.823 ND 0.758
6/16/2017 ND 4.82 ND ND ND 35.9
6/19/2017 26.7 2.59 1.6 10.7 7.76 2.47
6/22/2017 0.16 ND 4.43 ND ND ND
6/25/2017 11.8 7.15 0.61 11.8 13.9 0.384
6/28/2017 45.7 ND 2.14 6.6 0.199 ND
7/1/2017 ND 0.167 ND ND ND 4.5
7/4/2017 0.058 0.28 ND ND ND 6.06
7/7/2017 1.42 6.49 0.308 1.65 2.68 0.94
7/10/2017 0.152 8.31 0.083 4.21 34.2 0.334
7/13/2017 4.63 2.4 0.878 3.7 2.81 1.17
7/16/2017 4.64 5.04 2.73 2.09 5.88 11.2
7/19/2017 1.58 3.55 0.878 3.35 3.81 5.51
7/22/2017 5.11 13.9 1.06 10.2 7 2.02
7/25/2017 ND 0.929 0.345 ND 0.744 2.73
7/28/2017 ND 1.97 ND ND 0.087 9.14
7/31/2017 4.28 ND ND 1.76 2.63 ND
8/3/2017 14.3 ND 0.493 5.55 0.892 ND
8/6/2017 5.51 1.66 0.86 1.7 1.1 0.914
8/9/2017 45.3 0.076 ND 26.2 0.479 ND
8/12/2017 ND 12.3 0.276 0.058 0.736 4.68
8/15/2017 4.24 0.526 3.92 2.45 0.831 1.38
8/18/2017 ND 2.92 0.05 ND 0.461 3.41
8/21/2017 5.77 0.225 2.2 0.613 3.59 0.352
8/24/2017 3.27 0.218 0.033 7 1.72 0.776
Preliminary Chloroprene Assessment Page 22
Sample Date Sample Locations
238 Chad
Baker
Acorn &
Hwy 44 ESJH
5th Ward
Elem Levee Ochsner
8/27/2017 33.3 0.432 0.054 1.16 0.406 0.17
8/30/2017 13.9 0.025 2.29 0.308 ND 0.094
9/2/2017 2.39 0.174 0.07 2.81 2.66 0.127
9/5/2017 INVALID 1.15 2.29 0.247 2.15 3.92
9/8/2017 1.18 ND ND 5.01 3.13 ND
9/11/2017 0.029 ND ND 17.1 4.28 ND
9/14/2017 4.94 0.13 2.45 6.57 0.37 1.55
9/17/2017 16.2 0.95 1.5 19 4.32 1.3
9/20/2017 0.26 0.04 1.54 0.1 0.05 6.71
9/23/2017 4.53 0.196 0.312 4.9 4.46 0.93
9/26/2017 22.7 0.033 0.025 8.2 1.72 0.018
9/29/2017 29.2 3.59 1.6 21.5 22 3.55
10/2/2017 34.1 0.044 0.062 4.13 0.029 0.033
10/5/2017 29.7 0.025 ND 23.2 0.559 ND
10/8/2017 0.929 0.475 0.022 0.831 0.936 0.058
10/11/2017 0.355 0.279 1.6 0.258 4.79 0.987
10/14/2017 30.4 ND 0.058 15.7 0.047 ND
10/17/2017 0.112 0.044 0.029 0.504 4.82 0.044
10/20/2017 21 0.036 0.036 13.7 0.044 0.036
10/23/2017 0.827 0.794 0.179 0.207 2.09 0.131
10/26/2017 ND 15.5 1.61 0.036 2.99 43.2
10/29/2017 0.033 0.033 0.033 0.036 15.9 0.025
11/1/2017 19.5 0.036 1.44 1.65 0.033 0.025
11/4/2017 7.29 0.029 2.13 0.646 ND 0.127
11/7/2017 0.167 4.28 0.769 0.033 ND 1.44
11/10/2017 1.37 1.2 0.025 2.33 6.46 0.025
11/13/2017 6.2 0.033 0.029 32.1 0.21 0.029
11/16/2017 28.8 0.044 0.036 32.4 0.649 0.036
11/19/2017 0.033 0.138 0.036 0.036 24.1 0.192
11/22/2017 0.464 0.062 0.025 8.2 2.7 0.036
11/25/2017 21.3 17.3 39.5 6.2 21.1 89.2
11/28/2017 70 Invalid 15.4 151 1.07 0.069
12/1/2017 0.192 0.131 0.254 0.395 1.65 0.127
12/4/2017 1.33 ND 0.051 0.794 0.036 -Blank-
12/7/2017 ND ND ND 0.076 0.319 ND
12/10/2017 0.083 0.12 ND 0.123 0.395 0.276
12/13/2017 0.029 0.283 0.316 0.018 1.15 0.49
12/16/2017 1.02 0.022 0.015 0.929 0.954 0.018
12/19/2017 3.51 ND 0.58 12.3 -- ND
Preliminary Chloroprene Assessment Page 23
Sample Date Sample Locations
238 Chad
Baker
Acorn &
Hwy 44 ESJH
5th Ward
Elem Levee Ochsner
12/22/2017 ND ND 1.44 ND ND 0.258
12/25/2017 0.566 0.015 0.015 2.8 5.59 ND
12/28/2017 0.015 0.018 0.015 1.06 0.468 ND
12/31/2017 6.75 ND ND 9.39 4.24 ND
1/3/2018 ND ND ND 0.0598 2.66 ND
1/6/2018 16.9 ND 0.0526 23.6 2.72 ND
1/9/2018 ND ND ND ND 11.6 ND
1/12/2018 ND 1.6 0.392 ND 0.289 1.66
1/15/2018 2.65 3.84 3.84 4.5 12 5.37
1/19/2018 2.15 6.06 0.566 2.49 4.64 5.55
1/22/2018 15.6 ND 2.09 3.17 ND 1.78
1/25/2018 7 0.025 0.0225 2.62 26.4 ND
1/28/2018 1.7 0.0196 0.0236 10.8 10.5 0.0221
1/31/2018 30.9 ND 30.3 INVALID 9.68 0.111
2/3/2018 8.45 0.016 0.0185 3.55 0.018 ND
2/6/2018 32 ND 0.016 32.4 0.598 ND
2/9/2018 16.5 ND 0.0406 3.95 Invalid ND
2/12/2018 0.0319 0.0348 ND 0.0243 1.19 0.0334
2/15/2018 0.0308 ND 3.12 0.0406 0.0337 Invalid
2/18/2018 4.43 0.889 0.424 0.972 0.852 3.95
2/21/2018 ND 0.0323 0.773 0.0305 0.0243 0.0316
2/24/2018 0.624 0.0297 1.02 0.0229 ND 0.0591
2/27/2018 8.02 0.0265 0.0374 1.2 0.0497 0.0232
3/2/2018 0.0606 0.0479 0.0247 0.896 0.889 0.021
3/5/2018 0.747 ND 0.33 0.49 0.403 0.088
3/8/2018 ND ND ND 0.0809 0.91 ND
3/11/2018 1.36 0.0736 0.722 0.136 0.191 0.0939
3/14/2018 0.128 13.8 0.0196 3.57 28.3 0.228
3/17/2018 ND ND 0.718 ND ND 1.06
3/20/2018 ND 0.453 ND ND ND 0.199
3/23/2018 4.75 0.849 1.04 5.15 2.42 2.75
3/26/2018 ND 0.0345 0.907 0.0374 0.0359 0.114
3/29/2018 0.0218 0.0406 0.689 0.0196 0.443 0.105
4/1/2018 3.7 ND 0.783 8.96 2.7 0.053
4/4/2018 0.285 0.0925 0.377 0.319 0.715 0.49
4/7/2018 ND 0.482 0.359 ND 0.321 0.0693
4/10/2018 0.0424 ND ND 0.119 1.04 ND
4/13/2018 ND ND 2.47 ND ND 0.0178
4/16/2018 ND 0.388 ND ND 0.0243 0.0185
Preliminary Chloroprene Assessment Page 24
Sample Date Sample Locations
238 Chad
Baker
Acorn &
Hwy 44 ESJH
5th Ward
Elem Levee Ochsner
4/19/2018 ND 1.11 ND ND 2.54 1.49
4/22/2018 0.421 ND 0.482 0.101 ND 0.0258
4/25/2018 ND 3.99 ND ND 4.72 0.12
4/28/2018 0.522 7.51 ND 4.86 22.1 ND
5/1/2018 0.261 0.0229 0.1 INVALID ND ND
5/4/2018 ND 0.0272 0.049 INVALID 0.0268 0.0297
5/7/2018 ND 0.34 ND ND 1.35 ND
5/10/2018 10.8 ND 4.53 2.22 0.0479 0.328
5/13/2018 3.35 ND 0.299 0.947 0.0341 0.0185
5/16/2018 0.0341 0.235 0.106 0.0428 1.82 0.226
5/19/2018 0.827 0.598 0.54 0.172 0.297 0.435
5/22/2018 ND 0.504 0.0671 0.0105 1.26 0.7
5/25/2018 0.1 0.885 0.116 0.222 2.29 0.0591
5/28/2018 0.468 ND ND 0.103 3.53 ND
*ND = Concentration not detected §-- = No sample received in lab †Invalid = Sample was invalid ‡U = Concentration below method detection limit **-Blank- = Data cell left empty in EPA data file
NOTE: No samples collected on August 16-20, 2016 due to flooding in Louisiana
Highlighted in yellow = concentration above 20 ug/m3
Highlighted in blue = concentration not detected
Preliminary Chloroprene Assessment Page 25
APPENDIX B: Evaluation of Chloroprene Data, May 2016-May 2018
Table B-1. Summary of chloroprene concentrations in micrograms per cubic meter (ug/m3) in EPA
ambient air canister samples (24-hr) collected from LaPlace, LA, in 2016
2016
Air Monitor Location
Samples per
Location
% Detects Per
Location
% Concentrations
> 0.2 ug/m3 % Concentrations
> 20 ug/m3
238 Chad Baker 69 84.06 76.81 20.29
Acorn & Hwy 44 70 64.29 51.43 8.57
ESJH 70 80.00 64.29 1.43
5th Ward Elem 69 81.16 76.81 15.94
Levee 69 86.96 81.16 13.04
Ochsner 70 68.57 89.58 7.14
Table B-2. Summary of chloroprene concentrations in micrograms per cubic meter (ug/m3) in EPA
ambient air canister samples (24-hr) collected from LaPlace, LA, in 2017
2017
Air Monitor Location
Samples per
Location
% Detects Per
Location % Concentrations
> 0.2 ug/m3
% Concentrations
> 20 ug/m3
238 Chad Baker 121 77.69 61.16 13.22
Acorn & Hwy 44 121 71.07 42.98 0.00
ESJH 121 76.86 47.93 1.65
5th Ward Elem 122 77.05 61.48 6.56
Levee 120 80.00 62.50 5.00
Ochsner 120 75.83 45.00 2.50
Table B-3. Summary of chloroprene concentrations in micrograms per cubic meter (ug/m3) in EPA
ambient air canister samples (24-hr) collected from LaPlace, LA, in 2018
2018
Air Monitor Location
Samples per
Location
% Detects Per
Location % Concentrations
> 0.2 ug/m3
% Concentrations
> 20 ug/m3
238 Chad Baker 49 67.35 51.02 4.08
Acorn & Hwy 44 49 63.27 34.69 0.00
ESJH 49 75.51 46.94 2.04
5th Ward Elem 46 78.26 45.65 4.35
Levee 48 85.42 64.58 6.25
Ochsner 48 72.92 29.17 0.00
Preliminary Chloroprene Assessment Page 26
Preliminary Chloroprene Assessment Page 27
Preliminary Chloroprene Assessment Page 28
Preliminary Chloroprene Assessment Page 29
Preliminary Chloroprene Assessment Page 30
Preliminary Chloroprene Assessment Page 31
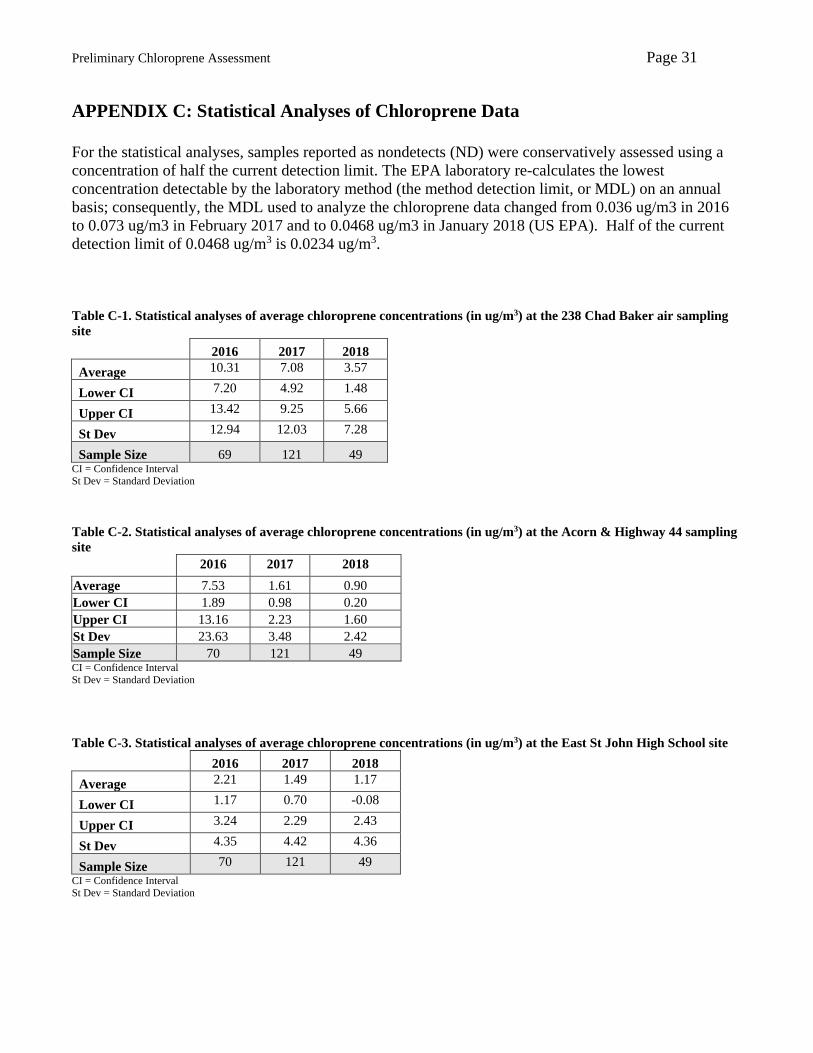
APPENDIX C: Statistical Analyses of Chloroprene Data
For the statistical analyses, samples reported as nondetects (ND) were conservatively assessed using a
concentration of half the current detection limit. The EPA laboratory re-calculates the lowest
concentration detectable by the laboratory method (the method detection limit, or MDL) on an annual
basis; consequently, the MDL used to analyze the chloroprene data changed from 0.036 ug/m3 in 2016
to 0.073 ug/m3 in February 2017 and to 0.0468 ug/m3 in January 2018 (US EPA). Half of the current
detection limit of 0.0468 ug/m3 is 0.0234 ug/m3.
Table C-1. Statistical analyses of average chloroprene concentrations (in ug/m3) at the 238 Chad Baker air sampling
site
2016 2017 2018
Average 10.31 7.08 3.57
Lower CI 7.20 4.92 1.48
Upper CI 13.42 9.25 5.66
St Dev 12.94 12.03 7.28
Sample Size 69 121 49 CI = Confidence Interval
St Dev = Standard Deviation
Table C-2. Statistical analyses of average chloroprene concentrations (in ug/m3) at the Acorn & Highway 44 sampling
site
2016 2017 2018
Average 7.53 1.61 0.90
Lower CI 1.89 0.98 0.20
Upper CI 13.16 2.23 1.60
St Dev 23.63 3.48 2.42
Sample Size 70 121 49 CI = Confidence Interval
St Dev = Standard Deviation
Table C-3. Statistical analyses of average chloroprene concentrations (in ug/m3) at the East St John High School site
2016 2017 2018
Average 2.21 1.49 1.17
Lower CI 1.17 0.70 -0.08
Upper CI 3.24 2.29 2.43
St Dev 4.35 4.42 4.36
Sample Size 70 121 49
CI = Confidence Interval
St Dev = Standard Deviation
Preliminary Chloroprene Assessment Page 32
Table C-4. Statistical analyses of average chloroprene concentrations (in ug/m3) at the Fifth Ward Elementary School
air sampling site
2016 2017 2018
Average 8.70 6.09 2.56
Lower CI 5.43 3.11 0.77
Upper CI 11.96 9.08 4.36
St Dev 13.58 16.68 6.05
Sample Size 69 122 46
CI = Confidence Interval
St Dev = Standard Deviation
Table C-5. Statistical analyses of average chloroprene concentrations (in ug/m3) at the Levee air sampling site
2016 2017 2018
Average 10.13 3.21 3.37
Lower CI 4.84 2.03 1.46
Upper CI 15.42 4.39 5.28
St Dev 22.02 6.52 6.58
Sample Size 69 120 48
CI = Confidence Interval
St Dev = Standard Deviation
Table C-6. Statistical analyses of average chloroprene concentrations (in ug/m3) at the Ochsner air sampling site
2016 2017 2018
Average 5.21 2.73 0.57
Lower CI 2.27 0.95 0.20
Upper CI 8.15 4.51 0.94
St Dev 12.32 9.84 1.29
Sample Size 70 120 48
CI = Confidence Interval
St Dev = Standard Deviation
Preliminary Chloroprene Assessment Page 33
Preliminary Chloroprene Assessment Page 34
Preliminary Chloroprene Assessment Page 35