Embed Size (px)
Citation preview
A Recognition of Health andNutrition Factors in FoodDemand Analysis
Oral Capps, Jr., and John D. Schmitz
A theoretical framework in which to formally consider health and nutrition factors in
demand analyses is developed. The framework is employed to empirically identify
and assess the impacts of information pertaining to cholesterol on the demands for
beef, pork, poultry, and fish. Issues in considering health and nutrition factors in food
demand analysis are documented.
Key words: health and nutrition factors, demand analysis, Rotterdam model.
Nutrition and health issues appear to be majorconcerns for consumers. In a recent Food Mar-keting Institute survey, 93% of the respondentsindicated concerns about the nutritional con-tent of foods. Almost two-thirds of those sur-veyed in a U.S. Department of Agriculture(USDA) study reported they had adjustedhousehold diets in the previous three years forhealth or nutrition reasons (Jones and Wei-mer). Concerns are on the rise for particularnutrients, notably fat and cholesterol (Borra).As well, organizations representing producergroups appear to be very conscious of healthand nutrition concerns in the promotion ofproducts. The deliberate or inadvertent omis-sion of such nontraditional, noneconomicvariables may have deleterious consequencesin the estimation of structural demand rela-tionships. To quote Manderscheid:
The authors are a professor and a graduate research assistant,respectively, Department of Agricultural Economics, Texas A&MUniversity.
A version of this article was presented at the Annual Meetingsof the Western Agricultural Economics Association, Vancouver,British Columbia, 4-8 August 1990. This is Technical Article No.25666 of the Texas Agricultural Experiment Station.
The authors thank Sylvia Lane, David Eastwood, Zuhair Has-san, Michael Wohlgenant, Hui-Shung Chang, Mary Hama, PeterBasiotis, Ben Senauer, Reuben Buse, and two anonymous review-ers for comments on previous drafts of this article. Any remainingerrors or omissions are the sole responsibility of the authors.
In both experimental and nonexperimental studies un-
controlled variables may, if they are important, affect
the relationships being studied. A study of the relation-ship between skim and whole milk prices at retail might
be upset by a "cholesterol scare" if such a scare receivedwidespread public attention and if the experimental de-
sign or statistical procedure did not remove its effect.
(p. 134)
Bringing together diverse viewpoints of ag-ricultural economists specializing in demandanalysis and those interested in human nutri-tion is no easy task. The intent of this articleis to formally consider the role of health andnutrition factors in food demand analysis. Spe-cific objectives are: (a) To conduct a literaturereview of selected studies that deal with healthand nutrition issues. (b) To develop a theo-retical framework in which to formally con-sider health and nutrition factors in demandanalyses. Much consideration is given to thegrowing interest with regard to the issue ofstructural change in demand analysis. (c) Toemploy the theoretical framework to empiri-cally identify and assess the impacts of infor-mation pertaining to cholesterol on the de-mands for beef, pork, poultry, and fish. Annualdata dealing with U.S. per capita consumptionlevels and corresponding nominal prices overthe period 1966 to 1988 are used in this ex-ercise. (d) To document key issues in consid-ering health and nutrition factors in food de-mand analysis.
Western Journal of Agricultural Economics, 16(1): 21-35
Copyright 1991 Western Agricultural Economics Association

Western Journal of Agricultural Economics
Literature Review
Agricultural economists possess some priorexperience in analyses of health and nutritionissues. Borrowing in part from Huffman, it ispossible to classify such analyses into variouscategories: (a) assessment of dietary quality,(b) determination of demand for specific nu-trients, (c) construction of hedonic price orconsumer goods characteristics models for nu-trients, and (d) assessment of attitudes andinformation about health and nutrition on thedemand for food products.
Assessment of Dietary Quality
Assessments of dietary quality are importantfrom the standpoint of personal health andpublic nutritional policy. Objectives of gov-ernment programs such as the Food StampProgram (FSP); National School Lunch Pro-gram (NSLP); Women, Infants, and ChildrenProgram (WIC); and National School Break-fast Program (NSBP) include the attainmentof nutritionally adequate diets, particularly forthe segment of the population whose incomesfall below the poverty level.
Typically, definitions of nutritionally ade-quate diets rest on: (a) nutrient-to-calorie den-sity ratios (Blanciforti, Green, and Lane;Windham et al.; Johnson, Burt, and Morgan);(b) Recommended Dietary Allowances (RDAs)(Huffman; Peterkin, Kerr, and Hama); and (c)Nutrient Achievement or Adequacy Ratios(NARs) (Lane; Davis and Neenan). Nutrientdensity is the unit measurement of each nu-trient per 1,000 kilocalories. RDAs, althougharguably the best standards for assessment ofnutrient adequacy, are not available for all nu-trients. Peterkin, Kerr, and Hama suggest thatif 80% of the RDAs for 11 nutrients (protein,calcium, iron, magnesium, phosphorus, vita-min A, thiamin, riboflavin, vitamin B6, vi-tamin B12, and vitamin C) is met, the dieteither for individuals or households is deemednutritionally adequate. In fact, there are rough-ly 45 essential nutrients, but RDAs have notbeen established for many of these. Huffmandefines nutritional adequacy in terms of meet-ing 100% of the RDAs for 13 nutrients, the 11previously mentioned as well as food energyand niacin. NARs express the amount of anutrient consumed as a percentage of theamount recommended as established by theRDAs. Lane calculates NARs for nine nutri-
ents: food energy, protein, calcium, iron, vi-tamin A, vitamin C, thiamin, riboflavin, andniacin for households in rural California. Da-vis and Neenan calculate NARs for protein,calcium, iron, vitamin A, and vitamin C forhouseholds located in central Florida.
Johnson, Burt, and Morgan employ the1977-78 USDA Nationwide Food Consump-tion Survey (1977-78 NFCS) to focus on theinfluence of participation in the FSP on dietaryquality. They provide evidence to indicate thatparticipation in the FSP positively affects di-etary quality. Huffman, using the spring por-tion of the 1977-78 NFCS together with probitand logit analysis, finds that participation inthe WIC program is positively associated withthe attainment of nutritionally adequate diets.Lane finds that participation in the FSP andthe Food Distribution Program are key factorsof dietary quality. Davis and Neenan provideevidence to indicate that participation in theFSP and the Expanded Food and NutritionEducation Program are important determi-nants of nutritional status.
As well, it is of interest to identify economicand demographic factors which may affect di-etary quality so as to determine target groupsfor food policy programs. Huffman for in-stance identifies and assesses economic anddemographic factors associated with attainingnutritionally adequate diets. Key factors in-clude race and food expenditures per adultequivalent as well as age, sex, and educationof the household head. Blanciforti, Green, andLane, using the dietary component of the sec-ond year of the 1972-73 Consumer Expendi-ture Survey conducted by the Bureau of LaborStatistics (BLS), examine the demand for rel-atively more versus relatively less nutritiousfood, as defined by nutrient-to-calorie densityratios, for seven stages of the life cycle. Theyrecommend the use of nutrition education asa policy tool to improve the nutritional qualityof diets.
Demand for Specific Nutrients
It is necessary to determine the effects of var-ious economic and sociodemographic vari-ables on demands for nutrients as well as onthe incidence of nutrition risk. Knowledge offactors which influence nutrition demands isuseful in the design and implementation ofprograms to promote improvements in nutri-
22 July 1991
Health and Nutrition Factors in Demand Analysis 23
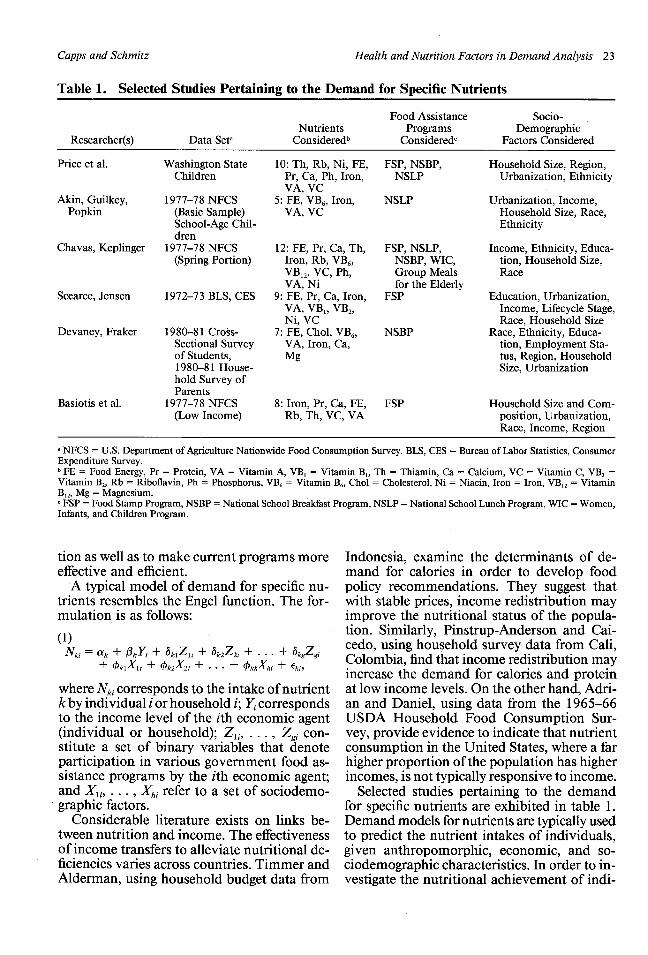
Table 1. Selected Studies Pertaining to the Demand for Specific Nutrients
Food Assistance Socio-Nutrients Programs Demographic
Researcher(s) Data Seta Considered b Consideredc Factors Considered
Price et al. Washington State 10: Th, Rb, Ni, FE, FSP, NSBP, Household Size, Region,Children Pr, Ca, Ph, Iron, NSLP Urbanization, Ethnicity
VA, VCAkin, Guilkey, 1977-78 NFCS 5: FE, VB6, Iron, NSLP Urbanization, Income,
Popkin (Basic Sample) VA, VC Household Size, Race,School-Age Chil- Ethnicitydren
Chavas, Keplinger 1977-78 NFCS 12: FE, Pr, Ca, Th, FSP, NSLP, Income, Ethnicity, Educa-(Spring Portion) Iron, Rb, VB6, NSBP, WIC, tion, Household Size,
VB,2, VC, Ph, Group Meals RaceVA, Ni for the Elderly
Scearce, Jensen 1972-73 BLS, CES 9: FE, Pr, Ca, Iron, FSP Education, Urbanization,VA, VB,, VB2, Income, Lifecycle Stage,Ni, VC Race, Household Size
Devaney, Fraker 1980-81 Cross- 7: FE, Chol, VB6, NSBP Race, Ethnicity, Educa-Sectional Survey VA, Iron, Ca, tion, Employment Sta-of Students, Mg tus, Region, Household1980-81 House- Size, Urbanizationhold Survey ofParents
Basiotis et al. 1977-78 NFCS 8: Iron, Pr, Ca, FE, FSP Household Size and Com-(Low Income) Rb, Th, VC, VA position, Urbanization,
Race, Income, Region
a NFCS = U.S. Department of Agriculture Nationwide Food Consumption Survey. BLS, CES = Bureau of Labor Statistics, ConsumerExpenditure Survey.b FE = Food Energy, Pr = Protein, VA = Vitamin A, VB, = Vitamin B, Th = Thiamin, Ca = Calcium, VC = Vitamin C, VB2 =Vitamin B2, Rb = Riboflavin, Ph = Phosphorus, VB6 = Vitamin B,, Chol = Cholesterol, Ni = Niacin, Iron = Iron, VB,2 = VitaminB,, Mg= Magnesium.c FSP = Food Stamp Program, NSBP = National School Breakfast Program, NSLP = National School Lunch Program, WIC = Women,Infants, and Children Program.
tion as well as to make current programs moreeffective and efficient.
A typical model of demand for specific nu-trients resembles the Engel function. The for-mulation is as follows:
(1)Nk, = ak + fkYi + .klZli + bk2 Z2 i + ... + kgZgi
+ ,klXli + Ok2X2 i + . .. + XkhXhi + Cki,
where Nki corresponds to the intake of nutrientk by individual i or household i; Y, correspondsto the income level of the ith economic agent(individual or household); Zi,, ... , Zg con-stitute a set of binary variables that denoteparticipation in various government food as-sistance programs by the ith economic agent;and Xj, ... , Xhi refer to a set of sociodemo-graphic factors.
Considerable literature exists on links be-tween nutrition and income. The effectivenessof income transfers to alleviate nutritional de-ficiencies varies across countries. Timmer andAlderman, using household budget data from
Indonesia, examine the determinants of de-mand for calories in order to develop foodpolicy recommendations. They suggest thatwith stable prices, income redistribution mayimprove the nutritional status of the popula-tion. Similarly, Pinstrup-Anderson and Cai-cedo, using household survey data from Cali,Colombia, find that income redistribution mayincrease the demand for calories and proteinat low income levels. On the other hand, Adri-an and Daniel, using data from the 1965-66USDA Household Food Consumption Sur-vey, provide evidence to indicate that nutrientconsumption in the United States, where a farhigher proportion of the population has higherincomes, is not typically responsive to income.
Selected studies pertaining to the demandfor specific nutrients are exhibited in table 1.Demand models for nutrients are typically usedto predict the nutrient intakes of individuals,given anthropomorphic, economic, and so-ciodemographic characteristics. In order to in-vestigate the nutritional achievement of indi-
Capps and Schmitz

Western Journal of Agricultural Economics
viduals, NARs may then be calculated. In thisway, the construction of demand models fornutrients leads to assessment of dietary qual-ity. In addition, the construction of the modelspermits analyses not only of the impacts ofvarious government programs but also of so-ciodemographic factors on levels of nutrientintakes.
Cross-sectional data sets are used in the var-ious selected studies. Except for the study byPrice et al., the respective data sets pertain tonational samples, typically from the 1977-78NFCS. Common nutrients considered are foodenergy, iron, vitamin A, vitamin C, and cal-cium. Government programs frequently con-sidered are the FSP, NSLP, and NSBP. In mostinstances, evidence exists to indicate thatparticipation in government food assistanceprograms leads to increases in the levels ofnutrient intakes, ceteris paribus. Finally, so-ciodemographic factors most commonly em-ployed in the models are income, householdsize, ethnicity, and urbanization. In many in-stances, the effects of the respective sociode-mographic factors on nutrient levels are sta-tistically significant, ceteris paribus. However,the influence of the sociodemographic variatesvaries (both direction and magnitude) acrosssamples and model specifications.
Hedonic Price Models
Hedonic price and/or characteristics modelsare very attractive in analyses pertaining tonutrition issues. The principal product fromsuch models is the assessment of marginalmonetary values of nutrients.
The hedonic function is typically similar tothe following:
(2) Pi = ai + Yij ij, + Vi,
where yj is the marginal implicit price of thejth nutrient and/or dietary component, r7ij isthe amount of nutrient and/or dietary attributej associated with a unit of product i, and Pi isthe price of product i (Eastwood, Brooker, andTerry; Morgan; Morgan, Metzen, and John-son; Huffman). For each product consumed,the price paid by the consumer equals the sumof marginal monetary values of the character-istics of the product. The marginal monetaryvalue of each characteristic equals the quantityof the characteristic obtained from the mar-
ginal unit of the product consumed multipliedby the marginal implicit price of the charac-teristic.
On the basis of the model, it is possible todetermine how much the consumer is willingto pay say, for example, the removal of onegram of fat or how much to pay for the inclu-sion of one gram of protein. Morgan, Metzen,and Johnson use this model to determine a setof hedonic prices for the nutritional charac-teristics of breakfast cereals. Eastwood, Brook-er, and Terry; Ladd and Suvannunt; Huffman;and Capps employ the hedonic price functionto determine a set of marginal monetary valuesfor 7, 8, 13, and 14 nutrients, respectively.
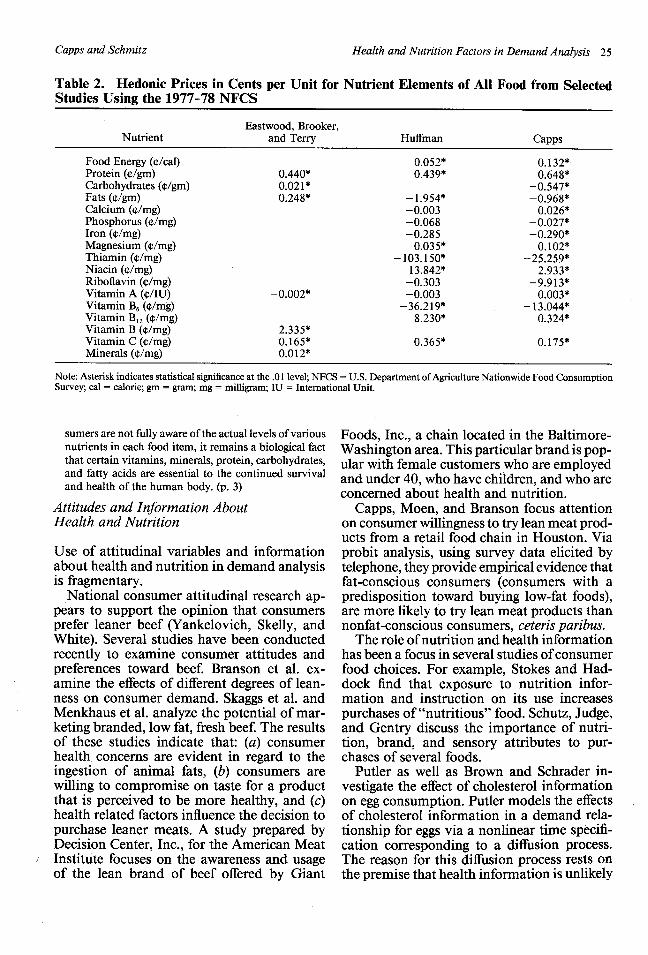
Hedonic prices for nutrient elements fromthe studies of Eastwood, Brooker, and Terry;Huffman; and Capps are exhibited in table 2.The selection of these studies rests on the factthat the 1977-78 NFCS is the common database. Huffman; and Eastwood, Brooker, andTerry use the spring portion of the survey, whileCapps uses all seasons from the survey. Littlesimilarity exists, except for perhaps protein andiron, among the estimates of various nutrientcharacteristics. To illustrate, according toHuffman (Capps), the consumer is willing topay 1.954¢ (.968¢) for the removal of one gramof fat; yet according to Eastwood, Brooker, andTerry, the consumer is willing to pay .248¢ forthe inclusion of one gram of fat. For protein,according to the results of these three studies,the consumer is willing to pay roughly .44-.65¢ for the inclusion of one gram, and foriron, the consumer is willing to pay .29¢ forthe removal of one milligram.
The consideration of nutritional elements indemand analyses is not a straightforward issue.Usually, the representative consumer does notpossess much information in regard to the nu-tritional content of foods. Moreover, nutri-tional factors are not necessarily independentof one another; for example, fat and caloriesare highly correlated. Also, although it may bedesirable to increase iron but simultaneouslydecrease cholesterol in the diet, particular foods(notably red meat) are excellent sources of bothiron and cholesterol.
Nevertheless, the key assumption is thatconsumers care about the nutritional charac-teristics of food. To quote LaFrance,
even if consumers do not compute or calculate at themargin the values of obtaining an additional microgramof vitamin B6, for example, they are undoubtedly awareof health and nutritional needs in general. Even if con-
24 July 1991
Health and Nutrition Factors in Demand Analysis 25
Table 2. Hedonic Prices in Cents per Unit for Nutrient Elements of All Food from SelectedStudies Using the 1977-78 NFCS
Eastwood, Brooker,Nutrient and Terry Huffman Capps
Food Energy (¢/cal) 0.052* 0.132*Protein (¢/gm) 0.440* 0.439* 0.648*Carbohydrates (¢/gm) 0.021 -0.547*Fats (c/gm) 0.248* -1.954* -0.968*Calcium ((/mg) -0.003 0.026*Phosphorus (¢/mg) -0.068 -0.027*Iron (¢/mg) -0.285 -0.290*Magnesium (¢/mg) 0.035* 0.102*Thiamin (¢/mg) -103.150* -25.259*Niacin (q/mg) 13.842* 2.933*Riboflavin (¢/mg) -0.303 -9.913*Vitamin A (¢/IU) -0.002* -0.003 0.003*Vitamin B6 (¢/mg) -36.219* -13.044*Vitamin B12 (¢/mg) 8.230* 0.324*Vitamin B (¢/mg) 2.335*Vitamin C (¢/mg) 0.165* 0.365* 0.175*Minerals (c/mg) 0.012*
Note: Asterisk indicates statistical significance at the .01 level; NFCS = U.S. Department of Agriculture Nationwide Food ConsumptionSurvey; cal = calorie; gm = gram; mg = milligram; IU = International Unit.
sumers are not fully aware of the actual levels of variousnutrients in each food item, it remains a biological factthat certain vitamins, minerals, protein, carbohydrates,and fatty acids are essential to the continued survivaland health of the human body. (p. 3)
Attitudes and Information AboutHealth and Nutrition
Use of attitudinal variables and informationabout health and nutrition in demand analysisis fragmentary.
National consumer attitudinal research ap-pears to support the opinion that consumersprefer leaner beef (Yankelovich, Skelly, andWhite). Several studies have been conductedrecently to examine consumer attitudes andpreferences toward beef. Branson et al. ex-amine the effects of different degrees of lean-ness on consumer demand. Skaggs et al. andMenkhaus et al. analyze the potential of mar-keting branded, low fat, fresh beef. The resultsof these studies indicate that: (a) consumerhealth concerns are evident in regard to theingestion of animal fats, (b) consumers arewilling to compromise on taste for a productthat is perceived to be more healthy, and (c)health related factors influence the decision topurchase leaner meats. A study prepared byDecision Center, Inc., for the American MeatInstitute focuses on the awareness and usageof the lean brand of beef offered by Giant
Foods, Inc., a chain located in the Baltimore-Washington area. This particular brand is pop-ular with female customers who are employedand under 40, who have children, and who areconcerned about health and nutrition.
Capps, Moen, and Branson focus attentionon consumer willingness to try lean meat prod-ucts from a retail food chain in Houston. Viaprobit analysis, using survey data elicited bytelephone, they provide empirical evidence thatfat-conscious consumers (consumers with apredisposition toward buying low-fat foods),are more likely to try lean meat products thannonfat-conscious consumers, ceteris paribus.
The role of nutrition and health informationhas been a focus in several studies of consumerfood choices. For example, Stokes and Had-dock find that exposure to nutrition infor-mation and instruction on its use increasespurchases of"nutritious" food. Schutz, Judge,and Gentry discuss the importance of nutri-tion, brand, and sensory attributes to pur-chases of several foods.
Putler as well as Brown and Schrader in-vestigate the effect of cholesterol informationon egg consumption. Putler models the effectsof cholesterol information in a demand rela-tionship for eggs via a nonlinear time specifi-cation corresponding to a diffusion process.The reason for this diffusion process rests onthe premise that health information is unlikely
Capps and Schmitz
Western Journal of Agricultural Economics
to be received by all consumers instantane-ously. Instead, this information diffusesthrough the population over time. On the basisof this diffusion model, Putler augments thetraditional set of Marshallian demand equa-tions via a nonlinear trend variable of the form,
exp[(B + a)T] - 1exp[(B + a)T] + B/a
The variable Tis {(t - t*) + (t + t*)}/2, wheret is the current period and t* is the time atwhich cholesterol information begins to affectconsumption. Using quarterly time-series datafrom 1960 to 1985, the hypothesis that healthinformation has no effect on shell egg con-sumption is rejected. On the basis of the dif-fusion model, the beginning of the health in-formation effect on shell egg consumption isthe second quarter of 1969, and the full impactof the health information is achieved by thefourth quarter of 1980.
Brown and Schrader construct a cholesterolinformation index to estimate the effect of cho-lesterol information on egg consumption. Thisindex is based on a running total of the numberof articles available to the medical profession.Each article supporting the linkage betweencholesterol and heart disease adds one unit tothe running total (lagged two quarters) and eacharticle refuting the linkage subtracts one unit.Brown and Schrader, using quarterly time-se-ries data from 1955 I to 1987 II, augment thetypical Marshallian demand relationship foreggs via the inclusion of the cholesterol infor-mation index. Adjustments are also made forseasonality as well as the percentage of womenin the labor force. Results from this study in-dicate that, ceteris paribus, information on thelinks between cholesterol and heart disease de-crease per capita shell egg consumption.
Chang and Kinnucan expand the Brown andSchrader index to include those articles avail-able not only in the United States but also inCanada. Using a variation of the AIDS modelto capture demand interrelationships for but-ter, margarine, shortening oils, and salad oilsin Canada, they conclude that over the period1973 II to 1986 III cholesterol informationnegatively impacted butter consumption butpositively impacted salad oil consumption,ceteris paribus.
In sum, current knowledge pertaining to nu-trition and health determinants of food de-mand centers on the assessment of dietary
quality, the estimation of nutrient demand re-lationships, the estimation of hedonic pricemodels, and the use of attitudinal variablesand information about nutrition and health indemand relationships.
Theoretical Framework
The purpose of this section is to describe atheoretical framework to measure the impactof health and nutrition information on the de-mand for food products. To motivate this the-oretical development, consider the issue ofstructural changes in domestic demand. Toquote Purcell
changes in prices of competing meats such as pork andpoultry cannot explain the dramatic drop in inflation-adjusted beef prices since 1979 ... it is difficult to ac-cept that there has been no structural change in beefdemand or that any shifts in beef demand can be ex-plained by changes in prices of other products. (pp. 18-19)
A plethora of studies by agricultural econo-mists exists with regard to structural change inthe demand for meat products (see for exam-ple, Chalfant and Alston; Haidacher et al.;Nyankori and Miller; Braschler; Chavas; Mar-tin and Porter; Choi and Sosin; Moschini andMeilke; Dahlgran; Eales and Unnevehr; Good-win). The various studies typically employeconometric procedures such as switching re-gression models; time-varying parametermodels; Farley-Hinich and Harvey-Colliertests; Chow tests; CUSUM and CUSUMQtests, which rely on recursive estimates andrecursive residuals; and nonparametric ap-proaches (compliance or noncompliance toweak and strong axioms of revealed prefer-ence) to ascertain the existence or nonexistenceof structural change. Although the evidence isfar from unanimous, structural change appearsto exist in the demand for meat products. Thenonconsensus of empirical results is attribut-able to alternative approaches in model de-velopment as well as to differences in data andeconometric and inferential procedures. Fur-ther, information about saturated fats and cho-lesterol in the diet appears to be the majorexplanation for structural change, albeit otherreasons include unprecedented economicshocks in the 1970s, increases in participationin the labor force by women, and changes inincome distribution, age distribution, and ra-cial composition.
26 July 1991
Health and Nutrition Factors in Demand Analysis 27
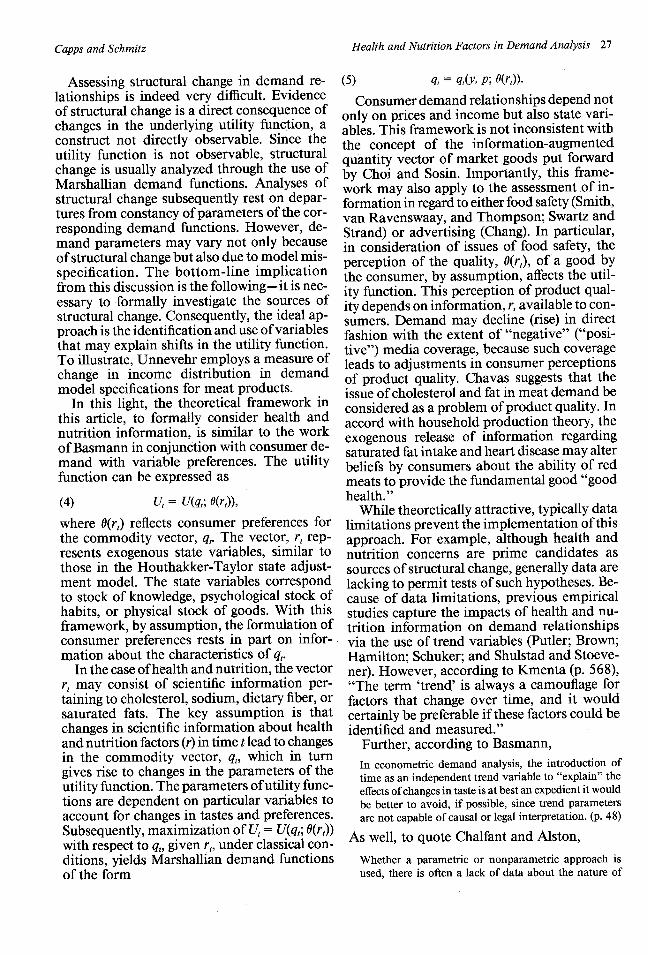
Assessing structural change in demand re-lationships is indeed very difficult. Evidenceof structural change is a direct consequence ofchanges in the underlying utility function, aconstruct not directly observable. Since theutility function is not observable, structuralchange is usually analyzed through the use ofMarshallian demand functions. Analyses ofstructural change subsequently rest on depar-tures from constancy of parameters of the cor-responding demand functions. However, de-mand parameters may vary not only becauseof structural change but also due to model mis-specification. The bottom-line implicationfrom this discussion is the following-it is nec-essary to formally investigate the sources ofstructural change. Consequently, the ideal ap-proach is the identification and use of variablesthat may explain shifts in the utility function.To illustrate, Unnevehr employs a measure ofchange in income distribution in demandmodel specifications for meat products.
In this light, the theoretical framework inthis article, to formally consider health andnutrition information, is similar to the workof Basmann in conjunction with consumer de-mand with variable preferences. The utilityfunction can be expressed as
(4) , = U(q,; o(rt)),
where O(r,) reflects consumer preferences forthe commodity vector, qt. The vector, r, rep-resents exogenous state variables, similar tothose in the Houthakker-Taylor state adjust-ment model. The state variables correspondto stock of knowledge, psychological stock ofhabits, or physical stock of goods. With thisframework, by assumption, the formulation ofconsumer preferences rests in part on infor-mation about the characteristics of q.
In the case of health and nutrition, the vectorr, may consist of scientific information per-taining to cholesterol, sodium, dietary fiber, orsaturated fats. The key assumption is thatchanges in scientific information about healthand nutrition factors (r) in time t lead to changesin the commodity vector, qt, which in turngives rise to changes in the parameters of theutility function. The parameters of utility func-tions are dependent on particular variables toaccount for changes in tastes and preferences.Subsequently, maximization of Ut = U(qt; 0(rt))with respect to qt, given rt, under classical con-ditions, yields Marshallian demand functionsof the form
(5) qt = qt(Y, P; O(r,)).
Consumer demand relationships depend notonly on prices and income but also state vari-ables. This framework is not inconsistent withthe concept of the information-augmentedquantity vector of market goods put forwardby Choi and Sosin. Importantly, this frame-work may also apply to the assessment of in-formation in regard to either food safety (Smith,van Ravenswaay, and Thompson; Swartz andStrand) or advertising (Chang). In particular,in consideration of issues of food safety, theperception of the quality, 0(rt), of a good bythe consumer, by assumption, affects the util-ity function. This perception of product qual-ity depends on information, r, available to con-sumers. Demand may decline (rise) in directfashion with the extent of "negative" ("posi-tive") media coverage, because such coverageleads to adjustments in consumer perceptionsof product quality. Chavas suggests that theissue of cholesterol and fat in meat demand beconsidered as a problem of product quality. Inaccord with household production theory, theexogenous release of information regardingsaturated fat intake and heart disease may alterbeliefs by consumers about the ability of redmeats to provide the fundamental good "goodhealth."
While theoretically attractive, typically datalimitations prevent the implementation of thisapproach. For example, although health andnutrition concerns are prime candidates assources of structural change, generally data arelacking to permit tests of such hypotheses. Be-cause of data limitations, previous empiricalstudies capture the impacts of health and nu-trition information on demand relationshipsvia the use of trend variables (Putler; Brown;Hamilton; Schuker; and Shulstad and Stoeve-ner). However, according to Kmenta (p. 568),"The term 'trend' is always a camouflage forfactors that change over time, and it wouldcertainly be preferable if these factors could beidentified and measured."
Further, according to Basmann,
In econometric demand analysis, the introduction oftime as an independent trend variable to "explain" theeffects of changes in taste is at best an expedient it wouldbe better to avoid, if possible, since trend parametersare not capable of causal or legal interpretation. (p. 48)
As well, to quote Chalfant and Alston,
Whether a parametric or nonparametric approach isused, there is often a lack of data about the nature of
Capps and Schmitz
Western Journal of Agricultural Economics
the structural change, and the alternative hypothesis isusually no more specific than that the null hypothesisis incorrect. It would be preferable to incorporate di-rectly the determinants and the nature of the hypothe-sized structural change in a more specific alternativehypothesis. For example, proxies for increased healthconsciousness could be included. However, problemsarise because of the number of possible influences, thelack of adequate data, and the uncertainty about themanner in which they might affect demands. (p. 397)
Nevertheless, Stigler and Becker appeal toeconomists to augment their models to ac-count for changes in demand relationships.Perhaps the best example of this approach, atleast with regard to health and nutrition in-formation, is the work of Brown and Schrader.
Empirical Application
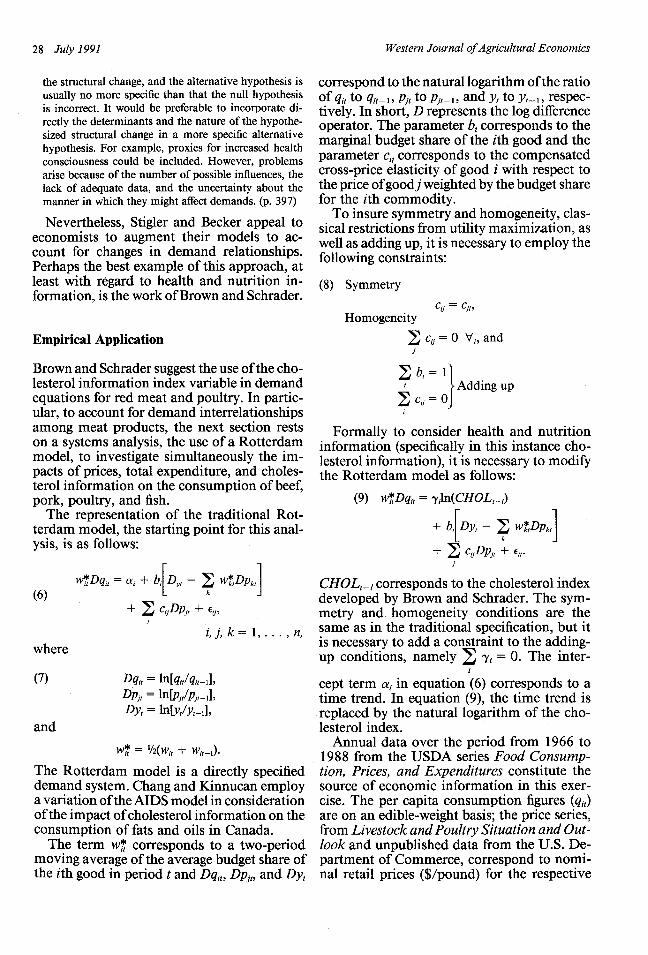
Brown and Schrader suggest the use of the cho-lesterol information index variable in demandequations for red meat and poultry. In partic-ular, to account for demand interrelationshipsamong meat products, the next section restson a systems analysis, the use of a Rotterdammodel, to investigate simultaneously the im-pacts of prices, total expenditure, and choles-terol information on the consumption of beef,pork, poultry, and fish.
The representation of the traditional Rot-terdam model, the starting point for this anal-ysis, is as follows:
(6)W*Dq, = a, + bi Dy - W*tDPkt
+ C cijDpj + Ej,
where
Dqit = ln[qit/qit-_],Dpj = ln[pjf/pjt,],Dy, = ln[yt/yt,],
and
w* = 1/2(w,, + w,,it).
The Rotterdam model is a directly specifieddemand system. Chang and Kinnucan employa variation of the AIDS model in considerationof the impact of cholesterol information on theconsumption of fats and oils in Canada.
The term w* corresponds to a two-periodmoving average of the average budget share ofthe ith good in period t and Dq,, Dpjt, and Dy,
correspond to the natural logarithm of the ratioof qit to q,_1, pj, to it- , and y, to yt- , respec-tively. In short, D represents the log differenceoperator. The parameter bi corresponds to themarginal budget share of the ith good and theparameter cj corresponds to the compensatedcross-price elasticity of good i with respect tothe price ofgoodj weighted by the budget sharefor the ith commodity.
To insure symmetry and homogeneity, clas-sical restrictions from utility maximization, aswell as adding up, it is necessary to employ thefollowing constraints:
(8) Symmetry
Cij = Cji,Homogeneity
0 c= 0 Vi, and
bi= 11i 4 Adding up
Z Cij= OJ
Formally to consider health and nutritioninformation (specifically in this instance cho-lesterol information), it is necessary to modifythe Rotterdam model as follows:
(9) w*Dq, = yjln(CHOLt_,)
+ biDy- W*DPk
+ j c D pj, + E,.
CHOLt,_ corresponds to the cholesterol indexdeveloped by Brown and Schrader. The sym-metry and homogeneity conditions are thesame as in the traditional specification, but itis necessary to add a constraint to the adding-up conditions, namely y = 0. The inter-
i
cept term a, in equation (6) corresponds to atime trend. In equation (9), the time trend isreplaced by the natural logarithm of the cho-lesterol index.
Annual data over the period from 1966 to1988 from the USDA series Food Consump-tion, Prices, and Expenditures constitute thesource of economic information in this exer-cise. The per capita consumption figures (qt)are on an edible-weight basis; the price series,from Livestock and Poultry Situation and Out-look and unpublished data from the U.S. De-partment of Commerce, correspond to nomi-nal retail prices ($/pound) for the respective
(7)
28 July 1991
Health and Nutrition Factors in Demand Analysis 29
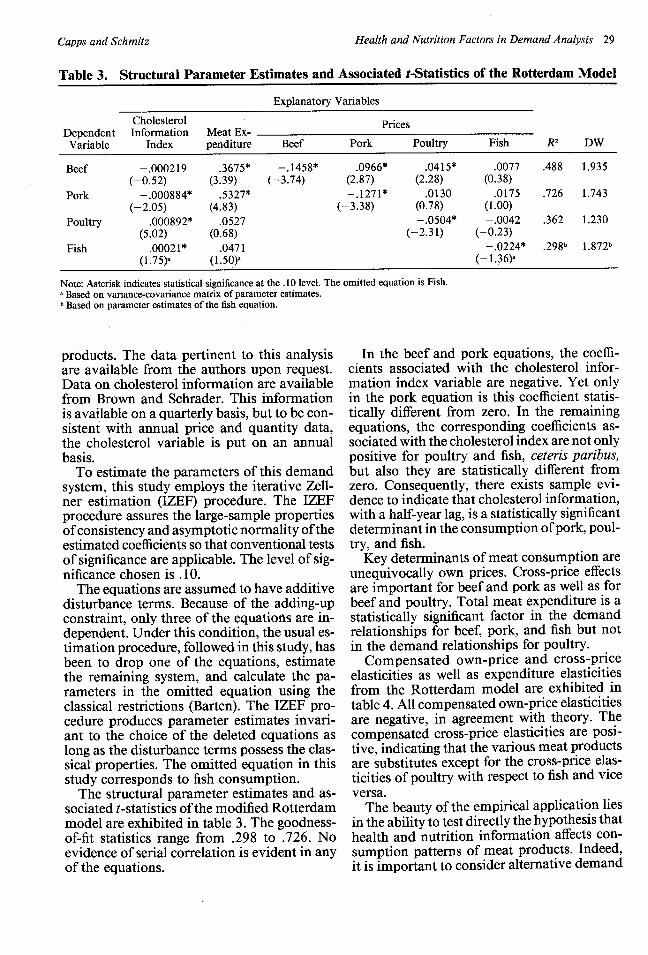
Table 3. Structural Parameter Estimates and Associated t-Statistics of the Rotterdam Model
Explanatory Variables
Cholesterol PricesDependent Information Meat Ex- PFcesVariable Index penditure Beef Pork Poultry Fish R2 DW
Beef -. 000219 .3675* -. 1458* .0966* .0415* .0077 .488 1.935(-0.52) (3.39) (-3.74) (2.87) (2.28) (0.38)
Pork -. 000884* .5327* -. 1271* .0130 .0175 .726 1.743(-2.05) (4.83) (-3.38) (0.78) (1.00)
Poultry .000892* .0527 -. 0504* -. 0042 .362 1.230(5.02) (0.68) (-2.31) (-0.23)
Fish .00021* .0471 -. 0224* .298b 1.872 b
(1.75) a (1.50) a (-1.36)_
Note: Asterisk indicates statistical significance at the .10 level. The omitted equation is Fish.a Based on variance-covariance matrix of parameter estimates.b Based on parameter estimates of the fish equation.
products. The data pertinent to this analysisare available from the authors upon request.Data on cholesterol information are availablefrom Brown and Schrader. This informationis available on a quarterly basis, but to be con-sistent with annual price and quantity data,the cholesterol variable is put on an annualbasis.
To estimate the parameters of this demandsystem, this study employs the iterative Zell-ner estimation (IZEF) procedure. The IZEFprocedure assures the large-sample propertiesof consistency and asymptotic normality of theestimated coefficients so that conventional testsof significance are applicable. The level of sig-nificance chosen is .10.
The equations are assumed to have additivedisturbance terms. Because of the adding-upconstraint, only three of the equations are in-dependent. Under this condition, the usual es-timation procedure, followed in this study, hasbeen to drop one of the equations, estimatethe remaining system, and calculate the pa-rameters in the omitted equation using theclassical restrictions (Barten). The IZEF pro-cedure produces parameter estimates invari-ant to the choice of the deleted equations aslong as the disturbance terms possess the clas-sical properties. The omitted equation in thisstudy corresponds to fish consumption.
The structural parameter estimates and as-sociated t-statistics of the modified Rotterdammodel are exhibited in table 3. The goodness-of-fit statistics range from .298 to .726. Noevidence of serial correlation is evident in anyof the equations.
In the beef and pork equations, the coeffi-cients associated with the cholesterol infor-mation index variable are negative. Yet onlyin the pork equation is this coefficient statis-tically different from zero. In the remainingequations, the corresponding coefficients as-sociated with the cholesterol index are not onlypositive for poultry and fish, ceteris paribus,but also they are statistically different fromzero. Consequently, there exists sample evi-dence to indicate that cholesterol information,with a half-year lag, is a statistically significantdeterminant in the consumption of pork, poul-try, and fish.
Key determinants of meat consumption areunequivocally own prices. Cross-price effectsare important for beef and pork as well as forbeef and poultry. Total meat expenditure is astatistically significant factor in the demandrelationships for beef, pork, and fish but notin the demand relationships for poultry.
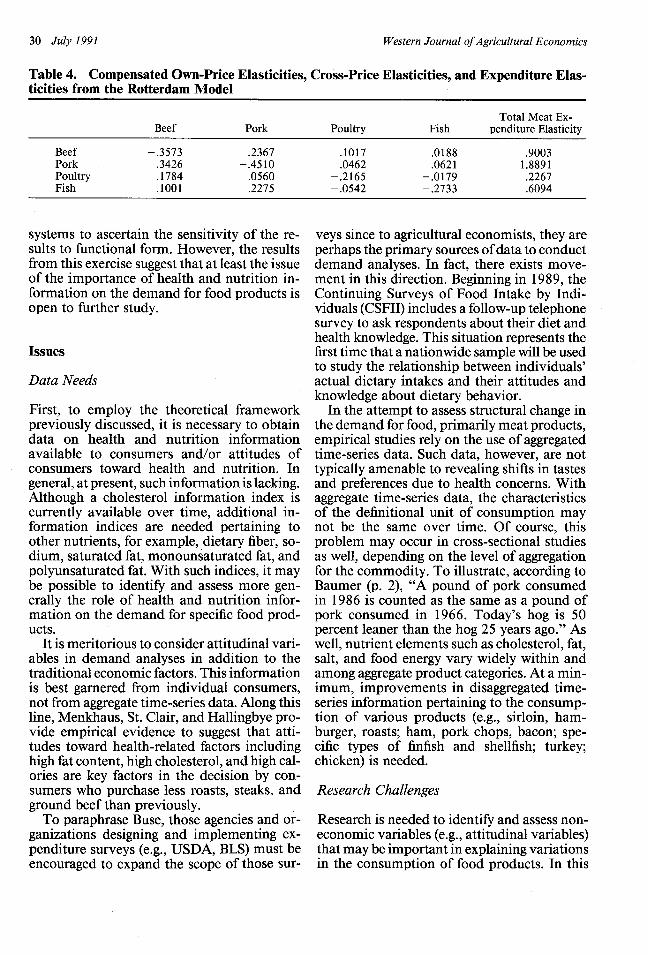
Compensated own-price and cross-priceelasticities as well as expenditure elasticitiesfrom the Rotterdam model are exhibited intable 4. All compensated own-price elasticitiesare negative, in agreement with theory. Thecompensated cross-price elasticities are posi-tive, indicating that the various meat productsare substitutes except for the cross-price elas-ticities of poultry with respect to fish and viceversa.
The beauty of the empirical application liesin the ability to test directly the hypothesis thathealth and nutrition information affects con-sumption patterns of meat products. Indeed,it is important to consider alternative demand
Capps and Schmitz
Western Journal ofAgricultural Economics
Table 4. Compensated Own-Price Elasticities, Cross-Price Elasticities, and Expenditure Elas-ticities from the Rotterdam Model
Total Meat Ex-Beef Pork Poultry Fish penditure Elasticity
Beef -. 3573 .2367 .1017 .0188 .9003Pork .3426 -. 4510 .0462 .0621 1.8891Poultry .1784 .0560 -. 2165 -. 0179 .2267Fish .1001 .2275 -. 0542 -. 2733 .6094
systems to ascertain the sensitivity of the re-sults to functional form. However, the resultsfrom this exercise suggest that at least the issueof the importance of health and nutrition in-formation on the demand for food products isopen to further study.
Issues
Data Needs
First, to employ the theoretical frameworkpreviously discussed, it is necessary to obtaindata on health and nutrition informationavailable to consumers and/or attitudes ofconsumers toward health and nutrition. Ingeneral, at present, such information is lacking.Although a cholesterol information index iscurrently available over time, additional in-formation indices are needed pertaining toother nutrients, for example, dietary fiber, so-dium, saturated fat, monounsaturated fat, andpolyunsaturated fat. With such indices, it maybe possible to identify and assess more gen-erally the role of health and nutrition infor-mation on the demand for specific food prod-ucts.
It is meritorious to consider attitudinal vari-ables in demand analyses in addition to thetraditional economic factors. This informationis best garnered from individual consumers,not from aggregate time-series data. Along thisline, Menkhaus, St. Clair, and Hallingbye pro-vide empirical evidence to suggest that atti-tudes toward health-related factors includinghigh fat content, high cholesterol, and high cal-ories are key factors in the decision by con-sumers who purchase less roasts, steaks, andground beef than previously.
To paraphrase Buse, those agencies and or-ganizations designing and implementing ex-penditure surveys (e.g., USDA, BLS) must beencouraged to expand the scope of those sur-
veys since to agricultural economists, they areperhaps the primary sources of data to conductdemand analyses. In fact, there exists move-ment in this direction. Beginning in 1989, theContinuing Surveys of Food Intake by Indi-viduals (CSFII) includes a follow-up telephonesurvey to ask respondents about their diet andhealth knowledge. This situation represents thefirst time that a nationwide sample will be usedto study the relationship between individuals'actual dietary intakes and their attitudes andknowledge about dietary behavior.
In the attempt to assess structural change inthe demand for food, primarily meat products,empirical studies rely on the use of aggregatedtime-series data. Such data, however, are nottypically amenable to revealing shifts in tastesand preferences due to health concerns. Withaggregate time-series data, the characteristicsof the definitional unit of consumption maynot be the same over time. Of course, thisproblem may occur in cross-sectional studiesas well, depending on the level of aggregationfor the commodity. To illustrate, according toBaumer (p. 2), "A pound of pork consumedin 1986 is counted as the same as a pound ofpork consumed in 1966. Today's hog is 50percent leaner than the hog 25 years ago." Aswell, nutrient elements such as cholesterol, fat,salt, and food energy vary widely within andamong aggregate product categories. At a min-imum, improvements in disaggregated time-series information pertaining to the consump-tion of various products (e.g., sirloin, ham-burger, roasts; ham, pork chops, bacon; spe-cific types of finfish and shellfish; turkey;chicken) is needed.
Research Challenges
Research is needed to identify and assess non-economic variables (e.g., attitudinal variables)that may be important in explaining variationsin the consumption of food products. In this
30 July 1991

Health and Nutrition Factors in Demand Analysis 31
light, it may be beneficial to agricultural econ-omists to work jointly with psychologists, so-ciologists, nutritionists, and home economistsin the consideration of such noneconomicvariables.
Consumers receive information about nu-trition and health from several sources: (a)doctors, nurses, other health professionals; nu-tritionists, dietitians, or home economists(people source); (b) radio, television, news-papers, magazines, books, government healthorganization publications, food company pub-lications (media source); and (c) food packagesor labels (package source). Research to assessthe impacts of the source of nutrition and healthinformation on food consumption, ceteris pa-ribus, merits attention. This factor constitutesin essence a measure of the role of influencerson food consumption behavior. With the ex-ception of the work by Ippolito and Mathios,studies to assess the impacts of sources of nu-trition information on food expenditure orconsumption patterns are lacking.
In conjunction with the issue of the role ofinfluencers on food consumption behavior, newlabeling proposals are under consideration bythe federal government (Bacon). Few policychanges have been initiated since 1975 whennutritional labeling was originally implement-ed. Agricultural economists can play a pivotalrole in addressing this issue. For instance, it ispossible to update the work of Lenahan et al.:(a) to discover the labeling formation mostacceptable to the consumer for presenting nu-trition information; (b) to discover the outletmost used by the consumer for receiving nu-trition information; (c) to identify the rate ofperception, understanding, and use of nutri-tion information on labels; and (d) to deter-mine the nature and importance of nonusebenefits (Padberg) of nutrition information asperceived by consumers.
The forthcoming 1987-88 NFCS containsinformation on 28 nutritional elements. Hence,with this survey, it will be possible to updatestudies in the assessment of dietary quality,the determination of demand for specific nu-trients, and the construction of hedonic pricesfor nutrients. Of course, such efforts will re-quire the use of interdisciplinary teams com-posed of nutritionists and agricultural econo-mists. Furthermore, unlike previous USDANationwide Food Consumption Surveys, the1987-88 NFCS contains information on sat-urated fat, monounsaturated fat, polyunsatu-
rated fat, cholesterol, dietary fiber, vitamin A,carotenes, vitamin E, folacin, zinc, copper, so-dium, and potassium. Therefore, the 1987-88NFCS constitutes not only a rich source ofnutrition information but also for particularnutrients a new set of information.
Additionally, with the 1987-88 NFCS, it ispossible to determine whether or not individ-uals or households meet any of the seven di-etary guidelines set forth by the USDA and theDepartment of Health and Human Services(DHHS) [(a) eat a variety of foods; (b) main-tain desirable weight; (c) avoid too much fat,saturated fat, and cholesterol; (d) eat foodswith adequate starch and fiber; (e) avoid toomuch sugar; (f) avoid too much sodium; and(g) if you drink alcoholic beverages, do so inmoderation]. Attainment of a single guidelineor multiple guidelines may also constitute al-ternative measures of diet quality. Conse-quently, it is possible to identify food use pat-terns conditional on the attainment ornonattainment of dietary guidelines, all otherfactors invariant. As well, issues in regard tothe demographics of nutrition may be worthyof attention. For example, which populationgroups achieve nutritional or dietary guide-lines? Also, are consumers who purchase con-venience or formulated foods more or less like-ly to achieve the dietary guidelines? With themyriad of formulated foods in the market-place, this latter question is unequivocally ofinterest. In fact, a paucity of economic andnutritional information exists pertaining toformulated foods. In the spirit of the works byHavlicek et al.; Capps, Tedford, and Havlicek;and Capps and Pearson, attempts to add tothis sparse store of knowledge are worthy ofconsideration.
Research in this area will assist food pro-duction and marketing specialists, agriculturaland consumer economists, food program ad-ministrators, food and nutrition educators,health professionals, and nutrition and eco-nomic researchers to better understand the na-ture of and reasons for household food selec-tions. Ultimately, improvements can be madein the design and focus of education and as-sistance programs that have food, nutrition,and food money management components.
Joint efforts of agricultural economists withnutritionists and public health officials are ofimportance to the National Nutrition Moni-toring System (NNMS). The NNMS coversfederal nutrition monitoring activities, both
Capps and Schmitz
Western Journal of Agricultural Economics
in the USDA and the DHHS. Of interest toagricultural economists, the national monitor-ing of dietary status requires information onthe nutrient content of food as well as foodconsumption. The sources for such informa-tion are the decennial food consumption sur-veys (1977-78 and 1987-88 NFCS) as well asthe CSFII initiated in 1985. The CSFII pro-vides information about dietary behavior be-tween the decennial surveys. Opportunities ex-ist for agricultural economists to use food andnutrient consumption information availablefrom the NNMS to conduct analyses of foodconsumption and to target and develop foodassistance and nutrition education programs.
Methodological Considerations
The incorporation of health and nutrition in-formation into demand systems merits con-sideration. By using the method of translation(Pollak and Wales), parameters of either thecost or the demand functions may, by as-sumption, depend upon previous levels ofhealth and nutrition information. This pro-cedure is very similar to the work of Green inincorporating advertising effects into demandsystems.
Also, scientific information about health andnutrition may be characterized by either geo-metric or polynomial distributed lag relation-ships. Polynomial distributed lag relationshipsmay be incorporated in demand system mod-els or single-equation models to formally de-termine the level of the effect of the infor-mation on the demand for the goods, when theinformation first begins to influence demand,the length of time before the informationreaches the full effect on demand, and the timepath of the effect of the information.
Finally, price and income elasticities mayvary due to the available scientific informationin conjunction with cholesterol. Via the use ofsingle-equation models with random coeffi-cients, it may be possible to determine if suchinformation leads to changes in price and in-come elasticities.
Concluding Remarks
This article promotes the consideration ofhealth and nutrition factors in analyses of fooddemand. Given the widespread attention on
health and nutrition issues from the news me-dia, food product labels, and from medical per-sonnel, it is important for agricultural econo-mists to identify and assess the effects ofattitudes and information on the demand forfood products. As well, agricultural econo-mists, in a multidisciplinary fashion, play arole in the assessment of dietary quality, thedetermination of demand for specific nutri-ents, and the construction of hedonic pricefunctions for nutrients. Research outcomes inthese areas will lead to the development ofappropriate food production distribution pol-icies as well as to the development of moreappropriate marketing practices (e.g., enforce-ment of food grades and standards as well asupdating of food labeling requirements).
Effectiveness of public policies directed to-ward consumers, farmers, and various inter-mediaries in the food and fiber sector will in-crease with improvements in the understandingof the structural elements of food consumptionand nutrient intakes. Estimates of food de-mand parameters are necessary in order to as-sess the impacts of alternative food, nutrition,and agricultural policies. The capability to ad-equately ascertain historical, current, and fu-ture patterns of food consumption is of ex-treme importance to both public and privateactors in the food system.
Health and nutrition issues are not about tofade away. Almost every new product makessome sort of health or nutritional claim. Re-cent changes in domestic food use have givenrise to questions by those involved in foodproduction, processing, and marketing. Forexample, are concerns about nutrition andhealth behind the decline in dairy consump-tion and beef consumption and behind the riseof poultry and seafood consumption?
Designing foods to make them attractive toconsumers is essentially a technological de-velopment. To be fully successful, this devel-opment must be guided by information thatindicates how the resulting products will farein the marketplace. Consequently, it is im-portant to understand the role of economic andnoneconomic demand factors. To not considerhealth and nutrition factors directly in demandanalysis, or at least to account for them in somefashion, is not only myopic but also, in thewords of Purcell, a failure by the discipline.
[Received April 1990; final revisionreceived February 1991.]
32 July 1991

Health and Nutrition Factors in Demand Analysis 33
References
Adrian, J., and R. Daniel. "Impact of SocioeconomicFactors on Consumption of Selected Food Nutrientsin the United States." Amer. J. Agr. Econ. 58(1976):31-38.
Akin, J. S., D. K. Guilkey, and B. M. Popkin. "The SchoolLunch Program and Nutrient Intake: A Switching Re-gression Analysis." Amer. J. Agr. Econ. 65(1983):477-85.
Bacon, K. "U.S. Proposes Nutrition Labels." The WallStreet Journal (8 March 1990), p. B1.
Barten, A. P. "Maximum Likelihood Estimation of aComplete System of Demand Equations." Eur. Econ.Rev. 1(1969):7-73.
Basiotis, P., M. Brown, S. R. Johnson, and K. J. Morgan."Nutrient Availability, Food Costs, and FoodStamps." Amer. J. Agr. Econ. 65(1983):685-93.
Basmann, R. L. "A Theory of Demand with VariableConsumer Preferences." Econometrica 24(1956):47-58.
Baumer, D. L. "Health Influence on the Demand forMeat: A Marketing Research Approach." Work. Pap.,North Carolina State University, 1988.
Blanciforti, L., R. Green, and S. Lane. "Income and Ex-penditure for Relatively More versus Relatively LessNutritious Food over the Life Cycle." Amer. J. Agr.Econ. 63(1981):255-60.
Borra, S. T. "A Healthy Diet with Animal Product Op-tions: What the Food Marketer and Consumer areDoing." Food Marketing Institute, Washington DC,November 1988.
Branson, R. E., H. R. Cross, J. W. Savell, G. C. Smith,and R. A. Edwards. "Marketing Implications fromthe National Consumer Beef Study." West. J. Agr.Econ. 11(1986):82-91.
Braschler, C. "The Changing Demand Structure for Porkand Beef in the 1970s: Implications for the 1980s."S. J. Agr. Econ. 15(December 1983):105-10.
Brown, J. D. "Effect of a Health Hazard 'Scare' on Con-sumer Demand." Amer. J. Agr. Econ. 51(1969):676-78.
Brown, D. J., and L. F. Schrader. "Cholesterol Infor-mation and Shell Egg Consumption." Amer. J. Agr.Econ. 72(1990):548-55.
Buse, R. C. "Is the Structure of the Demand for FoodChanging?: Implications for Projections." In FoodDemand Analysis: Implications for Future Consump-tion, eds., 0. Capps, Jr., and B. Senauer, pp. 105-29.Virginia Polytechnic Institute and State University,August 1986.
Capps, O., Jr. "Prices and Quality Effects in Cross-Sec-tional Demand Analysis: Comment." Tech. ArticleNo. 22840, Texas Agr. Exp. Sta., Texas A&M Uni-versity, June 1987.
Capps, O., Jr., D. S. Moen, and R. E. Branson. "Con-sumer Characteristics Associated with the Selectionof Lean Meat Products." Agribusiness 4(1988):549-57.
Capps, O., Jr., and J. M. Pearson. "Analysis of Conve-
nience and Nonconvenience Food Expenditures byU.S. Households with Projections to the Year 2000."In Food Demand Analysis: Implications for FutureConsumption, eds., 0. Capps, Jr., and B. Senauer.Virginia Polytechnic Institute and State University,August 1986.
Capps, O., Jr., J. R. Tedford, and J. Havlicek, Jr. "House-hold Demand for Convenience and NonconvenienceFoods." Amer. J. Agr. Econ. 67(1985):862-69.
Chalfant, J. A., and J. M. Alston. "Accounting for Changesin Tastes." J. Polit. Econ. 96(1988):391-410.
Chang, H. S. "Measuring the Effects of Advertising inFood Demand Subsystems." Ph.D. dissertation, Uni-versity of California, Davis, 1988.
Chang, H. S., and H. Kinnucan. "Advertising, Infor-mation, and Product Quality: The Case of Butter."Unpublished manuscript, Auburn University, 1990.
Chavas, J.-P. "Structural Change in the Demand forMeat." Amer. J. Agr. Econ. 65(1983):148-53.
Chavas, J.-P., and K. O. Keplinger. "Impact of DomesticFood Programs on Nutrient Intake of Low IncomePersons in the United States." S. J. Agr. Econ. 15(July1983):155-63.
Choi, S., and K. Sosin. "Testing for Structural Change:The Demand for Meat." Amer. J. Agr. Econ. 72(1990):227-36.
Dahlgran, R. A. "Complete Flexibility Systems and theStationarity of U.S. Meat Demands." West. J. Agr.Econ. 12(1987):152-63.
Davis, C. G., and P. H. Neenan. "Impact of Food Stampand Nutrition Education Programs on Food GroupExpenditure and Nutrient Intake of Low IncomeHouseholds." S. J. Agr. Econ. 1 (December 1979):121-29.
Decision Center, Inc. Giant Lean Awareness and Usage.Res. Rep. to the Center for Meat Marketing Research,American Meat Institute, February 1987.
Devaney, B., and T. Fraker. "The Dietary Impacts of theSchool Breakfast Program." Amer. J. Agr. Econ.71(1989):932-48.
Eales, J. S., and L. J. Unnevehr. "Demand for Beef andChicken Products: Separability and StructuralChange." Amer. J. Agr. Econ. 70(1988):521-32.
Eastwood, D. B., J. R. Brooker, and D. E. Terry. "House-hold Nutrient Demand: Use of Characteristics Theoryand a Common Attribute Model." S. J. Agr. Econ.17(December 1986):235-46.
Goodwin, B. K. "Multivariate Gradual Switching Sys-tems and the Stability of U.S. Meat Demands: ABayesian Analysis." Staff Pap. No. 90-2, Kansas StateUniversity, July 1989.
Green, R. "Dynamic Utility Functions for Measuring Ad-vertising Response." In Research on Effectiveness ofAgricultural Commodity Promotion, pp. 80-88. Pro-ceedings sponsored by Farm Foundation, AgriculturalMarketing Service, Economic Research Service, andForeign Ag. Service, September 1985.
Haidacher, R. C., J. A. Craven, K. S. Huang, D. M. Small-wood, and J. R. Blaylock. Consumer Demands forRed Meats, Poultry, and Fish. Staff Rep. No. AGES
Capps and Schmitz
Western Journal of Agricultural Economics
820818. Washington: U.S. Department of Agricul-ture, Economic Research Service, 1982.
Hamilton, J. L. "The Demand for Cigarettes: Advertis-ing, the Health Scare, and the Cigarette AdvertisingBan." Rev. Econ. and Statist. 54(1972):401-1 1.
Havlicek, J., Jr., O. Capps, Jr., J. Axelson, J. M. Pearson,and S. Richardson. "Nutritional and Economic As-pects of Convenience and Nonconvenience Foods."Proceedings of the 1983 Agricultural Outlook Confer-ence (January 1983):539-50.
Huffman, J. A. "The Influence of Income and Demo-graphic Variables on American Households' Achieve-ment of Nutritionally Adequate Diets." Ph.D. dis-sertation, University of California, Davis, 1988.
Ippolito, P. M., and A. D. Mathios. "Information, Ad-vertising, and Health Choices: A Study of the CerealMarket." Federal Trade Commission, April 1990.
Johnson, S. R., J. A. Burt, and K. J. Morgan. "The FoodStamp Program: Participation, Food Cost, and DietQuality for Low Income Households." Food Tech.35(1981):23-38.
Jones, J., and J. Weimer. "A Survey of Health-RelatedFood Choice." National Food Rev. (Fall 1980): 16-18.
Kmenta, J. Elements ofEconometrics, 2nd ed. New York:MacMillan Publishing Company, 1986.
Ladd, G. W., and V. Suvannunt. "A Model of ConsumerGoods Characteristics." Amer. J. Agr. Econ. 58(1976):504-10.
LaFrance, J. T. "The Economics of Nutrient Content andConsumer Demand for Food." Ph.D. dissertation,University of California, Berkeley, 1983.
Lane, S. "Food Distribution and Food Stamp ProgramEffects on Food Consumption and Nutritional'Achievement' of Low Income Persons in Kern Coun-ty, California." Amer. J. Agr. Econ. 60(1978):108-16.
Lenahan, R. J., J. A. Thomas, D. A. Taylor, D. L. Call,and D. I. Padberg. "Consumer Reaction to NutritionInformation on Food Product Labels." Search, 2,15,Cornell University, 1972.
Manderscheid, L. V. "Some Observations on InterpretingMeasured Demand Elasticities." J. Farm Econ.46(1964):128-36.
Martin, W., and D. Porter. "Testing for Changes in theStructure of the Demand for Meat in Australia." Aust.J. Agr. Econ. 29(1985):16-31.
Menkhaus, D. J., J. S. St. Clair, and S. Hallingbye. "AReexamination of Consumer Buying Behavior for Beef,Pork, and Chicken." West. J. Agr. Econ. 10(1985):116-25.
Menkhaus, D. J., G. D. Whipple, S. J. Torok, and R. A.Field. "Developing a Marketing Strategy for Brand-ed, Low Fat, Fresh Beef." Agribusiness 4(1988):91-103.
Morgan, K. J. "Consumer Demand for Nutrients in Food."In Food Demand Analysis: Problems, Issues, andEm-pirical Evidence, eds., R. Raunikar and C.-L. Huang.Ames: Iowa State University Press, 1987.
Morgan, K. J., E. J. Metzen, and S. R. Johnson. "A He-donic Index of Breakfast Cereals." J. Cons. Affairs6(1979):67-75.
Moschini, G., and K. D. Meilke. "Modeling the Patternof Structural Change in U.S. Meat Demand." Amer.J. Agr. Econ. 71(1989):253-61.
Nyankori, J. C. 0., and G. H. Miller. "Some Evidenceand Implications of Structural Change in Retail De-mand for Meats." S. J. Agr. Econ. 14(December 1982):65-70.
Padberg, D. I. "Non-Use Benefits of Mandatory Con-sumer Information Programs." J. Cons. Policy(1977):5-14.
Peterkin, B. B., R. L. Kerr, and M. Y. Hama. "NutritionalAdequacy of Diets of Low-Income Households." J.Nutrition Education 14(1982): 102-04.
Pinstrup-Anderson, P., and E. Caicedo. "The PotentialImpact of Changes in Income Distribution on FoodDemand and Human Nutrition." Amer. J. Agr. Econ.60(1978):402-12.
Pollak, R. A., and T. J. Wales. "Demographic Variablesin Demand Analysis." Econometrica 49(1981): 1533-51.
Price, D. W., D. A. West, G. E. Scheier, and D. Z. Price."Food Delivery Programs and Other Factors Affect-ing Nutrient Intake of Children." Amer. J. Agr. Econ.60(1978):609-18.
Purcell, W. D. "The Case of Beef Demand: A Failure bythe Discipline." Choices (Second Quarter 1989):16-19.
Putler, D. S. "The Effect of Health Information on ShellEgg Consumption." Work. Pap., University of Cali-fornia, Davis, 1987.
Scearce, W. K., and R. B. Jensen. "Food Stamp ProgramEffects on Availability of Food Nutrients for LowIncome Families in the Southern Region of the UnitedStates." S. J. Agr. Econ. 11 (December 1979): 113-20.
Schuker, R. E. "The Impact of Saccharin Warning Labelon Sales of Diet Soft Drinks in Supermarkets." J.Public Policy and Mktg. 2(1983):46-56.
Schutz, H. G., D. S. Judge, and J. Gentry. "The Impor-tance of Nutrition, Brand, Cost, and Sensory Attri-butes to Food Purchase and Consumption." FoodTech. (November 1986):79-82.
Shulstad, R. N., and H. H. Stoevener. "The Effects ofMercury Contamination in Pheasants on the Valueof Pheasant Hunting in Oregon." LandEcon. 54(1978):39-49.
Skaggs, R. K., D. J. Menkhaus, S. J. Torok, and R. A.Field. "Test Marketing of Branded, Low Fat, FreshBeef." Agribusiness 3(1987):257-71.
Smith, M. E., E. 0. van Ravenswaay, and S. R. Thompson."Sales Loss Determination in Food ContaminationIncidents: An Application to Milk Bans in Hawaii."Amer. J. Agr. Econ. 70(1988):513-20.
Stigler, G. J., and G. S. Becker. "De Gustibus Non EstDisputandum." Amer. Econ. Rev. 67(March 1977):76-90.
Stokes, R. C., and F. Haddock. "Interim Report of theFirst Two Phases of the FDA Nutritional LabelingResearch Program." Work. Pap., Consumer ResearchInstitute, Washington DC, 1972.
Swartz, D. G., and I. E. Strand, Jr. "Avoidance Costs
34 July 1991

Capps and Schmitz Health and Nutrition Factors in Demand Analysis 35
Associated with Imperfect Information: The Case ofKepone." Land Econ. 57(1981): 139-50.
Timmer, C. P., and H. Alderman. "Estimating Con-sumption Parameters for Food Policy Analysis." Amer.J. Agr. Econ. 61(1979):982-87.
Unnevehr, L. J. "Income Distribution and StructuralChange in U.S. Meat Demand." Work. Pap., Uni-versity of Illinois, July 1986.
Windham, C., B. Wyse, R. G. Hansen, and R. Hurst.
"Nutrient Density of Diets in the United States De-partment of Agriculture 1977-1978 Nationwide FoodConsumption Survey, I. Impact of SocioeconomicStatus on Dietary Density." J. Amer. Dietetic Assoc.82(1983):28-34.
Yankelovich, Skelly, and White, Inc. The Consumer Cli-mate for Red Meat. Report to the American MeatInstitute and the National Livestock and Meat Board,1985.