Embed Size (px)
Citation preview

CELLULAR NEUROSCIENCEORIGINAL RESEARCH ARTICLE
published: 14 May 2010doi: 10.3389/fncel.2010.00012
Frontiers in Cellular Neuroscience www.frontiersin.org May 2010 | Volume 4 | Article 12 | 1
layer neurons (Vos et al., 1999; Chadderton et al., 2004; Jörntell and Ekerot, 2006; Rancz et al., 2007) and their collective activity (Roggeri et al., 2008; Courtemanche et al., 2009) in response to natural stimuli. These results have supported in turn four main functional hypotheses. (1) The granular layer response to mossy fi ber bursts should be spatially organized in a center-surround pattern, where the excitatory–inhibitory balance is dominated by excitation in the center and by inhibition in the surrounding areas. (2) The granular layer should generate a time-window effect limit-ing the duration and intensity of the GrC output (D’Angelo and De Zeeuw, 2009). (3) The granular layer should behave as a high-pass fi lter allowing patterns over 50 Hz to be optimally transmitted (Mapelli et al., 2010b). Finally, (4) sparse GrC random activity should be able to sustain coherent low-frequency oscillations of granular layer activity (Maex and De Schutter, 1998). However, whether and how these aspects integrate into a coherent functional framework has remained unclear.
Among the properties that may contribute to determine the granular layer function, some appear especially relevant. The cardinal structural properties include the glomerular organiza-tion of the mossy fi ber inputs (Rossi and Hamann, 1998; Mapelli et al., 2009) and feed-forward, feed-back and lateral inhibition (Mapelli and D’Angelo, 2007; Kanichay and Silver, 2008). At
INTRODUCTIONThe cerebellum, owing to its regular structure, has inspired several theoretical models emphasizing the combinatorial properties of the network (Marr, 1969; Albus, 1971; Tyrrell and Willshaw, 1992; Dean et al., 2010). More recently, simplifi ed spiking models have also been developed (Maex and De Schutter, 1998; Medina and Mauk, 2000). Here, by taking advantage of recent advances in single cell and granular layer circuit physiology, a new computational model is developed that incorporates a much higher level of realism than previously possible. The model has then been used to investigate granular layer spatio-temporal dynamics and evaluate the main functional hypotheses suggested by biological investigations.
In brain slices, intracellular recordings have provided a detailed understanding of membrane and synaptic properties of single neu-rons (among others D’Angelo et al., 1995; Dieudonné, 1998; Forti et al., 2006; see also below), while multi-electrode array (MEA) and voltage-sensitive-dye imaging (VSD) recordings have revealed relevant aspects of ensemble granular layer activities (Mapelli and D’Angelo, 2007; D’Angelo et al., 2009; Mapelli et al., 2010a,b). Recordings in vivo have shown the behavior of single granular
A realistic large-scale model of the cerebellum granular layer predicts circuit spatio-temporal fi ltering properties
Sergio Solinas1,2, Thierry Nieus3 and Egidio D’Angelo1,2*
1 Department of Physiology, University of Pavia and Consorzio Nazionale Interuniversitario per le Scienze Fisiche della Materia, Pavia, Italy2 Brain Connectivity Center, Istituto Neurologico IRCCS fondazione C. Mondino, Pavia, Italy3 Neuroscience and Brain Technology, Italian Institute of Technology, Genova, Italy
The way the cerebellar granular layer transforms incoming mossy fi ber signals into new spike patterns to be related to Purkinje cells is not yet clear. Here, a realistic computational model of the granular layer was developed and used to address four main functional hypotheses: center-surround organization, time-windowing, high-pass fi ltering in responses to spike bursts and coherent oscillations in response to diffuse random activity. The model network was activated using patterns inspired by those recorded in vivo. Burst stimulation of a small mossy fi ber bundle resulted in granule cell bursts delimited in time (time windowing) and space (center-surround) by network inhibition. This burst–burst transmission showed marked frequency-dependence confi guring a high-pass fi lter with cut-off frequency around 100 Hz. The contrast between center and surround properties was regulated by the excitatory–inhibitory balance. The stronger excitation made the center more responsive to 10–50 Hz input frequencies and enhanced the granule cell output (with spikes occurring earlier and with higher frequency and number) compared to the surround. Finally, over a certain level of mossy fi ber background activity, the circuit generated coherent oscillations in the theta-frequency band. All these processes were fi ne-tuned by NMDA and GABA-A receptor activation and neurotransmitter vesicle cycling in the cerebellar glomeruli. This model shows that available knowledge on cellular mechanisms is suffi cient to unify the main functional hypotheses on the cerebellum granular layer and suggests that this network can behave as an adaptable spatio-temporal fi lter coordinated by theta-frequency oscillations.
Keywords: spatio-temporal dynamics, cerebellar cortex, neural networks, granular layer, electrophysiological modeling,
NMDA receptors, GABA receptors
Edited by:
James M. Bower, University of Texas at San Antonio, USA
Reviewed by:
Fidel Santamaria, University of Texas at San Antonio, USAJames M. Bower, University of Texas at San Antonio, USA
*Correspondence:
Egidio D’Angelo, Department of Physiology, University of Pavia, Via Forlanini 6, 27100 Pavia, Italy. e-mail: [email protected]
Abbreviations: GrC, granule cell; GoC, Golgi cell; SC/BC, stellate cell/basket cell; MLI, molecular layer interneuron; mf, mossy fi ber; pf, parallel fi ber.

Frontiers in Cellular Neuroscience www.frontiersin.org May 2010 | Volume 4 | Article 12 | 2
Solinas et al. Modeling the granular layer network dynamics
et al., 2001; Nieus et al., 2006; Solinas et al., 2007a,b; Diwakar et al., 2009). These neuronal and synaptic models have been extensively validated in previous works using electrophysiologi-cal and imaging data. Therefore, we have been able to develop a “realistic network model”, in which the large number of param-eters is constrained to biology. In this “bottom-up” approach, the functional properties of the network emerge from the properties of constitutive elements and from their synaptic organization (e.g. see Druckmann et al., 2007; Gleeson et al., 2007; Izhikevich and Edelman, 2008). The appropriateness of network responses was assessed by comparison with MEA and VSD recordings of network activity, which have recently become available for the cerebellum granular layer. Moreover, the availability of input spike patterns and neuronal responses in vivo (Vos et al., 1999; Chadderton et al., 2004; Jörntell and Ekerot, 2006; Rancz et al., 2007; Roggeri et al., 2008) has allowed to simulate granular layer network dynamics under conditions representative of natural activity states.
GENERAL PROPERTIES OF THE GRANULAR LAYER MODELThe network had a size suffi cient to reproduce a functionally relevant portion of the cerebellar granular layer, i.e. a cube with 100 µm edge length (Table 1 and Figure 1). The model included 315 mfs, 4393 neurons (4096 GrCs, 27 GoCs and 270 SCs/BCs) and more than 40000 synapses. The number of cells and synapses was large enough to maintain realistic convergence/divergence ratios (Eccles et al., 1967). On this scale, mf branching was not implemented (see Sultan and Heck, 2003). Moreover, to achieve inhibitory control over GoCs, a partial representation of the SC/BC was also included.
Network connections were constructed using precise rules, yet allowing the number of connections and synaptic weights to show statistical variability (Gaussian distribution: mean = 1, s.d. = 0.4; see Medina and Mauk, 2000). No systematic differences were observed using different seeds for parameter randomization, so that in several cases the same network confi guration was used to facilitate data
the molecular level, special importance has been attributed to NMDA and GABA-A (α1 and α6 subunit-containing) recep-tors (D’Angelo et al., 1995; Cull-Candy et al., 1998; Farrant and Nusser, 2005). These are highly sensitive to neurotransmitter spillover and are suitable to set the appropriate time constants for signal processing in the cerebellar glomerulus. Finally, neu-rotransmitter release probability at the mf-GrC synapse, which can be tuned by long-term synaptic plasticity (D’Errico et al., 2009), regulates the time course of EPSP temporal summation and spike emission. Thus, these factors need to be taken into account to appropriately simulate granular layer dynamics in the spatial, temporal and frequency domains.
The computational reconstruction of the granular layer reported in this work was based on biophysically realistic mod-els of granule cells (GrCs: D’Angelo et al., 2001; Diwakar et al., 2009) and Golgi cells (GoCs: Solinas et al., 2007a,b) and of their synapses (Nieus et al., 2006; Mapelli et al., 2009). The network, stimulated with patterns inspired to those observed in the mossy fi bers (mfs) in vivo, generated center-surround, time-window-ing, high-pass fi ltering and theta-frequency oscillations regulated by neurotransmitter release and NMDA and GABA-A synaptic receptors. Interestingly, the center-surround structure was capa-ble of fi ne-tuning the delay, number, and frequency of spikes generated by GrCs suggesting that the cerebellum granular layer behaves as a complex spatio-temporal fi lter, which can be adapted through long-term synaptic plasticity and coordinated by coher-ent oscillations.
MATERIALS AND METHODSThe granular layer network structure was generated on the basis of detailed anatomical and functional information (Eccles et al., 1967; Palkovits et al., 1971, 1972; Hámori and Somogyi, 1983; Jakab and Hámori, 1988; Harvey and Napper, 1991; Korbo et al., 1993; Sultan, 2001; Barmack and Yakhnitsa, 2008) and using models of neurons and synapses including biophysical repre-sentations of membrane ionic channels and receptors (D’Angelo
Table 1 | The constitutive elements of the granular layer network.
Num. Div. Conv. Transmitter Receptors Spillover Previous models
Glomeruli 315
GrC 4096 Nieus et al., 2006
GoC 27 Solinas et al., 2007a,b
SC/BC 270
mf→GrC 1:53 4:1 Glutamate AMPA, NMDA Yes Nieus et al., 2006
mf→GoC 1:3.6 50:1 Glutamate AMPA, NMDA Yes This paper – Cesana et al., 2009
GrC→GoC (pf) 1:1.9 100:1 Glutamate AMPA No This paper – from literature data
NMDA Yes
kainite Yes
GoC→GrC 1:600 4:1 GABA GABA-A (a1, a6) Yes Mapelli et al., 2009
SC/BC→GoC 1:1 6–50:1 GABA α-function – This paper
The table reports the number of elements in the network, the convergence and divergence ratios of connections, the transmitters and receptors involved, the presence of spillover and the references to previous models. All the corresponding mechanisms have been taken from the literature and are therefore not free parameters but rather constitutive elements of the network.

Frontiers in Cellular Neuroscience www.frontiersin.org May 2010 | Volume 4 | Article 12 | 3
Solinas et al. Modeling the granular layer network dynamics
comparison. Background noise in the network was generated by random spike patterns in mfs and pacemaking in GoCs and SC/BCs (see e.g. Häusser and Clark, 1997; Chadderton et al., 2004; Rancz et al., 2007). Neurons and synapses were endowed with multiple receptor and ionic channel-based mechanisms, allowing an accurate representation of neuronal fi ring. The synapses were endowed with neurotransmitter diffusion mechanisms and with a representation of vesicle cycling, generating spillover and developing short-term facilitation and depression. However, no molecular noise (e.g. from ionic diffusion, channel gating or receptor binding) or synaptic noise (e.g. from stochastic vesicle fusion) were introduced.
The model was written with NEURON-7.1. The simulation of 3 s of activity required about 20 h on a Pentium-5 dual-core but just 30 min using 80 CPUS on the CASPUR parallel cluster (http://www.caspur.it/en/). A graphical interface was written to represent the data as in MEA and VSD experiments.
SPECIAL PROPERTIES OF INHIBITORY CONNECTIVITYThe most relevant aspects of granular layer network organiza-tion depend on the inhibitory connections, which are therefore considered in detail. Lateral inhibition, as in other brain areas (Buzsáki, 2006), is an important structural property of the circuit. This has been reported since early anatomical investigations (e.g. see Eccles et al., 1967) and has recently been substantiated by electrophysiological recordings (Mapelli and D’Angelo, 2007). Lateral inhibition descended from the disproportionate exten-sion of the GoC axon compared to its dendritic afferent fi eld (i.e., the mossy fi bers excited an area including GrC and GoC basal dendrites, but then the GoC axon redistributed inhibition over a much larger area). Two relevant aspects of the inhibitory connections, which have recently been reported in experimen-tal investigations, have been taken into account in the model (Figure 1C).
FIGURE 1 | Network topology. (A) Elements of the network. (i) The whole network: the granular layer network was simulated as a cube with edge length 100 µm. It contained 4096 GrCs (blue dots), 27 GoCs (green spheres), and 315 glomeruli (red and cyan dots). The meaning of the eight glomeruli indicated with cyan dots is explained in (B). (ii) GoC–GrC divergence: the panel shows the glomeruli reached by a single GoC axon and GrCs inhibited therein. (iii) Mf–GoC convergence: The panel shows the glomeruli reaching a single GoC. Note that GoC–GrC divergence is wider than mf–GoC convergence, setting the basis for lateral inhibition. (B) Neurons responding to an input burst
delivered to a small mf bundle. In this example, which is drawn from the network shown in (A), eight glomeruli represented with cyan dots were supposed to delivered a burst (fi ve spike at 500 Hz) to the network. One of the GoCs excited by the burst [the same as in (ii)] is indicated with a large green dot. The GrCs are indicated with small dots: GrCs that are only inhibited are yellow, GrCs that are only excited are blue, GrCs that are both excited and inhibited are green. Note that excitation is concentrated in the center and inhibition in the surround. (C) Schematic drawing of network connectivity [same color code as in (B)].

Frontiers in Cellular Neuroscience www.frontiersin.org May 2010 | Volume 4 | Article 12 | 4
Solinas et al. Modeling the granular layer network dynamics
(3) The network connections were generated by applying simple rules, most of which can be directly extracted from original works on cerebellar architecture (e.g. see Eccles et al., 1967). (a) The GrC dendrites could not reach glomeruli farther than 40 µm (mean dendritic length 13.6 µm). (b) A single GrC was not allowed to project more than one dendrite inside the same glomerulus. (c) Only one GoC axon was allowed to enter a glomerulus forming inhibitory synapses on all the afferent GrC dendrites. (d) A GoC axon entering into one glomerulus was prevented from accessing the nei-ghboring glomeruli sharing GrCs with the fi rst glomerulus. This prevented a GrC from being inhibited twice through the same GoC, a case that does not seem to hold experimen-tally (see Mapelli et al., 2009). (e) Each GoC was allowed to access at most 40 glomeruli resulting in a maximum ∼2000 GrCs inhibited by the same GoC. (f) GoCs received exci-tation from 50 glomeruli and 100 GrCs through parallel fi bers (pfs) randomly selected within the network. These approximate numbers conform to existing estimates (Ito, 2006). (g) Each GoC was provided with an inhibitory input from SC/BC comprising two categories. One, equivalent to 6 SC/BC, provided a background rhythmic inhibition at 18.5 Hz (Häusser and Clark, 1997). The inhibitory SC/BC background activity was calibrated to balance the mf background activity in GoCs. The other, equivalent to 50 SC/BCs, provided dynamic inhibition through GrCs and pfs, implementing a dis-inhibitory loop. The dis-inhibi-tory loop was activated only to investigate network oscil-lations in Figure 8E and its intensity was regulated over various values.
In order to test the impact of the connectivity rules, in some modeling experiments a “mesh” confi guration was used. The “mesh” was built after removing the connectivity rules 3c and 3d reported above, so that GoCs were connected to GrC distributed all over the network. Nonetheless, each GrC still received the same number of excitatory and inhibitory synapses. A competitive growth algorithm would be desirable in the future.
IMPLEMENTATION OF NETWORK DYNAMICSThe neuron (GrC and GoC) models derived from previous models, which had been carefully tested against available experimental results in slices (D’Angelo et al., 2001; Nieus et al., 2006; Solinas et al., 2007a,b). These models were able to reproduce all the details of spike shape, timing and frequency in response to current injec-tion and synaptic stimulation. The synaptic models were adapted from the original scheme reported by Nieus et al. (2006) and were able to reproduce the kinetics and size of the EPSCs and IPSCs during repetitive synaptic transmission at the different synapses. These models accounted for vesicular dynamics, neurotransmitter spillover and receptor gating (including multiple closed, desen-sitized and open states) but not for quantal release mechanisms. The dynamics of synaptic responses were fully determined by the kinetic constants of synaptic and neuronal models. Given the short distances traveled by the spikes, axonal conduction times were considered negligible. Transmission delay was 1 ms for all the synapses.
First, ultrastructural measurements have revealed that each GrC receives on average three GoC inhibitory synapses (Hámori and Somogyi, 1983), but has left open the problem on whether these synapses originated from the same or from different GoCs. Typically, GrC IPSCs can be recruited by raising stimulation inten-sity (Mapelli et al., 2009), suggesting that three to four independ-ent GoCs are indeed connected. Recordings from GoC-GrC pairs further support this connectivity by showing that the size of the GoC-GrC IPSCs is equivalent to the minimal response generated by single fi ber stimulation (Mapelli et al., 2009).
Secondly, since glomeruli receive about 50 dendrites from as many different GrCs, the additional issue is whether a GoC inner-vates all the GrCs impinging on the same glomerulus. Even minimal stimulation (i.e. one that activates a single synaptic contact) can elicit a direct and an indirect spillover-mediated component in GrC IPSCs (Mapelli et al., 2009). Since spillover is a sign of release on neighboring synapses in the glomerulus (Rossi and Hamann, 1998), a GoC axon should inhibit numerous (if not all) GrC dendrites in the same glomerulus.
Therefore, in addition to lateral inhibition, the GoC-GrC con-nections were implemented with these topological rules: a GoC was not allowed to innervate a GrC more than once (and therefore did not innervate adjacent glomeruli) and each glomerulus was fully innervated by a single GoC. In fact these rules are a simplifi cation, since do not separate direct from indirect inhibition. An explicit representation of the glomerulus with internal diffusion allow-ing for independent generation of direct and indirect IPSCs may further improve this description.
NETWORK ARCHITECTURE AND GENERATION OF NETWORK CONNECTIONSThe generation of the model network occurred in three steps: (1) calculating the number of constitutive elements, (2) distributing the elements in space, and (3) connecting the elements.
(1) Starting from a GrC density of 4 × 10⁶/mm3, the density of GoCs was calculated to be ∼9000/mm3 to respect the ratio 1:430 reported by Korbo et al. (1993). The density of glome-ruli was calculated from the convergence/divergence ratio of the mf-GrC connections. Each glomerulus includes a mean of 53 dendrites from different GrCs and each GrC emits on average four dendrites (Jakab and Hámori, 1988). The den-sity of glomeruli was calculated as (4 × 10⁶/mm3 × 4 den-drites)/(53 dendrites/glomerulus) ≈ 3 × 10⁵/mm3. Although in this network there is space for just 9 GoCs, their number was increased to 27 to compensate for the inhibitory connec-tions that should occur in GrCs (a total of 4096 × 4 = 16384 inhibitory connections) but cannot be generated by the nine internal GoCs (providing only 600 × 9 = 5400 inhibitory con-nections). The missing 10984 inhibitory connections were generated by 18 additional GoCs (10984/600 = 18) located outside the network but projecting their axons inside it.
(2) After having calculated the number of constitutive elements (GrCs, glomeruli and GoCs and their synapses), these were placed into the network volume with coordinates drawn from a uniform random distribution. The next step was to connect these elements together.

Frontiers in Cellular Neuroscience www.frontiersin.org May 2010 | Volume 4 | Article 12 | 5
Solinas et al. Modeling the granular layer network dynamics
In order to conform to in vivo conditions, all models had to be adapted from their original temperature T
orig to T
sim = 37°C using
the correction factor Q10
(Tsim–Torig)/10 (Gutfreund et al., 1995; see also Traub and Llinas, 1979; Traub et al., 1991; Vanier and Bower, 1999). We have used: Q
10 = 3 for ionic channel gating, Q
10 = 2.4 for
receptor gating, Q10
= 1.5 for ionic channel permeation, Q10
= 1.3 for neurotransmitter diffusion, Q
10 = 3 for Ca2+ pumps and buff-
ers, Q10
= 1.3 (GrC) or 1.7 (GrC) for intracellular Ca2+ diffusion. Following adaptation at 37°C, the models were in matching with recordings at this same temperature (data not shown). The basic properties of GrCs and GoCs embedded into the granular layer network are shown in Figures 2–4.
SINGLE CELL AND SYNAPTIC MODELSThe GrC model was adapted from Nieus et al. (2006) by apply-ing appropriate Q
10 corrections. In addition, the GABA leak-
age conductance was increased by two times (60 µS/cm2), the Inward rectifier K+ conductance was increase by 1.5 times (1350 µS/cm2) and the leakage reversal potential was adjusted to restoring resting potential to −70 mV (see D’Angelo et al., 2001). With this asset, the GrC model properly reproduced responses to current injection at 37°C (data not shown) and spike trains observed in vivo (Chadderton et al., 2004; Jörntell and Ekerot, 2006) reaching maximum firing rates as high as 500 Hz (see Figure 2B
1).
The GoC model was adapted from Solinas et al. (2007a,b) by applying appropriate Q
10 corrections.
Without needing any further change, the GoC model properly reproduced responses to peripheral stimulation observed in vivo (Vos et al., 1999) and could reach a maximum fi ring rate of 350 Hz (see Figure 2B
2).
The SC/BC models, in the absence of detailed computational representations, were designed as random spike generators with a basal fi ring of 18.5 Hz (Armstrong and Rawson, 1969; Häusser and Clark, 1997).
The mf-GrC synapses take part to the formation of the cerebel-lar glomerulus, are glutamatergic and activate AMPA and NMDA receptors. The release, diffusion and ionic receptor mechanisms were the same reported by Nieus et al. (2006). Using a prob-ability of release of 0.6, the model was able to faithfully repro-duce postsynaptic currents recorded at 37°C in vitro (Saviane and Silver, 2006) and in vivo (Chadderton et al., 2004; Rancz et al., 2007). The time constant of the recovery from depression, τ
REC = 8 ms, was derived from in vivo measurements (Jörntell
and Ekerot, 2006) and allowed to reproduce natural dynam-ics of short-term plasticity (the time constants of presynaptic facilitation and vesicle inactivation were set to τ
facil = 5 ms and
τI = 1 ms, respectively).
The mf-GoC synapses are similar in several respects to the mf-GrC synapses. They are also located within the cerebellar glomeru-lus (Eccles et al., 1967) and are glutamatergic activating both AMPA and NMDA receptors (Kanichay and Silver, 2008; Cesana et al., 2009). The mf-GoC synapse was adapted from the mf-GrC synapse model (see above) to reproduce a peak postsynaptic current of −66 pA (Cesana et al., 2009; see Figures 2–5). Release probability and vesicle cycling parameters were set at the same values as at the mf-GrC synapse.
The GrC-GoC synapses are formed by pfs onto GoC apical dendrites in the molecular layer (Palay and Chan-Palay, 1974). These glutamatergic synapses activate AMPA, NMDA and Kainate-receptors (Dieudonné, 1998; Bureau et al., 2000; Misra et al., 2000). During repetitive stimulation, the AMPA current shows synaptic depression while the Kainate and NMDA currents show slow tem-poral summation. AMPA and NMDA currents were taken from the mf-GrC synapses and the kainate receptor current was modifi ed from the AMPA kinetic scheme. Release probability was 0.1 and vesicle cycling parameters were set at the same values as at the mf-GrC synapse.
The GoC-GrC synapses are GABAergic and impinge on GrC dendrites within the glomeruli. GABAergic neurotransmission was modeled based on Mapelli et al. (2009). The GABA-A receptor schemes comprised channels with fast (α1) and slow (α6) kinetics and GABA spillover generating the transient and sustained com-ponents of inhibition observed experimentally. In order to account for experimental results (Mapelli et al., 2009), the parameters describing presynaptic dynamics were: release probability = 0.35, τ
REC = 36 ms, τ
facil = 58.5 ms and τ
I = 0.1 ms, respectively (Mapelli
et al., 2009).The SC/BC-GoC synapses are GABAergic and impinge on the
GrC apical dendrites in the molecular layer. The postsynaptic current resulting from a single spike was described by a double-exponential function with τ
1 = 0.26 ms, τ
2 = 15 ms, and 1370 pS
maximum conductance, similar to synapses made by the same neurons onto Purkinje cells (see Jaeger et al., 1997).
PATTERNS OF ACTIVITYThe granular layer shows a background activity state, over which the mf inputs generate evoked responses. In brain slice record-ings, mfs and GrCs are silent, GoCs show rhythmic spontaneous activity at around 6 Hz (Dieudonné, 1998; Forti et al., 2006) and SC/BCs show rhythmic spontaneous activity at around 18.5 Hz (Häusser and Clark, 1997). Evoked activity occurs in GrC clus-ters of about 30 µm diameter (Mapelli et al., 2010a), which may represent granular layer functional units (Sultan and Heck, 2003). In the anesthetized rat in vivo, the mfs show a low basal activity (<1 Hz), GrCs generate sporadic spikes (<0.1 Hz) (Chadderton et al., 2004; Rancz et al., 2007), GoCs show a basal activity at 1–18 Hz (mean = 8.42, numeric cv = 0.43; Vos et al., 1999) and SC/BCs show a basal activity at 47 ± 17 Hz (Wang et al., 2009). Following punctuate sensory stimulation, mfs convey high-fre-quency bursts and GrCs and GoCs respond after short delay gen-erating themselves short bursts at 200–300 Hz (Vos et al., 1999, 2000; Chadderton et al., 2004; Jörntell and Ekerot, 2006; Rancz et al., 2007). These responses are clustered in small areas and can be detected by measuring the corresponding local fi eld potentials (Roggeri et al., 2008).
Spontaneous activityBackground activity in the model was generated by the follow-ing mechanisms. (i) The mfs were activated with a random spik-ing activity. Spike timing was drawn from a Poisson distribution (mean = 1 Hz, cv
2 = 0.9; see below for cv
2 defi nition). (ii) GoCs were
spontaneously active and their spike frequency and cv2 matched the
range reported in vivo once mfs and SC/BC were made active them-

Frontiers in Cellular Neuroscience www.frontiersin.org May 2010 | Volume 4 | Article 12 | 6
Solinas et al. Modeling the granular layer network dynamics
selves. (iii) SC/BCs were endowed with a random spiking activity drawn from a Poisson distribution (mean = 18.5 Hz, cv2 = 0.9). It should be noted that SC/BC functions were critical to control the basal activity state of GoCs. When the SC/BC random activity was turned off, the GoCs showed an unnaturally high fi ring fre-quency and blocked granular layer signal processing (unpublished observations).
Evoked activityThe mf bursts generated by punctuate tactile stimulation are composed of 5–10 spikes with an average frequency around 100 Hz and instantaneous frequencies as high as 700 Hz in the anesthetized rat (Chadderton et al., 2004; Rancz et al., 2007). More protracted stimuli have been reported to generate longer bursts with frequencies modulated between a few Hz and 500 Hz in the behaving monkey (Kase et al., 1980) and up to 1000 Hz in the decerebrated cat (Jörntell and Ekerot, 2006). Evoked activ-ity was simulated by stimulating eight contiguous unbranched mfs in the middle of the network (see Figure 1), which acti-vated ∼30 µm large GrC clusters. The stimuli consisted in spike bursts of different frequencies and duration, as indicated in the specifi c result sections (Figures 2–7), overriding the ongoing background activity.
DATA ANALYSISSimulation results were stored for offl ine analysis and processed using customized MATLAB programs (The MathWorks, Natick, MA, USA).
Single cell activities were analyzed as in ordinary patch-clamp experiments (averages of up to 150 simulations were required to overcome the irregularity generated by background network activity). The auto- and cross-correlograms (e.g. see Figure 8) were generated using data from 3-s long simulations. In order to display the average fi ring rate of an individual cell, the histograms were normalized by the total number of cells, by the number of stimula-tion spikes and by the bin width (1 ms).
Spatially organized activity was analyzed as in VSD experi-ments. Activity images (e.g. see Figure 5A) were reconstructed from the membrane potential of individual GrCs generating an average response within a volume. The peak of the cumulative depolarization of GrCs contained within the given volume was in fact a function of spike synchrony and frequency (see Mapelli et al., 2010b). To keep into account image blurring due to light diffraction in VSD imaging recordings (Mapelli et al., 2010b), simulated images were constructed from GrCs located within ±10 µm from the focal plane. The spatial profi le of responses to focal mf stimulation was constructed by computing the mean depolarization of GrCs located within spherical shells with radius between 5 and 35 µm from the core of excitation. The gain of transmission of mf bursts was evaluated by measuring the granu-lar layer output at a given frequency relative to the single-pulse response (Figure 7).
In order to quantify the excitatory–inhibitory balance (E-I bal-ance), the reconstructed VSD images were analyzed as in MEA experiments. The network was stimulated to make a doublet of spikes. The intensity of excitation was measured at the peak of the fi rst spike in control conditions. The intensity of inhibition
was estimated by the changes in the second spike caused by GABA receptor blockage (see Mapelli and D’Angelo, 2007; see Figure 5).
In this work three defi nitions of the coeffi cient of variation were used for consistency with different experimental works: cv = SD/mean, numeric cv = MAD/median, cv
2 = mean [2 × |ISI
n + 1 − ISI
n|/
(ISIn + 1
+ ISIn)] (Holt et al., 1996).
RESULTSRESPONSE OF SINGLE GrCs AND GoCs EMBEDDED INTO THE GRANULAR LAYER NETWORKOnce embedded into the network, single neurons receive a con-tinuous barrage of excitatory and inhibitory synaptic inputs driven by network-dependent activity. This can alter short-term facilita-tion and depression and the threshold and precision of spike fi ring (Dobrunz and Stevens, 1999; Klyachko and Stevens, 2006). The intrinsic responsiveness and synaptic activation of single GrCs and GoCs was assessed in model neurons embedded into the simulated granular layer network (Figures 2–4), which generated a continu-ous background activity (see Materials and Methods). Intrinsic responsiveness was assessed through intracellular current injection and synaptic responses were elicited by delivering a 100-Hz burst composed of fi ve impulses over a small bundle of eight adjacent and unbranched mfs. With this stimulus, the response occupied a surface of about 30 µm diameter refl ecting the spots observed with VSD recordings in slices (Mapelli et al., 2010a,b) and matching the granular layer functional units reported by Sultan and Heck (2003) (the spatial aspects of the response are considered in detail below, see Figures 5 and 6).
The GrC model (Figure 2A1) background activity comprised EPSPs generated by mfs and IPSPs generated by GoCs, while spon-taneous fi ring was almost absent. The GrC model properly repro-duced responses to current injection (Figure 2B1; D’Angelo et al., 1995, 2001). Most salient properties were non-sagging inward rec-tifi cation in the subthreshold range and regular fi ring with almost no adaptation during depolarization, with maximum frequencies as high as 500 Hz (Figure 2B1). In response to a brief mf burst, the GrC model showed various responses depending on the number of active excitatory synapses and on the number and timing of IPSPs received through the mf-GoC-GrC (feed-forward) and mf-GrC-GoC-GrC (feed-back) loops (Figure 2C1). In response to a short mf spike burst, the GrC model generated EPSPs showing short-term depression of the transient component and temporal summation of the protracted component, which could lead to brief spike bursts. The background and evoked activity of GrCs faithfully reproduced patch-clamp recordings in vivo (Eccles et al., 1967; Chadderton et al., 2004; Jörntell and Ekerot, 2006; Rancz et al., 2007).
The GoC model (Figure 2A2) showed spontaneous activity determined by its pacemaker properties (Dieudonné, 1998; Forti et al., 2006) and modulated by mf, pf and SC/BC synaptic inputs. The GoC maintained a fi ring rate of 8.4 Hz with cv
2 = 0.44, con-
sistent with recordings in vivo (Vos et al., 1999; Solinas et al., 2007b). Upon current injection (Figure 2A2), the GoC model showed the complex repertoire of dynamic rebounds observed in recordings in slices, including fi ring with adaptation during depolarization, sagging inward rectifi cation during hyperpolari-zation, rebound excitation on return to the resting state from
Frontiers in Cellular Neuroscience www.frontiersin.org May 2010 | Volume 4 | Article 12 | 7
Solinas et al. Modeling the granular layer network dynamics
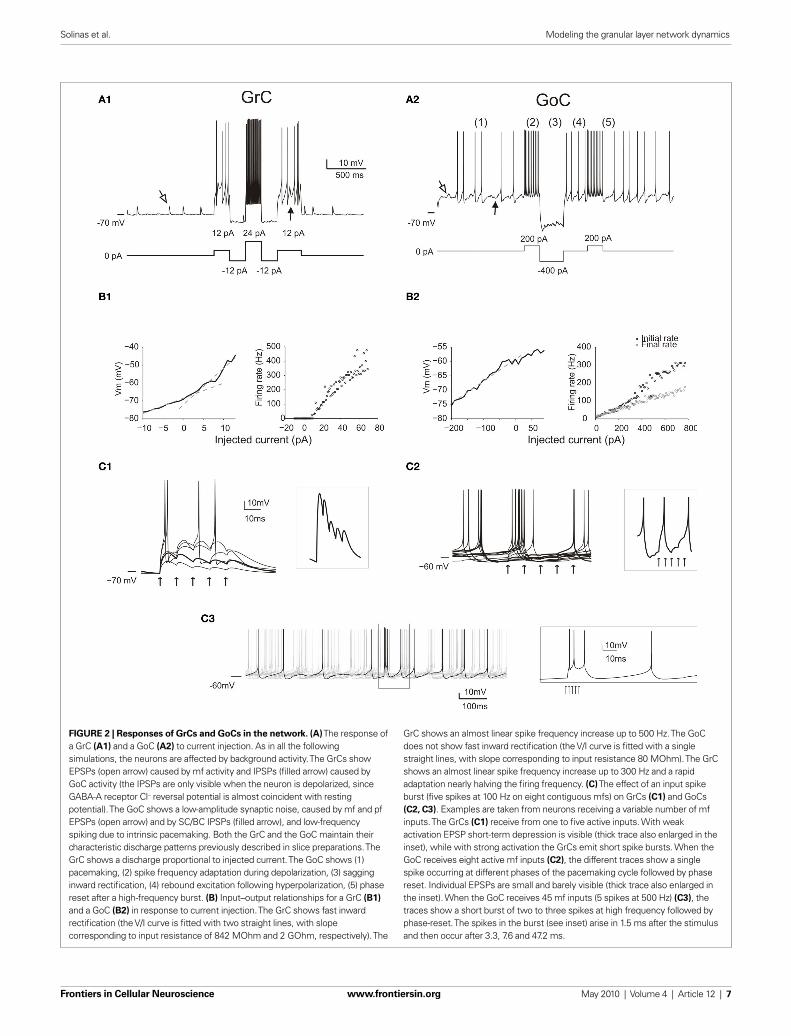
FIGURE 2 | Responses of GrCs and GoCs in the network. (A) The response of a GrC (A1) and a GoC (A2) to current injection. As in all the following simulations, the neurons are affected by background activity. The GrCs show EPSPs (open arrow) caused by mf activity and IPSPs (fi lled arrow) caused by GoC activity (the IPSPs are only visible when the neuron is depolarized, since GABA-A receptor Cl− reversal potential is almost coincident with resting potential). The GoC shows a low-amplitude synaptic noise, caused by mf and pf EPSPs (open arrow) and by SC/BC IPSPs (fi lled arrow), and low-frequency spiking due to intrinsic pacemaking. Both the GrC and the GoC maintain their characteristic discharge patterns previously described in slice preparations. The GrC shows a discharge proportional to injected current. The GoC shows (1) pacemaking, (2) spike frequency adaptation during depolarization, (3) sagging inward rectifi cation, (4) rebound excitation following hyperpolarization, (5) phase reset after a high-frequency burst. (B) Input–output relationships for a GrC (B1) and a GoC (B2) in response to current injection. The GrC shows fast inward rectifi cation (the V/I curve is fi tted with two straight lines, with slope corresponding to input resistance of 842 MOhm and 2 GOhm, respectively). The
GrC shows an almost linear spike frequency increase up to 500 Hz. The GoC does not show fast inward rectifi cation (the V/I curve is fi tted with a single straight lines, with slope corresponding to input resistance 80 MOhm). The GrC shows an almost linear spike frequency increase up to 300 Hz and a rapid adaptation nearly halving the fi ring frequency. (C) The effect of an input spike burst (fi ve spikes at 100 Hz on eight contiguous mfs) on GrCs (C1) and GoCs (C2, C3). Examples are taken from neurons receiving a variable number of mf inputs. The GrCs (C1) receive from one to fi ve active inputs. With weak activation EPSP short-term depression is visible (thick trace also enlarged in the inset), while with strong activation the GrCs emit short spike bursts. When the GoC receives eight active mf inputs (C2), the different traces show a single spike occurring at different phases of the pacemaking cycle followed by phase reset. Individual EPSPs are small and barely visible (thick trace also enlarged in the inset). When the GoC receives 45 mf inputs (5 spikes at 500 Hz) (C3), the traces show a short burst of two to three spikes at high frequency followed by phase-reset. The spikes in the burst (see inset) arise in 1.5 ms after the stimulus and then occur after 3.3, 7.6 and 47.2 ms.

Frontiers in Cellular Neuroscience www.frontiersin.org May 2010 | Volume 4 | Article 12 | 8
Solinas et al. Modeling the granular layer network dynamics
hyperpolarization and phase-reset on return to the resting state from burst fi ring (Solinas et al., 2007a,b). The GoC model reached fi ring rates as high as 350 Hz (Figure 2B2). In response to a brief mf burst (Figure 2C2), the GoC model generated EPSPs deter-mined by direct mf-GoC activation and by propagation of activity through the mf-GrC-GoC loop (Cesana et al., 2009). With a weak input (8 mfs) the GoC generated a single spike and phase reset the pacemaker. With a strong input (45 mfs) the GoC generated a brief burst composed of two to three spikes followed by phase reset (Figure 2C
3, inset) as observed following punctuate stimulation
in vivo (Vos et al., 1999; Solinas et al., 2007b). The spikes were generated in 1.5 ms and the burst reached an initial frequency of over 300 Hz (cf. Kanichay and Silver, 2008). The background and evoked activity of GoCs as well as their fi ring patterns are in keeping with extracellular recordings in vivo (for review and other references see D’Angelo, 2008).
These simulations show that the GrC and GoC models [for GrCs: D’Angelo et al. (2001), Nieus et al. (2006), Diwakar et al., (2009); for GoCs: Solinas et al. (2007a,b)] adapted to 37°C and subjected to background and stimulated network activity, were able to reproduce the typical response patterns observed in vivo [for GrC: Chadderton et al. (2004), Jörntell and Ekerot (2006), Rancz et al. (2007); for GoC: Vos et al. (1999)].
SUBCELLULAR MECHANISMS DETERMINE TIMING OF GrC AND GoC RESPONSES IN THE NETWORKWhile neuronal responses in slices look stereotyped, the responses of GrCs and GoCs embedded into the network show a remark-able variability. This is due to random background activity, to variations in the number and strength of synaptic contacts and to the assortment of excitatory and inhibitory fi bers impinging on a given cell. Figure 3 shows the cell-specifi c contribution of glutamate and GABA-A receptors to dendritic responses of GrCs and GoCs.
Fast excitatory transmission was ensured through AMPA receptor-mediated currents, which showed short-term depres-sion at the mf-GrC and mf-GoC synapses and short-term facilita-tion at the pf-GoC synapses. Slow excitation was sustained by the NMDA and the kainate receptor-mediated currents, the former being most evident at the mf-GrC synapse and the latter being specifi cally expressed at the pf-GoC synapse (Dieudonné, 1998; Bureau et al., 2000; Misra et al., 2000; Kanichay and Silver, 2008; Cesana et al., 2009). Thus, whereas all excitatory synapse could effi ciently react to spike bursts, only the mf-GrC synapse was sen-sitive to fast transitions in fi ring rate. Inhibition was mediated by GABA-A currents both at the GoC-GrC and at the SC/BC-GoC synapses. At the GoC-GrC synapses, GABAergic currents were protracted by the slow kinetics of GABA-A α6 receptors (see below; D’Angelo et al., 1995; Rossi and Hamann, 1998; Mapelli et al., 2009). Therefore, potentially, the network could implement the time-window mechanism (requiring fast GrC responses and delayed GoC reaction through the mf-GoC-GrC or feed-forward inhibitory loop; D’Angelo and De Zeeuw, 2009), high pass fi ltering (requiring frequency-dependent build-up of the burst response through NMDA currents at the mf-GrC relay), and slow oscillations (through the pf-GoC-GrC or feed-back inhibitory loop). These properties are considered below.
GLOMERULAR TRANSMISSION: POSTSYNAPTIC RECEPTOR ACTIVATION AND RELEASE PROBABILITYAmong the processes controlling the GrC response, there are some that merit specifi c mention, since they are thought to confer the GrC with specifi c integration properties: the regulation of synaptic excitation by NMDA and GABA-A receptors and the regulation of neurotransmission by mf-GrC release probability (Figure 4A). In addition to AMPA receptors, GrCs have the most prominent expression of NMDA receptors in the cerebellum (Cull-Candy et al., 1998) and, unique in the brain, express the α6 subunit of GABA-A receptors (Farrant and Nusser, 2005). Both NMDA and GABA-A α6 receptors have slow kinetics and are highly sensitive to neurotransmitter spillover (see also Figure 3).
In these simulations, blocking the NMDA receptors mark-edly reduced EPSP temporal summation delaying and curtail-ing the GrC response, while blocking GABA-A α1 and GABA-A α6 receptors sorted the opposite effect. The time of occurrence for the 1st, 2nd, 3rd, 4th spikes was 6.5 ± 1.1 (n = 20), 14.1 ± 1.3 (n = 5), 24.6 ± 1.3 (n = 4), 36.4 ± 1.6 (n = 4) ms in control; 5.4 ± 0.4 (n = 34), 16.0 ± 2.0 (n = 35), 24.4 ± 1.6 (n = 37), 34.5 ± 1.9 (n = 21) ms with α6 receptor block; 5.3 ± 0.5 (n = 36), 13.3 ± 1.0 (n = 106), 23.6 ± 0.8 (n = 34), 33.4 ± 0.6 (n = 64) ms with α1 and α6 recep-tor block. Thus, both α1- and α6-containing GABA-A receptors controlled the number and the regularity of GrC spike discharge.
Mf-GrC release probability can be tuned by long-term synap-tic plasticity (Sola et al., 2004; D’Errico et al., 2009) and regulate the rate of short-term depression and EPSP temporal summation (Nieus et al., 2006). In the model, GrC spikes at low release prob-ability were delayed and less numerous compared to those at high release probability (Figure 4A), confi rming the experimental obser-vations obtained during LTP and LTD recordings in slices and in vivo (Nieus et al., 2006; Roggeri et al., 2008).
Once considering the whole GrC-GoC circuit, the relative timing of GrC and GoC activity became evident (Figure 4B). In response to an input burst, the GrCs and GoCs coactived by the same mf set fi red almost at the same time (it should be noted that the reac-tion time of GrCs and GoCs conforms to experimental measure-ments: D’Angelo et al., 1995; Kanichay and Silver, 2008; Cesana et al., 2009). An additional delay was due to the time spent at the GoC-GrC synapse for GABA release and for the opening of GABA channels. This allowed the GrCs to generate a short spike burst before being inhibited.
These observations indicate that the mechanisms and reaction times of the circuit are appropriate to implement spatio- temporal fi ltering according to the time-window hypothesis (see also Figures 2 and 3; D’Angelo and De Zeeuw, 2009).
LATERAL INHIBITION AND CENTER-SURROUND ORGANIZATION OF THE GRANULAR LAYER RESPONSEA main organizing principle deriving from MEA (Mapelli and D’Angelo, 2007) and VSD (Mapelli et al., 2010a,b) experiments is that activation of the mf bundle generates alternated areas of excitation and inhibition, which, on average, are organized in a center-surround manner. The origin of this effect has been attributed to the larger extension of the GoC inhibitory fi eld compared to the GoC input through the basal dendrites, but a single center-surround structure was experimentally hard to
Frontiers in Cellular Neuroscience www.frontiersin.org May 2010 | Volume 4 | Article 12 | 9
Solinas et al. Modeling the granular layer network dynamics
in the surround. This effect was particularly evident by comparing the PSTH generated by two exemplar GrCs, one in the center and the other in the surround (Figure 6A).
Inhibition in the model respected two rules derived from experi-mental observations. Just one GoC axon was allowed to enter into a glomerulus and to form inhibitory synapses on all the GrC den-drites therein. Moreover, a GoC axon entering a glomerulus was prevented from accessing the neighboring glomeruli, which shared GrCs with the fi rst glomerulus. This prevented a GrC from being inhibited twice through the same GoC (see Mapelli et al., 2009) and clustered inhibitory synapse belonging to closed mf-GrC-GoC-GrC and mf-GoC-GrC loops. The extent to which the center- surround organization depended on this synaptic organization of inhibition was assessed by comparison with a mesh-like GoC-GrC connec-tivity merely based on statistics. In the mesh confi guration, late spikes were more common and the time-window effect was less pronounced (Figure 6B). The core remained more excited after the fi rst spike, while the surround appeared less affected (Figure 6C). Thus, time-window and the center-surround effects generated by the feed-forward inhibitory loop were enhanced by the specifi c topology of inhibitory connections.
These simulations suggest that the center-surround organization benefi ts of the specifi c connectivity of the inhibitory synapses and allows for a selective control of spike transfer through the core, as further considered below.
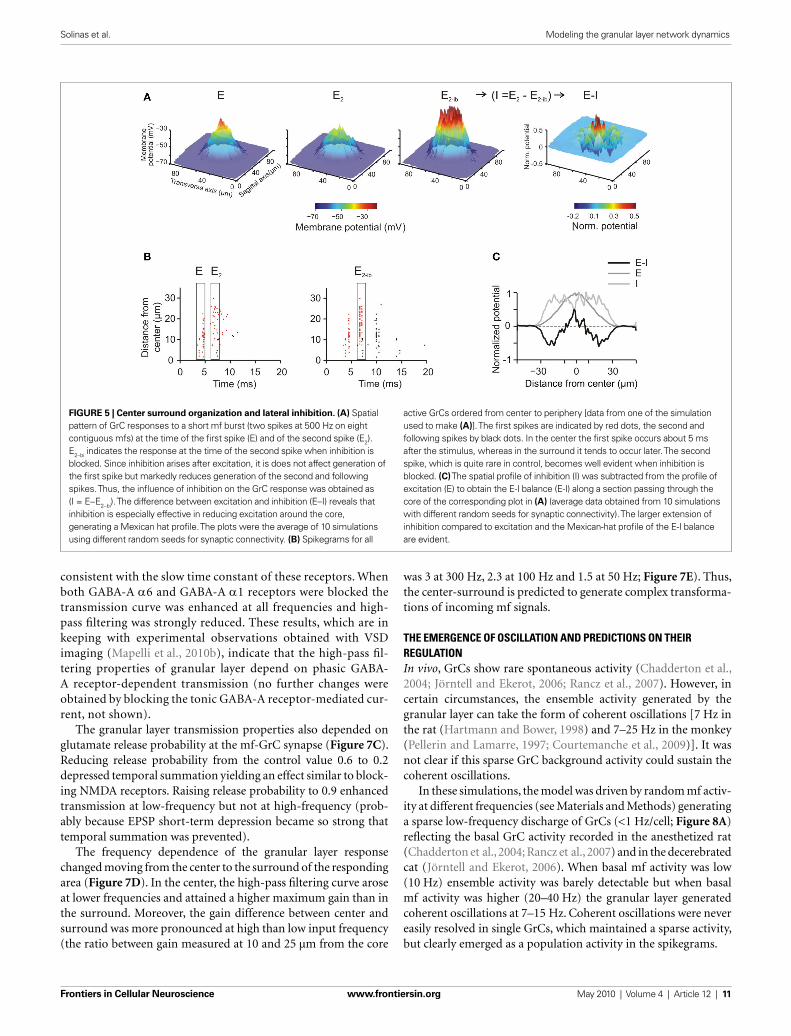
isolate. To test the center-surround hypothesis, the model was activated through eight neighboring unbranched mfs with 500-Hz bursts composed of just two spikes (similar results were also obtained with longer bursts, data not shown). Mf stimulation caused a doublet of spikes forming a spot of activity that degraded around the core. Then, blocking inhibition increased the inten-sity and extension of the response. As explained in our previous paper (Mapelli and D’Angelo, 2007), the difference between the response before and after inhibition allowed to quantify the exci-tatory– inhibitory balance (E-I balance) (Figure 5A, right). The E-I balance was evaluated using the fi rst peak to estimate excita-tion and the changes of the second peak caused by GABA receptor blockage to estimate inhibition (see Mapelli and D’Angelo, 2007, Materials and Methods and Figure 5B). The spatial profi le of the E-I balance revealed a Mexican-hat profi le indicative of center-surround organization, in which inhibition overcomes excitation around the core (Figure 5C).
THE IMPACT OF CENTER-SURROUND ORGANIZATION ON SPIKE TRANSMISSIONThe center surround organization bore consequences for the way spikes were transmitted through the granular layer. In the center, where the E-I balance is higher, the depolarization was faster and the inhibitory window closed more slowly, so that the GrCs emitted spike bursts with shorter delay, higher rate and longer duration than
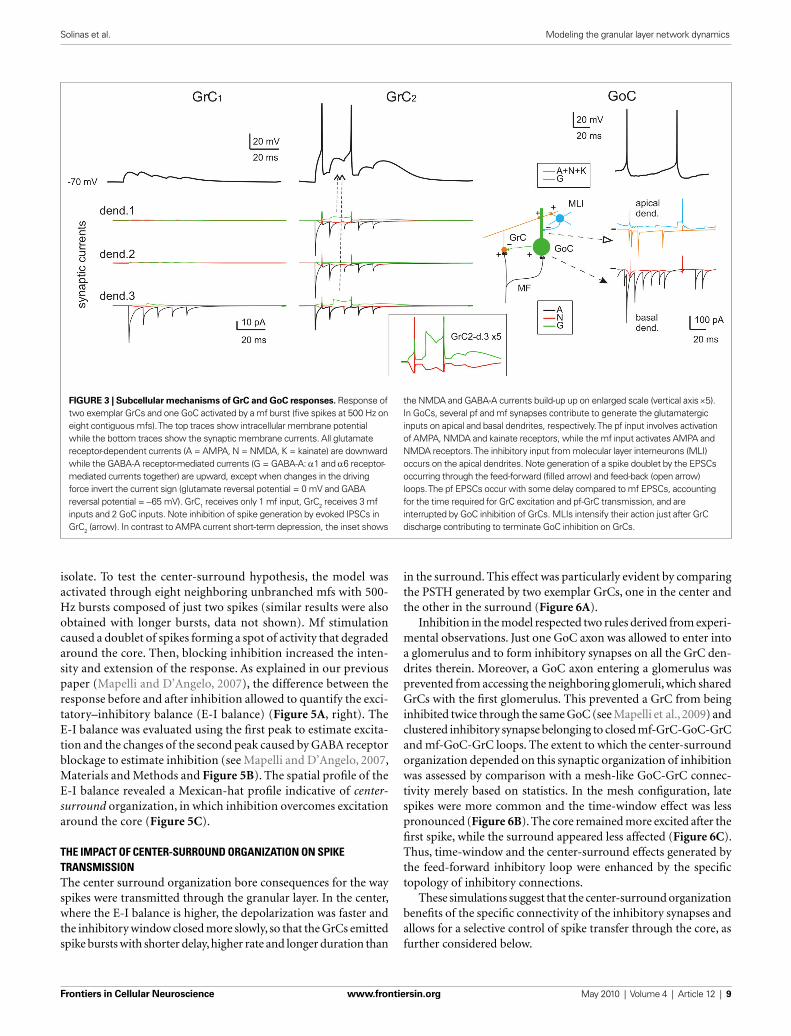
FIGURE 3 | Subcellular mechanisms of GrC and GoC responses. Response of two exemplar GrCs and one GoC activated by a mf burst (fi ve spikes at 500 Hz on eight contiguous mfs). The top traces show intracellular membrane potential while the bottom traces show the synaptic membrane currents. All glutamate receptor-dependent currents (A = AMPA, N = NMDA, K = kainate) are downward while the GABA-A receptor-mediated currents (G = GABA-A: α1 and α6 receptor-mediated currents together) are upward, except when changes in the driving force invert the current sign (glutamate reversal potential = 0 mV and GABA reversal potential = −65 mV). GrC1 receives only 1 mf input, GrC2 receives 3 mf inputs and 2 GoC inputs. Note inhibition of spike generation by evoked IPSCs in GrC2 (arrow). In contrast to AMPA current short-term depression, the inset shows
the NMDA and GABA-A currents build-up up on enlarged scale (vertical axis ×5). In GoCs, several pf and mf synapses contribute to generate the glutamatergic inputs on apical and basal dendrites, respectively. The pf input involves activation of AMPA, NMDA and kainate receptors, while the mf input activates AMPA and NMDA receptors. The inhibitory input from molecular layer interneurons (MLI) occurs on the apical dendrites. Note generation of a spike doublet by the EPSCs occurring through the feed-forward (fi lled arrow) and feed-back (open arrow) loops. The pf EPSCs occur with some delay compared to mf EPSCs, accounting for the time required for GrC excitation and pf-GrC transmission, and are interrupted by GoC inhibition of GrCs. MLIs intensify their action just after GrC discharge contributing to terminate GoC inhibition on GrCs.

Frontiers in Cellular Neuroscience www.frontiersin.org May 2010 | Volume 4 | Article 12 | 10
Solinas et al. Modeling the granular layer network dynamics
enhancement of excitation matched the high-pass fi ltering properties of the granular layer observed experimentally (Mapelli et al., 2010b).
The granular layer transmission properties strictly depended on specifi c synaptic receptors (Figure 7C). When NMDA receptors were blocked, the transmission curve was selectively depressed at low-frequency (below 20 Hz, where EPSP temporal summation was more critically dependent on NMDA receptors; cf. D’Angelo et al., 1995) but the high-pass fi ltering properties were maintained. When GABA-A α6 receptors were blocked, the transmission curve was enhanced especially at low frequency,
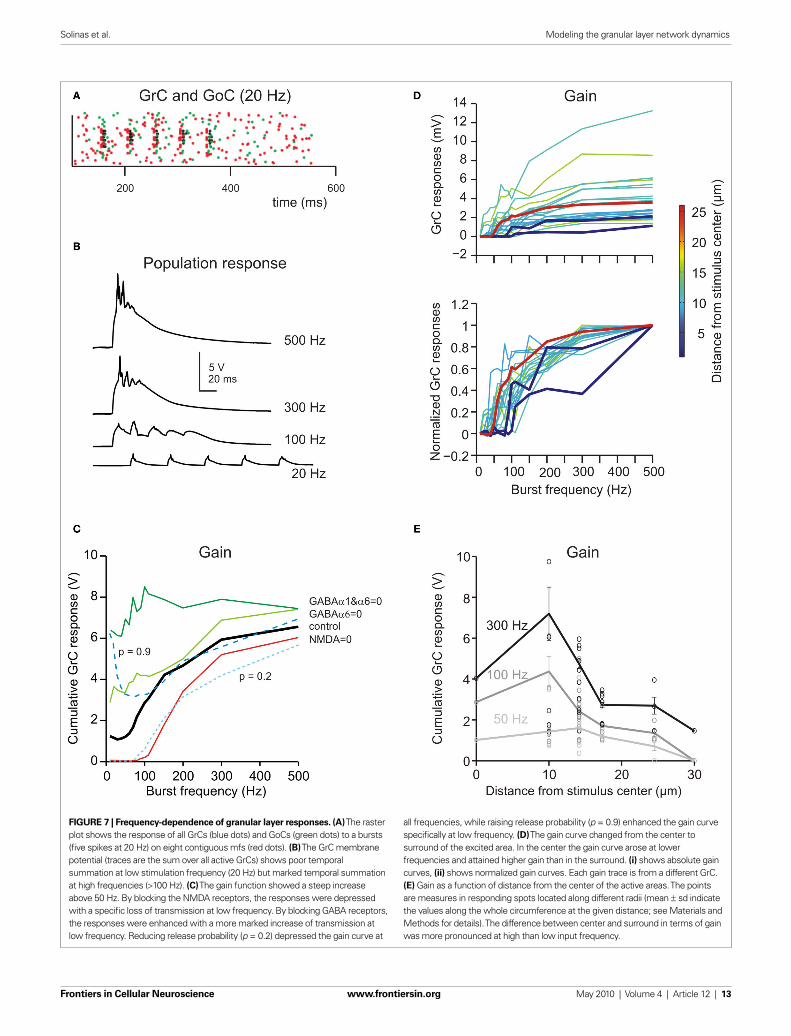
FREQUENCY-DEPENDENCE OF GRANULAR LAYER TRANSMISSION AND PREDICTIONS ON ITS REGULATIONThe mfs can discharge at different frequencies (Kase et al., 1980; Van Kan et al., 1993, 1994; Arenz et al., 2008). In the model, the network was stimulated using bursts of fi ve impulses activating eight neighboring mfs repeated at frequencies between 5 and 500 Hz (Figure 7A; see Materials and Methods). Raising stimula-tion frequency from 5 to 500 Hz increased temporal summation (Figure 7B) and spike generation in GrCs. As a consequence, the response increased following a sigmoidal gain curve with cut-off frequency around 100 Hz (Figure 7C). The frequency- dependent
FIGURE 4 | The impact of molecular/cellular mechanisms on GrC synaptic
excitation in the network. (A) Response of GrCs activated by a mf burst (fi ve spikes at 100 Hz on eight contiguous mfs). Each group of traces corresponds to the same 52 GrCs sharing a common bursting mf. The underlying PSTH reports the probability of spike occurrence in 1-ms bins for all (250) GrCs responding to the mf burst. Note that the switch-off of GABA-A α6 receptors and even more of GABA-A α1 + GABA-A α6 receptors, which control the fast and slow components of inhibition, considerably enhances spike generation protracting the duration of the output burst. Blocking the NMDA receptors prevents EPSP
temporal summation reducing the GrC response. Decreasing release probability slows down temporal summation while increasing release probability accelerates temporal summation, with opposite effects on the rate of the GrC resposne. (B) The raster-plot shows the timing of individual spikes in different conditions for the same 52 GrCs shown in (A) and for 5 GoC. Note that GoCs, through GABA-A α1 and α6 receptors, regulate the duration of the time window for GrC discharge, which normally lasts 5–10 ms from the stimulus. Repetitive GrC fi ring is prevented by the block of NMDA receptors and by a low release probability.
Frontiers in Cellular Neuroscience www.frontiersin.org May 2010 | Volume 4 | Article 12 | 11
Solinas et al. Modeling the granular layer network dynamics
was 3 at 300 Hz, 2.3 at 100 Hz and 1.5 at 50 Hz; Figure 7E). Thus, the center-surround is predicted to generate complex transforma-tions of incoming mf signals.
THE EMERGENCE OF OSCILLATION AND PREDICTIONS ON THEIR REGULATIONIn vivo, GrCs show rare spontaneous activity (Chadderton et al., 2004; Jörntell and Ekerot, 2006; Rancz et al., 2007). However, in certain circumstances, the ensemble activity generated by the granular layer can take the form of coherent oscillations [7 Hz in the rat (Hartmann and Bower, 1998) and 7–25 Hz in the monkey (Pellerin and Lamarre, 1997; Courtemanche et al., 2009)]. It was not clear if this sparse GrC background activity could sustain the coherent oscillations.
In these simulations, the model was driven by random mf activ-ity at different frequencies (see Materials and Methods) generating a sparse low-frequency discharge of GrCs (<1 Hz/cell; Figure 8A) refl ecting the basal GrC activity recorded in the anesthetized rat (Chadderton et al., 2004; Rancz et al., 2007) and in the decerebrated cat (Jörntell and Ekerot, 2006). When basal mf activity was low (10 Hz) ensemble activity was barely detectable but when basal mf activity was higher (20–40 Hz) the granular layer generated coherent oscillations at 7–15 Hz. Coherent oscillations were never easily resolved in single GrCs, which maintained a sparse activity, but clearly emerged as a population activity in the spikegrams.
consistent with the slow time constant of these receptors. When both GABA-A α6 and GABA-A α1 receptors were blocked the transmission curve was enhanced at all frequencies and high-pass fi ltering was strongly reduced. These results, which are in keeping with experimental observations obtained with VSD imaging (Mapelli et al., 2010b), indicate that the high-pass fi l-tering properties of granular layer depend on phasic GABA-A receptor-dependent transmission (no further changes were obtained by blocking the tonic GABA-A receptor-mediated cur-rent, not shown).
The granular layer transmission properties also depended on glutamate release probability at the mf-GrC synapse (Figure 7C). Reducing release probability from the control value 0.6 to 0.2 depressed temporal summation yielding an effect similar to block-ing NMDA receptors. Raising release probability to 0.9 enhanced transmission at low-frequency but not at high-frequency (prob-ably because EPSP short-term depression became so strong that temporal summation was prevented).
The frequency dependence of the granular layer response changed moving from the center to the surround of the responding area (Figure 7D). In the center, the high-pass fi ltering curve arose at lower frequencies and attained a higher maximum gain than in the surround. Moreover, the gain difference between center and surround was more pronounced at high than low input frequency (the ratio between gain measured at 10 and 25 µm from the core
FIGURE 5 | Center surround organization and lateral inhibition. (A) Spatial pattern of GrC responses to a short mf burst (two spikes at 500 Hz on eight contiguous mfs) at the time of the fi rst spike (E) and of the second spike (E2). E2−bi indicates the response at the time of the second spike when inhibition is blocked. Since inhibition arises after excitation, it is does not affect generation of the fi rst spike but markedly reduces generation of the second and following spikes. Thus, the infl uence of inhibition on the GrC response was obtained as (I = E−E2−bi). The difference between excitation and inhibition (E–I) reveals that inhibition is especially effective in reducing excitation around the core, generating a Mexican hat profi le. The plots were the average of 10 simulations using different random seeds for synaptic connectivity. (B) Spikegrams for all
active GrCs ordered from center to periphery [data from one of the simulation used to make (A)]. The fi rst spikes are indicated by red dots, the second and following spikes by black dots. In the center the fi rst spike occurs about 5 ms after the stimulus, whereas in the surround it tends to occur later. The second spike, which is quite rare in control, becomes well evident when inhibition is blocked. (C) The spatial profi le of inhibition (I) was subtracted from the profi le of excitation (E) to obtain the E-I balance (E-I) along a section passing through the core of the corresponding plot in (A) (average data obtained from 10 simulations with different random seeds for synaptic connectivity). The larger extension of inhibition compared to excitation and the Mexican-hat profi le of the E-I balance are evident.

Frontiers in Cellular Neuroscience www.frontiersin.org May 2010 | Volume 4 | Article 12 | 12
Solinas et al. Modeling the granular layer network dynamics
A measure of rhythmicity was provided by the autocorrelograms of groups of GrCs and GoCs, which showed fi ring at regular periods over hundreds of milliseconds. The cross-correlograms between GrCs and GoCs cells (Figure 8B) also showed coherent oscilla-tions, indicating that activity in the two cell populations were cor-related. The coherent granular layer oscillations followed those of GoCs with a 5- to 10-ms lag due to the time spent in the feed-back inhibitory loop.
The granular layer oscillation assumed a frequency correlated with that in the mf input, as revealed by power spectrum analysis (Figure 8C). The output frequency was typically in the 7–15 Hz range remaining lower than the input frequency. The oscillation was regulated by several synaptic mechanisms operating in the cerebellar glomerulus (Figure 8Di; cf. Figure 4). Blocking GrC NMDA recep-tors strongly reduced the PSD peak amplitude, while blocking GrC GABA-A α6 receptors markedly increased the PSD peak amplitude, refl ecting opposite regulation on the feed-back (GrC-GoC-GrC) loop. Blocking both GrC GABA-A α6 and GABA-A α1 interrupted the feed-back loop and fl attened the PSD curve. Another remark-able effect was generated by altering mf-GrC release probability and therefore EPSP temporal summation. Decreasing mf-GrC release probability (p = 0.2) reduced the PSD peak amplitude, while
increasing mf-GrC release probability (p = 0.9) increased the PSD peak amplitude, again refl ecting opposite regulation on the feed-back loop. Moreover, (Figure 8Dii), when the feed-back loop was enhanced (GABA-A α6 receptor block or p = 0.9) the PSD peak frequency was increased, while the opposite occurred when the loop was weakened. Therefore, synaptic mechanisms allowed to fi ne-tune the intensity and frequency of oscillations.
It should be noted that increasing the strength of the mf-GoC synapse (Figure 8Ei) and of the SC/BC-GoC synapse (Figure 8Eii) progressively reduced the PSD of oscillations. Thus, oscillations were critically dependent on circuit components that controlled the feed-back inhibitory loop.
DISCUSSIONThis computational investigation provides a formal demonstration that available knowledge on cellular properties and circuit con-nectivity can explain center-surround and time-window effects during burst transmission and that sparse GrC random activity can sustain coherent low-frequency oscillations (D’Angelo and De Zeeuw, 2009; D’Angelo et al., 2009). The model predicts differen-tial transmission through the center-surround structure refl ect-ing the balance between NMDA and GABA-A receptor activation.
FIGURE 6 | The impact of network topology on granular layer responses.
Granular layer response elicited by a mf burst (fi ve spikes at 500 Hz on eight contiguous mfs) using the control or the mesh-like network confi gurations (see Materials and Methods). (A) The traces show that responses in the center have shorter latency and higher number of spikes than in the surround of the activated area (exemplar traces are taken at 10 and 32 µm from the core; arrows mark the time of stimulation). The PSTHs (bin width 0.5 ms) were normalized by the number of simulations. The mesh-like confi guration reduces the overall level of inhibition, with a more evident effect in the surround, so that the PSTH of peripheral cells shows a remarkable increase in the second/third spike fi ring probability. (B) The PSTHs of responding GrCs were ordered according to GrC distance from the stimulus center and color coded. In the control network confi guration, most neurons fi re a high frequency spike doublet with short
latency which, in some cases, is followed by a late spike with lower time precision. Some neurons in the periphery fi re just a single late spike. The mesh network confi guration shows differences in the timing of the fi rst and second spikes and an enhanced probability of third spikes. The mesh-control plot shows sharp peaks in the early response phase due to differences in spike timing and wider peaks in the late response phase due to increase fi ring probability. (C) Time and space response profi les with control and mesh network confi gurations. The upper plot shows the mean response of all GrCs. The two curves show a signifi cant difference at the time of the second spike. The point of maximum difference is at 7.2 ms after the stimulus and the difference is signifi cant in the range indicated by the black bar (p < 0.007, t-test). The lower plot illustrates the spatial profi le of control and mesh responses at the time of their maximal difference.
Frontiers in Cellular Neuroscience www.frontiersin.org May 2010 | Volume 4 | Article 12 | 13
Solinas et al. Modeling the granular layer network dynamics
FIGURE 7 | Frequency-dependence of granular layer responses. (A) The raster plot shows the response of all GrCs (blue dots) and GoCs (green dots) to a bursts (fi ve spikes at 20 Hz) on eight contiguous mfs (red dots). (B) The GrC membrane potential (traces are the sum over all active GrCs) shows poor temporal summation at low stimulation frequency (20 Hz) but marked temporal summation at high frequencies (>100 Hz). (C) The gain function showed a steep increase above 50 Hz. By blocking the NMDA receptors, the responses were depressed with a specifi c loss of transmission at low frequency. By blocking GABA receptors, the responses were enhanced with a more marked increase of transmission at low frequency. Reducing release probability (p = 0.2) depressed the gain curve at
all frequencies, while raising release probability (p = 0.9) enhanced the gain curve specifi cally at low frequency. (D) The gain curve changed from the center to surround of the excited area. In the center the gain curve arose at lower frequencies and attained higher gain than in the surround. (i) shows absolute gain curves, (ii) shows normalized gain curves. Each gain trace is from a different GrC. (E) Gain as a function of distance from the center of the active areas. The points are measures in responding spots located along different radii (mean ± sd indicate the values along the whole circumference at the given distance; see Materials and Methods for details). The difference between center and surround in terms of gain was more pronounced at high than low input frequency.

Frontiers in Cellular Neuroscience www.frontiersin.org May 2010 | Volume 4 | Article 12 | 14
Solinas et al. Modeling the granular layer network dynamics
FIGURE 8 | Background activity and oscillations. (A) The response of GrCs and GoCs to a 20-Hz mf random activity. Activity of individual GrCs was sparse and appeared to occur at random and uncorrelated times [membrane potential traces, (i)]. However, when represented in a raster plot (ii), GrC (blue dots) and GoC (green dots) activity appeared organized in a repetitive coherent pattern. (B) Autocorrelograms of GrC and GoC population activity at three different frequencies of the random input (10 Hz, 20 Hz, 40 Hz; (i,ii)). The autocorrelogram of GrCs is enlarged in the inset. The cross-correlogram shows the mean activity of the GoCs in relation to spikes fi red by GrCs (iii). (C) The power spectrum density (PSD) of the GrC population activity shows a peak between 7 and 20 Hz at the three different input frequencies [(i): 10 Hz, 20 Hz, 40 Hz]. These peaks are represented as a function of the input
frequency in (ii). (D) The effect of altering neurotransmission mechanisms on the GrC power spectral density generated with a 20-Hz mf random activity. Blocking NMDA receptors reduced the PSD peak frequency, while blocking GABA-A receptors increased the PSD peak frequency. Decreasing mf-GrC release probability (p = 0.2) reduced the PSD peak frequency, while increasing mf-GrC release probability (p = 0.9) increased the PSD peak frequency. (E) The effect of altering the strength of GoC excitation through the mfs and of GoC inhibition through MLI on the GrC power spectral density generated with a 20-Hz mf random activity. The oscillatory effect, revealed by the intensity of the GrC PSD, tends to vanish as the intensity of the feed-forward inhibitory loop is increased and as the intensity of the feed-back dis-inhibitory loop is increased.
The center had a lower cut-off for input signals and generated spike bursts at higher frequency and with shorter delay than the surround. In the center the time–window closed less effectively and contained more spikes than in the surround. The higher mf-GrC release probability in the center than in the surround due to long-term synaptic plasticity (Mapelli and D’Angelo, 2007) would
further enhance the contrast between adjacent network areas. The main prediction of the model is therefore that the granular layer circuit behaves as a spatio-temporal fi lter, whose local proper-ties can be adapted through long-term plasticity and different areas can be synchronized through low-frequency oscillations. It can be envisioned that distributed inputs generate a continuum
Frontiers in Cellular Neuroscience www.frontiersin.org May 2010 | Volume 4 | Article 12 | 15
Solinas et al. Modeling the granular layer network dynamics
of center-surround structures performing a complex time- and frequency-dependent transformation of input signals (e.g. Mapelli et al., 2010a) to be relayed to Purkinje cells. These results support the concept that input mossy fi ber bursts are fi rst separated and transformed in granular layer sub-circuits and then relayed to Purkinje cells for subsequent integration and pattern recognition (Dean et al., 2010).
The major innovation in this model is that membrane mecha-nisms are reproduced using Hodgkin–Huxley gating schemes and synaptic transmission using synaptic vesicle cycling schemes, which are based on extended electrophysiological experiments and bio-physical analysis in slices (D’Angelo et al., 2001; Nieus et al., 2006; Solinas et al., 2007a,b; Diwakar et al., 2009 and references therein). Moreover, circuit structure is reproduced beyond statistical con-nectivity, accounting for a sophisticated arrangement of neuronal and synaptic elements (see Mapelli and D’Angelo, 2007; D’Angelo, 2008; D’Angelo and De Zeeuw, 2009; D’Angelo et al., 2009; Mapelli et al., 2009, 2010a). Finally, the simulations accounted for granular layer responses to three major mf discharge patterns inspired by in vivo recordings: localized bursting, frequency-modulated activity and diffused random activity (Kase et al., 1980; Chadderton et al., 2004; Jörntell and Ekerot, 2006; Rancz et al., 2007). In response to single input bursts, the model showed center–surround responses and time windowing (D’Angelo and De Zeeuw, 2009). In response to input trains at different frequencies, the granular layer behaved as a high-pass fi lter with a rapid growth of the response between 50 and 100 Hz, as observed in VSD recordings (Mapelli et al., 2010b). In response to continuous random stimuli, the model generated synchronous oscillations in the theta band (Pellerin and Lamarre, 1997; Hartmann and Bower, 1998; Maex and De Schutter, 1998; Courtemanche et al., 2009).
The model, by being reconstructed from a detailed description of its constitutive elements, could account for the multiple dynam-ics of granular layer activity observed in vitro and in vivo. The individual GrCs and GoCs showed responses to mf burst stimula-tion compatible with those elicited in vivo following punctuate stimulation of the whisker pad (Vos et al., 1999; Chadderton et al., 2004; Rancz et al., 2007) or following more prolonged touching on the limbs (Jörntell and Ekerot, 2006). The specifi c fi ring pat-terns depended on the blend of local excitation and inhibition. Moreover, the neurons, although individually maintaining a low and irregular fi ring rate, could be entrained into coherent oscilla-tory activity. Therefore, the model, in addition to demonstrate that biophysical properties in vitro are suffi cient to reproduce multiple activity patterns in vivo, provides the basis for investigating the contribution of single neurons to network activity and, conversely, network’s infl uence on single neurons (Buzsáki, 2006; Izhikevich and Edelman, 2008).
Previous models [originally the theoretical models of Marr (1969), Albus (1971), Tyrrell and Willshaw (1992), Dean et al. (2010) but also the computational model of Maex and De Schutter (1998), Medina and Mauk (2000)] were based on the statistical properties of the granular layer connectivity. Here we have faced the problem of how GoCs contact GrCs in the glomeruli by using the following rules: a GoC inhibits all the dendrites in a glomeru-lus and cannot inhibit a GrC more than once. As a corollary, each GrC is inhibited by different (up to 5 with a mean of 4) GoCs and
all GrCs sending their dendrites in the same glomerulus have at least one GoC in common. This organization, by increasing the effi ciency of feed-forward loops and concentrating inhibition into certain cell subgroups, enhanced center-surround transmission and time windowing. These rules are compatible with original Golgi staining images (Golgi, 1883; Ramón y Cajal, 1887, 1889, 1904; Eccles et al., 1967; Palay and Chan-Palay, 1974) but would require further refi nement of the glomerular representation in the model to improve generation of direct and indirect GABAergic responses (Rossi and Hamann, 1998; Mapelli et al., 2009) and to implement glomerular crosstalk (Mitchell and Silver, 2000a,b). It should also be noted that network topologies were not fully resolved in the model, because mf and GoC axon branching on the sagittal plane and pf long-range connections on the transverse plane could not be implemented on the scale of this network (see Wu et al., 1999; Sultan, 2001; Barmack and Yakhnitsa, 2008; D’Angelo, 2008).
The model identifi ed different roles for the main components of inhibition. Lateral inhibition was critical to determine the center-surround effect, feed-forward inhibition to determine the time-windowing effect and feed-back inhibition to determine coherent oscillations. In fact, in the model, the generation of oscillatory activ-ity in response to random mf bursts decreased with the strength of the feed-forward loop, which, in turn, was essential to generate time-windowing in response to localized mf activity. Since the rela-tive strength of the feed-forward and feed-back loops is unknown, different mechanism can be envisaged: (i) the relative strength of feed-back and feed-forward loops is dynamically balanced through the intervention of SC/BC-GoC inhibition (Dumoulin et al., 2001) or through glomerular mechanisms (Mitchell and Silver, 2000a,b, 2003; Mapelli et al., 2009); (ii) the feed-forward loop is independ-ently regulated through pfs originating from GrCs located outside the active beam; (iii) oscillating activity is conveyed into the cer-ebellum in pre-organized patterns. Although these mechanisms may coexist, the latter is especially interesting since both GrCs and GoCs have resonant properties in the theta-band (D’Angelo et al., 2001; Solinas et al., 2007a,b; D’Angelo and De Zeeuw, 2009). It is therefore possible that theta patterns at the input (around 7 Hz in rodents; Hartmann and Bower, 1998) are particularly effi cient in generating granular layer responses (Ros et al., 2009).
The model appropriately reproduced the high-pass fi ltering properties of the granular layer, so that burst patterns over 50 Hz were effi ciently transmitted while those at lower frequencies were not (Mapelli et al., 2010b). This is in keeping with the proposal that GrCs receive and retransmit high-frequency bursts (Chadderton et al., 2004; Rancz et al., 2007). The higher cut-off observed in the surround than in the center suggests that a frequency-code is spa-tially implemented through the center-surround structure. The gain control mechanisms based on stochastic resonance (Mitchell and Silver, 2003) may overlay with those considered here and account for the frequency-dependent modulation of incoming signals observed in certain functional conditions (Arenz et al., 2008).
In the model, generation of appropriate spatio-temporal pat-terns of activity of the cerebellum granular layer required a detailed description of cellular and synaptic properties. The time course of vesicle cycling regulated temporal summation during repeti-tive neurotransmission (see Figures 2 and 4) and fi ltering at the mf-GrC relay (see Figure 7). Transmission at low frequency was

Frontiers in Cellular Neuroscience www.frontiersin.org May 2010 | Volume 4 | Article 12 | 16
Solinas et al. Modeling the granular layer network dynamics
and modeling of a slow K+-dependent mechanism. J. Neurosci. 21, 759–770.
D’Errico, A., Prestori, F., and D’Angelo, E. (2009). Differential induction of bidirectional long-term changes in neurotransmitter release by fre-quency-coded patterns at the cer-ebellar input. J. Physiol. (Lond.) 587, 5843–5857.
Dean, P., Porrill, J., Ekerot, C.-F., and Jörntell, H. (2010). The cerebellar microcircuit as anadaptive filter: experimental and computational evidence. Nat. Neurosci. Rev. 11, 30–43.
Dieudonné, S. (1998). Submillisecond kinetics and low effi cacy of parallel fi bre-Golgi cell synaptic currents in the rat cerebellum. J. Physiol. (Lond.) 510, 845–866.
Diwakar, S., Magistretti, J., Goldfarb, M., Naldi, G., and D’Angelo, E. (2009). Axonal Na+ channels ensure fast spike activation and back-propaga-tion in cerebellar granule cells. J. Neurophysiol. 101, 519–532.
Dobrunz, L. E., and Stevens, C. F. (1999). Response of hippocampal synapses to natural stimulation patterns. Neuron 22, 157–166.
Druckmann, S., Banitt, Y., Gidon, A., Schürmann, F., Markram, H., and Segev, I. (2007). A novel multiple objective optimization framework for constraining conductance-based neuron models by experimental data. Front. Neurosci. 1:1, 7–18. doi: 10.3389/neuro.01.1.1.001.2007.
Dumoulin, A., Triller, A., and Dieudonné, S. (2001). IPSC kinetics at identifi ed GABAergic and mixed GABAergic and glycinergic synapses onto
Courtemanche, R., Chabaud, P., and Lamarre, Y. (2009). Synchronization in primate cerebellar granule cell layer local fi eld potentials: basic anisotropy and dynamic changes during active expectancy. Front. Cell. Neurosci. 3:6. doi: 10.3389/neuro.03.006.2009.
Cull-Candy, S. G., Brickley, S. G., Misra, C., Feldmeyer, D., Momiyama, A., and Farrant, M. (1998). NMDA receptor diversity in the cerebellum: identifi ca-tion of subunits contributing to func-tional receptors. Neuropharmacology 37, 1369–1380.
D’Angelo, E. (2008). The critical role of Golgi cells in regulating spatio-temporal integration and plastic-ity at the cerebellum input stage. Front. Neurosci. 2:1, 35–46. doi: 10.3389/neuro.01.008.2008.
D’Angelo, E., De Filippi, G., Rossi, P., and Taglietti, V. (1995). Synaptic excitation of individual rat cerebellar granule cells in situ: evidence for the role of NMDA receptors. J. Physiol. (Lond.) 484, 397–413.
D’Angelo, E., and De Zeeuw, C. I. (2009). Timing and plasticity in the cerebel-lum: focus on the granular layer. Trends Neurosci. 32, 30–40.
D’Angelo, E., Koekkoek, S. K. E., Lombardo, P., Solinas, S., Ros, E., Garrido, J., Schonewille, M., and De Zeeuw, C. I. (2009). Timing in the cer-ebellum: oscillations and resonance in the granular layer. Neuroscience 162, 805–815.
D’Angelo, E., Nieus, T., Maffei, A., Armano, S., Rossi, P., Taglietti, V., Fontana, A., and Naldi, G. (2001). Theta-frequency bursting and resonance in cerebellar granule cells: experimental evidence
enhanced by the slow time constant of excitation introduced by the NMDA receptors and was reduced by the slow time constant of inhibition introduced by GABA-A α-6 receptors (see Figure 7), suggesting that the balance of the two is critical to regulate circuit functioning. These same mechanisms also helped maintaining network oscillations in the theta-frequency band (see Figure 8; D’Angelo et al., 2001; Solinas et al., 2007b). It should be noted that, with unconstrained parameterization, a previous model generated 40 Hz oscillations, which are probably non-physiological (Maex and De Schutter, 1998).
In order to assess the hypothesis that the granular layer behaves as an adaptable spatio-temporal fi lter coordinated by low-frequency oscillations, experimental tests may be combined with further com-putational investigations. First, the implementation of rules for long-term synaptic plasticity in the model of the mf-GrC synapse (D’Errico et al., 2009) could allow investigating the impact of adap-tation on network fi ltering and pattern recognition. Secondly, the ability of the circuit of generating theta-frequency oscillations in response to repetitive bursting (which would be naturally con-veyed by the cerebral cortex; Ros et al., 2009) could be investi-
gated by modulating the resonant properties of GrCs and GoCs models (D’Angelo et al., 2001; Solinas et al., 2007b). Thirdly, the observation that tonic inhibition can control granular layer gain (Mitchell and Silver, 2003) could be assessed by introducing quantal mechanisms of neurotransmitter release in the model of the mf-GrC synapse (Arleo et al., 2010). The integration of the current model into larger modules including the molecular layer and deep cerebellar nuclei will eventually provide a tool for investigating the spatio-temporal fi ltering hypothesis of the entire cerebellar network (Dean et al., 2010).
ACKNOWLEDGMENTSThis work was supported by projects SENSOPAC (FP6-IST 028056) and CYBERRAT (Bio-ICT convergence 216528) of the European Commission and by NEUROIMAGE of CNISM (Consorzio Interuniversitario per le Scienze Fisiche della Materia) to E.D. The computational facility for the most intensive simulations was pro-vided by the parallel cluster CASPUR (Consorzio Interuniversitario per le Applicazioni di Supercalcolo per Università e Ricerca). We thank Dr. S. Masoli for his contribution to parallelization of the model.
REFERENCESAlbus, J. S. (1971). A theory of cerebellar
function. Math. Biosci. 10, 25–61.Arenz, A., Silver, R. A., Schaefer, A. T.,
and Margrie, T. W. (2008). The con-tribution of single synapses to sensory representation in vivo. Science 321, 977–980.
Arleo, A., Nieus, T., Bezzi, M., Derrico, A., D’Angelo, E., and Coenen, S. O. (2010). How synaptic release prob-ability shapes neuronal transmission: information theoretic analysis in a cerebellar granule cell. Neural Comp. 22, 1113–1148.
Armstrong, D. M., and Rawson, J. A. (1969). Activity patterns of cerebellar cortical neurones and climbing fi bre afferents in the awake cat. J. Physiol. (Lond.) 289, 425–448.
Barmack, N. H., and Yakhnitsa, V. (2008). Functions of interneurons in mouse cerebellum. J. Neurosci. 28, 1140–1152.
Bureau, I., Dieudonné, S., Coussen, F., and Mulle, C. (2000). Kainate recep-tor-mediated synaptic currents in cerebellar Golgi cells are not shaped by diffusion of glutamate. Proc. Natl. Acad. Sci. U.S.A. 97, 6838–6843.
Buzsáki, G. (2006). Rhythms of the Brain. New York: Oxford University Press.
Cesana, E., Dieudonné, S., Isope, P., Bidoret, C., D’Angelo, E., and Forti, L. (2009). Excitatory inputs to cerebel-lar Golgi cells in the cerebellum. SfN Abstract 367.17.
Chadderton, P., Margrie, T. W., and Häusser, M. (2004). Integration of quanta in cerebellar granule cells during sensory processing. Nature 428, 856–860.
cerebellar Golgi cells. J. Neurosci. 21, 6045–6057.
Eccles, J. C., Ito, M., and Szentagothai, J. (1967). The Cerebellum as a Neuronal Machine. Berlin: Springer.
Farrant, M., and Nusser, Z. (2005). Variations on an inhibitory theme: phasic and tonic activation of GABAA receptors. Nat. Rev. Neurosci. 6, 215–229.
Forti, L., Cesana, E., Mapelli, J., and D’Angelo, E. (2006). Ionic mecha-nisms of autorhythmic fi ring in rat cerebellar Golgi cells. J. Physiol. (Lond.) 574, 711–729.
Gleeson, P., Steuber, V., and Silver, R. A. (2007). neuroConstruct: a tool for modeling networks of neurons in 3D space. Neuron 54, 219–235.
Golgi, C. (1883). Sulla fi na anatomia degli organi centrali del sistema nervoso IV. Sulla fi na anatomia delle circonvoluzi-oni cerebellari. Riv. Sper. Freniatr. Med. Leg. Alien. Ment. 9, 1–17.
Gutfreund, Y., Yarom, Y., and Segev, I. (1995). Subthreshold oscillations and resonant frequency in guinea-pig corti-cal neurons: physiology and modelling. J. Physiol. (Lond.) 483(Pt 3), 621–640.
Hámori, J., and Somogyi, J. (1983). Differentiation of cerebellar mossy fi ber synapses in the rat: a quantitative electron microscope study. J. Comp. Neurol. 220, 365–377.
Hartmann, M. J., and Bower, J. M. (1998). Oscillatory activity in the cerebellar hemispheres of unrestrained rats. J. Neurophysiol. 80, 1598–1604.
Harvey, R. J., and Napper, R. M. A. (1991). Quantitative studies of the mamma-lian cerebellum. Prog. Neurobiol. 36, 437–463.
Frontiers in Cellular Neuroscience www.frontiersin.org May 2010 | Volume 4 | Article 12 | 17
Solinas et al. Modeling the granular layer network dynamics
de los vertebrados (3 volumenes). Madrid:Imprenta y Librería de Nicolás Moya.
Rancz, E. A., Ishikawa, T., Duguid, I., Chadderton, P., Mahon, S., and Häusser, M. (2007). High-fidelity transmission of sensory information by single cerebellar mossy fi bre bou-tons. Nature 450, 1245–1248.
Roggeri, L., Rivieccio, B., Rossi, P., and D’Angelo, E. (2008). Tactile stimula-tion evokes long-term synaptic plastic-ity in the granular layer of cerebellum. J. Neurosci. 28, 6354–6359.
Ros, H., Sachdev, R. N., Yu, Y., Sestan, N., and McCormick, D. A. (2009). Neocortical networks entrain neu-ronal circuits in cerebellar cortex. J. Neurosci. 29, 10309–10320.
Rossi, D. J., and Hamann, M. (1998). Spillover-mediated transmission at inhibitory synapses promoted by high affi nity alpha6 subunit GABAA recep-tors and glomerular geometry. Neuron 20, 783–795.
Saviane, C., and Silver, R. A. (2006). Fast vesicle reloading and a large pool sus-tain high bandwidth transmission at a central synapse. Nature 439, 983–987.
Sola, E., Prestori, F., Rossi, P., Taglietti, V., and D’Angelo, E. (2004). Increased neurotransmitter release during long-term potentiation at mossy fi bre-gran-ule cell synapses in rat cerebellum. J. Physiol. (Lond.) 2004 557, 843–861.
Solinas, S., Forti, L., Cesana, E., Mapelli, J., De Schutter, E., and D’Angelo, E. (2007a). Computational reconstruc-tion of pacemaking and intrinsic elec-troresponsiveness in cerebellar golgi cells. Front. Cell. Neurosci. 1:2. doi: 10.3389/neuro.03.002.2007.
Solinas, S., Forti, L., Cesana, E., Mapelli, J., De Schutter, E., and D’Angelo, E. (2007b). Fast-reset of pacemaking and theta-frequency resonance patterns in cerebellar golgi cells: simulations of their impact in vivo. Front. Cell. Neurosci. 1:4. doi: 10.3389/neuro.03.004.2007.
Sultan, F. (2001). Distribution of mossy fi ber rosettes in the cerebellum of cat and mice: evidence for a parasagittal organization at the single fi ber level. Eur. J. Neurosci. 13, 2123–2130.
Sultan, F., and Heck, D. (2003). Detection of sequences in the cerebellar cortex: numerical estimate of the possi-ble number of tidal-wave inducing sequences represented. J. Physiol. (Paris) 97, 591–600.
Traub, R. D., and Llinas, R. (1979). Hippocampal pyramidal cells: signifi -cance of dendritic ionic conductances for neuronal function and epileptogen-esis. J. Neurophysiol. 42, 476–496.
Traub, R. D., Wong, R. K., Miles, R., and Michelson, H. (1991). A model of a CA3 hippocampal pyramidal neuron incorporating voltage-clamp data on
Mapelli, J., Gandolfi , D., and D‘Angelo, E. (2010b). High-pass filtering and dynamic gain regulation enhance vertical bursts transmission along the mossy fiber pathway of cere-bellum. Front. Cell. Neurosci. 4:14. doi:10.3389/fncel.2010.00014
Mapelli, L., Rossi, P., Nieus, T., and D’Angelo, E. (2009). Tonic activation of GABAB receptors reduces release probability at inhibitory connec-tions in the cerebellar glomerulus. J. Neurophysiol. 101, 3089–3099.
Marr, D. (1969). A theory of cerebel-lar cortex. J. Physiol. (Lond.) 202, 437–470.
Medina, J. F., and Mauk, M. D. (2000). Computer simulation of cerebellar information processing. Nat. Neurosci. 3, 1205–1211.
Misra, C., Brickley, S. G., Farrant, M., and Cull-Candy, S. G. (2000). Identifi cation of subunits contributing to synaptic and extrasynaptic NMDA receptors in Golgi cells of the rat cerebellum. J. Physiol. (Lond.) 524, 147–162.
Mitchell, S. J., and Silver, R. A. (2000a). Glutamate spillover suppresses inhibi-tion by activating presynaptic mGluRs. Nature 404, 498–502.
Mitchell, S. J., and Silver, R. A. (2000b). GABA spillover from single inhibi-tory axons suppresses low-frequency excitatory transmission at the cer-ebellar glomerulus. J. Neurosci. 20, 8651–8658.
Mitchell, S. J., and Silver, R. A. (2003). Shunting inhibition modulates neu-ronal gain during synaptic excitation. Neuron 38, 433–445.
Nieus, T., Sola, E., Mapelli, J., Saftenku, E., Rossi, P., and D’Angelo, E. (2006). LTP regulates burst initiation and fre-quency at mossy fi ber-granule cell syn-apses of rat cerebellum: experimental observations and theoretical predic-tions. J. Neurophysiol. 95, 686–699.
Palay, S. L., and Chan-Palay, V. (1974). Cerebellar Cortex . New York: Springer-Verlag.
Palkovits, M., Magyar, P., and Szentàgothai, J. (1971). Quantitative histological analysis of the cerebellar cortex in the cat. II. Cell numbers and densi-ties in the granular layer. Brain Res. 32, 15–30.
Palkovits, M., Magyar, P., and Szentágothai, J. (1972). Quantitative histological anal-ysis of the cerebellar cortex in the cat. IV. Mossy fi ber-Purkinje cell numerical transfer. Brain Res. 45, 15–29.
Pellerin, J. P., and Lamarre, Y. (1997). Local field potential oscillations in primate cerebellar cortex during vol-untary movement. J. Neurophysiol. 78, 3502–3507.
Ramón y Cajal, S. (1887, 1889, 1904). Textura del sistema nervioso del hombre y
Häusser, M., and Clark, B. A. (1997). Tonic synaptic inhibition modulates neuronal output pattern and spatio-temporal synaptic integration. Neuron 19, 665–678.
Holt, G. R., Softky, W. R., Koch, C., and Douglas, R. J. (1996). Comparison of discharge variability in vitro and in vivo in cat visual cortex neurons. J. Neurophysiol. 75, 1806–1814.
Ito, M. (2006). Cerebellar circuitry as a neuronal machine. Prog. Neurobiol. 78, 272–303.
Izhikevich, E. M., and Edelman, G. M. (2008). Large-scale model of mamma-lian thalamocortical systems. Proc. Natl. Acad. Sci. U.S.A. 105, 3593–3598.
Jaeger, D., De Schutter, E., and Bower, J. M. (1997). The role of synaptic and voltage-gated currents in the control of Purkinje cell spiking: a modeling study. J. Neurosci. 17, 91–106.
Jakab, R. L., and Hámori, J. (1988). Quantitative morphology and synap-tology of cerebellar glomeruli in the rat. Anat. Embryol. 179, 81–88.
Jörntell, H., and Ekerot, C. F. (2006). Properties of somatosensory syn-aptic integration in cerebellar gran-ule cells in vivo. J. Neurosci. 26, 11786–11797.
Kanichay, R. T., and Silver, R. A. (2008). Synaptic and cellular properties of the feedforward inhibitory circuit within the input layer of the cerebellar cortex. J. Neurosci. 28, 8955–8967.
Kase, M., Miller, D. C., and Noda, H. (1980). Discharges of Purkinje cells and mossy fibres in the cerebellar vermis of the monkey during saccadic eye movements and fi xation. J. Physiol. (Lond.) 300, 539–555.
Klyachko, V. A., and Stevens, C. F. (2006). Excitatory and feed-forward inhibi-tory hippocampal synapses work synergistically as an adaptive fi lter of natural spike trains. PLoS Biol. 4, e207. doi:10.1371/journal.pbio.0040207.
Korbo, L., Andersen, B. B., Ladefoged, O., and Møller, A. (1993). Total numbers of various cell types in rat cerebellar cortex estimated using an unbiased stereologi-cal method. Brain Res. 609, 262–268.
Maex, R., and De Schutter, E. (1998). Synchronization of Golgi and granule cell fi ring in a detailed network model of the cerebellar granule cell layer. J. Neurophysiol. 80, 2521–2537.
Mapelli, J., and D’Angelo, E. (2007). The spatial organization of long-term synaptic plasticity at the input stage of cerebellum. J. Neurosci. 27, 1285–1296.
Mapelli, J., Gandolfi , D., and D’Angelo, E. (2010a). Combinatorial responses controlled by synaptic inhibition in the cerebellum granular layer. J. Neurophysiol. 103, 250–261.
intrinsic conductances. J. Neurophysiol. 66, 635–650.
Tyrrell, T., and Willshaw, D. (1992). Cerebellar cortex: its simulation and the relevance of Marr’s theory. Philos. Trans. R. Soc. Lond., B, 336, 239–257.
Van Kan, P. L., Horn, K. M., and Gibson, A. R. (1994). The importance of hand use to discharge of interpositus neurones of the monkey. J. Physiol. (Lond.) 480, 171–190.
Van Kan, P. L., Houk, J. C., and Gibson, A. R. (1993). Output organization of intermediate cerebellum of the mon-key. J. Neurophysiol. 69, 57–73.
Vanier, M. C., and Bower, J. M. (1999). A comparative survey of automated parameter-search methods for com-partmental neural models. J. Comput. Neurosci. 7, 149–171.
Vos, B. P., Volny-Luraghi, A., and De Schutter, E. (1999). Cerebellar Golgi cells in the rat: receptive fi elds and timing of responses to facial stimula-tion. Eur. J. Neurosci. 11, 2621–2634.
Vos, B. P., Volny-Luraghi, A., Maex, R., and De Schutter, E. (2000). Precise spike timing of tactile-evoked cerebellar Golgi cell responses: a refl ection of combined mossy fiber and parallel fi ber activation? Prog. Brain Res. 124, 95–106.
Wang, X., Chen, G., Gao, W., and Ebner, T. J. (2009). Parasagittal organization of cer-ebellar cortex, parallel fi bers and synap-tic plasticity. SfN Abstract 319.10.
Wu, H. S., Sugihara, I., and Shinoda, Y. (1999). Projection patterns of single mossy fi bers originating from the lat-eral reticular nucleus in the rat cerebel-lar cortex and nuclei. J. Comp. Neurol. 411, 97–118.
Conflict of Interest Statement: The authors declare that the research was con-ducted in the absence of any commercial or fi nancial relationships that could be con-strued as a potential confl ict of interest.
Received: 01 August 2009; paper pending published: 13 November 2009; accepted: 18 March 2010; published online: 14 May 2010.Citation: Solinas S, Nieus T and D’Angelo E (2010) A realistic large-scale model of the cerebellum granular layer predicts circuit spatio-temporal filtering prop-erties. Front. Cell. Neurosci. 4:12. doi: 10.3389/fncel.2010.00012Copyright © 2010 Solinas, Nieus and D’Angelo. This is an open-access article subject to an exclusive license agreement between the authors and the Frontiers Research Foundation, which permits unre-stricted use, distribution, and reproduc-tion in any medium, provided the original authors and source are credited.