Embed Size (px)
Citation preview
A Re-Examination of Forces and Factors Affecting Ohio School District OAT and OGT Performance
Randy L. Hoover, Ph. D.Department of Teacher Education
Beeghly College of EducationYoungstown State University
Youngstown, OhioAugust 26, 2008
Acknowledgement
I would like to express my sincerest gratitude to James Dittrich of Simon Fraser University, Vancouver, British Columbia for his assistance verifying and validating the data and analyses used in this research study. –rlh
Section One:Overview
This research study examines 6091 Ohio school districts in terms of student
performance on all grade-level tests and sub-tests of the 2007 Ohio Achievement Tests
(OAT) and how that performance compares to performance in 1997. In February 2000, I
released a similar study of district-level performance, entitled Forces and Factors
Affecting Ohio Proficiency Test Performance: A Study of 593 Ohio School Districts2.
This earlier study examined 593 Ohio districts on all of the 1997 grade-level tests and
sub-tests. The primary finding of this previous study was that student performance on
the tests was most significantly (r = 0.80) affected by the non-school variables within the
student social-economic living conditions. Indeed, the statistical significance of the
predictive power of SES led to the inescapable conclusion that the tests had no
academic accountability or validity whatsoever.
The purpose of this current research study is to: 1) Mathematically re-examine,
compare, and contrast the primary outcomes of the 1997 data analysis in terms of the
2007 data; 2) Focus on the validity and fairness of the Ohio Achievement Tests and the
Ohio Graduation Test (OGT); and 3) Reflect on the credibility of the Ohio School Report
Card within the research findings relative to the Federal Government performance
mandates of No Child Left Behind (NCLB).
As with the initial study, the data were analyzed using linear regression and
Pearson’s Correlation (Pearson’s r) procedures. The current study is not as broad as
the first, using only the statistically significant primary findings of the first to target the
current analysis. In simple terms, the statistical procedures are used to determine what
factors are the greatest predictors of student performance. The findings of the original
study showed unequivocally that non-school variables (e.g., mean family income, school
lunch subsidy, economic disadvantage) were the greatest predictors of student
performance, not in-school variables (e.g., class size, per pupil expenditure). In other
words, the reality of the living conditions, the lived experience of the students outside of
school, was the significant predictor of OAT performance.
Likewise, the findings of this second study of data ten years later yield the same
conclusion: Performance on the Ohio Proficiency Test is most significantly related to the
social-economic living conditions, the lived experiences of the pupils to the extent that
1 Ohio had 611 districts reporting data in 2007. Two districts were omitted because of the extremely small student populations.2 http://cc.ysu.edu/~rlhoover/OPT/
the tests are found to have no academic validity nor educational accountability validity
whatsoever.
Section Two:Primary Findings
• The Data:
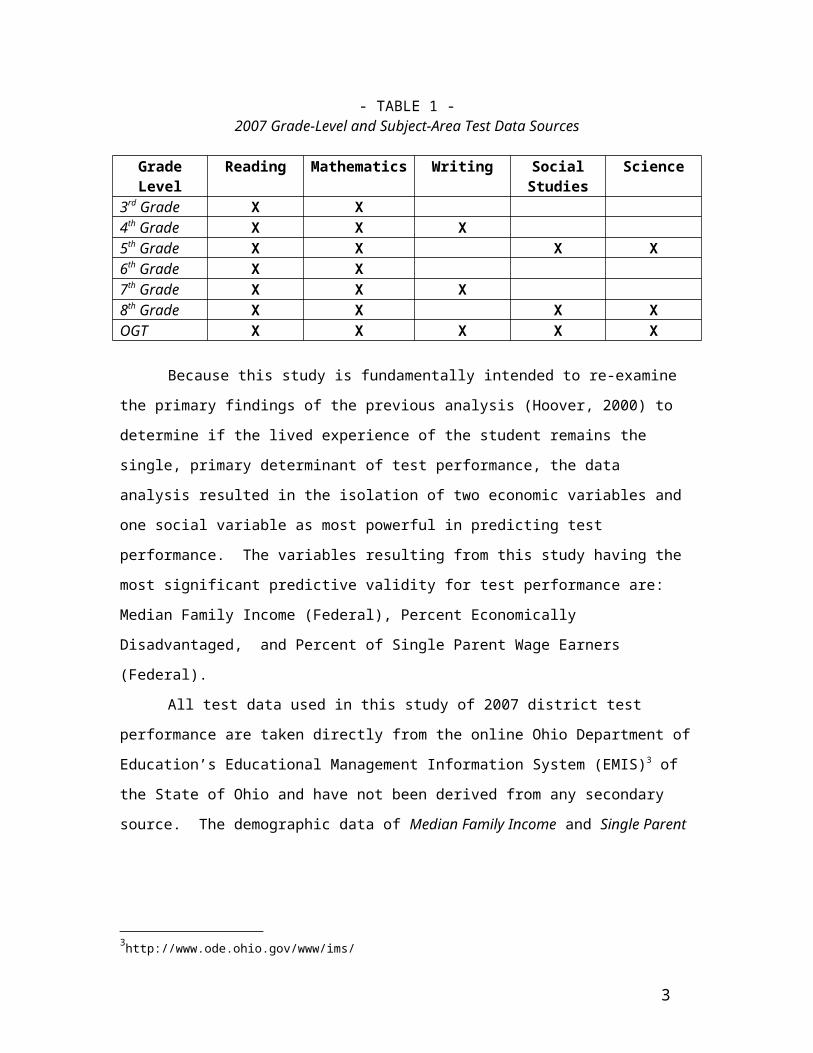
This study examines the 609 of the 611 Ohio school districts on all sections of
the 2007 third-grade, fourth-grade, fifth-grade, sixth-grade, seventh-grade, eighth-grade
Ohio Achievement Tests, and the Ohio Graduation Test. (Table 1). Therefore, the
research analysis used 23 sets of test data for each of the 609 school districts-- a total of
14,007 data cells representing Ohio school district performance.
- TABLE 1 - 2007 Grade-Level and Subject-Area Test Data Sources
Grade Level
Reading Mathematics Writing Social Studies
Science
3rd Grade X X4th Grade X X X5th Grade X X X X6th Grade X X7th Grade X X X8th Grade X X X XOGT X X X X X
Because this study is fundamentally intended to re-examine the primary findings
of the previous analysis (Hoover, 2000) to determine if the lived experience of the
student remains the single, primary determinant of test performance, the data analysis
resulted in the isolation of two economic variables and one social variable as most
powerful in predicting test performance. The variables resulting from this study having
the most significant predictive validity for test performance are: Median Family Income
(Federal), Percent Economically Disadvantaged, and Percent of Single Parent Wage
Earners (Federal).
All test data used in this study of 2007 district test performance are taken directly
from the online Ohio Department of Education’s Educational Management Information
System (EMIS)3 of the State of Ohio and have not been derived from any secondary
source. The demographic data of Median Family Income and Single Parent Wage
3http://www.ode.ohio.gov/www/ims/
2
Earners are taken from the Ohio Department of Taxation4 and the Economically
Disadvantaged data are from the EMIS-ODE source.
• Methodology:
As with the first study, linear regression is used to examine the relationship
between variables such as median family income and district test performance.
Basically, linear regression allows us to perceive how the change in one set of variables
relates to corresponding change in the other set of variables. Statistical correlation then
allows us to determine the strength of the relationship between the two sets of variables.
The correlation used in this study is called "Pearson's Correlation" or "Pearson's r."
It is this correlation result that tells how significant the association is between the
pairs of variables. Correlation analysis yields what is called the "correlation coefficient"
or "r." The range of "r" is from -1.0 to 1.0. The closer that "r" is to -1.0 or 1.0, the
stronger the relationship between the two sets of variables being analyzed. For
example, where r = 1.0, the correlation is perfect and where r = 0.0, there is no
relationship whatsoever. In cases where the r value is negative, the correlation is said to
be inverse, meaning that as the value of one variable increases, the value of the other
decreases. (See the graphs of Economic Disadvantaged and Single Parent Wage
Earners for examples of inverse correlations.) In cases where the r value is positive, as
the value of one variable increases so does the value of the other variable.
In social science research, a perfect correlation is rarely, if ever, found. Indeed,
correlations approaching either r = 0.40 or r = -0.40 are usually considered significant. It
is suggested that the reader consult a good statistics text for better understanding of the
details and assumptions involved with regression analysis and correlation. It needs to
be noted that the primary finding of this study regarding the relationship between the
lived experience of the student and district performance is r = 0.78, a significantly high
correlation by any statistical standard. The findings of this study are considered
statistically significant within the standards of the field of statistics.
• Primary Results Overview:
This study, as with the first study, produced results that confirm that OAT and
OGT performance are vastly more indicative of the out-of-school, lived experience of the
students rather than indicative of academics. Although numerous variables were run
against district test performance, no in-school variables produced statistically significant
4http://tax.ohio.gov/divisions/tax_analysis/tax_data_series/school_district_data/publications_tds_school.stm
3
results. Likewise, all social-economic variables produced significant results. The most
significant individual predictors of test performance were found to be:
1. Median federal family income5 of the school district (r = 0.62 ).
2. Percent of students within the school district classified as Economically
Disadvantaged by the State of Ohio (r = 0.75 ).
3. Percent of single-parent wage earners within the school district (r = 0.77).
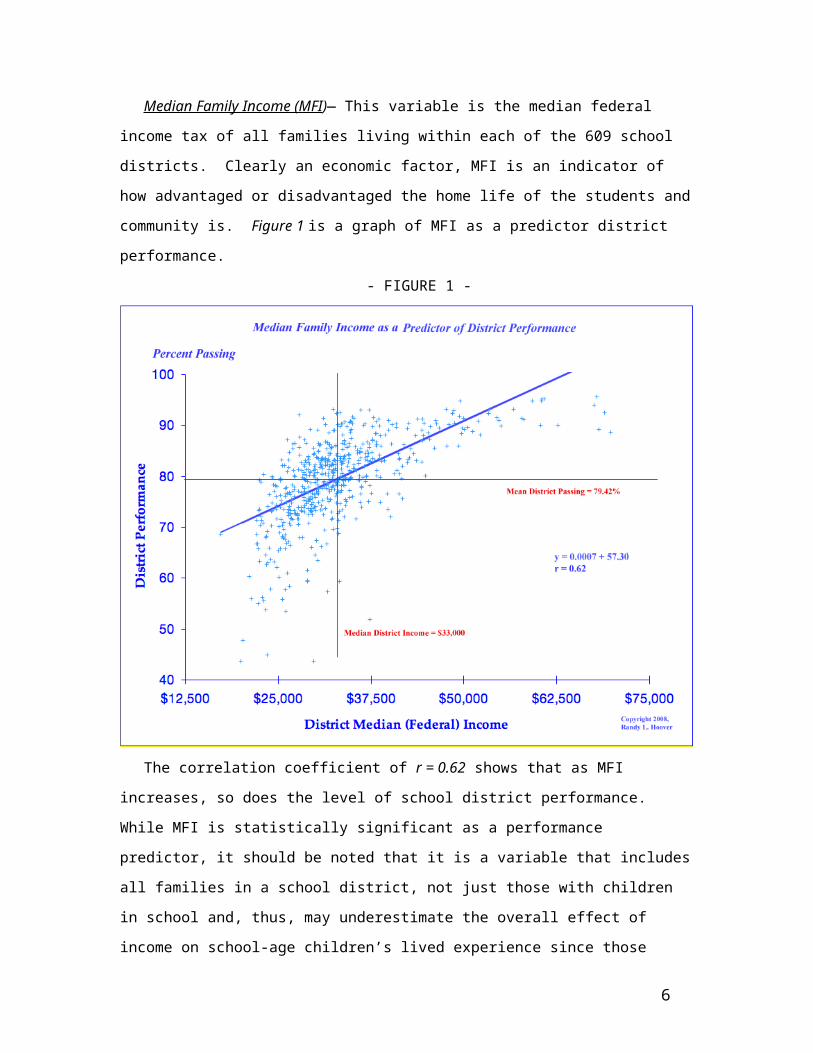
Median Family Income (MFI)— This variable is the median federal income tax of all
families living within each of the 609 school districts. Clearly an economic factor, MFI is
an indicator of how advantaged or disadvantaged the home life of the students and
community is. Figure 1 is a graph of MFI as a predictor district performance.
- FIGURE 1 -
The correlation coefficient of r = 0.62 shows that as MFI increases, so does the level
of school district performance. While MFI is statistically significant as a performance
predictor, it should be noted that it is a variable that includes all families in a school
district, not just those with children in school and, thus, may underestimate the overall 5 Data from 1999 federal tax returns were used because it was the most recent data available at the time of the study.
4

effect of income on school-age children’s lived experience since those families with
children tend to have lower family incomes and/or less deposable income per child than
those without children.
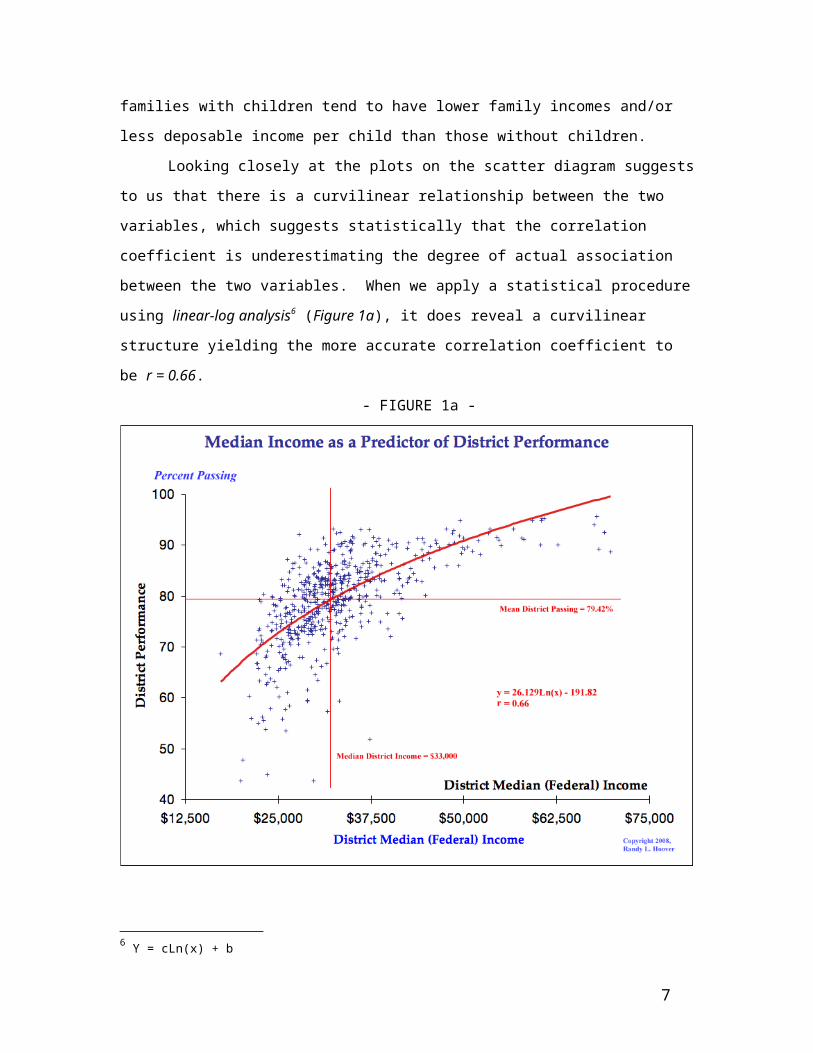
Looking closely at the plots on the scatter diagram suggests to us that there is a
curvilinear relationship between the two variables, which suggests statistically that the
correlation coefficient is underestimating the degree of actual association between the
two variables. When we apply a statistical procedure using linear-log analysis6 (Figure
1a), it does reveal a curvilinear structure yielding the more accurate correlation
coefficient to be r = 0.66.
- FIGURE 1a -
6 Y = cLn(x) + b
5
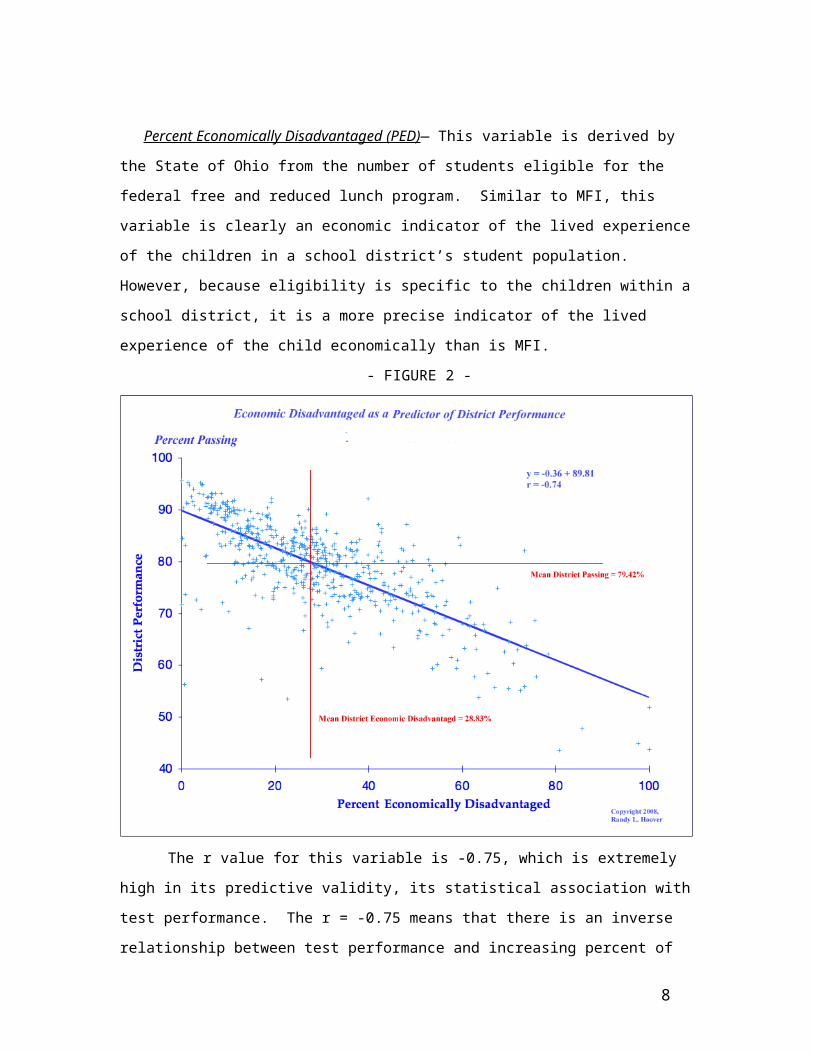
Percent Economically Disadvantaged (PED)— This variable is derived by the State
of Ohio from the number of students eligible for the federal free and reduced lunch
program. Similar to MFI, this variable is clearly an economic indicator of the lived
experience of the children in a school district’s student population. However, because
eligibility is specific to the children within a school district, it is a more precise indicator of
the lived experience of the child economically than is MFI.
- FIGURE 2 -
The r value for this variable is -0.75, which is extremely high in its predictive
validity, its statistical association with test performance. The r = -0.75 means that there
is an inverse relationship between test performance and increasing percent of students
in this category—as the number of students classified as economically disadvantaged
goes up, the overall district test performance goes down. This result, again, verifies that
the OAT and OGT are far more sensitive to testing the lived experience of the child than
to academic achievement.
6
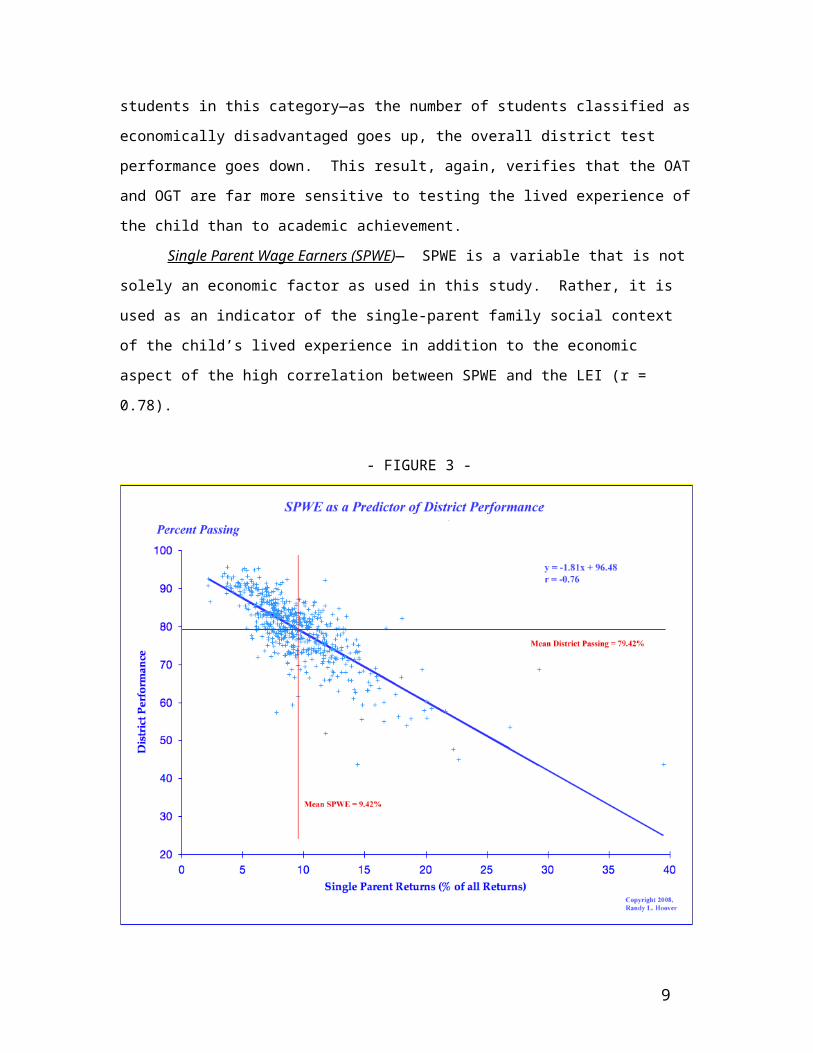
Single Parent Wage Earners (SPWE)— SPWE is a variable that is not solely an
economic factor as used in this study. Rather, it is used as an indicator of the single-
parent family social context of the child’s lived experience in addition to the economic
aspect of the high correlation between SPWE and the LEI (r = 0.78).
- FIGURE 3 -
The correlation coefficient of SPWE being r = -0.77 exceeds that of both MFI and PED
and is a powerful predictor of district test performance. From the graphed data, it is
again apparent that Ohio’s testing program is extremely sensitive to the nature of the
lived experience of each school district’s children rather than the impact the schools are
actually having in terms of academic achievement.
7
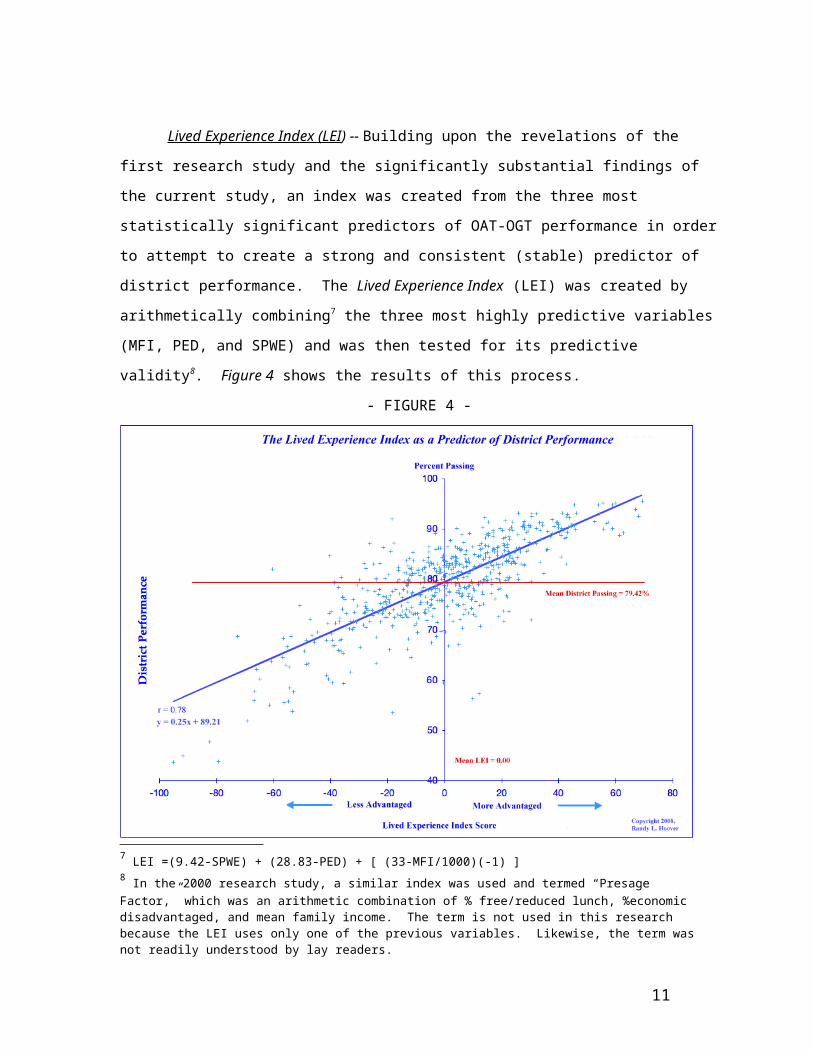
Lived Experience Index (LEI) -- Building upon the revelations of the first research
study and the significantly substantial findings of the current study, an index was created
from the three most statistically significant predictors of OAT-OGT performance in order to
attempt to create a strong and consistent (stable) predictor of district performance. The Lived
Experience Index (LEI) was created by arithmetically combining7 the three most highly
predictive variables (MFI, PED, and SPWE) and was then tested for its predictive validity8.
Figure 4 shows the results of this process.
- FIGURE 4 -
Most simply defined, the LEI is the degree of social and economic advantage the
students experience in their daily lives as children. The creation of an index in social science
is neither new nor mysterious. Indices such as the LEI are created using verifiable statistical
methods and used as succinct indicators of social, political, and/or economic conditions. For
example, the consumer price index and the gross national product are commonly used to
7 LEI =(9.42-SPWE) + (28.83-PED) + [ (33-MFI/1000)(-1) ]8 In the 2000 research study, a similar index was used and termed “Presage Factor,” which was an arithmetic combination of % free/reduced lunch, %economic disadvantaged, and mean family income. The term is not used in this research because the LEI uses only one of the previous variables. Likewise, the term was not readily understood by lay readers.
8
inform the public of social-economic conditions. The LEI formulation is extremely
straightforward in its arithmetic simplicity— it is not a hidden way of spinning the argument
against Ohio using achievement tests that lack academic validity and that are not credible in
reporting school accountability. Indeed, the Ohio School Report Card uses the index method
—Adequate Yearly Progress (AYP) and the classification/ranking system, among others, are
both statistical indices. Most recently, Ohio has started to phase in another school and
educator accountability index: Value Added.
The power of the Lived Experience Index is seen in its having an r value of 0.78 out of
a possible 1.00, thus having extremely high predictive validity for district test performance. In
terms of this research study, LEI and its statistically significant relationship to test
performance stands as the benchmark for the overall finding of the research study: Ohio’s
achievement tests are not valid assessments of academic achievement.
As with the study of 1997 test performance, this study clearly indicates that the
range of tests lacks validity across all social-economic levels in terms of assessing
academic performance. In other words, the analysis of the data shows the test
performance results are equally and consistently invalid regardless of whether the
districts are performing poorly or well. The results clearly and significantly show that it
is not just a matter of districts with more disadvantaged students for whom the tests are
invalid; they are equally invalid for districts with high passing rates as well. That is, just
because most of the students in some districts pass, we cannot make the claim that they
do so because they know how to apply the academic content material. Understanding
this counter intuitive notion, an apparent paradox, is discussed in Section 6.
9
Section Three:Actual Performance9
It is possible to use even the bias-flawed test results of school district
performance to begin to derive and examine actual district performance. The concept of
actual district performance reflects the statistical reality that once we are able to
establish the effects of the Lived Experience Index on school district performance, we
then are able to compare the predicted rate of passing determined by the regression
analysis with the actual rate of passing given the LEI score for the district. In this sense,
we are controlling for the effects of lived experience for each of the 609 Ohio school
districts and can examine student performance through a very different lens than does
the State of Ohio.
In other words, since we know the power of the LEI effect (r = 0.78) and, that
most conservatively it determines 61% of the test performance, we can then examine
district performance controlling for the LEI scores by comparing the predicted passing
rate to the actual passing rate then comparing those performances10.
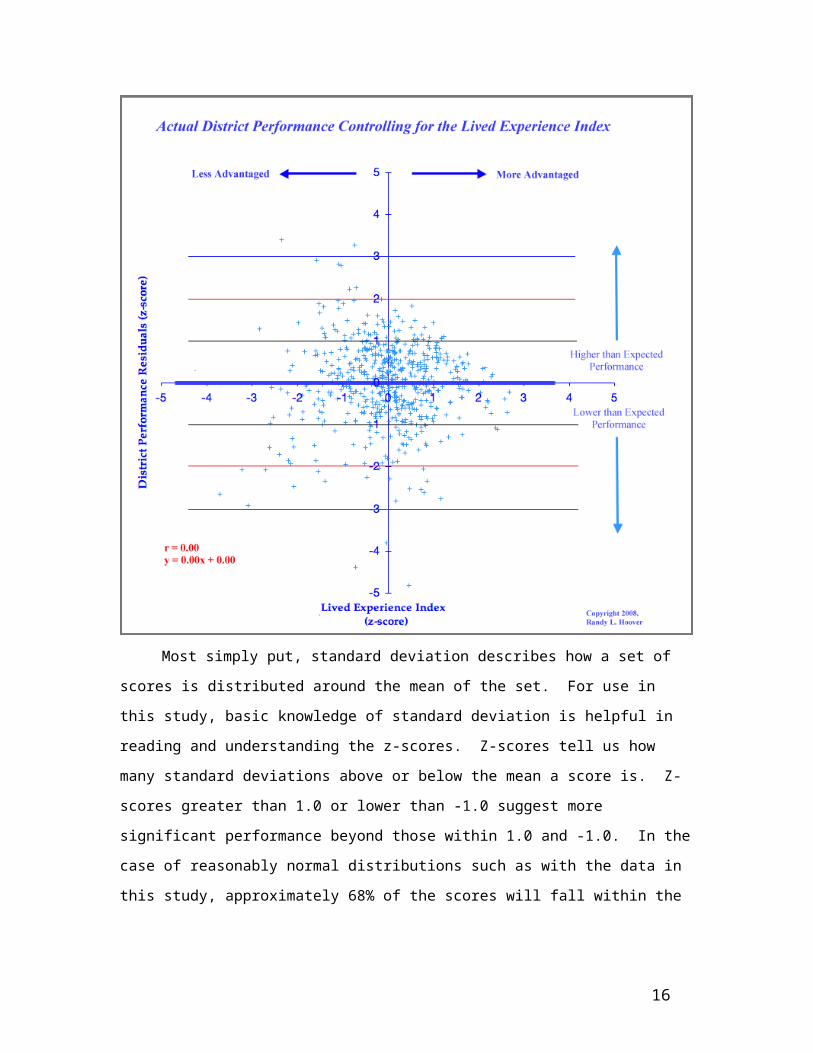
Figure 5 is a graphing of actual district performance because it shows how
districts are performing with the social-economic determiners contained in the LEI
removed.11 Essentially, it is a graph that indicates how far arithmetically districts are
above or below the regression line shown in Figure 4, the graph of The Lived
Experience Index as a Predictor of District Performance at the end of Section Two.
The arithmetic distance above or below the regression line of the graph seen in
Figure 4 is termed a “residual” and represents the difference between where we would
expect a district to fall based upon the predictive power of the LEI and where the district
actually falls. Loosely put, from this statistical procedure and its graph, we can identify
school districts that can be thought of as performing higher than expected, performing as
expected, or performing lower than expected.
9 Much of this section is extracted directly from the earlier study simply because the explanation of the meaning and methodology for actual performance does not change.10 Since the release of the 2000 study, many have asked me if using actual performance by controlling for SES was a form of value added methodology. The answer is yes.11A list of the highest performing Ohio districts may be found in Appendix B. Only the top 204 districts are given because I do not wish to have these data used inappropriately against any Ohio school district.
10
This graph of actual district performance, Figure 5, uses z-score transformation
of the raw scores.. This is done so that we may see how significant the actual
performance of any given district is above or below what we would expect. Z-score
transformations are based upon the standard deviation of a set of raw scores.
- FIGURE 5 -
Most simply put, standard deviation describes how a set of scores is distributed
around the mean of the set. For use in this study, basic knowledge of standard deviation
is helpful in reading and understanding the z-scores. Z-scores tell us how many
standard deviations above or below the mean a score is. Z-scores greater than 1.0 or
lower than -1.0 suggest more significant performance beyond those within 1.0 and -1.0.
In the case of reasonably normal distributions such as with the data in this study,
approximately 68% of the scores will fall within the 1.0 and -1.0 range of the first
11
standard deviation. This range is the area between the thin, horizontal black lines in
Figure 5.
Likewise, 95% of the scores will fall within the limits of the second standard
deviation (2.0 and -2.0), the area between the thin, red horizontal lines seen in Figure 5.
Scores that are two, three, or four standard deviations above or below the mean are
progressively more extreme in actual performance beyond what we would expect given
their LEI scores. The following bullets are taken from the first study and may serve as a
reader’s guide to the graph of actual performance using z-scores and standard
deviation.
• The upper left quadrant represents districts that are performing average or above
average and have average or below average levels of advantagement.
• The upper right quadrant represents districts performing average or above average
and have average or above average LEI scores.
• The lower left quadrant represents districts that are performing average or below
average and have average or below average advantagement.
• The lower right quadrant represents districts performing average or below average and
have average or above average LEI scores.
• The greater the distance above or below the x-axis (the horizontal dark blue line), the
more the district is performing respectively beyond or below what would be expected
given the LEI score of the particular district.
• Districts falling between +1 and -1 on the x-axis are all within one standard deviation of
the mean and may be considered as having performance that is about where we
would expect them to perform.
• Any district above the +1 mark of the x-axis is performing significantly better than
average and better than would be expected. Likewise, any district below the -1 mark
below the x-axis is performing significantly lower than average and lower than would
be expected.
Summary Comments Regarding Actual Performance
Given the sanctions against schools and school districts by the State of Ohio in
compliance with NCLB mandates as well as the high-stakes nature of OGT imposed
upon graduation requirements in Ohio, the data and analysis of actual performance
present an important reality that must not go unnoticed: There are as many school
districts with advantaged students significantly under performing as there are school
12
districts with disadvantaged student populations. Similarly, the same is true of those
districts that are performing well above expectations.
This reality, again, shows Ohio’s school accountability system to be grossly
misleading at best and grossly unfair at worst. Ohio’s current accountability system
perpetuates the political fiction that poor children can’t learn and teachers in schools with
poor children can’t teach. Indeed, the system of reporting school district and building
level accountability progress, The Ohio School Report Card, is as misleading to all Ohio
stakeholders as it is unfair to Ohio’s children and their educators.
If we are to report the degree to which educators move students along the continuum
of academic achievement, we must use valid assessments and report progress using a
demonstrably credible school report card—one that is worthy of belief by all. This
section on actual performance merely corrects for the test validity problem of the bias
against districts with more disadvantaged students and the bias favoring districts with
more advantaged students. Section Six will briefly discuss why students perform as they
do on the tests.
13
Section Four:
Additional Important Findings
Comparisons to the 1997 Data:
The primary findings of the current study are statistically the same as those of the
previous study. The correlations on the social-economic indicators are so close that
they can be considered statistically the same. In the 2000 study, the index of prediction
using Percent Economically Disadvantaged, Mean Family Income, and Percent Free-
Reduced Lunch yielded an r = 0.80 compared to the LEI, which yielded an r = 0.78, a
difference of two-hundredths of a point, which is statistically a dead heat. The
correlation of district test performance with the lived experience of the child still provides
the evidence for the complete lack of academic validity on the part of Ohio’s
achievement tests.
These comparative data led to examination of the degree to which the 1997
rankings of Ohio’s school districts by overall performance levels compared to the 2007
rankings. The correlation is r = 0.80, which is extremely high and statistically significant.
This r value speaks to the relative performance position of each district being almost the
same as in 1997. In other words, the districts tend to line up very similarly to the way
they ranked ten years ago—the wealthy districts are at the top, middle class districts in
the middle, and underclass districts at the bottom.
Likewise, an examination of changes in the percentile rank of each district
comparing 1997 data with 2007 data shows that the average change in percentile rank
from 1997 is 0.10% or one-tenth of a percentile. This is a very telling statistic and
supports the finding that little has changed when we take a big-picture view of Ohio’s
district level performance ranking comparison.
However, it is worth noting that while the average district percentile change in the
rank is extremely low overall in the 609 districts, several districts show extremely large
gains in percentile rank (e.g., + 86.4), and an equal number show extremely large losses
(e.g., - 80.3). These performance extremes will be examined more closely as time
permits after the release of this study.
Comparatively, only one dimension shows moderately significant change from
the 1997 performance data. District performance as a function of percent white and
percent African-American shows a greater differential in the 2007 data and needs to be
14
examined. This ten-year comparative performance difference is examined in the
ensuing sub-section, The African-American Achievement Gap.
The Achievement Gaps and the Ohio School Report Cards:
The term achievement gap refers to test performance differentials among
identifiable groups that are seen when test data are disaggregated into subgroups such
as disabled-non-disabled, Black-Hispanic-, male-female, wealthy-poor, and others.
Seemingly, the two most dominant achievement gaps in terms of claims made by the
Ohio Department of Education (ODE) and press releases from State Superintendent
Zelman’s office are black-white and rich-poor. However, it is one thing to claim there are
achievement gaps and quite another to verify what they truly are and how they are
determined.
Essential and requisite to the credibility of claiming achievement gaps is the
important element of the test’s statistical validity12— does the test accurately assess that
which it claims to assess. Once a test is determined to be valid using the appropriate
and acceptable procedures well established in the field of tests and measurement, test
reliability must be established mathematically in order for the test to be considered
worthy and test results credible13. Likewise, any claims about what the test data show
such as an achievement gap, must be based in clear proof that test validity and
reliability have been established scientifically. The research findings from the 2000
study and this 2007 study both support the case that the tests are not valid because the
results are shown to be determined almost exclusively by the lived experience of the
students—their lives outside of school.
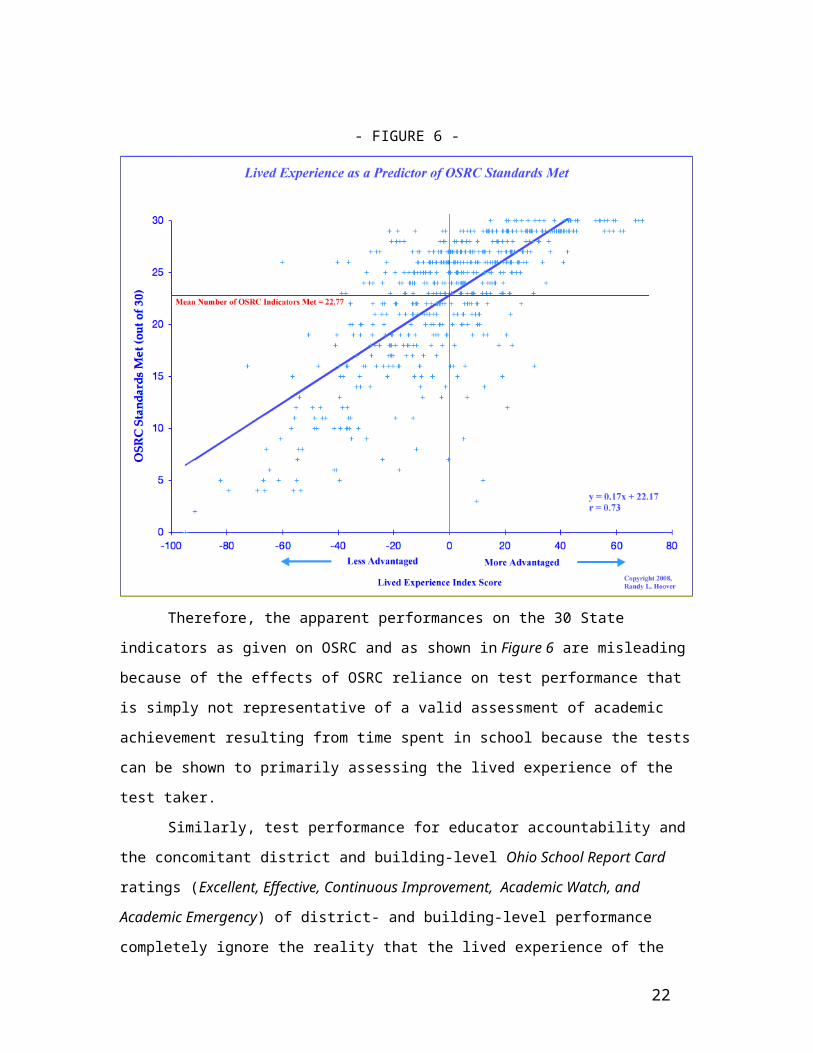
The Ohio School Report Card reflects the identical bias or validity problem found
in district test performance, Figure 6. Again, taken at face value, the distribution of the
number of standards or indicators met by a district is a function of the LEI index (r =
0.73), thus seemingly verifying the rich-poor achievement gap. However, there are 30
indicators used and reported by the OSRC, and all but two of the 30 indicators are
directly based on test performance. The nearly exclusive reliance on 28 test indicators
guarantees a carry over of any test bias into the portrayal of district performance shown
in the Ohio School Report Cards.
12 Statistical validity is a scientifically derived mathematical procedure and a key principle for upholding test standards.13If a test cannot be shown to be valid, reliability is moot.
15
- FIGURE 6 -
Therefore, the apparent performances on the 30 State indicators as given on
OSRC and as shown in Figure 6 are misleading because of the effects of OSRC reliance
on test performance that is simply not representative of a valid assessment of academic
achievement resulting from time spent in school because the tests can be shown to
primarily assessing the lived experience of the test taker.
Similarly, test performance for educator accountability and the concomitant
district and building-level Ohio School Report Card ratings (Excellent, Effective,
Continuous Improvement, Academic Watch, and Academic Emergency) of district- and
building-level performance completely ignore the reality that the lived experience of the
learners has any effect what is portrayed and reported to Ohio’s stakeholders. Indeed,
both NCLB and Ohio’s NCLB-compliant accountability model attribute any and all
academic performance to be the result of educators regardless of the background forces
and factors of their students taking the tests. Therefore, stakeholders reading the OSRC
have no way of knowing if the schools and district are actually advancing academic
achievement.
16
Given that OSRC is the State’s primary means of communicating district and
building performance to the public, two additional observations resulting from conducting
the research are in order. Both observations have to do directly with researching the
credibility factors affecting the Ohio School Report Card. First is the convoluted nature
of the report cards themselves. They are extremely difficult to understand beyond the
designations used (Excellent with Distinction, Excellent, Effective, Continuous
Improvement, Academic Watch and Academic Emergency). The many different
categories and the procedures used to derive them are extremely obtuse and the
rationale for using them virtually non existent. I encourage the reader to examine
closely the Ohio Department of Education’s Guide for Ohio’s Report Card System 2007-
200814.
The second observation has to do with Value Added15, the newest addition to
OSRC. The Guide for Ohio’s Report Card System 2007-2008 notes that this
achievement indicator is intended to reward or punish schools that exceed performance
expectations or fail to meet expectations respectively. The implication is that this
measure will adjust the playing field for less advantaged districts and schools. However,
stakeholders need to be aware that the gain scores are still based upon selected Ohio
Achievement Tests and therefore, are based upon faulty assumptions about the
academic validity as presented in this study. Likewise, at the time of this writing, the
precise formula for generating Value Added is nowhere to be found in the OSRC, n the
Guide, or on the ODE website.
o Rich-Poor Achievement Gap:
When Ohio’s school district test performance is taken at face value, clearly there
is a striking differential between rich and poor. However, the central finding of the study
shows the reason for this to be the extremely significant bias of OAT and OGT in terms
of the social-economic environment in which the children live (Figures 1, 2, 3, and 4).
The critical credibility question for Ohio’s stakeholders examined in this research study is
whether the performance differentials are artifacts of test bias (as shown by the LEI
data) or artifacts of bad teaching and schooling-- the latter being the explicit basis for
NCLB policies in general and Ohio’s school accountability system in particular.
14http://www.ode.state.oh.us/GD/Templates/Pages/ODE/ODEDetail.aspx?page=3&TopicRelationID=1266&ContentID=52790&Content=5281815 Research regarding the appropriateness and validity of Value Added will be conducted subsequent to the release of this study --rlh.
17
When controlling for LEI, we clearly find an equal number of rich-poor districts
showing academic achievement as not. Therefore, the rich-poor achievement gap as
portrayed by the State is faulty on at least two levels: 1) It is based upon tests that
assess rich-poor more than they assess academic achievement, and 2) It assumes
absolute performance is more important than relative academic achievement. That is
many schools that are not meeting AYP or are not meeting a sufficient number of OSRC
indicators are actually very successful in significantly advancing academic achievement.
(See the upper, left quadrant of the graph in Figure 5.)
The reverse is also demonstrably true that many schools categorized as
Excellent and Effective and/or that are meeting AYP goals are, in fact, not advancing
academic achievement when we control for LEI; they are underperforming. (See the
lower, right quadrant of the graph in Figure 5.)
18
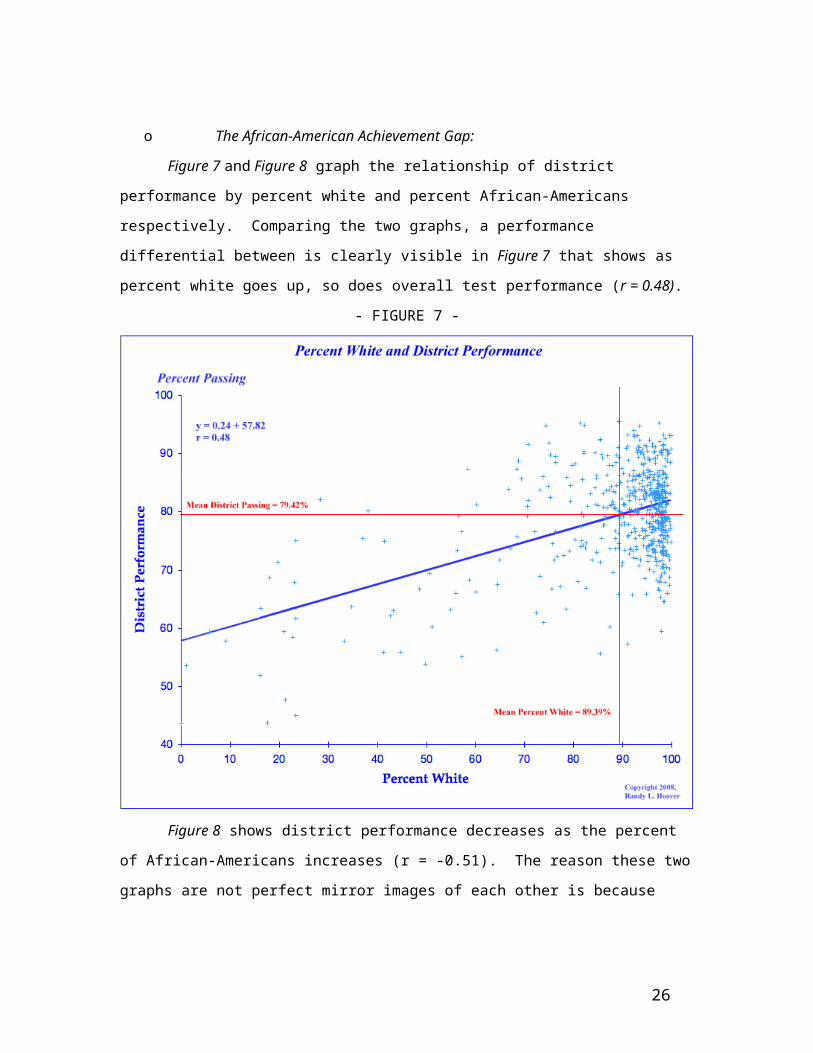
o The African-American Achievement Gap:
Figure 7 and Figure 8 graph the relationship of district performance by percent
white and percent African-Americans respectively. Comparing the two graphs, a
performance differential between is clearly visible in Figure 7 that shows as percent
white goes up, so does overall test performance (r = 0.48).
- FIGURE 7 -
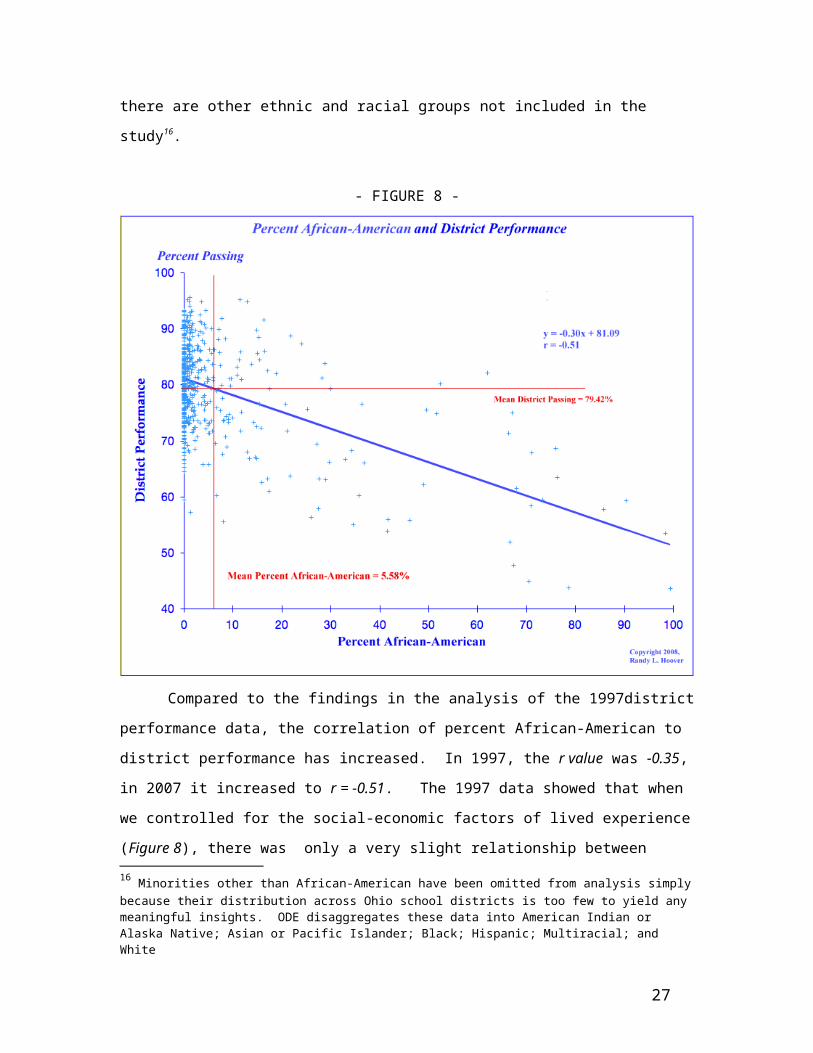
Figure 8 shows district performance decreases as the percent of African-
Americans increases (r = -0.51). The reason these two graphs are not perfect mirror
images of each other is because there are other ethnic and racial groups not included in
the study16.
16 Minorities other than African-American have been omitted from analysis simply because their distribution across Ohio school districts is too few to yield any meaningful insights. ODE disaggregates these data into American Indian or Alaska Native; Asian or Pacific Islander; Black; Hispanic; Multiracial; and White
19
- FIGURE 8 -
Compared to the findings in the analysis of the 1997district performance data,
the correlation of percent African-American to district performance has increased. In
1997, the r value was -0.35, in 2007 it increased to r = -0.51. The 1997 data showed
that when we controlled for the social-economic factors of lived experience (Figure 8),
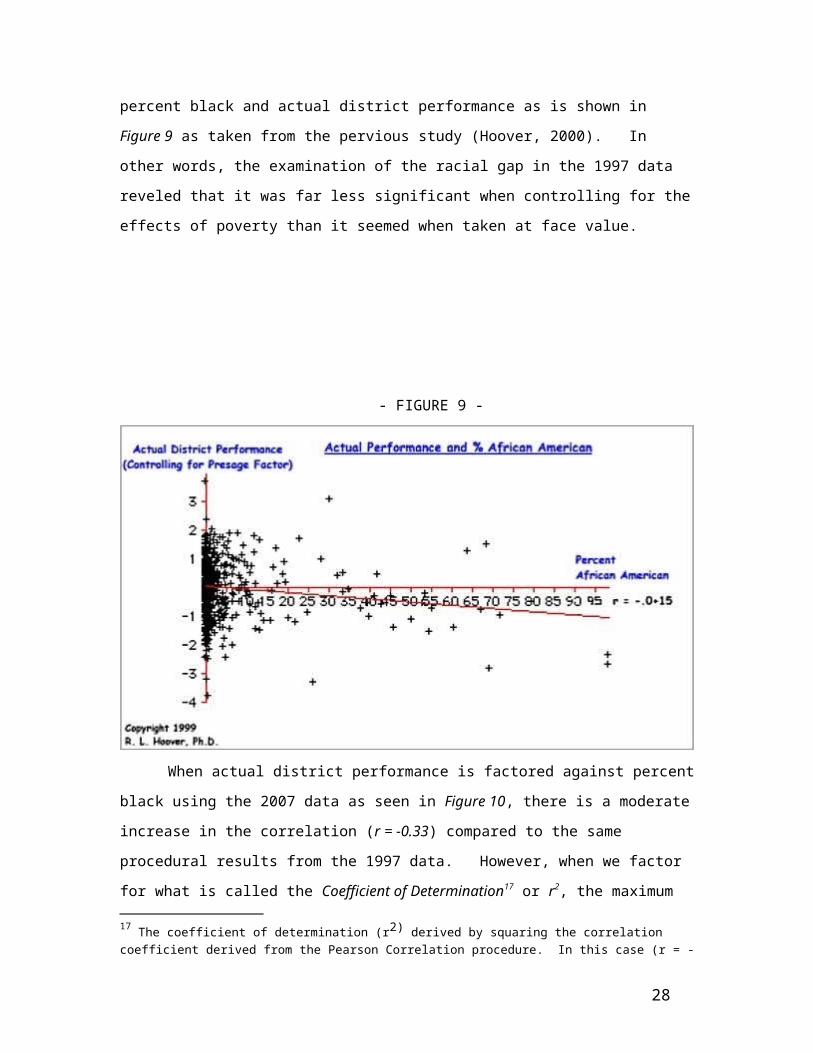
there was only a very slight relationship between percent black and actual district
performance as is shown in Figure 9 as taken from the pervious study (Hoover, 2000).
In other words, the examination of the racial gap in the 1997 data reveled that it was far
less significant when controlling for the effects of poverty than it seemed when taken at
face value.
20
- FIGURE 9 -
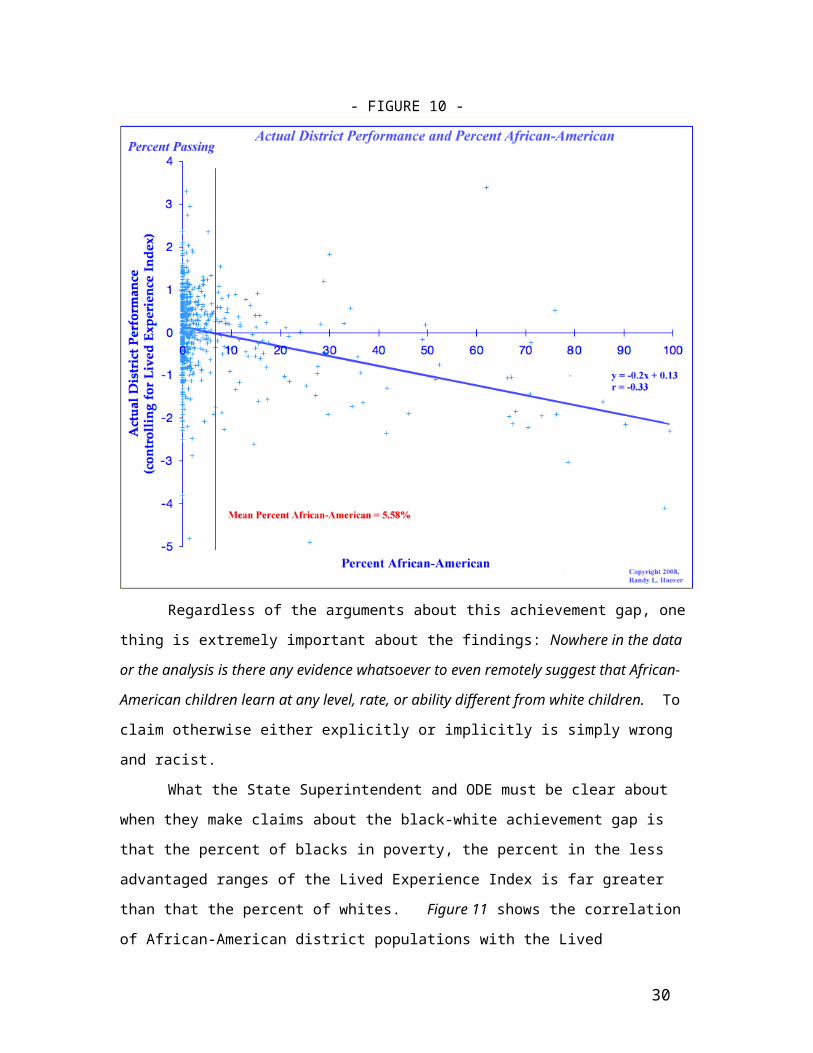
When actual district performance is factored against percent black using the
2007 data as seen in Figure 10, there is a moderate increase in the correlation (r = -
0.33) compared to the same procedural results from the 1997 data. However, when we
factor for what is called the Coefficient of Determination17 or r2, the maximum amount of
any effect even close to being considered causality is 0.11% of the performance. In
other words, arguably, there is an achievement gap, but it is extremely small.
17 The coefficient of determination (r2) derived by squaring the correlation coefficient derived from the
Pearson Correlation procedure. In this case (r = -0.33) therefore r2 = -0.332 = 0.11).
21
- FIGURE 10 -
Regardless of the arguments about this achievement gap, one thing is extremely
important about the findings: Nowhere in the data or the analysis is there any evidence
whatsoever to even remotely suggest that African-American children learn at any level,
rate, or ability different from white children. To claim otherwise either explicitly or
implicitly is simply wrong and racist.
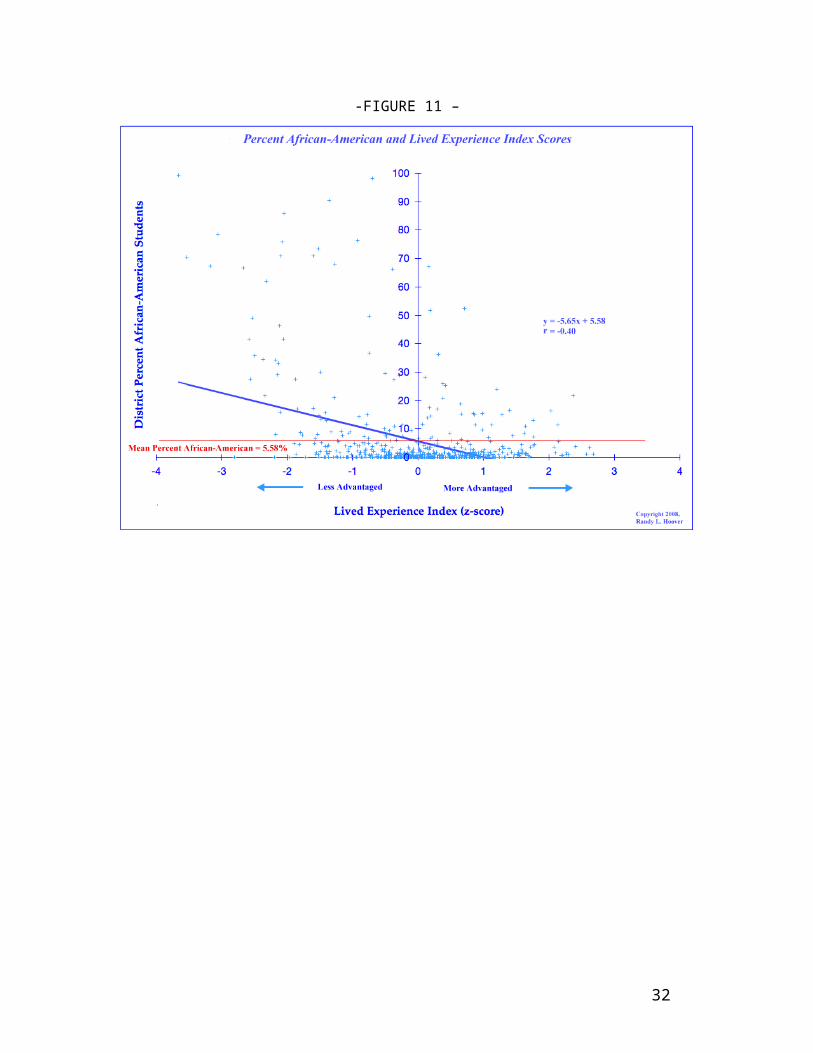
What the State Superintendent and ODE must be clear about when they make
claims about the black-white achievement gap is that the percent of blacks in poverty,
the percent in the less advantaged ranges of the Lived Experience Index is far greater
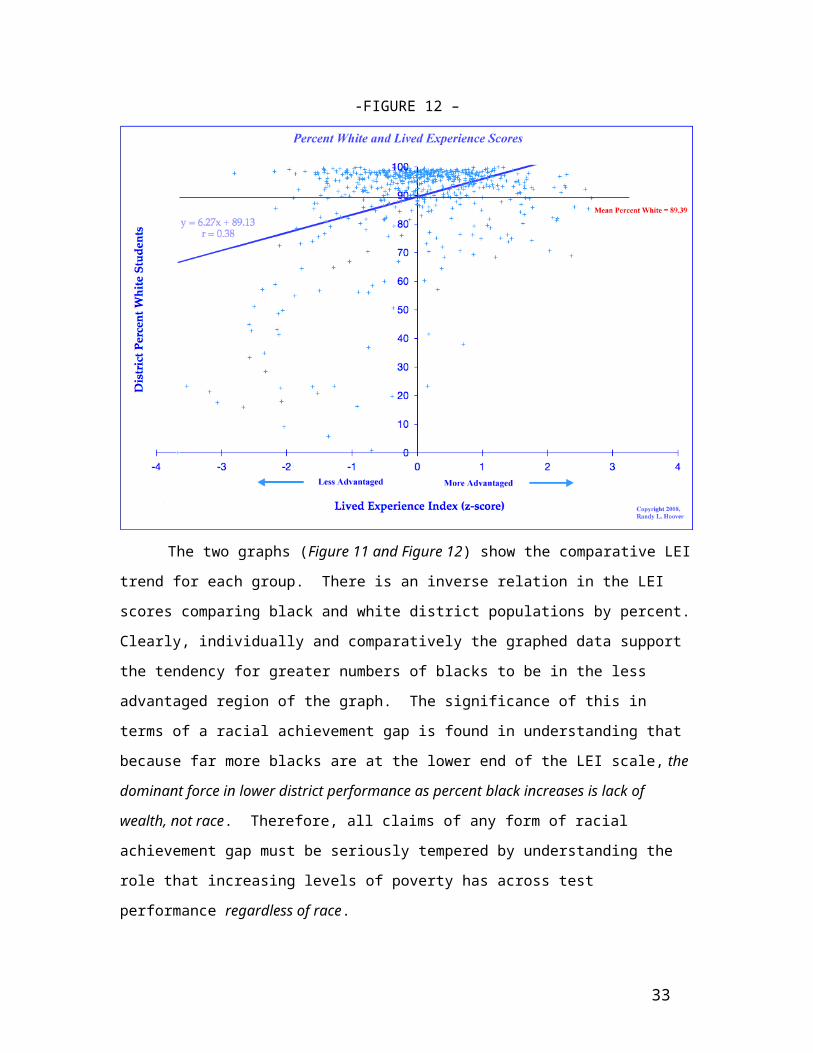
than that the percent of whites. Figure 11 shows the correlation of African-American
district populations with the Lived Experience Scores followed by Figure 12 showing the
trend for whites.
22
-FIGURE 11 –
23
-FIGURE 12 –
The two graphs (Figure 11 and Figure 12) show the comparative LEI trend for
each group. There is an inverse relation in the LEI scores comparing black and white
district populations by percent. Clearly, individually and comparatively the graphed data
support the tendency for greater numbers of blacks to be in the less advantaged region
of the graph. The significance of this in terms of a racial achievement gap is found in
understanding that because far more blacks are at the lower end of the LEI scale, the
dominant force in lower district performance as percent black increases is lack of wealth,
not race. Therefore, all claims of any form of racial achievement gap must be seriously
tempered by understanding the role that increasing levels of poverty has across test
performance regardless of race.
24
Section Five:
The Ohio Graduation Test Findings
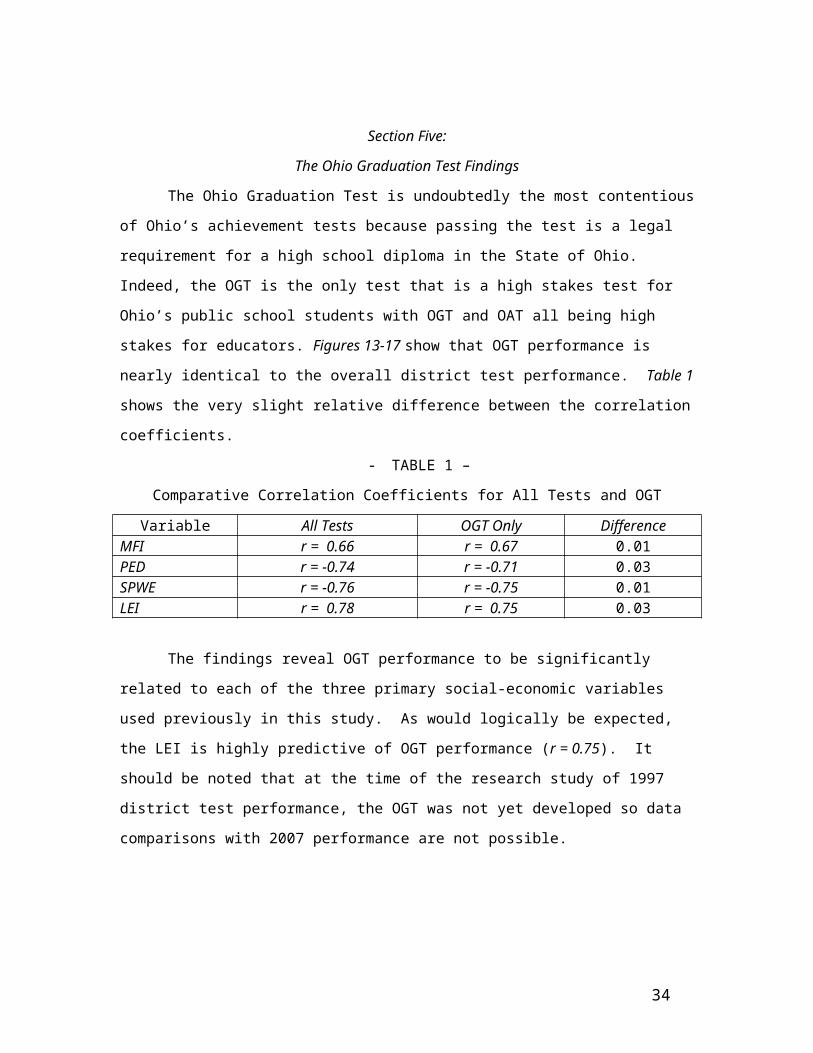
The Ohio Graduation Test is undoubtedly the most contentious of Ohio’s
achievement tests because passing the test is a legal requirement for a high school
diploma in the State of Ohio. Indeed, the OGT is the only test that is a high stakes test
for Ohio’s public school students with OGT and OAT all being high stakes for educators.
Figures 13-17 show that OGT performance is nearly identical to the overall district test
performance. Table 1 shows the very slight relative difference between the correlation
coefficients.
- TABLE 1 –
Comparative Correlation Coefficients for All Tests and OGT
Variable All Tests OGT Only DifferenceMFI r = 0.66 r = 0.67 0.01PED r = -0.74 r = -0.71 0.03SPWE r = -0.76 r = -0.75 0.01LEI r = 0.78 r = 0.75 0.03
The findings reveal OGT performance to be significantly related to each of the
three primary social-economic variables used previously in this study. As would logically
be expected, the LEI is highly predictive of OGT performance (r = 0.75). It should be
noted that at the time of the research study of 1997 district test performance, the OGT
was not yet developed so data comparisons with 2007 performance are not possible.
25
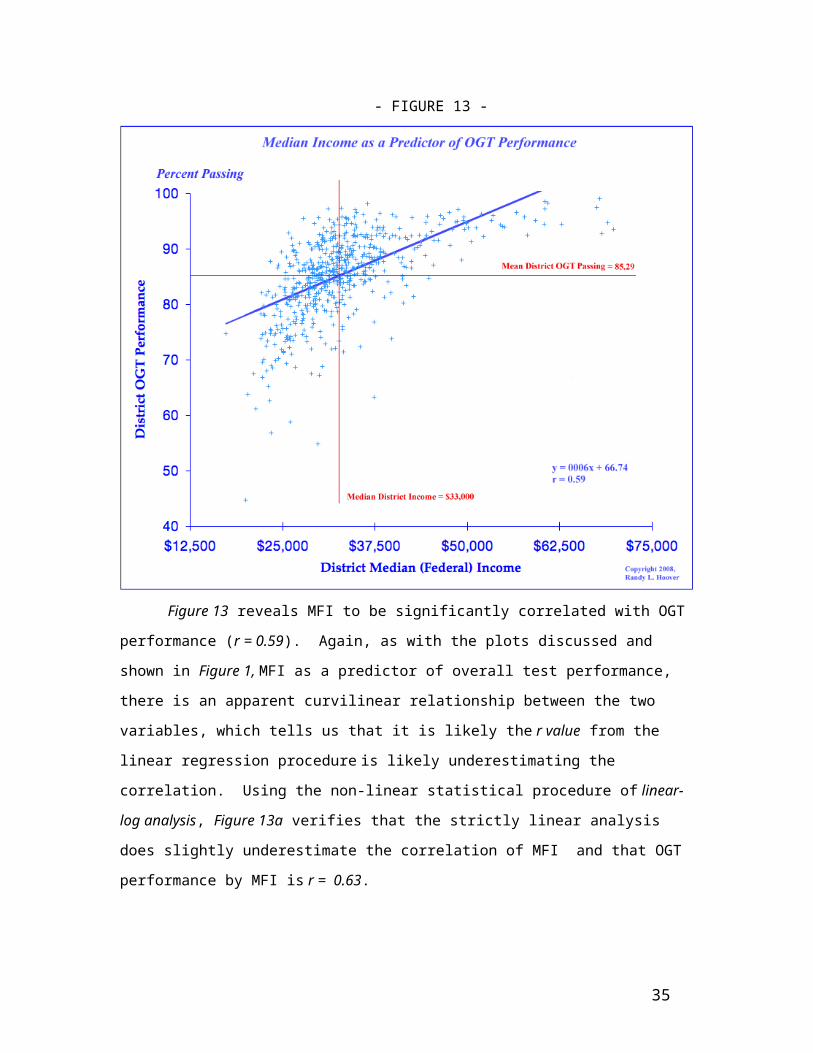
- FIGURE 13 -
Figure 13 reveals MFI to be significantly correlated with OGT performance (r =
0.59). Again, as with the plots discussed and shown in Figure 1, MFI as a predictor of
overall test performance, there is an apparent curvilinear relationship between the two
variables, which tells us that it is likely the r value from the linear regression procedure is
likely underestimating the correlation. Using the non-linear statistical procedure of
linear-log analysis, Figure 13a verifies that the strictly linear analysis does slightly
underestimate the correlation of MFI and that OGT performance by MFI is r = 0.63.
26
- FIGURE 13a -
27
- FIGURE 14 -
The data on percent economic disadvantaged and district OGT performance,
Figure 14, show OGT to be highly correlated (r = -0.71) with the economic conditions of
the families from which the children come, thus supporting the overall findings of the
study that the tests are extremely sensitive to the living conditions of the students and
stand as a more valid measure of those conditions than of academic achievement.
28
- FIGURE 14 -
Perhaps the single most telling variable regarding the absence of OGT academic
achievement validity is shown in Figure 14. The extremely high correlation of OGT
performance to single-parent family conditions is revealed. As briefly discussed
previously, SPWE is a significant variable because it carries with it an explicit family
condition as well as an economic implication.
29
- FIGURE 15 –
Applying the Lived Experience Index (Figure 15) to OGT performance shows us
that the OGT suffers from the same validity problem as the other tests do collectively.
Whether considered as a fairness issue or a test validity issue, the OGT data and its
analysis raise questions that policy makers and stakeholders of Ohio need to address
openly and honestly in order to have a State school accountability system with a
graduation requirement that is fair to students and their families.
30

- FIGURE 16 -
Figure 16 shows the distribution of OGT school district performance
controlling for the effects of the social-economic factors that form the LEI in the same
manner and format of graph used in Figure 5 showing actual district performance on all
tests. Again, what we see are district performances strikingly different from those
portrayed in Figure 15 as indicative of what the State reports. The power of LEI for
predicting OGT performance (r = 0.75) shown in Figure 15 contrasted with the
demonstrated reality of actual performance as shown in Figure 16 seriously undermines
the basis for using OGT as a requirement for receiving a high school diploma.
31
Section Six:A Brief Discussion of the Findings and Issues
In most ways, examination of 2007 Ohio school district test performance in light
of the 1997 performance stands as a distinction without a difference in that, essentially,
nothing has changed— the tests are still demonstrably assessing the attributes and
artifacts of students’ lived experience to an incredibly high degree. Therefore, it is
logical to conclude that any and all aspects of Ohio’s school accountability system that
are based upon OAT and OGT are flawed to the point that they are simply not credible
—not worthy of belief. The Ohio School Report Card still stands as a fundamental
misrepresentation of school and district performance.
The argument that OAT and OGT are not academically valid rests upon the
finding of their LEI bias. Additionally, the failure of the State to account for this bias
reality masks any actual academic achievement progress or lack of progress as given in
the findings on actual district performance. The findings of this research study
consistently encompass more than just research-grounded insight into the performance
of districts having more disadvantaged children—The performance of advantaged
districts is just as invalid as the performance of less advantaged districts.
A particularly disturbing finding is the use of OGT as a requirement for a high
school diploma. Using an academically invalid test as a gatekeeper for high school
graduation is grossly unfair to the students and to their families. Indeed, given that the
14th amendment to the United States Constitution guarantees legal due process, an
interesting legal argument18 might be made to argue that using OGT as a means for
denying a high school diploma violates the right to due process. In terms of the OGT
requirement, we are denying many students diplomas simply because of their family,
economic, and social backgrounds irrespective of their talent, ability, capability, or
aptitude to succeed and do well in life.
o Understanding Why Student Performance is What It Is:
It is not the purpose of this research study to explain in depth why students score
as they do--why the Ohio Achievement Tests and Ohio Graduation Tests assess the
lived experience of the students at the expense of assessing actual academic
achievement. However, it would be remiss to not at least suggest why this is so given
the findings of the study. The literature base that addresses lived experience of children
18 This author is not a lawyer and is not offering formal legal advice though he has studied school law and teaches a graduate level course in that area.
32
and its manifestations in life and in school is extremely vast and varied. There is a wide
variety of forces and factors that inform well the phenomenon of standardized test
performance, and what has been written does clearly lead to cogent understanding.
However, one particular study “The Early Catastrophe: The 30 Million Word Gap
by Age 3” by Hart and Risley, published in American Educator (Spring, 2003)19, is
arguably a very good starting point for beginning to understand why student
performance is what it is as evidenced in this research study. I also strongly recommend
Divided We Fail: Issues of Equity in American Schools, written by Crystal M. England
and published by Heinemann, 2005. The National Center for Fair & Open Testing at
www.fairtest.org is an excellent source for additional insights into the issues of
standardized achievement testing across the United States.
Perhaps the three most wrong-headed assumptions underlying systems of
school accountability such as found in Ohio and as firmly entrenched in the basis for
NCLB are 1) the idea that all children are the same when they come to school, 2) the
belief that one paper and pencil test can validly determine the worth, capability, potential,
talent, and intellectual ability of any and all school-age children, and 3) the conviction
that those paper and pencil tests can determine the professional worthiness of
educators. The reality that contradicts those assumptions even at the common sense
level is that we are what we have experienced in life—no more, no less. And, given that
reality, common sense informs us that the lived experience of school children is
extremely varied and often very diverse across families, wealth, individual differences,
lifestyles, and enrichment.
To understand why students score as they do, we also need to realize that when
tests are standardized, they are normed on particular language use, vocabulary, values,
social-economic perspectives, and life experiences. Too often these norms are more or
less alien to population groups outside the upper-class social-economic group upon
whom the tests are most commonly normed. Depth and breadth of experience as well
as enrichment are most often a function of wealth and the opportunity it affords to bring
us the material, physical, emotional well-being and security that shape our lived
experience as what we know. Likewise, holding educators accountable for providing
these kinds of things in schools and in classrooms to students who are less than fully
advantaged is absurd even to the severest critics of public educators— or ought to be.
19 This article may be found online at http://www.aft.org/pubs-reports/american_educator/spring2003/catastrophe.html
33
o Educator Accountability Issues:
The findings of this study also inform the issue of educator accountability.
Stakeholders need to clearly understand that, with the exception of OGT, the State’s
school accountability system is high stakes testing for educators only. (In the case of
OGT, it is high stakes testing for both educators and high school students.) For Ohio’s
educators and stakeholders, there is a significant message about school accountability
in these research findings that must be made explicit.
The findings underscore how we are punishing educators because they work in
districts with student populations having low LEI conditions. Similarly, Ohio’s
accountability system reports educator performance with no regard whatsoever for the
degree to which educators actually advance academic achievement. Conversely, we
give high ratings to districts that have student populations having high LEI conditions
regardless of whether the district is truly advancing academic achievement.
Given the statistically significant data-based evidence that OAT and OGT test
performance is primarily determined by the lives of our students outside of school,
holding Ohio’s schools and educators accountable for test performance is entirely
unreasonable and unjust for the educators as well as to the stakeholders of Ohio. What
has been absent in school accountability discussions is the fundamental principle that
we can hold people accountable for those things and only those things over which they
have professional decision latitude and control—authentic accountability.
Therefore, the basis for school and educator accountability must never be rooted
in non-school forces and factors such as the lived experience of the students. To do so
is to engage in pseudo accountability at the expense of authentic accountability, the
latter being the element most vital to making the Ohio School Report Cards credible for
the people of Ohio.
It was not the intent of this study and its findings to argue against educational
accountability. On the contrary, both educator accountability and professional standards
are both requisite to insuring a quality system of public schooling. However paradoxical,
it is incumbent upon stakeholders and especially professional education associations to
hold education policy makers and politicians accountable for a valid and credible
education accountability system.
o Concluding Comments:
34
In the spirit of the age-old adage that a picture is worth a thousand words, Figure
17 is a summary pictorial representation of the most basic finding. It is a graphical
expression of district performance and LEI in terms of social-economic class.
- FIGURE 17 -
The graph uses z-score transformations in order to illustrate the very real district
performance differentials across social-economic levels and to reasonably, though
somewhat arbitrarily20, identify district performance by social-economic class.
The following paraphrases the conclusion of the 2000 research study: Rejection
of these findings regarding overall OAT validity means that we full\y accept the position
that wealth and advantage define academic intelligence, that the wealthier the students,
the more intelligent they are than less wealthy students. This position is absurd from
any perspective — wealth does not define intelligence nor does it determine the ability to
learn.
20 The LEI “Class” designations are arbitrary only in the sense that they are assigned using standard deviations above and below the mean. They are reasonable in the sense that they are logically derived from a reasoned statistical procedure.
35