Embed Size (px)
Citation preview
Human Journals
Research Article
June 2015 Vol.:3, Issue:3
© All rights are reserved by Vaishali Shirsat et al.
A Rapid Stability Indicating RP-HPLC Method and the Degradation
Kinetics Data for the Simultaneous Estimation of Tenofovir Disoproxil
Fumarate and Emtricitabine
www.ijppr.humanjournals.com
Keywords: Tenofovir disoproxil fumarate (TDF),
Emtricitabine (FTC), RP-HPLC, Forced Degradation,
Degradation kinetics study
ABSTRACT
A gradient stability indicating assay method was developed
and validated according to the ICH guidelines for
simultaneous estimation of Emtricitabine (FTC) and
Tenofovir Disoproxil Fumarate (TDF) in marketed tablet
formulation. The resolution between the drugs and their
degradants was achieved on HiQ Sil C18 HS HPLC column
with mobile phase consisting of ammonium acetate buffer
(pH 5.5) and methanol at a wavelength of 260 nm. Drugs
were subjected to forced hydrolytic, oxidative, photolytic and
thermal degradation conditions. FTC showed degradation in
alkaline (0.5 N NaOH) and oxidative condition (3% H2O2) at
room temperature and acidic degradation (0.1 N HCl) under
reflux conditions at 800C. Complete degradation was
observed for TDF in alkaline medium (0.1 N NaOH) at room
temp. TDF also showed degradation in acidic medium (0.1 N
HCl) when refluxed at 800C. The described stability
indicating assay method was used to study degradation
kinetics of TDF and FTC under different forced degradation
conditions as specified above. The kinetic parameters like
rate constant (K), half life (t1/2), shelf life (t90) were
calculated and order of reaction was determined. The best fit
corresponding to the first order kinetics was observed in the
studies of the degradation kinetics of FTC and TDF.
Manasi Agashe1, Rohit Chaudhari
2, Vaishali
Shirsat1*
1 Department of Pharmaceutical Analysis, Bombay
College of Pharmacy, Kalina, Santacruz (E),
Mumbai-400098, Maharashtra,
2 Department of Pharmaceutical Chemistry, Bombay
College of Pharmacy, Kalina, Santacruz (E),
Mumbai-400098, Maharashtra, India.
Submission: 3 June 2015
Accepted: 9 June 2015
Published: 25 June 2015
www.ijppr.humanjournals.com
Citation: Vaishali Shirsat et al. Ijppr.Human, 2015; Vol. 3 (3): 145-159.
146
INTRODUCTION
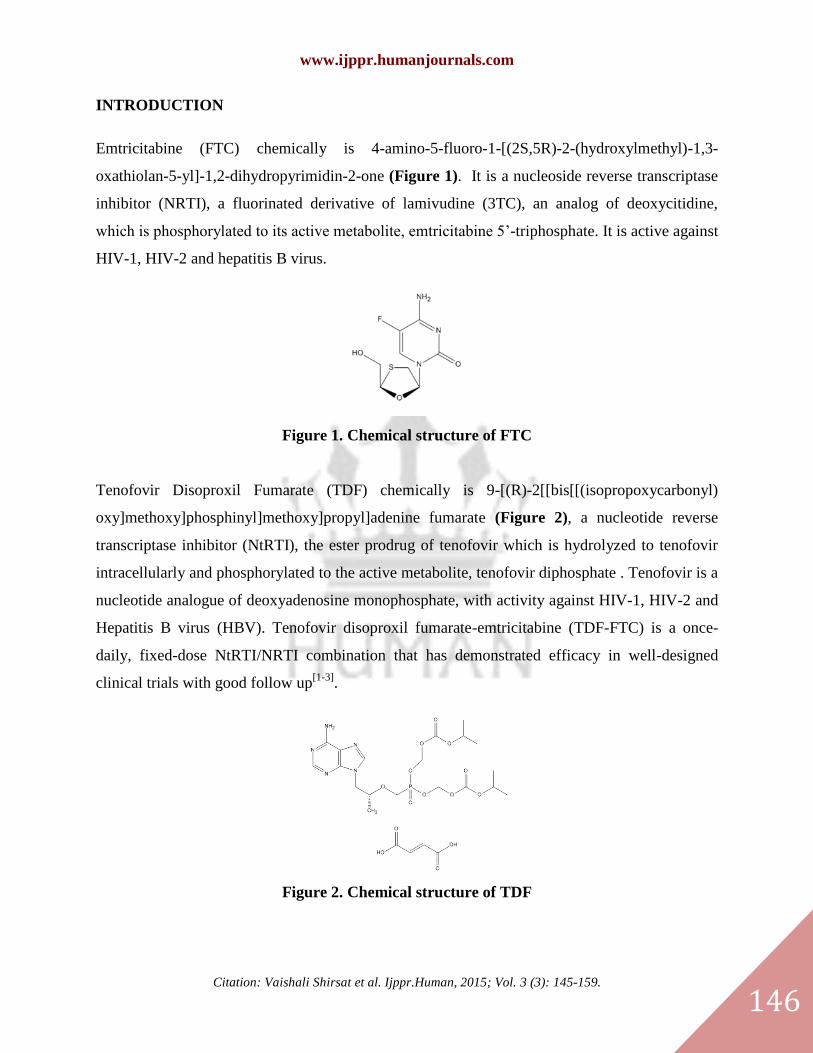
Emtricitabine (FTC) chemically is 4-amino-5-fluoro-1-[(2S,5R)-2-(hydroxylmethyl)-1,3-
oxathiolan-5-yl]-1,2-dihydropyrimidin-2-one (Figure 1). It is a nucleoside reverse transcriptase
inhibitor (NRTI), a fluorinated derivative of lamivudine (3TC), an analog of deoxycitidine,
which is phosphorylated to its active metabolite, emtricitabine 5’-triphosphate. It is active against
HIV-1, HIV-2 and hepatitis B virus.
Figure 1. Chemical structure of FTC
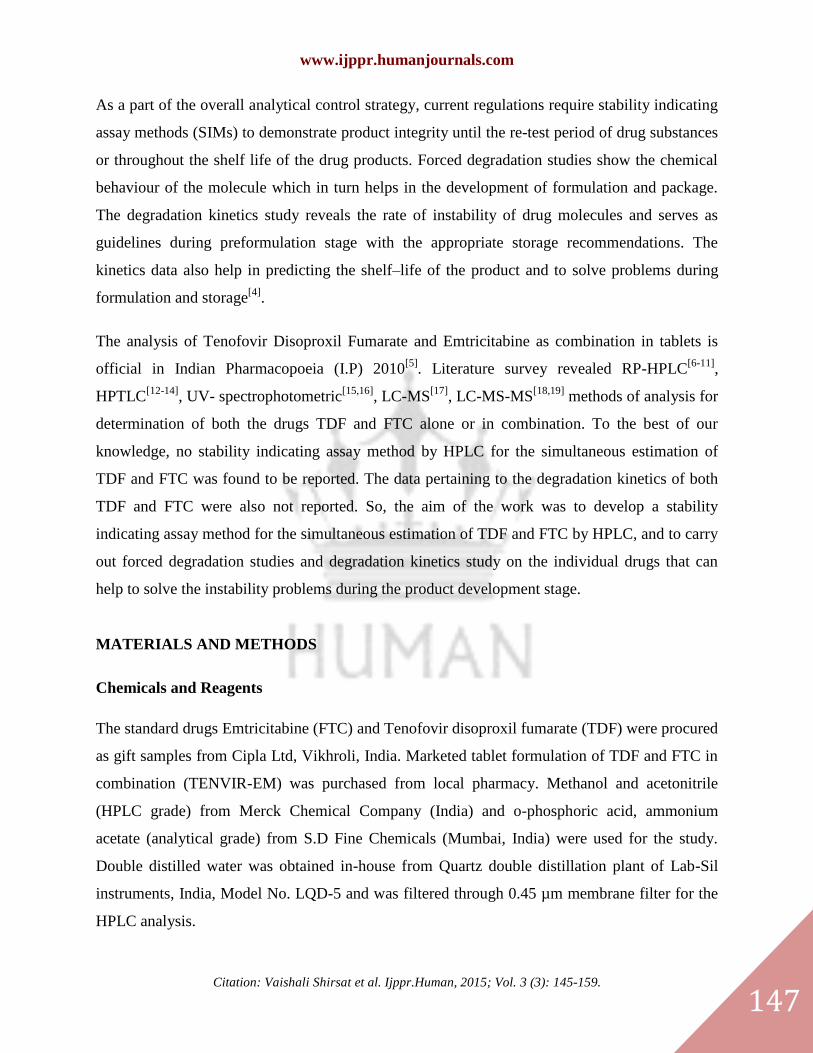
Tenofovir Disoproxil Fumarate (TDF) chemically is 9-[(R)-2[[bis[[(isopropoxycarbonyl)
oxy]methoxy]phosphinyl]methoxy]propyl]adenine fumarate (Figure 2), a nucleotide reverse
transcriptase inhibitor (NtRTI), the ester prodrug of tenofovir which is hydrolyzed to tenofovir
intracellularly and phosphorylated to the active metabolite, tenofovir diphosphate . Tenofovir is a
nucleotide analogue of deoxyadenosine monophosphate, with activity against HIV-1, HIV-2 and
Hepatitis B virus (HBV). Tenofovir disoproxil fumarate-emtricitabine (TDF-FTC) is a once-
daily, fixed-dose NtRTI/NRTI combination that has demonstrated efficacy in well-designed
clinical trials with good follow up[1-3]
.
Figure 2. Chemical structure of TDF
www.ijppr.humanjournals.com
Citation: Vaishali Shirsat et al. Ijppr.Human, 2015; Vol. 3 (3): 145-159.
147
As a part of the overall analytical control strategy, current regulations require stability indicating
assay methods (SIMs) to demonstrate product integrity until the re-test period of drug substances
or throughout the shelf life of the drug products. Forced degradation studies show the chemical
behaviour of the molecule which in turn helps in the development of formulation and package.
The degradation kinetics study reveals the rate of instability of drug molecules and serves as
guidelines during preformulation stage with the appropriate storage recommendations. The
kinetics data also help in predicting the shelf–life of the product and to solve problems during
formulation and storage[4]
.
The analysis of Tenofovir Disoproxil Fumarate and Emtricitabine as combination in tablets is
official in Indian Pharmacopoeia (I.P) 2010[5]
. Literature survey revealed RP-HPLC[6-11]
,
HPTLC[12-14]
, UV- spectrophotometric[15,16]
, LC-MS[17]
, LC-MS-MS[18,19]
methods of analysis for
determination of both the drugs TDF and FTC alone or in combination. To the best of our
knowledge, no stability indicating assay method by HPLC for the simultaneous estimation of
TDF and FTC was found to be reported. The data pertaining to the degradation kinetics of both
TDF and FTC were also not reported. So, the aim of the work was to develop a stability
indicating assay method for the simultaneous estimation of TDF and FTC by HPLC, and to carry
out forced degradation studies and degradation kinetics study on the individual drugs that can
help to solve the instability problems during the product development stage.
MATERIALS AND METHODS
Chemicals and Reagents
The standard drugs Emtricitabine (FTC) and Tenofovir disoproxil fumarate (TDF) were procured
as gift samples from Cipla Ltd, Vikhroli, India. Marketed tablet formulation of TDF and FTC in
combination (TENVIR-EM) was purchased from local pharmacy. Methanol and acetonitrile
(HPLC grade) from Merck Chemical Company (India) and o-phosphoric acid, ammonium
acetate (analytical grade) from S.D Fine Chemicals (Mumbai, India) were used for the study.
Double distilled water was obtained in-house from Quartz double distillation plant of Lab-Sil
instruments, India, Model No. LQD-5 and was filtered through 0.45 µm membrane filter for the
HPLC analysis.
www.ijppr.humanjournals.com
Citation: Vaishali Shirsat et al. Ijppr.Human, 2015; Vol. 3 (3): 145-159.
148
Optimised HPLC Chromatographic Conditions
The chromatographic system consisted of JASCO HPLC system with the JASCO-PU 2080
PLUS intelligent HPLC pump, and JASCO UV-2075 plus intelligent UV-Vis detector. The
software used was Borwin software, Varian star 800 MODULE INTERFACE. A 20 µl
Rheodyne injector port was used for injecting sample solutions. A HiQ Sil C18HS (250×4.6
mm; 5 µm particle size) column maintained at ambient temperature was used for the
analysis. The gradient method consisting of mobile phase -20mM Ammonium acetate (pH
5.5 ± 0.2): methanol in a composition of 85:15 ( 0-20 min), 20: 80 ( 20-22 min), 20:80 ( 22-
30 min), 85:15 ( 30-32 min), 85:15 (32-37 min) was found to be the most optimum method
for separation of both the drugs TDF and FTC, and all their degradants in combination. The
pH of buffer was adjusted with o-phosphoric acid. The mobile phase was filtered through
0.45 µm membrane filter followed by sonication for 10 min using bath sonicator. The
optimum wavelength selected for quantification was 260 nm with a total run time of 35 min.
Preparation of solutions
Preparation of standard stock solution of drugs
Standard stock solution of both drugs FTC and TDF of concentration of 1000 µg/ml (1000
ppm) was prepared in methanol by dissolving 10 mg of each drug in 10 ml of methanol. The
standard stock solutions were diluted with the mobile phase to get solutions in concentrations
ranging from 0.1 µg/ml to 100 µg/ml.
Analysis of marketed tablet formulation
Preparation of test solution
Twenty marketed tablets of FTC and TDF in combination (TENVIR-EM, Cipla Ltd) were
weighed and crushed to give a fine powder. Tablet powder equivalent to weight of one tablet
(1.0172 g) was weighed and transferred to a 100 ml volumetric flask. Both drugs were
extracted using a mixture of methanol and water in the ratio of 70:30 and were kept for bath
sonication. The volume was made up to 100 ml with methanol and water mixture. The
solution was filtered through 0.45 µm membrane filter. 1 ml of the filtered tablet solution
www.ijppr.humanjournals.com
Citation: Vaishali Shirsat et al. Ijppr.Human, 2015; Vol. 3 (3): 145-159.
149
was diluted to 10 mL with mobile phase. Then 1 ml of this solution was further diluted to 10
ml with mobile phase to give test solution concentration of 20 µg/mL of FTC and 30 µg/mL
of TDF. The peak areas of standard and sample solutions were compared and percentage
assay was calculated.
Forced degradation samples of FTC and TDF
For all hydrolytic and oxidative degradation conditions, 15 mg of each drug was weighed and
dissolved in 15 ml of acid (0.1 N, 0.2, 0.5, 1 N HCl), base (0.1 N, 0.2, 0.5, 1 NaOH), distilled
water and hydrogen peroxide (3 % v/v and 10 % v/v) respectively. The reactions were monitored
for 24 hr at room temperature and for 8 hr under reflux condition at 80ºC using TLC. In case of
acid and base degradation, reaction mixture was neutralized by using same strength of acid and
base respectively. The photolytic degradation study was carried both in solid and solution form
by exposing 100 mg and 1mg/ml methanolic solution of each drug respectively to direct sunlight
daily for 4 hr and was studied for 15 days. Dry heat degradation for TDF was carried out by
subjecting 100 mg of drug to dry heat in hot air oven at 60ºC for 24 hr, and for FTC by
subjecting 100 mg of drug to dry heat in hot air oven at 100ºC for 5 hr. For HPLC analysis of
degradants, final dilutions of the samples were done in mobile phase.
Degradation kinetics study on FTC and TDF
The oxidative degradation kinetics study on FTC was carried out using 3 % H2O2 at room
temperature. Samples were withdrawn at time interval of 0, 0.25, 0.5, 1, 2, and 3 hr. The
degradation kinetics under acidic and basic conditions for FTC was studied using 0.1 N HCl at
reflux conditions and 0.5 N NaOH at room temperature for 5 hr respectively. The degradation
kinetics for TDF was studied under acidic degradation using 0.1 N HCl at reflux conditions
(80ºC) for 5 hr. The degradation kinetics for TDF in basic condition was not studied as drug
showed complete degradation on addition of 0.1 N NaOH. The order of reaction was determined
by a plot of log % remaining versus time. The degradation rate constant (K), half-life or time left
for 50% potency (t1/2), shelf life or time left for 90% potency (t90) for each stress condition were
calculated by using the slope of the straight line for each degradation condition, Equation (1),
and Equation (2) respectively.
www.ijppr.humanjournals.com
Citation: Vaishali Shirsat et al. Ijppr.Human, 2015; Vol. 3 (3): 145-159.
150
Equation (1): t1/2= 0.693/K
Equation (2): t90 = 0.105/K
Method Validation
The method was validated in terms of linearity, range, precision, accuracy, specificity, limit
of detection, limit of quantitation and robustness as per ICH guidelines[20]
. The system
suitability parameters were evaluated as specified in Indian Pharmacopoeia 2010.
Linearity:
Six different concentrations of each drug (10, 20, 30, 40, 50 and 60 µg/mL) were prepared
from standard stock solution of 1000 µg/mL of FTC and TDF respectively and were
analysed in triplicate. The peak areas were plotted against the corresponding concentrations
to obtain a linearity plot.
Precision:
The precision was evaluated with respect to both repeatability and intermediate precision.
Repeatability was evaluated by injecting six replicate injections of test solution of the drugs FTC
(20 µg/ml) and TDF (30 µg/ml). The studies were repeated for three different days to determine
intermediate precision. Peak areas of the drugs were determined and % RSD was calculated.
Accuracy:
The accuracy of the method was assessed by the recovery studies at three different
concentrations (corresponding to 80%, 100% and 120% of the test solution concentration for
both FTC and TDF) by the addition of known amount of standard to the test solutions. The
% recovery was calculated by slope and intercept of the linearity plot of drugs.
Limit of detection (LOD) and Limit of Quantitation (LOQ):
The limit of detection was calculated based on visual evaluation and S/N ratio (3: 1) and the limit
of quantitation was calculated based on visual evaluation and S/N ratio (10: 1).
www.ijppr.humanjournals.com
Citation: Vaishali Shirsat et al. Ijppr.Human, 2015; Vol. 3 (3): 145-159.
151
Specificity:
This was evaluated by injecting degradation sample solutions. The resolution between the
drugs and degradation products was evaluated.
Robustness:
Robustness was evaluated by deliberate variation in parameters like pH and molar
concentration of buffer. The pH of the mobile phase was varied by 5.5 ± 0.1 units and molar
concentration was varied by 20 ± 5 mM. Robustness was studied at a concentration of 30
µg/mL for TDF and 20 µg/mL for FTC.
RESULTS AND DISCUSSION
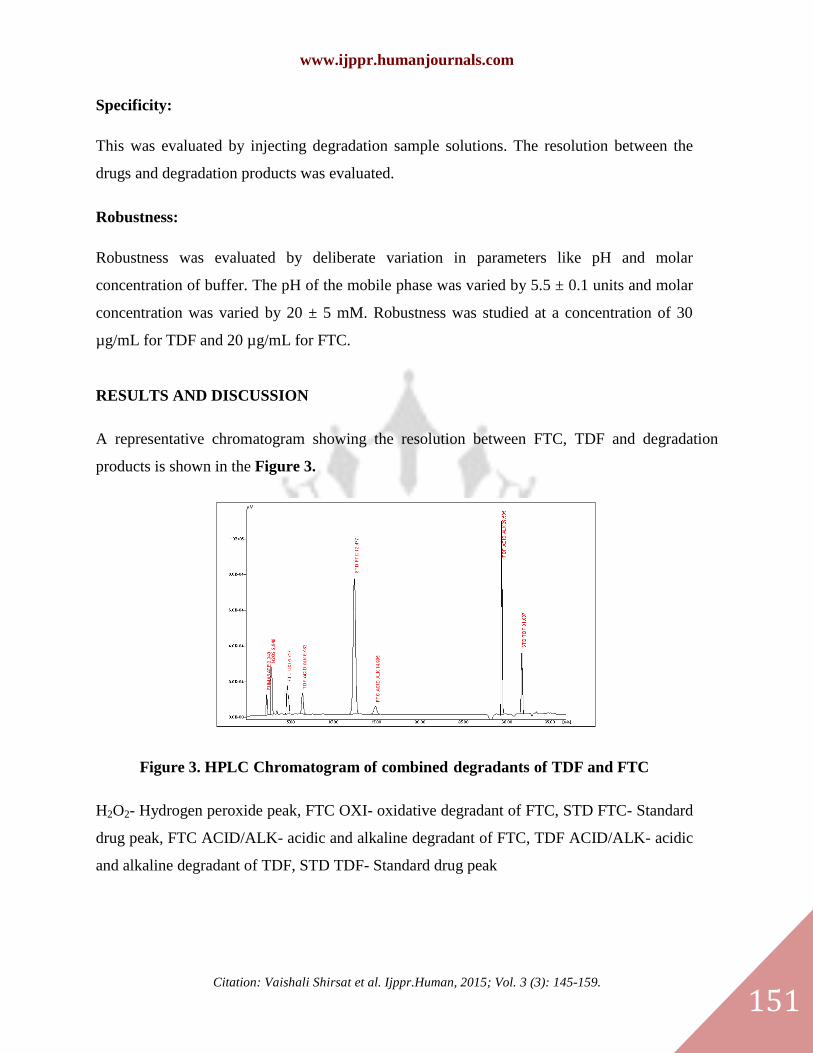
A representative chromatogram showing the resolution between FTC, TDF and degradation
products is shown in the Figure 3.
Figure 3. HPLC Chromatogram of combined degradants of TDF and FTC
H2O2- Hydrogen peroxide peak, FTC OXI- oxidative degradant of FTC, STD FTC- Standard
drug peak, FTC ACID/ALK- acidic and alkaline degradant of FTC, TDF ACID/ALK- acidic
and alkaline degradant of TDF, STD TDF- Standard drug peak
www.ijppr.humanjournals.com
Citation: Vaishali Shirsat et al. Ijppr.Human, 2015; Vol. 3 (3): 145-159.
152
Forced degradation studies
FTC showed acidic degradation after 3 hr in 0.1 N HCl under reflux conditions at 80ºC, alkaline
degradation after 1 hr in 0.5 N NaOH at room temperature, and oxidative degradation in 3% v/v
H2O2 after 15 min at room temperature. Forced degradation studies on FTC showed that the drug
is more susceptible for oxidation at room temperature. The drug was found to be stable under
forced neutral hydrolysis, thermal and photolytic degradation conditions. TDF showed
degradation in acidic medium (0.2 N HCl) under reflux condition at 80ºC after 1 hour and
immediate complete degradation in alkaline medium (0.1 N NaOH) at room temperature. TDF
was found to be very susceptible to alkaline hydrolysis. TDF was found to be stable under
neutral hydrolytic, oxidative, photolytic and thermal degradation conditions.
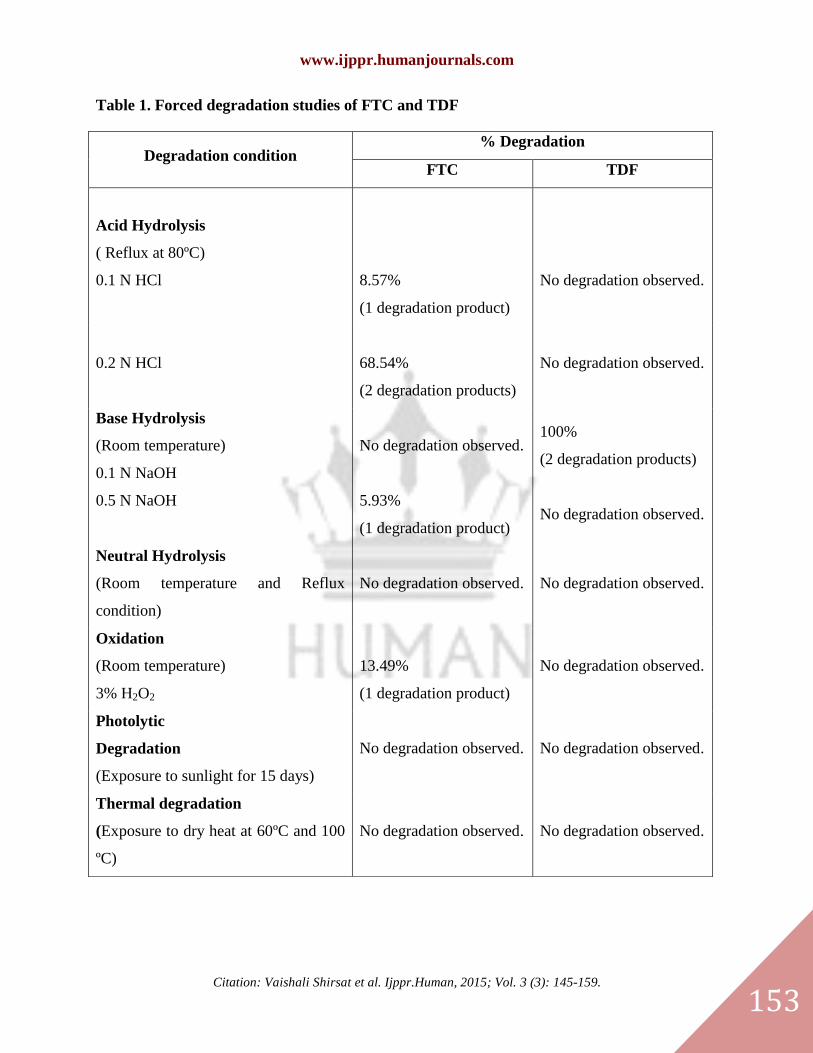
The % degradation was calculated by comparing the peak areas of standard drug with peak areas
of drug under degradation conditions. The % degradation for FTC in acidic, basic and oxidative
degradation conditions was found to be 8.57%, 5.93% and 13.49% respectively. The %
degradation for TDF in acidic and basic degradation conditions was found to be 68.54% and
100% respectively. The results are tabulated in the Table 1.
www.ijppr.humanjournals.com
Citation: Vaishali Shirsat et al. Ijppr.Human, 2015; Vol. 3 (3): 145-159.
153
Table 1. Forced degradation studies of FTC and TDF
Degradation condition % Degradation
FTC TDF
Acid Hydrolysis
( Reflux at 80ºC)
0.1 N HCl
8.57%
(1 degradation product)
No degradation observed.
0.2 N HCl
68.54%
(2 degradation products)
No degradation observed.
Base Hydrolysis
(Room temperature)
0.1 N NaOH
No degradation observed. 100%
(2 degradation products)
0.5 N NaOH
5.93%
(1 degradation product) No degradation observed.
Neutral Hydrolysis
(Room temperature and Reflux
condition)
No degradation observed. No degradation observed.
Oxidation
(Room temperature)
3% H2O2
13.49%
(1 degradation product)
No degradation observed.
Photolytic
Degradation
(Exposure to sunlight for 15 days)
No degradation observed. No degradation observed.
Thermal degradation
(Exposure to dry heat at 60ºC and 100
ºC)
No degradation observed. No degradation observed.
www.ijppr.humanjournals.com
Citation: Vaishali Shirsat et al. Ijppr.Human, 2015; Vol. 3 (3): 145-159.
154
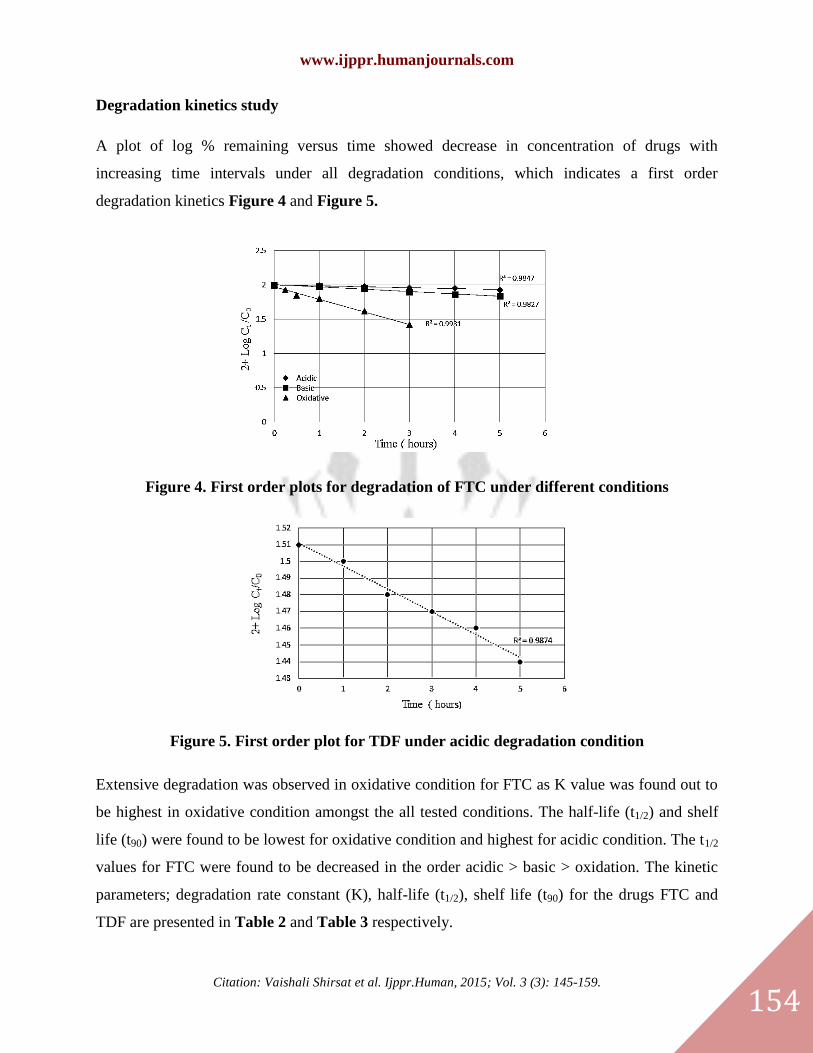
Degradation kinetics study
A plot of log % remaining versus time showed decrease in concentration of drugs with
increasing time intervals under all degradation conditions, which indicates a first order
degradation kinetics Figure 4 and Figure 5.
Figure 4. First order plots for degradation of FTC under different conditions
Figure 5. First order plot for TDF under acidic degradation condition
Extensive degradation was observed in oxidative condition for FTC as K value was found out to
be highest in oxidative condition amongst the all tested conditions. The half-life (t1/2) and shelf
life (t90) were found to be lowest for oxidative condition and highest for acidic condition. The t1/2
values for FTC were found to be decreased in the order acidic > basic > oxidation. The kinetic
parameters; degradation rate constant (K), half-life (t1/2), shelf life (t90) for the drugs FTC and
TDF are presented in Table 2 and Table 3 respectively.

www.ijppr.humanjournals.com
Citation: Vaishali Shirsat et al. Ijppr.Human, 2015; Vol. 3 (3): 145-159.
155
Table 2. Summary of FTC degradation kinetics
Degradation condition K( hr -1
) t1/2 (hr) t90 (hr)
Acidic
(0.1 N HCl reflux at 80ºC) 0.032 21.65 3.28
Basic
(0.5 N NaOH at room
temperature)
0.079 8.70 1.31
Oxidation
(3% H2O2 at room
temperature)
0.421 1.64 0.25
Table 3. Summary of TDF degradation kinetics
Degradation condition K( hr -1
) t1/2 (hr) t90 (hr)
Acidic
(0.2 N HCl reflux at 80ºC ) 0.0315 22 3.33
Method Validation
Linearity
A linear response for FTC and TDF in combination was obtained in concentration range of
10 to 70 µg/ml. Linearity was studied using six different concentrations of each drug (10,
20, 30, 40, 50 and 60 µg/mL). The linear regression equation and correlation co-efficient (r2)
obtained for FTC were y= 26272x+68494 and 0.999 respectively and for TDF were y=
22264x+42617 and 0.9991 respectively.
Precision
The % RSD for intraday and inter day precision was less than 2%, which is within the acceptable
limits, indicating that the method is precise.
The results are presented in the Table 4.

www.ijppr.humanjournals.com
Citation: Vaishali Shirsat et al. Ijppr.Human, 2015; Vol. 3 (3): 145-159.
156
Table 4. Inter-day and Intra-day precision of standard FTC (20 µg/mL) & TDF (30
µg/mL) in combination
Drug Intra-day precision Inter-day precision
Mean peak area ± SD
(n=6)
%
RSD
Mean peak area ± SD
(n=6)
%
RSD
FTC 615591 ± 4726.021 0.76 615498 ±4367.426 0.70
TDF 755660 ±6877.844 0.90 762878 ±6341.785 0.83
Accuracy
The results obtained for accuracy are presented in the Table 5. The % recovery for FTC ranged
from 98.36-101.34%, whereas for TDF the % recovery ranged from 99.66-101.75% indicating
that the proposed method is accurate.
Table 5. Percent recovery of FTC and TDF in combination in marketed tablets
Level
(%)
Concentration
of drug added
(µg/mL)
Total
concentration of
drug (µg/mL)
%
RSD
%
Recovery
FTC
80 16 36 0.24 98.36
100 20 40 0.05 98.92
120 24 44 0.15 101.34
Mean 0.158 99.54 %
TDF
80 24 54 0.07 99.67
100 30 60 0.01 99.66
120 36 66 0.11 101.75
Mean 0.3 100.36%
www.ijppr.humanjournals.com
Citation: Vaishali Shirsat et al. Ijppr.Human, 2015; Vol. 3 (3): 145-159.
157
Limit of Detection (LOD) and Limit of Quantitation (LOQ)
The LOD and LOQ for FTC were found to be 0.05 µg/mL and 0.1 µg/mL respectively. The
LOD and LOQ for TDF were found to be 0.04 µg/mL and 0.08 µg/mL respectively.
Specificity
Degradation peaks were well resolved from the drugs peak, which indicates that the method
is specific. The chromatogram for the same is shown in Figure 1.
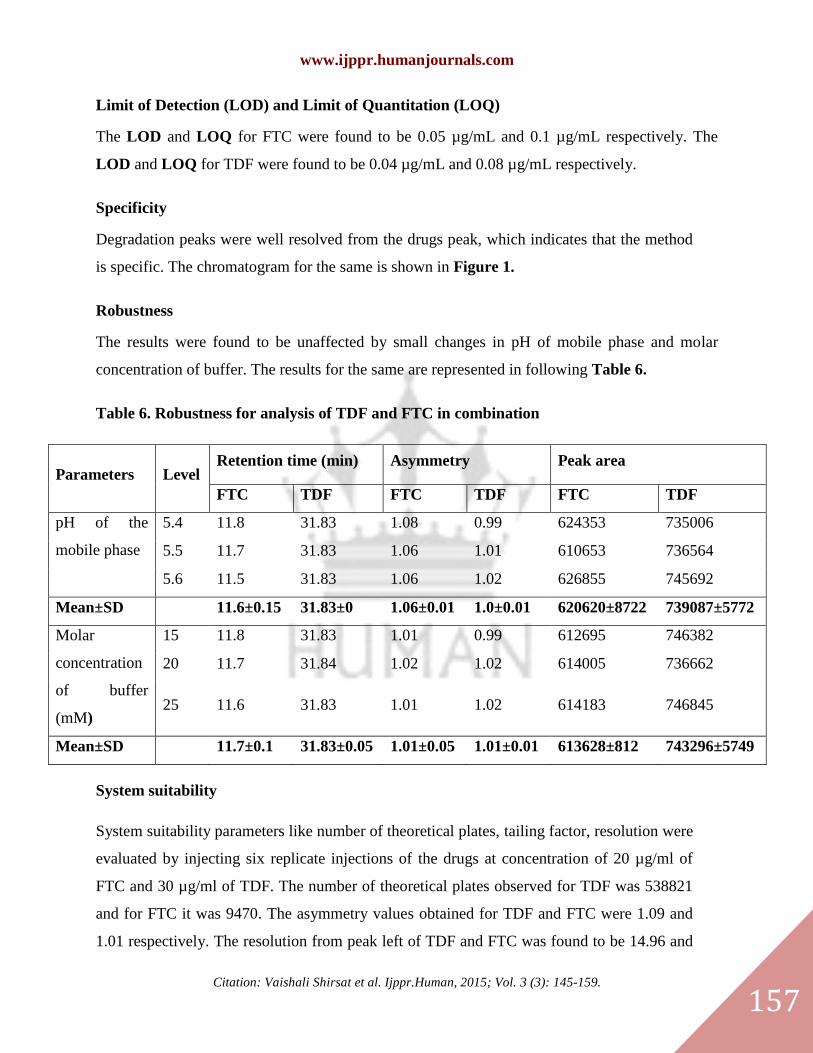
Robustness
The results were found to be unaffected by small changes in pH of mobile phase and molar
concentration of buffer. The results for the same are represented in following Table 6.
Table 6. Robustness for analysis of TDF and FTC in combination
Parameters Level Retention time (min) Asymmetry Peak area
FTC TDF FTC TDF FTC TDF
pH of the
mobile phase
5.4 11.8 31.83 1.08 0.99 624353 735006
5.5 11.7 31.83 1.06 1.01 610653 736564
5.6 11.5 31.83 1.06 1.02 626855 745692
Mean±SD 11.6±0.15 31.83±0 1.06±0.01 1.0±0.01 620620±8722 739087±5772
Molar
concentration
of buffer
(mM)
15 11.8 31.83 1.01 0.99 612695 746382
20 11.7 31.84 1.02 1.02 614005 736662
25 11.6 31.83 1.01 1.02 614183 746845
Mean±SD 11.7±0.1 31.83±0.05 1.01±0.05 1.01±0.01 613628±812 743296±5749
System suitability
System suitability parameters like number of theoretical plates, tailing factor, resolution were
evaluated by injecting six replicate injections of the drugs at concentration of 20 µg/ml of
FTC and 30 µg/ml of TDF. The number of theoretical plates observed for TDF was 538821
and for FTC it was 9470. The asymmetry values obtained for TDF and FTC were 1.09 and
1.01 respectively. The resolution from peak left of TDF and FTC was found to be 14.96 and
www.ijppr.humanjournals.com
Citation: Vaishali Shirsat et al. Ijppr.Human, 2015; Vol. 3 (3): 145-159.
158
16.12 respectively. The resolution obtained for peak right of FTC was 5.05. The results were
found to be within the acceptable limits as mentioned in I.P 2010.
Assay of marketed tablets
The marketed tablets were found to contain 198.65 mg (99.32% of label claim) of FTC and
299.63 mg (99.875% of label claim) of TDF when assayed. The results obtained in the assay
were found to be within the limits as specified for the assay of Tenofovir Disoproxil Fumarate
and Emtricitabine in I.P.
CONCLUSION
The forced degradation studies showed the presence of one degradation product of FTC under
reflux at 80oC each in acid, alkaline and at room temperature on subjecting to oxidation. The
drug was found to be stable under forced neutral hydrolysis, thermal and photolytic degradation
conditions. TDF showed two degradation products each in the acidic medium refluxed at 80oC
and 100% degradation at room temperature in alkaline medium. TDF was found to be stable
under neutral hydrolytic, oxidative and thermal degradation conditions. The best fit
corresponding to the first order kinetics was observed in the studies of the degradation kinetics of
FTC in acidic medium, alkaline medium, and on subjecting to oxidation. Similarly for
degradation of TDF in acidic media, the best fit was obtained for first order kinetics. The forced
degradation and kinetics study results indicate that the drug FTC is more susceptible to oxidation
at room temperature and the drug TDF demonstrates poor stability in alkaline medium. Hence
these factors must be considered during formulation of these drugs and their storage conditions.
The proposed stability indicating assay method for simultaneous estimation of TDF and FTC
successfully resolves the degradation peaks and excipients from the drugs. The proposed method
has a total run time of only 37 min and can be considered as an alternate method for monitoring
the assay of stability samples of both the drugs in combination.
ACKNOWLEDGEMENTS
The authors are thankful to Cipla Ltd, India for providing gift samples of the drugs-Emtricitabine
and Tenofovir Disoproxil Fumarate.
“The authors declare that there is no conflict of interests regarding the publication of this paper.”
www.ijppr.humanjournals.com
Citation: Vaishali Shirsat et al. Ijppr.Human, 2015; Vol. 3 (3): 145-159.
159
REFERENCES
1. Masho SW, Wang CL, Nixon DE. Review of tenofovir-emtricitabine. Ther Clin Risk Manag. 2007; 3:1097-4.
2. Brunton LL, Lazo JS, Parker KL. Antiretroviral Agents and Treatment of HIV Infection. In: Goodman &
Gilman’s The Pharmacological Basis of Therapeutics. 11th
ed. New York: The Mc Graw Hill Companies; 2005.
3. Fung HB, Stone EA, Piacenti FJ. Tenofovir disoproxil fumarate: A nucleotide reverse transcriptase for the
treatment of HIV infection. Clin Ther .2002; 24:1515-48.
4. Maggio RM, Vignaduzzo SE, Kaufman TS. Practical and regulatory considerations for stability-indicating
methods for the assay of bulk drugs and drug formulations, TrAC Trends Analyt Chem. 2013; 49:57-70.
5. Indian Pharmacopoeia 2010, Vol-III, 2191-2193
6. Ashenafi D, Chintam V, Veghel DV, Dragovic S, Hoogmartens J, Adams E. Development of a validated liquid
chromatographic method for determination of related substances and assay of tenofovir disoproxil fumarate. J
Sep Sci. 2010; 33:1708-16.
7. Hamrapurkar PD, Parate AN. HPLC method for the determination of emtricitabine and related degradation
substances, J Chromatogr Sci. 2013; 51:419-24.
8. Devanaboyina N, Satyanarayana T, Rao GB. HPLC method development and validation for simultaneous
estimation of tenofovir and emtricitabine in combines pharmaceutical dosage form. Int J Res pharm biomed Sci.
2012; 3:361-7.
9. Rezk NL, Crutchley RD, Kashuba ADM. Simultaneous quantification of emtricitabine and tenofovir in human
plasma using high performance liquid chromatography after solid phase extraction. J Chromatogr B. 2005;
822:201-8.
10. Kumar P, Dwivedi SC, Kushnoor A. A validated stability indicating RP- HPLC method for determination of
emtricitabine in bulk and capsules. Farmacia. 2012; 60:402-10.
11. Kumar P, Dwivedi SC, Kushnoor A. A validated stability indicating RP- HPLC method for determination of
tenofovir in bulk and tablet dosage forms, Euresian J Anal Chem. 2012; 7:104-14.
12. Bhirud CH, Hiremath SN. Development of validated stability-indicating simultaneous estimation of tenofovir
disoproxil fumarate and emtricitabine in tablets by HPTLC, J Pharm Res. 2013; 7:157-61.
13. Rathore AS, Sathiyanarayanan L, Mahadik KR. Stability-indicating high-Performance thin-layer
chromatographic method for quantitative estimation of emtricitabine in bulk drug and pharmaceutical dosage
form. ISRN Chrom. 2012; 2012:1-7.
14. Havele S, Dhaneshwar SR. Stress studies of tenofovir disoproxil fumarate by HPTLC in bulk drug and
pharmaceutical formulation. Scientific World Journal. 2012; 2012:1-6.
15. Ashour HK, Belal TS. New simple spectrophotometric method for determination of the antiviral mixture of
emtricitabine and tenofovir disoproxil fumarate. Arab J Chem. 2013; Article in press.
16. Sutar SV, Patil SS, Pishvikar SA, More HN. Spectrophotometric method for degradation study of tenofovir
disoproxil fumarate, Int J Pharm Sci Res. 2012; 3:4363-6.
17. Pendela M, Mamade DA, Hoogmartens J, Schepdael AV, Adams E. Characterization of emtricitabine related
substances by liquid chromatography coupled to an ion trap. Talanta. 2010; 82:125-8.
18. Delahunty T, Bushman L, Robbins B, Fletcher CV. The simultaneous assay of tenofovir and emtricitabine in
plasma using LC/MS/MS. J Chromatogr B. 2009; 77:1907-14.
19. Jansen RS, Rosing H, Kromdijk W, Heine RT, Schellens JHM, Beijnen JH. Simultaneous quantification of
emtricitabine and tenofovir nucleotides in peripheral mononuclear cells using weak anion exchange liquid
chromatography coupled with tandem mass spectrometry. J Chromatogr B. 2010; 878:621-7.
20. ICH Q2 (R1), Validation of Analytical Procedures: Text and Methodology, ICH Harmonized Tripartite
Guideline, 2005.