Embed Size (px)
Citation preview
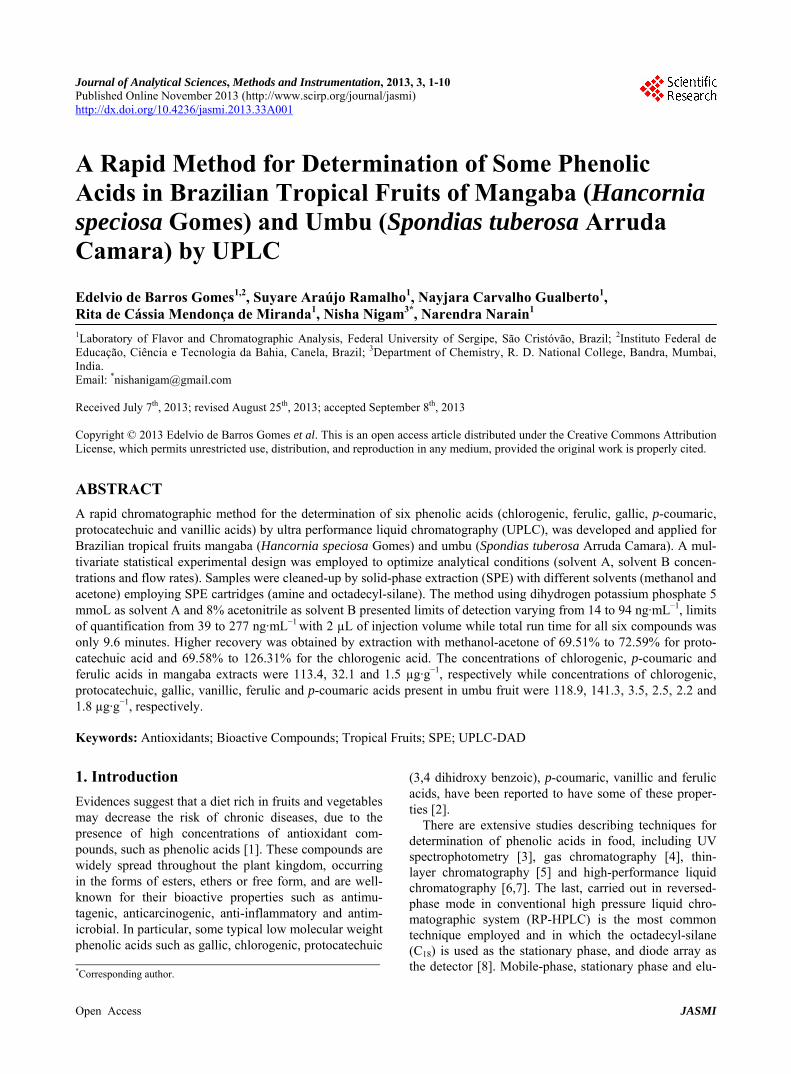
Journal of Analytical Sciences, Methods and Instrumentation, 2013, 3, 1-10 Published Online November 2013 (http://www.scirp.org/journal/jasmi) http://dx.doi.org/10.4236/jasmi.2013.33A001
Open Access JASMI
1
A Rapid Method for Determination of Some Phenolic Acids in Brazilian Tropical Fruits of Mangaba (Hancornia speciosa Gomes) and Umbu (Spondias tuberosa Arruda Camara) by UPLC
Edelvio de Barros Gomes1,2, Suyare Araújo Ramalho1, Nayjara Carvalho Gualberto1, Rita de Cássia Mendonça de Miranda1, Nisha Nigam3*, Narendra Narain1
1Laboratory of Flavor and Chromatographic Analysis, Federal University of Sergipe, São Cristóvão, Brazil; 2Instituto Federal de Educação, Ciência e Tecnologia da Bahia, Canela, Brazil; 3Department of Chemistry, R. D. National College, Bandra, Mumbai, India. Email: *[email protected] Received July 7th, 2013; revised August 25th, 2013; accepted September 8th, 2013 Copyright © 2013 Edelvio de Barros Gomes et al. This is an open access article distributed under the Creative Commons Attribution License, which permits unrestricted use, distribution, and reproduction in any medium, provided the original work is properly cited.
ABSTRACT
A rapid chromatographic method for the determination of six phenolic acids (chlorogenic, ferulic, gallic, p-coumaric, protocatechuic and vanillic acids) by ultra performance liquid chromatography (UPLC), was developed and applied for Brazilian tropical fruits mangaba (Hancornia speciosa Gomes) and umbu (Spondias tuberosa Arruda Camara). A mul- tivariate statistical experimental design was employed to optimize analytical conditions (solvent A, solvent B concen- trations and flow rates). Samples were cleaned-up by solid-phase extraction (SPE) with different solvents (methanol and acetone) employing SPE cartridges (amine and octadecyl-silane). The method using dihydrogen potassium phosphate 5 mmoL as solvent A and 8% acetonitrile as solvent B presented limits of detection varying from 14 to 94 ng·mL−1, limits of quantification from 39 to 277 ng·mL−1 with 2 µL of injection volume while total run time for all six compounds was only 9.6 minutes. Higher recovery was obtained by extraction with methanol-acetone of 69.51% to 72.59% for proto- catechuic acid and 69.58% to 126.31% for the chlorogenic acid. The concentrations of chlorogenic, p-coumaric and ferulic acids in mangaba extracts were 113.4, 32.1 and 1.5 µg·g−1, respectively while concentrations of chlorogenic, protocatechuic, gallic, vanillic, ferulic and p-coumaric acids present in umbu fruit were 118.9, 141.3, 3.5, 2.5, 2.2 and 1.8 µg·g−1, respectively. Keywords: Antioxidants; Bioactive Compounds; Tropical Fruits; SPE; UPLC-DAD
1. Introduction
Evidences suggest that a diet rich in fruits and vegetables may decrease the risk of chronic diseases, due to the presence of high concentrations of antioxidant com- pounds, such as phenolic acids [1]. These compounds are widely spread throughout the plant kingdom, occurring in the forms of esters, ethers or free form, and are well- known for their bioactive properties such as antimu- tagenic, anticarcinogenic, anti-inflammatory and antim- icrobial. In particular, some typical low molecular weight phenolic acids such as gallic, chlorogenic, protocatechuic
(3,4 dihidroxy benzoic), p-coumaric, vanillic and ferulic acids, have been reported to have some of these proper- ties [2].
There are extensive studies describing techniques for determination of phenolic acids in food, including UV spectrophotometry [3], gas chromatography [4], thin- layer chromatography [5] and high-performance liquid chromatography [6,7]. The last, carried out in reversed- phase mode in conventional high pressure liquid chro- matographic system (RP-HPLC) is the most common technique employed and in which the octadecyl-silane (C18) is used as the stationary phase, and diode array as the detector [8]. Mobile-phase, stationary phase and elu- *Corresponding author.
A Rapid Method for Determination of Some Phenolic Acids in Brazilian Tropical Fruits of Mangaba (Hancornia speciosa Gomes) and Umbu (Spondias tuberosa Arruda Camara) by UPLC
2
tion system (gradient or isocratic mode) conditions were optimized in developing a RP-HPLC method [9]. The elution systems are usually binary with an aqueous acidi-fied polar solvent (the solvent “A”—responsible for the minimization of peak tailing) such as aqueous acetic acid, perchloric acid, trichloroacetic acid, trifluoracetic acid, phosphoric acid, dihydrogen-potassium phosphate or for- mic acid; and a less polar organic solvent (the solvent “B”) such as methanol or acetonitrile [10].
In general, the RP-HPLC determinations are time- consuming and this is attributed largely due to the gradi- ent elution mode. Isocratic elution mode, on the contrary, is advantageous, since it tends to be accomplished in a single chromatographic run, with economy of solvent. Additionally, in the RP-HPLC systems, acetonitrile has been preferentially employed as the solvent “B” due to its low viscosity and excellent mixing capacity with wa- ter. Nevertheless, the recent worldwide scarcity of ace- tonitrile caused dramatic price increases, requiring for minimized usage of this solvent [11]. Moreover analysis in RP-HPLC conventional system requires more time when compared to analysis performed in reversed-phase ultra performance liquid chromatographic (RP-UPLC) system.
Few reports using isocratic RP-HPLC for the determi- nation of phenolic acids in fruits have been published [12,13], and there is just one report describing the de- velopment of isocratic method using RP-UPLC system for the simultaneous determination of phenolic acids (gallic, 3,5 dihydroxybenzoic, protocatechuic, chloroge- nic, gentisic, 4-hydroxybenzoic, caffeic, vanillic, syrin- gic, 3-hydroxybenzoic, coumaric, sinapic, ferulic, salicy- lic and trans-cinnamic acids) in beverages using mass- spectrometer as the detector [14]. However to the best of our knowledge, an isocratic RP-UPLC method using diode array as detector for determining phenolic acids in fruits has not been reported.
In this paper our objective was to develop an isocratic method for rapid determination of phenolic acids such as chlorogenic, ferulic, gallic, p-coumaric, protocatechuic and vanillic acids using RP-UPLC system and to analyze their concentrations in Brazilian tropical fruits of man- gaba and umbu. Differents mobile phases at varying flow-rates were used and evaluated to optimize analytical conditions. The method was validated by evaluating se- lectivity, linear range and limits of detection, quantifica- tion and recovery of the phenolic acids.
2. Experimental
2.1. Fruits
Ripe fruits used in this study were purchased from the Central Market in the city of Aracaju, Sergipe state, Bra- zil. Two tropical fruits, largely cultivated in this region,
were selected: mangaba (Harcornia speciosa Gomes) and umbu (Spondia stuberosa Arruda Camara).
2.2. Standards, Solvents and Reagents
All standards of phenolic acids as well as the uracil stan- dard were purchased from Sigma-Aldrich. (St Louis, MO). Phenolic acids standards were: chlorogenic, ferulic, gal- lic, p-coumaric, protocatechuic and vanillic acid. Re- agents (hydrochloric acid, dihydrogen-potassium phos- phate, trichloroacetic acid and trifluoroacetic acid) and solvents (acetonitrile, acetone and methanol) were of HPLC grade and these were purchased from Vetec Ltd (Duque de Caxias, Brazil). Dihydrogen-potassium phos- phate was used at 5 mmoL·L−1, and both trichloroacetic and trifluoroacetic acids were used at 1%v·v−1 concen- tration. All standards were dissolved in methanol. The LC grade water was obtained from milliQ water purifica- tion system (Millipore, Bedford, MA, USA).
2.3. UPLC Analysis
Analyses were performed using a Prominence Ultra Per- formance Liquid Chromatographic system (Shimadzu Inc., Japan) which comprised of a binary pump (model LC-20AD), diode array detector (model SPD-M20A), auto-sampler (model SIL-20A HT), oven (model CTO- 20A), controller (model CBM-20A), degasser (model DGU-20A3). The LC-Solution software version 1.2 was used to control the auto-sampler, detector, data acquisi-tion and run settings. A C18 reverse-phase column, (Shimpack, Shimadzu Inc. Japan; 50 mm × 3.0 mm, 2.2 µm particle size) was employed for all analysis at a tem- perature of 40˚C. Peak areas were determined at 254 nm for the gallic, vanillic and protocatechuic acid and 310 nm for the chlorogenic, ferulic and p-coumaric acids.
2.4. Parameters Optimization
A three-factor full factorial design (FFD) was used to describe the relationship between the response function and the process variables, as well as to determine the conditions that influenced the retention time. The inde- pendent variables studied were: solvent “A” (dihydro- gen-potassium phosphate, trichloroacetic acid and tri- fluoroacetic acid); flow rates of mobile phase (X1: 0.4; 0.5 and 0.6 mL·min−1) and solvent “B” (X2: 8%, 10% e 12%v·v−1 of acetonitrile) while response variables were retention time of the six phenolic acids (gallic, chloro- genic, protocatechuic, p-coumaric, vanillic and ferulic: Y1, Y2, Y3, Y4, Y5, Y6, respectively). Twenty-seven ran- domized experiments were performed, based on FFD parameters as cited in Table 1. Solvent “A” solutions were prepared using deionized water and pH was ad- justed to 2.4.
Open Access JASMI
A Rapid Method for Determination of Some Phenolic Acids in Brazilian Tropical Fruits of Mangaba (Hancornia speciosa Gomes) and Umbu (Spondias tuberosa Arruda Camara) by UPLC
3
Table 1. Conditions of full factorial design of 33 detailing independent variables, their codes and values.
Coded levels Independent variable Unit Symbol
−1 0 +1
Flow rate mL·min−1 X1 0.4 0.5 0.6
Solvent A - - TCA TFA KH2PO4
Solvent B %v·v−1 X2 8 10 12
2.5. Data Interpretation and Statistical Analysis
Results of statistical factorial design experiments were computed using Statistica software version 7.0 (Micro- soft, Tulsa-Oklahoma, USA). Statistical models gener- ated were re-parameterized considering only statistically significant effects (p < 0.05). The influence of the three independent variables, were primarily based on the sta- tistical analysis of retention time (Y) as response-variable at (p < 0.05). Additionally, parameters such as number of efficient theoretical plates (Nef) [15] resolution between critical adjacent peaks (RS) and minimal usage of ace- tonitrile were also considered in optimizing the analytical conditions.
2.6. Sample Preparation and Clean-Up
For sample preparation, pulp weight of about 2 g was used. The SPE cartridges used for clean-up of samples were a Strata C18-E cartridge 500 mg-6 mL and a Strata NH2 cartridge 500 mg - 6 mL (PhenomenexTM, Torrance- California, USA). Two sets of samples were prepared. The first one, non-fortified sample—without any addition of phenolic acids, while the second set was fortified (ad- dition of 0.66 µg of each standard of phenolic acids be- fore elution). The cartridges were conditioned with 10 mL of methanol, followed by 10 mL of distilled water. Both sets of samples were directly loaded onto the car- tridges, washed and followed by elution. Both cartridges were eluted with 2 mL of 0.1 mol·L−1 of HCl, and then continuously eluted with 10 mL of methanol. Addition- ally, another sequence of solvents was used being 10 mL of methanol and 2 mL of acetone. These eluates were collected in a flask and then evaporated under vacuum in a rotary evaporator at 40˚C to dryness. Each dried extract of sample was re-suspended in 2 mL of methanol.
2.7. Identification and Quantification of Phenolic Acids
A volume of 2 µL of the extract prepared as described in item 2.6 was injected in UPLC System (item 2.3). The identification of phenolic acids in the samples was car- ried out by comparing their retention times and the spec- tra obtained from those of the standards injected at iden- tical analytical conditions. The quantification of all phe-
nolic acids was done based on the peak area of the com- pounds related to the calibration curves prepared from injecting the standard solutions.
2.8. Method Validation
2.8.1. Selectivity, Sensitivity and Linearity Linear least-squares regression was employed to calcu- late the slope, intercept and correlation coefficient. The calibration graphs were constructed by plotting each chromatographic peak area against its corresponding concentration. Selectivity was evaluated by comparing the chromatograms of sample extracts to those of stan- dards and possible interferences were investigated con- sidering shapes of peaks, retention time and absorption spectra. Additionally, blank chromatogram at selected wavelengths (254 nm for gallic, vanillic and protocate- chuic acid and 310 nm for chlorogenic, p-coumaric and ferulic acid), was used to confirm nonexistence of these compounds or any other interferences. The method sensi- tivity was determined by the angular coefficients (slope) of the calibration graphs for each phenolic acid. The linearity of the detector responses for the studied com- pounds was represented by the linear regression coeffi- cient (r2).
2.8.2. Limit of Detection (LOD) and Limit of Quantification (LOQ)
Peaks which produced signals between 3 and 10 times the amplitude of noise were selected and LOD calculated by using the equation: where, C is the amount of analyte which produced such signal; H is the height of the peak; and N is the amplitude of noise. The quantification limits (LOQ) were stated as the 3 times the limit of detection (LOQ = 3 × LOD) and these were also determined experimentally by using varying concentrations of phenolic acids [16].
1LOD 2 . .C H N
2.8.3. Recovery The extracts were spiked with known amounts of each standard in triplicate and analyzed. The recovery was determined as the quotient of the determined concentra- tion of phenolic acids (after chromatographic analysis) per concentration added of individual standards. Results were expressed in percentage.
3. Results and Discussion
The variables such as flow rate (X1) and the usage of solvent B (X2) were selected based on preliminary stud- ies, which indicated that flow rates higher than 0.6 mL·min−1 implied in lower resolution between all con- tiguous pairs of peaks (Rs < 1.3). On the other hand, flow rates lower than 0.4 mL·min−1 extended total retention time to more than 15 minutes which was an undesirable
Open Access JASMI
A Rapid Method for Determination of Some Phenolic Acids in Brazilian Tropical Fruits of Mangaba (Hancornia speciosa Gomes) and Umbu (Spondias tuberosa Arruda Camara) by UPLC
Open Access JASMI
4
feature in this work as it aimed for shorter retention times. Furthermore based on preliminary studies, concentrations of solvent B (acetonitrile) lower than 8% also extended total retention time to more than 15 minutes, and values higher than 12% decreased resolution to undesirable values (Rs < 1.3). The effect of independent variables (flow rate and percentage of solvent B) was evaluated by retention time data for all six phenolic acids at a signifi- cant level of p < 0.05 and statistical data analysis results are presented in Table 2.
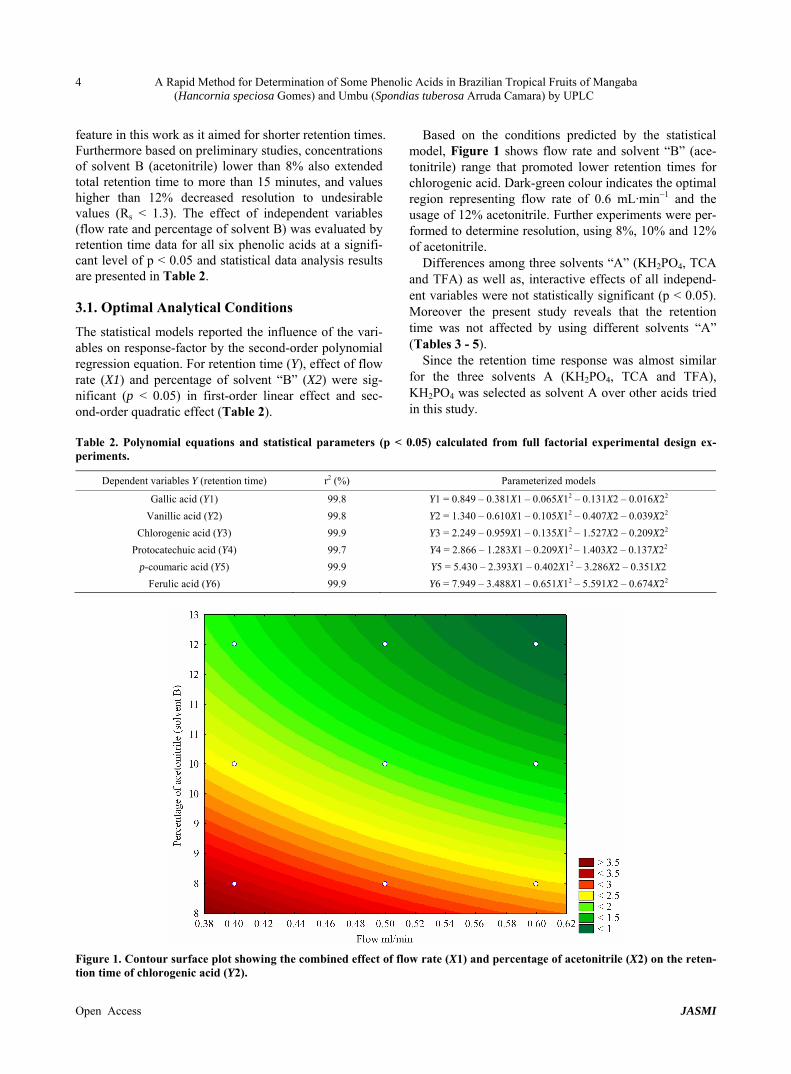
Based on the conditions predicted by the statistical model, Figure 1 shows flow rate and solvent “B” (ace- tonitrile) range that promoted lower retention times for chlorogenic acid. Dark-green colour indicates the optimal region representing flow rate of 0.6 mL·min−1 and the usage of 12% acetonitrile. Further experiments were per- formed to determine resolution, using 8%, 10% and 12% of acetonitrile.
Differences among three solvents “A” (KH2PO4, TCA and TFA) as well as, interactive effects of all independ- ent variables were not statistically significant (p < 0.05). Moreover the present study reveals that the retention time was not affected by using different solvents “A” (Tables 3 - 5).
3.1. Optimal Analytical Conditions
The statistical models reported the influence of the vari- ables on response-factor by the second-order polynomial regression equation. For retention time (Y), effect of flow rate (X1) and percentage of solvent “B” (X2) were sig- nificant (p < 0.05) in first-order linear effect and sec- ond-order quadratic effect (Table 2).
Since the retention time response was almost similar for the three solvents A (KH2PO4, TCA and TFA), KH2PO4 was selected as solvent A over other acids tried in this study.
Table 2. Polynomial equations and statistical parameters (p < 0.05) calculated from full factorial experimental design ex-periments.
Dependent variables Y (retention time) r2 (%) Parameterized models
Gallic acid (Y1) 99.8 Y1 = 0.849 – 0.381X1 – 0.065X12 – 0.131X2 – 0.016X22
Vanillic acid (Y2) 99.8 Y2 = 1.340 – 0.610X1 – 0.105X12 – 0.407X2 – 0.039X22
Chlorogenic acid (Y3) 99.9 Y3 = 2.249 – 0.959X1 – 0.135X12 – 1.527X2 – 0.209X22
Protocatechuic acid (Y4) 99.7 Y4 = 2.866 – 1.283X1 – 0.209X12 – 1.403X2 – 0.137X22
p-coumaric acid (Y5) 99.9 Y5 = 5.430 – 2.393X1 – 0.402X12 – 3.286X2 – 0.351X2
Ferulic acid (Y6) 99.9 Y6 = 7.949 – 3.488X1 – 0.651X12 – 5.591X2 – 0.674X22
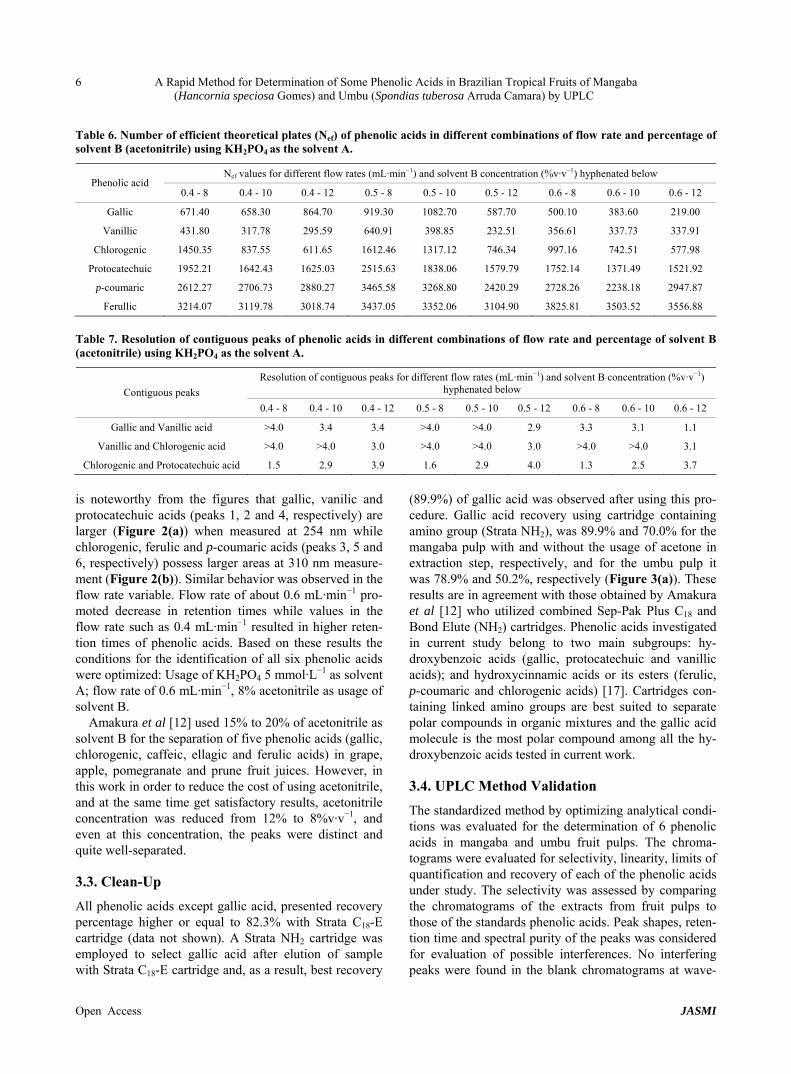
Figure 1. Contour surface plot showing the combined effect of flow rate (X1) and percentage of acetonitrile (X2) on the reten- tion time of chlorogenic acid (Y2).
A Rapid Method for Determination of Some Phenolic Acids in Brazilian Tropical Fruits of Mangaba (Hancornia speciosa Gomes) and Umbu (Spondias tuberosa Arruda Camara) by UPLC
5
Table 3. Retention time data of phenolic acids for three solvents “A” (KH2PO4, TCA and TFA) and solvent “B” (8% acetoni-trile) at different flow rates.
Retention time (min) Solvent A
Flow Rate (mL·min−1) Gallic Vanillic Chlorogenic Protocatechuic p-coumaric Ferulic
KH2PO4 0.4 0.377 1.146 3.150 3.654 7.986 12.505
TCA 0.4 0.365 1.108 2.784 3.511 7.644 11.893
TFA 0.4 0.373 1.121 2.883 3.525 7.693 12.024
KH2PO4 0.5 0.309 0.931 2.584 2.973 6.482 10.179
TCA 0.5 0.296 0.892 2.248 2.826 6.180 9.627
TFA 0.5 0.301 0.903 2.350 2.848 6.235 9.739
KH2PO4 0.6 0.260 0.781 2.177 2.500 5.521 9.096
TCA 0.6 0.253 0.754 1.910 2.389 5.221 8.175
TFA 0.6 0.256 0.761 1.989 2.404 5.252 8.207
Table 4. Retention time data of phenolic acids for three solvents “A” (KH2PO4, TCA and TFA) and solvent “B” (10% ace-tonitrile) at different flow rates.
Retention time (min) Solvent A
Flow Rate (mL·min−1) Gallic Vanillic Chlorogenic Protocatechuic p-coumaric Ferulic
KH2PO4 0.4 0.286 0.857 1.871 2.615 5.553 8.321
TCA 0.4 0.281 0.830 1.671 2.493 5.268 7.861
TFA 0.4 0.286 0.841 1.758 2.531 5.343 7.954
KH2PO4 0.5 0.231 0.696 1.615 2.172 4.541 6.800
TCA 0.5 0.226 0.670 1.361 2.020 4.278 6.368
TFA 0.5 0.232 0.681 1.437 2.047 4.325 6.442
KH2PO4 0.6 0.199 0.589 1.310 1.792 3.816 5.740
TCA 0.6 0.191 0.565 1.152 1.713 3.639 5.433
TFA 0.6 0.195 0.574 1.222 1.732 3.672 5.524
Table 5. Retention time data of phenolic acids for three solvents “A” (KH2PO4, TCA and TFA) and solvent “B” (12% ace-tonitrile) at different flow rates.
Retention time (min) Solvent A
Flow rate (mL·min−1) Gallic Vanillic Chlorogenic Protocatechuic p-coumaric Ferulic
KH2PO4 0.4 0.235 0.664 1.186 1.940 3.954 5.671
TCA 0.4 0.231 0.643 1.069 1.867 3.796 5.419
TFA 0.4 0.232 0.644 1.113 1.864 3.785 5.424
KH2PO4 0.5 0.190 0.537 0.963 1.568 3.199 4.604
TCA 0.5 0.187 0.521 0.872 1.509 3.063 4.385
TFA 0.5 0.188 0.522 0.904 1.509 3.066 4.397
KH2PO4 0.6 0.169 0.454 0.815 1.322 2.702 3.888
TCA 0.6 0.157 0.442 0.742 1.279 2.598 3.724
TFA 0.6 0.159 0.441 0.767 1.278 2.601 3.742
3.2. Usage of Lower Concentration of
Acetonitrile
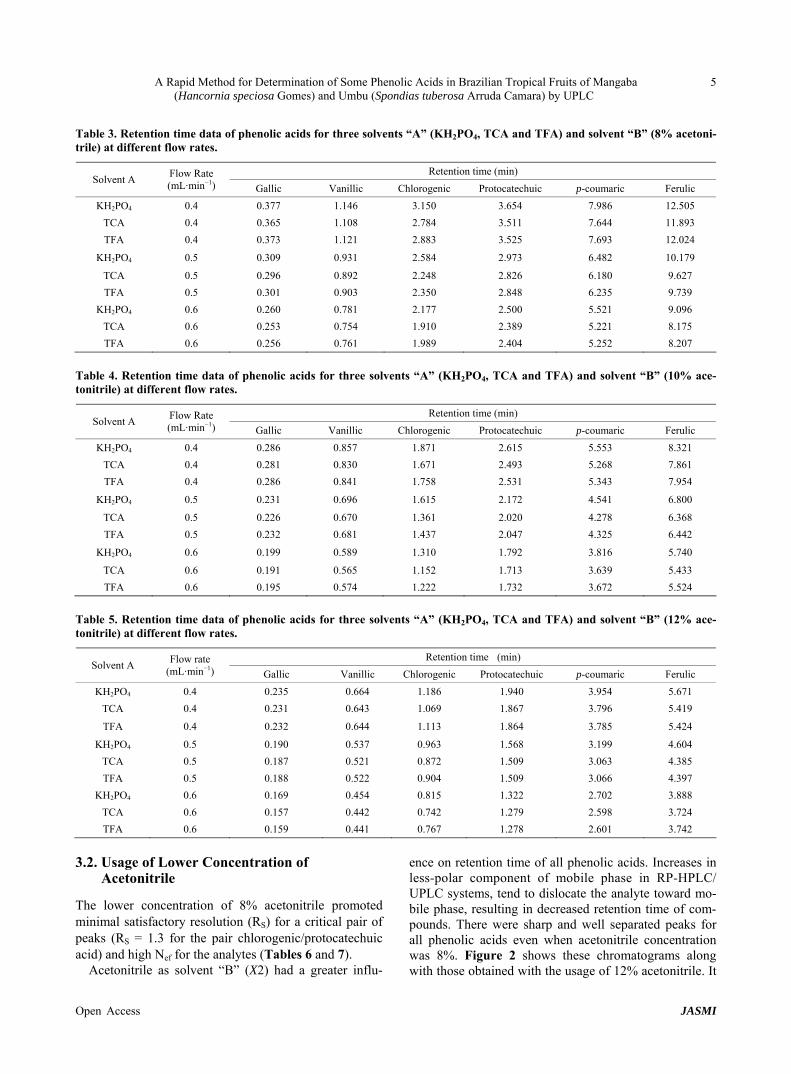
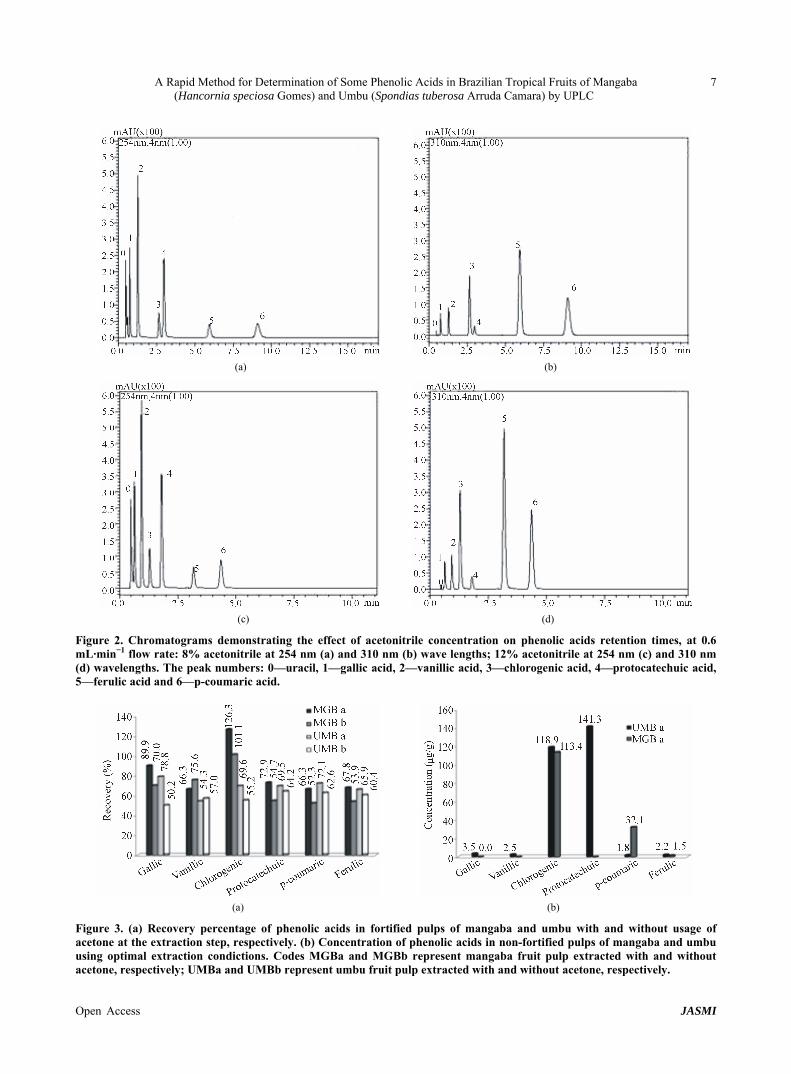
The lower concentration of 8% acetonitrile promoted minimal satisfactory resolution (RS) for a critical pair of peaks (RS = 1.3 for the pair chlorogenic/protocatechuic acid) and high Nef for the analytes (Tables 6 and 7).
Acetonitrile as solvent “B” (X2) had a greater influ-
ence on retention time of all phenolic acids. Increases in less-polar component of mobile phase in RP-HPLC/ UPLC systems, tend to dislocate the analyte toward mo- bile phase, resulting in decreased retention time of com- pounds. There were sharp and well separated peaks for all phenolic acids even when acetonitrile concentration was 8%. Figure 2 shows these chromatograms along with those obtained with the usage of 12% acetonitrile. It
Open Access JASMI
A Rapid Method for Determination of Some Phenolic Acids in Brazilian Tropical Fruits of Mangaba (Hancornia speciosa Gomes) and Umbu (Spondias tuberosa Arruda Camara) by UPLC
6
Table 6. Number of efficient theoretical plates (Nef) of phenolic acids in different combinations of flow rate and percentage of solvent B (acetonitrile) using KH2PO4 as the solvent A.
Nef values for different flow rates (mL·min−1) and solvent B concentration (%v·v−1) hyphenated below Phenolic acid
0.4 - 8 0.4 - 10 0.4 - 12 0.5 - 8 0.5 - 10 0.5 - 12 0.6 - 8 0.6 - 10 0.6 - 12
Gallic 671.40 658.30 864.70 919.30 1082.70 587.70 500.10 383.60 219.00
Vanillic 431.80 317.78 295.59 640.91 398.85 232.51 356.61 337.73 337.91
Chlorogenic 1450.35 837.55 611.65 1612.46 1317.12 746.34 997.16 742.51 577.98
Protocatechuic 1952.21 1642.43 1625.03 2515.63 1838.06 1579.79 1752.14 1371.49 1521.92
p-coumaric 2612.27 2706.73 2880.27 3465.58 3268.80 2420.29 2728.26 2238.18 2947.87
Ferullic 3214.07 3119.78 3018.74 3437.05 3352.06 3104.90 3825.81 3503.52 3556.88
Table 7. Resolution of contiguous peaks of phenolic acids in different combinations of flow rate and percentage of solvent B (acetonitrile) using KH2PO4 as the solvent A.
Resolution of contiguous peaks for different flow rates (mL·min−1) and solvent B concentration (%v·v−1) hyphenated below Contiguous peaks
0.4 - 8 0.4 - 10 0.4 - 12 0.5 - 8 0.5 - 10 0.5 - 12 0.6 - 8 0.6 - 10 0.6 - 12
Gallic and Vanillic acid >4.0 3.4 3.4 >4.0 >4.0 2.9 3.3 3.1 1.1
Vanillic and Chlorogenic acid >4.0 >4.0 3.0 >4.0 >4.0 3.0 >4.0 >4.0 3.1
Chlorogenic and Protocatechuic acid 1.5 2.9 3.9 1.6 2.9 4.0 1.3 2.5 3.7
is noteworthy from the figures that gallic, vanilic and protocatechuic acids (peaks 1, 2 and 4, respectively) are larger (Figure 2(a)) when measured at 254 nm while chlorogenic, ferulic and p-coumaric acids (peaks 3, 5 and 6, respectively) possess larger areas at 310 nm measure- ment (Figure 2(b)). Similar behavior was observed in the flow rate variable. Flow rate of about 0.6 mL·min−1 pro- moted decrease in retention times while values in the flow rate such as 0.4 mL·min−1 resulted in higher reten- tion times of phenolic acids. Based on these results the conditions for the identification of all six phenolic acids were optimized: Usage of KH2PO4 5 mmol·L−1 as solvent A; flow rate of 0.6 mL·min−1, 8% acetonitrile as usage of solvent B.
Amakura et al [12] used 15% to 20% of acetonitrile as solvent B for the separation of five phenolic acids (gallic, chlorogenic, caffeic, ellagic and ferulic acids) in grape, apple, pomegranate and prune fruit juices. However, in this work in order to reduce the cost of using acetonitrile, and at the same time get satisfactory results, acetonitrile concentration was reduced from 12% to 8%v·v−1, and even at this concentration, the peaks were distinct and quite well-separated.
3.3. Clean-Up
All phenolic acids except gallic acid, presented recovery percentage higher or equal to 82.3% with Strata C18-E cartridge (data not shown). A Strata NH2 cartridge was employed to select gallic acid after elution of sample with Strata C18-E cartridge and, as a result, best recovery
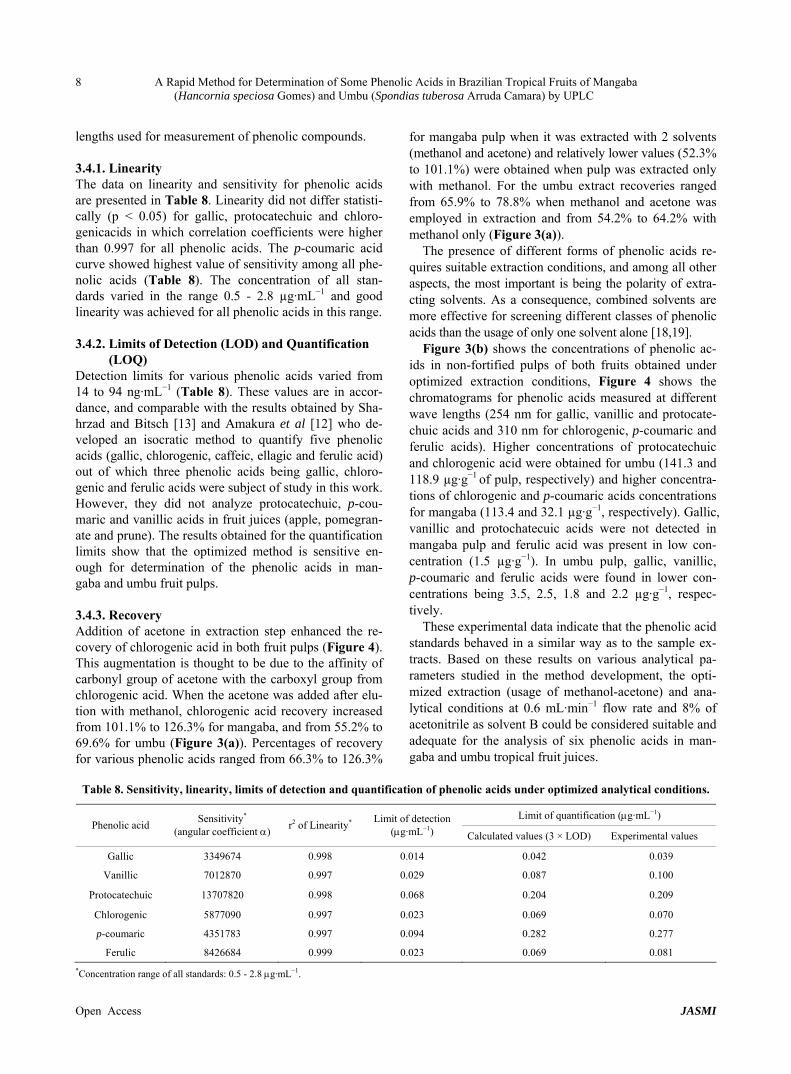
(89.9%) of gallic acid was observed after using this pro- cedure. Gallic acid recovery using cartridge containing amino group (Strata NH2), was 89.9% and 70.0% for the mangaba pulp with and without the usage of acetone in extraction step, respectively, and for the umbu pulp it was 78.9% and 50.2%, respectively (Figure 3(a)). These results are in agreement with those obtained by Amakura et al [12] who utilized combined Sep-Pak Plus C18 and Bond Elute (NH2) cartridges. Phenolic acids investigated in current study belong to two main subgroups: hy- droxybenzoic acids (gallic, protocatechuic and vanillic acids); and hydroxycinnamic acids or its esters (ferulic, p-coumaric and chlorogenic acids) [17]. Cartridges con- taining linked amino groups are best suited to separate polar compounds in organic mixtures and the gallic acid molecule is the most polar compound among all the hy- droxybenzoic acids tested in current work.
3.4. UPLC Method Validation
The standardized method by optimizing analytical condi- tions was evaluated for the determination of 6 phenolic acids in mangaba and umbu fruit pulps. The chroma- tograms were evaluated for selectivity, linearity, limits of quantification and recovery of each of the phenolic acids under study. The selectivity was assessed by comparing the chromatograms of the extracts from fruit pulps to those of the standards phenolic acids. Peak shapes, reten- tion time and spectral purity of the peaks was considered for evaluation of possible interferences. No interfering peaks were found in the bla k chromatograms at wave- n
Open Access JASMI
A Rapid Method for Determination of Some Phenolic Acids in Brazilian Tropical Fruits of Mangaba (Hancornia speciosa Gomes) and Umbu (Spondias tuberosa Arruda Camara) by UPLC
7
(a) (b)
(c) (d)
Figure 2. Chromatograms demonstrating the effect of acetonitrile concentration on phenolic acids retention times, at 0.6 mL·min−1 flow rate: 8% acetonitrile at 254 nm (a) and 310 nm (b) wave lengths; 12% acetonitrile at 254 nm (c) and 310 nm (d) wavelengths. The peak numbers: 0—uracil, 1—gallic acid, 2—vanillic acid, 3—chlorogenic acid, 4—protocatechuic acid, 5—ferulic acid and 6—p-coumaric acid.
(a) (b)
Figure 3. (a) Recovery percentage of phenolic acids in fortified pulps of mangaba and umbu with and without usage of acetone at the extraction step, respectively. (b) Concentration of phenolic acids in non-fortified pulps of mangaba and umbu using optimal extraction condictions. Codes MGBa and MGBb represent mangaba fruit pulp extracted with and without
cetone, respectively; UMBa and UMBb represent umbu fruit pulp extracted with and without acetone, respectively. a
Open Access JASMI
A Rapid Method for Determination of Some Phenolic Acids in Brazilian Tropical Fruits of Mangaba (Hancornia speciosa Gomes) and Umbu (Spondias tuberosa Arruda Camara) by UPLC
8
lengths used for measurement of phenolic compounds.
3.4.1. Linearity The data on linearity and sensitivity for phenolic acids are presented in Table 8. Linearity did not differ statisti- cally (p < 0.05) for gallic, protocatechuic and chloro- genicacids in which correlation coefficients were higher than 0.997 for all phenolic acids. The p-coumaric acid curve showed highest value of sensitivity among all phe- nolic acids (Table 8). The concentration of all stan- dards varied in the range 0.5 - 2.8 µg·mL−1 and good linearity was achieved for all phenolic acids in this range.
3.4.2. Limits of Detection (LOD) and Quantification (LOQ)
Detection limits for various phenolic acids varied from 14 to 94 ng·mL−1 (Table 8). These values are in accor- dance, and comparable with the results obtained by Sha- hrzad and Bitsch [13] and Amakura et al [12] who de- veloped an isocratic method to quantify five phenolic acids (gallic, chlorogenic, caffeic, ellagic and ferulic acid) out of which three phenolic acids being gallic, chloro- genic and ferulic acids were subject of study in this work. However, they did not analyze protocatechuic, p-cou- maric and vanillic acids in fruit juices (apple, pomegran- ate and prune). The results obtained for the quantification limits show that the optimized method is sensitive en- ough for determination of the phenolic acids in man- gaba and umbu fruit pulps.
3.4.3. Recovery Addition of acetone in extraction step enhanced the re- covery of chlorogenic acid in both fruit pulps (Figure 4). This augmentation is thought to be due to the affinity of carbonyl group of acetone with the carboxyl group from chlorogenic acid. When the acetone was added after elu- tion with methanol, chlorogenic acid recovery increased from 101.1% to 126.3% for mangaba, and from 55.2% to 69.6% for umbu (Figure 3(a)). Percentages of recovery for various phenolic acids ranged from 66.3% to 126.3%
for mangaba pulp when it was extracted with 2 solvents (methanol and acetone) and relatively lower values (52.3% to 101.1%) were obtained when pulp was extracted only with methanol. For the umbu extract recoveries ranged from 65.9% to 78.8% when methanol and acetone was employed in extraction and from 54.2% to 64.2% with methanol only (Figure 3(a)).
The presence of different forms of phenolic acids re- quires suitable extraction conditions, and among all other aspects, the most important is being the polarity of extra- cting solvents. As a consequence, combined solvents are more effective for screening different classes of phenolic acids than the usage of only one solvent alone [18,19].
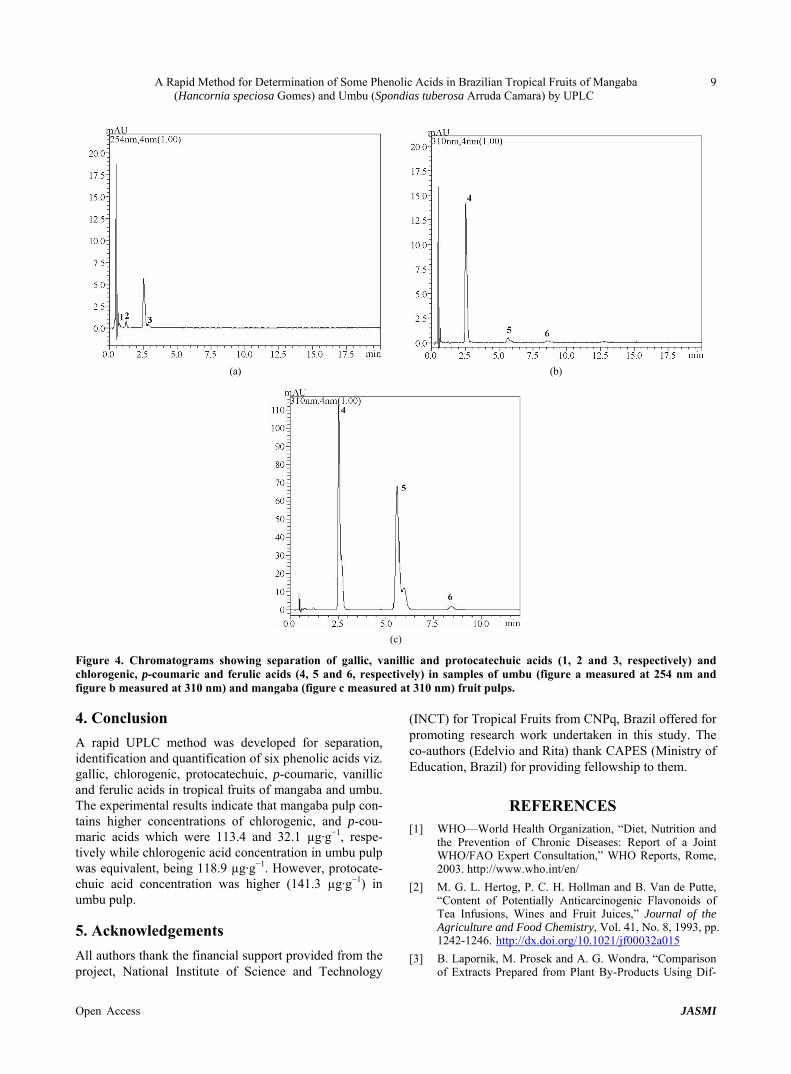
Figure 3(b) shows the concentrations of phenolic ac- ids in non-fortified pulps of both fruits obtained under optimized extraction conditions, Figure 4 shows the chromatograms for phenolic acids measured at different wave lengths (254 nm for gallic, vanillic and protocate- chuic acids and 310 nm for chlorogenic, p-coumaric and ferulic acids). Higher concentrations of protocatechuic and chlorogenic acid were obtained for umbu (141.3 and 118.9 µg·g−1 of pulp, respectively) and higher concentra- tions of chlorogenic and p-coumaric acids concentrations for mangaba (113.4 and 32.1 µg·g−1, respectively). Gallic, vanillic and protochatecuic acids were not detected in mangaba pulp and ferulic acid was present in low con- centration (1.5 µg·g−1). In umbu pulp, gallic, vanillic, p-coumaric and ferulic acids were found in lower con- centrations being 3.5, 2.5, 1.8 and 2.2 µg·g−1, respec- tively.
These experimental data indicate that the phenolic acid standards behaved in a similar way as to the sample ex- tracts. Based on these results on various analytical pa- rameters studied in the method development, the opti- mized extraction (usage of methanol-acetone) and ana- lytical conditions at 0.6 mL·min−1 flow rate and 8% of acetonitrile as solvent B could be considered suitable and adequate for the analysis of six phenolic acids in man- gaba and umbu tropical fruit juices.
Table 8. Sensitivity, linearity, limits of detection and quantification of phenolic acids under optimized analytical conditions.
Limit of quantification (g·mL−1) Phenolic acid
Sensitivity* (angular coefficient )
r2 of Linearity* Limit of detection (g·mL−1) Calculated values (3 × LOD) Experimental values
Gallic 3349674 0.998 0.014 0.042 0.039
Vanillic 7012870 0.997 0.029 0.087 0.100
Protocatechuic 13707820 0.998 0.068 0.204 0.209
Chlorogenic 5877090 0.997 0.023 0.069 0.070
p-coumaric 4351783 0.997 0.094 0.282 0.277
Ferulic 8426684 0.999 0.023 0.069 0.081
*Concentration range of all standards: 0.5 - 2.8 g·mL−1.
Open Access JASMI
A Rapid Method for Determination of Some Phenolic Acids in Brazilian Tropical Fruits of Mangaba (Hancornia speciosa Gomes) and Umbu (Spondias tuberosa Arruda Camara) by UPLC
9
(a) (b)
(c)
Figure 4. Chromatograms showing separation of gallic, vanillic and protocatechuic acids (1, 2 and 3, respectively) and chlorogenic, p-coumaric and ferulic acids (4, 5 and 6, respectively) in samples of umbu (figure a measured at 254 nm and figure b measured at 310 nm) and mangaba (figure c measured at 310 nm) fruit pulps.
4. Conclusion
A rapid UPLC method was developed for separation, identification and quantification of six phenolic acids viz. gallic, chlorogenic, protocatechuic, p-coumaric, vanillic and ferulic acids in tropical fruits of mangaba and umbu. The experimental results indicate that mangaba pulp con- tains higher concentrations of chlorogenic, and p-cou- maric acids which were 113.4 and 32.1 µg·g−1, respe- tively while chlorogenic acid concentration in umbu pulp was equivalent, being 118.9 µg·g−1. However, protocate- chuic acid concentration was higher (141.3 µg·g−1) in umbu pulp.
5. Acknowledgements
All authors thank the financial support provided from the project, National Institute of Science and Technology
(INCT) for Tropical Fruits from CNPq, Brazil offered for promoting research work undertaken in this study. The co-authors (Edelvio and Rita) thank CAPES (Ministry of Education, Brazil) for providing fellowship to them.
REFERENCES [1] WHO—World Health Organization, “Diet, Nutrition and
the Prevention of Chronic Diseases: Report of a Joint WHO/FAO Expert Consultation,” WHO Reports, Rome, 2003. http://www.who.int/en/
[2] M. G. L. Hertog, P. C. H. Hollman and B. Van de Putte, “Content of Potentially Anticarcinogenic Flavonoids of Tea Infusions, Wines and Fruit Juices,” Journal of the Agriculture and Food Chemistry, Vol. 41, No. 8, 1993, pp. 1242-1246. http://dx.doi.org/10.1021/jf00032a015
[3] B. Lapornik, M. Prosek and A. G. Wondra, “Comparison of Extracts Prepared from Plant By-Products Using Dif-
Open Access JASMI
A Rapid Method for Determination of Some Phenolic Acids in Brazilian Tropical Fruits of Mangaba (Hancornia speciosa Gomes) and Umbu (Spondias tuberosa Arruda Camara) by UPLC
10
ferent Solvents and Extraction Time,” Journal of Food Engineering, Vol. 71, No. 2, 2005, pp. 214-222. http://dx.doi.org/10.1016/j.jfoodeng.2004.10.036
[4] T. Y. Chu, C. H. Chang, Y. C. Liao and Y. C. Chen, “Mi- crowave-accelerated Derivatization Processes for the De- termination of Phenolic Acids by Gas Chromatography- Mass Spectrometry,” Talanta, Vol. 54, No. 6, 2001, pp. 1163-1171. http://dx.doi.org/10.1016/S0039-9140(01)00392-7
[5] M. Nardini and A. Ghisell, “Determination of Free and Bound Phenolic Acids in Beer,” Food Chemistry, Vol. 84, No. 1, 2004, pp. 137-143. http://dx.doi.org/10.1016/S0308-8146(03)00257-7
[6] R. J. Robbins and S. R. Bean, “Development of a Quanti- tative High-Performance Liquid Chromatography-Photo- diode Array Detection Measurement System for Phenolic Acids,” Journal of Chromatography A, Vol. 1038, No. 1-2, 2004, pp. 97-105. http://dx.doi.org/10.1016/j.chroma.2004.03.009
[7] R. Tsao and R. Yang, “Optimization of a New Mobile Phase to Know the Complex and Real Polyphenolic Com- position: Towards a Total Phenolic Index Using High- Performance Liquid Chromatography,” Journal of Chro- matography A, Vol. 1018, No. 1, 2003, pp. 29-40. http://dx.doi.org/10.1016/j.chroma.2003.08.034
[8] R. J. Robbins, “Phenolic Acids in Foods: An Overview of Analytical Methodology,” Journal of the Agriculture and Food Chemistry, Vol. 51, No. 10, 2003, pp. 2866-2887. http://dx.doi.org/10.1021/jf026182t
[9] H. S. Lee, “HPLC Analysis of Phenolic Compounds,” In: L. M. L. Nollet, Ed., Food Analysis by HPLC, 2nd Edi-tion, Marcel Dekker, Inc., New York, 2000.
[10] H. M. Merken and G. R. Beecher, “Measurement of Food Flavonoids by High Performance Liquid Chromatography: A Review,” Journal of the Agriculture and Food Che- mistry, Vol. 48, No. 3, 2000, pp. 577-599. http://dx.doi.org/10.1021/jf990872o
[11] J. G. Bordonaba, P. Crespo and L. A. Terry, “A New Acetonitrile-Free Mobile Phase for HPLC-DAD Deter- mination of Individual Anthocyanins in Blackcurrant and Strawberry Fruits: A Comparison and Validation Study,” Food Chemistry, Vol. 129, No. 3, 2011, pp. 1265-1273.
http://dx.doi.org/10.1016/j.foodchem.2010.09.114
[12] Y. Amakura, M. Okada, S. Tsuji and Y. Tonogai, “De- termination of Phenolic Acids in Fruit Juices by Isocratic Column Liquid Chromatography,” Journal of Chroma- tography A, Vol. 891, No. 1, 2000, pp. 183-188. http://dx.doi.org/10.1016/S0021-9673(00)00625-7
[13] S. Shahrzad and I. Bitsch, “Determination of Some Phar- macologically Active Phenolic Acids in Juices by High- Performance Liquid Chromatography,” Journal of Chro- matography A, Vol. 741, No. 2, 1996, pp. 223-231. http://dx.doi.org/10.1016/0021-9673(96)00169-0
[14] J. Gruz, O. Novak and M. Strnad, “Rapid Analysis of Phenolic Acids in Beverages by UPLC-MS/MS,” Food Chemistry, Vol. 111, No. 3, 2008, pp. 789-794. http://dx.doi.org/10.1016/j.foodchem.2008.05.014
[15] A. J. P. Martin and R. L. M. Synge, “A New Form of Chro- matogram Employing Two Liquid Phases,” Biochemical Journal, Vol. 35, No. 12, 1941, pp. 1358-1368.
[16] S. M. Muñoz, M. Montserrat, B. Olga and J. Guasch, “Determination of Some Flavan-3-ols and Anthocyanins in Red Grape Seed and Skin Extracts by HPLC-DAD: Validation Study and Response Comparison of Different Standards,” Analytical Chimica Acta, Vol. 628, No. 1, 2008, pp. 104-110. http://dx.doi.org/10.1016/j.aca.2008.08.045
[17] L. Bravo, “Polyphenols: Chemistry, Dietary Sources, Me- tabolism and Nutritional Significance,” Nutrition Review, Vol. 56, No. 11, 1998, pp. 317-333. http://dx.doi.org/10.1111/j.1753-4887.1998.tb01670.x
[18] M. Markom, M. Hasan, R. W. D. Wan, H. Singh and J. M. Jahim, “Extraction of Hydrostable Tannins from Phyllan- thus niruri Linn.: Effect of Solvents and Extraction Me- thods,” Separation and Purification Technology, Vol. 52, No. 3, 2007, pp. 487-496. http://dx.doi.org/10.1016/j.seppur.2006.06.003
[19] K. A. Ross, T. Beta and S. D. Arntfield, “A Comparative Study on the Phenolic Acids Identified and Quantified in Dry Beans Using HPLC as Affected by Different Extrac- tion and Hydrolysis Methods,” Food Chemistry, Vol. 113, No. 1, 2009, pp. 336-344. http://dx.doi.org/10.1016/j.foodchem.2008.07.064
Open Access JASMI