Embed Size (px)
Citation preview

American Mineralogist, Volume 69, pages 645459, 1984
A Raman spectroscopic study of glasses inthe system CaO-MgG-SiO2
Peul McMILLAN
Department of ChemistryArizona Stile rJniversity, Tempe, Arizona 85287
Abstract
The Raman spectra of a number of glasses in the system CaO-MgO-SiO2 have beenprepared using solar furnace techniques. The spectra of glasses along the SiO2-CaO' SiO2-MgO and SiOz-Cao sMgo sO joins are similar to those obtained in other studies, and areinterpreted in terms of vibrations of tetrahedral silicate units with zero, one, two, three andfour non-bridging oxygens, consistent with previous discussions. Some glasses wereprepared with bulk compositions within the CaO-MgO-SiO2 two-liquid field, using both a"normal" and afast quench rate. The normal-quenched glasses were opaque and unmixed,the fast-quenched samples transparent and homogeneous. Both sets of samples hadidentical spectra, and the implications of this are discussed. Finally, a number of sampleswith varying CalMg ratio at constant high silica content were studied. Their Raman spectraare discussed along with results ofprevious studies on alkali and alkaline earth silicate glass
systems to develop a molecular site model which describes the effect of changing metalcation on the distribution of silicate species.
Introduction
A considerable number of studies have used Ramanspectroscopy to investigate the structures of silicateglasses and melts, many of which have been applied tounderstanding properties important in geological process-es. In the present study, a number of glasses wereprepared in the system CaO-MgO-SiO2 using solar fur-nace melting and fast quench techniques. There havebeen several previous studies on glasses and melts in thissystem (e.g., Etchepare, 1970a, 1972; Konijendijk, 1975;Brawer and White, 1977; Sharma etal.,1979; Sharma andYoder, 1979; Virgo et al., 1980; Kashio et al., 1980;Mysen et al., 1980a,b, l982a,b; Mysen and Virgo, 1980;Tsunawaki et al.. l98ll McMillan et al.. l98l: McMillanand Piriou, 1983; Piriou and McMillan, l983a,b) whoseresults are compared with the present observations. Fi-nally, a number of samples with bulk compositions withinthe two-liquid field of the liquidus CaO-MgO-SiO2 phasediagram were prepared by quenching from the liquid atdifferent quench rates. The Raman spectra of theseglasses give some insight into the nature of unmixing inthis system, and lead to a discussion of the r6le of metalcations in determining the structures of these and othersilicate glasses and melts.
Experimental procedure
Sample preparation and characlerization
Glass samples for this study were prepared from reagent-grad "
Raman spectroscopy
oxide mixes or gels by solar melting at the French solar furnace All transparent NQ samples were polished for polarized 90'
facility (CNRS Odeillo). Temperatures at the sample could not Raman scattering, while opaque glasses were run by glancing
be controlled or accurately measured, but were estimated at
2000-2500'C. Normal quenching (NQ) was achieved by simplyremoving the sample from the beam and allowing to cool in air,
to give a quench rate of around 103'C/s. Super-quenched (SQ)
samples were obtained by splat quenching on the water-cooled
sample stage. The quench rate by this method is of the order of105-106"C/s. Melting was ascertained by visual observation ofthesamples during heating, and by optical, Raman and X-ray study
of the quenched products. Further details of this preparation
method are discussed in Coutures et al., (1978), McMillan (1981)'
and McMil lan et al. t1982).Samples were analyzed using a Cameca MS-46 electron
microprobe with a 15 kV accelerating voltage and near 25 nA
beam current for a2 trrm spot size. Data were reduced using theprogram nnevr (Heinrich, 1972). Twenty to thirty point countswere obtained for each sample, and a relative homogeneity index
H was calculated following similar reasoning to Boyd and Finger(1975) (see McMillan et al., 1982). Values of H near unity
indicate that the sample is homogeneous in that oxide
component. Most glass samples in this study were found to behomogeneous, and Raman spectra obtained from different parts
of a given sample were identical. Some samples with
compositions within the CaO-MgO-SiO2 miscibility gap (Levin
et al., 1964, p. 2 I I ; Fig. 1) were found to be inhomogeneous, andwere analyzed by X-ray fluorescence using a Philips PW l4l0vacuum spectrometer and the low-dilution disc method ofThomas and Haukka (1978). Some such samples showeddifferences in Raman spectra between parts of the same sample'as discussed in the text. Analytical results are reported in Tablel, and sample compositions studied are shown in Figure l.
0003-004x/84/0708-0645$02. 00 &5

646 McMILLAN: GZASSES IN THE SYSTEM CaO-MgO-SiO2
Table 1. Glass compositions studied in the CaO-MgO-SiO,system.
( a ) T h e S i 0 2 - C a M S S i 0 q j o i n ( F i g u r e s 3 , 4 ) .
Sanpl e % o x i d e nethod{a) homogeneity(b)
r ( c ) x ( o ) c a o l { g o s i o 2
Table l. (cont.)
si 02Itlg0
nethod honogeneity
t I Cao l lg0 Si02
I sQ( e , 33 .2
2 sQ 34.5
z s Q 3 5 . 9 / . \0 . 6 \ , 1
2 Sq 37 .4
3 NQ 33.50 . 9
3 N Q 3 4 . 6
4 N Q 3 2 . 00 . 7
4 N Q 3 3 , 1
5 N Q 3 1 . 30 , 8
5 NQ 30,7
6 N Q 2 9 , 50 . 5
6 N Q 3 1 , 1
7 N Q 2 7 . 9r . 4
7 NQ 28,8
8 N Q 2 1 . 80 . 4
8 N Q 2 a . 2
9 N Q 2 6 . 00 . 8
9 N Q 2 5 . 3
10 sQ 2 l ,80 . 6
1 0 N Q 2 2 . 1
si 02N Q
32.4
3 1 . 8
27 .80 . 7
27 .4
25.40 . 7
24 ,1
2 3 . 30 . 7
24 .2
22 .70 . 8
2 2 . 40 . 7
2 2 . 4
21.2
2 0 . 20 . 5
20.4
1 8 . 0
1 9 . 3
2 0 . 50 . 421 .8
34,3 I00 .0
33.7 100.0
36.2 101 ,40 . 6 , I . 8
3 5 . 2 ( 9 1 1 0 0 . 0
4 L 1 9 9 . 40 . 9 0 . 9
40 .8 100.0
44 .1 100.00 . 7 2 . 4
42.7 100.0
45.9 99 .50 , 8 1 . 346.2 100.0
48.1 100.80 . 7 l . t
46 .5 100.0
5 I .0 101 . lI .5 3 .8
49 .9 100.0
52 .0 98 .90 . 4 1 . 3
51 .4 100.0
5 6 . 0 9 9 . 61 . 8 2 . 0
55 .4 100.0
57,6 99 .40 . 5 r . 8
56.1 100.0
100.0 100.0
X R F
SEM
E M P
AA
E M P
E M P
E},I P
AA
E[IP
M
E M P
M
E M P
EI.IP
E M P
( h )
I
2
I
2
angle reflection. The SQ glasses were generally too small andfriable for mounting and polishing, and unpolarized or partially-polarized spectra were obtained from unpolished samples. Mostspectra were obtained at CNRS Bellevue (France) using aSpectra-Physics 165 Ar* laser and Coderg pHO doublemonochromator. A number of spectra for samples of poor opticalquality were run at ENSTA, Palaiseau with a Coherent Ar+ laserand Coderg T800 triplet monoclromator. Glass spectra wereobtained using the 4800 or 5145 A lines of the argon lasers, with500-1000 mW power at the sample, and resolving slits of near 4cm t. The room-temperature spectra reported here were notreduced to remove effects of thermal populat ion (e.g.,Leadbetter and Stringfellow , 1974; Piriou and Alain, t979). Thisprocedure removes the pseudo-band near 50-100 cm t andreduces the relative intensity below around 600 cm-t (Hass,1969; Shuker and Gammon, 1970), but does not substantiallychange the band contours discussed here.
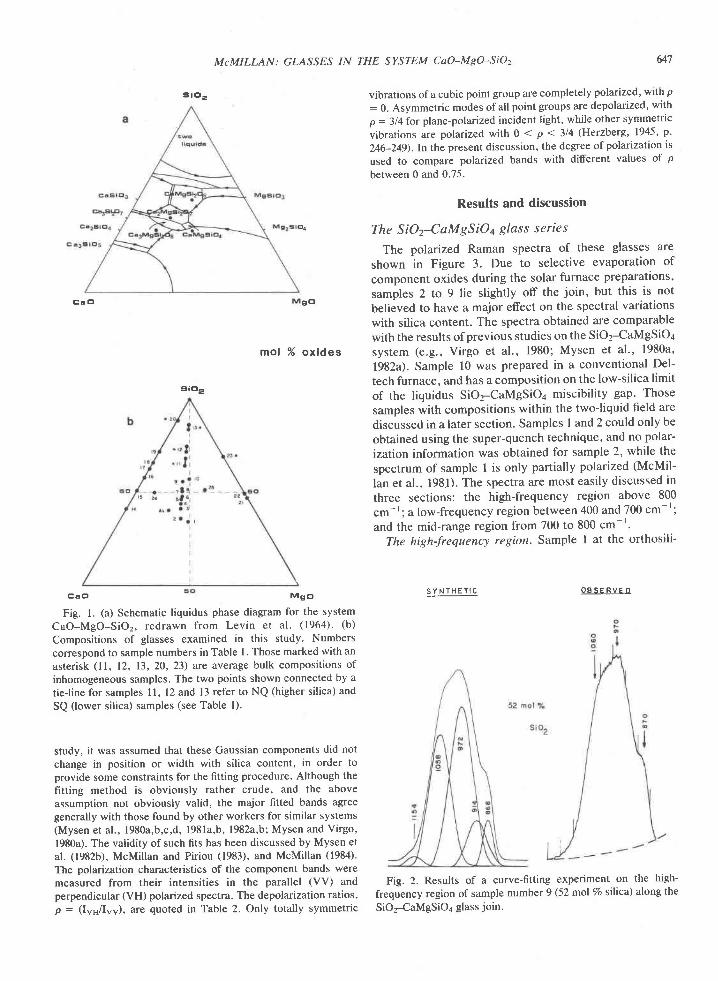
Unresolved bands were decomposed using a curve-fittingtechnique with a DuPont 310 curve-resolver as describedpreviously (McMillan et al., 1982). Results of curve-fittingexperiments for glasses along the SiO2-CaMgSiOa join areshown in Figure 4 and Table 2, and are discussed below. Themethod followed is illustrated in Figure 2 for sample 9 with 52lnole Vo SiO2. The component bands fitted at 1058, 972 and 868cm-r correspond to the obvious features in the experimentalspectrum indicated by arrows. The intensities of these bandswere optimized to reproduce the high- and low-frequency sidesof the observed band contour, while the 914 and ll54 cm I
components were introduced to complete the fit. In the present
( b ) T h e c a l q s i 0 q - S i 0 2 m i s c i b i l i t y g a p ( F i g u r e 7 ) .
s i 0 2 s Q 9 9 . 8 9 8 . 7 E M P 2 20 . 7 t . 1 . .
1 1 N Q 2 0 . 7 1 4 . 6 6 4 . 6 9 6 . 2 ( J ) E M p4
I . 5 1 . 6 2 . 9 1 . 0 , , .1 1 N 0 2 0 . 8 1 5 . 2 6 4 . 0 l 0 4 . 0 t K l
si02
2 2 2
XRF
1 2 ( 1 ) N Q 2 2 . 3 1 4 . 4 6 3 . 3( m ) 3 . 4 2 . 4 4 . 5
1 2 ( 2 ) N Q 4 . 7 2 . 0 9 2 . 55 . 5 5 . 5 9 . 3
l 2 l i Q 1 4 . 5 1 1 , 3 1 4 . 2
1 3 N Q 7 . 0 4 . 4 8 8 . 54 . 9 3 . 2 8 . 1
1 3 N Q 8 , 9 7 . 5 8 3 . 5
u s Q 1 7 . 9 1 3 . 8 6 a , 21 . 5 1 , 6 2 . 9
1 2 S Q 1 5 . 9 t 2 . 1 7 1 , 93 , 2 2 . 9 6 , 0
1 3 S Q 1 , 6 6 . 1 8 6 , 30 , 8 0 . 7 t . ?
( c ) T h e S i 0 2 - C a o j o i n ( F i g u r e 8 )
14 sQ 59.2 - 40.80 . 8 - 0 . 8
1 5 S Q 4 9 . 1 - 5 0 . 90 . 5 - 0 . 5
1 6 N Q 4 2 . 2 - 5 7 . 80 . 7 - 0 . 1
t7 NQ 37 .8 - 62,20 . 7 - 0 . 7
1 8 N Q 3 4 . 6 - 6 5 . 31 . 8 - 1 . 8
1 9 N Q 2 8 . 2 - 7 1 . 83 . 5 - 3 . 5
20 NQ t5.2 - 84.81 . 1 - 7 . 7
2 0 N Q t r . z - 8 8 . 8
9 5 . 3 E M P t 2
9 3 , 8 E M P 1 18 . 9
1 0 7 . 5 X R F
9 3 . 4 E M P 2 3
1 0 8 . 2 X R F
99.6 Er '4P 271 f
100,4 t i rP 261 . 0
9 9 . 8 E H P 2 21 . 2
1 0 0 . 7 E I P 2 41 . 4
I O O . 9 E M P 2 T1 . 0
100.5 El lP 21
9 8 . 7 E M P 1 11 . 4
99.9 Ei lP 191 . 1
98,4 Et lP 18I . 8
97.0 El,{P 233 . 9
1 0 2 . 6 X R F
5
t 7
l3
2
6
2
I
I
I
2
2
t4
5 6
29 I0
1 1
3
6
2
Table l. (cont.)
Sample l o x method honoqeneity
[ # Cao l'lg0 Si02si 021490
(d ) The S i02- i l90 jo in (F igure 8)
21 SQ - 53 .0 47 .0 100.0
22 SQ - 51 .0 49 .0 101 .1- 1 . 5 I . 5 1 . 8
23 SQ - 29 .4 70 . I 100.0- 0 . 6 0 . 6 1 . 5
23 NQ - 30 .3 69 .6 93 .6- 2 7 t
2 3 N Q - 3 0 . 9 6 9 . 1 9 9 . 6
( e ) H i g h - s i 1 i c a s a m p l e s ( F i g u . e 9 ) .
1 9 N Q 2 8 . 2 - 7 \ . A 9 8 . 43 . 5 - 3 . 5 I . 8
1 1 5 0 1 1 , 9 1 3 . 8 6 a . 2 9 9 . 61 . 5 1 . 6 2 . 9 t . 7
1 2 S Q 1 5 . 9 1 2 . 1 7 1 . 9 1 0 0 . 43 . 2 2 . 9 6 . 0 I . 0
2 3 S 0 - 2 9 . 8 7 0 . 1 1 0 0 . 0- 0 . 6 0 . 6 1 . 5
EMP 29
ErlP 19
Ei4P 23
EMP 19
X R F
1
I
I
5
2
2
l
4
Et4P 18
El.t P 27
Er'tP 26
EMP 23
Notes: (a) Analysis nethod: XRF - X-ray f luorescence, El ' lP-eletronn i c r o p r o b e , A A - a t o m i c a b s o r p t i o n a n a l y s i s i n t h e U n i v e r s i t 6 d eP a r i s V I , S E l F e n e r g y - d i s p e r s i v e s c a n n i n g e l e c t r o n n i c r o g c o p y .
(b) Hmogeneity index (see sect ion on Experinental Techniques).(c) Sum of weight per cent oxides for EIP and XRF.( d ) N u n b e r o f p o i n t s i n E M P t r a v e r s e .( e ) S Q - s u p e r q u e n c h ; N Q - n o r m a l q u e n c h ( s e e t e x t ) .( f ) T w o s t a n d a r d d e v i a t i o n s ( 2 o ) f o r E l l P a n a l y s e s .( 9 ) S i 0 2 b y d i f f e r e n c e .( h ) H i g h - p u . i t y s i l i c a s a m p l e s f r o m E l e c t r o - Q t a . t z C o . , F r a n c e .
( T e t r a s i l S E : < 1 0 p p n 1 1 2 0 , < t p p n j m p u r i t i e s ) .( j ) P o o r E l t P t o t a l s d u e t o d i f f e r e n t i a l p o l i s h o n s u r f a c e o f u n n i x e d
sanpl es.(k) Foor XRF totals due to standard curve used (Problf ls in naking
d i s c s w j t h h i g h C a o , t h o c o n t e n t s ) .( n ) S a m p l e l 2 - N 0 a n a l y z e d a s t w o c m p o s i t i o n p o p u l a t i o n s ( 1 ) a n d ( ? ) .
4 - 4
2 3 4
- 1 1
s t o e
McMILLAN: GLASSES IN THE SYSTEM CaO-MeO-SiOz
mol %
vibrations of a cubic point group are completely polarized, with p: 0. Asymmetric modes of all point groups are depolarized' with
p = 3l4fot plane-polarized incident light, while other symmetrtc
vibrations are polarized with 0 < p < 314 (Herzberg, 1945' p'
246-249). In the present discussion, the degree of polarization is
used to compare polarized bands with different values of p
between 0 and 0.75.
Results and discussion
" The SiOT-CaMgSiOa glass series
The polarized Raman spectra of these glasses are
shown in Figure 3. Due to selective evaporation of
component oxides during the solar furnace preparations,
samples 2 to 9 lie slightly off the join, but this is noteo believed to have a major efect on the spectral variations
with silica content. The spectra obtained are comparablewith the results of previous studies on the SiO2-CaMgSiOa
oxides system (e.g., Virgo et al., 1980; Mysen et al ' ' 1980a'
1982a). Sample l0 was prepared in a conventional Del-
tech furnace, and has a composition on the low-silica limit
of the liquidus SiO2-CaMgSiOa miscibility gap' Those
samples with compositions within the two-liquid field are
discussed in a later section. Samples I and2 could only be
obtained using the super-quench technique, and no polar-
ization information was obtained for sample 2, while the
spectrum of sample I is only partially polarized (McMil-
lan et al., l98l). The spectra are most easily discussed in
three sections: the high-frequency region above 800
cm-l; a low-frequency region between 400 and 700 cm-';
and the mid-range region from 700 to 800 cm-''The high-frequency region Sample I at the orthosili-
M g C t S Y N T H E T I C O B S E R V E D
u7
C a c l
C a O
Fig. l. (a) Schematic liquidus phase diagram for the systemCaO-MgO-SiO2, redrawn from Levin et al. (1964). (b)
Compositions of glasses examined in this study' Numberscorrespond to sample numbers in Table l Those marked with anasterisk (ll, 12, 11, 20, 2l) are average bulk compositions ofinhomogeneous samples. The two points shown connected by a
tieline for samples 11, 12 and l3 refer to NQ (higher silica) and
SQ (lower silica) samples (see Table l).
study, it was assumed that these Gaussian components did notchange in position or width with silica content, in order toprovide some constraints for the fitting procedure. Although thefitting method ls obviously rather crude, and the aboveassumption not obviously valid, the major fitted bands agreegenerally with those found by other workers for similar systems(Mysen et al. , l980a,b,c,d, l98la,b, l982a,b; Mysen and Virgo,1980a). The validity of such fits has been discussed by Mysen etal. (1982b), McMillan and Piriou (1983), and McMillan (1984).
The polarization characteristics of the component bands weremeasured from their intensities in the parallel (VV) andperpendicular (VH) polarized spectra. The depolarization ratios,p : (Iyg/Iyy), are quoted in Table 2. Only totally symmetric
Fig. 2. Results of a curve-fitting experiment on the high-
frequency region of sample number 9 (52 mol Vo sllica) along the
SiOrCaMgSiOa glass join.
sroe

a a6 > E < Fq p F > pP O o O - c A 6
McMILLAN: GZASSES IN THE SYSTEM CaO-MpO-SiO,
o ^ o o ^N T + N @
- l> l + @ € @ €
I @ + @ 6 6o o 6 @ @
; ; " i r! ! o lp l
_3 .3 2lo o
€ o
@
o o
I ? I v o l
E
d a @ 6
I ? I I I ?
= F u =
9 o o o + i
+ + + + 4 r +
l f r u o r u 9 o= F O € _ : 6
JI
j
N O < a
> l> l 6 0 @ <
o o o 6
3 s^ @ 6 @ Fi i + i @ + +v v v o
= l - q @ o q , @ < - o - - - o - o> r ' 3 3 5 3 S - t " 3 3 3 S - 8 F g> l H >
o O + O ^i o < H 6
- l= l o 6 6 6 o
| @ 6 F o ro o o o o
r l o l
^ @ O o ^N N < i @
- t - - - - -> t <
i o o 6 @
^ ^ + @ ^ ^o @ s o F o
- l N € 6 < o a> l + r < o 6 o
d o o 6 6 6
. ^ ti < @ r o ^ t 9 l
t s l - l
> l ^ l * l> l + @ @ d + H l - l
v l - li o o o @ | I
d l
6 O @ 6 ^ ^ @ O @
- l> l : o @ i < > l @ N o <
r R o R : @ > l I r < @ 0 60 o 0 6 @ | o o 6 d
l i
6 l^ 6 < 0 :
= t - - - - -> l o d 6 r @
@ | € t s o €i o o o @
, ^ ^ ^ ^ li @ @ N n ^ t ^ o 6 i 9 l
e I N a o + v t- | _ l v - - - ^ |
= l o o @ $ N a ; l < @ : ' : lq + l v l
o o o 6 @ | > l o o o @ |N t > t H N l
o l
. i N 6 N @o l - o l
- l > l - lq > t N o 6 s e d
, E l : , 3 8 3 0 E l
e l^ N t s N ^6 0 < a r
> l> l < 6 N < @
d o o o @
^ ^ : N O ^< o < o i o
> l r u o r o o e6 F 6 r O @a O O 6 6 @
6 6 + a @
- t - - - - -> t o o N @ :
H O O 6 @
6 6
O N ^_ r 6 6 6 6r t w v v v
, H O @ € O
e l ^ 3 3 3 3 'H t u
o t , !
9 l > i o 6 6 c <
E I 9 ' P : i S
648
oI)
o
o
d
(t
UI
U)
d
!
€I
d
o
o. -
o
obI)
o
N
o
F

McMILLAN: GLASSES IN THE SYSTEM CaO-MsO-SiOz
sto2
Fig. 3. Polarized (VV and VH) Raman spectra of glasses l-10near the SiOrCaMgSiOr join.
cate composition shows a strong band near 850 cm-' withan asymmetric tail to higher frequency. The 850 cm-'band may be completely polarized within experimentaluncertainty (McMillan et al., 1981; Piriou and McMillan,1983a), while the high-frequency component has a highdepolarization ratio. With increasing silica content, the850 cm-l band decreases in relative intensity, while newbands grow at higher frequency. At sample 3, the majorhigh frequency peak is at 910 cm l, with a pronouncedshoulder near 1000 cm r. Between samples 4 and 9, thisshoulder develops into the major band in the spectrum,while a further shoulder near 1050 cm-r becomes appar-ent for sample 7. This 1050 cm-r shoulder increases inrelative intensity between samples 7 and 10, to becomethe dominant high-frequency band of sample 10. The VHspectra show all these bands to be highly, but notcompletely polarized. The VH polarized spectra alsoshow different asymmetric band contours to the corre-sponding VV spectra, suggesting that the various compo-nents bands have different depolarization ratios. Thespectrum of vitreous silica at the top of Figure 3 showstwo weak bands near 1200 and 1060 cm-' which Fur-ukawa et al. (1981) found to be depolarized (p - 0.75).Seifert et al. (1982) and Mysen et al. (1982a) havesuggested that the broad 1200 cm-' band may have twocomponents. al l2O9 and | 160 cm l.
For a clearer view of spectral changes as a function ofsilica content, these high-frequency bands were deconvo-luted into Gaussian components, as described above. Theresults of this curve-fitting are shown in Figure 4 andTable 2. Four major component bands were found forsampfes l-10; at 862, 906, 972 and 1056 cm-', in reason-able agreement with Mysen et al., (1980a, l982a,b) andMysen and Virgo (1980). These were all highly.polarized,with p ranging from ( 0.1 (for the 862 cm ' band) toaround 0.2. The variation in relative intensity of thesemajor bands with silica content is shown in Figure 5. The862 cm-l band is dominant at the orthosilicate composi-tion, the 906 cm-' band near the pyrosilicate with 40 moleVa sllica, and the 972 cm I band at the metasilicatecomposition (50 mole Vo sllica). The 1056 cm-r band hasnot yet reached a maximum in relative intensity at 58mole 7o silica. These variations are similar to thoseobserved by Furukawa et al. (1981) for the 950 cm-' andll00 cm-l bands in the SiOrNazO glass series, and whofound the 1100 cm-r band to be maximized at thedisilicate composition with 67 mole Vo silica. On the basisof the positions, intensities and polarization characteris-tics of these bands, the silica content at which they havemaximum intensity, and comparison of correspondingglass and crystal spectra, previous workers have conclud-ed that the 862, 906,972 and 1056 cm-' bands correspondto symmetric silicon-oxygen stretching vibrations of sili-cate tetrahedral units with respectively four, three, twoand one non-bridging oxygen (e.g., Brawer and White,1975;Verweij and Konijnend[ik, 1976; Virgo et al., 1980;Mysen et al., 1980a, 1982a; Furukawa et al., l98l and
Rems shift cm'l
Raman shill cm'l Raman shitt cm-l

650 McMILLAN: GZASSES IN THE SYSTEM CaO-MpO-SiO"
( a )
vv V H
6N.tc Ob-rd
E gB E g ETTITT TTTTT
I AA
- l-, \
AA
4N
A
A6
Ai \
J_\
I r l l l t t | | l
E E gE E Er | l t l I t lE E E F Eg
B A i l A N S H I F T c m
( b )
Fig. 4. Curve-fitting experiments on the high-frequency bands of the SiO-CaMgSiOa glass series in Fig. 3. In each case, theobserved unresolved band contour is shown at right for comparison with the synthetic sum ofcomponents. The dashed line shows theassumed baseline, which could not be reproduced for the synthetic reconstruction. Measured component band positions are given inTable2, along with relative band intensities, half-widths and depolarization ratios, and a general discussion ofthese data.
SYNTHETIC I OBSERVED SYNTHETIC I
| (vv)
-.a\ 1 (VH)

McMILLAN: GZASSES IN THE SYSTEM CaO-MsO-SiOz 651
30 40 mol % sid;
Fig. 5. Relative high-frequency component band intensitiesfrom VV polarized spectra in the SiOz-CaMgSiOr glass series(from Fig. 4 and Table 2). The error bars shown for thecomponent bands for samples I at:.d 2 represent the relativeintensities obtained from alternative deconvolutions I and II,which are thought to be extreme cases (see Table 2 and Fig. 4).
many others: summarized in McMillan, 1984). Theseunits are shown schematically in Figure 6, and arereferred to here as SiOr, - SiO3, : SiOz, and = SiOgroups. These are equivalent to the Q0, Q', Qt, and Q3species referred to by other workers (e.g., Matson et al.,1983) in notation borrowed from NMR spectroscopicstudies (Englehardt et al., 1975). The present notation isused here for its pictorial value, and its simple extensionto aluminosilicate systems (McMillan et al., 1982). Thereare a number of other weak components present in thehigh-frequency spectra associated with the above majorbands, which may be due to asymmetric stretching vibra-tions of these units within the glass (see e.g., Furukawaand White, 1980; Mysen et al., 1980a; Furukawa et al.,1981; Matson et al., 1983; McMillan, 1984; also footnotero Table 2).
There have been a number of interpretations of the1200 and 1060 cm-r bands observed for vitreous silica(see McMillan, 1984). For the purposes of the presentdiscussion, these are assigned to asymmetric silicon-oxygen stretching motions within the fully-polymerizedsilica glass framework (McMillan et al., 1982). In the pres-ent notation, this framework is represented as :Si :.
The low-frequency region The spectrum of sample Ishows a weak, polarized band at 7(X cm-r. The Ramanspectra of crystalline calcium magnesium orthosilicatesdo not show any band in this region (Piriou and McMillan,1983a), while the band increases in intensity with increas-ing silica content (Virgo et al., 1980; Mysen et al., 1980a,1982a; this work, Fig. 3). All of the above authorsconcluded that this 7O4 cm-t band was due to a symmet-ric stretching motion o;f or about the bridging oxygen indimer units, Si2O7, within the glass structure. The pres-ence of such units within a glass at the orthosilicatecomposition (sample l; Table l) suggests that some
oxygen within the glass is not bound to silicon, but only tomagnesium and/or calcium.
With increasing silica content (samples 3 to l0)' thisband increases in intensity, becomes asymmetric, andshifts its maximum to lower frequency, to near 620 cm-lfor sample l0 (Fie. 3). From studies of alkali silicate glass
r200,1060=S i=
K E YAtrA
a
85O band
91O band
940 band
lO50 band
o
o
ds
sioII
s i o - s i - o s iIIos
J I
o
IS i O - S i - O -
IIo -
tooo-950
=Sio2
o
-q-5 i -e -
Io -
850
si04
Fig. 6. Silicate structural units. (a) Schematic indicating thenature of bridging and non-bridging oxygen in the present
context. M* may also refer to 0.5 M2*, as in the alkaline earthseries. (b) The weak, depolarized bands at 1200 and-1060 cm-lare assigned to asymmetric silicon-oxygen stretching vibrationswithin a fully-polymerized tetrahedral network : Si :. (c) Thefour major polarized high-frequency bands are generally
assigned to symmetric stretching vibrations of tetrahedralsilicate units with one, two, three and four non-bridging oxygens.
(c) s-!o
II
s io - s i - o -
II
o5 l
iloo-to50
=s io
o
Isio_ si _o-
o-900
-s io^

652 McMILLAN: G|ASSES IN THE SYSTEM CaO-MpO-SiO,
series (e.9., Brawer and White, 1975; Kontjnendijk andStevels, 1976; Verwej and Konijnendijk, 1976; Furukawaet al., 1981) it is l ikely that the dominanr 430 cm I band ofvitreous silica represents the continuation ofthis band tohigh silica content. The band is always highly polarized(Verweij, l979a,b; this work, Fig. 3). The asymmetry ofthis band in these room-temperature spectra is partly dueto thermal population effects, and may partly be due tothe presence of discrete component bands as for the high-frequency band group. Attempts at curve-fitting using upto six Gaussian components were unsuccessful, and theproblem was deemed too unconstrained for meaningfuldeconvolution at the present level.
All of the previous studies on this and similar systems(see McMillan, 1984) have associated the 400-700 cm-tband with the presence of bridging oxygens corner-sharedbetween adjacent SiOa tetrahedra (see Fig. 6), indicatingsilicate units more polymerized than the isolated orthosi-licate tetrahedron. The detailed motions giving rise to thislow-frequency band are as yet unclear, and may changeas a function of the particular silicate group involved.Isotopic studies on Si2O7 dimers in crystalline pyrosili-cates suggest considerable silicon motion associated withthe 700 cm-' vibration (Tarte et al., 1973), consistent withits assignment to a symmetric stretch of the - SiO3groups about their bridging oxygen (e.g.,Lazarev,1972,p. 63-72). However, the 430 cm-r band of vitreous silicashows a large 180/160 isotopic shift consistent with main-ly oxygen motion, suggested to be in the plane bisectingthe Si-O-Si bridge (e.g., Galeener and Mikkelsen, l98l).
The mid-range region. Vitreous silica shows an asym-metric band near 800 cm-', with probable components at790 and 830 cm ' (e.g., Seifert et al., 1982). Comparisonof VV and VH spectra shows that the lower frequencycomponent has a higher depolarization ratio (Fig. 3).Vibrational calculations have associated modes in thisregion with mainly motion of silicon (e.g., Laughlin andJoannopoulos,1977; Furukawa et al., l98l), consistentwith the results of the isotopic exchange studies ofGaleener and Mikkelsen (1981) and Galeener and Geiss-berger (1983). Laughlin and Joannopoulos (1977) andPiriou and McMillan (1983b) suggested that the siliconmotion was symmetric about the bridging oxygens, con-sistent with the observed infrared and Raman intensities(see McMillan et al., 1982). In alkali silicate glass sys-tems, this band broadens and shifts to slightly lowerfrequency with decreasing silica content, to around 750cm-r at 55 mole Vo srlica (e.g., Brawer and White, 1975;Verweij and Konijnendljk, 1976; Furukawa et al., l98l;Mysen et al., 1982a). The band is observed in the presentSiO2-CaMgSiOa glasses as a weak shoulder in the VVspectra, and as an asymmetric band near 780 cm I in theVH spectra (Fig. 3; also Virgo et al., 1980; Mysen et al.,1980a, 1982a). This band may nor be clearly distinguishedfor samples with less than 50 mole Vo silica.
It is possible that the mid-range bands in these silicateglass series are similar to the 800 cm-l band of vitreous
silica, and due predominantly to motion of silicon againstits oxygen "cage". It is of interest that bands are ob-served in this region in the infrared and Raman spectra ofcrystalline sheet silicates (e.9., Brawer and White, 1975;Pavinich et al., 1976; Verweij and Konijnendijk, 1976;Verweij, 1979b), but not in the spectra of calcium magne-sium chain silicates (e.g., Etchepare, 1970a,7972; Omori,l97l; White, 1975; Zulumyan et al., 1976; Conjeaud andBoyer, 1980). McMillan (1981) suggested that such "sil i-con cage motions" might only be resolved in silicatestructures with a high degree of polymerization whereassociated oxygen motion would be hindered, and thatthese vibrations might couple with vibrations of thebridging oxygens (giving rise to the 700-400 cm-r bandset) for lower silicate polymerizations.
The SiOTCaMgSiOa miscibility gap
Three samples were prepared with bulk compositionswithin the SiO2-CaMgSiOa two-liquid field (Fig. l). Oneset of glasses was prepared by normal quenching, andgave opaque samples which were macroscopically inho-mogeneous and presumably unmixed (Table I and inset toFig. 7). A second set were re-melted then super-quenched, to give optically transparent glasses whichwere much more homogeneous to electron microprobeanalysis (Table l). Sample 12 had a bluish tinge, butsamples l l and l3 were colorless, implying inhomogenei-ties smaller than several hundred Angstroms (Voishvillo,1962; Andreev, 1978). The spectra of these two sets ofglass samples are compared in Figure 7. Also shown arethe spectra of vitreous silica and of sample 10, withcompositions near the poles of the liquidus miscibility gapin the SiO2-CaMgSiOa system (see Fig. l).
The spectra of the normal-quenched opaque unmixedsamples ll to 13 are simple superpositions of the spectraof SiO2 and sample 10, varying inversely in relativeintensity as the two-liquid field is traversed. This is theexpected behavior for a two-phase sample with varyingrelative proportions ofeach phase. It is ofinterest that thespectra of the super-quenched and optically transparentglasses show exactly the same behavior, which hasseveral implications. First, the same vibrating units arepresent in both the opaque and the transparent samples,suggesting no difference in molecular structure betweenthe two sets of samples as sampled by the Ramanexperiment. The major difference between the opaqueand transparent samples then probably lies in the size ofthe individual structural units responsible for macroscop-ic inhomogeneity. Glass and liquid immiscibility is com-monly detected and measured by the onset of visibleopalescence in the sample (e.g., Haller et al., 1974) whichoccurs when density fluctations are of the order of severalhundred Angstrom units across (Voishvillo, 1962; Andre-ev, 1978). The present study shows that Raman spectros-copy is insensitive to size changes in the structural unit ona hundred Angstrom level, which would be consistentwith Raman band localization arguments (see McMillan,

McMILLAN: GLASSES IN THE SYSTEM CaO-MsO-SiOz 653
Fig. 7. Crossing the SiO2-CaMgSioa miscibility gap (samples ll, l2 and l3). Spectra (a) correspond to normal-quenched, opaqueglasses, while (b) shows the spectra of super-quenched, transparent glasses of similar bulk compositions to those in (a). The samplesin (b) were re-melted for super-quench, hence had slightly lower silica content due to volatilization (see text, and Table l), whichexplains the band intensity differences between spectra (a) and (b).
1984). It also suggests that the molecular groups precur-sor to phase separation are present in the transparentglass series, which would classically be termed "homoge-neous". This places limits on the structural significanceof miscibility gaps determined by opalescence and clear-ing temperatures. Finally, there is no evidence in theSiOrCaMgSiOa glass series for intermediate structuresbetween those at the poles of the classical miscibility gap,in contrast to the SiO2-Na2O and SiOrK2O glass series
where a continuous set of changes is found (e.g., Etche-pare, 1970b; Brawer and White, 1975; Konijnendijk andStevels, 1976; Verweij and Konijnendijk, 1976; Furukawaet a l . , l98 l ;Mysen et a l . , 1982; Matson et a l . , 1983) '
The SiOrCaO qnd SiOyMgO glass series
The unpolarized Raman spectra of glasses along theSiOrCaO and SiOrMgO joins are shown in Figure 8.The spectra are similar to those obtained in previous
s
nvw.-p50
Raman shift cm-l Raman shift cm-l

654 McMILLAN: GZASSES IN THE SYSTEM CaO-MsO-SiOz
( b )
1000 500
Raman shift cm-l
( a ) ( c )
10@ 500
Raman shift cm-l
Fig' 8. Unpolarized (VV + VH) Raman spectra of glasses (a) 14-19 and (c) 2l-23 and SiO2, respectively along the SiO2-CaO andSiO2-MgO joins. CaO-SiO2 sample 20 (b) was opaque and inhomogeneous, with approximate compositional limits as shown in theinset. The two spectra were taken from different parts of the sample. From their form, these correspond to higher-silica and lower-silica regions.
studies (e.g., Kashio et al., 1980; Mysen and Virgo, 1980;Mysen et al., 1980a,b, 1982a,b; Tsunawaki et al., l98l)and show similar changes with silica content to the SiO2-CaMgSiOa glass series. The individual bands in the SiO2-CaO series are better-resolved than those for the SiO2-MgO glasses. Brawer and White (1977) studied series ofsodium silicate glasses containing calcium or magnesium,and found the bands for the calcic glasses better-resolvedthan for the magnesian compositions. Some of the SiO2-CaO and SiO2-MgO samples had compositions within theCaO-MgO-SiO2 two-liquid field, and both opaque un-mixed and transparent "homogeneous" glasses wereprepared by normal- and fast-quench techniques. As forthe SiO2-CaMgSiO+ series, both sets of samples hadidentical Raman spectra.
The binary calcium silicate sample 20 prepared bynormal quenching was found to be very inhomogeneous,with a bulk composition near 85 mole Vo silica but
variations of 110 mole Vo in silica content within thesample (Table l). A number of spectra were obtainedfrom different parts of the sample, and none were exactlyalike. The two most extreme spectra observed are shownin Figure 8b. The spectrum with higher intensity in thehigh-frequency region corresponds to the area with lowersilica content. This low-silica spectrum is similar in formto the spectrum of samples 18 and 19, within the SiO2-CaO miscibility gap, but with different relative intensityofthe high-frequency and low-frequency parts. These aregenerally indicative of the relative proportions of respec-tively low-silica and high-silica unmixed regions, as dis-cussed above for the SiOrCaMgSiOa series.
The spectrum for the higher silica part of sample 20shows a different type of spectmm (Fie. 8b). The 430cm-l band of vitreous silica still dominates the spectrum,but its "defect" bands at 500 and 600 cm-r seem sup-pressed relative to both SiO2 glass and the lower-silica

McMILLAN: GLASSES IN THE SYSTEM CaO-MsO-SiOz 655
part of sample 20. The high-frequency region shows onlya weak, broad, asymmetric band, in contrast to theconstant band pattern indicative of the depolymerizedsilicate units of the unmixed spectra. Polarization studies(not shown) indicate that this weak band is a combinationof three bands. The depolarized bands of vitreous silicamay be identified at 1060 and 12fi) cm-r, with a newpolarized band appearing near ll00 cm-r. This is similarto the spectra observed for silica glass with small addi-tions of alkali oxides, MzO (Stolen and Walrafen, 1976;Mysen et al., 1982;Matson et al., 1983), KAIO2 (McMil-lan et al., 1982) and AlzOr (McMillan and Piriou, 1982). Itis suggested that the polarized ll00 cm-r band corre-sponds to the symmetric stretching vibration of a smallproportion of = SiO units, within a silica glass frameworkonly slightly perturbed by the presence of CaO compo-nent (see also McMillan and Piriou, 1982).
Interpretations and structural models
Consistent with the results of previous studies, theobserved high-frequency bands have been assigned tosil icon-oxygen stretching motions of :Si:, :SiO,=SiOz, -SiO3 and SiOa groups within the glass structure(see Fig. 6). Their observed relative intensity variation asa function of silica content is consistent with a decrease inthe average polymerization of the silicate units as thesilica content is decreased, and that some distribution ofpolymerized species is present at a given silica content(Figs. 3-5, 8; also e.g., Furukawa et al., 1981; Mysen etal., 1982a). Most previous studies have not consideredthe detailed a"rrangement of these molecular groups, onlytheir relative distribution as a function of silica content(see McMillan, 1984). Brawer and White (1975) proposedthat individual silicate tetrahedral units might show bondlength and angle disorder, and that adjacent units couldhave different polymerization. This model allows forcontinuous depolymerization of the silica glass networkon addition of metal oxide component, by creation ofsilicate tetrahedra with non-bridging oxygens at randomthroughout the structure. More recently Mysen, Virgoand co-workers (e.g., Virgo et al., 1980; Mysen et al.,1980a, 1982a) have proposed a model based on discreteanionic silicate structural units. At any given silica con-tent, the melt or glass structure will contain a distributionof orthosilicate and pyrosilicate dimer groups, infinitechain and sheet structures, and three-dimensional net-work units. This latter model implies that the Ramanbands used to characterize these long-range structuresare in fact specific to such structures and exclude otherpossibilities, such as the random arrangement of silicateunits proposed by Brawer and White (197 5) . A number ofauthors have discussed the localization of the dominantRaman bands in silicate glasses (e.g., Bell and Dean,1970; Bell et al., 1970; Brawer, 1975; Furukawa et al.,1981; McMillan and Piriou, 1983; McMillan, 1984). Itseems likely that the major high-frequency bands arehighly localized within a given silicate tetrahedral unit,
and are relatively insensitive to the nature of adjacenttetrahedral units. This excludes the use of the high-frequency Raman bands of silicate glasses to characterizelong-range structures such as infinite sheets and chains.This implies that although the Raman spectra are consis-tent with the model of Virgo et al. (1980) and Mysen et al.(1980a, 1982a), they are equally consistent with that ofBrawer and White (1975). In the present article, themolecular groups =SiO, =SiO2, and -SiO3 are notassigned to any particular long-range structure. By defini-tion, the groups SiOa and =Si: denote respectively asilicate tetrahedral unit with four non-bridging oxygens,and a silicate unit corner-sharing all four oxygens as partof a fully-polymerized network.
To investigate the effect of different metals on thedistribution of silicate species, it is of interest to comparethe spectra of glasses with the same silica content. Thiswas done in the present study for CaO-MgO-SiOz glasseswith near 70 mole Vo siliea. The spectra of these glassesare shown in Figure 9. The high-frequency bands of the
mot foxld6a
Raman shift cm-1
Fig. 9. The efect of calcium/magnesium substitution on thespectra of glasses with near 70 mole 7o silica.
rc

656 McMILLAN: GLASSES IN THE SYSTEM CaO-MsO-SiO2
CaO-SiO2 glass (19) are well-resolved at 1060 and 970cm-l. The dominant 1060 cm-r band indicates a highproportion of =SiO units, while the 970 cm-r is due to=SiO2 groups. The weak band at 860 cm-r indicates thepresence of isolated SiOa tetrahedra. The 900 cm-r bandexpected for -SiO3 groups is probably unresolved fromthe higher frequency group (see Figs. 3 and 4; also Mysenet al., 1982b). The SiOrCaMgSiOa samples l l and 12have silica contents of respectively 68 and 72 mole Vosilica. The high-frequency bands are less well-resolvedthan those of the calcic glass. The 1060 cm-r bandremains more intense than the shoulder at 980 cm-t:butless so than for sample 19. Finally, the SiO2-MgO glass(23) shows no bands resolved at high frequency, but onlya broad asymmetric maximum between 960 and 1080cm-1, where the lower-frequency pan seems to predomi-nate. These observations suggest that, if Mg/Ca substitu-tion affects the absolute intensities of the 1060 and 970cm-r bands in the same way, the relative proportion of:SiOz to =SiO groups increases as magnesium is substi-tuted for calcium in the glass structure.
Related observations have been noted in studies ofother silicate glass systems. The spectra of alkali silicateglasses with above 60 mole Vo sllica are dominated by aband near 1100 cm-ldue to =SiO units with a weakerband near 950 cm-r associated with =SiOz groups (e.g.,Brawer and White, 1975; Verweij and Konijnendijk, 1976;Konijnendijk and Stevels, 1976). Brawer and White(1975) noted that the 950 cm-r band was relatively moreprominent in the order K < Na < Li, at a given silicacontent. Matson et al. (1983) have obtained Raman spec-tra for a wider range of alkali silicate glasses, and find thatthe relative intensity of the 950 cm-l band increases inthe sequence Cs < Rb < K < Na < Li at fixed silicacontent. This band was also observed to appear at highersilica content in these glass series in the same order. Atthe same time, there is an increased intensity near 450cm-' in the same order, attributed to an increased propor-tion of silica-like network (:Si: units) in the glassstructure. Brawer and White (1977) studied series of high-silica CaO-Na2O-SiO2 and MgGNa2O-SiO2 glasses.They observed increased proportions of :SiOz and :Si:units relative to =SiO groups as the alkaline earth cationwas substituted for sodium, with magnesium having moreeffect than calcium. Finally, the results of Mysen et al.(1982a) for SiO2-Na2O, BaO, CaO and (Ca,Mg)O glassseries show that, at given high silica content, the 1000-950 cm-r band indicative of :SiO2 units is relativelymore important in the order Na < Ba < Ca (Ca,Mg),compared with the 1100-1050 cm-r band associated with=SiO units. These observations may be rationalized bythe following model, termed the "molecular site model"(McMillan, l98l: McMillan and Piriou. 1983).
If it assumed that all oxygen is coordinated to silicon,and that local electrostatic charge balance must be satis-fied, then a given metal cation will have an appropriatecombination of bridging and non-bridging oxygens in its
coordination sphere. The non-bridging oxygens may bedescribed by the silicate molecular units SiO4, -SiOr,:SiOz and =SiO, and may be used to define types ofcation site. The model is most simply discussed for highsilica content, where :SiOz, =SiO and uncharged :Si=
units predominate, and for singly- and doubly-chargedcations M+ and M2*. A single site =SiO defines a site forone M* cation, while the doubly-charged site :SiOz mayaccomodate one M2*, or two M+ cations. Finally, acoupled site [=5i91r, with two discrete =SiO units withinthe coordination sphere, may be formulated to house asingle M2* or two M+ cations. The uncharged unit =Si=
has no associated cation. At a given silica content, therelative proportion of these sites will be a function of themetal cation. Large cations M+ should prefer the singlesite =SiO, since occupation of :SiOz sites would lead tosteric crowding, while smaller M+ cations should allow ahigher proportion of :SiOz sites. Doubly-charged cationsM2+ of large ionic radius should preferentially occupy themore open, coupled site J=5;9L, while smaller M2+cations will favor the higher charge concentration offeredby the =SiO2 sites. At constant silica content, the overalldistribution of silicate molecular units is fixed bv the"reaction"
2 -:SiO : :Si= + :SiOz.
The above reasoning suggests that this reaction will bedriven to the right for small, doubly-charged cations, andto the left for large, singly-charged cations. This isconsistent with the experimental observations discussedabove, where bands for :SiOz and =Si= units becomemore prominent at the expense of =SiO groups, at similarsilica content in the order
Cs* < Rb* < K+ < Na* < Li+ and ca2* < Mg2*
The formation of :Si: and :SiOz units from =SiOgroups is a charge concentration effect, since the =Si:unit has no associated cation. The clustering induced bythis charge concentration may be regarded as incipientimmiscibility, and suggests that the tendency for unmix-ing should increase in the order Cs < Rb < K < Na < Lifor the alkalis, and Ca < Mg for the alkaline earthsilicates. The model also suggests that the low-silica limitof the two-phase region should move toward more basiccompositions, in the same order.
It has long been known that liquids in the systemsSiO2-MgO, CaO and SrO show large miscibilty gaps athigh silica content (e.g., Greig, 1927), while SiO2-BaOand SiO2-Li2O, Na2O and perhaps K2O show metastableimmiscibility in high silica glasses (e.g., Charles, 1966,1967, 1969: Galakhov and Varshal, 1973; Haller et al.,1974; Hess, 1977). ln all cases, the silica-rich liquid isnear pure silica (90-100 mole Vo SiOJ, while the composi-tion of the metal oxide-rich liquid or glass becomesprogressively richer in metal oxide in the order Ba < Sr <Ca < Mg for alkaline earth oxides, and for the alkalies, K< Na < Li, with Li between Mg and Ca, Na between Sr

McMILLAN: GTASSES IN THE SYSTEM CaO-MgO-SiO2 657
and Ba, and K lower than Ba (e.g., Kracek, 1939;Charles, 1967: Galakhov and Varshal. 1973: Hess. 1977).The above model based on the Raman spectroscopicresults is certainly consistent with the observed immisci-bility behavior of alkali and alkaline earth silicate meltsand glasses. Matson et al. (1983) have recently developeda similar but independent model from their Raman studiesof alkali silicate glasses. The model has also been extend-ed to simple aluminosilicate compositions by McMillan etal. (1982) and Navrotsky et al. (1982), where it successful-ly rationalized heats of mixing along the SiO2-NaAlO2and SiO2-Caa.5AlO2 glass joins, and predicted some ten-dency for unmixing in the system SiO2-Mg6 5AlO2.
In all of the alkali and alkaline earth silicate miscibilitygaps described above, the high silica limit of the two-phase region lies near 90-9 5 mole Vo silica, suggesting thata few per cent metal oxide component may dissolve in thesilica glass network before leading to macroscopic phaseseparation. The spectrum of the high-silica SiO2-CaOglass 20 (Figure 8b) shows a weak band assigned to =SiOunits near 1100 cm-t between the two silica bands at 1060and 1200 cm-r. The major features of the silica glassspectrum are not changed, except that the two defectpeaks at 500 and 600 cm-'are less prominent than invitreous silica. It is suggested that these few per cent ofmetal oxide component may be accepted into the silicaglass structure with formation of some =SiO units, with-out disrupting the overall glass network, and that thismechanism may suppress the structural "defect" respon-sible for the 500 and 600 cm-r bands. A similar effect wasnoted for small additions of Al2O3 to silica glass (McMil-lan and Piriou, 1982), and also for additions of KAIO2 andalkali oxides where no stable immiscibility is known (e.g.,Stolen and Walrafen, 1976; McMillan et al., 1982; Mysenet al., 1982a; Matson et al., 1983).
The above site model appears to give a useful molecu-lar description of structural factors possibly responsiblefor the unmixing behavior observed in simple silicatesystems. The model becomes of less value as the silicacontent is decreased, with formation of -SiO3 and SiOagroups. Associated with these would be various combina-tions of M+ and M2* cations, each controlled by a varietyof factors, such as cation--oxygen bonding, and cation-cation repulsion effects. The sites -SiO3 and SiOa mayalso be considered coupled to :SiOz and =SiO, furthercomplicating the problem. Similarly, the model may notyet be simply formulated for higher valence cations.Finally, it is noted that the model will work best whenelectrostatic charge balance is most rigorous, or when thecation-oxygen association is maximized. However, asthis association is increased, it may perturb the silicatebonding interaction. It is of interest that the major silicatebands are observed to broaden in the order Cs < Rb < K< Na < Li < Ca < Mg in alkali and alkaline earth silicateglass systems, which may partly reflect an increasedperturbation of the silicate units as the cation strengthlncreases.
Acknowledgments
This work has been supported by NSF grants EAR-7809954,INT-7926523, INT-8006965 and EAR-8108748, the FrenchCNRS and the PIRPSEV program. The author would like tothank Bernard Piriou, John Holloway and Alex Navrotsky fortheir support and encouragement, Paul Caro of C.N.R.S. Belle-vue for his hospitality, and Jean Etchepare ofENSTA Palaiseaufor the use of his instrument to obtain spectra for samples of pooroptical quality. He also thanks John Bradley, Jim Clark and AnnYates at Arizona State University, and the analytical group atI'Universit6 de Paris VI, for assistance with sample analyses,Mary McMillan for help with computing and drafting, and NitaDagon and Mike Palitz for typing. A predecessor of this manu-script was reviewed by Bjorn Mysen, and in its present form wasread by John Clemens, Chris Capobianco, Nancy Ross and MikeO'Keetre and reviewed by Ed Stolper and Shiv Sharma, whosehelpful comments were all appreciated.
References
Andreev, N. S. (1978) Scattering of visible light by glassesundergoing phase separation and homogenization. Journal ofNon-Crystalline Solids, 30, 99-126.
Bell, R. J. and Dean, P. (1970) Atomic vibrations in vitreoussilica. Discussions of the Faraday Society, 50, 55-61.
Belf , R. J., Dean, P. and Hibbins-Butler, D. C. (1970) Localiza-tion of normal modes in vitreous silica, germania and berylli-um f luoride. Journal of Physics C,3,2l l l -2118.
Boyd, F. R. and Finger, L. W. (1975) Homogeneity of mineralsin mantle rocks from Lesotho. Carnegie Institute of Washing-ton Yearbook, 74, 519-525.
Brawer, S. A. and White, W. B. (1975) Raman spectroscopicinvestigation of silicate glasses. L The binary alkali silicates.Journal of Chemical Physics, 63,2421-2432.
Brawer, S. A. (1975) Theory of the vibrational spectra of somenetwork and molecular glasses. Physical Review B, l ,3l '73-3194.
Brawer, S. A. and White, W B. (1975) Raman spectroscopicinvestigation of the structures of silicate glasses (II). Soda-alkaline earth-alumina ternary and quaternary glasses. Journalof Non-Crystalline Solids, 23, 261-278.
Charles, R J. (1966) Metastable liquid immiscibility in alkalimetal oxide-silica systems. Journal of the American CeramicSociety, 49,55-62.
Charles, R. J. (1967) Activities in Li2O-, Na2O- and K2O-SiO2solutions. Journal of the American Ceramic Society,50,631-u t .
Charles, R. J. (1969) The origin of immiscibility in silicatesolutions. Physics and Chemistry of Glasses, 10, 169-178.
Conjeaud, M. and Boyer, H. (1980) Some possibilities of Ramanmicroprobe in cement chemistry. Cement and Concrete Re-search, 10,6l-70.
Coutures, J. P., Berjoan, R., Benezech, G., and Granier, B.(1978) Utilisation des fours solaires de laboratoire pour l'6tudei haute temp6rature des propri6t6s physicochimiques desoxydes r6fractaires. Revue Internationale des Hautes Tem-peratures et R6fractaires, 15, 103-l 14.
Englehardt, G., Zeigan, D., Jancke, H., Hoebbel, D., andWieker, W. (1975) Zur abhiingigkeit der struktur der silicatan-ionen in wiissrigen natrium silicatlosiingen vom Na:Si verhiilt-nis. Zeitschrift fiir Anorganische Allgemeine Chemie, 418,l7-28.

65E McMILLAN: GLASSES IN
Etchepare, J. (1970a) Spectres Raman du diopside cristallis6 etvitreux. Comptes Rendus de I'Acaddmie des Sciences d Paris,s€rie B. 270. 1339-1342.
Etchepare, J. (1970b) Sur I'nterpretation des spectres de ditru-sion Raman de la silice vitreuse et de verres binaires desilicates alcalins. Journal de Chimie Physique, 67, 890-894.
Etchepare, J . (1972) Study by Raman spectroscopy of crystallineand glassy diopside. In R. W. Douglas and B. Ellis, Eds.,Amorphous Materials, p. 337-346. John Wiley and Sons, NewYork.
Furukawa, T. and White, W. B. (1980) Vibrational spectra andglass structure. Journal of Non-Crystalline Solids, 38139,87-92.
Furukawa, T., Fox, K. E., and White, W. B. (1981) Ramanspectroscopic investigation of the structure of silicate glasses.III. Raman intensities and structural units in sodium silicateglasses. Journal of Chemical Physics, 75, 3226-3237.
Galakhov, F. Ya. and Varshal, B. G. (1973) Causes of phaseseparation in simple silicate systems. In The Structure ofGlass, vol. 8, Phase Separation Phenomena in Glasses, ed. E.A. Porai-Koshits, p. 7-11. Consultants Bureau, New York.
Galeener, F. L. and Mikkelsen, J. C. (1981) Vibrational dynam-ics in r8O-substituted vitreous SiOz. Physical Review B, 17,1928-1933.
Galeener, F. L. and Geissberger, A. E. (1983) Vibrationaldynamics in 3oSi-substituted vitreous SiOz. Physical Review8.27. 6199-6204.
Greig, J. W. (1927) Immiscibility in silicate melts. AmericanJournal of Science. 13. l-44 and 133-154.
Halfer, W., Blackburn, D. H., and Simmons, J. H. (1974)Miscibility gaps in alkali-silicate binaries--data and thermody-namic interpretation. Journal of the American Ceramic Socie-|y,57, '120-126.
Hass, M. (1969) Temperature dependence of the Raman spec-trum of vitreous silica. Solid State Communications. 7. 1069-1071.
Heinrich, K. F. J. (1972) A simple correction procedure forquantitative electron probe microanalysis. National Bureau ofStandards Technical Note 719, U.S. Government PrintingOffices.
Herzberg, G. (1945) Molecular Spectra and Molecular StructureVol. Il, Infrared and Raman spectra of Polyatomic Molecules.Van Nostrand Press.
Hess, P. C. (1977) Structure of silicate melts. Canadian Mineral-ogist,15, 162-178.
Kashio, S., lguchi, Y., Goto, T., Nishina, Y., and Fuwa, T.(1980) Raman spectroscopy study on silicate slag. Transac-tions of the Iron and Steel Institute of Japan, 20,251-253.
Konijnendijk, W. L. (1975) The Structure of Borosilicate Glass-es, Philips Research Reports Supplements No. l, CentrexPublishing Company, Eindhoven, Netherlands.
Konijnendijk, W. L. and Stevels, J. M. (1976) Raman scatteringmeasurements of silicate glasses and compounds. Journal ofNon-Crystalline Solids, 21, 447-453.
Laughlin, R. B. and Joannopoulos, J. D. (1977) Phonons inamorphous silica. Physical Review B, 16,2942-2952.
Lazarev, A. N. (1972) Vibrational Spectra and Structure ofSilicates. Consultants Bureau, New York.
Leadbetter, A. J. and Stringfellow, M. W. (1974) The frequencyspectrum of the normal modes of vibration of vitreous silicaand a-quartz. In Proceedings of the Grenoble Conference onNeutron Inelastic Scattering, p. 501-513. lnternational AtomicEnergy Association, Vienna.
THE SYSTEM CaO-MgO-SiO.t
Levin, E. M., Robbins, C. R., and McMurdie, H. F. (1964)Phase Diagrams for Ceramists, Vol. I. American CeramicSociety, Columbus, Ohio.
Matson, D. W., Sharma, S. K., and Philpotts, J. A. (19E3) Thestructure of high-silica alkali-silicate glasses-a Raman spec-troscopic investigation. Journal of Non-Crystalline Solids, 58,323-352.
McMillan, P. F. (1981) A Structural Study of AluminosilicateGlasses by Raman Spectroscopy. Ph.D. dissertation, ArizonaState University.
McMillan, P. F. (1984) Structural studies of silicate glasses andmelts-applications and limitations of Raman spectroscopy.American Mineralogist, 69, 622-6M.
McMillan, P. F. and Piriou, B. (1982) The structures andvibrational spectra of crystals and glasses in the silica-aluminasystem. Journal of Non-Crystalline Solids, 53,279-298.
McMillan, P. F. and Piriou, B. (1983) Raman spectroscopicstudies of silicate and related glass structure: a review. Bulle-tin de Mindralogie, 106,57J5.
McMillan, P. F., Coutures, J. P., and Piriou, B. (1981) DitrusionRaman d'un verre de monticellite. Comptes Rendus de I'Aca-d6mie des Sciences ir Paris, s6rie II, 292,195-198.
McMillan, P. F., Piriou, 8., and Navrotsky, A. (1982) A Ramanspectroscopic study of glasses along the joins silica-calciumaluminate, silica-sodium aluminate, and silica-potassium alu-minate. Geochimica et Cosmochimica Acta, 46,2021-2037.
Mysen, B. O. and Virgo, D. (1980) Solubility mechanisms ofcarbon dioxide in silicate melts: A Raman spectroscopicstudy. American Mineralogist, 65, 885-899.
Mysen, B. O., Virgo, D., and Scarfe, C. M. (1980a) Relationsbetween the anionic structure and viscosity of silicate melts-a Raman spectroscopic study. American Mineralogist, 65,690-710.
Mysen, B. O., Seifert, F., and Virgo, D. (1980b) Structure andredox equilibria of iron-bearing silicate melts. American Min-eralogist, 65. 867-884.
Mysen, B. O., Virgo, D., Harrison, W. J., and Scarfe, C. M.(1980c) Solubility mechanisms of H2O in silicate melts at highpressures and temperatures: a Raman spectroscopic study.American Mineralogist, 65, 900-914.
Mysen, B. O., Ryerson, F. J., and Virgo, D. (1980d) Theinfluence of TiO2 on the structure and derivative properties ofsilicate melts. American Mineralogist, 65, I 150-1165.
Mysen, B. O., Ryerson, F. J., and Virgo, D. ( l98la) Thestructural role of phosphorus in silicate melts. AmericanMineralogist, 66, 106-1 17.
Mysen, B. O., Virgo, D., and Kushiro, I . ( l98lb) The structuralrole of aluminum in silicate melts-a Raman spectroscopicstudy at I atmosphere. American Mineralogist, 66, 678-701.
Mysen, B. O., Virgo, D., and Seifert, F. A. (1982a) The structureof silicate melts: implications for chemical and physical prop-erties of natural magma. Reviews of Geophysics and SpacePhysics, 20, 353-383.
Mysen, B. O., Finger, L. W., Virgo, D., and Seifert, F. A.(1982b) Curve-fitting of Raman spectra of silicate glasses.American Mineralogist, 67, 686-695.
Navrotsky, A., Peraudeau, G., McMillan, P., and Coutures, J.P. (1982) A thermochemical study ofglasses and crystals alongthe joins silica-calcium aluminate and silica-sodium alumi-nate. Geochimica et Cosmochimica Acta. 46.2039-2047.
Omori, K. (1971) Analysis of the infrared absorption spectrum ofdiopside. American Mineralogist, 56, I 607-1616.
Pavinich, V. F., Mirgorodskii, A. P., Kolesova, V. A., and

McMILLAN: GZASSES IN
Lazarev , A. N. (1976) Interpretation of the infrared spectra ofa laminated Li2Si2O5 crystal and its structural analog a-Na2Si2O5. Optics and Spectroscopy, 40, 466-468.
Piriou, B. and Alain, P. (1979) Density of states and structuralforms related to physical properties of amorphous solids. HighTemperatures-High Pressures , ll, 407-414.
Piriou, B. and McMillan, P. (1983a) The high-frequency vibra-tional spectra of vitreous and crystalline orthosilicates. Ameri-can Mineralogist, 68, 426-M3.
Piriou, B. and McMillan, P. (1983b) Ordre et spectroscopievibrationelle de silicates. Bulletin de Min6ralogie , 106,23-32.
Seifert, F., Mysen, B. O. and Virgo, D. (1982) Three-dimension-al network structure of quenched melts (glass) in the systemsSiO2-NaAlO2, SiOr-CaAl2Oa and SiO2-MgAl2Oa. AmericanMineralogist, 67, 696-7 l7 .
Sharma, S. K. and Yoder, H. S. (1979) Structural study ofglasses of akermanite, diopside, and sodium melilite composi-tions by Raman spectroscopy. Carnegie Institute of Washing-ton Yearbook. 78. 526-532.
Sharma, S. K., Virgo, D., and Mysen, B. O. (1979) Raman studyof the coordination of aluminum in jadeite melts as a functionof pressure. American Mineralogist, U, 779-:787.
Shuker, R. and Gammon, R. W. (1970) Raman-scattering selec-tion-rule breaking and the density of states in amorphousmaterials. Physical Review Letters, 25, 222-225.
Stolen, R. H. and Walrafen, G. E. (1976) Water and its relationto broken bond defects in fused silica. Journal of ChemicalPhysics, &,2623-2631.
Tarte, P., Pottier, M. J. and Proc6s, A. M. (1973) Vibrationalstudies of silicates and germanates - V. I. R. and Ramanspectra of pyrosilicates and pyrogermanates with a linearbridge. Spectrochimica Acta, 29 A, l0l7 -1027 .
Thomas, I. L. and Haukka, M. T. (1978) XRF determination of
THE SYSTEM CaO-MgO-SiOz 659
trace and major elements using a single-fused disc. ChemicalGeology, 2l, 39-50.
Tsunawaki, Y., Iwamoto, N., Hattori, T., and Mitsuishi, A.(1981) Analysis of CaO-SiO2 and CaO-SiOz-CaF2 glasses byRaman spectroscopy. Journal of Non-Crystalline Solids, 44,369-378.
Verweij, H. (1979a) Raman study of the structure of alkaliger-manosilicate glasses (I): sodium and potassium metagermano-silicate glasses. Journal of Non-Crystalline Solids, 33,4l-53.
Verweij, H. (1979b) Raman study of the structure of alkaliger-manosilicate glasses II. Lithium, sodium and potassium diger-manosilicate glasses. Journal of Non-Crystalline Solids, 33,55-69.
Verweij, H. and Konijnendijk, W. L. (1976) Structural units inKrO-PbO-SiO2 glasses by Raman spectroscopy. Journal ofthe American Ceramic Society, 59, 517-521.
Virgo, D., Mysen, B. O. and Kushiro, I. (1980) Anionic constitu-tion of l-atmosphere silicate melts: implications for the struc-ture of igneous melts. Science,zOE, l37l-1373.
Voishvillo, N. A. (1962) Coherent scattering of light in glass.Optics and Spectroscopy, 12, 225-229.
white, w. B. (1975) structural interpretations of lunar andterrestrial minerals by Raman spectroscopy. In C. Karr,Infrared and Raman spectroscopy of Lunar and TerrestrialMaterials, p. 325-358. Academic Press, New York.
Zulumyan, N. O., Mirgorodski i , A. P., Pavinich, V. F., andLazarev, A. N. (1976) Study of calculation of the vibrationalspectrum of a crystal with complex polyatomic anions. Diop-side CaMgSizO6. Optics and Spectroscopy , 4l, 622-627 .
Manuscript received, March 1, 1983;acceptedfor publication, January 25, lgM.