Embed Size (px)
Citation preview
A rain splash transport equation assimilating field and laboratory
measurements
Thomas Dunne,1,2 Daniel V. Malmon,3 and Simon M. Mudd4
Received 4 March 2009; revised 13 July 2009; accepted 3 September 2009; published 7 January 2010.
[1] Process-based models of hillslope evolution require transport equations relatingsediment flux to its major controls. An equation for rain splash transport in the absenceof overland flow was constructed by modifying an approach developed by Reeve (1982)and parameterizing it with measurements from single-drop laboratory experiments andsimulated rainfall on a grassland in East Africa. The equation relates rain splash to hillslopegradient, the median raindrop diameter of a storm, and ground cover density; the effect ofsoil texture on detachability can be incorporated from other published results. The spatialand temporal applicability of such an equation for rain splash transport in the absence ofoverland flow on uncultivated hillslopes can be estimated from hydrological calculations.The predicted transport is lower than landscape-averaged geologic erosion rates fromKenya but is large enough to modify short, slowly eroding natural hillslopes as well asmicrotopographic interrill surfaces between which overland flow transports the mobilizedsediment.
Citation: Dunne, T., D. V. Malmon, and S. M. Mudd (2010), A rain splash transport equation assimilating field and laboratory
measurements, J. Geophys. Res., 115, F01001, doi:10.1029/2009JF001302.
1. Models of Hillslope Evolution
[2] Hillslope evolution under transport-limited conditionsis usually modeled as the result of one-dimensional sedimenttransport, represented by the mass balance equation
@z
@t¼ � 1
rb
@Qs
@xð1Þ
where @z/@t is the local rate of elevation change (m�1 a�1),x is horizontal distance, rb is the sediment bulk density(kg m�3), and Qs is the mass transport rate of sediment perunit width of hillslope (kg m�1 a�1). Much of the work usingequation (1) has been concerned with possible forms ofequations for Qs, and with the hillslope profiles such equa-tions predict when subject to chosen boundary conditions[Culling, 1960; Hirano, 1969; Kirkby, 1971]. Ahnert [1976,1987], Kirkby [1985, 1989], and Willgoose et al. [1991]incorporated the mass balance equation into numericalsimulations of landscape evolution for a range of processesand boundary conditions such as base-level control.[3] The theoretical work challenged geomorphologists
to develop formulae relating sediment transport to its controlsin order to quantify analyses of the geomorphic effects ofclimate, hydrology, vegetation, material properties, tectonism,
and time. Field and laboratory measurements of the sedimenttransport processes responsible for landform evolution haveaccumulated more slowly than the theoretical developments.They are necessary for understanding actual magnitudes andrates of geomorphic change, the relative roles and interac-tions of various processes, and the influence of environmen-tal factors on rates of landform change and sedimentproduction. Yet Dietrich et al. [2003] concluded that geo-morphology has made little progress in developing process-based sediment transport equations for modeling landformevolution.[4] Here we construct a transport equation for aerial rain
splash, including particle creep along the surface, in theabsence of overland flow. It is based on field experimentson grass-covered hillslopes in Kenya, laboratory experimentsby us and others, and modification and generalization of apublished model of particle trajectories. The equation isrelevant to those events and portions of a landscape in whichrain splash molds hillslopes, and, with some modification, tothose parts of landscapes that contribute rain splash to rainflow transport [Moss et al., 1979] in the form of interrillerosion [Meyer et al., 1975].[5] Rain splash transport is usually represented in
equation (1) by an equation of the form
Qs ¼ rbKdz
dx
��������b ð2Þ
In the most common applications of this equation b isassumed to be 1.0, leading to the combination of equations (1)and (2) into a topographic diffusion equation [Culling, 1960],and K represents the environmental factors that controltransport intensity. This paper examines the functional form
JOURNAL OF GEOPHYSICAL RESEARCH, VOL. 115, F01001, doi:10.1029/2009JF001302, 2010ClickHere
for
FullArticle
1Donald Bren School of Environmental Science and Management,University of California, Santa Barbara, California, USA.
2Department of Earth Science, University of California, Santa Barbara,California, USA.
3U.S. Geological Survey, Menlo Park, California, USA.4School of Geosciences, University of Edinburgh, Edinburgh, UK.
Copyright 2010 by the American Geophysical Union.0148-0227/10/2009JF001302$09.00
F01001 1 of 16
of the transport equation for rain splash, but its main focus isquantification of the magnitude of sediment transport and theenvironmental factors that control K for this simplest ofhillslope sediment transport processes.
2. Sediment Transport Equations for Rain Splash
[6] On intensively managed land surfaces, erosion byflowing water is prevalent, and although rain splash is theprimary agent detaching soil, overland flow between andwithin rills is the dominant transport mechanism [Young andWiersma, 1973; Moss et al., 1979]. Hence, in agriculturalengineering the role of raindrop impact has usually beenincorporated into sediment transport equations for ‘‘interrillerosion,’’ which involves soil detachment by raindrops andtransport by thin films of runoff [Meyer et al., 1975; Foster,1982; Lane et al., 1992]. Experiments on these surfaces andon loose sediments in laboratories have shown that detach-ment and aerial transport by splash are affected by raindropsize, fall velocity, or kinetic energy; local gradient; surfacecover; and various soil properties [Ellison, 1944b; Sreenivaset al., 1947; Woodburn, 1948; Ekern, 1950; Morgan, 1978;Salles et al., 2000; Van Dijk et al., 2003]. Equations forsediment transport per unit contour width, were not usuallydeveloped from those studies.[7] Geomorphologists have been interested in the morpho-
genetic role of rain splash under a wider range of environ-mental conditions, including natural landscapes where plantcover and soil structure limit overland flow, and thus whereaerial rain splash transport may contribute significantly tohillslope erosion over long time periods. For example, ongrass-covered, sandy soils of the western Congo, De Ploeyand Savat [1968, p. 175] concluded that raindrop impactand ‘‘diffuse, discontinuous flow’’ were responsible forerosion, but hillslope evolution was essentially determinedby splash. Mosley [1973] observed splash transport withoutrunoff during an intense storm on convex badland dividesin Wyoming, and conducted laboratory experiments to con-struct a rain splash transport equation with which he simu-lated the evolution of the convexities. Imeson [1977] andKwaad [1977] demonstrated that rain splash (aerial andsurface creep) was an important mechanism transportingstony loam colluvium down forested slopes in the ArdennesMountains.[8] Several geomorphologists have used rainfall simula-
tors or single-drop formers and high-speed photographyand videography in the laboratory to develop transport equa-tions for single drop sizes, single particle sizes, and bare soil[De Ploey and Savat, 1968; Mosley, 1973; McCarthy, 1980;Poesen and Savat, 1981; Furbish et al., 2007]. The presentstudy extends this methodology to some of the complexitiesof natural hillslope surfaces and climates by incorporating theeffects of plant cover and a distribution of raindrop sizes.[9] Splash transport equations based on field measure-
ments of mixed grain size soils would be more attractivebut are problematic because of uncertainties in knowledge ofnatural rainfall and surface characteristics, the complicatinginfluence of surface runoff, the variability of grain sizes, andthe difficulty of making accurate measurements of splashtransport in the field. However, Poesen [1986] measuredsplash transport of bare soils on cultivated, 14�–23� slopesof by means of splash samplers and the resistance to splash
detachment with small splash cups. He found that the field-measured splash transport rates on bare sands and loams agreedwell with those estimated from his laboratory-generatedtransport equation based on repacked soils, as did those fromseveral other field studies of disturbed, bare soils.[10] The status of sediment transport formulae for aerial
rain splash can be summarized as follows. The functionalform of the sediment transport equation for aerial rain splashis known approximately: transport is proportional to a powerof gradient (b in equation (2)) lying between 0.6 and 1.1.However, the intensity of splash transport, represented by Kin equation (2), for a given drop size and cover density is noteasily predicted.[11] The intensity of rain splash, measured as the amount
of sediment detached from a smooth, bare surface by a unit ofraindrop kinetic energy, drop size, or other index of erosivityhas been widely measured. In the absence of high organicmatter or other binding agent, detachability is related tomedian grain size, though not monotonically [Poesen andSavat, 1981]. For rainfall of uniform raindrop diameter thedetachment rate per unit of kinetic energy was not linear forall soils [Poesen, 1985]. McCarthy [1980] showed thatsplashed mass was strongly related to both drop diameterand particle size in sands.Mosley’s [1973] laboratory experi-ments showed a sixfold increase in detachment over the range0�–25�, whereas field measurements by Froehlich andSlupik [1980, p. 95] indicated a two to threefold increaseover 0�–20�, and the laboratory experiments of McCarthy[1980, p. 106] and Furbish et al. [2007, Figure 9] revealedlittle or no effect of slope on detachment for loose sands. Theonly information on distances of splash [McCarthy, 1980;Poesen and Savat, 1981; Mouzai and Bouhadef, 2003;Furbish et al., 2007] also relates to smooth, bare surfaces.There is general agreement about the fractions of detachedmaterial that splash up and downslope on a bare surface[Poesen, 1985], although there appears to be a differencebetween sand and coarser particles [Mosley, 1973]. Furbishet al. [2007] provided a physical explanation for this fraction,based upon the upslope-downslope partitioning of dropmomentum. Although detachment has been measured undervarious densities of plant cover [e.g., Ellison, 1948] and litter[e.g., Tsukamoto, 1966], quantitative relations between plantcover density and detachment have not been defined, itusually being assumed that splash occurs only from barepatches of soil. However, Furbish et al. [2009] have recentlydeveloped a model of the exchange of sand particles betweenshrub-stabilized mounds and the surrounding surface as aresult of the spatial gradient of raindrop intensity around thecenter of the shrub.
3. Aims of the Study
[12] The study was designed with the following aims:[13] 1. To measure rates of aerial rain splash transport
under field conditions. The interaction of splash and overlandflow was specifically avoided. Raindrop size, gradient, andgrass cover density were varied between experiments on asingle soil type.[14] 2. To assimilate the resulting relations into a sediment
transport equation for splash transport per rainstorm for thepurposes of modeling hillslope evolution.
F01001 DUNNE ET AL.: A RAIN SPLASH TRANSPORT EQUATION
2 of 16
F01001
[15] Our purpose is to develop a transport equation for theone-dimensional modeling of hillslope evolution over pre-human, morphogenetic time scales, which requires thatparameterization of vegetation and rainfall effects be limitedto features that can be estimated from coarse-grained paleo-environmental data. Also, we avoided agricultural soils,where tillage creates soil structures that evolve rapidlythrough crusting early in a rainstorm, which we have notobserved in rainfall simulation experiments on more natural(though still grazed) clay/sand mixtures in Kenya grasslands.Although such effects have not been reported in other rainsplash experiments, it is reasonable to anticipate that theymight be important under some circumstances, particularlyon bare, silt-rich soils.
4. Field Site
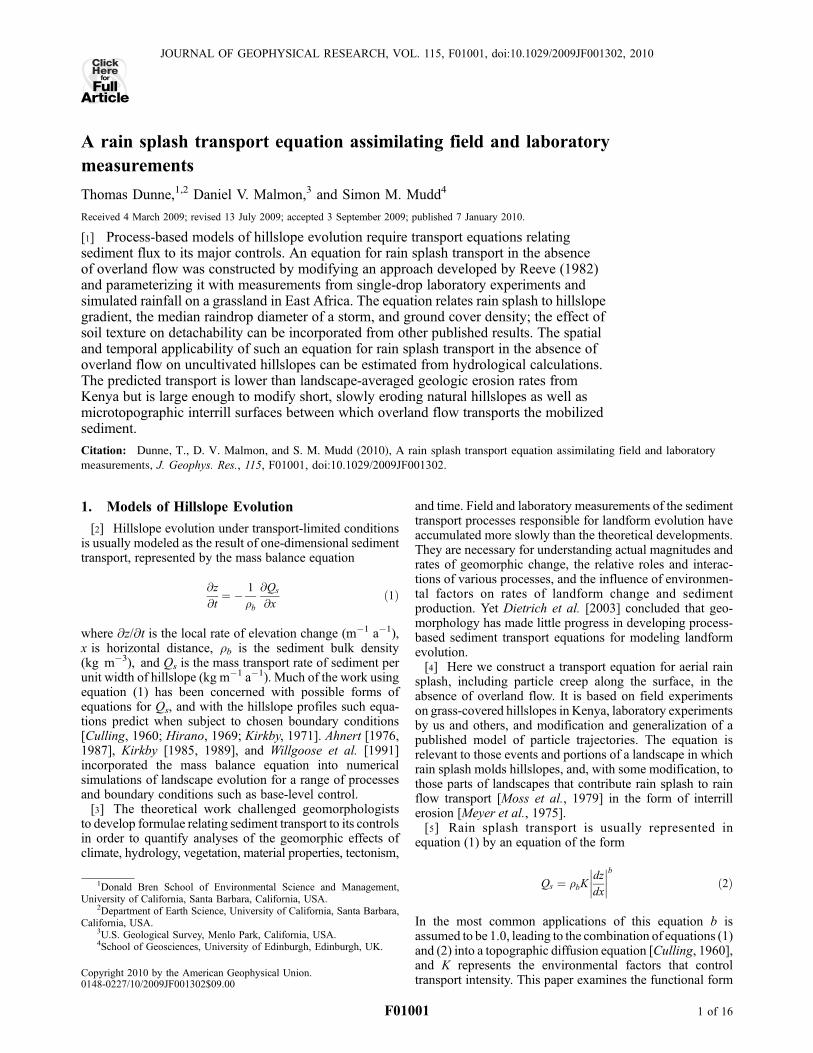
[16] Experiments were conducted on grassland at EremitoRidge in Amboseli National Park, 150 km SE of Nairobi,Kenya [Dunne and Dietrich, 1980a]. The average gradient ofthe ridge is 0.02, with local variations of 0.012–0.12. Theridge is covered by a sandy clay loam with an organic contentless then 1% and a bulk density of 1300–1600 kg m�3. Thetopsoil of the plots was poorly aggregated with a blocky,subangular structure and many fine pores. The surface layer(�5 mm deep) had an average grain size distribution illus-trated in Figure 1. Sampling of the surface layer upslope anddownslope of each splash sampler before and after theexperiments indicated changes of only a few percent withinany size class and no consistent coarsening or fining duringthe brief experiments. Although the surface contained�27%of silt and clay, the only visible aggregates were of sand size.Infiltration capacity at a point varied between 1 and 8 cm h�1
with rainfall intensity and vegetation cover density [Dunneet al., 1991].
[17] Mean annual rainfall at the site is �25–30 cm,concentrated in two seasons of 30–60 days duration sepa-rated by long dry seasons. The plant cover is clumped grass(Aristida candiensis, Chloris rhoxburgiana, Sporobulus can-diensis), grazed by wild herbivores and livestock. It variesseasonally and between years with rainfall and grazingpressure, and at the time of the experiments was 1–10 cmhigh with occasional stems rising to 20 cm. At the time of ourexperiments, during the dry season, small plots could beselected with cover densities ranging from 0.01 to 0.88.
5. Field Methods
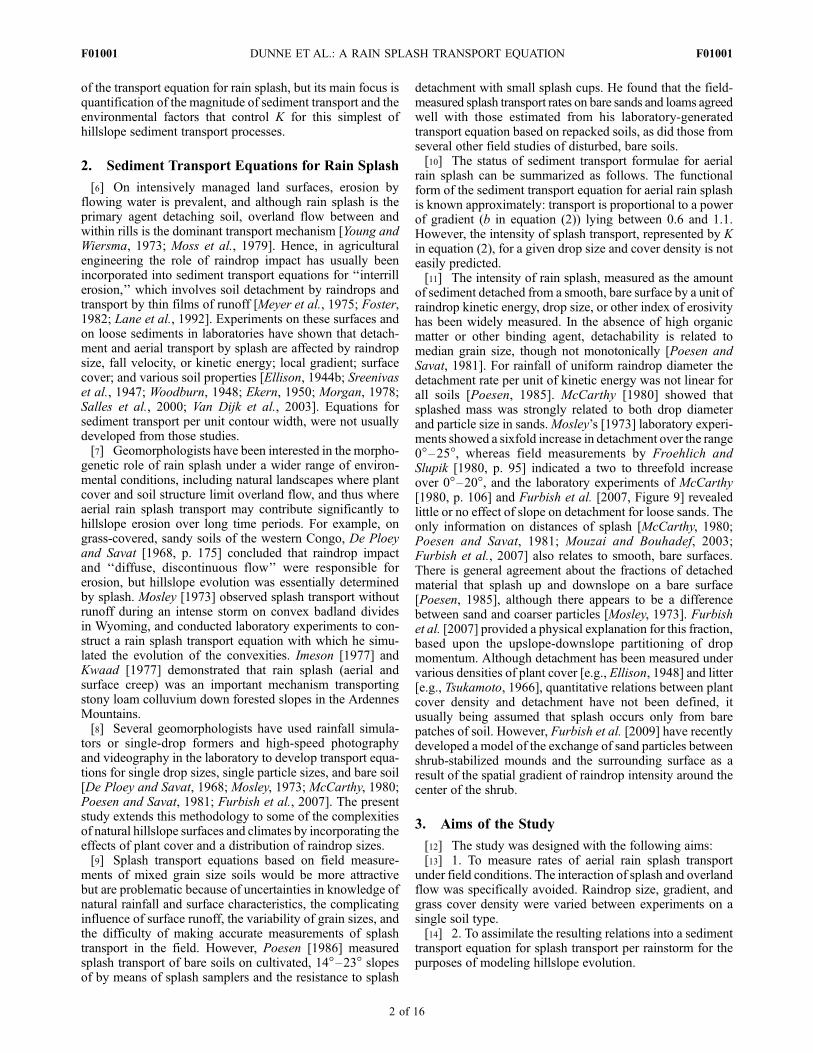
[18] Three pairs of Ellison [1944a] splash samplers(Figure 2) were installed back-to-back, parallel to the contourbeneath a rainfall simulator. The goal of the experiment wasto measure the mass of sediment splashed across the front lipsof the catch pans on the upslope and downslope sides of eachsampler to yield a net mass flux per unit width of hillslope.The vertical board of the sampler between each pair of catchpans was 30 cm high and 15 cm wide. The samplers weredifferent from the original design in one way. Ellison’s[1944a] original sampler had a catch pan 1.25 cm wide inthe slope-parallel direction and 9.5 cm deep, and with a lipthat protruded 1.25 cm above the soil surface. To obtain asclose a fit to the soil surface as possible, the lip of our catchpan was set at the ground surface, and to minimize breakageof the brittle topsoil during excavation, the catch pan depthwas limited to 1 cm. Each catch pan was 10 cm long in theslope-parallel direction. Splashing of sediment from the soilacross the sides of the panwas prevented by placing 8–10 cmhigh, porous bundles of thin sticks along the contour abuttingthe pan. Before each experiment, the pans were filled withwater to prevent sediment from being splashed out of the pan.After rainfall, a wash bottle was used to sluice all particlesfrom the 30 cm high vertical boards and the catch pans (whichwere removable from the assembly) into a storage bottle forfiltering, drying, and weighing.
Figure 1. Texture of the surface 5 mm of soil, averagedfrom 14 samples scraped from the surface upslope and down-slope of each splash collector before and after experiments onthe seven plots. There was no consistent relationship betweenmedian (d50) surface texture and either gradient or vegetationcover density, although plot 2 was significantly finer (d50 =0.06 mm) than the other six plots, which had a mean d50 of0.21 (±0.05) mm.
Figure 2. Ellison splash samplers placed back-to-back.Bundles of sticks provide a porous surface that preventssplashed soil from entering over the side of the catch pan. Thebundle is shown on one side only for clarity.
F01001 DUNNE ET AL.: A RAIN SPLASH TRANSPORT EQUATION
3 of 16
F01001
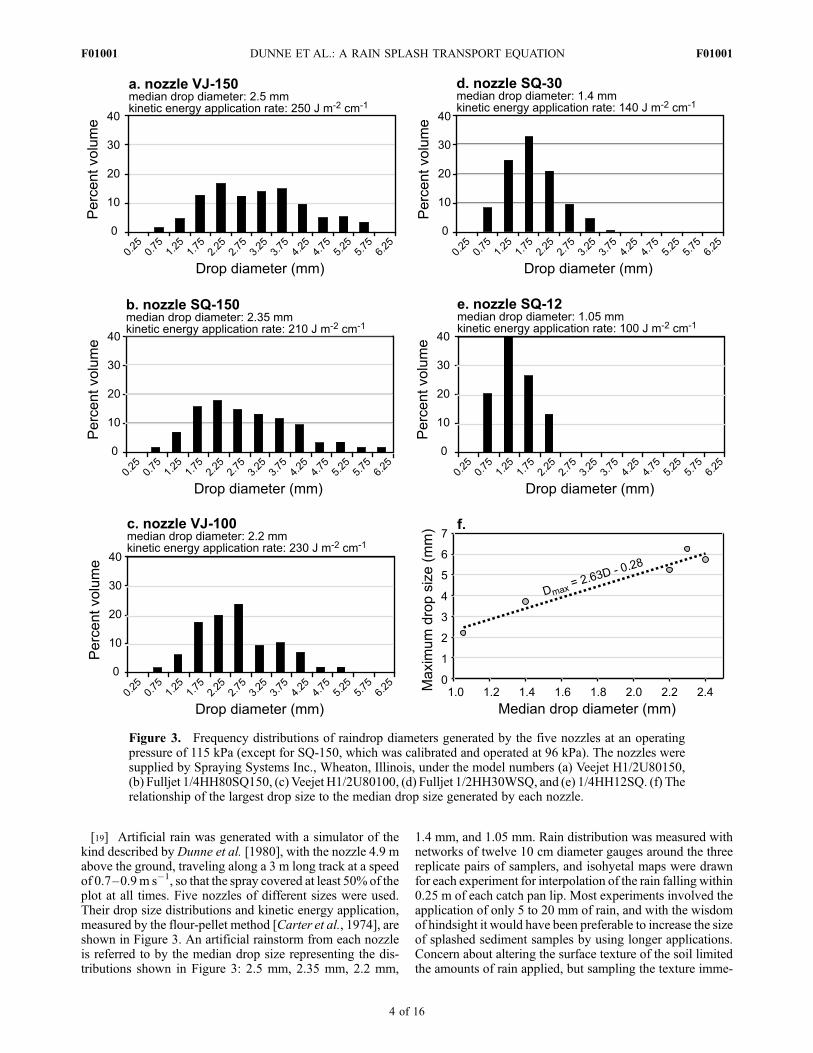
[19] Artificial rain was generated with a simulator of thekind described by Dunne et al. [1980], with the nozzle 4.9 mabove the ground, traveling along a 3 m long track at a speedof 0.7–0.9m s�1, so that the spray covered at least 50% of theplot at all times. Five nozzles of different sizes were used.Their drop size distributions and kinetic energy application,measured by the flour-pellet method [Carter et al., 1974], areshown in Figure 3. An artificial rainstorm from each nozzleis referred to by the median drop size representing the dis-tributions shown in Figure 3: 2.5 mm, 2.35 mm, 2.2 mm,
1.4 mm, and 1.05 mm. Rain distribution was measured withnetworks of twelve 10 cm diameter gauges around the threereplicate pairs of samplers, and isohyetal maps were drawnfor each experiment for interpolation of the rain falling within0.25 m of each catch pan lip. Most experiments involved theapplication of only 5 to 20 mm of rain, and with the wisdomof hindsight it would have been preferable to increase the sizeof splashed sediment samples by using longer applications.Concern about altering the surface texture of the soil limitedthe amounts of rain applied, but sampling the texture imme-
Figure 3. Frequency distributions of raindrop diameters generated by the five nozzles at an operatingpressure of 115 kPa (except for SQ-150, which was calibrated and operated at 96 kPa). The nozzles weresupplied by Spraying Systems Inc., Wheaton, Illinois, under the model numbers (a) Veejet H1/2U80150,(b) Fulljet 1/4HH80SQ150, (c) Veejet H1/2U80100, (d) Fulljet 1/2HH30WSQ, and (e) 1/4HH12SQ. (f) Therelationship of the largest drop size to the median drop size generated by each nozzle.
F01001 DUNNE ET AL.: A RAIN SPLASH TRANSPORT EQUATION
4 of 16
F01001
diately adjacent to the pans before and after each set ofexperiments revealed no measurable changes in texture andthere was no visible change in surface condition.[20] The plot surface was closely observed during each
application. At the first sign of the surface glistening fromwater accumulation, the nozzle was abruptly pulled to oneend of the plot and the spray was interrupted and restartedafter the surface had drained. In this way, we avoidedinteraction of raindrop impact with a surface water film,although we had no precise control over the moisture contentof the surface soil. There was no sign of water repellency atthe soil surface or of aggregate breakdown as the surface soilwas not aggregated at a visible scale.[21] Seven plots were used for the measurements (Table 1),
and on two of them (2 and 3) plant cover was reduced byclipping before some rainfall applications (measurementsafter clipping are indicated by ‘‘c’’ in Table 1). Plant coverdensity, including litter which provided only a small fractionof the cover, was measured as the average of visual estimatesby two to four observers with the aid of a 0.5 m squarequadrat sampler placed immediately upslope and downslopeof each catch pan [Greig-Smith, 1983]. Standard errorsamong observers and quadrats averaged 4.7% of the meancover density for each plot. The local gradient over 0.5 mintervals upslope and downslope of each splash samplerwas measured with an engineering level. The experimentsincluded variations in raindrop size, local gradient, and plantcover density on a single soil type, but only a limited set ofcombinations of gradient and cover could be found in thevicinity.[22] Composite samples of the upper 5 mm of soil on each
plot were collected for wet sieve analysis before and aftereach set of experiments, and 33 composite samples ofsplashed sediment from individual rainfall applications weresaved for grain size analysis in a settling tube.
6. Analysis of Splash Measurements
[23] Themass of sediment caught in each pan represented aflux through a 15 cm wide length of contour passing throughthe outer lip of the catch pan as a result of a certain number ofraindrop impacts within splashing range of the pan (5–10 cmby observation and calculation). The amount of sedimentsplashed by a fixed distribution of drop sizes should increaselinearly with the number of drops, and therefore with thedepth of rainfall in the absence of interactions between theimpacts and in the absence of a water film. Nonlinearrelationships between rainfall intensity and the amount orrate of soil splash, such as those reported by Ellison [1944b,
p. 181] and Gilley and Finkner [1985, p.144] presumablyresult from relationships between intensity and drop size,limitations on the detachment rate due to cohesion, or surfacewater accumulation. These effects were minimized in ourstudy. Thus, for each nozzle the mass of sediment passingthrough the 15 cm width was divided by the depth of rainfalling immediately upslope or downslope of the catch pan,and the splash transport was expressed in units of kg permeter of contour per cm of rain.[24] When the splash was plotted against local hillslope
gradient upslope or downslope of each pan, the resultsconfirmed our visual observations that extremely local (1–10 cm scale) variations in vegetation patchiness and micro-topography obscured any such relationship, given the narrowrange of gradient (0.012–0.12) that could be sampled at thefield site. Therefore, we combined all measured splashvalues, regardless of upslope or downslope direction, intoan analysis of the effects of raindrop characteristics andvegetation cover on the mass splashed, essentially treatingall of the gradients as zero. Thus, our field results relate onlyto the magnitude, rbK, of the fluxes in equation (2), and wedeveloped a theoretical slope function for partitioning trans-port upslope and downslope on gradients steeper than themeasurement sites (see later).[25] We tested the hypothesis that the mass of sediment
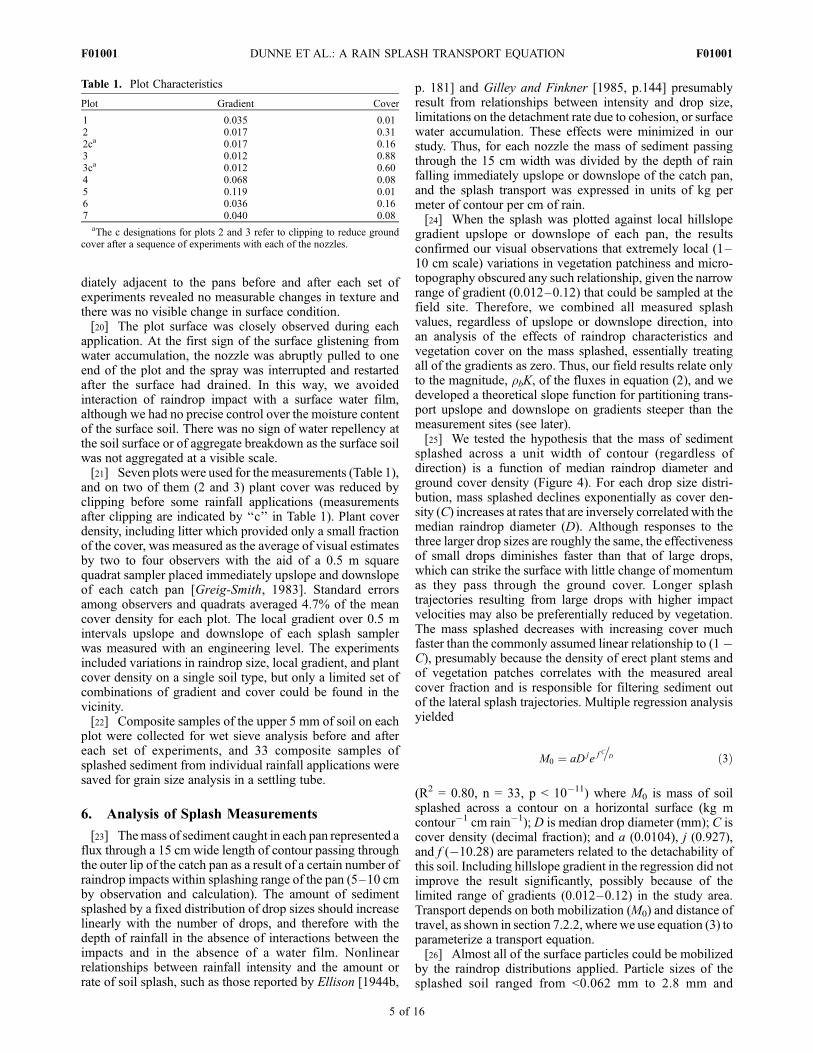
splashed across a unit width of contour (regardless ofdirection) is a function of median raindrop diameter andground cover density (Figure 4). For each drop size distri-bution, mass splashed declines exponentially as cover den-sity (C) increases at rates that are inversely correlated with themedian raindrop diameter (D). Although responses to thethree larger drop sizes are roughly the same, the effectivenessof small drops diminishes faster than that of large drops,which can strike the surface with little change of momentumas they pass through the ground cover. Longer splashtrajectories resulting from large drops with higher impactvelocities may also be preferentially reduced by vegetation.The mass splashed decreases with increasing cover muchfaster than the commonly assumed linear relationship to (1�C), presumably because the density of erect plant stems andof vegetation patches correlates with the measured arealcover fraction and is responsible for filtering sediment outof the lateral splash trajectories. Multiple regression analysisyielded
M0 ¼ aD je f C�D ð3Þ
(R2 = 0.80, n = 33, p < 10�11) where M0 is mass of soilsplashed across a contour on a horizontal surface (kg mcontour�1 cm rain�1); D is median drop diameter (mm); C iscover density (decimal fraction); and a (0.0104), j (0.927),and f (�10.28) are parameters related to the detachability ofthis soil. Including hillslope gradient in the regression did notimprove the result significantly, possibly because of thelimited range of gradients (0.012–0.12) in the study area.Transport depends on both mobilization (M0) and distance oftravel, as shown in section 7.2.2, where we use equation (3) toparameterize a transport equation.[26] Almost all of the surface particles could be mobilized
by the raindrop distributions applied. Particle sizes of thesplashed soil ranged from <0.062 mm to 2.8 mm and
Table 1. Plot Characteristics
Plot Gradient Cover
1 0.035 0.012 0.017 0.312ca 0.017 0.163 0.012 0.883ca 0.012 0.604 0.068 0.085 0.119 0.016 0.036 0.167 0.040 0.08
aThe c designations for plots 2 and 3 refer to clipping to reduce groundcover after a sequence of experiments with each of the nozzles.
F01001 DUNNE ET AL.: A RAIN SPLASH TRANSPORT EQUATION
5 of 16
F01001
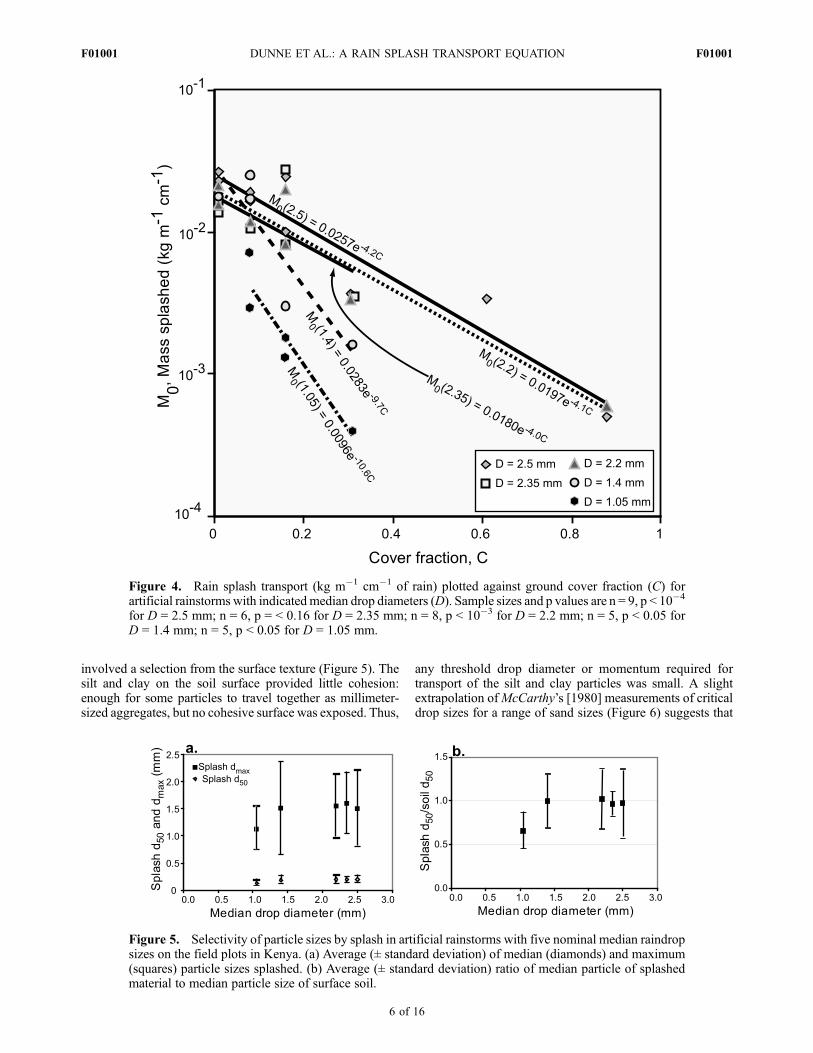
involved a selection from the surface texture (Figure 5). Thesilt and clay on the soil surface provided little cohesion:enough for some particles to travel together as millimeter-sized aggregates, but no cohesive surface was exposed. Thus,
any threshold drop diameter or momentum required fortransport of the silt and clay particles was small. A slightextrapolation ofMcCarthy’s [1980] measurements of criticaldrop sizes for a range of sand sizes (Figure 6) suggests that
Figure 4. Rain splash transport (kg m�1 cm�1 of rain) plotted against ground cover fraction (C) forartificial rainstorms with indicatedmedian drop diameters (D). Sample sizes and p values are n = 9, p < 10�4
for D = 2.5 mm; n = 6, p = < 0.16 for D = 2.35 mm; n = 8, p < 10�3 for D = 2.2 mm; n = 5, p < 0.05 forD = 1.4 mm; n = 5, p < 0.05 for D = 1.05 mm.
Figure 5. Selectivity of particle sizes by splash in artificial rainstorms with five nominal median raindropsizes on the field plots in Kenya. (a) Average (± standard deviation) of median (diamonds) and maximum(squares) particle sizes splashed. (b) Average (± standard deviation) ratio of median particle of splashedmaterial to median particle size of surface soil.
F01001 DUNNE ET AL.: A RAIN SPLASH TRANSPORT EQUATION
6 of 16
F01001
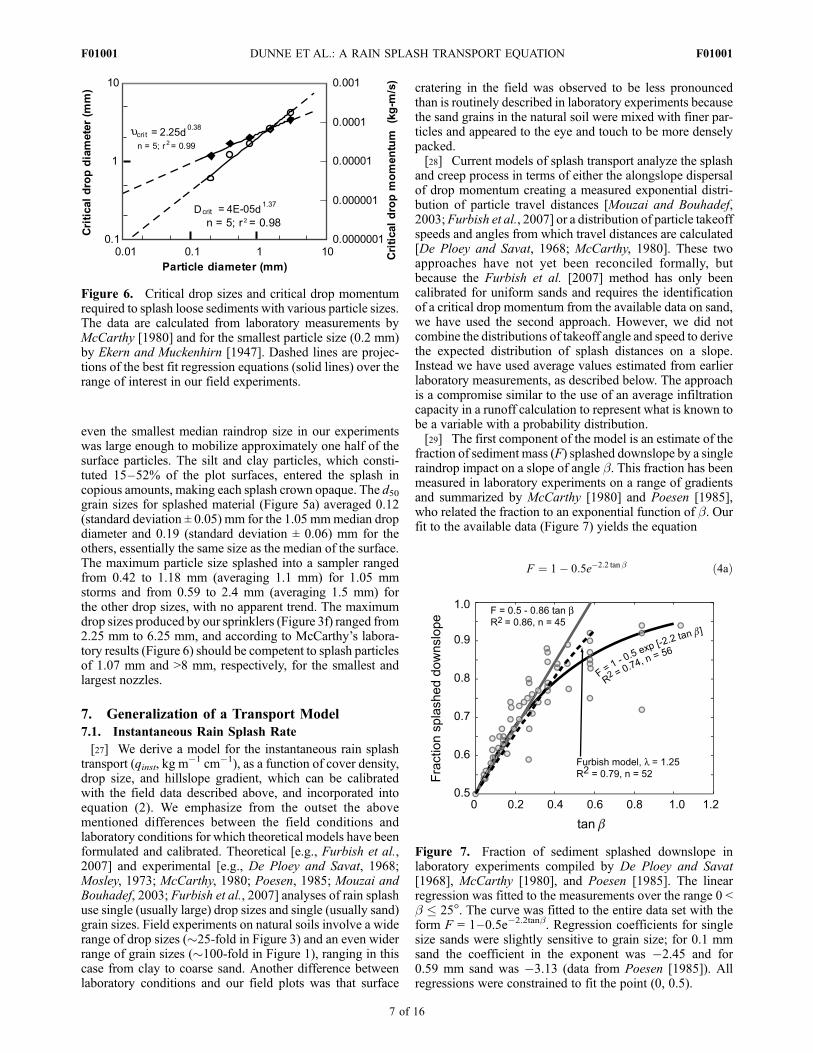
even the smallest median raindrop size in our experimentswas large enough to mobilize approximately one half of thesurface particles. The silt and clay particles, which consti-tuted 15–52% of the plot surfaces, entered the splash incopious amounts, making each splash crown opaque. The d50grain sizes for splashed material (Figure 5a) averaged 0.12(standard deviation ± 0.05) mm for the 1.05 mmmedian dropdiameter and 0.19 (standard deviation ± 0.06) mm for theothers, essentially the same size as the median of the surface.The maximum particle size splashed into a sampler rangedfrom 0.42 to 1.18 mm (averaging 1.1 mm) for 1.05 mmstorms and from 0.59 to 2.4 mm (averaging 1.5 mm) forthe other drop sizes, with no apparent trend. The maximumdrop sizes produced by our sprinklers (Figure 3f) ranged from2.25 mm to 6.25 mm, and according to McCarthy’s labora-tory results (Figure 6) should be competent to splash particlesof 1.07 mm and >8 mm, respectively, for the smallest andlargest nozzles.
7. Generalization of a Transport Model
7.1. Instantaneous Rain Splash Rate
[27] We derive a model for the instantaneous rain splashtransport (qinst, kg m
�1 cm�1), as a function of cover density,drop size, and hillslope gradient, which can be calibratedwith the field data described above, and incorporated intoequation (2). We emphasize from the outset the abovementioned differences between the field conditions andlaboratory conditions for which theoretical models have beenformulated and calibrated. Theoretical [e.g., Furbish et al.,2007] and experimental [e.g., De Ploey and Savat, 1968;Mosley, 1973; McCarthy, 1980; Poesen, 1985; Mouzai andBouhadef, 2003; Furbish et al., 2007] analyses of rain splashuse single (usually large) drop sizes and single (usually sand)grain sizes. Field experiments on natural soils involve a widerange of drop sizes (�25-fold in Figure 3) and an even widerrange of grain sizes (�100-fold in Figure 1), ranging in thiscase from clay to coarse sand. Another difference betweenlaboratory conditions and our field plots was that surface
cratering in the field was observed to be less pronouncedthan is routinely described in laboratory experiments becausethe sand grains in the natural soil were mixed with finer par-ticles and appeared to the eye and touch to be more denselypacked.[28] Current models of splash transport analyze the splash
and creep process in terms of either the alongslope dispersalof drop momentum creating a measured exponential distri-bution of particle travel distances [Mouzai and Bouhadef,2003;Furbish et al., 2007] or a distribution of particle takeoffspeeds and angles from which travel distances are calculated[De Ploey and Savat, 1968; McCarthy, 1980]. These twoapproaches have not yet been reconciled formally, butbecause the Furbish et al. [2007] method has only beencalibrated for uniform sands and requires the identificationof a critical drop momentum from the available data on sand,we have used the second approach. However, we did notcombine the distributions of takeoff angle and speed to derivethe expected distribution of splash distances on a slope.Instead we have used average values estimated from earlierlaboratory measurements, as described below. The approachis a compromise similar to the use of an average infiltrationcapacity in a runoff calculation to represent what is known tobe a variable with a probability distribution.[29] The first component of the model is an estimate of the
fraction of sediment mass (F) splashed downslope by a singleraindrop impact on a slope of angle b. This fraction has beenmeasured in laboratory experiments on a range of gradientsand summarized by McCarthy [1980] and Poesen [1985],who related the fraction to an exponential function of b. Ourfit to the available data (Figure 7) yields the equation
F ¼ 1� 0:5e�2:2 tan b ð4aÞ
Figure 6. Critical drop sizes and critical drop momentumrequired to splash loose sediments with various particle sizes.The data are calculated from laboratory measurements byMcCarthy [1980] and for the smallest particle size (0.2 mm)by Ekern and Muckenhirn [1947]. Dashed lines are projec-tions of the best fit regression equations (solid lines) over therange of interest in our field experiments.
Figure 7. Fraction of sediment splashed downslope inlaboratory experiments compiled by De Ploey and Savat[1968], McCarthy [1980], and Poesen [1985]. The linearregression was fitted to the measurements over the range 0 <b � 25�. The curve was fitted to the entire data set with theform F = 1–0.5e�2.2tanb. Regression coefficients for singlesize sands were slightly sensitive to grain size; for 0.1 mmsand the coefficient in the exponent was �2.45 and for0.59 mm sand was �3.13 (data from Poesen [1985]). Allregressions were constrained to fit the point (0, 0.5).
F01001 DUNNE ET AL.: A RAIN SPLASH TRANSPORT EQUATION
7 of 16
F01001
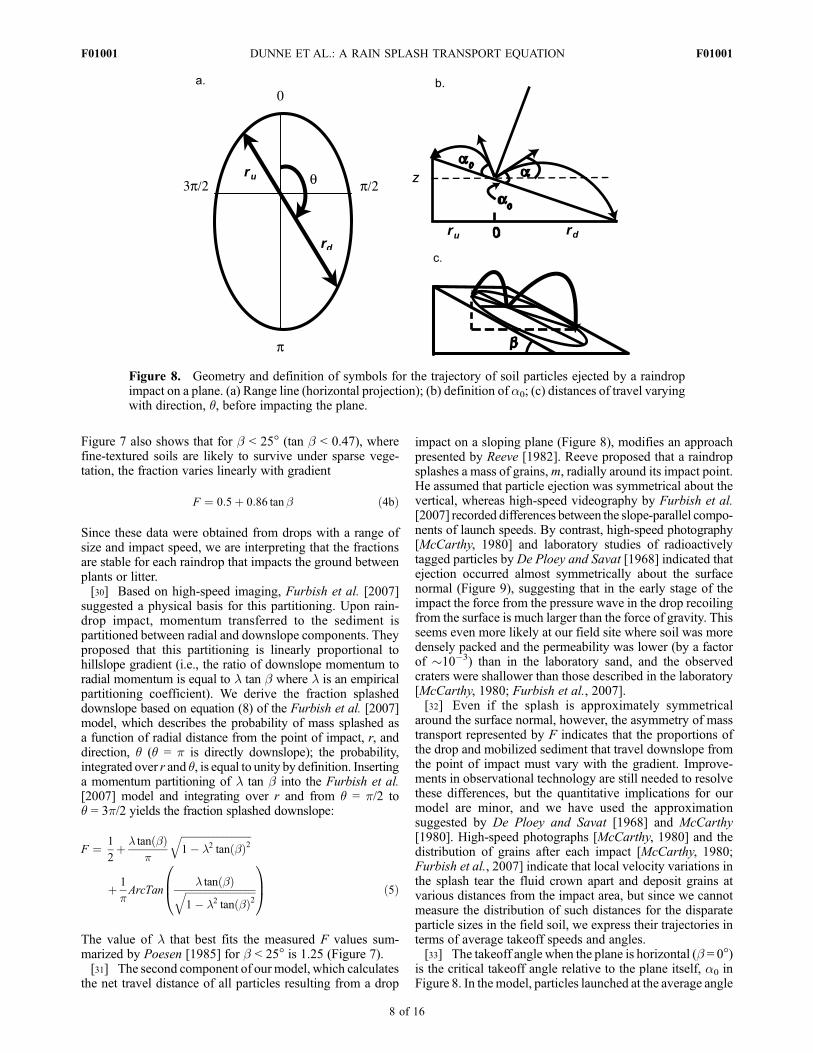
Figure 7 also shows that for b < 25� (tan b < 0.47), wherefine-textured soils are likely to survive under sparse vege-tation, the fraction varies linearly with gradient
F ¼ 0:5þ 0:86 tanb ð4bÞ
Since these data were obtained from drops with a range ofsize and impact speed, we are interpreting that the fractionsare stable for each raindrop that impacts the ground betweenplants or litter.[30] Based on high-speed imaging, Furbish et al. [2007]
suggested a physical basis for this partitioning. Upon rain-drop impact, momentum transferred to the sediment ispartitioned between radial and downslope components. Theyproposed that this partitioning is linearly proportional tohillslope gradient (i.e., the ratio of downslope momentum toradial momentum is equal to l tan b where l is an empiricalpartitioning coefficient). We derive the fraction splasheddownslope based on equation (8) of the Furbish et al. [2007]model, which describes the probability of mass splashed asa function of radial distance from the point of impact, r, anddirection, q (q = p is directly downslope); the probability,integrated over r and q, is equal to unity by definition. Insertinga momentum partitioning of l tan b into the Furbish et al.[2007] model and integrating over r and from q = p/2 toq = 3p/2 yields the fraction splashed downslope:
F ¼ 1
2þ l tanðbÞ
p
ffiffiffiffiffiffiffiffiffiffiffiffiffiffiffiffiffiffiffiffiffiffiffiffiffiffiffiffi1� l2 tanðbÞ2
q
þ 1
pArcTan
l tanðbÞffiffiffiffiffiffiffiffiffiffiffiffiffiffiffiffiffiffiffiffiffiffiffiffiffiffiffiffi1� l2 tanðbÞ2
q0B@
1CA ð5Þ
The value of l that best fits the measured F values sum-marized by Poesen [1985] for b < 25� is 1.25 (Figure 7).[31] The second component of our model, which calculates
the net travel distance of all particles resulting from a drop
impact on a sloping plane (Figure 8), modifies an approachpresented by Reeve [1982]. Reeve proposed that a raindropsplashes a mass of grains,m, radially around its impact point.He assumed that particle ejection was symmetrical about thevertical, whereas high-speed videography by Furbish et al.[2007] recorded differences between the slope-parallel compo-nents of launch speeds. By contrast, high-speed photography[McCarthy, 1980] and laboratory studies of radioactivelytagged particles by De Ploey and Savat [1968] indicated thatejection occurred almost symmetrically about the surfacenormal (Figure 9), suggesting that in the early stage of theimpact the force from the pressure wave in the drop recoilingfrom the surface is much larger than the force of gravity. Thisseems even more likely at our field site where soil was moredensely packed and the permeability was lower (by a factorof �10�3) than in the laboratory sand, and the observedcraters were shallower than those described in the laboratory[McCarthy, 1980; Furbish et al., 2007].[32] Even if the splash is approximately symmetrical
around the surface normal, however, the asymmetry of masstransport represented by F indicates that the proportions ofthe drop and mobilized sediment that travel downslope fromthe point of impact must vary with the gradient. Improve-ments in observational technology are still needed to resolvethese differences, but the quantitative implications for ourmodel are minor, and we have used the approximationsuggested by De Ploey and Savat [1968] and McCarthy[1980]. High-speed photographs [McCarthy, 1980] and thedistribution of grains after each impact [McCarthy, 1980;Furbish et al., 2007] indicate that local velocity variations inthe splash tear the fluid crown apart and deposit grains atvarious distances from the impact area, but since we cannotmeasure the distribution of such distances for the disparateparticle sizes in the field soil, we express their trajectories interms of average takeoff speeds and angles.[33] The takeoff angle when the plane is horizontal (b = 0�)
is the critical takeoff angle relative to the plane itself, a0 inFigure 8. In themodel, particles launched at the average angle
Figure 8. Geometry and definition of symbols for the trajectory of soil particles ejected by a raindropimpact on a plane. (a) Range line (horizontal projection); (b) definition of a0; (c) distances of travel varyingwith direction, q, before impacting the plane.
F01001 DUNNE ET AL.: A RAIN SPLASH TRANSPORT EQUATION
8 of 16
F01001
and speed come to rest where their trajectories intersect theground surface, and do not rebound upon contact with theslope. Our close field observations confirmed the lack ofrebound. Reeve [1982] derived an expression for the ‘‘rangeline,’’ the horizontal projection of the closed curve, r(q),representing the termini of all the particles splashed by araindrop on a plane of slope angle b (Figures 8a and 8c),where r is the radial distance of splash and q is the direction incylindrical coordinates, taken as zero in the upslope directionand increasing clockwise. This range line is a notional one,reflecting the average distances that would be traveled byparticles with the average takeoff speed vt and angle, a0.
[34] Like Reeve [1982], we solve the ballistic trajectory ofsplashed sediment particles by the application of Newton’ssecond law in three dimensions. The resulting range linediffers from that of Reeve [1982] because we use the surfacenormal as the axis of symmetry of the splash. Our derivationof the range line is
r ¼v2t 2 cos q secb sina0 tanb þ
ffiffiffi2p ffiffiffiffiffiffiffiffiffiffiffiffiffiffiffiffiffiffiffiffiffiffiffiffiffiffiffiffiffiffiffiffiffiffiffiffiffiffiffiffiffiffiffiffiffiffiffiffiffiffiffiffiffiffiffiffiffiffiffiffiffiffiffiffiffiffiffiffiffiffiffi
1þ cosð2a0Þ sec2 b þ cosð2qÞ tan2 bp� �
gðcos2 q sec2 b þ sin2 qÞ cosb cos eca0
ð6Þ
[35] Reeve [1982] showed that the upslope flux of sedi-ment (sup) across a length L of hillslope contour per unit ofrainfall is
sup ¼imL
2p
Z p=2
p=2
r cos qdq ð7Þ
and the downslope flux (sd) is
sd ¼ �imL
2p
Z 3p=2
p=2
r cos qdq ð8Þ
where i represents the number of raindrops per unit rainfalldepth per unit area and m is the mass splashed by each drop.Each integral contains the area in the horizontal plane that lieswithin splash range, r(q), of the unit length of contour (orcollector) and therefore also indicates the volume of waterthat falls onto that area in a rainfall of unit depth. The netdownslope transport per unit of contour length results fromthe difference between equations (7) and (8):
qinst ¼sd � su
Lð9Þ
[36] In our analysis the flux is weighted by the proportionsof mass splashed up and downslope according to equation (4)or (5). The available data on slope-wise partitioning of thesplashed mass do not allow the splashed fraction to bespecified as a function of q and incorporated directly intothe integrals of equations (7) and (8). Instead, we make the
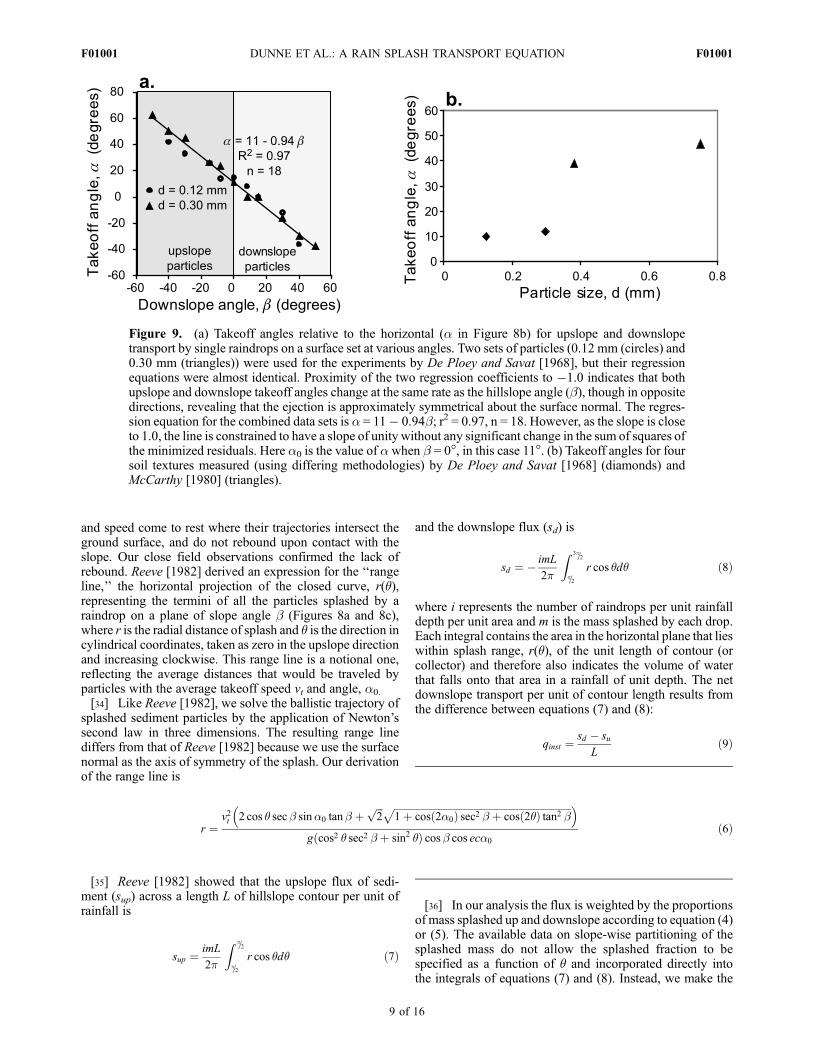
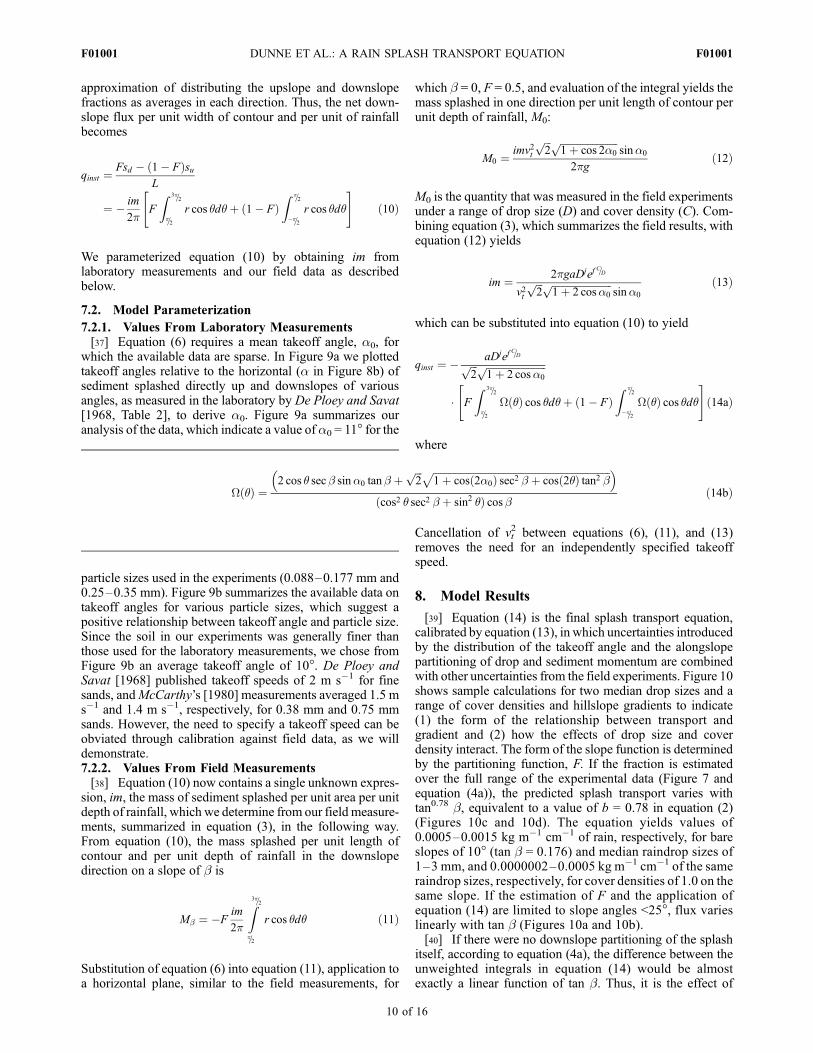
Figure 9. (a) Takeoff angles relative to the horizontal (a in Figure 8b) for upslope and downslopetransport by single raindrops on a surface set at various angles. Two sets of particles (0.12 mm (circles) and0.30 mm (triangles)) were used for the experiments by De Ploey and Savat [1968], but their regressionequations were almost identical. Proximity of the two regression coefficients to �1.0 indicates that bothupslope and downslope takeoff angles change at the same rate as the hillslope angle (b), though in oppositedirections, revealing that the ejection is approximately symmetrical about the surface normal. The regres-sion equation for the combined data sets is a = 11� 0.94b; r2 = 0.97, n = 18. However, as the slope is closeto 1.0, the line is constrained to have a slope of unity without any significant change in the sum of squares ofthe minimized residuals. Here a0 is the value of awhen b = 0�, in this case 11�. (b) Takeoff angles for foursoil textures measured (using differing methodologies) by De Ploey and Savat [1968] (diamonds) andMcCarthy [1980] (triangles).
F01001 DUNNE ET AL.: A RAIN SPLASH TRANSPORT EQUATION
9 of 16
F01001
approximation of distributing the upslope and downslopefractions as averages in each direction. Thus, the net down-slope flux per unit width of contour and per unit of rainfallbecomes
qinst ¼Fsd � ð1� FÞsu
L
¼ � im
2pF
Z 3p=2
p=2
r cos qdqþ ð1� FÞZ p=2
�p=2
r cos qdq
" #ð10Þ
We parameterized equation (10) by obtaining im fromlaboratory measurements and our field data as describedbelow.
7.2. Model Parameterization
7.2.1. Values From Laboratory Measurements[37] Equation (6) requires a mean takeoff angle, a0, for
which the available data are sparse. In Figure 9a we plottedtakeoff angles relative to the horizontal (a in Figure 8b) ofsediment splashed directly up and downslopes of variousangles, as measured in the laboratory by De Ploey and Savat[1968, Table 2], to derive a0. Figure 9a summarizes ouranalysis of the data, which indicate a value of a0 = 11� for the
particle sizes used in the experiments (0.088–0.177 mm and0.25–0.35 mm). Figure 9b summarizes the available data ontakeoff angles for various particle sizes, which suggest apositive relationship between takeoff angle and particle size.Since the soil in our experiments was generally finer thanthose used for the laboratory measurements, we chose fromFigure 9b an average takeoff angle of 10�. De Ploey andSavat [1968] published takeoff speeds of 2 m s�1 for finesands, andMcCarthy’s [1980] measurements averaged 1.5 ms�1 and 1.4 m s�1, respectively, for 0.38 mm and 0.75 mmsands. However, the need to specify a takeoff speed can beobviated through calibration against field data, as we willdemonstrate.7.2.2. Values From Field Measurements[38] Equation (10) now contains a single unknown expres-
sion, im, the mass of sediment splashed per unit area per unitdepth of rainfall, which we determine from our field measure-ments, summarized in equation (3), in the following way.From equation (10), the mass splashed per unit length ofcontour and per unit depth of rainfall in the downslopedirection on a slope of b is
Mb ¼ �Fim
2p
Z3p=2p=2
r cos qdq ð11Þ
Substitution of equation (6) into equation (11), application toa horizontal plane, similar to the field measurements, for
which b = 0, F = 0.5, and evaluation of the integral yields themass splashed in one direction per unit length of contour perunit depth of rainfall, M0:
M0 ¼imv2t
ffiffiffi2p ffiffiffiffiffiffiffiffiffiffiffiffiffiffiffiffiffiffiffiffiffiffiffi
1þ cos 2a0
psina0
2pgð12Þ
M0 is the quantity that was measured in the field experimentsunder a range of drop size (D) and cover density (C). Com-bining equation (3), which summarizes the field results, withequation (12) yields
im ¼ 2pgaDjefC=D
v2tffiffiffi2p ffiffiffiffiffiffiffiffiffiffiffiffiffiffiffiffiffiffiffiffiffiffiffiffi
1þ 2 cosa0
psina0
ð13Þ
which can be substituted into equation (10) to yield
qinst ¼ �aDjef
C=Dffiffiffi2p ffiffiffiffiffiffiffiffiffiffiffiffiffiffiffiffiffiffiffiffiffiffiffiffi
1þ 2 cosa0
p
� F
Z 3p=2
p=2
W qð Þ cos qdqþ ð1� FÞZ p=2
�p=2
W qð Þ cos qdq" #
ð14aÞ
where
W qð Þ ¼2 cos q secb sina0 tanb þ
ffiffiffi2p ffiffiffiffiffiffiffiffiffiffiffiffiffiffiffiffiffiffiffiffiffiffiffiffiffiffiffiffiffiffiffiffiffiffiffiffiffiffiffiffiffiffiffiffiffiffiffiffiffiffiffiffiffiffiffiffiffiffiffiffiffiffiffiffiffiffiffiffiffiffiffi
1þ cosð2a0Þ sec2 b þ cosð2qÞ tan2 bp� �
ðcos2 q sec2 b þ sin2 qÞ cosbð14bÞ
Cancellation of vt2 between equations (6), (11), and (13)
removes the need for an independently specified takeoffspeed.
8. Model Results
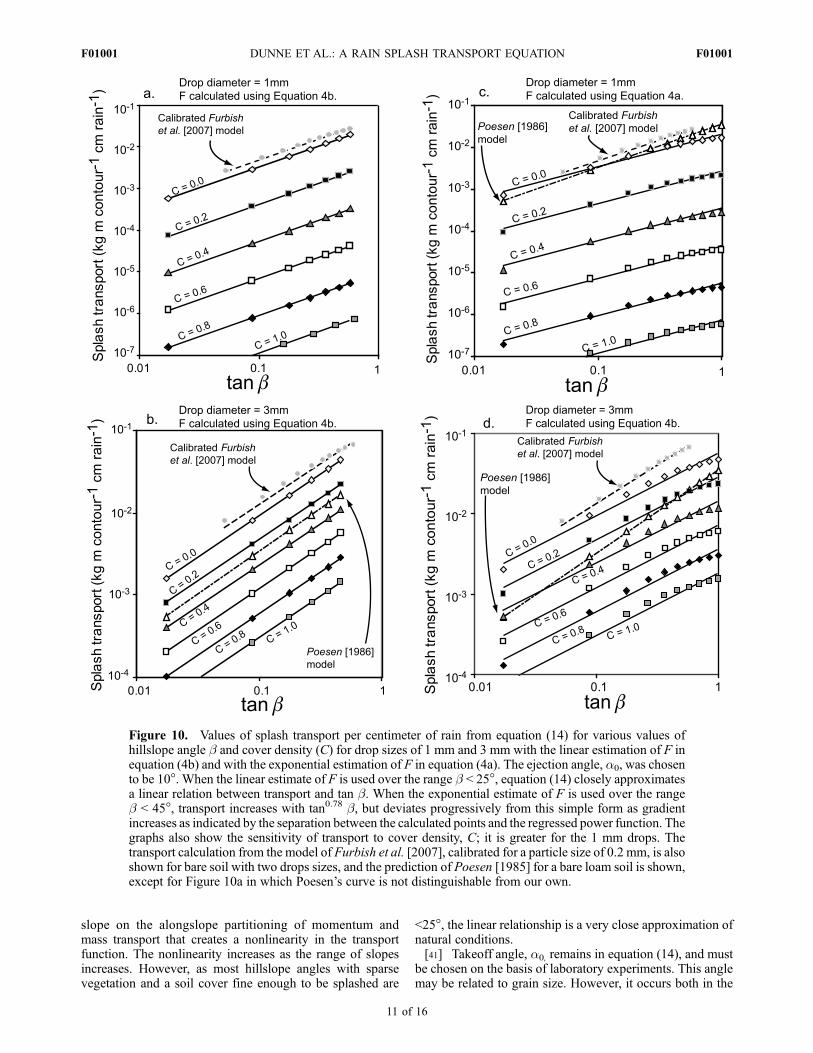
[39] Equation (14) is the final splash transport equation,calibrated by equation (13), in which uncertainties introducedby the distribution of the takeoff angle and the alongslopepartitioning of drop and sediment momentum are combinedwith other uncertainties from the field experiments. Figure 10shows sample calculations for two median drop sizes and arange of cover densities and hillslope gradients to indicate(1) the form of the relationship between transport andgradient and (2) how the effects of drop size and coverdensity interact. The form of the slope function is determinedby the partitioning function, F. If the fraction is estimatedover the full range of the experimental data (Figure 7 andequation (4a)), the predicted splash transport varies withtan0.78 b, equivalent to a value of b = 0.78 in equation (2)(Figures 10c and 10d). The equation yields values of0.0005–0.0015 kg m�1 cm�1 of rain, respectively, for bareslopes of 10� (tan b = 0.176) and median raindrop sizes of1–3 mm, and 0.0000002–0.0005 kg m�1 cm�1 of the sameraindrop sizes, respectively, for cover densities of 1.0 on thesame slope. If the estimation of F and the application ofequation (14) are limited to slope angles <25�, flux varieslinearly with tan b (Figures 10a and 10b).[40] If there were no downslope partitioning of the splash
itself, according to equation (4a), the difference between theunweighted integrals in equation (14) would be almostexactly a linear function of tan b. Thus, it is the effect of
F01001 DUNNE ET AL.: A RAIN SPLASH TRANSPORT EQUATION
10 of 16
F01001
slope on the alongslope partitioning of momentum andmass transport that creates a nonlinearity in the transportfunction. The nonlinearity increases as the range of slopesincreases. However, as most hillslope angles with sparsevegetation and a soil cover fine enough to be splashed are
<25�, the linear relationship is a very close approximation ofnatural conditions.[41] Takeoff angle, a0, remains in equation (14), and must
be chosen on the basis of laboratory experiments. This anglemay be related to grain size. However, it occurs both in the
Figure 10. Values of splash transport per centimeter of rain from equation (14) for various values ofhillslope angle b and cover density (C) for drop sizes of 1 mm and 3 mm with the linear estimation of F inequation (4b) and with the exponential estimation of F in equation (4a). The ejection angle, a0, was chosento be 10�. When the linear estimate of F is used over the range b < 25�, equation (14) closely approximatesa linear relation between transport and tan b. When the exponential estimate of F is used over the rangeb < 45�, transport increases with tan0.78 b, but deviates progressively from this simple form as gradientincreases as indicated by the separation between the calculated points and the regressed power function. Thegraphs also show the sensitivity of transport to cover density, C; it is greater for the 1 mm drops. Thetransport calculation from the model of Furbish et al. [2007], calibrated for a particle size of 0.2 mm, is alsoshown for bare soil with two drops sizes, and the prediction of Poesen [1985] for a bare loam soil is shown,except for Figure 10a in which Poesen’s curve is not distinguishable from our own.
F01001 DUNNE ET AL.: A RAIN SPLASH TRANSPORT EQUATION
11 of 16
F01001
integral and in the denominator of the coefficient inequation (14) and thus has offsetting effects on flux rateand the exponent b in equation (2). As particle size increasesfrom 0.1 to 0.2 mm to 0.4 mm, the sparse data in Figure 9bsuggest that a0 might increase from 10� to as much as 47�,which reduces the flux in equation (14) by�50%, if the linearestimate of F is used.[42] Only a few comparisons can be made of this equation
with independent measurements from other sites with baresoil. Poesen [1986] published a summary of his own andother splash measurements, finding that the field measure-ments on bare tilled soil, bare patches of forest soils, andunpaved roads agreed well his transport equation. Thisequation, added as a dashed line to Figure 10, agrees almostexactly with our equation for a 1 mm raindrop and predicts40% of our value for a 3 mm drop, if we use a bare soil with adetachability value (mass splashed per unit of rainfall kineticenergy) of 0.000588 kg J�1 for a ‘‘loamy soil’’ frommeasure-ments by Poesen and Savat [1981] and kinetic energy valuesfor these drop sizes from our own rainfall simulator.[43] We have also calibrated the Furbish et al. [2007]
model for comparison with equation (14). Rather than a fallline, the Furbish et al. [2007] model describes sedimentejection after drop impact as a probability distribution that is afunction of the radial distance and angle about the center ofimpact. Two parameters must be calibrated in this model. Thefirst is l in equation (5) above, which describes partitioningof momentum between radial and downslope components.Using data compiled from Poesen [1985] and Furbish et al.[2007], we found l to be 1.25 for b < 25�. The secondparameter, m0, describes the mean distance traveled byejected sediment. Furbish et al. [2007] found that m0 variedfrom 2 to 4cm for drops between 2 and 4 mm and sedimentparticles between 0.35 and 0.85 mm.[44] After determining the mass splashed by individual
raindrops we transformed the probability distributions pre-dicted by Furbish et al. [2007] into mass splashed across aunit length of contour. The mass splashed per drop has beenobserved by a number of authors to be a function of the dropmomentum [e.g., McCarthy, 1980; Mouzai and Bouhadef,2003; Furbish et al., 2007]. We calculated the relationshipbetween drop momentum, u (kg m�1 s�1), andmass splashedper drop,m (kg), for various particle sizes (0.2 < d < 3.0 mm)based on McCarthy’s [1980] experiments:
m ¼ 0:14ud0:7 ð15Þ
for u > ucrit = 4.08� 10�5d1.37 where ucrit is the critical dropmomentum required for splashing of a given particle size (seeFigure 6). Unfortunately the raw data for individual splashesare not available from McCarthy [1980] for computing theprecision of equation (15).[45] The Furbish et al. [2007] model (equations (4), (7),
and (8)) predicts a greater mass splashed than is predicted byequation (3) for bare soil if laboratory values of m0 are used.We suspect that microtopography on bare natural surfacesreducesmean splash distance relative to controlled laboratoryexperiments. To calibrate for field conditions, we reduced m0
values until the Furbish et al. [2007] model reproduced themass splashed across a contour predicted by equation (3). Weperformed this calculation using values of mass splashed per
raindrop for 0.2 mm sediment particles. The calibrated valuesof m0 ranged between 0.67 and 1 cm. The fluxes thenpredicted by the Furbish et al. [2007] model exceed thoseof equation (14) by 43% in the case of 1 mm raindrops and by33% in the case of 3 mm raindrops. This discrepancy is smallcompared to both cover and drop size effects (Figure 10).[46] Thus, it appears that our rain splash transport
equation (14), calibrated with splash measurements on anAfrican grassland, which although grazed is not tilled orsmoothed, results in flux predictions that overlap the range ofbare tilled soils and bare patches of forest soils as well asprediction equations derived from single grain size laboratoryexperiments. Equation (14) also quantifies the role of rain-drop size and ground cover density, which are both ultimatelyrelated to climate.
9. Discussion of Results
9.1. Role of Gradient
[47] Rain splash transport for a single rainstorm can besummarized in the form
qstorm ¼ pqinst ¼ pk tanb b ð16Þ
where qstorm (kg m�1) is the net downslope aerial splash andcreep transport in a rainstorm of depth p (cm) in the absenceof runoff. The exponent, b = 1.0 for slopes <25� or b = 0.78over the full range of gradient, reflects the form of the slope-dependent bracketed function in equation (14), whichincludes the hillslope gradient and the takeoff angle (a soilproperty). The slope function thus confirms the linearfunction used by Kirkby [1971] for modeling equilibriumhillslope profiles, and calculated by McCarthy [1980] andFurbish et al. [2007] from laboratory results. The 0.78 valueis essentially the same as the value of 0.75 proposed by DePloey and Savat [1968], but the nonlinearity only becomesrelevant on gradients steep enough to maintain a soil coverthat is either gravel-rich or stabilized by dense vegetation.The coefficient k in equation (16) combines the environ-mental controls: median drop size, vegetation cover, and soilmobility, and has a much larger effect on calculations ofsplash transport and hillslope profile evolution than does theexponent on gradient.
9.2. Role of Factors Related to Climate
[48] Equations (14) and (16) illustrate how rain splash iscontrolled by two climatic factors (drop size,D and rainstormdepth, p) and a biotic factor (C), which varies with the sumof all p values that yield the annual rainfall, possibly withseason, and with grazing pressure. The influence on splash ofp is linear for a single storm, though the number of theseincrements of rainfall depth and their average drop size overthe entire rainfall climate is still required to compute rbKwhen the flux from equation (14) is inserted into the annualtransport equation (2). The effect of the median drop size, D,will vary between storms, depending mainly on rainfallintensity, so that the equation will have to be integrated overthe probability distributions of rainstorm intensity and dura-tion in a climate to obtain the long-term value of rbK. Theeffectiveness of ground cover density depends on the mediandrop size (equation (3) and Figure 4), being far more effective
F01001 DUNNE ET AL.: A RAIN SPLASH TRANSPORT EQUATION
12 of 16
F01001
in reducing splash for small raindrops than for larger ones.This effect can be also seen in Figure 10, in which splashdecreases with increasing cover much more rapidly for thesmaller raindrop size. The exponential decline of transportwith increasing cover is stronger than the commonly assumedlinear effect of (1 � C), presumably because the planformvegetation cover reduces impact while the associated densityof erect stems or vegetation patches reduces lateral splashdistances.
9.3. Role of Soil Characteristics
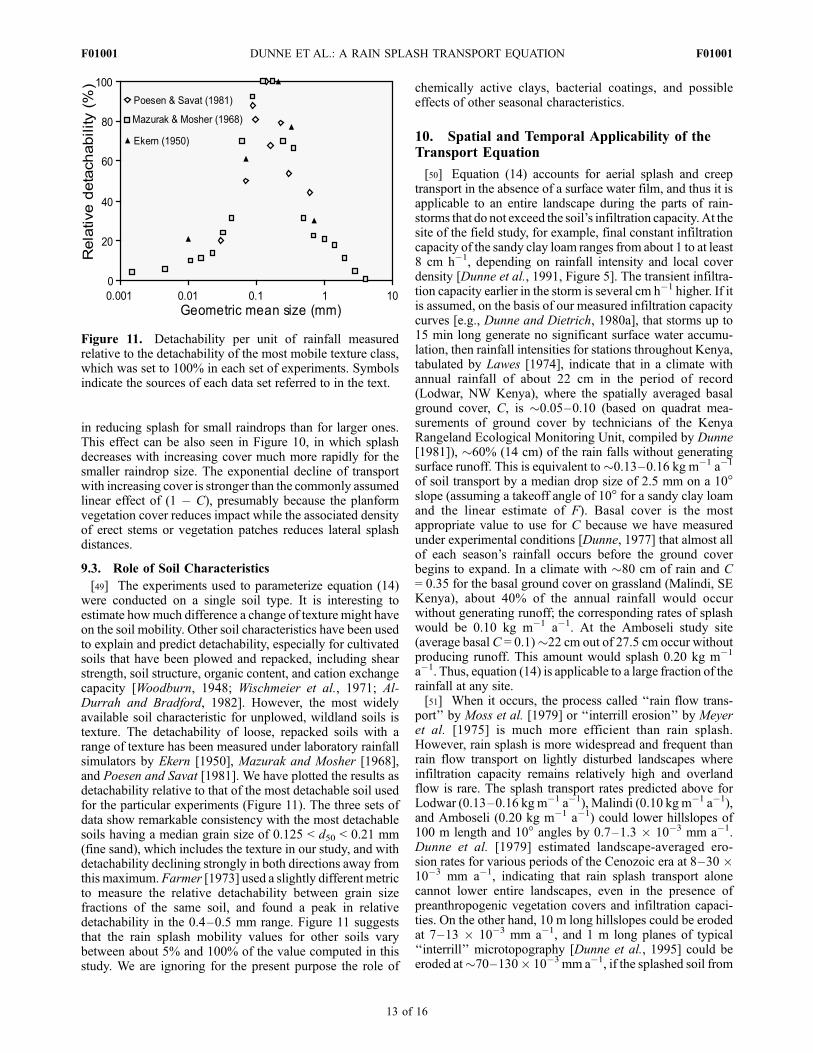
[49] The experiments used to parameterize equation (14)were conducted on a single soil type. It is interesting toestimate howmuch difference a change of texture might haveon the soil mobility. Other soil characteristics have been usedto explain and predict detachability, especially for cultivatedsoils that have been plowed and repacked, including shearstrength, soil structure, organic content, and cation exchangecapacity [Woodburn, 1948; Wischmeier et al., 1971; Al-Durrah and Bradford, 1982]. However, the most widelyavailable soil characteristic for unplowed, wildland soils istexture. The detachability of loose, repacked soils with arange of texture has been measured under laboratory rainfallsimulators by Ekern [1950], Mazurak and Mosher [1968],and Poesen and Savat [1981]. We have plotted the results asdetachability relative to that of the most detachable soil usedfor the particular experiments (Figure 11). The three sets ofdata show remarkable consistency with the most detachablesoils having a median grain size of 0.125 < d50 < 0.21 mm(fine sand), which includes the texture in our study, and withdetachability declining strongly in both directions away fromthis maximum. Farmer [1973] used a slightly different metricto measure the relative detachability between grain sizefractions of the same soil, and found a peak in relativedetachability in the 0.4–0.5 mm range. Figure 11 suggeststhat the rain splash mobility values for other soils varybetween about 5% and 100% of the value computed in thisstudy. We are ignoring for the present purpose the role of
chemically active clays, bacterial coatings, and possibleeffects of other seasonal characteristics.
10. Spatial and Temporal Applicability of theTransport Equation
[50] Equation (14) accounts for aerial splash and creeptransport in the absence of a surface water film, and thus it isapplicable to an entire landscape during the parts of rain-storms that do not exceed the soil’s infiltration capacity. At thesite of the field study, for example, final constant infiltrationcapacity of the sandy clay loam ranges from about 1 to at least8 cm h�1, depending on rainfall intensity and local coverdensity [Dunne et al., 1991, Figure 5]. The transient infiltra-tion capacity earlier in the storm is several cm h�1 higher. If itis assumed, on the basis of our measured infiltration capacitycurves [e.g., Dunne and Dietrich, 1980a], that storms up to15 min long generate no significant surface water accumu-lation, then rainfall intensities for stations throughout Kenya,tabulated by Lawes [1974], indicate that in a climate withannual rainfall of about 22 cm in the period of record(Lodwar, NW Kenya), where the spatially averaged basalground cover, C, is �0.05–0.10 (based on quadrat mea-surements of ground cover by technicians of the KenyaRangeland Ecological Monitoring Unit, compiled by Dunne[1981]), �60% (14 cm) of the rain falls without generatingsurface runoff. This is equivalent to�0.13–0.16 kg m�1 a�1of soil transport by a median drop size of 2.5 mm on a 10�slope (assuming a takeoff angle of 10� for a sandy clay loamand the linear estimate of F). Basal cover is the mostappropriate value to use for C because we have measuredunder experimental conditions [Dunne, 1977] that almost allof each season’s rainfall occurs before the ground coverbegins to expand. In a climate with �80 cm of rain and C= 0.35 for the basal ground cover on grassland (Malindi, SEKenya), about 40% of the annual rainfall would occurwithout generating runoff; the corresponding rates of splashwould be 0.10 kg m�1 a�1. At the Amboseli study site(average basal C = 0.1)�22 cm out of 27.5 cm occur withoutproducing runoff. This amount would splash 0.20 kg m�1
a�1. Thus, equation (14) is applicable to a large fraction of therainfall at any site.[51] When it occurs, the process called ‘‘rain flow trans-
port’’ by Moss et al. [1979] or ‘‘interrill erosion’’ by Meyeret al. [1975] is much more efficient than rain splash.However, rain splash is more widespread and frequent thanrain flow transport on lightly disturbed landscapes whereinfiltration capacity remains relatively high and overlandflow is rare. The splash transport rates predicted above forLodwar (0.13–0.16 kg m�1 a�1), Malindi (0.10 kg m�1 a�1),and Amboseli (0.20 kg m�1 a�1) could lower hillslopes of100 m length and 10� angles by 0.7–1.3 � 10�3 mm a�1.Dunne et al. [1979] estimated landscape-averaged ero-sion rates for various periods of the Cenozoic era at 8–30 �10�3 mm a�1, indicating that rain splash transport alonecannot lower entire landscapes, even in the presence ofpreanthropogenic vegetation covers and infiltration capaci-ties. On the other hand, 10 m long hillslopes could be erodedat 7–13 � 10�3 mm a�1, and 1 m long planes of typical‘‘interrill’’ microtopography [Dunne et al., 1995] could beeroded at�70–130� 10�3 mm a�1, if the splashed soil from
Figure 11. Detachability per unit of rainfall measuredrelative to the detachability of the most mobile texture class,which was set to 100% in each set of experiments. Symbolsindicate the sources of each data set referred to in the text.
F01001 DUNNE ET AL.: A RAIN SPLASH TRANSPORT EQUATION
13 of 16
F01001
their ends is carried away by runoff. This comparison withlong-term erosion rates indicates that the morphogenetic roleof rain splash acting alone is limited to parts of the landscapethat lower more slowly than the landscape average, or to shorthillslopes (<100 m) from which rain splash feeds soil tooverland flow in the process of rain flow transport. Rainsplash also tends to fill the rills initiated by overland flow,thereby suppressing channel formation, and maintainingsmooth hillslope surfaces [Dunne and Aubry, 1985].[52] Much of the landscape, however, is still affected by
rain splash. Even during overland flow, the runoff depth,which is usually parameterized as a sheet with an average,‘‘hydraulically effective,’’ depth for the purpose of runoffrouting, varies from zero at the hillslope divide and at the topof microtopographic promontories [Dunne and Aubry, 1985].The rate at which the average depth increases with distancealong the slope depends on the runoff rate, local gradient, andflow resistance, which in turn depend mainly upon theground cover density and microtopographic amplitude.Dunne and Dietrich [1980b] presented examples of thevariability of runoff depths along contours on experimentalplots at the Amboseli study site. Average flow depth in-creased with the square root of distance downslope, but at thehigh rates of runoff during the experiments, and on the low-gradient hillslopes characteristic of a craton, few zero depthswere measured at the scale of the 5 � 2.5 m plots. However,further downslope on the same hillslopes the microtopogra-phy contains sufficient large-scale elements [Dunne et al.,1995] that runoff depths scaled by the hillslope length wouldnot inundate a considerable fraction of the surface. Instead,this fraction would have only thin, discontinuous films ofrunoff, <1 mm deep, generated on local protuberances. Onmuch steeper and rougher hillslopes in regions of moreintense recent tectonism and climatic change and lowergrazing and trampling pressure, Abrahams et al. [1989]showed that flow depths exhibited an exponential distribu-tion, while Gabet and Dunne [2003] found a Poissondistribution; both cases indicating considerable areas of thehillslope microtopography with 0–1 mm scale water depthswhere splash should be only slightly affected by the waterfilm.
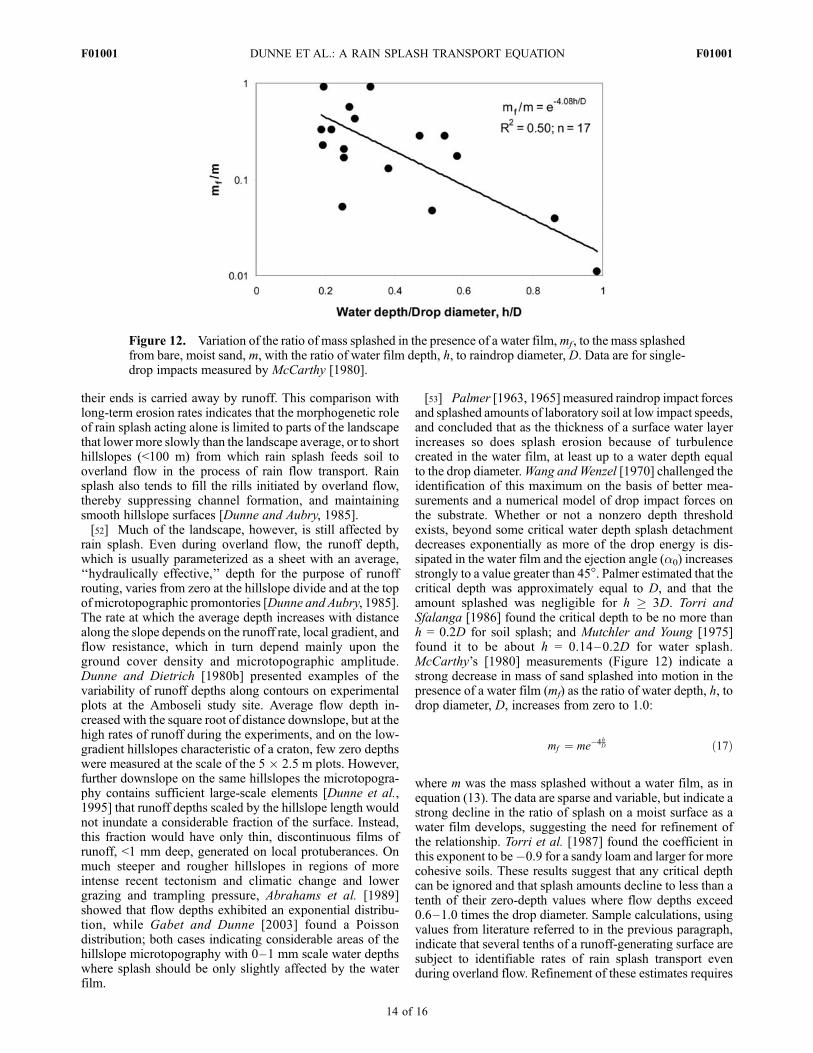
[53] Palmer [1963, 1965] measured raindrop impact forcesand splashed amounts of laboratory soil at low impact speeds,and concluded that as the thickness of a surface water layerincreases so does splash erosion because of turbulencecreated in the water film, at least up to a water depth equalto the drop diameter.Wang and Wenzel [1970] challenged theidentification of this maximum on the basis of better mea-surements and a numerical model of drop impact forces onthe substrate. Whether or not a nonzero depth thresholdexists, beyond some critical water depth splash detachmentdecreases exponentially as more of the drop energy is dis-sipated in the water film and the ejection angle (a0) increasesstrongly to a value greater than 45�. Palmer estimated that thecritical depth was approximately equal to D, and that theamount splashed was negligible for h � 3D. Torri andSfalanga [1986] found the critical depth to be no more thanh = 0.2D for soil splash; and Mutchler and Young [1975]found it to be about h = 0.14–0.2D for water splash.McCarthy’s [1980] measurements (Figure 12) indicate astrong decrease in mass of sand splashed into motion in thepresence of a water film (mf) as the ratio of water depth, h, todrop diameter, D, increases from zero to 1.0:
mf ¼ me�4hD ð17Þ
where m was the mass splashed without a water film, as inequation (13). The data are sparse and variable, but indicate astrong decline in the ratio of splash on a moist surface as awater film develops, suggesting the need for refinement ofthe relationship. Torri et al. [1987] found the coefficient inthis exponent to be�0.9 for a sandy loam and larger for morecohesive soils. These results suggest that any critical depthcan be ignored and that splash amounts decline to less than atenth of their zero-depth values where flow depths exceed0.6–1.0 times the drop diameter. Sample calculations, usingvalues from literature referred to in the previous paragraph,indicate that several tenths of a runoff-generating surface aresubject to identifiable rates of rain splash transport evenduring overland flow. Refinement of these estimates requires
Figure 12. Variation of the ratio of mass splashed in the presence of a water film,mf , to the mass splashedfrom bare, moist sand, m, with the ratio of water film depth, h, to raindrop diameter, D. Data are for single-drop impacts measured by McCarthy [1980].
F01001 DUNNE ET AL.: A RAIN SPLASH TRANSPORT EQUATION
14 of 16
F01001
more extensive sampling of rain splash and of the detailedspatial distribution of runoff depths on natural hillslopes.
11. Summary
[54] A goal of hillslope geomorphology has been toformulate sediment transport equations for individual sedi-ment transport processes with sufficient physical resolutionto identify major controls, the form of the equation, and themagnitude of its parameters. The research reported hereprovides such an equation. The functional form relatingtransport to hillslope gradient was shown to be linear overthe range of gradients found on sparsely vegetated, soilcovered hillslopes, and we have demonstrated that themomentum-partitioning approach to predicting this function-al form [Furbish et al., 2007], can be calibrated to provideaccurate transport values for bare soil. The magnitude ofsplash for a given gradient depends strongly on the climat-ically determined variables of rainstorm size, raindrop size,and cover density. We also summarized results from otherresearchers on the magnitude of the soil texture effect onsplash. An analysis of the spatial and temporal significance ofsplash transport for a semiarid savanna suggests that rainsplash mobilizes sediment on a large proportion of thelandscape, either as aerial transport or as rain flow transport,but by itself has morphogenetic significance only on shorthillslopes.[55] However, even for rain splash, the simplest of all
geomorphic processes, the construction of a physically basedtransport equation is fraught with complexity and the need todevelop the equation with theory and with measurementsfrom the laboratory and the field. The mechanics of splashleading to ejection angles (a0) and the asymmetry of theupslope-downslope partitioning of sediment (F) remainpoorly understood, but the momentum-partitioning approachof Furbish et al. [2007] appears to be the most promisingtheoretical approach to partitioning the splashed massupslope and downslope, if it can be tractably extended tomultidrop rainstorms and mixed grain size soils. It is notsecurely known whether soil grain size affects the ejectionangle; nor has there been any thorough exploration of theeffects of drop size on this angle. Detachability remains to beexplored further, especially on cohesive soils and undis-turbed soils that have not been dispersed and repacked forlaboratory studies. On the other hand, scaling up of theequation to natural hillslopes, which bedevils studies of someother transport processes on hillslopes and in rivers, is notmuch of a problem, except for the need to know the spatialdistribution of water depths during runoff generating storms.
[56] Acknowledgments. The work was supported by a grant fromNSF Earth Science with logistical support from the Kenya RangelandEcological Monitoring Unit. Brian Aubry and Suzanne Fouty assisted withthe field experiments and David Western provided information on localecological conditions and processes. Conrad McCarthy stimulated thesenior author’s interest in defining the environmental conditions repre-sented in rain splash transport equations. Suggestions from Joel Johnsonand three anonymous reviewers improved the manuscript.
ReferencesAbrahams, A. D., A. J. Parsons, and S. H. Luk (1989), Distribution of depthof overland flow on desert hillslopes and implications for modeling soilerosion, J. Hydrol., 106, 177–184, doi:10.1016/0022-1694(89)90173-X.
Ahnert, F. (1976), Brief description of a comprehensive three-dimensionalprocess-response model of landform development, Z. Geomorphol.,Suppl., 25, 29–49.
Ahnert, F. (1987), Process-response models of denudation at different spa-tial scales, Catena Suppl., 10, 31–50.
Al-Durrah, M. M., and J. M. Bradford (1982), The mechanism of rainsplash on soil surfaces, Soil Sci. Soc. Am. J., 46, 1086–1090.
Carter, C. E., J. D. Greer, H. J. Braud, and J. M. Floyd (1974), Raindropcharacteristics in the south central United States, Trans. ASAE, 17(6),1033–1037.
Culling, W. E. H. (1960), Analytical theory of erosion, J. Geol., 68, 336–344, doi:10.1086/626663.
De Ploey, J., and J. Savat (1968), Contribution a l’etude de l’erosion par lesplash, Z. Geomorphol., 12, 174–193.
Dietrich, W. E., D. Bellugi, A. M. Heimsath, J. J. Roering, L. Sklar, andJ. D. Stock (2003), Geomorphic transport laws for predicting the formand evolution of landscapes, in Prediction in Geomorphology, Geophys.Monogr. Ser., vol. 135, edited by P. Wilcock and R. Iverson, pp. 103–132, AGU, Washington D. C.
Dunne, T. (1977), Intensity and controls of soil erosion in Kajiado District,Kenya, Rep. Kenya Wildlife Manage. Proj., 67 pp., U.N. Food and Agric.Organ, Rome.
Dunne, T. (1981), Effect of woodfuel harvest on soil erosion in Kenya,report, Beijer Inst. and Kenya Minist. of Energy, Nairobi.
Dunne, T., and B. F. Aubry (1985), Evaluation of Horton’s theory of sheet-wash and rill erosion on the basis of field experiments, in Hillslope Pro-cesses, edited by A. D. Abrahams, pp. 31–53, Allen and Unwin, London.
Dunne, T., and W. E. Dietrich (1980a), Experimental study of Horton over-land flow on tropical hillslopes. Part I: Soil conditions, infiltration, andfrequency of runoff, Z. Geomorphol., Suppl., 33, 40–59.
Dunne, T., and W. E. Dietrich (1980b), Experimental study of Horton over-land flow on tropical hillslopes. Part II: Sheetflow hydraulics and hill-slope hydrographs, Z. Geomorphol., Suppl., 33, 60–80.
Dunne, T., W. E. Dietrich, and M. J. Brunengo (1979), Rapid evaluation ofsoil erosion and soil lifespan in the grazing lands of Kenya, IAHS AISHPubl., 128, 421–428.
Dunne, T., W. E. Dietrich, and M. J. Brunengo (1980), Simple, portableequipment for erosion experiments under artificial rainfall, J. Agric. Eng.Res., 25, 161–168, doi:10.1016/0021-8634(80)90057-8.
Dunne, T., W. Zhang, and B. F. Aubry (1991), Effects of rainfall intensity,vegetation, and microtopography on infiltration and runoff,Water Resour.Res., 27, 2271–2285, doi:10.1029/91WR01585.
Dunne, T., K. X. Whipple, and B. F. Aubry (1995), Microtopography ofhillslopes and the initiation of channels by Horton overland flow, inEvolving Concepts in Fluvial Geomorphology, Geophys. Monogr. Ser.,vol. 89, edited by J. E. Costa et al., pp. 27–44, AGU, Washington D. C.
Ekern, P. C. (1950), Raindrop impact as the force initiating soil erosion, SoilSci. Soc. Am. Proc., 15, 7–10.
Ekern, P. C., and R. J. Muckenhirn (1947), Water drop impact as a force intransporting sand, Soil Sci. Soc. Am. Proc., 12, 441–444.
Ellison, W. D. (1944a), Two devices for measuring soil erosion, Agric.Eng., 25, 53–55.
Ellison, W. D. (1944b), Studies of raindrop erosion, Agric. Eng., 25, 131–136.
Ellison, W. D. (1948), Soil detachment by water in erosion processes, EosTrans. AGU, 29, 499–502.
Farmer, E. E. (1973), Relative detachability of soil particles by simulatedrainfall, Soil Sci. Soc. Am. Proc., 37, 629–633.
Foster, G. R. (1982), Modeling the erosion process, in Hydrologic Modelingof Small Watersheds, edited by C. T. Han et al., pp. 297–380, Am. Soc.of Agric. Eng., Saint Joseph, Mich.
Froehlich, W., and J. Slupik (1980), Importance of splash in erosion processwithin a small flysch catchment basin, Stud. Geomorphol. Carpatho-Balcanica, 14, 77–112.
Furbish, D. J., K. K. Hammer, M. Schmeeckle, M. N. Borosund, and S. M.Mudd (2007), Rain splash of dry sand revealed by high-speed imagingand sticky paper splash targets, J. Geophys. Res., 112, F01001,doi:10.1029/2006JF000498.
Furbish, D. J., E. M. Childs, P. K. Haff, and M. W. Schmeeckle (2009),Rain splash of soil grains as a stochastic advection-dispersion process,with implications for desert plant-soil interactions and land-surface evo-lution, J. Geophys. Res., 114, F00A03, doi:10.1029/2009JF001265.
Gabet, E. J., and T. Dunne (2003), Soil detachment by rain power, WaterResour. Res., 39(1), 1002, doi:10.1029/2001WR000656.
Gilley, J. E., and S. C. Finkner (1985), Estimating soil detachment causedby raindrop impact, Trans. ASAE, 28, 140–145.
Greig-Smith, P. (1983), Quantitative Plant Ecology, 3rd ed., 359 pp., Univ.of Calif. Press, Berkeley.
Hirano, M. (1969), Slope form and upheaval of the Yoro Mountain Range,central Japan (in Japanese), J. Geol. Soc. Jpn., 75, 615–627.
F01001 DUNNE ET AL.: A RAIN SPLASH TRANSPORT EQUATION
15 of 16
F01001

Imeson, A. C. (1977), Splash erosion, animal activity and sediment supplyin a small, forested Luxembourg catchment, Earth Surf. Processes, 2,153–160, doi:10.1002/esp.3290020207.
Kirkby, M. J. (1971), Hillslope process: Response models based on thecontinuity equation, Inst. Br. Geogr. Spec. Publ., 3, 15–30.
Kirkby, M. J. (1985), A model for the evolution of regolith-mantled slopes,in Models in Geomorphology, edited by M. J. Woldenberg, pp. 213–237,Allen and Unwin, London.
Kirkby, M. J. (1989), A model to estimate the impact of climatic change onhillslope and regolith form, Catena, 16, 321–341, doi:10.1016/0341-8162(89)90018-0.
Kwaad, F. J. P. M. (1977), Measurements of rain splash erosion and theformation of colluvium beneath deciduous woodland in the LuxembourgArdennes, Earth Surf. Processes, 2, 161–173, doi:10.1002/esp.3290020208.
Lane, L. J., M. A. Nearing, J. M. Laflen, G. R. Foster, and M. H. Nichols(1992), Description of the US Department of Agriculture water erosionproject (WEPP) model, in Overland Flow: Hydraulics and ErosionMechanics, edited by A. J. Parsons and A. D. Abrahams, pp. 377–391, Chapman and Hall, New York.
Lawes, E. F. (1974), An analysis of short duration rainfall, Tech. Memo. 23,43 pp., East Afr. Meteorol. Dep., Nairobi.
Mazurak, A. P., and P. N. Mosher (1968), Detachment of soil particles insimulated rainfall, Soil Sci. Soc. Am. Proc., 32, 716–719.
McCarthy, C. J. (1980), Sediment transport by rain splash, Ph.D. disserta-tion, 215 pp., Dep. of Geol. Sci., Univ. of Wash., Seattle.
Meyer, L. D., G. R. Foster, and M. J. M. Romkens (1975), Origin of erodedsoil from upland slopes, in Present and Prospective Technology forPredicting Sediment Yields and Sources, pp. 177–189, U.S. Dep. ofAgric., Washington, D. C.
Morgan, R. P. (1978), Field studies of rain splash erosion, Earth Surf.Processes, 3, 295–299, doi:10.1002/esp.3290030308.
Mosley, M. P. (1973), Rain splash and the convexity of badland divides,Z. Geomorphol., Suppl., 18, 10–25.
Moss, A. J., P. H. Walker, and J. Hutka (1979), Raindrop stimulated trans-portation in shallow water flows: An experimental study, Sediment.Geol., 22, 165–184, doi:10.1016/0037-0738(79)90051-4.
Mouzai, L., and M. Bouhadef (2003), Water drop erosivity: Effects on soilsplash, J. Hydraul. Res., 42, 61–68.
Mutchler, C. K., and R. A. Young (1975), Soil detachment by raindrops, inPresent Prospective Technology for Predicting Sediment Yields andSources, pp. 114–117, U.S. Dep. of Agric., Washington, D. C.
Palmer, R. S. (1963), The influence of a thin water layer on waterdropimpact forces, Int. Assoc. Sci. Hydrol. Publ., 65, 141–148.
Palmer, R. S. (1965), Waterdrop impact forces, Trans. ASAE, 8, 69–70.Poesen, J. (1985), An improved splash transport model, Z. Geomorphol.,29, 193–211.
Poesen, J. (1986), Field measurement of splash erosion to validate a splashtransport model, Z. Geomorphol., Suppl., 58, 81–91.
Poesen, J., and J. Savat (1981), Detachment and transportation of loosesediments by raindrop splash, part II: Detachability and transportabilitymeasurements, Catena, 8, 19–41, doi:10.1016/S0341-8162(81)80002-1.
Reeve, I. J. (1982), A splash transport model and its application to geo-morphic measurement, Z. Geomorphol., 26, 55–71.
Salles, C., J. Poesen, and G. Govers (2000), Statistical and physical analysisof soil detachment by raindrop impact: Rain erosivity indices and thresh-old indices, Water Resour. Res., 36, 2721 – 2729, doi:10.1029/2000WR900024.
Sreenivas, L., J. R. Johnston, and H. O. Hill (1947), Some relationships ofvegetation and soil detachment in the erosion process, Soil Sci. Soc. Am.Proc., 12, 471–474.
Torri, D., and M. Sfalanga (1986), Some aspects of soil erosion modeling,in Agricultural Nonpoint Source Pollution: Model Selection and Applica-tion, edited by A. Giorgini and F. Zingales, pp. 161–171, Elsevier,Amsterdam.
Torri, D., M. Sfalanga, and M. Del Sette (1987), Splash detachment: Runoffdepth and soil cohesion, Catena, 14, 149–155, doi:10.1016/S0341-8162(87)80013-9.
Tsukamoto, Y. (1966), Raindrops under forest canopies and splash erosion(in Japanese with English summary), Bull. Exp. For. Tokyo Univ. Agric.Technol., 5, 65–77.
Van Dijk, A. I. J. M., L. A. Bruijnzeel, and E. H. Eisma (2003), A meth-odology to study rain splash and wash processes under natural rainfall,Hydrol. Processes, 17, 153–167, doi:10.1002/hyp.1154.
Wang, R. C., and H. G. Wenzel Jr. (1970), The mechanics of a drop afterstriking a stagnant water layer, Rep. 30, 130 pp., Univ. of Ill. WaterResour. Cent., Urbana.
Willgoose, G., R. L. Bras, and I. Rodriguez-Iturbe (1991), A coupledchannel network growth and hillslope evolution model: 1. Theory, WaterResour. Res., 27, 1671–1684.
Wischmeier, W. H., C. B. Johnson, and B. V. Cross (1971), A soil erodibilitynomograph for farmland and construction sites, J. Soil Water Conserv., 26,189–193.
Woodburn, R. (1948), The effect of structural condition on soil detachmentby raindrop action, Agric. Eng., 29, 154–156.
Young, R. A., and J. L. Wiersma (1973), The role of raindrop impact in soildetachment and transport, Water Resour. Res., 9, 1629 – 1630,doi:10.1029/WR009i006p01629.
�����������������������T. Dunne, Donald Bren School of Environmental Science and Manage-
ment, University of California, Santa Barbara, CA 93106 USA.D. V. Malmon, U.S. Geological Survey, 345 Middlefield Rd., Menlo
Park, CA 94025, USA.S. M. Mudd, School of Geosciences, University of Edinburgh, Edinburgh
EH8 9XP, UK.
F01001 DUNNE ET AL.: A RAIN SPLASH TRANSPORT EQUATION
16 of 16
F01001