Embed Size (px)
Citation preview

JOURNAL OF THEORETICAL
AND APPLIED MECHANICS
48, 3, pp. 751-770, Warsaw 2010
A RAILWAY WHEEL WEAR PREDICTION TOOL BASED
ON A MULTIBODY SOFTWARE1
Joao Pombo, Jorge Ambrósio, Manuel PereiraIDMEC/Instituto Superior Tecnico, Technical University of Lisbon, Lisbon, Portugal
e-mail: [email protected]; [email protected]; [email protected]
Roger Lewis, Rob Dwyer-JoyceUniversity of Sheffield, Department of Mechanical Engineering, Sheffield, United Kingdom
e-mail: [email protected]; [email protected]
Caterina Ariaudo, Naim KukaRunning Dynamics – ALSTOM Ferroviaria S.p.A., Savigliano (CN), Italy
e-mail: [email protected]; [email protected]
The wheel wear prediction is a key-topic in the field of railway research as ithas big impact on economical and safety aspects of trainset design, operationand maintenance. The aim of this work was to implement a flexible and pre-dictive railway wheel wear tool that, starting from a specific vehicle mission,provides the wheel profile evolution as a function of the distance run. The we-ar estimation tool consists of the use of a sequence of pre and post-processingpackages, in which the methodologies now presented are implemented, inter-faced with a commercial multibody software that is used to study the railwaydynamics. The computational tool is applied here to several simulation sce-narios. The purpose is to demonstrate its capabilities on wear prediction byevaluating the influence of trainset design and of track layout on the wheelwear growth. Special attention is also given to study how the wear evolutionis affected by the friction conditions between the wheel and rail.
Key words: railway dynamics, vehicle-track interaction, wheel profiles upda-ting, track geometry, flange lubrication
1. Introduction
The increase of the world population, the growing energy prices and severalenvironmental factors have promoted the expansion and development of ra-ilway transport in the last few decades. Nowadays, passenger trains have to
1The paper was presented at the ECCOMAS Thematic Conference on Multibody
Dynamics which was held at Warsaw University of Technology on June 29 – July 2, 2009.

752 J. Pombo et al.
travel faster, with improved safety and comfort conditions. Furthermore, thecompetition with other transportation systems has increased greatly. For shortand medium distances, modern high speed trains are able to compete with airtransportation, having the advantage of presenting better energy efficiencyand causing less pollution. For larger distances, the railway system is still themost economical means for transportation of goods and starts to have somecompetitive edge in the passenger transportation. On the other hand, the ra-ilway operators are demanding reductions in the overall operational costs. Inthis regard, they put particular attention to the railway vehicles maintenancecosts and to the aggressiveness of rolling stocks on the infrastructures, i.e., thetrack damage.
In order to improve the competitiveness of the railway systems, railway ve-hicle manufacturers are investing large resources in research and developmentactivities. These research activities contribute decisively to the developmentof new design concepts by using recent simulation techniques, modern pro-duction methods and innovative optimization procedures. The purpose is todevelop sophisticated railway vehicles that answer to the increasing demandsfor faster, safer and more comfortable vehicles, but also that they have lowerlife cycle costs and are more ecological.
An important issue arising during the design phase of a new rolling stockis the optimisation of the dynamic performance of the railway vehicles. Thisis a complex issue since it is multidisciplinary and, therefore, requires the useof computational tools that represent the state of the art in railway dynamics.These tools must be able to characterize the modern designs and predict thevehicles performance by using reliable and validated mathematical models.Such models should consider boundary conditions and external loads, andmust represent accurately track geometry and wheel-rail contact conditions.Therefore, the development and use of such computational tools is of para-mount importance during the design stage of a project. It allows performanceof several simulations of the railway vehicles, under various scenarios, to testthe performance of different mechanical and structural solutions in order toreach an optimized design. In addition, analysis can be carried out to evaluatethe impact of design changes or failure modes risks in a much faster and lesscostly way than the physical implementation and test of those changes in realprototypes.
Nowadays, partnerships have been established between the industry anduniversities to improve the integration of Academic research work within theindustry and to develop a better understanding, within universities, of the in-dustrial needs. A good example of such a collaboration is the Project AWARE

A railway wheel wear prediction tool... 753
(ReliAble Prediction of the WeAr of Railway WhEels), which is coordinatedby ALSTOM Transport and has, as partners, the University of Sheffield, theTechnical University of Lisbon (IST) and the University of Zilina. This projectis funded by the European Union to meet its transport policy objectives forthe improvement of efficiency and competitiveness of the European railwaytransport system. AWARE is a Transfer of Knowledge project with the ob-jective of developing a methodology to predict the wear evolution on railwaywheels.
The wear computational tool developed in this work is used to predict thewheel wear evolution in several operation scenarios. In particular, the influenceof trainset configuration, of track layout and of friction conditions between thewheel and rail are studied. The scenarios of wheel flange lubrication are alsoconsidered here.
2. General overview of the wear prediction tool
The computational tool developed here to predict the wear of railway wheelsconsists of using a commercial Multibody Software (MBS) to study the ra-ilway dynamic problem and a purpose-built code for managing its pre- andpost-processing data in order to compute the wear. According to this stra-tegy, an initial wheel profile is provided and the MBS runs a simulation fora pre-defined travel distance. Then, the wear prediction tool collects the ne-cessary data from the dynamic analysis results and calculates the wear, i.e.,the amount of material to be removed from the wheel surfaces. The resultingupdated profiles are then used as the input for a new dynamic analysis in theMBS. This methodology is repeated as many times as required by the user inorder to be representative of the trainset service conditions. The wear tool isimplemented in MATLAB (Hunt et al., 2001; Lyshevski, 2003) and the MBSused to study the railway dynamic problem is VAMPIRE (AEA Technologyplc, 2004; DeltaRail Group Ltd, 2006).
In real situations, many trainsets are operated in different tracks. There-fore, when predicting the wear evolution on the wheels of a railway vehicle,this issue has to be considered and the wear studies should be performed usingthe track models (geometry and characteristics) that represent the real ope-ration conditions. In the wear computational tool presented here, there are nolimitations with respect to the length of the track models or to the number ofmodels to use. In fact, after each simulation with the MBS, the wheel profilesare updated and used as the input for a new dynamic analysis in the MBS.

754 J. Pombo et al.
This new dynamic analysis can be performed with the same track model orwith a different one. This approach allows computation of the wheel wear withbetter precision by reproducing the real service conditions of the railway ve-hicles. The result is the wheel profile evolution, in respect of the distance run,for the vehicle mission specified by the user.A schematic representation of the wear computational tool is shown in
Fig. 1 and it consists of the following steps:
1. Prepare the input data for computation;
2. Prepare the wheel-rail contact data files;
3. Run the multibody dynamic analysis;
4. Read the multibody dynamic analysis output;
5. Compute the wear, i.e., amount of material to be removed from wheelsurfaces;
6. Update and smooth the wheel profiles.
Fig. 1. Schematic representation of the wear prediction tool
The wear evolution study ends when the total simulated distance matchesthe total distance defined by the user. In the following, the main steps of thewear prediction tool are briefly described as the detailed description of thetool is outside the scope of this text. Nevertheless, the interested readers arereferred to the works (Quost et al., 2008a,b; Tassini et al., 2008, 2009).
2.1. Wear computation
This is the core of the wear prediction tool as it computes the amount ofworn material to be removed from the wheel surfaces, starting from the MBS

A railway wheel wear prediction tool... 755
dynamics results. It can be considered to be divided into three parts: i) Contactmodel; ii) Wear function; iii) Wear distribution. The contact model processesthe dynamic analysis results to obtain the wheel-rail contact parameters. Thewear function uses these contact parameters as the input to compute thequantity of worn wheel material. The wear distribution allocates the quantityof worn material along the wheel profile.
Concerning the contact model, two alternative methods have been imple-mented, global or local, depending on the way they solve the wheel-rail contactproblem (Andersson et al., 1998; Dukkipati and Amyot, 1988; Garg and Duk-kipati, 1984; Johnson, 1985; Kalker, 1979, 1990; Pombo and Ambrósio, 2008;Pombo et al., 2007). In the global approach, the contact parameters are obta-ined by studying the contact problem on the whole wheel-rail contact patch,considering the mean values of normal and tangential forces. In the local me-thod, the contact problem is studied by dividing the wheel-rail contact areainto small cells and evaluating the contact parameters individually for eachcell.
The wear functions relate the energy dissipated in the wheel-rail contactpatch with the amount of worn material to be removed. In general, these wearlaws use a set of contact parameters, namely the normal and tangential for-ces and the relative slip velocities (creepages), as the input to compute thewear. In the literature (Beagley, 1975; Bolton and Clayton, 1983; Braghin etal., 2006; Dearden, 1960; Enblom, 2006; Jendel, 2002; Lewis and Dwyer-Joyce,2004; Lewis et al., 2009; Lewis and Olofsson, 2004; Pearce and Sherratt, 1991;Ramalho, 2008; Ramalho and Miranda, 2006; Tassini et al., 2009) differentmethods for estimating wear of railway wheels can be found. These methodsare based on real wear data acquired using different experimental techniques,with the twin disc arrangement being the most common. Three of the we-ar functions developed by the British Rail Research (Beagley, 1975; Boltonand Clayton, 1983; Dearden, 1960; Pearce and Sherratt, 1991), by the RoyalInstitute of Technology from Stockholm (Enblom, 2006; Jendel, 2002), andby the University of Sheffield (Braghin et al., 2006; Lewis and Dwyer-Joyce,2004; Lewis et al., 2009; Lewis and Olofsson, 2004; Tassini et al., 2009), areimplemented in the computational tool described here and can be selected bythe user. Other authors (Meinders and Meinke, 2002) use a wear modellingapproach with coefficients from the literature to determine the amount of massloss caused by the contact forces and slip values.
In the wear studies performed in this work, the wear function developed bythe University of Sheffield is used (Lewis and Dwyer-Joyce, 2004). It relates thewear rate, representing the weight of lost material [µg] per distance rolled [m]

756 J. Pombo et al.
per contact area A [mm2], to the product Tγ, where T is the tangentialcontact force and γ is the global creepage. This formulation is based on thetwin disc experimental data acquired from the contact between discs madeof R8T wheel material and UIC60 900A rail material. These experimentaltests have identified three wear regimes, mild, severe and catastrophic, for thecontact between wheel and rail materials. Notice that these materials are theones used to assemble the vehicles and tracks considered here. The equationsgoverning the University of Sheffield wear function are defined in Table 1.
Table 1. Equations for the University of Sheffield wear function
Wear regimeWear range Wear rateTγ/A [N/mm2] [µg/m/mm2]
Mild TγA< 10.4 5.3Tγ
A
Severe 10.4 ¬ TγA< 77.2 55.0
Catastrophic TγA 77.2 61.9Tγ
A
2.2. Wheel profile updating and smoothing
After obtaining the quantities of worn material, the wheel profiles need tobe updated in order to be used as the input for the next dynamic analysis. Inthe wear prediction tool described here, two alternative approaches are imple-mented: i) Localised profile updating and; ii) Intersection profile updating.
In the localised approach, the worn surface values for the same wheel-railrelative lateral displacement band are summed. Then they are converted to adepth of the material and are removed from the corresponding wheel profilepoint, which is the wheel-rail contact point for that relative displacement.This method requires a subsequent smoothing procedure in order to spreadthe wear along the profile.
In the intersection profile updating method, for each wheel-rail relativedisplacement considered, the wheel and rail profiles are geometrically inter-sected and the profile is modified, spreading the worn surface along the wheelprofile, following the same shape of the intersection area. This approach onlyrequires the application of a light additional smoothing. For a more detaileddescription of the wear tool, the interested readers are referred to the works(Quost et al., 2008a,b; Tassini et al., 2008, 2009).

A railway wheel wear prediction tool... 757
3. Wear studies
The wear computational tool implemented in the scope of the project AWAREis demonstrated here through its application to several simulation scenarios.The purpose is to demonstrate the capabilities of the tool on wear prediction.This is done by evaluating the influence on wear of the train design, of thetrack layout and of the friction coefficient between the wheel and rail.
3.1. Influence of trainset design on wear
In order to analyse the influence of the trainset configuration on the wearevolution, a comparative study is carried out using two different trainsets. Forthis purpose, two simulations are run using two vehicle models, but keepingunchanged the remaining input data and the analysis parameters required forthe wear computation.
Fig. 2. Non-articulated conventional trainset
The first case study considered here is a non-articulated conventional tra-inset. This trainset is composed by seven vehicles interconnected by linkingelements, as represented in Fig. 2. Due to its configuration, it is assumed that,concerning the wear studies performed here, the dynamic behaviour of eachvehicle has insignificant influence on the others. Therefore, each vehicle of thistrainset can be studied independently, as shown in Fig. 3. In this way, duringthe wear studies, the multibody vehicle model is only built for one vehicle ofthe trainset, called hereafter as Vehicle 1. The vehicle considered is one motorvehicle of the trainset, which has two motor wheelsets, represented in black inFig. 3, and two trailer wheelsets, represented in white.
Fig. 3. Representation of Vehicle 1 – from a non-articulated conventional trainset
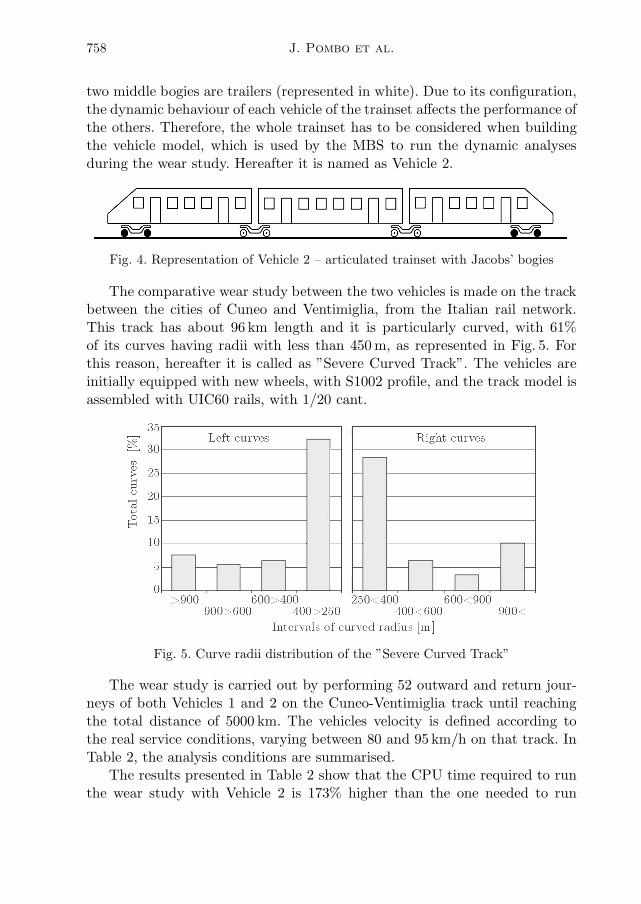
The second case study is a three-vehicle articulated trainset with Jacobs’sbogies, as represented in Fig. 4. This trainset is composed of four bogies, wherethe two bogies of the extremities are motored (represented in black), and the
758 J. Pombo et al.
two middle bogies are trailers (represented in white). Due to its configuration,the dynamic behaviour of each vehicle of the trainset affects the performance ofthe others. Therefore, the whole trainset has to be considered when buildingthe vehicle model, which is used by the MBS to run the dynamic analysesduring the wear study. Hereafter it is named as Vehicle 2.
Fig. 4. Representation of Vehicle 2 – articulated trainset with Jacobs’ bogies
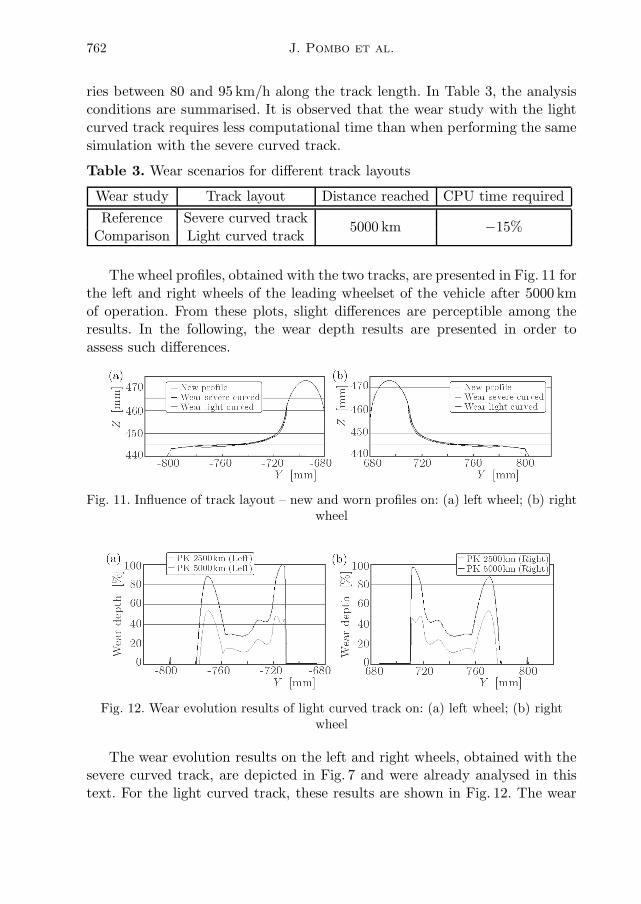
The comparative wear study between the two vehicles is made on the trackbetween the cities of Cuneo and Ventimiglia, from the Italian rail network.This track has about 96 km length and it is particularly curved, with 61%of its curves having radii with less than 450m, as represented in Fig. 5. Forthis reason, hereafter it is called as ”Severe Curved Track”. The vehicles areinitially equipped with new wheels, with S1002 profile, and the track model isassembled with UIC60 rails, with 1/20 cant.
Fig. 5. Curve radii distribution of the ”Severe Curved Track”
The wear study is carried out by performing 52 outward and return jour-neys of both Vehicles 1 and 2 on the Cuneo-Ventimiglia track until reachingthe total distance of 5000 km. The vehicles velocity is defined according tothe real service conditions, varying between 80 and 95 km/h on that track. InTable 2, the analysis conditions are summarised.The results presented in Table 2 show that the CPU time required to run
the wear study with Vehicle 2 is 173% higher than the one needed to run

A railway wheel wear prediction tool... 759
Table 2. Analysis conditions for trainset design wear studies
Wear study Railway vehicle Distance reached CPU time required
Reference Vehicle 15000 km +173%
Comparison Vehicle 2
the same simulation with Vehicle 1. This difference results from the fact thatthe multibody model of Vehicle 2 is composed by three railway compositions,with all respective bodies and mechanical components, whereas the model ofVehicle 1 is only constituted by one composition. These differences in the sizesof vehicle models mean that the dynamic analysis of Vehicle 2, performed withthe MBS, takes more time to run. In addition, Vehicle 2 has 8 wheelsets whileVehicle 1 is composed by 4. This also implies that more computational time isrequired to study Vehicle 2 since the wear calculations and the profile updatingprocedures need to be done for each wheelset.In the following, the wear results are presented for the first wheelset of
both vehicles. The new and the worn profiles, on the left and right wheels,after 5000 km of trainset operation are given in Fig. 6. From these plots, nodifferences are perceptible between the results obtained with the two vehicles.The wear depth results are presented here in order to analyse such differences.
Fig. 6. Influence of trainset configuration – new and worn profiles on: (a) left wheel;(b) right wheel
The wear depth results, obtained with Vehicle 1, are depicted in Fig. 7 forthe left and right wheels. In order to study the wear progression, these valuesare plotted for the travelled distances of 2500 and 5000 km. The results arepresented as a percentage of the maximum wear depth value obtained on bothwheels. Figure 7 shows that, in the tread zones of both wheels, the majorityof worn material is removed in the first 2500 km. On the wheel flanges, it isobserved that the wear evolution is nearly uniform along the total distancestudied. The wear evolution results also show that, after 5000 km of trainsetoperation, the highest wear on the left wheel occurs on both the tread andflange zones, while, on the right wheel, it occurs on the flange.

760 J. Pombo et al.
Fig. 7. Wear evolution results of Vehicle 1 on: (a) left wheel; (b) right wheel
In Fig. 8, the wear depth results on the left and right wheels of Vehicle 2are depicted. These are presented as a percentage of the maximum wear depthvalue obtained on both wheels for the travelled distances of 2500 and 5000 km.As for Vehicle 1, it is observed here that, in the tread zones of both wheels, themajority of the wear happens in the first 2500 km. On the wheel flanges, thewear evolution is nearly uniform along the 5000 km studied. The results alsoshow that, after 5000 km, the highest values of wear on the left wheel occuron the tread zone, whereas, for the right wheel, the wear depth is higher onthe flange.
Fig. 8. Wear evolution results of Vehicle 2 on: (a) left wheel; (b) right wheel
The comparison between wear depth values on the wheels of both vehicles,after 5000 km of trainset operation, is presented in Fig. 9. These results arepresented as a percentage of the maximum wear depth value obtained. It isobserved that, in general, the quantity of worn material obtained with Vehicle 1is less than the one obtained with Vehicle 2. Additionally, the wear distributionalong the profiles is similar on two vehicles. In fact, the results reveal that thehighest wear values occur on both the tread and flange while, on the transitionbetween these profile zones, the wear is 20 to 40% lower.

A railway wheel wear prediction tool... 761
Fig. 9. Comparison of wear depth results of Vehicle 1 and 2 on: (a) left wheel;(b) right wheel
3.2. Influence of track layout on wear
The objective now is to analyse the influence of the track layout on thewear evolution. For this purpose, a comparative study is carried out using twodifferent track layouts and keeping unchanged the remaining input data andthe wear analysis parameters. The vehicle model used in the two simulationsis Vehicle 1, represented in Fig. 3. The first track considered here is the severecurved track, which has the curve radii distribution shown in Fig. 5. The secondtrack considered has the same length of the previous one but its geometry ismainly straight. Hereafter it is called as ”Light Curved Track” since 85% ofits curves have radii higher than 450m, as shown in Fig. 10.
Fig. 10. Curve radii distribution of the ”Light Curved Track”
The comparative wear study is carried out by performing several journeysof Vehicle 1 on both tracks until reaching the distance of 5000 km. The trackmodels are assembled with UIC60 rails and the vehicle is initially equippedwith new wheels with S1002 profile. In both cases, the vehicle velocity va-
762 J. Pombo et al.
ries between 80 and 95 km/h along the track length. In Table 3, the analysisconditions are summarised. It is observed that the wear study with the lightcurved track requires less computational time than when performing the samesimulation with the severe curved track.
Table 3. Wear scenarios for different track layouts
Wear study Track layout Distance reached CPU time required
Reference Severe curved track5000 km −15%
Comparison Light curved track
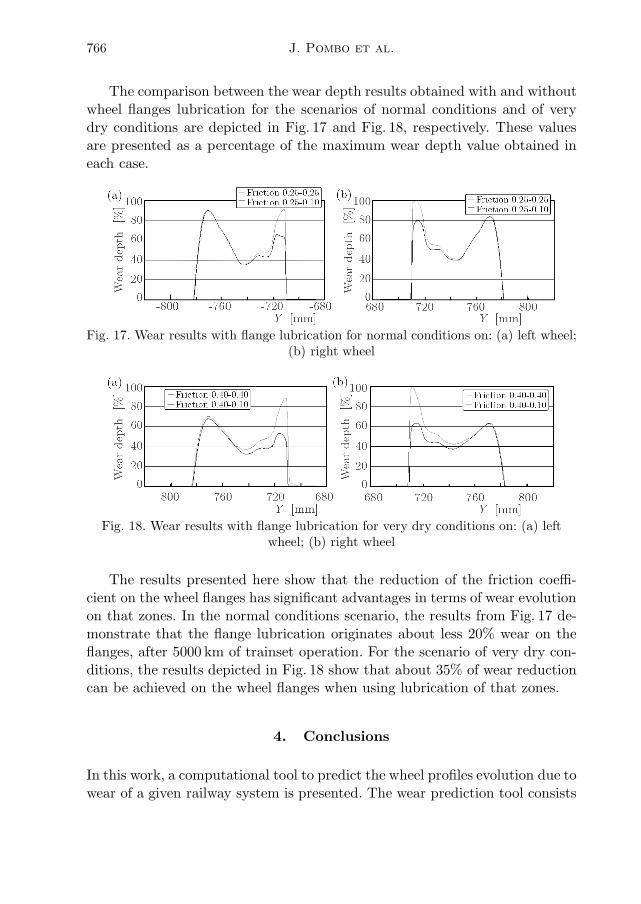
The wheel profiles, obtained with the two tracks, are presented in Fig. 11 forthe left and right wheels of the leading wheelset of the vehicle after 5000 kmof operation. From these plots, slight differences are perceptible among theresults. In the following, the wear depth results are presented in order toassess such differences.
Fig. 11. Influence of track layout – new and worn profiles on: (a) left wheel; (b) rightwheel
Fig. 12. Wear evolution results of light curved track on: (a) left wheel; (b) rightwheel
The wear evolution results on the left and right wheels, obtained with thesevere curved track, are depicted in Fig. 7 and were already analysed in thistext. For the light curved track, these results are shown in Fig. 12. The wear

A railway wheel wear prediction tool... 763
depth values are presented as a percentage of the maximum value obtainedon both wheels for the travelled distances of 2500 and 5000 km. As for thesevere curved track, it is observed that, in the tread zones of both wheels, themajority of wear happens in the first 2500 km. On the wheel flanges, the wearevolution is nearly uniform along the total distance studied. The results fromFig. 12 also show that, after 5000 km of operation, the highest values of wearon both wheels occur on the flange zones.
The comparison between the wear depth values obtained when travelling onthe two tracks, after 5000 km of operation, is presented in Fig. 13. The resultsare presented as a percentage of the maximum wear depth value obtained. Thesevere curved track has a larger number of tight curves and the results showthat these geometrical characteristics generate higher levels of wear. In fact,this track originates wear depth values 20 to 40% higher than the light curvedone. It is also observed that the wear distribution along the profiles is similarusing the two tracks. The results reveal that the highest wear values occur onboth extremities of profiles while, on the intermediate zone, the wear is 30 to60% lower.
Fig. 13. Comparison of wear results of severe and light curved tracks on: (a) leftwheel; (b) right wheel
3.3. Influence of friction conditions on wear
In order to analyse how the wear evolution is affected by the friction co-efficient µ between the wheel and rail, three simulations are carried out withdifferent values for this parameter. The friction coefficients on the wheel tre-ad and flange are defined, according to the values presented in Table 4, inorder to represent three different scenarios of trainset operation. The wearsimulations are run using the same input data and the same wear analysisparameters, except the friction coefficient. The friction values are maintainedconstant and applied over the whole track length. The vehicle model used isVehicle 1 (Fig. 3) and the track model considered is the severe curved track

764 J. Pombo et al.
(Fig. 5). The wear studies are carried out by performing several journeys onthe track until reaching the total distance of 5000 km. The results presentedin Table 4 show that the CPU time required to run the wear studies is nearlythe same for all scenarios of friction conditions.
Table 4. Wear scenarios for different friction conditions
Wear study Friction conditions µTread µFlange Distance CPU time
Reference Normal conditions 0.25 0.25Comparison 1 Very low friction 0.10 0.10 5000 km −1%Comparison 2 Very dry conditions 0.40 0.40 +2%
The left and right wheel profiles, obtained with the different friction co-efficients between the wheel and rail, are depicted in Fig. 14. A zoom-in ofthese profiles is presented in Fig. 15 in order to allow a detailed view of thedifferences among them.
Fig. 14. Influence of friction conditions – new and worn profiles on: (a) left wheel;(b) right wheel
Fig. 15. Influence of friction conditions – zoom of profiles on: (a) left wheel; (b) rightwheel
The comparison between the wear depth values obtained for different fric-tions conditions, after 5000 km of trainset operation, is shown in Fig. 16. Theseresults are presented as a percentage of the maximum wear depth value obta-ined. It is observed that the higher friction coefficients originate greater levelsof wear. In general, differences between 15 and 20% of wear depth are detectedamong the three scenarios studied here. In addition, it is observed that, for

A railway wheel wear prediction tool... 765
the two scenarios of lower friction between the wheel and rail, the highest wearvalues occur on both the tread and flange zones of the profiles. For the scena-rio of very dry conditions, the wheel flanges are the zones subjected to higherlevels of wear. This result is perhaps not surprising as changing the frictioncoefficient will, as well as altering the dynamic response of the vehicle, lead todifferent Tγ values being generated in the wheel-rail contact. This will givedifferent levels of wear and maybe even a transition to another wear regime. Itshould be noted that the causes of varying friction, for example water or oil inthe contact, will also change the wear mechanism, and the wear data curren-tly used in the model is for dry conditions. More work is required to build-upwear curves for contaminated contacts to overcome this problem. The sameissue applies to the modelling in the next Section where flange lubrication ismimicked by altering the friction coefficient in this region.
Fig. 16. Comparison of wear results with different friction conditions on: (a) leftwheel; (b) right wheel
3.4. Influence of wheel flanges lubrication on wear
With the purpose to study how the wear growth is influenced by the whe-el flanges lubrication, two additional wear studies are performed here. Theyconsist of studying the scenarios of normal conditions and of very dry condi-tions, described in Table 4, but using reduced friction coefficients between thewheel flanges and rails. The wear analyses are run using the same input dataand the same wear parameters described in the previous section, except theflange friction coefficient. In Table 5, the analysis conditions for the scenariosof flange lubrication are summarised.
Table 5. Analysis conditions for wheel flanges lubrication scenarios
Flange lubrication scenarios µTread µFlange
Normal conditions 0.25 0.10Very dry conditions 0.40 0.10
766 J. Pombo et al.
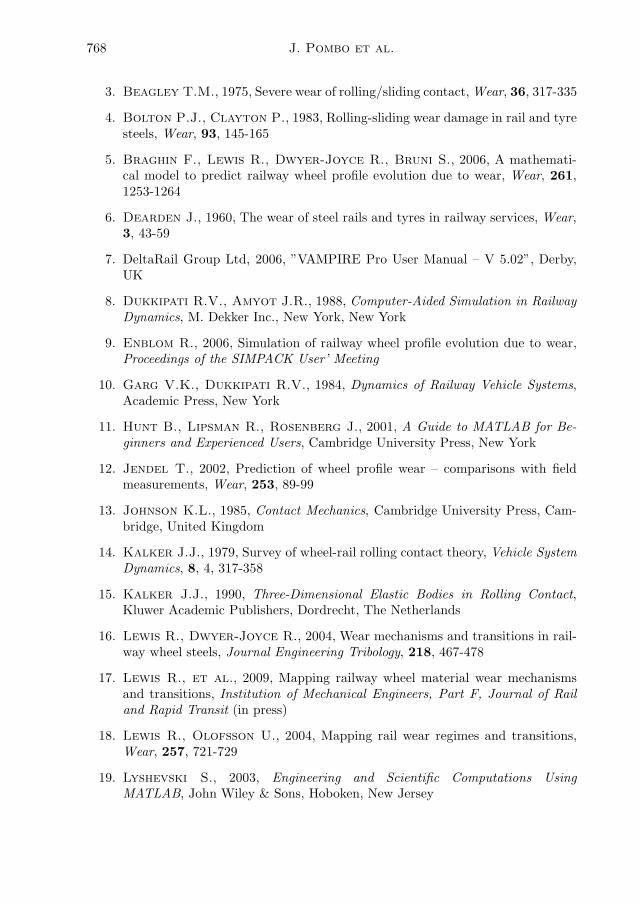
The comparison between the wear depth results obtained with and withoutwheel flanges lubrication for the scenarios of normal conditions and of verydry conditions are depicted in Fig. 17 and Fig. 18, respectively. These valuesare presented as a percentage of the maximum wear depth value obtained ineach case.
Fig. 17. Wear results with flange lubrication for normal conditions on: (a) left wheel;(b) right wheel
Fig. 18. Wear results with flange lubrication for very dry conditions on: (a) leftwheel; (b) right wheel
The results presented here show that the reduction of the friction coeffi-cient on the wheel flanges has significant advantages in terms of wear evolutionon that zones. In the normal conditions scenario, the results from Fig. 17 de-monstrate that the flange lubrication originates about less 20% wear on theflanges, after 5000 km of trainset operation. For the scenario of very dry con-ditions, the results depicted in Fig. 18 show that about 35% of wear reductioncan be achieved on the wheel flanges when using lubrication of that zones.
4. Conclusions
In this work, a computational tool to predict the wheel profiles evolution due towear of a given railway system is presented. The wear prediction tool consists

A railway wheel wear prediction tool... 767
of pre- and post-processing packages that are interfaced with a commercialMBS. The MBS is used to study the railway dynamic problem and its inputand output data are managed in a proper way to compute the wear evolution.The wear tool is applied here to several operation scenarios. The studies
carried out aim to evaluate the influence on wear growth of train design, tracklayout and friction coefficient the between wheel and rail. The comparison ofresults obtained with the two railway vehicles considered here reveals that, ingeneral, the wear on the vehicle from a conventional trainset is less than thewear obtained with the trainset having Jacobs’ bogies.The comparative wear study between two tracks with different layouts
was also performed here. The results show that the wear depth values on thetrack with a larger number of tight curves are 20 to 40% higher than the onesobtained in the track with mainly straight geometry.In this work, a comparison between the wear evolution results obtained
with different friction conditions is also performed. It is observed that higherfriction coefficients originate greater levels of wear. Differences between 15 and20% of wear depth are detected among the three scenarios studied. Regardingthe wear evolution on railway wheels, the most favourable scenario is the onewith low friction between the wheel and rail.The wear prediction tool allows defining separately the friction coefficients
on the wheel tread and flange. This feature is used here to study the influenceof wheel flanges lubrication on wear growth. The results show the importanceof using flange lubrication devices as the reduction of the friction coefficienton these zones can significantly reduce the wear progression on the railwaywheels.
Acknowledgements
The work presented here has been developed in the framework of the European
Project AWARE (Reliable Prediction of the Wear of Railway Wheels). The project
is supported by the European Community under the Sixth Framework Programme
Marie Curie Actions: Host Fellowships, Transfer of Knowledge (TOK-IAP) with the
contract number MTKI-CT-2006 – 042358.
References
1. AEA Technology plc (2004) ”VAMPIRE User Manual - V 4.32”, Derby, UK
2. Andersson E., Berg M., Stichel S., 1998, Rail Vehicle Dynamics, Fun-damentals and Guidelines, Royal Institute of Technology (KTH), Stockholm,Sweden
768 J. Pombo et al.
3. Beagley T.M., 1975, Severe wear of rolling/sliding contact,Wear, 36, 317-335
4. Bolton P.J., Clayton P., 1983, Rolling-sliding wear damage in rail and tyresteels, Wear, 93, 145-165
5. Braghin F., Lewis R., Dwyer-Joyce R., Bruni S., 2006, A mathemati-cal model to predict railway wheel profile evolution due to wear, Wear, 261,1253-1264
6. Dearden J., 1960, The wear of steel rails and tyres in railway services,Wear,3, 43-59
7. DeltaRail Group Ltd, 2006, ”VAMPIRE Pro User Manual – V 5.02”, Derby,UK
8. Dukkipati R.V., Amyot J.R., 1988, Computer-Aided Simulation in RailwayDynamics, M. Dekker Inc., New York, New York
9. Enblom R., 2006, Simulation of railway wheel profile evolution due to wear,Proceedings of the SIMPACK User’ Meeting
10. Garg V.K., Dukkipati R.V., 1984, Dynamics of Railway Vehicle Systems,Academic Press, New York
11. Hunt B., Lipsman R., Rosenberg J., 2001, A Guide to MATLAB for Be-ginners and Experienced Users, Cambridge University Press, New York
12. Jendel T., 2002, Prediction of wheel profile wear – comparisons with fieldmeasurements, Wear, 253, 89-99
13. Johnson K.L., 1985, Contact Mechanics, Cambridge University Press, Cam-bridge, United Kingdom
14. Kalker J.J., 1979, Survey of wheel-rail rolling contact theory, Vehicle SystemDynamics, 8, 4, 317-358
15. Kalker J.J., 1990, Three-Dimensional Elastic Bodies in Rolling Contact,Kluwer Academic Publishers, Dordrecht, The Netherlands
16. Lewis R., Dwyer-Joyce R., 2004, Wear mechanisms and transitions in rail-way wheel steels, Journal Engineering Tribology, 218, 467-478
17. Lewis R., et al., 2009, Mapping railway wheel material wear mechanismsand transitions, Institution of Mechanical Engineers, Part F, Journal of Railand Rapid Transit (in press)
18. Lewis R., Olofsson U., 2004, Mapping rail wear regimes and transitions,Wear, 257, 721-729
19. Lyshevski S., 2003, Engineering and Scientific Computations UsingMATLAB, John Wiley & Sons, Hoboken, New Jersey
A railway wheel wear prediction tool... 769
20. Meinders T., Meinke P., 2002, Rotor dynamics and irregular wear of elasticwheelsets, In: System Dynamics and Long-Term Behaviour of Railway Vehic-les: Track and Subgrade, Popp K. and Schiehlen W. (Eds.), Springer, Berlin,Germany, 133-152
21. Pearce T., Sherratt N., 1991, Prediction of wheel profile wear,Wear, 144,343-351
22. Pombo J., Ambrósio J., 2008, Application of a wheel-rail contact model torailway dynamics in small radius curved tracks, Multibody Systems Dynamics,19, 91-114
23. Pombo J., Ambrósio J., Silva M., 2007, A new wheel-rail contact model forrailway dynamics, Vehicle System Dynamics, 45, 2, 165-189
24. Quost X., et al., 2008a, A numerical model of twin disc test arrangementfor evaluating railway wheel wear prediction algorithms, Proceedings of theSTLE/ASME International Joint Tribology Conference (IJTC 2008), Miami,Florida, October 20-22
25. Quost X., et al., 2008b, Predicting railway wheel wear starting from mul-tibody analysis: a preliminary study, Proceedings of 2008 IEEE/ASME JointRail Conference (JRC 2008), Wilmington, DE, April 22-24
26. Ramalho A., 2008, A geometrical model to predict the wear evolution ofcoated surfaces, Wear, 264, 775-780
27. Ramalho A., Miranda J., 2006, The relationship between wear and dissipa-ted energy in sliding systems, Wear, 260, 361-367
28. Tassini N., et al., 2008, Parametric study of a new railway wheel wear predic-tion tool based on commercial MBS software, Proceedings of EURNEX-ZEL08Conference, Zilina, Slovakia, June 4-5
29. Tassini N., Quost X., Lewis R., Dwyer-Joyce R., Ariaudo C., KukaN., 2010, A numerical model of twin disc test arrangement for the evaluationof railway wheel wear prediction methods, Wear, 268, 5/6, 660-667
Modelowanie zużycia kół pojazdów szynowych za pomocą narzędzi
symulacyjnych opartych na oprogramowaniu dla układów wielobryłowych
Streszczenie
Przewidywanie stopnia zużycia kół pojazdów szynowych jest zagadnieniem o klu-czowym znaczeniu w badaniach taboru kolejowego pod względem ekonomicznym, bez-pieczeństwa, eksploatacyjnym i serwisowym. Celem tej pracy jest opis zastosowaniaelastycznego narzędzia komputerowego pozwalającego na symulację procesu zużyciakół w zależności od rodzaju pojazdu szynowego lub całego składu, w efekcie którego

770 J. Pombo et al.
otrzymuje się ewolucję profilu kół w funkcji przebytej drogi. Narzędzie to wykorzystu-je sekwencję pakietów do pre- i post-procesorowego przetwarzania, w których zawartonajnowsze metodologie obliczeń zintegrowane z komercyjnym oprogramowaniem sto-sowanym w kolejnictwie do badań dynamiki pociągów. Narzędzie to zaprezentowanona przykładzie różnych scenariuszy odnoszących się do kilku konkretnych warunkówjazdy. Głównym celem było zademonstrowanie efektywności symulacji zużycia kółpoprzez ilościowe określenie wpływu rodzaju składu pociągu i parametrów trasy naprzebieg tego zużycia. Szczególną uwagę zwrócono na wrażliwość metody w odwzoro-wywaniu profilu kół w zależności od warunków tarcia pomiędzy kołem a szyną.
Manuscript received November 12, 2009, accepted for print February 26, 2010