Embed Size (px)
Citation preview
A R A N E T A P R O P E R T I E S , I N C . 2 1 S T F L O O R C I T I B A N K T O W E R P A S E O D E R O X A S , S A L C E D O V I L L A G E , M A K A T I C I T Y P H I L I P P I N E S 1 2 0 0
P H O N E : ( 6 3 2 ) 8 4 8 1 5 0 1 T O 0 4 • F A X : ( 6 3 2 ) 8 4 8 - 1 4 9 5 • E - M A I L a r a @ i n f o . c o m . p h
November 12, 2014
THE PHILIPPINE STOCK EXCHANGE, INC.
Philippine Stock Exchange Plaza
Ayala Triangle, Ayala Avenue, Makati City
Attention: MS. JANET A. ENCARNACION
Head – Disclosure Department
Gentlemen:
In view of Araneta Properties, Inc.’s 17Q disclosure, we would like to submit the Amended 17Q
report with changes on page 5 thereof.
Thank you.
Very truly yours,
JOSE FIDEL R. ACUÑA
SEC Number 152249 File Number .
ARANETA PROPERTIES INCORPORATED Company’s Full name
21st Floor Citibank Tower, Paseo de Roxas, Makati City Company’s Address
(632) 848-1501 Telephone Number
December 31 . Fiscal Year Ending
(month & day)
_ 17-Q_3rd Quarter ____.
Form Type
______ Amended Designation (if applicable)
September 30, 2014 Period Ended Date
_____Registered and Listed . Secondary License Type and File Number

SECURITIES AND EXCHANGE COMMISSION
SEC FORM 17-Q
QUARTERLY REPORT PURSUANT TO SECTION 17 OF THE SECURITIES REGULATION CODE AND SRC RULE 17(2) (b) THEREUNDER
1. For the quarterly period ended September 30, 2014 2. SEC Identification No. 152249 3. BIR Tax Identification No. 050-000-840-355
4. Exact name of issuer as specified in its charter: ARANETA PROPERTIES, INC. 5. _________________
Province, country or other jurisdiction of incorporation or organization
6. Industry Classification Code: (SEC Use Only)
7. 21st Floor, Citibank Tower, Paseo de Roxas, Makati City Address of issuer’s principal office Postal Code 8. (632) 848-1501 Registrant’s telephone number, including area code 9. Former name, former address, and former fiscal year, if changed since last report 10. Securities registered pursuant to Sections 8 and 12 of the Code, or Section 4 and 8 of the RSA
Title of Each Class Number of Shares of Common Stock Outstanding and
Amount of Debt Outstanding 1,561,110,070 11. Are any or all of these securities listed on the Philippine Stock Exchange? Yes [X] No [ ] 12. Indicate by check mark whether the registrant: (a) has filed all reports required to be filed by Section 17 of the Code and SRC Rule 17 thereunder or Sections
11 of the RSA and RSA Rule 11(a)-1 thereunder and Sections 26 and 141 of the Corporation Code of the Philippines during the preceding twelve (12) months (or for such shorter period that the registrant was required to file such reports):
Yes [X] No [ ] (b) has been subject to such filing requirements for the past 90 days.
Yes [X] No [ ]
PART I - FINANCIAL INFORMATION
Item 1. Financial Statements
The financial statements of Araneta Properties Incorporated (ARA) are filed as part of this Form 17-Q.
Item 2. Management’s Discussion and Analysis of Financial Condition and Results of Operations; Plan of Operation
During the third quarter of 2014
Plan of Operation The Company sales output during the period performs well as compared with that of the third quarter of the previous year, this performance is a result of the present economic stability and as well as the marketing strategies being implemented specifically the price watch which shows higher forecast of demand in the real estate within the locality, evidenced by the launching of real estate projects of Ayala land Development, Inc. as well as the Avida Land, Inc. in San Jose Del Monte, Bulacan area.
Another bright future seen in the coming years is the plan of the National Gov’ on the expansion of the MRT/LRT from Quezon City LRT (from Welcome Rotonda through Commonwealth Avenue with the proposed extension via Quirino Highway to Norzaragay). This will provide faster, easier access to and from Metro Manila which absolutely may influence the demand in the real estate business in the north.
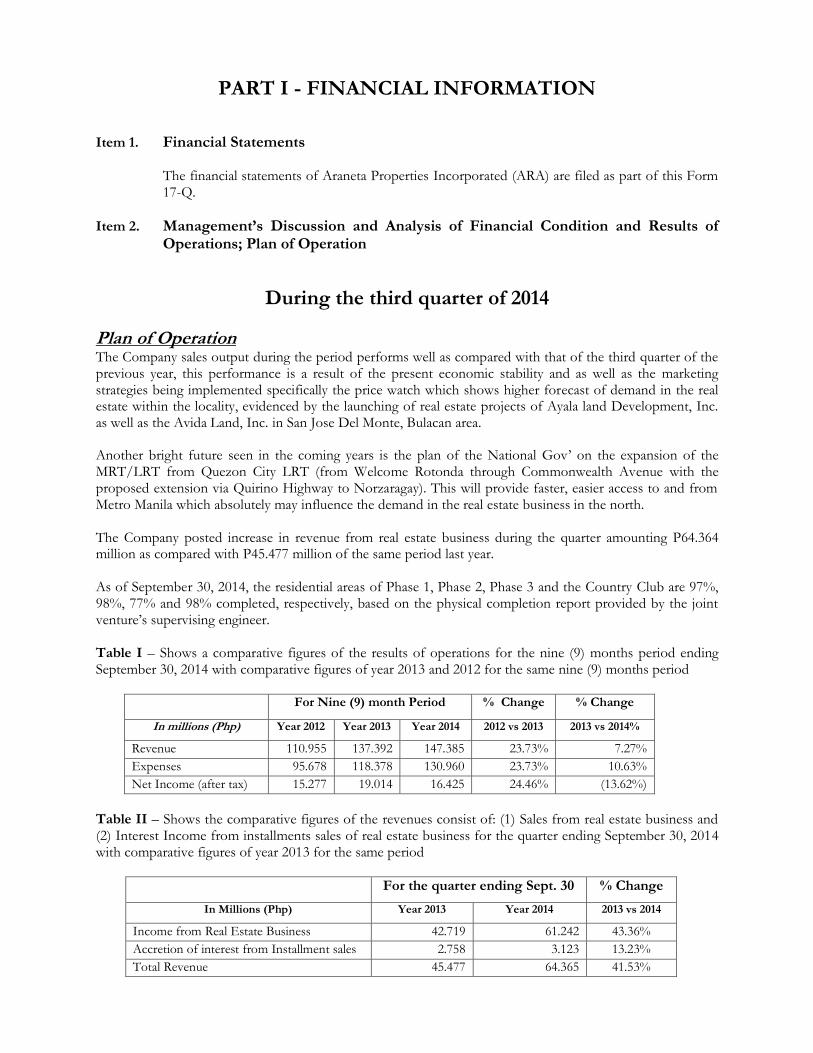
The Company posted increase in revenue from real estate business during the quarter amounting P64.364 million as compared with P45.477 million of the same period last year.
As of September 30, 2014, the residential areas of Phase 1, Phase 2, Phase 3 and the Country Club are 97%, 98%, 77% and 98% completed, respectively, based on the physical completion report provided by the joint venture’s supervising engineer.
Table I – Shows a comparative figures of the results of operations for the nine (9) months period ending September 30, 2014 with comparative figures of year 2013 and 2012 for the same nine (9) months period
For Nine (9) month Period % Change % Change
In millions (Php) Year 2012 Year 2013 Year 2014 2012 vs 2013 2013 vs 2014%
Revenue 110.955 137.392 147.385 23.73% 7.27%
Expenses 95.678 118.378 130.960 23.73% 10.63%
Net Income (after tax) 15.277 19.014 16.425 24.46% (13.62%)
Table II – Shows the comparative figures of the revenues consist of: (1) Sales from real estate business and (2) Interest Income from installments sales of real estate business for the quarter ending September 30, 2014 with comparative figures of year 2013 for the same period
For the quarter ending Sept. 30 % Change
In Millions (Php) Year 2013 Year 2014 2013 vs 2014
Income from Real Estate Business 42.719 61.242 43.36%
Accretion of interest from Installment sales 2.758 3.123 13.23%
Total Revenue 45.477 64.365 41.53%
Management’s Discussion & Analysis or plan of operation Results of Operation (January– September 30, 2014 - vs- January - September 30, 2013) During the third quarter the scenario of business shows very healthy in all aspect, this includes the real estate as there are reputable real estate companies that started their development and marketing operations in San Jose Del Monte, Bulacan. This scenario sending positively business opportunity in the locality which directly benefited the previous year’s land banking activity.
Total lots sold during the nine (9) months is One Hundred Six Thousand Three Hundred Eighty Five (106,385) square meter, Thus the Company has already sold a total area of Nine Hundred Eleven Thousand Six Hundred Forty Eight (911,348) square meter as of September 30, 2014.
The company has posted a net profit (after tax) of P16.425 Million in the third quarter of 2014 as compared with the P19.014 million in 2013 of that same period. of the same period.
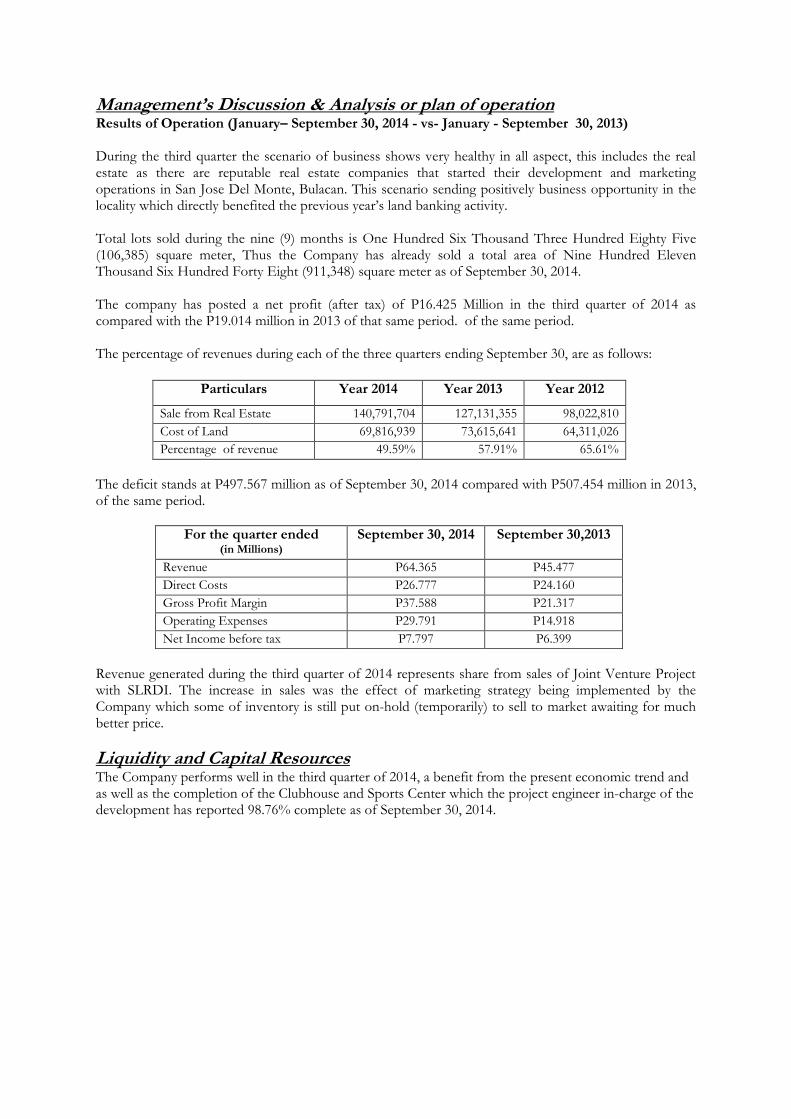
The percentage of revenues during each of the three quarters ending September 30, are as follows:
Particulars Year 2014 Year 2013 Year 2012
Sale from Real Estate 140,791,704 127,131,355 98,022,810
Cost of Land 69,816,939 73,615,641 64,311,026
Percentage of revenue 49.59% 57.91% 65.61%
The deficit stands at P497.567 million as of September 30, 2014 compared with P507.454 million in 2013, of the same period.
For the quarter ended (in Millions)
September 30, 2014
September 30,2013
Revenue P64.365 P45.477
Direct Costs P26.777 P24.160
Gross Profit Margin P37.588 P21.317
Operating Expenses P29.791 P14.918
Net Income before tax P7.797 P6.399
Revenue generated during the third quarter of 2014 represents share from sales of Joint Venture Project with SLRDI. The increase in sales was the effect of marketing strategy being implemented by the Company which some of inventory is still put on-hold (temporarily) to sell to market awaiting for much better price.
Liquidity and Capital Resources The Company performs well in the third quarter of 2014, a benefit from the present economic trend and as well as the completion of the Clubhouse and Sports Center which the project engineer in-charge of the development has reported 98.76% complete as of September 30, 2014.
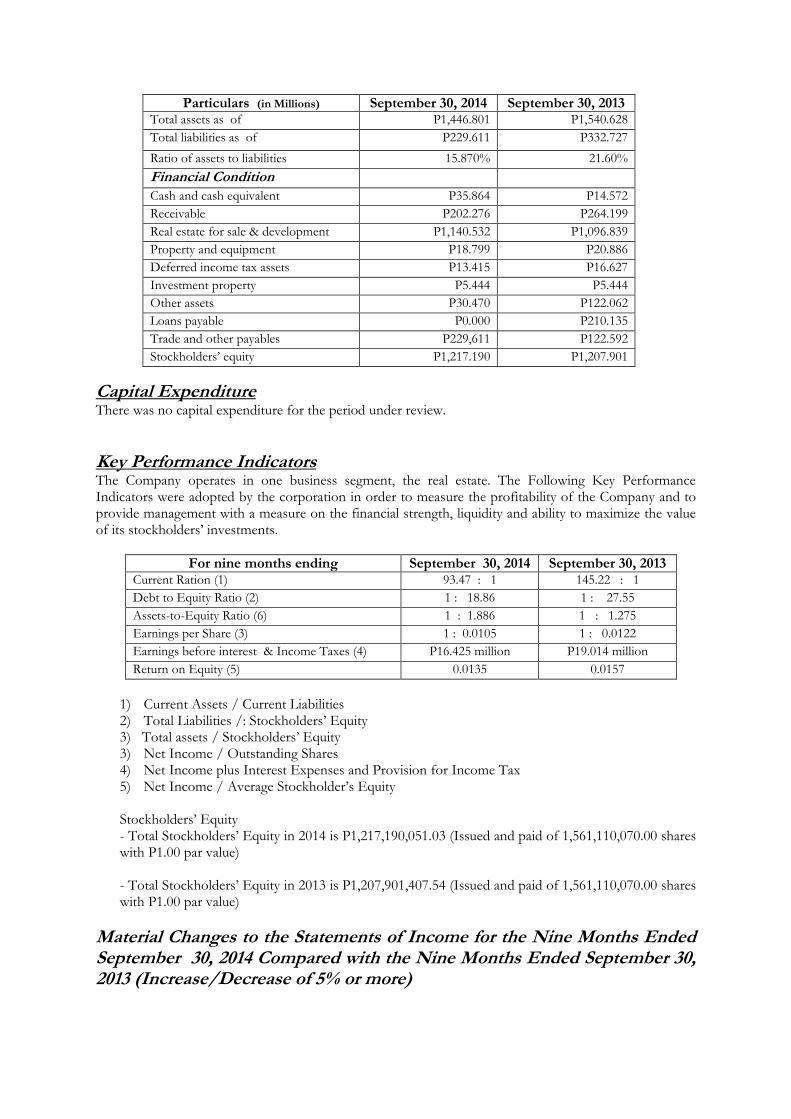
Capital Expenditure There was no capital expenditure for the period under review.
Key Performance Indicators
The Company operates in one business segment, the real estate. The Following Key Performance Indicators were adopted by the corporation in order to measure the profitability of the Company and to provide management with a measure on the financial strength, liquidity and ability to maximize the value of its stockholders’ investments.
For nine months ending September 30, 2014 September 30, 2013 Current Ration (1) 93.47 : 1 145.22 : 1
Debt to Equity Ratio (2) 1 : 18.86 1 : 27.55
Assets-to-Equity Ratio (6) 1 : 1.886 1 : 1.275
Earnings per Share (3) 1 : 0.0105 1 : 0.0122
Earnings before interest & Income Taxes (4) P16.425 million P19.014 million
Return on Equity (5) 0.0135 0.0157
1) Current Assets / Current Liabilities 2) Total Liabilities /: Stockholders’ Equity 3) Total assets / Stockholders’ Equity 3) Net Income / Outstanding Shares 4) Net Income plus Interest Expenses and Provision for Income Tax 5) Net Income / Average Stockholder’s Equity
Stockholders’ Equity - Total Stockholders’ Equity in 2014 is P1,217,190,051.03 (Issued and paid of 1,561,110,070.00 shares with P1.00 par value)
- Total Stockholders’ Equity in 2013 is P1,207,901,407.54 (Issued and paid of 1,561,110,070.00 shares with P1.00 par value)
Material Changes to the Statements of Income for the Nine Months Ended September 30, 2014 Compared with the Nine Months Ended September 30, 2013 (Increase/Decrease of 5% or more)
Particulars (in Millions) September 30, 2014 September 30, 2013 Total assets as of P1,446.801 P1,540.628
Total liabilities as of P229.611 P332.727
Ratio of assets to liabilities 15.870% 21.60%
Financial Condition
Cash and cash equivalent P35.864 P14.572
Receivable P202.276 P264.199
Real estate for sale & development P1,140.532 P1,096.839
Property and equipment P18.799 P20.886
Deferred income tax assets P13.415 P16.627
Investment property P5.444 P5.444
Other assets P30.470 P122.062
Loans payable P0.000 P210.135
Trade and other payables P229,611 P122.592
Stockholders’ equity P1,217.190 P1,207.901
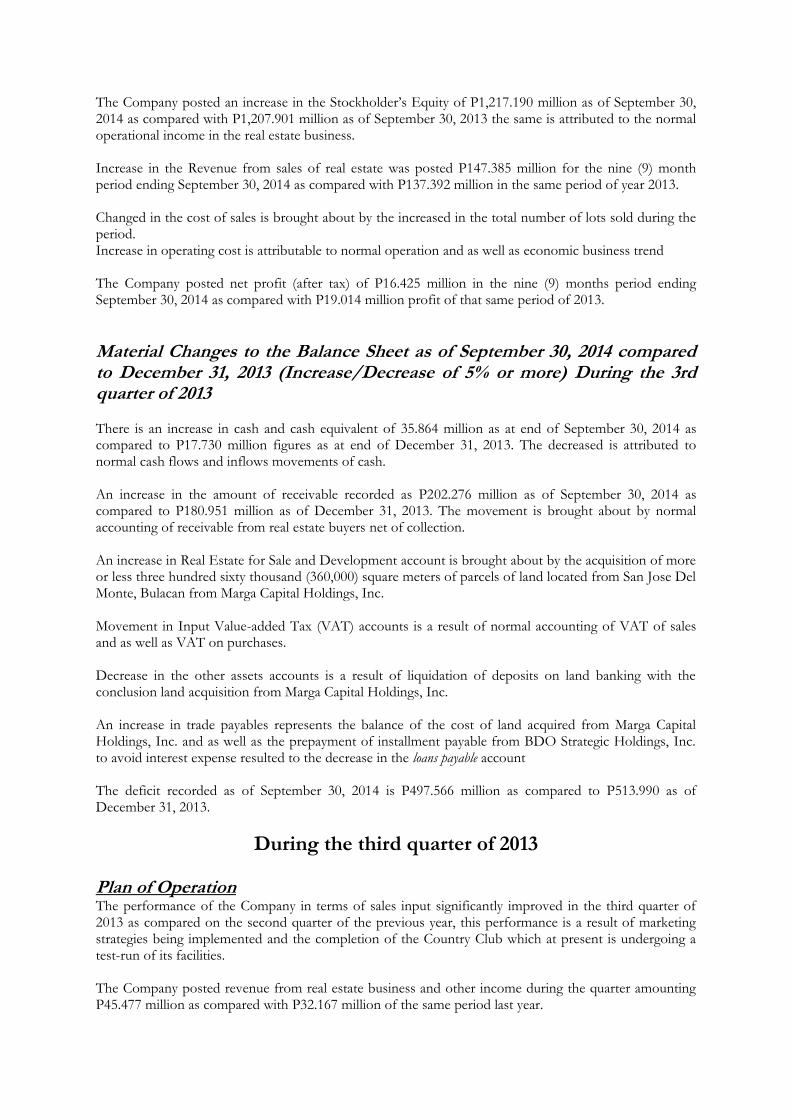
The Company posted an increase in the Stockholder’s Equity of P1,217.190 million as of September 30, 2014 as compared with P1,207.901 million as of September 30, 2013 the same is attributed to the normal operational income in the real estate business.
Increase in the Revenue from sales of real estate was posted P147.385 million for the nine (9) month period ending September 30, 2014 as compared with P137.392 million in the same period of year 2013.
Changed in the cost of sales is brought about by the increased in the total number of lots sold during the period. Increase in operating cost is attributable to normal operation and as well as economic business trend
The Company posted net profit (after tax) of P16.425 million in the nine (9) months period ending September 30, 2014 as compared with P19.014 million profit of that same period of 2013.
Material Changes to the Balance Sheet as of September 30, 2014 compared to December 31, 2013 (Increase/Decrease of 5% or more) During the 3rd quarter of 2013
There is an increase in cash and cash equivalent of 35.864 million as at end of September 30, 2014 as compared to P17.730 million figures as at end of December 31, 2013. The decreased is attributed to normal cash flows and inflows movements of cash.
An increase in the amount of receivable recorded as P202.276 million as of September 30, 2014 as compared to P180.951 million as of December 31, 2013. The movement is brought about by normal accounting of receivable from real estate buyers net of collection. An increase in Real Estate for Sale and Development account is brought about by the acquisition of more or less three hundred sixty thousand (360,000) square meters of parcels of land located from San Jose Del Monte, Bulacan from Marga Capital Holdings, Inc. Movement in Input Value-added Tax (VAT) accounts is a result of normal accounting of VAT of sales and as well as VAT on purchases. Decrease in the other assets accounts is a result of liquidation of deposits on land banking with the conclusion land acquisition from Marga Capital Holdings, Inc. An increase in trade payables represents the balance of the cost of land acquired from Marga Capital Holdings, Inc. and as well as the prepayment of installment payable from BDO Strategic Holdings, Inc. to avoid interest expense resulted to the decrease in the loans payable account The deficit recorded as of September 30, 2014 is P497.566 million as compared to P513.990 as of December 31, 2013.
During the third quarter of 2013 Plan of Operation The performance of the Company in terms of sales input significantly improved in the third quarter of 2013 as compared on the second quarter of the previous year, this performance is a result of marketing strategies being implemented and the completion of the Country Club which at present is undergoing a test-run of its facilities.
The Company posted revenue from real estate business and other income during the quarter amounting P45.477 million as compared with P32.167 million of the same period last year.
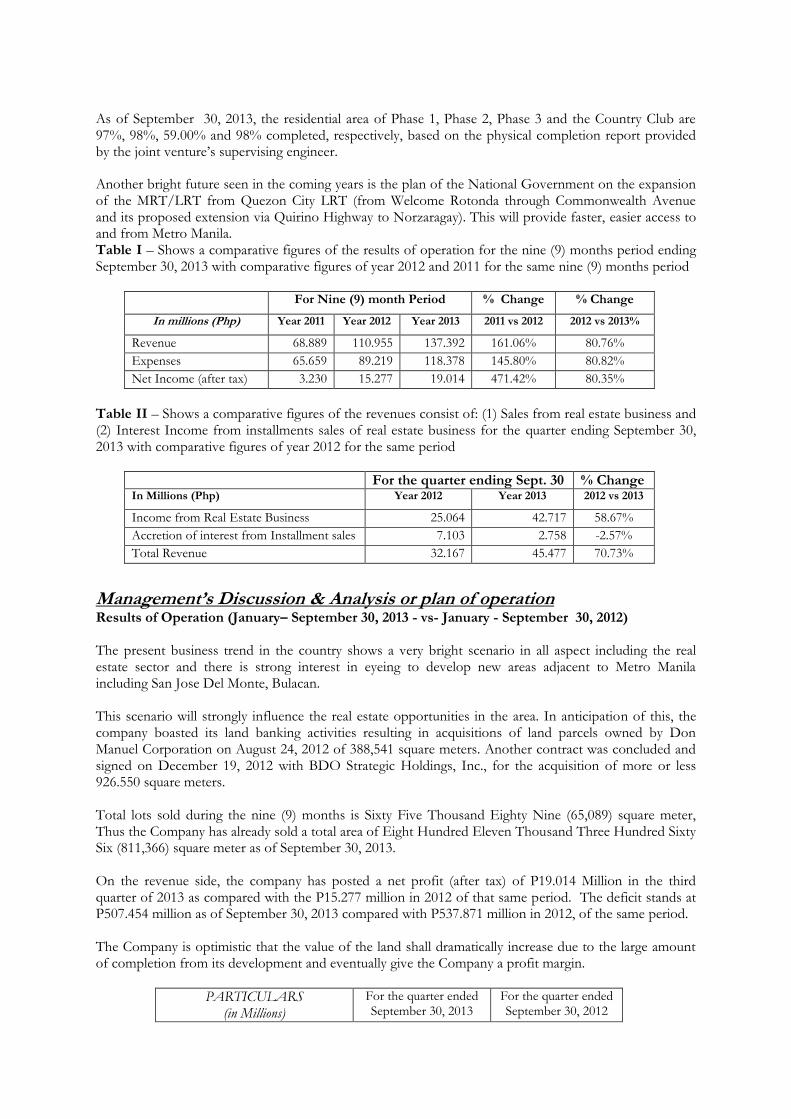
As of September 30, 2013, the residential area of Phase 1, Phase 2, Phase 3 and the Country Club are 97%, 98%, 59.00% and 98% completed, respectively, based on the physical completion report provided by the joint venture’s supervising engineer.
Another bright future seen in the coming years is the plan of the National Government on the expansion of the MRT/LRT from Quezon City LRT (from Welcome Rotonda through Commonwealth Avenue and its proposed extension via Quirino Highway to Norzaragay). This will provide faster, easier access to and from Metro Manila. Table I – Shows a comparative figures of the results of operation for the nine (9) months period ending September 30, 2013 with comparative figures of year 2012 and 2011 for the same nine (9) months period
For Nine (9) month Period % Change % Change
In millions (Php) Year 2011 Year 2012 Year 2013 2011 vs 2012 2012 vs 2013%
Revenue 68.889 110.955 137.392 161.06% 80.76%
Expenses 65.659 89.219 118.378 145.80% 80.82%
Net Income (after tax) 3.230 15.277 19.014 471.42% 80.35%
Table II – Shows a comparative figures of the revenues consist of: (1) Sales from real estate business and (2) Interest Income from installments sales of real estate business for the quarter ending September 30, 2013 with comparative figures of year 2012 for the same period
For the quarter ending Sept. 30 % Change In Millions (Php) Year 2012 Year 2013 2012 vs 2013
Income from Real Estate Business 25.064 42.717 58.67%
Accretion of interest from Installment sales 7.103 2.758 -2.57%
Total Revenue 32.167 45.477 70.73%
Management’s Discussion & Analysis or plan of operation Results of Operation (January– September 30, 2013 - vs- January - September 30, 2012)
The present business trend in the country shows a very bright scenario in all aspect including the real estate sector and there is strong interest in eyeing to develop new areas adjacent to Metro Manila including San Jose Del Monte, Bulacan.
This scenario will strongly influence the real estate opportunities in the area. In anticipation of this, the company boasted its land banking activities resulting in acquisitions of land parcels owned by Don Manuel Corporation on August 24, 2012 of 388,541 square meters. Another contract was concluded and signed on December 19, 2012 with BDO Strategic Holdings, Inc., for the acquisition of more or less 926.550 square meters.
Total lots sold during the nine (9) months is Sixty Five Thousand Eighty Nine (65,089) square meter, Thus the Company has already sold a total area of Eight Hundred Eleven Thousand Three Hundred Sixty Six (811,366) square meter as of September 30, 2013.
On the revenue side, the company has posted a net profit (after tax) of P19.014 Million in the third quarter of 2013 as compared with the P15.277 million in 2012 of that same period. The deficit stands at P507.454 million as of September 30, 2013 compared with P537.871 million in 2012, of the same period. The Company is optimistic that the value of the land shall dramatically increase due to the large amount of completion from its development and eventually give the Company a profit margin.
PARTICULARS (in Millions)
For the quarter ended September 30, 2013
For the quarter ended September 30, 2012
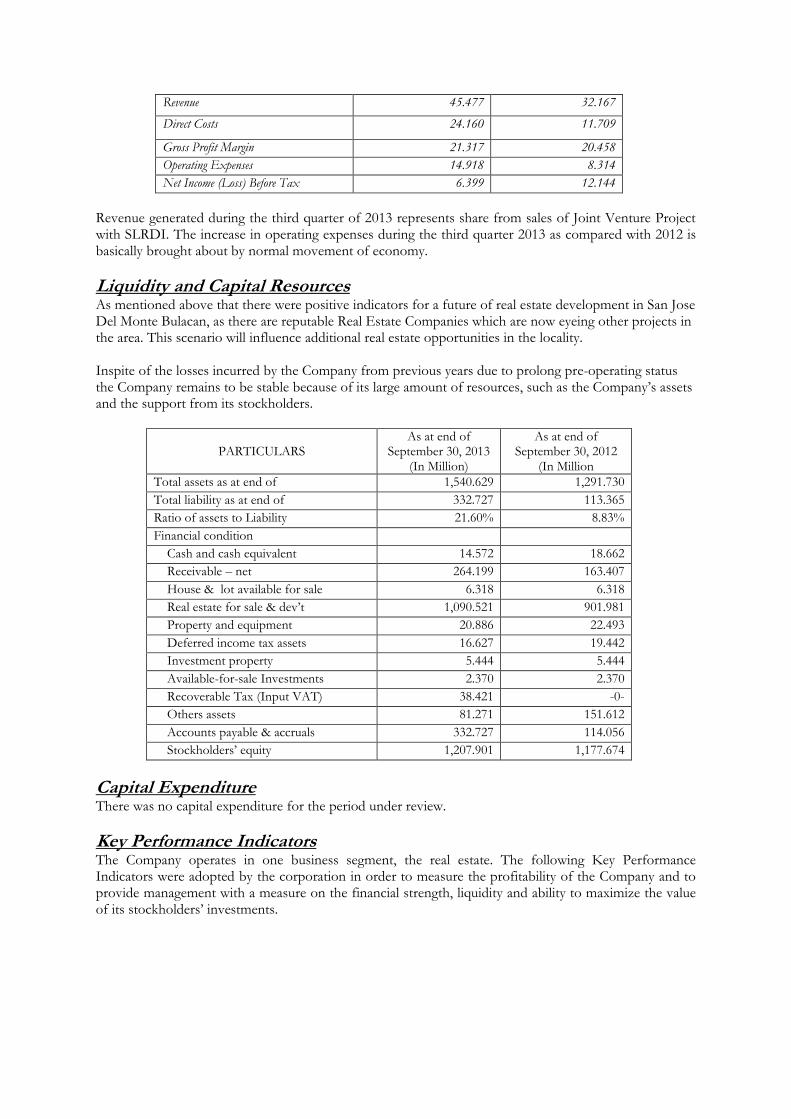
Revenue 45.477 32.167
Direct Costs 24.160 11.709
Gross Profit Margin 21.317 20.458
Operating Expenses 14.918 8.314
Net Income (Loss) Before Tax 6.399 12.144
Revenue generated during the third quarter of 2013 represents share from sales of Joint Venture Project with SLRDI. The increase in operating expenses during the third quarter 2013 as compared with 2012 is basically brought about by normal movement of economy.
Liquidity and Capital Resources As mentioned above that there were positive indicators for a future of real estate development in San Jose Del Monte Bulacan, as there are reputable Real Estate Companies which are now eyeing other projects in the area. This scenario will influence additional real estate opportunities in the locality.
Inspite of the losses incurred by the Company from previous years due to prolong pre-operating status the Company remains to be stable because of its large amount of resources, such as the Company’s assets and the support from its stockholders.
PARTICULARS As at end of
September 30, 2013 (In Million)
As at end of September 30, 2012
(In Million
Total assets as at end of 1,540.629 1,291.730
Total liability as at end of 332.727 113.365
Ratio of assets to Liability 21.60% 8.83%
Financial condition
Cash and cash equivalent 14.572 18.662
Receivable – net 264.199 163.407
House & lot available for sale 6.318 6.318
Real estate for sale & dev’t 1,090.521 901.981
Property and equipment 20.886 22.493
Deferred income tax assets 16.627 19.442
Investment property 5.444 5.444
Available-for-sale Investments 2.370 2.370
Recoverable Tax (Input VAT) 38.421 -0-
Others assets 81.271 151.612
Accounts payable & accruals 332.727 114.056
Stockholders’ equity 1,207.901 1,177.674
Capital Expenditure There was no capital expenditure for the period under review.
Key Performance Indicators The Company operates in one business segment, the real estate. The following Key Performance Indicators were adopted by the corporation in order to measure the profitability of the Company and to provide management with a measure on the financial strength, liquidity and ability to maximize the value of its stockholders’ investments.
1) 2)
1) Current Assets / Current Liabilities 2) Total Liabilities / Stockholders’ Equity 3) Net Income / Outstanding Shares 4) Net Income plus Interest Expenses and Provision for Income Tax 5) Net Income / Average Stockholder’s Equity 6) Asset / Equity
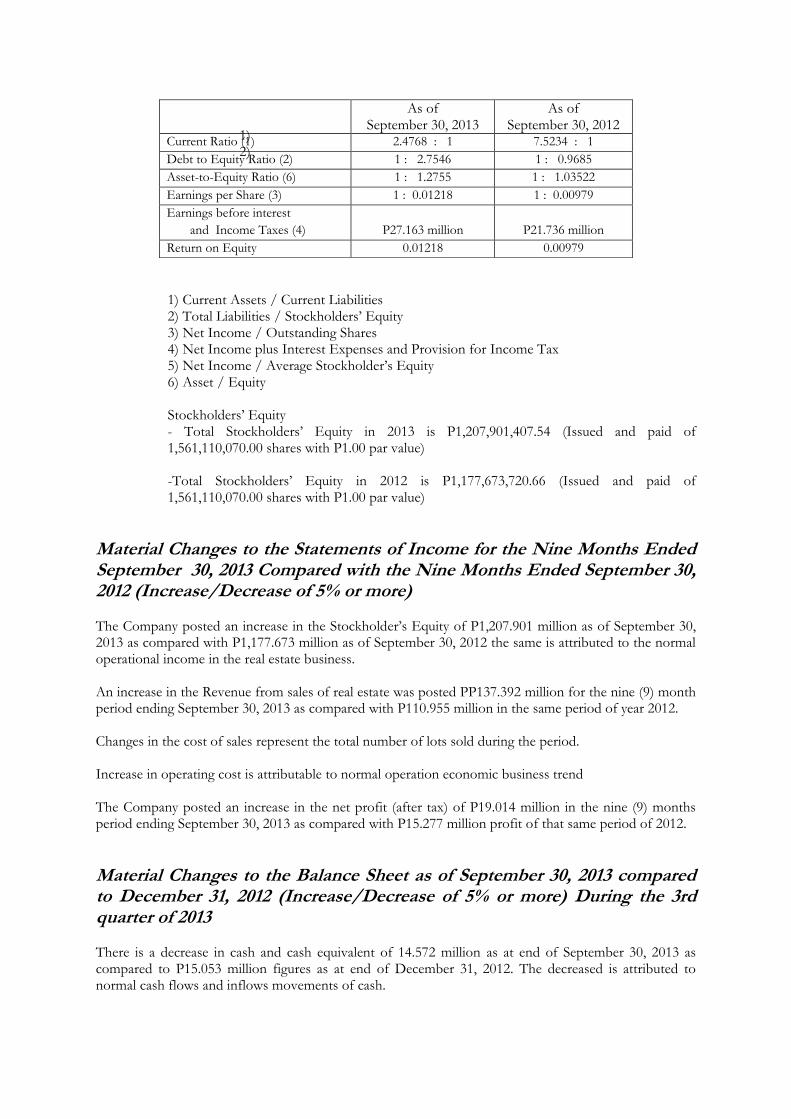
Stockholders’ Equity - Total Stockholders’ Equity in 2013 is P1,207,901,407.54 (Issued and paid of 1,561,110,070.00 shares with P1.00 par value)
-Total Stockholders’ Equity in 2012 is P1,177,673,720.66 (Issued and paid of 1,561,110,070.00 shares with P1.00 par value)
Material Changes to the Statements of Income for the Nine Months Ended September 30, 2013 Compared with the Nine Months Ended September 30, 2012 (Increase/Decrease of 5% or more) The Company posted an increase in the Stockholder’s Equity of P1,207.901 million as of September 30, 2013 as compared with P1,177.673 million as of September 30, 2012 the same is attributed to the normal operational income in the real estate business.
An increase in the Revenue from sales of real estate was posted PP137.392 million for the nine (9) month period ending September 30, 2013 as compared with P110.955 million in the same period of year 2012.
Changes in the cost of sales represent the total number of lots sold during the period.
Increase in operating cost is attributable to normal operation economic business trend
The Company posted an increase in the net profit (after tax) of P19.014 million in the nine (9) months period ending September 30, 2013 as compared with P15.277 million profit of that same period of 2012.
Material Changes to the Balance Sheet as of September 30, 2013 compared to December 31, 2012 (Increase/Decrease of 5% or more) During the 3rd quarter of 2013
There is a decrease in cash and cash equivalent of 14.572 million as at end of September 30, 2013 as compared to P15.053 million figures as at end of December 31, 2012. The decreased is attributed to normal cash flows and inflows movements of cash.
As of September 30, 2013
As of September 30, 2012
Current Ratio (1) 2.4768 : 1 7.5234 : 1
Debt to Equity Ratio (2) 1 : 2.7546 1 : 0.9685
Asset-to-Equity Ratio (6) 1 : 1.2755 1 : 1.03522
Earnings per Share (3) 1 : 0.01218 1 : 0.00979
Earnings before interest
and Income Taxes (4)
P27.163 million
P21.736 million
Return on Equity 0.01218 0.00979
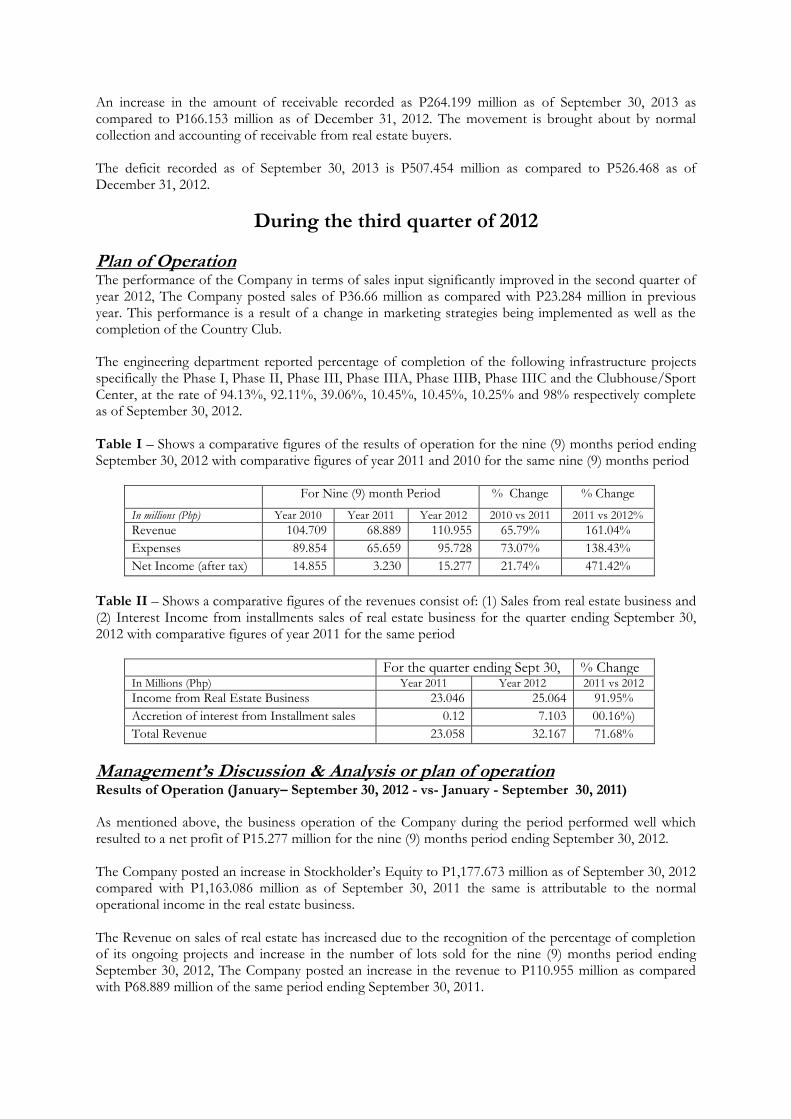
An increase in the amount of receivable recorded as P264.199 million as of September 30, 2013 as compared to P166.153 million as of December 31, 2012. The movement is brought about by normal collection and accounting of receivable from real estate buyers.
The deficit recorded as of September 30, 2013 is P507.454 million as compared to P526.468 as of December 31, 2012.
During the third quarter of 2012
Plan of Operation The performance of the Company in terms of sales input significantly improved in the second quarter of year 2012, The Company posted sales of P36.66 million as compared with P23.284 million in previous year. This performance is a result of a change in marketing strategies being implemented as well as the completion of the Country Club.
The engineering department reported percentage of completion of the following infrastructure projects specifically the Phase I, Phase II, Phase III, Phase IIIA, Phase IIIB, Phase IIIC and the Clubhouse/Sport Center, at the rate of 94.13%, 92.11%, 39.06%, 10.45%, 10.45%, 10.25% and 98% respectively complete as of September 30, 2012. Table I – Shows a comparative figures of the results of operation for the nine (9) months period ending September 30, 2012 with comparative figures of year 2011 and 2010 for the same nine (9) months period
For Nine (9) month Period % Change % Change
In millions (Php) Year 2010 Year 2011 Year 2012 2010 vs 2011 2011 vs 2012%
Revenue 104.709 68.889 110.955 65.79% 161.04%
Expenses 89.854 65.659 95.728 73.07% 138.43%
Net Income (after tax) 14.855 3.230 15.277 21.74% 471.42%
Table II – Shows a comparative figures of the revenues consist of: (1) Sales from real estate business and (2) Interest Income from installments sales of real estate business for the quarter ending September 30, 2012 with comparative figures of year 2011 for the same period
For the quarter ending Sept 30, % Change In Millions (Php) Year 2011 Year 2012 2011 vs 2012
Income from Real Estate Business 23.046 25.064 91.95%
Accretion of interest from Installment sales 0.12 7.103 00.16%)
Total Revenue 23.058 32.167 71.68%
Management’s Discussion & Analysis or plan of operation Results of Operation (January– September 30, 2012 - vs- January - September 30, 2011)
As mentioned above, the business operation of the Company during the period performed well which resulted to a net profit of P15.277 million for the nine (9) months period ending September 30, 2012.
The Company posted an increase in Stockholder’s Equity to P1,177.673 million as of September 30, 2012 compared with P1,163.086 million as of September 30, 2011 the same is attributable to the normal operational income in the real estate business.
The Revenue on sales of real estate has increased due to the recognition of the percentage of completion of its ongoing projects and increase in the number of lots sold for the nine (9) months period ending September 30, 2012, The Company posted an increase in the revenue to P110.955 million as compared with P68.889 million of the same period ending September 30, 2011.
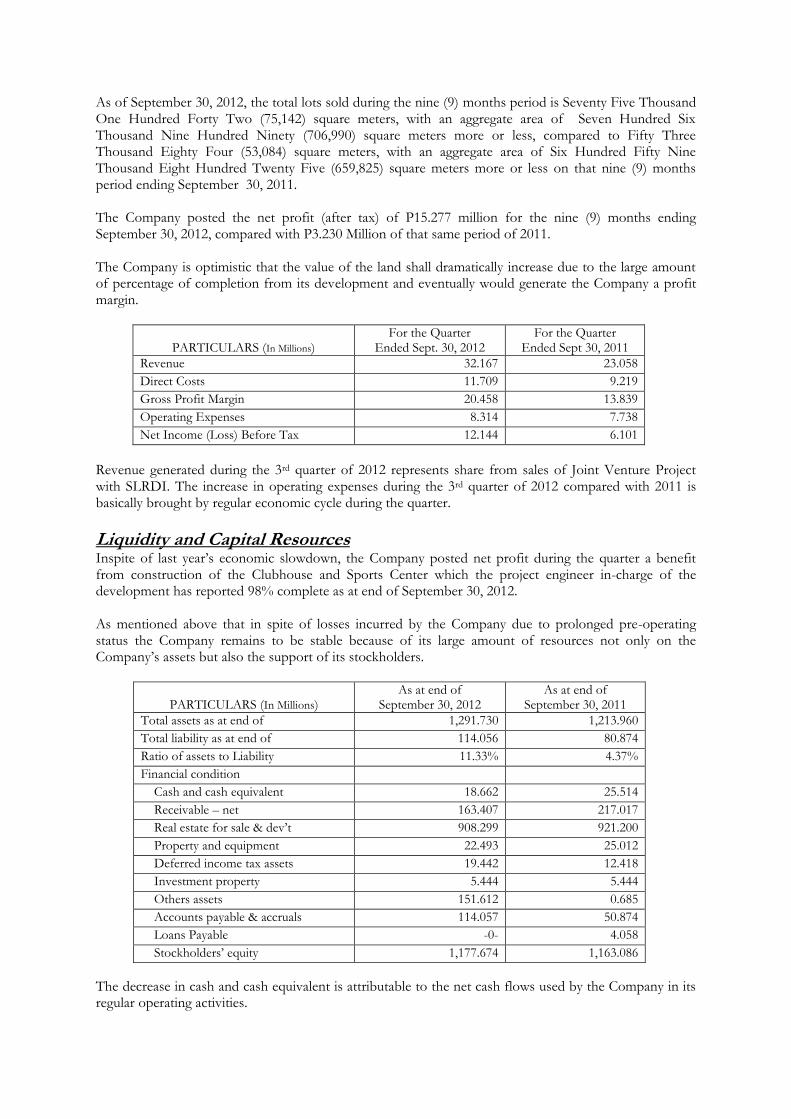
As of September 30, 2012, the total lots sold during the nine (9) months period is Seventy Five Thousand One Hundred Forty Two (75,142) square meters, with an aggregate area of Seven Hundred Six Thousand Nine Hundred Ninety (706,990) square meters more or less, compared to Fifty Three Thousand Eighty Four (53,084) square meters, with an aggregate area of Six Hundred Fifty Nine Thousand Eight Hundred Twenty Five (659,825) square meters more or less on that nine (9) months period ending September 30, 2011.
The Company posted the net profit (after tax) of P15.277 million for the nine (9) months ending September 30, 2012, compared with P3.230 Million of that same period of 2011. The Company is optimistic that the value of the land shall dramatically increase due to the large amount of percentage of completion from its development and eventually would generate the Company a profit margin.
PARTICULARS (In Millions)
For the Quarter Ended Sept. 30, 2012
For the Quarter Ended Sept 30, 2011
Revenue 32.167 23.058
Direct Costs 11.709 9.219
Gross Profit Margin 20.458 13.839
Operating Expenses 8.314 7.738
Net Income (Loss) Before Tax 12.144 6.101
Revenue generated during the 3rd quarter of 2012 represents share from sales of Joint Venture Project with SLRDI. The increase in operating expenses during the 3rd quarter of 2012 compared with 2011 is basically brought by regular economic cycle during the quarter.
Liquidity and Capital Resources Inspite of last year’s economic slowdown, the Company posted net profit during the quarter a benefit from construction of the Clubhouse and Sports Center which the project engineer in-charge of the development has reported 98% complete as at end of September 30, 2012.
As mentioned above that in spite of losses incurred by the Company due to prolonged pre-operating status the Company remains to be stable because of its large amount of resources not only on the Company’s assets but also the support of its stockholders.
PARTICULARS (In Millions) As at end of
September 30, 2012 As at end of
September 30, 2011
Total assets as at end of 1,291.730 1,213.960
Total liability as at end of 114.056 80.874
Ratio of assets to Liability 11.33% 4.37%
Financial condition
Cash and cash equivalent 18.662 25.514
Receivable – net 163.407 217.017
Real estate for sale & dev’t 908.299 921.200
Property and equipment 22.493 25.012
Deferred income tax assets 19.442 12.418
Investment property 5.444 5.444
Others assets 151.612 0.685
Accounts payable & accruals 114.057 50.874
Loans Payable -0- 4.058
Stockholders’ equity 1,177.674 1,163.086
The decrease in cash and cash equivalent is attributable to the net cash flows used by the Company in its regular operating activities.
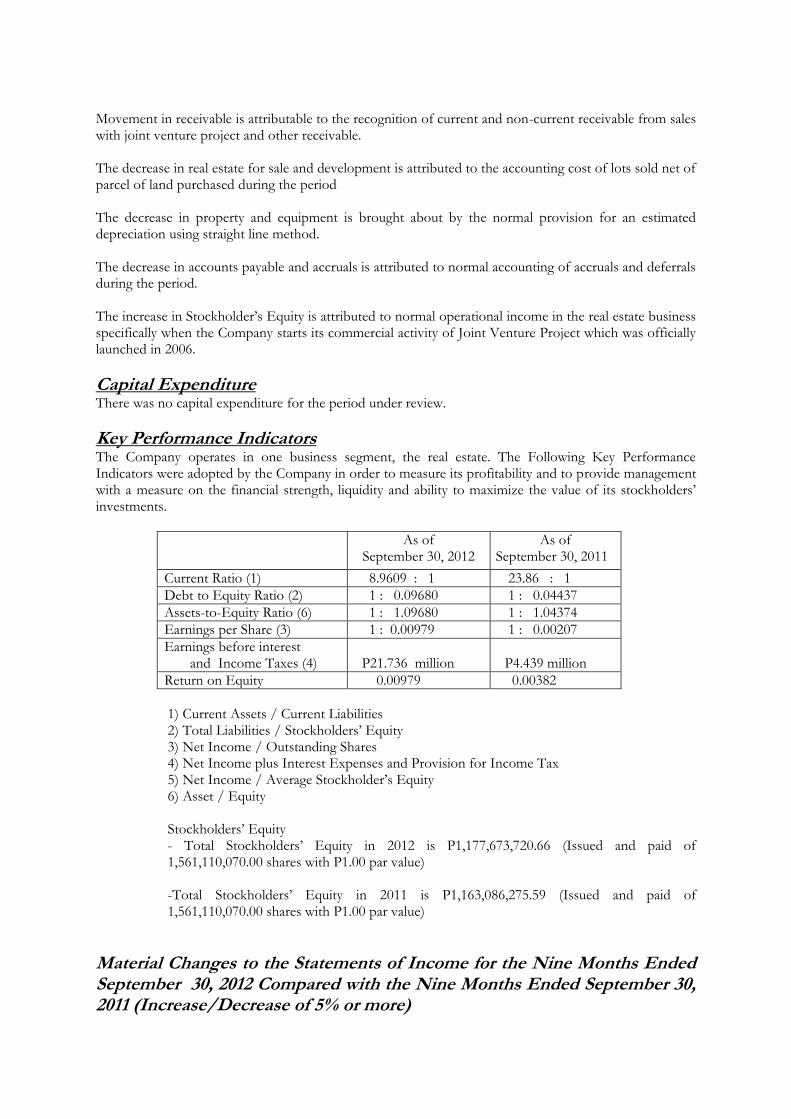
Movement in receivable is attributable to the recognition of current and non-current receivable from sales with joint venture project and other receivable. The decrease in real estate for sale and development is attributed to the accounting cost of lots sold net of parcel of land purchased during the period
The decrease in property and equipment is brought about by the normal provision for an estimated depreciation using straight line method.
The decrease in accounts payable and accruals is attributed to normal accounting of accruals and deferrals during the period.
The increase in Stockholder’s Equity is attributed to normal operational income in the real estate business specifically when the Company starts its commercial activity of Joint Venture Project which was officially launched in 2006.
Capital Expenditure There was no capital expenditure for the period under review.
Key Performance Indicators The Company operates in one business segment, the real estate. The Following Key Performance Indicators were adopted by the Company in order to measure its profitability and to provide management with a measure on the financial strength, liquidity and ability to maximize the value of its stockholders’ investments.
As of September 30, 2012
As of September 30, 2011
Current Ratio (1) 8.9609 : 1 23.86 : 1
Debt to Equity Ratio (2) 1 : 0.09680 1 : 0.04437
Assets-to-Equity Ratio (6) 1 : 1.09680 1 : 1.04374
Earnings per Share (3) 1 : 0.00979 1 : 0.00207
Earnings before interest and Income Taxes (4)
P21.736 million
P4.439 million
Return on Equity 0.00979 0.00382
1) Current Assets / Current Liabilities 2) Total Liabilities / Stockholders’ Equity 3) Net Income / Outstanding Shares 4) Net Income plus Interest Expenses and Provision for Income Tax 5) Net Income / Average Stockholder’s Equity 6) Asset / Equity
Stockholders’ Equity - Total Stockholders’ Equity in 2012 is P1,177,673,720.66 (Issued and paid of 1,561,110,070.00 shares with P1.00 par value)
-Total Stockholders’ Equity in 2011 is P1,163,086,275.59 (Issued and paid of 1,561,110,070.00 shares with P1.00 par value)
Material Changes to the Statements of Income for the Nine Months Ended September 30, 2012 Compared with the Nine Months Ended September 30, 2011 (Increase/Decrease of 5% or more)
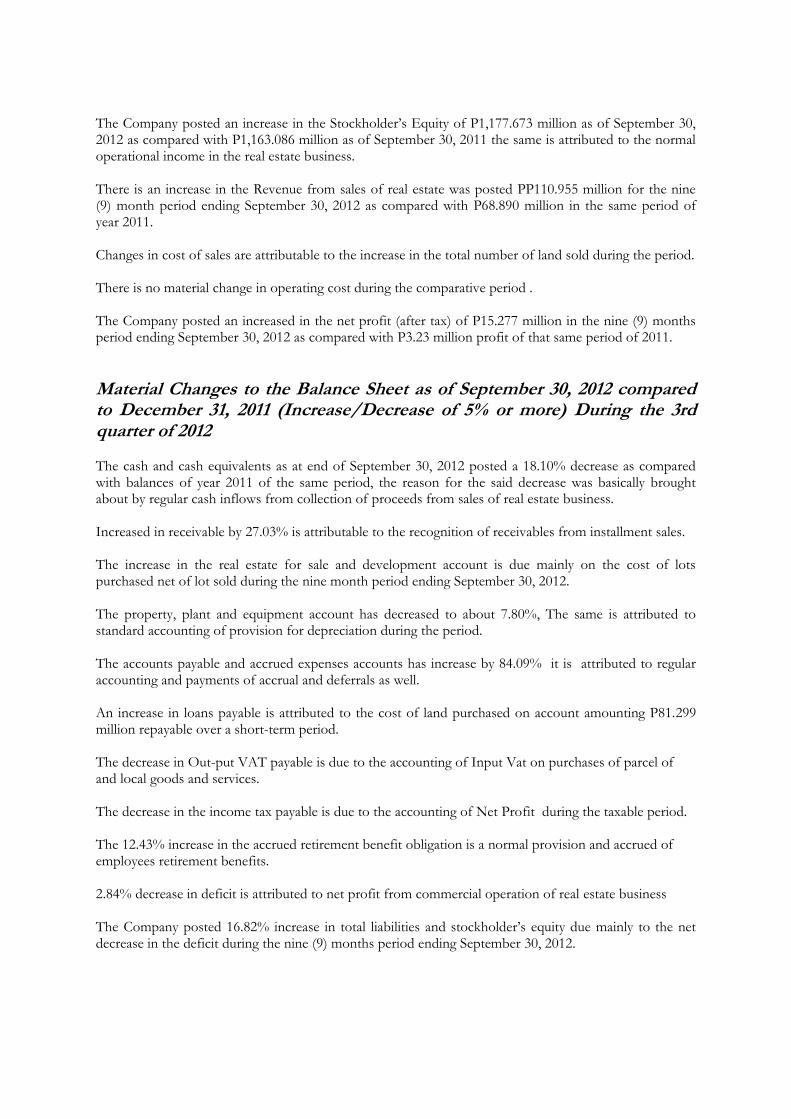
The Company posted an increase in the Stockholder’s Equity of P1,177.673 million as of September 30, 2012 as compared with P1,163.086 million as of September 30, 2011 the same is attributed to the normal operational income in the real estate business.
There is an increase in the Revenue from sales of real estate was posted PP110.955 million for the nine (9) month period ending September 30, 2012 as compared with P68.890 million in the same period of year 2011.
Changes in cost of sales are attributable to the increase in the total number of land sold during the period.
There is no material change in operating cost during the comparative period .
The Company posted an increased in the net profit (after tax) of P15.277 million in the nine (9) months period ending September 30, 2012 as compared with P3.23 million profit of that same period of 2011.
Material Changes to the Balance Sheet as of September 30, 2012 compared to December 31, 2011 (Increase/Decrease of 5% or more) During the 3rd quarter of 2012
The cash and cash equivalents as at end of September 30, 2012 posted a 18.10% decrease as compared with balances of year 2011 of the same period, the reason for the said decrease was basically brought about by regular cash inflows from collection of proceeds from sales of real estate business.
Increased in receivable by 27.03% is attributable to the recognition of receivables from installment sales.
The increase in the real estate for sale and development account is due mainly on the cost of lots purchased net of lot sold during the nine month period ending September 30, 2012.
The property, plant and equipment account has decreased to about 7.80%, The same is attributed to standard accounting of provision for depreciation during the period.
The accounts payable and accrued expenses accounts has increase by 84.09% it is attributed to regular accounting and payments of accrual and deferrals as well.
An increase in loans payable is attributed to the cost of land purchased on account amounting P81.299 million repayable over a short-term period.
The decrease in Out-put VAT payable is due to the accounting of Input Vat on purchases of parcel of and local goods and services.
The decrease in the income tax payable is due to the accounting of Net Profit during the taxable period.
The 12.43% increase in the accrued retirement benefit obligation is a normal provision and accrued of employees retirement benefits.
2.84% decrease in deficit is attributed to net profit from commercial operation of real estate business
The Company posted 16.82% increase in total liabilities and stockholder’s equity due mainly to the net decrease in the deficit during the nine (9) months period ending September 30, 2012.
Other related matters in operation
The interim financial report has been prepared in conformity with generally accepted accounting principles in the Philippines.
No disclosures nor discussions were made for the following since these did not affect the past and present operations of the Company:
a) No known trends, events or uncertainties with significant impact on net sales, or income except for the above mentioned international economic uncertainties, or have material impact on liquidity that would trigger direct or contingent liability, including default or acceleration of obligation rather than what was mentioned in the Plan of Operation. b) Significant elements of income or loss did not arise from the Company’s continuing operations other than what was mentioned in the revenues. c) All accounting policies and methods of computation and estimates are followed in the interim financial statement as compared with the most recent annual financial statement report. d) There were no seasonality or cyclicality aspects that have material effect in the financial statement and the financial condition or results of operations during the period. e) There were no material commitments affecting assets, liabilities, equity, net income, or cash flows that are unusual during the interim financial report except acquisition of land with zero percent interest on short-term installment from Marga Capital Holding, Inc., sand as well as for the prepayment of installment purchase of land reported under Loans Payable in the Balance Sheet account fully paid in the second quarter of 2014. f) There were no nature and amount of changes in estimates of amounts reported in prior interim periods of the current financial year or changes in estimates of amounts reported in prior financial years that have a material effect in the current interim period. g) There were no issuances, repurchases and repayments of debt and equity securities, except for the payment non-interest bearing payable obtained for the acquisition of two (2) parcels of land classified under “real estate for sale and development account” in the 2012, recorded as loans payable in the balance account of the financial statement was already fully paid in the second quarter of year 2014. h) There were no Dividends paid during the interim financial period. i) The Company is reporting with only one (1) accounting segment.
j) There were no material events that occurred during the subsequent to interim reporting period that have not been reflected in the financial statements, such as default or acceleration of an obligation or off-balance sheet transactions, arrangements, obligations, and other relationship of the Company with unconsolidated entities or other persons created during the reporting period. k) There were no changes in the composition of the issuer during the interim period and no business combinations, acquisitions or disposal if subsidiaries and long-term investments, restructurings, and discontinuing operation during the interim period. l) There were no changes in contingent liabilities or contingent asset was made during the interim period as compared with the most recent annual balance sheet date. m) No disclosures in compliance with SEC MC No. 14, Series of 2004 specifically Certain Relationship and Related Transaction or arrangements, as there were no such transaction during the
period and or subsequent event occur after the closed of accounting period with respect to certain relationship or related transaction being required by SFAS/IAS No. 24. n) There were no reclassification on Financial Instruments in the current reporting period and previous periods.
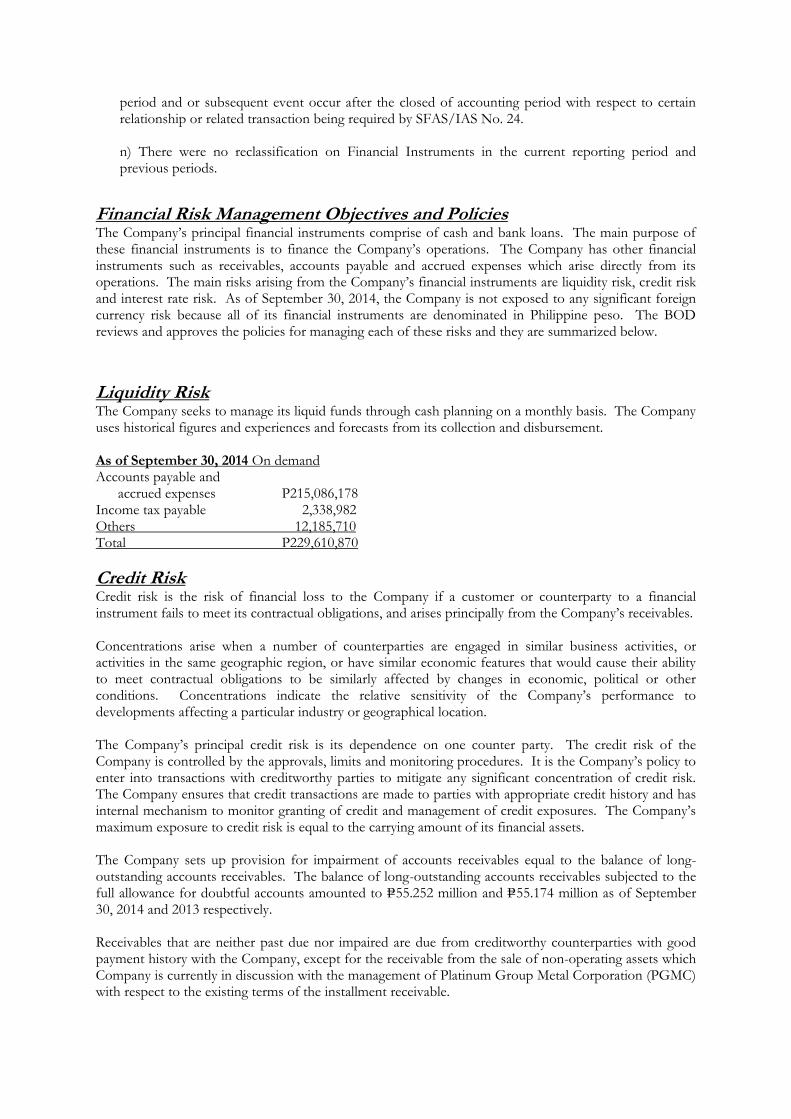
Financial Risk Management Objectives and Policies The Company’s principal financial instruments comprise of cash and bank loans. The main purpose of these financial instruments is to finance the Company’s operations. The Company has other financial instruments such as receivables, accounts payable and accrued expenses which arise directly from its operations. The main risks arising from the Company’s financial instruments are liquidity risk, credit risk and interest rate risk. As of September 30, 2014, the Company is not exposed to any significant foreign currency risk because all of its financial instruments are denominated in Philippine peso. The BOD reviews and approves the policies for managing each of these risks and they are summarized below.
Liquidity Risk The Company seeks to manage its liquid funds through cash planning on a monthly basis. The Company uses historical figures and experiences and forecasts from its collection and disbursement.
As of September 30, 2014 On demand Accounts payable and accrued expenses P215,086,178 Income tax payable 2,338,982 Others 12,185,710 Total P229,610,870
Credit Risk Credit risk is the risk of financial loss to the Company if a customer or counterparty to a financial instrument fails to meet its contractual obligations, and arises principally from the Company’s receivables.
Concentrations arise when a number of counterparties are engaged in similar business activities, or activities in the same geographic region, or have similar economic features that would cause their ability to meet contractual obligations to be similarly affected by changes in economic, political or other conditions. Concentrations indicate the relative sensitivity of the Company’s performance to developments affecting a particular industry or geographical location.
The Company’s principal credit risk is its dependence on one counter party. The credit risk of the Company is controlled by the approvals, limits and monitoring procedures. It is the Company’s policy to enter into transactions with creditworthy parties to mitigate any significant concentration of credit risk. The Company ensures that credit transactions are made to parties with appropriate credit history and has internal mechanism to monitor granting of credit and management of credit exposures. The Company’s maximum exposure to credit risk is equal to the carrying amount of its financial assets.
The Company sets up provision for impairment of accounts receivables equal to the balance of long-outstanding accounts receivables. The balance of long-outstanding accounts receivables subjected to the full allowance for doubtful accounts amounted to P=55.252 million and P=55.174 million as of September 30, 2014 and 2013 respectively.
Receivables that are neither past due nor impaired are due from creditworthy counterparties with good payment history with the Company, except for the receivable from the sale of non-operating assets which Company is currently in discussion with the management of Platinum Group Metal Corporation (PGMC) with respect to the existing terms of the installment receivable.
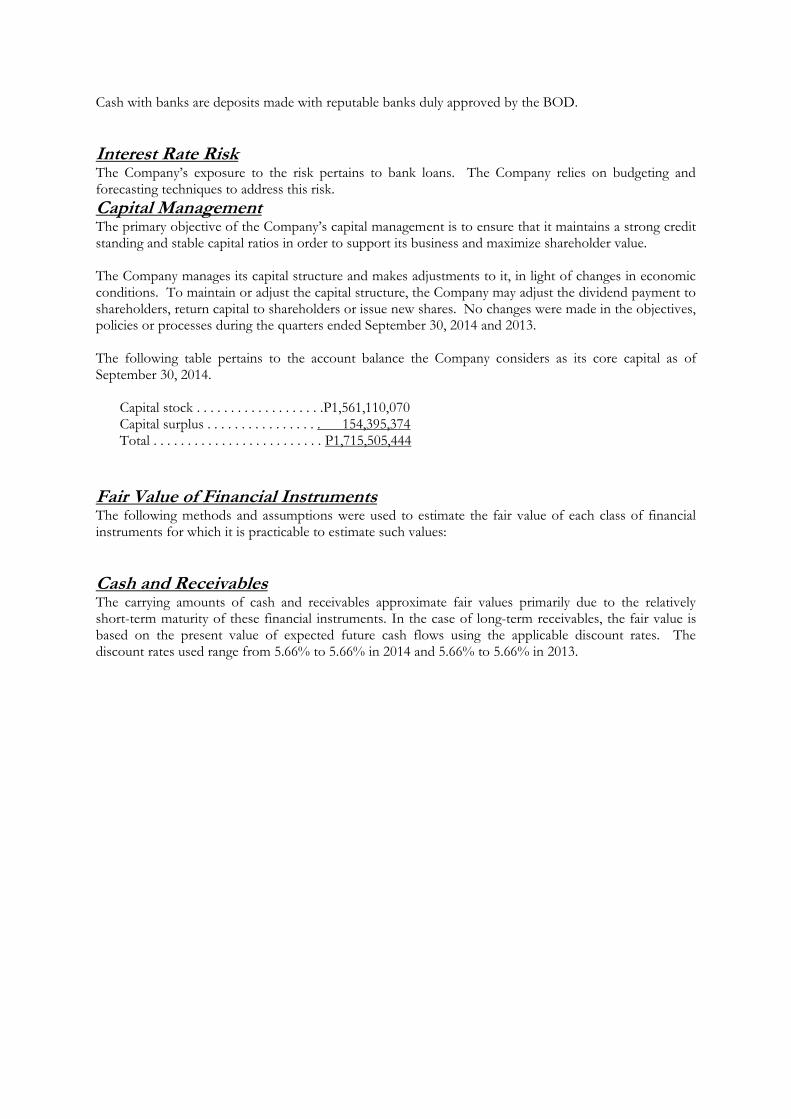
Cash with banks are deposits made with reputable banks duly approved by the BOD.
Interest Rate Risk The Company’s exposure to the risk pertains to bank loans. The Company relies on budgeting and forecasting techniques to address this risk.
Capital Management The primary objective of the Company’s capital management is to ensure that it maintains a strong credit standing and stable capital ratios in order to support its business and maximize shareholder value.
The Company manages its capital structure and makes adjustments to it, in light of changes in economic conditions. To maintain or adjust the capital structure, the Company may adjust the dividend payment to shareholders, return capital to shareholders or issue new shares. No changes were made in the objectives, policies or processes during the quarters ended September 30, 2014 and 2013.
The following table pertains to the account balance the Company considers as its core capital as of September 30, 2014.
Capital stock . . . . . . . . . . . . . . . . . . .P1,561,110,070 Capital surplus . . . . . . . . . . . . . . . . . 154,395,374 Total . . . . . . . . . . . . . . . . . . . . . . . . . P1,715,505,444
Fair Value of Financial Instruments The following methods and assumptions were used to estimate the fair value of each class of financial instruments for which it is practicable to estimate such values:
Cash and Receivables The carrying amounts of cash and receivables approximate fair values primarily due to the relatively short-term maturity of these financial instruments. In the case of long-term receivables, the fair value is based on the present value of expected future cash flows using the applicable discount rates. The discount rates used range from 5.66% to 5.66% in 2014 and 5.66% to 5.66% in 2013.
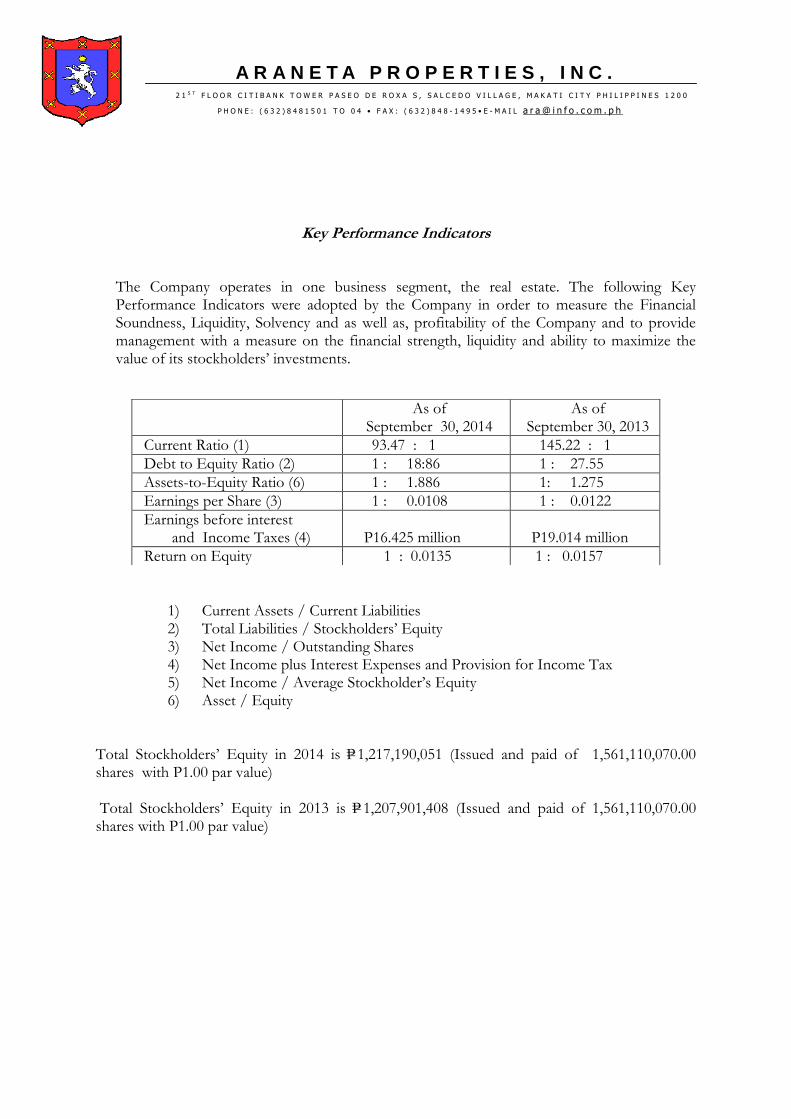
Key Performance Indicators
The Company operates in one business segment, the real estate. The following Key Performance Indicators were adopted by the Company in order to measure the Financial Soundness, Liquidity, Solvency and as well as, profitability of the Company and to provide management with a measure on the financial strength, liquidity and ability to maximize the value of its stockholders’ investments.
1) Current Assets / Current Liabilities 2) Total Liabilities / Stockholders’ Equity 3) Net Income / Outstanding Shares 4) Net Income plus Interest Expenses and Provision for Income Tax 5) Net Income / Average Stockholder’s Equity 6) Asset / Equity
Total Stockholders’ Equity in 2014 is P=1,217,190,051 (Issued and paid of 1,561,110,070.00 shares with P1.00 par value)
Total Stockholders’ Equity in 2013 is P=1,207,901,408 (Issued and paid of 1,561,110,070.00 shares with P1.00 par value)
2 1 S T F L O O R C I T I B A N K T O W E R P A S E O D E R O X A S , S A L C E D O V I L L A G E , M A K A T I C I T Y P H I L I P P I N E S 1 2 0 0
P H O N E : ( 6 3 2 ) 8 4 8 1 5 0 1 T O 0 4 • F A X : ( 6 3 2 ) 8 4 8 - 1 4 9 5 • E - M A I L a r a @ i n f o . c o m . p h
A R A N E T A P R O P E R T I E S , I N C .
As of September 30, 2014
As of September 30, 2013
Current Ratio (1) 93.47 : 1 145.22 : 1
Debt to Equity Ratio (2) 1 : 18:86 1 : 27.55
Assets-to-Equity Ratio (6) 1 : 1.886 1: 1.275
Earnings per Share (3) 1 : 0.0108 1 : 0.0122
Earnings before interest and Income Taxes (4)
P16.425 million
P19.014 million
Return on Equity 1 : 0.0135 1 : 0.0157

PART II - OTHER INFORMATION
As of this date, the Company filed the following reports on SEC Form 17-C:
Date of Report Item Reported
None
BSheet
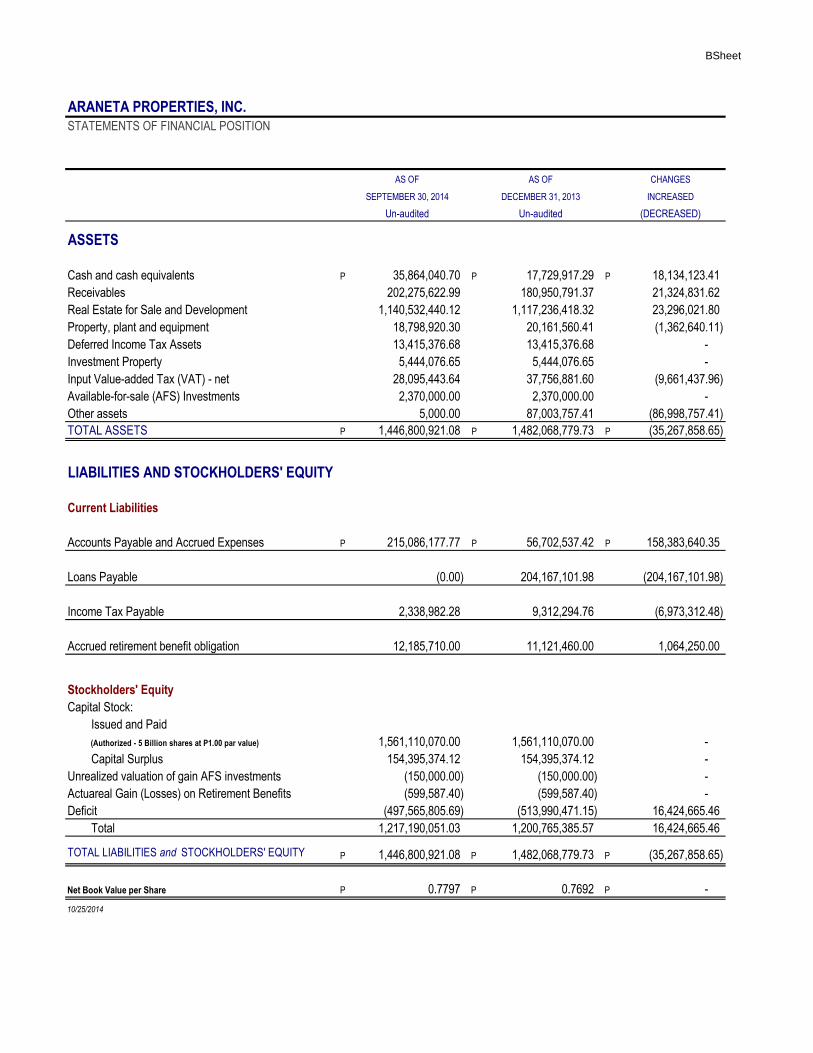
ARANETA PROPERTIES, INC.
STATEMENTS OF FINANCIAL POSITION
AS OF AS OF CHANGES
SEPTEMBER 30, 2014 DECEMBER 31, 2013 INCREASED
Un-audited Un-audited (DECREASED)
ASSETS
Cash and cash equivalents P 35,864,040.70 P 17,729,917.29 P 18,134,123.41
Receivables 202,275,622.99 180,950,791.37 21,324,831.62
Real Estate for Sale and Development 1,140,532,440.12 1,117,236,418.32 23,296,021.80
Property, plant and equipment 18,798,920.30 20,161,560.41 (1,362,640.11)
Deferred Income Tax Assets 13,415,376.68 13,415,376.68 -
Investment Property 5,444,076.65 5,444,076.65 -
Input Value-added Tax (VAT) - net 28,095,443.64 37,756,881.60 (9,661,437.96)
Available-for-sale (AFS) Investments 2,370,000.00 2,370,000.00 -
Other assets 5,000.00 87,003,757.41 (86,998,757.41)
TOTAL ASSETS P 1,446,800,921.08 P 1,482,068,779.73 P (35,267,858.65)
LIABILITIES AND STOCKHOLDERS' EQUITY
Current Liabilities
Accounts Payable and Accrued Expenses P 215,086,177.77 P 56,702,537.42 P 158,383,640.35
Loans Payable (0.00) 204,167,101.98 (204,167,101.98)
Income Tax Payable 2,338,982.28 9,312,294.76 (6,973,312.48)
Accrued retirement benefit obligation 12,185,710.00 11,121,460.00 1,064,250.00
Stockholders' Equity
Capital Stock:
Issued and Paid
(Authorized - 5 Billion shares at P1.00 par value) 1,561,110,070.00 1,561,110,070.00 -
Capital Surplus 154,395,374.12 154,395,374.12 -
Unrealized valuation of gain AFS investments (150,000.00) (150,000.00) -
Actuareal Gain (Losses) on Retirement Benefits (599,587.40) (599,587.40) -
Deficit (497,565,805.69) (513,990,471.15) 16,424,665.46
Total 1,217,190,051.03 1,200,765,385.57 16,424,665.46
TOTAL LIABILITIES and STOCKHOLDERS' EQUITY P 1,446,800,921.08 P 1,482,068,779.73 P (35,267,858.65)
Net Book Value per Share P 0.7797 P 0.7692 P -
10/25/2014
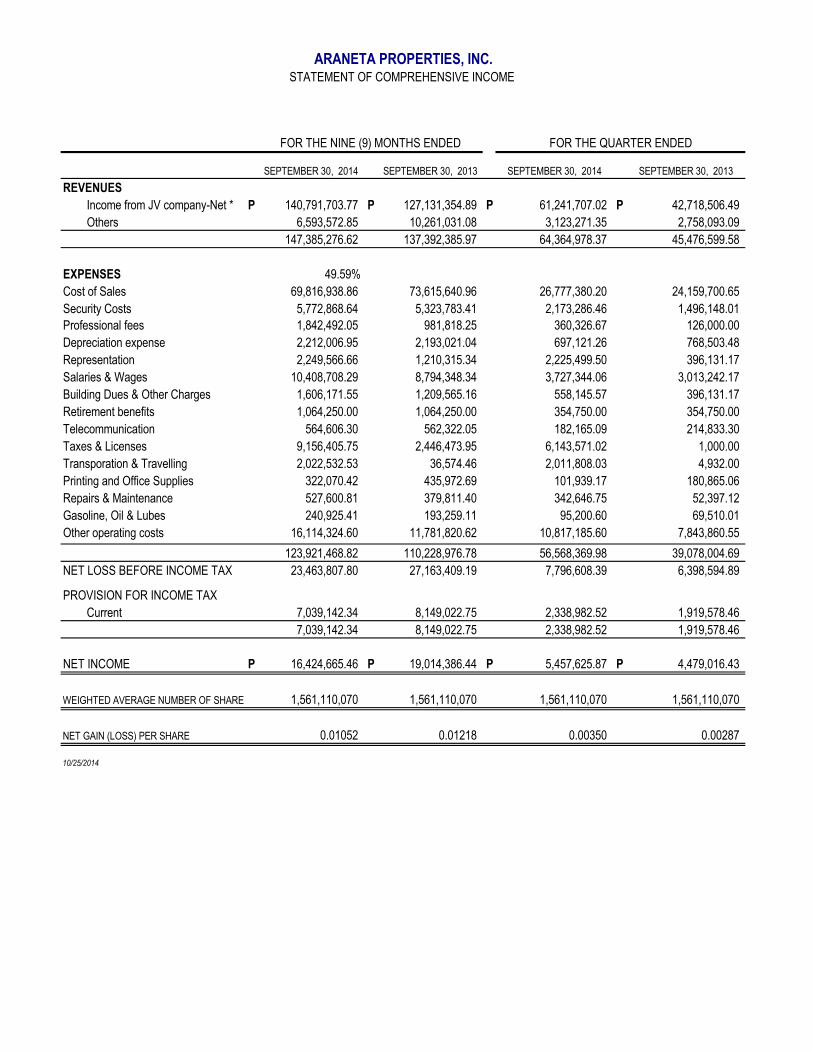
SEPTEMBER 30, 2014 SEPTEMBER 30, 2013 SEPTEMBER 30, 2014 SEPTEMBER 30, 2013
REVENUES
Income from JV company-Net * P 140,791,703.77 P 127,131,354.89 P 61,241,707.02 P 42,718,506.49
Others 6,593,572.85 10,261,031.08 3,123,271.35 2,758,093.09
147,385,276.62 137,392,385.97 64,364,978.37 45,476,599.58
EXPENSES 49.59%
Cost of Sales 69,816,938.86 73,615,640.96 26,777,380.20 24,159,700.65
Security Costs 5,772,868.64 5,323,783.41 2,173,286.46 1,496,148.01
Professional fees 1,842,492.05 981,818.25 360,326.67 126,000.00
Depreciation expense 2,212,006.95 2,193,021.04 697,121.26 768,503.48
Representation 2,249,566.66 1,210,315.34 2,225,499.50 396,131.17
Salaries & Wages 10,408,708.29 8,794,348.34 3,727,344.06 3,013,242.17
Building Dues & Other Charges 1,606,171.55 1,209,565.16 558,145.57 396,131.17
Retirement benefits 1,064,250.00 1,064,250.00 354,750.00 354,750.00
Telecommunication 564,606.30 562,322.05 182,165.09 214,833.30
Taxes & Licenses 9,156,405.75 2,446,473.95 6,143,571.02 1,000.00
Transporation & Travelling 2,022,532.53 36,574.46 2,011,808.03 4,932.00
Printing and Office Supplies 322,070.42 435,972.69 101,939.17 180,865.06
Repairs & Maintenance 527,600.81 379,811.40 342,646.75 52,397.12
Gasoline, Oil & Lubes 240,925.41 193,259.11 95,200.60 69,510.01
Other operating costs 16,114,324.60 11,781,820.62 10,817,185.60 7,843,860.55
123,921,468.82 110,228,976.78 56,568,369.98 39,078,004.69
NET LOSS BEFORE INCOME TAX 23,463,807.80 27,163,409.19 7,796,608.39 6,398,594.89
PROVISION FOR INCOME TAX
Current 7,039,142.34 8,149,022.75 2,338,982.52 1,919,578.46
7,039,142.34 8,149,022.75 2,338,982.52 1,919,578.46
NET INCOME P 16,424,665.46 P 19,014,386.44 P 5,457,625.87 P 4,479,016.43
WEIGHTED AVERAGE NUMBER OF SHARE 1,561,110,070 1,561,110,070 1,561,110,070 1,561,110,070
NET GAIN (LOSS) PER SHARE 0.01052 0.01218 0.00350 0.00287
10/25/2014
FOR THE NINE (9) MONTHS ENDED FOR THE QUARTER ENDED
ARANETA PROPERTIES, INC.STATEMENT OF COMPREHENSIVE INCOME
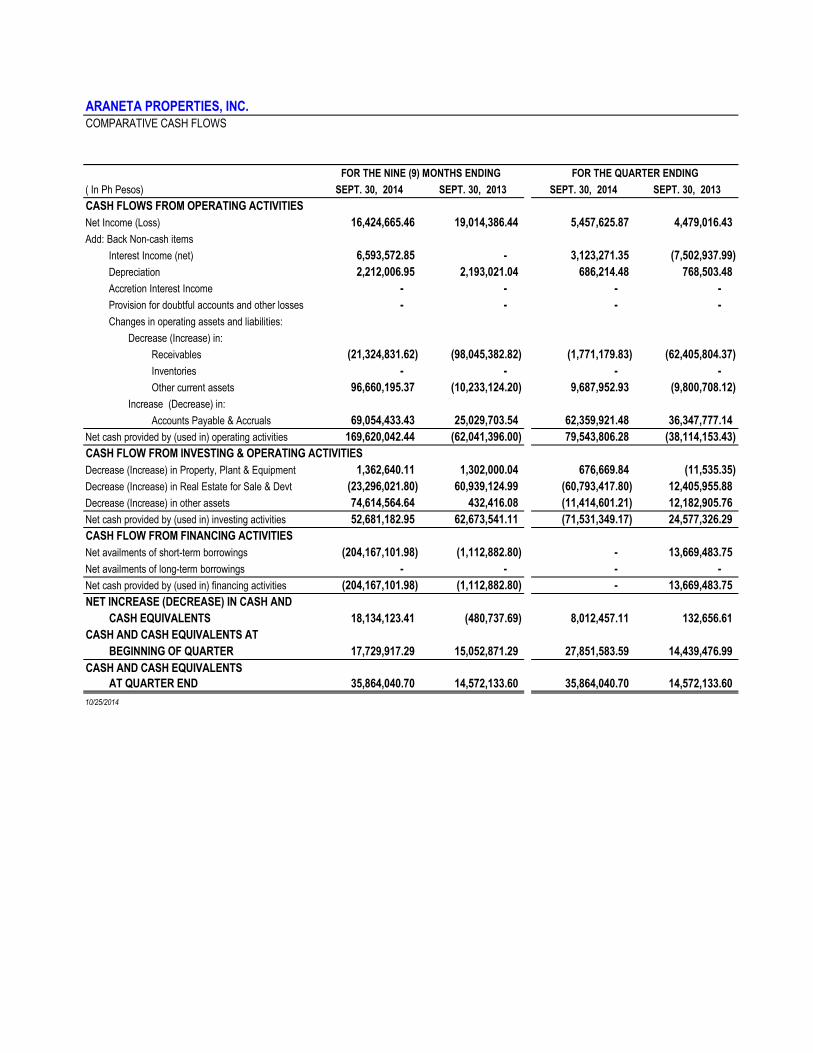
ARANETA PROPERTIES, INC.COMPARATIVE CASH FLOWS
( In Ph Pesos) SEPT. 30, 2014 SEPT. 30, 2013 SEPT. 30, 2014 SEPT. 30, 2013
CASH FLOWS FROM OPERATING ACTIVITIES
Net Income (Loss) 16,424,665.46 19,014,386.44 5,457,625.87 4,479,016.43
Add: Back Non-cash items
Interest Income (net) 6,593,572.85 - 3,123,271.35 (7,502,937.99)
Depreciation 2,212,006.95 2,193,021.04 686,214.48 768,503.48
Accretion Interest Income - - - -
Provision for doubtful accounts and other losses - - - -
Changes in operating assets and liabilities:
Decrease (Increase) in:
Receivables (21,324,831.62) (98,045,382.82) (1,771,179.83) (62,405,804.37)
Inventories - - - -
Other current assets 96,660,195.37 (10,233,124.20) 9,687,952.93 (9,800,708.12)
Increase (Decrease) in:
Accounts Payable & Accruals 69,054,433.43 25,029,703.54 62,359,921.48 36,347,777.14
Net cash provided by (used in) operating activities 169,620,042.44 (62,041,396.00) 79,543,806.28 (38,114,153.43)
CASH FLOW FROM INVESTING & OPERATING ACTIVITIES
Decrease (Increase) in Property, Plant & Equipment 1,362,640.11 1,302,000.04 676,669.84 (11,535.35)
Decrease (Increase) in Real Estate for Sale & Devt (23,296,021.80) 60,939,124.99 (60,793,417.80) 12,405,955.88
Decrease (Increase) in other assets 74,614,564.64 432,416.08 (11,414,601.21) 12,182,905.76
Net cash provided by (used in) investing activities 52,681,182.95 62,673,541.11 (71,531,349.17) 24,577,326.29
CASH FLOW FROM FINANCING ACTIVITIES
Net availments of short-term borrowings (204,167,101.98) (1,112,882.80) - 13,669,483.75
Net availments of long-term borrowings - - - -
Net cash provided by (used in) financing activities (204,167,101.98) (1,112,882.80) - 13,669,483.75
NET INCREASE (DECREASE) IN CASH AND
CASH EQUIVALENTS 18,134,123.41 (480,737.69) 8,012,457.11 132,656.61
CASH AND CASH EQUIVALENTS AT
BEGINNING OF QUARTER 17,729,917.29 15,052,871.29 27,851,583.59 14,439,476.99
CASH AND CASH EQUIVALENTS
AT QUARTER END 35,864,040.70 14,572,133.60 35,864,040.70 14,572,133.60
10/25/2014
FOR THE NINE (9) MONTHS ENDING FOR THE QUARTER ENDING
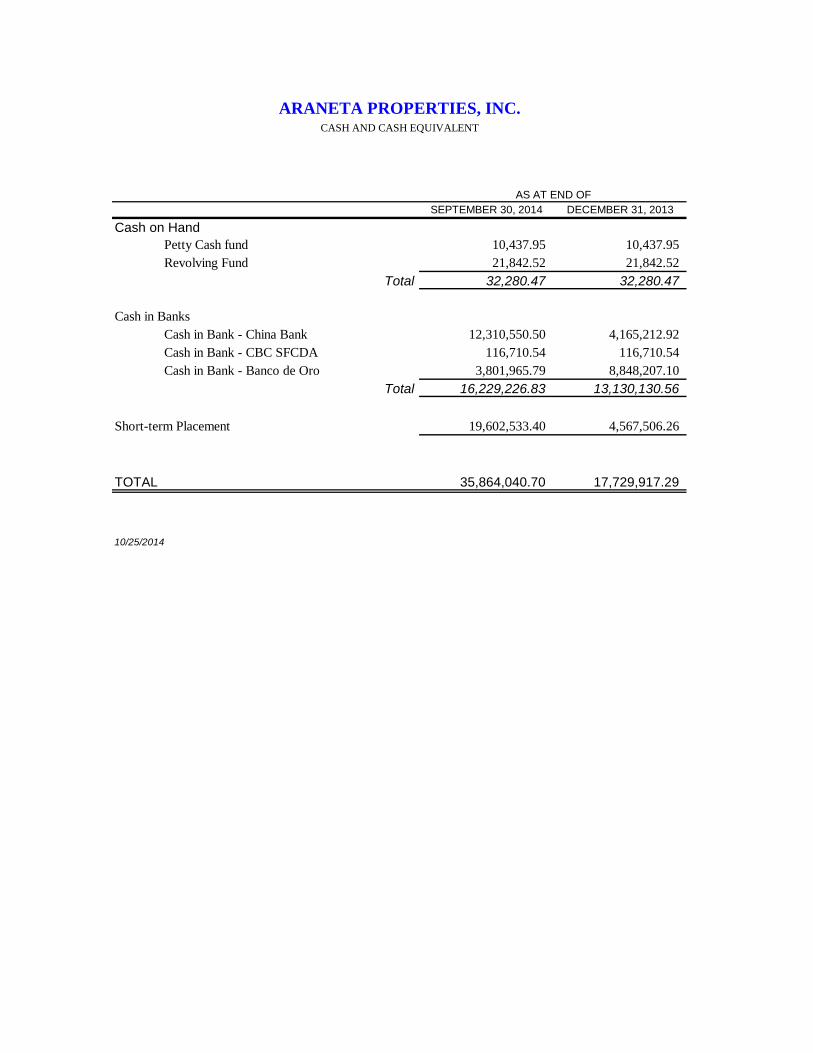
SEPTEMBER 30, 2014 DECEMBER 31, 2013
Cash on Hand
Petty Cash fund 10,437.95 10,437.95
Revolving Fund 21,842.52 21,842.52
Total 32,280.47 32,280.47
Cash in Banks
Cash in Bank - China Bank 12,310,550.50 4,165,212.92
Cash in Bank - CBC SFCDA 116,710.54 116,710.54
Cash in Bank - Banco de Oro 3,801,965.79 8,848,207.10
Total 16,229,226.83 13,130,130.56
Short-term Placement 19,602,533.40 4,567,506.26
TOTAL 35,864,040.70 17,729,917.29
10/25/2014
ARANETA PROPERTIES, INC.CASH AND CASH EQUIVALENT
AS AT END OF
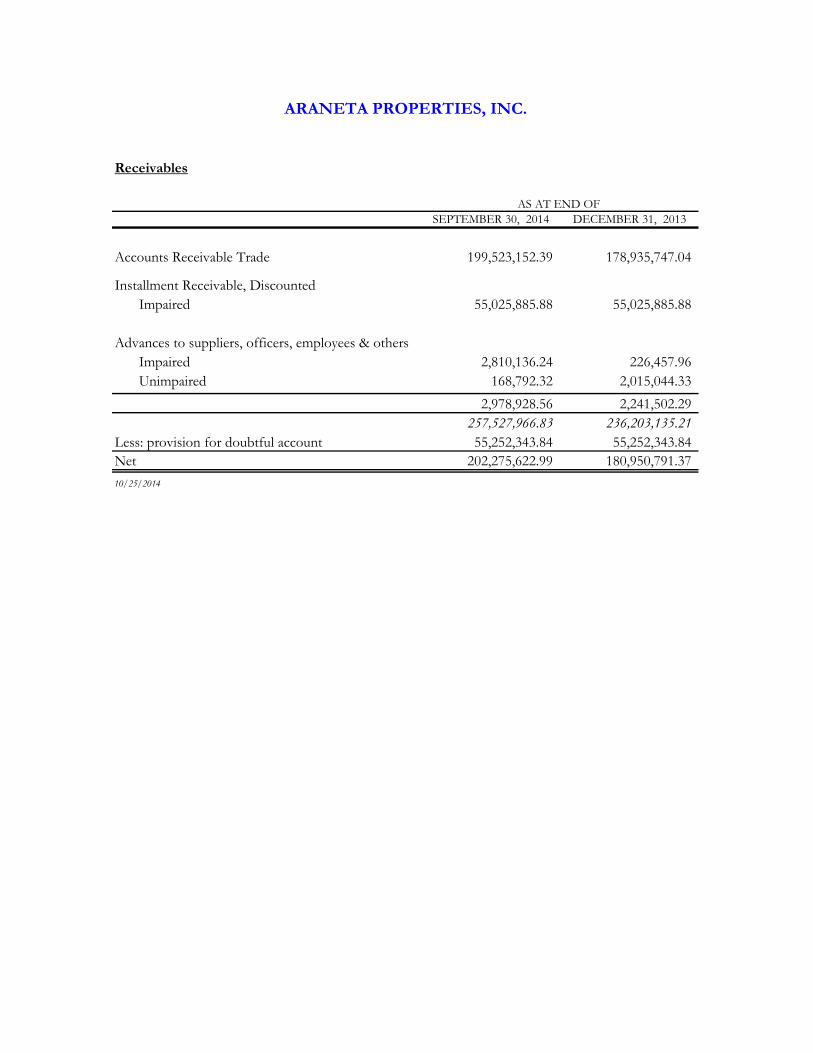
Receivables
SEPTEMBER 30, 2014 DECEMBER 31, 2013
Accounts Receivable Trade 199,523,152.39 178,935,747.04
Installment Receivable, Discounted
Impaired 55,025,885.88 55,025,885.88
Advances to suppliers, officers, employees & others
Impaired 2,810,136.24 226,457.96
Unimpaired 168,792.32 2,015,044.33
2,978,928.56 2,241,502.29
257,527,966.83 236,203,135.21
Less: provision for doubtful account 55,252,343.84 55,252,343.84
Net 202,275,622.99 180,950,791.37
10/25/2014
ARANETA PROPERTIES, INC.
AS AT END OF
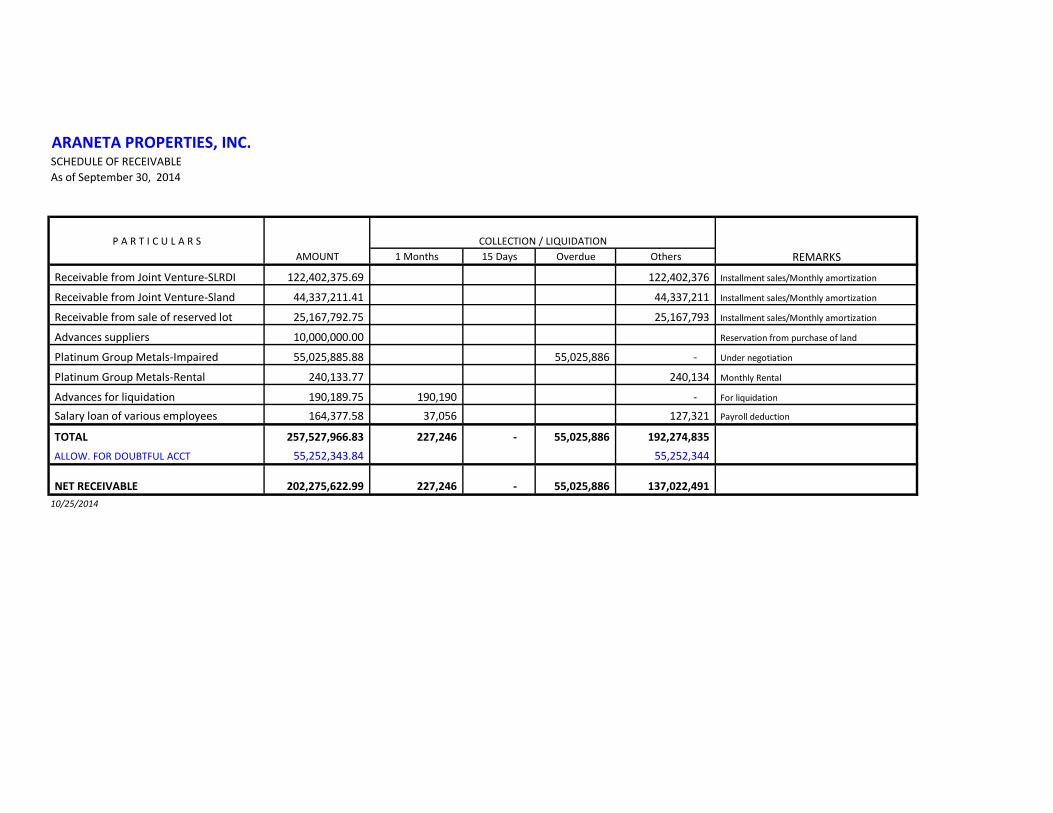
ARANETA PROPERTIES, INC.SCHEDULE OF RECEIVABLE
As of September 30, 2014
P A R T I C U L A R S
AMOUNT 1 Months 15 Days Overdue Others
Receivable from Joint Venture-SLRDI 122,402,375.69 122,402,376 Installment sales/Monthly amortization
Receivable from Joint Venture-Sland 44,337,211.41 44,337,211 Installment sales/Monthly amortization
Receivable from sale of reserved lot 25,167,792.75 25,167,793 Installment sales/Monthly amortization
Advances suppliers 10,000,000.00 Reservation from purchase of land
Platinum Group Metals-Impaired 55,025,885.88 55,025,886 - Under negotiation
Platinum Group Metals-Rental 240,133.77 240,134 Monthly Rental
Advances for liquidation 190,189.75 190,190 - For liquidation
Salary loan of various employees 164,377.58 37,056 127,321 Payroll deduction
TOTAL 257,527,966.83 227,246 - 55,025,886 192,274,835
ALLOW. FOR DOUBTFUL ACCT 55,252,343.84 55,252,344
NET RECEIVABLE 202,275,622.99 227,246 - 55,025,886 137,022,491
10/25/2014
COLLECTION / LIQUIDATION
REMARKS
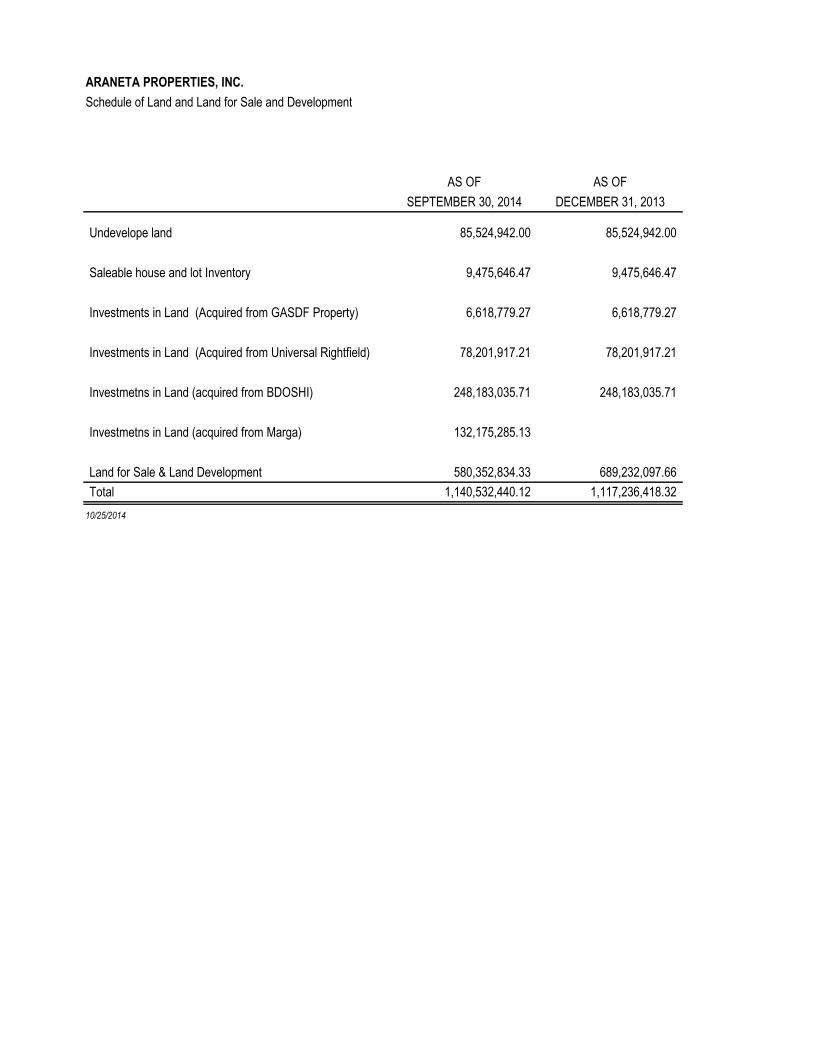
ARANETA PROPERTIES, INC.
Schedule of Land and Land for Sale and Development
AS OF AS OF
SEPTEMBER 30, 2014 DECEMBER 31, 2013
Undevelope land 85,524,942.00 85,524,942.00
Saleable house and lot Inventory 9,475,646.47 9,475,646.47
Investments in Land (Acquired from GASDF Property) 6,618,779.27 6,618,779.27
Investments in Land (Acquired from Universal Rightfield) 78,201,917.21 78,201,917.21
Investmetns in Land (acquired from BDOSHI) 248,183,035.71 248,183,035.71
Investmetns in Land (acquired from Marga) 132,175,285.13
Land for Sale & Land Development 580,352,834.33 689,232,097.66
Total 1,140,532,440.12 1,117,236,418.32
10/25/2014
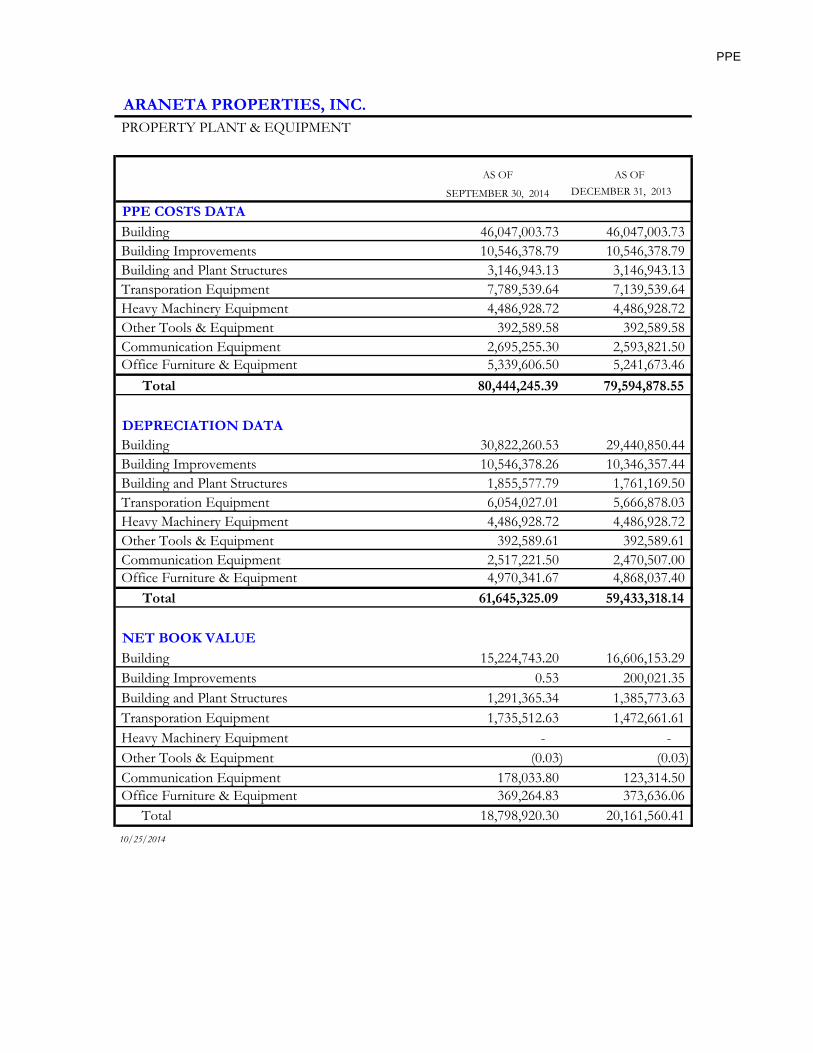
PPE
ARANETA PROPERTIES, INC.
PROPERTY PLANT & EQUIPMENT
AS OF AS OF
SEPTEMBER 30, 2014 DECEMBER 31, 2013
PPE COSTS DATA
Building 46,047,003.73 46,047,003.73
Building Improvements 10,546,378.79 10,546,378.79
Building and Plant Structures 3,146,943.13 3,146,943.13
Transporation Equipment 7,789,539.64 7,139,539.64
Heavy Machinery Equipment 4,486,928.72 4,486,928.72
Other Tools & Equipment 392,589.58 392,589.58
Communication Equipment 2,695,255.30 2,593,821.50
Office Furniture & Equipment 5,339,606.50 5,241,673.46
Total 80,444,245.39 79,594,878.55
DEPRECIATION DATA
Building 30,822,260.53 29,440,850.44
Building Improvements 10,546,378.26 10,346,357.44
Building and Plant Structures 1,855,577.79 1,761,169.50
Transporation Equipment 6,054,027.01 5,666,878.03
Heavy Machinery Equipment 4,486,928.72 4,486,928.72
Other Tools & Equipment 392,589.61 392,589.61
Communication Equipment 2,517,221.50 2,470,507.00
Office Furniture & Equipment 4,970,341.67 4,868,037.40
Total 61,645,325.09 59,433,318.14
NET BOOK VALUE
Building 15,224,743.20 16,606,153.29
Building Improvements 0.53 200,021.35
Building and Plant Structures 1,291,365.34 1,385,773.63
Transporation Equipment 1,735,512.63 1,472,661.61
Heavy Machinery Equipment - -
Other Tools & Equipment (0.03) (0.03)
Communication Equipment 178,033.80 123,314.50
Office Furniture & Equipment 369,264.83 373,636.06
Total 18,798,920.30 20,161,560.41
10/25/2014
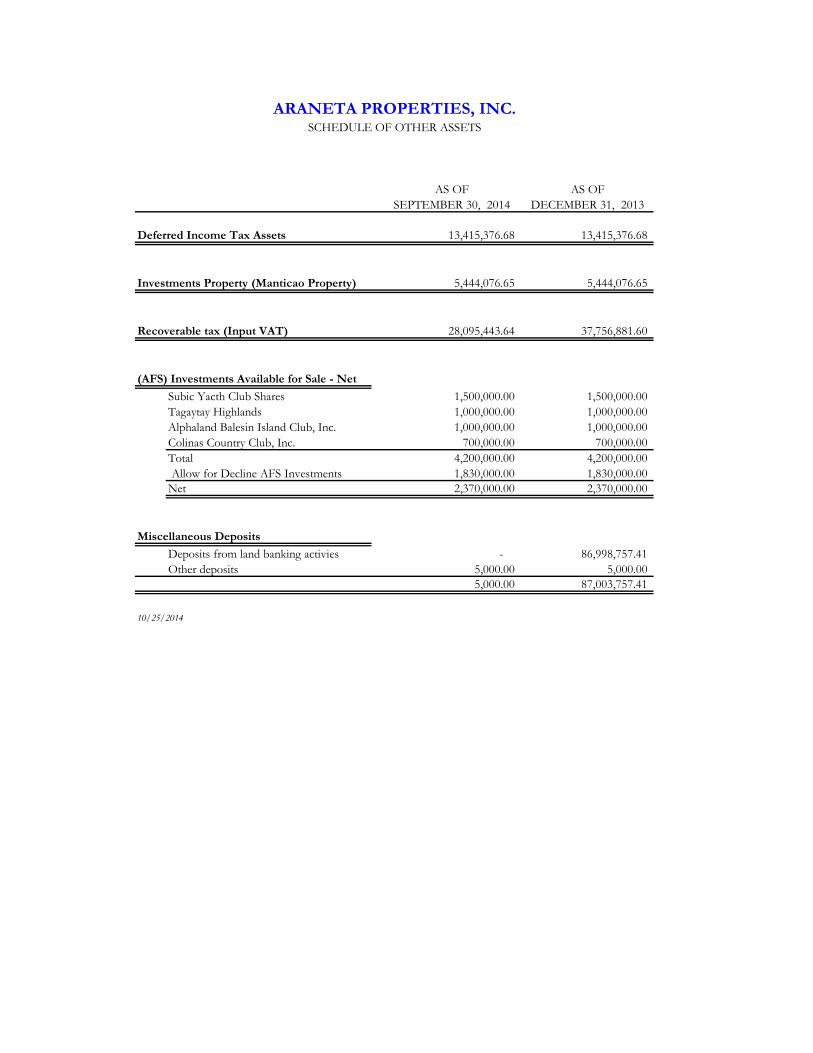
AS OF AS OF
SEPTEMBER 30, 2014 DECEMBER 31, 2013
Deferred Income Tax Assets 13,415,376.68 13,415,376.68
Investments Property (Manticao Property) 5,444,076.65 5,444,076.65
Recoverable tax (Input VAT) 28,095,443.64 37,756,881.60
(AFS) Investments Available for Sale - Net
Subic Yacth Club Shares 1,500,000.00 1,500,000.00
Tagaytay Highlands 1,000,000.00 1,000,000.00
Alphaland Balesin Island Club, Inc. 1,000,000.00 1,000,000.00
Colinas Country Club, Inc. 700,000.00 700,000.00
Total 4,200,000.00 4,200,000.00
Allow for Decline AFS Investments 1,830,000.00 1,830,000.00
Net 2,370,000.00 2,370,000.00
Miscellaneous Deposits
Deposits from land banking activies - 86,998,757.41
Other deposits 5,000.00 5,000.00
5,000.00 87,003,757.41
10/25/2014
ARANETA PROPERTIES, INC.SCHEDULE OF OTHER ASSETS
AS OF AS OF
SEPTEMBER 30, 2014 DECEMBER 31, 2013
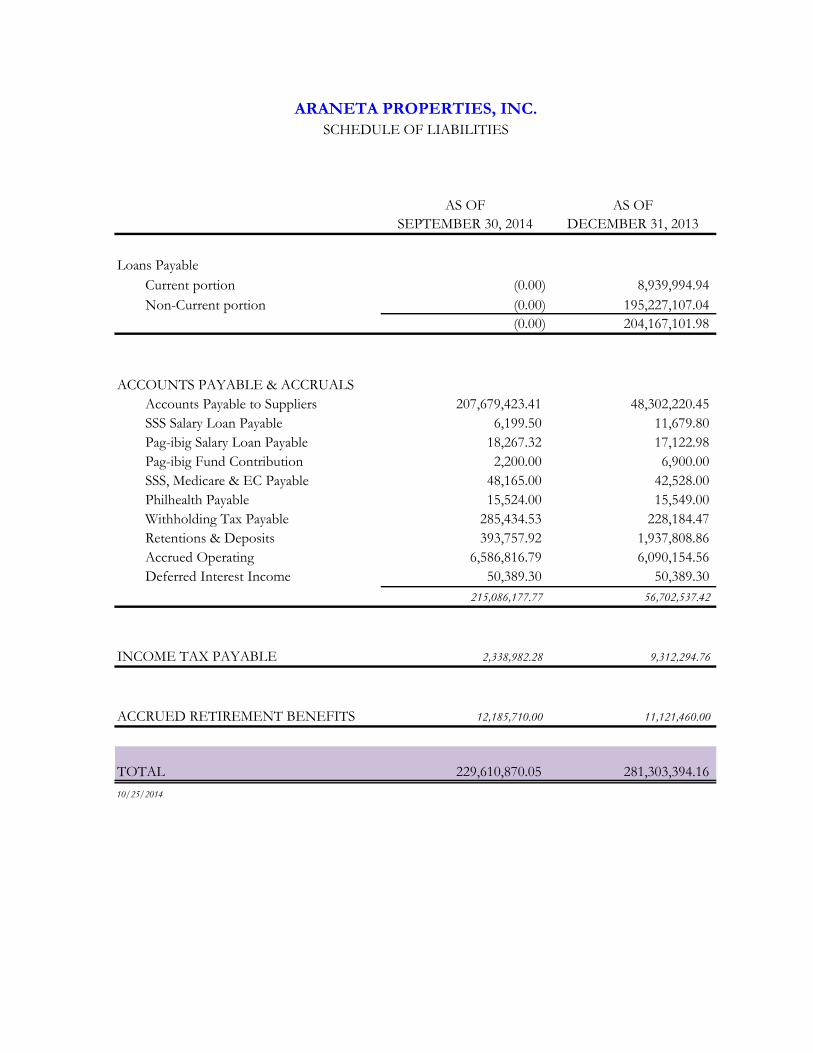
Loans Payable
Current portion (0.00) 8,939,994.94
Non-Current portion (0.00) 195,227,107.04
(0.00) 204,167,101.98
ACCOUNTS PAYABLE & ACCRUALS
Accounts Payable to Suppliers 207,679,423.41 48,302,220.45
SSS Salary Loan Payable 6,199.50 11,679.80
Pag-ibig Salary Loan Payable 18,267.32 17,122.98
Pag-ibig Fund Contribution 2,200.00 6,900.00
SSS, Medicare & EC Payable 48,165.00 42,528.00
Philhealth Payable 15,524.00 15,549.00
Withholding Tax Payable 285,434.53 228,184.47
Retentions & Deposits 393,757.92 1,937,808.86
Accrued Operating 6,586,816.79 6,090,154.56
Deferred Interest Income 50,389.30 50,389.30
215,086,177.77 56,702,537.42
INCOME TAX PAYABLE 2,338,982.28 9,312,294.76
ACCRUED RETIREMENT BENEFITS 12,185,710.00 11,121,460.00
TOTAL 229,610,870.05 281,303,394.16
10/25/2014
ARANETA PROPERTIES, INC.
SCHEDULE OF LIABILITIES
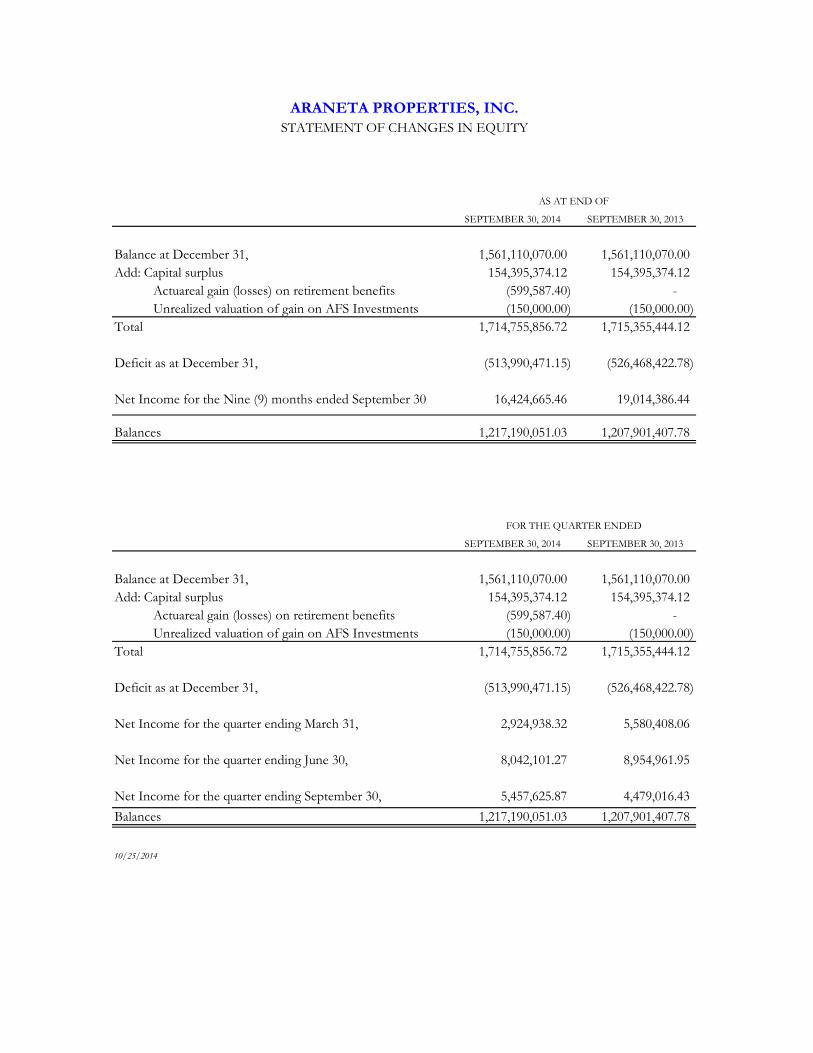
SEPTEMBER 30, 2014 SEPTEMBER 30, 2013
Balance at December 31, 1,561,110,070.00 1,561,110,070.00
Add: Capital surplus 154,395,374.12 154,395,374.12
Actuareal gain (losses) on retirement benefits (599,587.40) -
Unrealized valuation of gain on AFS Investments (150,000.00) (150,000.00)
Total 1,714,755,856.72 1,715,355,444.12
Deficit as at December 31, (513,990,471.15) (526,468,422.78)
Net Income for the Nine (9) months ended September 30 16,424,665.46 19,014,386.44
Balances 1,217,190,051.03 1,207,901,407.78
SEPTEMBER 30, 2014 SEPTEMBER 30, 2013
Balance at December 31, 1,561,110,070.00 1,561,110,070.00
Add: Capital surplus 154,395,374.12 154,395,374.12
Actuareal gain (losses) on retirement benefits (599,587.40) -
Unrealized valuation of gain on AFS Investments (150,000.00) (150,000.00)
Total 1,714,755,856.72 1,715,355,444.12
Deficit as at December 31, (513,990,471.15) (526,468,422.78)
Net Income for the quarter ending March 31, 2,924,938.32 5,580,408.06
Net Income for the quarter ending June 30, 8,042,101.27 8,954,961.95
Net Income for the quarter ending September 30, 5,457,625.87 4,479,016.43
Balances 1,217,190,051.03 1,207,901,407.78
10/25/2014
FOR THE QUARTER ENDED
ARANETA PROPERTIES, INC.
STATEMENT OF CHANGES IN EQUITY
AS AT END OF