Embed Size (px)
Citation preview

Mon. Not. R. Astron. Soc. 421, 2598–2609 (2012) doi:10.1111/j.1365-2966.2012.20532.x
A QUMOND galactic N-body code – I. Poisson solver and rotationcurve fitting
G. W. Angus,1� K. J. van der Heyden,1 B. Famaey,2,3 G. Gentile,4 S. S. McGaugh5
and W. J. G. de Blok1
1Astrophysics, Cosmology & Gravity Centre, University of Cape Town, Private Bag X3, Rondebosch 7701, South Africa2Observatoire Astronomique de Strasbourg, CNRS, UMR 7550, France3AIfA, University of Bonn, Auf dem Hugel 71, D-53121 Bonn, Germany4Sterrenkundig Observatorium, Ghent University, Krijgslaan 281, S9, 9000 Ghent, Belgium5Department of Astronomy, Computer & Space Sciences Bldg, University of Maryland, College Park, MD 20742-2421, USA
Accepted 2012 January 3. Received 2011 December 28; in original form 2011 July 1
ABSTRACTHere we present a new particle-mesh galactic N-body code that uses the full multigrid algo-rithm for solving the modified Poisson equation of the quasi-linear formulation of modifiedNewtonian dynamics (QUMOND). A novel approach for handling the boundary conditionsusing a refinement strategy is implemented and the accuracy of the code is compared withanalytical solutions of Kuzmin discs. We then employ the code to compute the predicted rota-tion curves for a sample of five spiral galaxies from the THINGS sample. We generated staticN-body realizations of the galaxies according to their stellar and gaseous surface densities andallowed their distances, mass-to-light ratios (M/L values) and both the stellar and gas scale-heights to vary in order to estimate the best-fitting parameters. We found that NGC 3621, NGC3521 and DDO 154 are well fitted by MOND using expected values of the distance and M/L.NGC 2403 required a moderately larger M/L than expected and NGC 2903 required a substan-tially larger value. The surprising result was that the scale-height of the dominant baryoniccomponent was well constrained by the rotation curves: the gas scale-height for DDO 154 andthe stellar scale-height for the others. In fact, if the suggested stellar scale-height (one-fifththe stellar scale-length) was used in the case of NGC 3621 and NGC 3521 it would not bepossible to produce a good fit to the inner rotation curve. For each of the four stellar dominatedgalaxies, we calculated the vertical velocity dispersions which we found to be, on the whole,quite typical compared with observed stellar vertical velocity dispersions of face-on spirals.We conclude that modelling the gas scale-heights of the gas-rich dwarf spiral galaxies will bevital in order to make precise conclusions about MOND.
Key words: galaxies: kinematics and dynamics – galaxies: photometry – galaxies: spiral –cosmology: dark matter.
1 IN T RO D U C T I O N
The H I Nearby Galaxy Survey (THINGS; Walter et al. 2008)brought an unprecedented level of precision to the measurement ofthe rotation curves of certain nearby spiral galaxies. This, when cou-pled with 3.6 μm images of the stellar component from the SpitzerInfrared Nearby Galaxies Survey (SINGS; Kennicutt et al. 2003),produces a stringent new data set for modelling the galactic dy-namics of these systems. These tighter constraints are of paramountimportance for testing alternative theories of gravity, in particu-lar those with no galactic dark matter like modified Newtonian
�E-mail: [email protected]
dynamics (MOND; Milgrom 1983, but see also Famaey & Mc-Gaugh 2011).
MOND is an appealing framework because, at least in galaxies,the gravitational field is fully determined by the matter distributionof the visible components. This means that a galaxy comprisingdiscy stellar and gaseous components produces a rotation curvedepending only on the properties of those components. It is cru-cial, in order to keep up with the advancing observations, that weproduce methods of modelling the galaxies with a similar level ofsophistication.
In this paper, we develop a galactic N-body code for MOND andapply it to fitting the high-resolution rotation curves of the THINGSsurvey. We compare predicted and fitted distances and make use of
C© 2012 The AuthorsMonthly Notices of the Royal Astronomical Society C© 2012 RAS

A QUMOND galactic N-body code 2599
free parameters in the form of the scale-heights of the two baryoniccomponents.
2 SO LV IN G T H E MO N D EQUATIO N O N AG R I D
MOND has a different force law from Newtonian dynamics, andthis traditionally is rather tricky to solve (Bekenstein & Milgrom1984; Milgrom 1986; Brada & Milgrom 1995). For instance, in theNewtonian analogue, the ordinary Poisson equation must simply besolved using the matter distribution in terms of its density, whichincludes stars (ρ∗), gas (ρg) and cold dark matter (ρCDM), using
∇2�N = 4πG(ρ∗ + ρg + ρCDM) (1)
to give the Newtonian potential, �N. However, in a recently pro-posed version of MOND, called QUMOND (Milgrom 2010; butsee also Zhao & Famaey 2010), it was shown that the MOND po-tential, �, can be found exactly from the Newtonian potential (notincluding cold dark matter) as follows:
∇2� = ∇ · [ν(y)∇�N] , (2)
where ν(y) = 0.5 + 0.5√
1 + 4/y and y = ∇�N/a0, witha0 being the MOND acceleration constant chosen here to be3.6 ( km s−1)2 pc−1.ν(y) could take on another form, and similarlya0 could take on a different value, but we choose here not to focus onthis topic for fear of being sidetracked. We note that the ν-functionwe adopt here is the analogue of the μ-function used by Famaey &Binney (2005) to fit the terminal velocity curve of the Milky Way.
Very often in the literature, equation (2) is not solved, but rather anapproximation is made that is referred to as the following algebraicMOND relation:
∇� = ν(y)∇�N. (3)
This approximation ignores the curl field, which is negligible inmost cases of high symmetry, but has the scope to be a significantcomponent of the gravitational field in triaxial systems. Here weare not advocating that it is imperative to use equation (2) forfitting rotation curves of relaxed spiral galaxies, but rather for whenMOND is extended to study interacting galaxies, or galaxies withlopsided matter distributions.
Our goal is to determine the gravity at locations inside the galaxywe are studying and the procedure to do this is as follows. We mustset up a three-dimensional grid, sliced into numerous cubic cells –usually we use 65, 129 or 257 cells per dimension. In each cell wehave the following:
(i) an approximated, but near exact, value of the baryonic density(step 1, the source of equation 1 using only gas and stars);
(ii) a solution to the Newtonian potential (step 2);(iii) the source ‘density’ – the right-hand side of equation (2)
(step 3);(iv) the solution of the QUMOND potential (step 4).
Getting from step 1 to step 4 is in the details of the code, whichwe briefly describe here.
We read in a set of particle positions that determine the densityof the stars and gas in the galaxy on the grid using the cloud-in-cell technique (step 1). The stars and gas are allocated half of thetotal number of particles each and therefore the particles of gasand stars are weighted differently and according to the total massof each component. With this density, we solve for the Newtonianpotential (step 2; equation 1) using the full multigrid algorithm thatis well known and described in Press et al. (1992). The full multigrid
method is extended to three dimensions which implements red–black Gauss–Seidel relaxation. Our default is to use six V-cycles,from the finest to the coarsest grid and back to the finest with bilinearprolongation and restriction, as well as two pre- and post-smoothingsteps before and after the coarse grid correction is computed.
We then use finite differencing to find the source for equation (2)(step 3). The finite differencing technique used to solve equa-tion (2) is described in Angus & Diaferio (2011). We use the samemultigrid technique to solve equations (1) and (2), only the sourcechanges (step 4). We make a final finite differencing to determinethe QUMOND gravity, ∇�, on the grid and then we interpolate tothe point at which we wish to know the gravity. The interpolationscheme is the same as the scheme to assign density to the grid, i.e.the cloud-in-cell technique.
Our final step is to calculate the circular speed associated withthis QUMOND potential as a function of radius. This is taken as
v2c = R × ∂R�|z=0. (4)
Although this is the first attempt to solve the modified Poissonequation of QUMOND on a grid in a non-cosmological setting (seeLlinares, Knebe & Zhao 2008; Angus & Diaferio 2011; Llinares2011 for the cosmological analogue), this is not the first time thata modified Poisson equation linked to MOND has been solved insuch a way. Brada & Milgrom (1999) developed a cubic particle-mesh code that solved the modified Poisson equation and used itto investigate some important topics (Brada & Milgrom 2000a,b).Tiret & Combes (2007) developed a similar code and parallelized itand incorporated hydrodynamics into their simulations (see Tiret &Combes 2008a,b). In addition to these, Londrillo & Nipoti (2009)produced a spherical grid code that investigated various issues in theframework of MOND (Nipoti, Londrillo & Ciotti 2007a,b; Nipotiet al. 2008).
The key to a galactic N-body code, as opposed to a cosmolog-ical one, is the boundary conditions. In a cosmological code, theexpectation that the Universe is homogeneous and isotropic allowsus to enforce periodic boundary conditions. At the galaxy scale, theboundary conditions must be set precisely at all outer grid cells,which is non-trivial in MOND. It is not clear how accurately thiswas achieved in the previous codes, but here we implement a dif-ferent strategy (see Tiret & Combes 2007; Wu et al. 2009 for otherexamples).
We define a coarse grid which is many times (210) larger than thegalaxy we are studying. For this coarsest grid we set the boundarycondition of the Newtonian and QUMOND potentials to be zero.Then we solve for the Newtonian and QUMOND potentials every-where on the grid. From this, we define a refined grid that is halfthe size of the coarse grid and we interpolate through the valuesof the potential on the coarse grid to define the boundary conditionof the refined grid. We make this refinement up to 10 times in orderto zoom in on our galaxy, but the boundary conditions are correctat the sub-per cent level at all points on the grid by the secondrefinement. This also enables us to use different grid levels to findthe potential at the location of a particle, depending on its positionin the various grid levels. The limitation of this is that it is cen-trally refining, not arbitrarily towards regions of high density. Notethat the number of grid cells is constant for each refinement, so theresolution increases for the finer grids – with more cells per kpc.
There is an initial guess that is required in multigrid methods.For clarity, our finest grid is 257 × 257 × 257 and we solve forthe potential on this grid at 10 incremental levels of resolution(box size). For each box size, in order to more rapidly calculatethe potential on the finest grid, we smooth the calculated (fed in)
C© 2012 The Authors, MNRAS 421, 2598–2609Monthly Notices of the Royal Astronomical Society C© 2012 RAS

2600 G. W. Angus et al.
density down to the coarsest possible level of resolution, which isa 3 × 3 × 3 grid. The coarsest density field is known in each ofthe 27 cells and we must solve for the potential in each of thesecells. Since for the largest box, of length 4 Mpc, the density andpotential in each of the 26 outer cells are zero, the potential in thecentral cell is simply proportional to the density in that central cell.This is true for both the Newtonian step and the QUMOND step.Following this, we perform the standard multigrid interpolation ofthe potential to finer grids and use the finer density defined on thosegrids to make a more rapid calculation of the potential on the finestgrid.
3 STATIC N- B O DY R E A L I Z AT I O N S
Our aim is to use this particle-mesh code to fit rotation curves. Todo this, we need to generate static N-body realizations of galaxiesdepending on their surface density. Initially, to test the resolution ofthe code, we generated a realization of a Kuzmin disc and comparedthe analytical circular velocity to the circular velocity simulatedby the code.
3.1 Kuzmin discs
Kuzmin discs are unique in MOND because their isopotential con-tours are spherically symmetric (at least in each distinct hemisphere,above and below the disc mid-plane), meaning that there is no curlfield. The surface density of a Kuzmin disc is given by Binney& Tremaine (2008) to be �K(R) = aM
2π(R2 + a2)−3/2. Assuming
an infinitely thin disc, and integrating this by 2πRdR, we get the
enclosed mass MK(R) = M
(1 − a√
R2+a2
). If we express the frac-
tion of the total mass as f = MK(R)/M , then we know that the wayto distribute particles in radius is R = a
√(1 − f )−2 − 1. From this
we randomly sample f and distribute the particles according to arandom azimuthal angle.
We did this for a model where we set a = 1.5 kpc and M =1010 M� and we show in Fig. 1 (left-hand panel) the fractionaldifference between this, the simulated QUMOND rotation curveand the analytically expected rotation curve. For the Kuzmin disc,the three-dimensional Newtonian gravity on a star slightly belowthe disc is defined by gN,r = −GM/(R2 + a2) and this pointstowards the position (R, z) = (0, a), as if all the mass were concen-
trated in a single point at the location (0, a). Similarly, the gravitytowards the centre of the disc is gN,R = −GMR(R2 + a2)−3/2.Therefore, the QUMOND gravity towards the centre of the disc isgM,R = ν(|gN,r |/a0)gN,R . Note the subtlety here with respect to thesubscripts of R and r.
Fig. 1 demonstrates that the accuracy of the code is less than1 per cent beyond 0.3 kpc and less than 0.1 per cent beyond 1 kpcfor this model. This depends greatly on the extent of the galaxy. AKuzmin disc, with scale radius a = 1.5 kpc still has 5 per cent ofits mass beyond 30 kpc and so is rather unrealistically extended. InFig. 1 (right-hand panel) we make the same plots for a = 150 pcand M = 109 M� to demonstrate that in that case the agreement isbetter than 0.1 per cent down to ∼50 pc. In both cases, as for thereal galaxies to follow, we use the following strategy to evaluategravity at various radii, R. When R < 0.8 kpc we use the finest gridwhich has a default box size of 4 kpc, when 0.8 < R < 1.6 kpc weuse the second finest box of size 8 kpc, when 1.6 < R < 3.2 kpcwe use the 16-kpc box and so on. These values need not be fixedand should be tailored to different galaxy sizes.
3.2 Convergence
Although we can accurately simulate the gravitational field of aKuzmin disc to roughly 0.1 per cent, it is equally important toensure that the solution to Poisson’s equation does converge formore complex density distributions, which might not immediatelyfollow from a smooth Kuzmin disc. As mentioned above, our defaultparameters for using the full multigrid algorithm are that we makea standard number of six V-cycles at each level of the grid. Beforeand after we make the coarse grid correction we always make twored–black Gauss–Seidel relaxation sweeps.
For one of our galaxies, NGC 3621, we have plotted in Fig. 2the relative error (as a function of radius) between the simulatedrotation speed for a series of numbers of V-cycles compared to therotation speed found using 99 V-cycles. Each different number ofV-cycles is given a distinct colour. If a colour is not seen at a specificradius, this is because the relative error is less than 10−8 and is mostlikely identical to the 99 V-cycles simulation. The discontinuitiesare caused by moving from one grid resolution to another. Clearly,using only one or two V-cycles does not allow for convergence, butby six cycles the difference is less than 0.1 per cent at all radii. Sincethe theoretical accuracy of the code is roughly 0.1 per cent as well
Figure 1. The relative error between the analytically defined QUMOND circular velocity and the simulated circular velocity of a Kuzmin disc. The left-handpanel uses a mass of 1010 M� and scale-length of 1.5 kpc, whereas the right-hand panel uses a mass of 109 M� and scale-length of 150 pc. Note that the y-axeshave different ranges.
C© 2012 The Authors, MNRAS 421, 2598–2609Monthly Notices of the Royal Astronomical Society C© 2012 RAS

A QUMOND galactic N-body code 2601
Figure 2. For NGC 3621, the relative error (as a function of radius) betweenthe simulated rotation speed for a series of numbers of V-cycles comparedto the rotation speed found using 99 V-cycles. Each different number ofV-cycles is given a distinct colour. If a colour is not seen at a specific radius,this is because the relative error is less than 10−8. The discontinuities arecaused by moving from one grid resolution to another.
(see Fig. 1), it makes six V-cycles a sensible number of cycles tomake until the accuracy can be improved.
3.3 Curl field and scale-height
To compare the difference between solving the modified Poissonequation of QUMOND (equation 2) and the algebraic MOND re-lation (equation 3) we plot in Fig. 3 the rotation curve for an ex-ponential disc galaxy with scale-length a = 1.5 kpc and total massM = 1010 M�. There is a small but noticeable difference even fora perfectly symmetric and thin exponential disc. Also plotted is thesimulated rotation curve for a disc with scale-height of 1 kpc, witha sech2 distribution. This creates a 10 km s−1 difference out to R =6 kpc and is still significant at R = 10 kpc. For this reason, scale-height is a crucial parameter that we will use to enhance the fits tothe rotation curves of the galaxies.
Figure 3. The difference between the rotation curve when we solve themodified Poisson equation of QUMOND (solid black, equation 2) and thealgebraic relation (solid red, equation 3) for a razor thin exponential disc.The dashed curve shows the rotation speed from the same exponential disc,using our code, but with a vertical scale-height of 1 kpc that is described bya sech2 distribution.
Figure 4. The surface densities of the stellar (solid) and gaseous (dashed)components for NGC 3621. Data comes from de Blok et al. (2008).
3.4 Realistic two-component galaxies
In order to generate realistic, static N-body realizations for galaxieswe need the surface densities of both the stellar and gaseous discs,like that plotted for NGC 3621 in Fig. 4. In our models we alwaysseparate stars and gas, giving half of the particles to each componentand weighting them according to the relative masses of these twocomponents. We use the well-known rejection technique from Presset al. (1992) to produce an N-body realization of the two componentsthat resembles the observed surface densities. Typically we use 2563
particles and our most refined grid is only 4 kpc across, with 129cells per dimension.
3.5 Free parameters
We are now in a position to compare simulated circular velocitycurves with the observed rotation curves. This brings into ques-tion the various free parameters we employ. We assume that theuncertainty in the inclination of the galaxy is contained withinthe measurement errors associated with each data point. The er-ror from inclination is addressed in de Blok et al. (2008), where thetilted ring fits find little variation in inclination for the galaxies weuse. This leaves us with four free parameters: the distance to thegalaxy, D, the mass-to-light ratio (M/L) of the stellar componentof the galaxy and the scale-heights of both the stellar, z∗, and gas,zg, discs – with sech2 distributions. We then make an exhaustivesearch through parameter space to find the quality of fit values,
χ2/n ={
�ni=1
[Vfit(Ri )−Vobs(Ri )]2
σ 2obs(Ri )
}/n, of these parameters by com-
paring the simulated QUMOND rotation curve with the observedone. We initially enforce flat priors on the distance to be no morethan two standard deviations and the M/L is forced to be withinthe range set by the diet-Salpeter and Kroupa initial mass functions(IMFs). We then relax these priors if no good fit is found, or if asignificantly improved fit is found despite not being preferred bycurrent limits on the parameters. The scale-heights are free to varyfrom razor thin up to 1 kpc. It should be emphasized that Gentile,Famaey & de Blok (2011) have suggested that de Blok et al. (2008)overestimate the error bars on some rotation curves, σobs, and as suchthe reduced χ2 cannot be directly used as a probability indicator inevery case.
4 SA MPLE
The sample of five galaxies that we have chosen is a subsample ofthe galaxies used in the MOND fits of Gentile et al. (2011), which
C© 2012 The Authors, MNRAS 421, 2598–2609Monthly Notices of the Royal Astronomical Society C© 2012 RAS

2602 G. W. Angus et al.
Figure 5. The curves of minimum reduced χ2 as a function of the fitted parameters of each galaxy. The top left-hand panel shows the fitted distance of eachgalaxy normalized to the observed distance, and the top right-hand panel shows the fitted M/L normalized to the M/L using the diet-Salpeter IMF (the figurebelow this is the same as above but with a larger plotted range). We also plot the two scale-heights. A different coloured line is used for each galaxy and alegend emphasizes this in each panel.
C© 2012 The Authors, MNRAS 421, 2598–2609Monthly Notices of the Royal Astronomical Society C© 2012 RAS

A QUMOND galactic N-body code 2603
is itself a subset of the galaxies studied by de Blok et al. (2008). Oursample removed all galaxies that had a significant spheroid com-ponent and also those galaxies that could be aided by the externalfield effect, which we devote a future paper to. Here our goal isnot to have a representative sample of galaxies to test MOND in astatistical sense, but rather to highlight the potential of this Poissonsolver and to investigate the impact of variable scale-heights onrotation curve fits. The properties of the five galaxies themselvescan be found in detail in de Blok et al. (2008).
5 R ESU LTS
In Fig. 5 we plot the minimum reduced χ2 for each free parameteras a function of that parameter. Specifically, this is the minimumχ2 achievable with that parameter fixed and every other parameterfree. The distances and M/L are limited according to the plottedrange for each galaxy.
Each galaxy in Fig. 5 has a different line colour. In the top left-hand panel, we plot reduced χ2 for each galaxy against distance. Thefitted distance is normalized to the measured distance and similarlythe fitted M/L is normalized to the M/L predicted by the diet-SalpeterIMF. The 1σ error on distance varies from galaxy to galaxy and canbe found in Table 1. For M/L, the Kroupa IMF is typically 70 percent of the diet-Salpeter value.
Clearly two galaxies (NGC 2903 and NGC 3521) prefer sub-stantially lower distances than the measurements suggest, whereasthe other three galaxies have their minima closer to the measureddistance. It is worth bearing in mind that NGC 2903 and NGC 3521have the largest uncertainties on their distances, 25 and 30 per cent,respectively.
The M/L plots (top right and middle right) have only four linessince we fix the M/L of DDO 154 to the diet-Salpeter value and do
not vary it, nor do we vary its stellar scale-height. The concern hereis that the curve for NGC 2903 rises sharply towards large χ2 whentypical M/L are tried.
The gas scale-height is only significant for two galaxies. Obvi-ously, DDO 154 is our only gas-dominated galaxy and 95 per centof its mass is gaseous. It prefers as large a gas scale-height as possi-ble and the χ2 rises sharply below 0.6 kpc. On the other hand, NGC2403 prefers a thin gas disc below 0.4 kpc in scale-height. The otherthree galaxies prefer gas scale-heights larger than 0.5 kpc, but nosignificant gain is achieved for larger values than this.
The stellar scale-height is strongly constrained by the rotationcurves. All four stellar dominated galaxies show a clear minimumbetween 0.25 and 0.55 kpc and the quality of the fits would besignificantly reduced if they were forced to be razor thin or 1 kpc inextent.
In Figs 6–10 we plot various fits to the five rotation curves aswell as three contour plots (DDO 154 only has one) for the threecombinations of the three free parameters (gas scale-height has beenomitted).
5.1 DDO 154
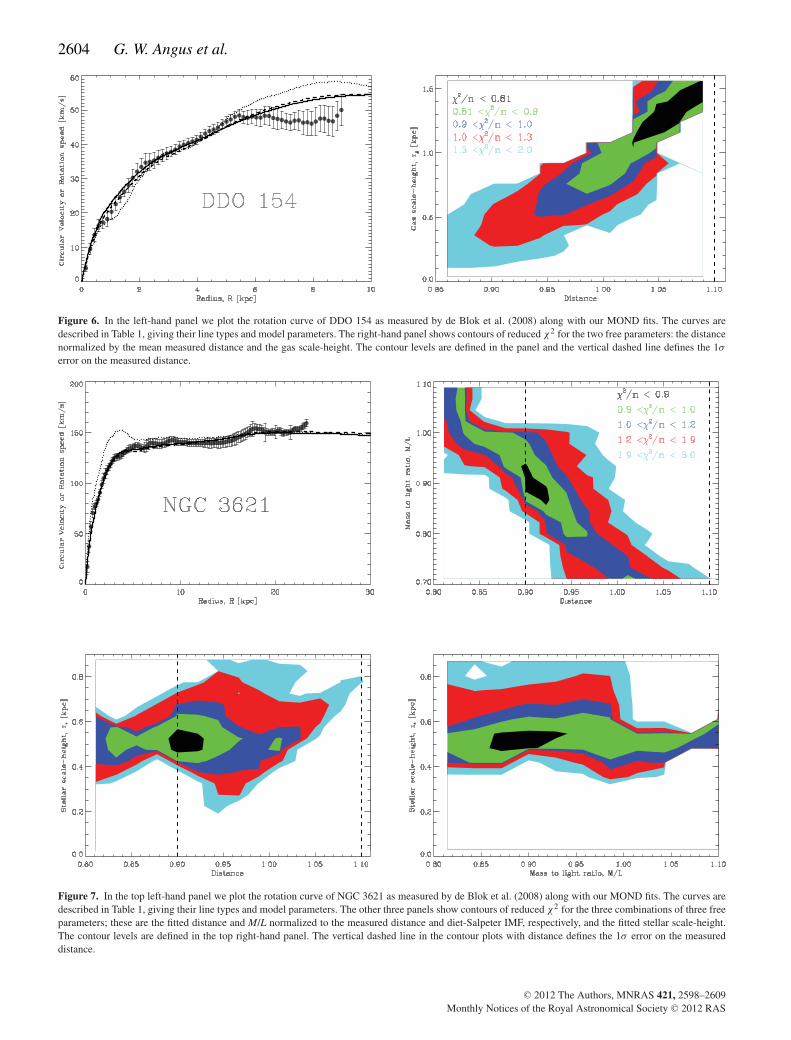
A lower χ2 can be achieved by increasing the distance and gasscale-height. In Table 1 we give the parameters used for the threefits in the left-hand panel of Fig. 6. In all figures showing the rotationcurve, the fits and data points are rescaled to the distance of model(a) for that particular galaxy. In the case of DDO 154 this is 1.085times the measured distance of 4.3 Mpc and as such is 4.67 Mpc. Itis not possible to fit the inner curve and outer flat data points beyond7 kpc with the same model. The flat outer points may be due to awarp in the outer part of its gaseous disc (Carignan & Purton 1998).Nevertheless, the solid and dashed lines achieve excellent fits up
Table 1. Here we show the various parameters corresponding to our fitted models that are plotted in Figs 6–10). For each galaxy we give the measuredparameters from the literature and our fitted values. The measured distances come from Walter et al. (2008), who took their value from Freedman et al. (2001),except NGC 2403 which comes from the more recent study of Vinko et al. (2006). The masses for the stellar and gaseous components come from de Bloket al. (2008) and are correct at the mean of the measured distance and with use of the diet-Salpeter initial mass function. The predicted mass-to-light ratios(M/L values) also come from de Blok et al. (2008), for which ‘d-S’ and ‘Kr’ correspond to diet-Salpeter and Kroupa initial mass functions, respectively. Thesuggested stellar scale-heights are merely one-fifth of the radial scale-height. There is no suggested scale-height for the gaseous distribution. For each galaxy,every separate fit is given a different letter – a, b, c or d – and these fits correspond to different line types in their corresponding figures. Our fitted distancesand values for the M/L are normalized to the mean measured distance and the diet-Salpeter IMF, respectively. The stellar scale-heights are well constrained,but the gas scale-heights less so. For DDO 154 we fixed the stellar parameters since they had little influence.
Galaxy Measured distance Fitted distanceMeasured distance Stellar (gas) mass Predicted M/L Fitted M/L
dS M/L Suggested z∗ Fitted z∗ (zg) Line type(Mpc) (109 M�) [3.6 μm d-S (Kr)] (kpc) (kpc)
DDO 154-a 4.30 ± 1.07 1.085 0.026 (0.468) 0.32 (0.23) 1.0 0.2 0.2 (1.5) SolidDDO 154-b 0.96 1.0 0.2 (0.65) DashedDDO 154-c 0.9 1.0 0.2 (0.05) Dotted
NGC 3621-a 6.64 ± 0.70 0.91 19.3 (9.58) 0.59 (0.42) 0.88 1.5 0.5 (1.0) SolidNGC 3621-b 0.97 0.76 0.5 (1.0) DashedNGC 3621-c 0.91 0.88 0.05 (1.0) Dotted
NGC 2903-a 8.90 ± 2.20 0.8 16.2 (6.6) 0.61 (0.43) 4.6 0.5 0.54 (1.0) SolidNGC 2903-b 1.1 2.5 0.3 (1.0) DashedNGC 2903-c 1.15 1.5 0.2 (1.0) Dotted
NGC 2403-a 3.47 ± 0.29 1.19 5.13 (3.82) 0.39 (0.26) 1.15 0.4 0.4 (0.1) SolidNGC 2403-b 1.09 1.45 0.5 (0.1) DashedNGC 2403-c 1.19 1.15 0.05 (0.1) DottedNGC 2403-d 1.05 1.2 0.6 (0.1) Dot–dashed
NGC 3521-a 10.7 ± 3.20 0.63 125.5 (13.0) 0.73 (0.52) 1.1 1.9 0.25 (1.0) SolidNGC 3521-b 0.82 0.8 0.25 (1.0) Dashed
C© 2012 The Authors, MNRAS 421, 2598–2609Monthly Notices of the Royal Astronomical Society C© 2012 RAS
2604 G. W. Angus et al.
Figure 6. In the left-hand panel we plot the rotation curve of DDO 154 as measured by de Blok et al. (2008) along with our MOND fits. The curves aredescribed in Table 1, giving their line types and model parameters. The right-hand panel shows contours of reduced χ2 for the two free parameters: the distancenormalized by the mean measured distance and the gas scale-height. The contour levels are defined in the panel and the vertical dashed line defines the 1σ
error on the measured distance.
Figure 7. In the top left-hand panel we plot the rotation curve of NGC 3621 as measured by de Blok et al. (2008) along with our MOND fits. The curves aredescribed in Table 1, giving their line types and model parameters. The other three panels show contours of reduced χ2 for the three combinations of three freeparameters; these are the fitted distance and M/L normalized to the measured distance and diet-Salpeter IMF, respectively, and the fitted stellar scale-height.The contour levels are defined in the top right-hand panel. The vertical dashed line in the contour plots with distance defines the 1σ error on the measureddistance.
C© 2012 The Authors, MNRAS 421, 2598–2609Monthly Notices of the Royal Astronomical Society C© 2012 RAS

A QUMOND galactic N-body code 2605
Figure 8. Same as Fig. 7, but for NGC 2903.
to 6 kpc and the dashed line uses an acceptable distance and gasscale-height of only 0.65 kpc. The dotted line uses a razor thin gasdisc and is a poor fit to the inner curve and poorer still to the outercurve. Walter & Brinks (1999) claim that dwarf galaxies (such asDDO 154) have thicker H I discs than more massive spiral galaxiesdue to a lower restoring force from weaker gravity. In order to bea good fit in MOND, the outer warp should be responsible for theanomalously low rotation speeds between 7 and 8.5 kpc.
5.2 NGC 3621
The χ2 minimum for NGC 3621 is obvious in the contour plots ofFig. 7 and puts strong constraints on all three parameters. The fits,whose parameters are given in Table 1, at the top left-hand panelshow the best fit (solid line) and another fit with slightly largerdistance (dashed line), more in keeping with the measured distance.Both are excellent fits. The dotted line shows the best-fitting modelwhen the best-fitting stellar scale-height is replaced with a razor thinstellar disc and is a very poor fit to the central rotation curve. Thebest-fitting parameters are all within acceptable bounds and this isan excellent fit for MOND.
5.3 NGC 2903
The contour plots in Fig. 8 show that in order to have a satisfactoryfit, regardless of distance and stellar scale-height, the M/L must be
more than twice the predicted value. If this is the case, then anexcellent fit can be achieved as shown in the top left-hand panel.On the other hand, using a M/L of only 50 per cent larger than thepredicted value gives a poor fit, as the dotted line attests. Therefore,NGC 2903 is a problem for MOND unless a reason can be foundwhy it should have a M/L that is twice the diet-Salpeter prediction.If such a reason was found, it would be well fitted by MOND.
5.4 NGC 2403
In Fig. 9 the contour plot of distance against M/L shows therequirement for a good fit to have either an excessively largeM/L or distance. This is aggravated by the tight error on thedistance of a mere 8 per cent and the relatively low predictedM/L for the given stellar population. For instance, the predicted3.6 μm diet-Salpeter IMF M/L of NGC 2403 is 0.39, whereas forNGC 2903, NGC 3521 and NGC 3621 it is 0.61, 0.73 and 0.59,respectively.
In the top left-hand panel of Fig. 9 we fit four curves to theobserved rotation curve. The solid and dashed curves are the best-fitting models, which, respectively, use a >2σ discrepant fitteddistance and regular M/L, and a more regular distance but morediscrepant M/L. The other two lines are a model with the sameparameters as the best fit, but using a razor thin stellar disc (dottedline), and one with a regular distance and M/L (dot–dashed line).
C© 2012 The Authors, MNRAS 421, 2598–2609Monthly Notices of the Royal Astronomical Society C© 2012 RAS

2606 G. W. Angus et al.
Figure 9. Same as Fig. 7, but for NGC 2403.
Both of these are unsatisfactory fits. As with NGC 2903, this galaxyNGC 2403 can only be consistent with MOND if the cause of itshigher than expected M/L is found; however, this is a much lesssignificant problem than NGC 2903 because even with the requiredM/L for a good fit, it would still have a typical M/L compared toother galaxies.
5.5 NGC 3521
For NGC 3521, the preference is for a much lower distance thanmeasured, which can be seen in the contour plot of Fig. 10. This isnot necessarily out of the question since the error on its distance is30 per cent, but the χ2 minimum is actually further from the meanthan this. The parameters of the two models plotted against theobserved rotation curve in the top left-hand panel are given in Table 1and correspond to a distance more than 1σ lower than the mean androughly 0.5σ lower than the mean. Both require sensible M/L andthe stellar scale-height is constrained to be close to 0.25 kpc. Thefit with the less discrepant distance (dashed line) is a better fit tothe inner 13 kpc and the discontinuity in measured rotation speed atthis radius makes it difficult for any model to achieve a good fit toboth the inner and outer curves. In general, this galaxy is well fittedby MOND.
5.6 Stellar scale-heights
A somewhat surprising result is the tight constraint placed on thevalues of the stellar scale-height for the four stellar dominated galax-ies and the gas scale-height of DDO 154. From the contour plots ofFigs 6–10 we see the relative lack of freedom in the stellar scale-heights and this gives us the opportunity to put a further constrainton the model by checking if the required scale-heights are consistentwith the typical stellar vertical velocity dispersions of other spiralgalaxies.
Making the assumption that the stellar velocity dispersions areisothermal with height above the disc we can use the followingequation to solve for the stellar vertical velocity dispersion at anyradius:
σ 2z,∗(R) = −d�(R, z)
dz× ρ∗(R, z)
∂zρ∗(R, z). (5)
A similar test could be used to constrain the gas scale-heights, butwe do not follow that route. The right-hand side is comprised fullyof quantities that are known in the rotation curve fitting code. Ascan be seen in Fig. 11, the vertical velocity dispersions of all thegalaxies have a similar shape. Generally, for the best-fitting models(solid and dashed lines) the trend is to have a large central verticalvelocity dispersion σ z(0) of between 20 and 35 km s−1 and thisdrops to between 4 and 8 km s−1 by 15 kpc. The dotted lines, which
C© 2012 The Authors, MNRAS 421, 2598–2609Monthly Notices of the Royal Astronomical Society C© 2012 RAS

A QUMOND galactic N-body code 2607
Figure 10. Same as Fig. 7, but for NGC 3521.
are for very thin discs of only 0.05 kpc scale-height, have muchlower velocity dispersions – with NGC 2403 and NGC 3621 beingcentrally just 8 and 10 km s−1, respectively.
Bottema (1993) studied the stellar velocity dispersions of a sam-ple of 12 spiral galaxies of varying blue band magnitude in therange MB = −18.76 to −22.22. They found a trend for the verticalstellar velocity dispersions to scale with decreasing galaxy magni-tude (increasing luminosity). The three galaxies with MB > −20,for which only NGC 3521 from our sample does not apply, wereNGC 3198, NGC 3938 and NGC 6503 and they had central stellarvelocity dispersions of 45 ± 5, 32 ± 13 and 30 ± 7 km s−1, re-spectively, although NGC 3198 and NGC 3938 are inclined. Thestellar velocity dispersions dropped to between 10 and 20 km s−1
after 2 or 3 scale-heights, which is similar to our models. The largergalaxies with MB < −21, which applies to NGC 3521, had cen-tral stellar velocity dispersions between 50 and 120 km s−1. Thisis larger than the central stellar velocity dispersion of NGC 3521.Even increasing the stellar scale-height to 1 kpc can only increasethe central vertical stellar velocity dispersion to 60 km s−1 and thisremains on the low end of the sample studied by Bottema (1993).Perhaps the increased velocity dispersions with luminosity are alsolinked to the increased prevalence of bulges with luminosity andNGC 3521’s lack of a significant spheroid bucks this trend.
The stellar and gas scale-heights we use in the fits are given inTable 1 along with the stellar scale-heights suggested by de Bloket al. (2008). The suggested stellar scale-heights are simply one-fifthof the scale-lengths and for NGC 3521 and NGC 3621, respectively,are 1.9 and 1.5 kpc. These values are several times larger thanthe fitted scale-heights of 0.25 and 0.5 kpc, respectively. If thesesuggested scale-heights were enforced, it would not be possibleto achieve a good fit to the rotation curves. Therefore, it is vitalto have a separate measurement of the stellar velocity dispersion toput an orthogonal limit on the scale-heights, as shown by Puglielli,Widrow & Courteau (2010) in the case of NGC 6503 and Bershadyet al. (2011). Bershady et al. (2011) used the Disk Mass Survey todemonstrate that the magnitude of vertical velocity dispersions ledto the inference that galaxy discs must be submaximal. Maximumdisc simply means the fit to the rotation curve with the highestM/L possible and the least amount of dark matter, such that all therotation velocity is attributable to the disc in the central part. Itwould be interesting to see if this holds in MOND for which thedisc, by definition, must be maximal.
Banerjee et al. (2011) made an analysis of the scale-heights ofthe gas-dominated THINGS galaxies in Newtonian gravity and itis essential that a similar review is made of the same galaxies inMOND.
C© 2012 The Authors, MNRAS 421, 2598–2609Monthly Notices of the Royal Astronomical Society C© 2012 RAS

2608 G. W. Angus et al.
Figure 11. Stellar vertical velocity dispersions as functions of radius for the four stellar dominated galaxies. The line types for each galaxy are defined suchthat the solid, dotted and dashed lines always correspond to models (a), (b) and (c), respectively, as set out in Table 1.
5.7 The external field effect
External gravitational fields (see forthcoming paper), usually theresult of nearby galaxies or clusters, can cause a suppression ofthe boost to gravity due to MOND. This is particularly likely forlow surface brightness galaxies. An external gravitational field hasa similar effect to decreasing the M/L and increasing the scale-height, but they are not degenerate given the gaseous mass contentand the radial dependence of the circular velocity on scale-height.It is an oft-quoted solution to unknown problems in MOND, but itis important to emphasize that it would have no beneficial influenceon NGC 2403 or NGC 2903 since it would simply impose a largerM/L, making the situation worse.
6 C O N C L U S I O N
Here we have introduced an N-body code that solves the modifiedPoisson equation of QUMOND (see Milgrom 2010). With it, wefitted the rotation curves of five spiral galaxies from the THINGSsurvey (Walter et al. 2008), using N-body realizations of the starsand the gas in each galaxy fixed by their surface densities. Weallowed the distance, M/L and both the scale-heights of the stellarand gaseous discs to be free parameters, with priors set dependingon observational constraints.
We discovered that our best fits were excellent matches to therotation curves of all five galaxies, except for some minor discrep-ancies at locations of publicized uncertainty in the observations. Wedisplayed contour plots of reduced χ2 for the various free param-eters of all galaxies and found that two galaxies, NGC 2403 andNGC 2903, could only make satisfactory fits if their M/L valueswere larger than the predicted values. The required increase in M/Lfor NGC 2403 is moderate, but for NGC 2903 it is considerable.Interestingly, the dark matter fits to these rotation curves given byde Blok et al. (2008), which can be seen in their tables 5 and 6,also require larger M/L. For NGC 2403, a value 50 per cent largerthan the predicted diet-Salpeter value and for NGC 2903 more thandouble was required, which is exactly what we have found.
If this were an isolated incident, it could have less relevance,but there is a growing preference for stellar dominated galaxies torequire much larger M/L values than predicted by stellar populationmodels from typical initial stellar mass functions. Large M/L valuesare also required for certain dwarf spheroidal galaxies surroundingthe Milky Way, in particular Carina, Sextans and Draco (see Angus2008; Serra, Angus & Diaferio 2010), and a large fraction of theearly-type galaxies studied by Sanders & Noordermeer (2007). TheMOND fits to the dynamics are in general still excellent, but asolution must be found to explain why certain galaxies can have
C© 2012 The Authors, MNRAS 421, 2598–2609Monthly Notices of the Royal Astronomical Society C© 2012 RAS

A QUMOND galactic N-body code 2609
M/L described by a Kroupa or diet-Salpeter IMF and other galaxiesneed one up to twice as large. Both the MOND and dark matter fitsto the rotation curves of NGC 2403 and NGC 2903 suggest thatthere is a problem with the stellar population synthesis models ofthese galaxies. Furthermore, the distance required for NGC 3521 isconsiderably lower than the mean, but this is acceptable due to thelarge uncertainty. A revised distance with tighter error bars could bevery revealing. These issues need to be resolved before we can saythat MOND provides good fits to all five galaxies with reasonableparameters.
The surprising result was that the MOND fits put a tight constrainton the stellar scale-heights. The best-fitting scale-heights of allfour stellar dominated galaxies were found to be between 0.25 and0.55 kpc and were strongly constrained to be larger than 0 andless than 1 kpc. For two galaxies, NGC 2403 and NGC 2903, thebest-fitting stellar scale-heights were very close to the typical scale-height used, which is one-fifth of the radial scale-length. On theother hand, NGC 3521 and NGC 3621 have best-fitting stellar scale-heights that are far lower than the suggested scale-height insofar asif the scale-height was fixed to this suggested value, a good fit tothe inner data points would not be achievable. Similarly, the onlygas-dominated galaxy we studied, DDO 154, can achieve a goodfit only if its gas scale-height is larger than ∼0.6 kpc. In fact, thequality of the fit improves with increasing scale-height.
Clearly, the use of both stellar and gas scale-heights as free pa-rameters in MOND fits to galaxy rotation curves is imperative.Line-of-sight velocity dispersions of both components in a sampleof similar face-on galaxies should be used as a sanity check ontheir values since in MOND the rotation curves and vertical veloc-ity dispersions of both components are bound together to the massdistribution.
AC K N OW L E D G M E N T S
GWA’s research is supported by the Claude Leon Foundation anda University Research Fellowship. GWA, KvdH and WJGdB’s re-search is supported by the University of Cape Town and the NationalResearch Foundation of South Africa. BF acknowledges the sup-port of the AvH Foundation. GG is a postdoctoral fellow with theNational Science Fund (FWO-Vlaanderen). The authors thank theTHINGS collaboration for providing their data.
R E F E R E N C E S
Angus G. W., 2008, MNRAS, 387, 1481Angus G. W., Diaferio A., 2011, MNRAS, 417, 941
Banerjee A., Jog C. J., Brinks E., Bagetakos I., 2011, MNRAS, 415, 687Bekenstein J., Milgrom M., 1984, ApJ, 286, 7Bershady M. A., Martinsson T. P. K., Verheijen M. A. W., Westfall K. B.,
Andersen D. R., Swaters R. A., 2011, ApJ, 739, L47Binney J., Tremaine S., 2008, Galactic Dynamics, 2nd edn. Princeton Univ.
Press, Princeton, NJBottema R., 1993, A&A, 275, 16Brada R., Milgrom M., 1995, MNRAS, 276, 453Brada R., Milgrom M., 1999, ApJ, 519, 590Brada R., Milgrom M., 2000a, ApJ, 541, 556Brada R., Milgrom M., 2000b, ApJ, 531, L21Carignan C., Purton C., 1998, ApJ, 506, 125de Blok W. J. G., Walter F., Brinks E., Trachternach C., Oh S., Kennicutt R.
C., 2008, AJ, 136, 2648Famaey B., Binney J., 2005, MNRAS, 363, 603Famaey B., McGaugh S., 2011, preprint (arXiv:1112.3960)Freedman W. L. et al., 2001, ApJ, 553, 47Gentile G., Famaey B., de Blok W. J. G., 2011, A&A, 527, A76Kennicutt R. C., Jr, et al., 2003, PASP, 115, 928Llinares C., 2011, PhD thesis, Kapteyn Astronomical Institute, GroningenLlinares C., Knebe A., Zhao H., 2008, MNRAS, 391, 1778Londrillo P., Nipoti C., 2009, Mem. Soc. Astron. Ital., 13, 89Milgrom M., 1983, ApJ, 270, 365Milgrom M., 1986, ApJ, 302, 617Milgrom M., 2010, MNRAS, 403, 886Nipoti C., Londrillo P., Ciotti L., 2007a, ApJ, 660, 256Nipoti C., Londrillo P., Ciotti L., 2007b, MNRAS, 381, L104Nipoti C., Ciotti L., Binney J., Londrillo P., 2008, MNRAS, 386, 2194Press W. H., Teukolsky S. A., Vetterling W. T., Flannery B. P., 1992, Nu-
merical Recipes in fortran. The Art of Scientific Computing. CambridgeUniv. Press, Cambridge
Puglielli D., Widrow L. M., Courteau S., 2010, ApJ, 715, 1152Sanders R. H., Noordermeer E., 2007, MNRAS, 379, 702Serra A. L., Angus G. W., Diaferio A., 2010, A&A, 524, 16Tiret O., Combes F., 2007, A&A, 464, 517Tiret O., Combes F., 2008a, A&A, 483, 719Tiret O., Combes F., 2008b, in Funes J. G., Corsini E. M., eds, ASP Conf.
Ser. Vol. 396. Formation and evolution of galaxy disks. Astron. Soc.Pac., San Francisco, p. 259
Vinko J. et al., 2006, MNRAS, 369, 1780Walter F., Brinks E., 1999, AJ, 118, 273Walter F., Brinks E., de Blok W. J. G., Bigiel F., Kennicutt R. C., Thornley
M. D., Leroy A., 2008, AJ, 136, 2563Wu X., Zhao H., Wang Y., Llinares C., Knebe A., 2009, MNRAS, 396, 109Zhao H., Famaey B., 2010, Phys. Rev. D, 81, 087304
This paper has been typeset from a TEX/LATEX file prepared by the author.
C© 2012 The Authors, MNRAS 421, 2598–2609Monthly Notices of the Royal Astronomical Society C© 2012 RAS


![Gradient Domain Salience-preserving Color-to-gray Conversion · 2020. 4. 17. · domain 2, a PDE solver such as Poisson equation solver (PES) [Fattal et al. 2002; Press et al. 1992]](https://img.pdfslide.us/doc/110x75/5ff4663d2e827548a42b7c63/gradient-domain-salience-preserving-color-to-gray-conversion-2020-4-17-domain.jpg)

![Hugues Hoppe - An Adaptive Multigrid Solverhhoppe.com/adaptivemultigrid.pdf · 2019. 5. 9. · 3. The Poisson Reconstruction Solver The solver described by Kazhdan et al. [KBH06]](https://img.pdfslide.us/doc/110x75/60668ff91c670e0de017da26/hugues-hoppe-an-adaptive-multigrid-2019-5-9-3-the-poisson-reconstruction.jpg)