Embed Size (px)
Citation preview
A �asi-experimental Estimate of the Impact of P2PTransportation Platforms on Urban Consumer Pa�erns
Zhe ZhangCarnegie Mellon University
5000 Forbes AvePittsburgh, PA [email protected]
Beibei LiCarnegie Mellon University
5000 Forbes AvePittsburgh, PA 15213
ABSTRACTWith the pervasiveness of mobile technology and location-basedcomputing, new forms of smart urban transportation, such as Uber& Lyft, have become increasingly popular. These new forms ofurban infrastructure can in�uence individuals’ movement frictionsand patterns, in turn in�uencing local consumption patterns andthe economic performance of local businesses. To gain insightsabout future impact of urban transportation changes, in this paper,we utilize a novel dataset and econometric analysis methods topresent a quasi-experimental examination of how the emerginggrowth of peer-to-peer car sharing services may have a�ected localconsumer mobility and consumption patterns.
CCS CONCEPTS• Applied computing → Economics; Transportation; • Infor-mation systems → Location based services;
ACM Reference format:Zhe Zhang and Beibei Li. 2017. A Quasi-experimental Estimate of the Im-pact of P2P Transportation Platforms on Urban Consumer Patterns. InProceedings of KDD ’17, August 13-17, 2017, Halifax, NS, Canada, , 9 pages.DOI: 10.1145/3097983.3098058
1 INTRODUCTIONWith the pervasiveness of mobile technology and location-basedcomputing, new forms of smart urban transportation, such as Uber& Lyft — peer-to-peer car transportation services — have becomeincreasingly popular. These new forms of urban infrastructure andtransportation can in�uence individuals’ movement frictions, inturn in�uencing local consumption patterns and the economicperformance of local businesses. In this paper, we utilize a noveldataset to present a quasi-experimental examination of how theemerging growth of peer-to-peer car sharing services may havea�ected local consumer mobility and consumption patterns (e.g.frequency of consumption, total amount spent, and diversity ofconsumption).
Permission to make digital or hard copies of all or part of this work for personal orclassroom use is granted without fee provided that copies are not made or distributedfor pro�t or commercial advantage and that copies bear this notice and the full citationon the �rst page. Copyrights for components of this work owned by others than theauthor(s) must be honored. Abstracting with credit is permitted. To copy otherwise, orrepublish, to post on servers or to redistribute to lists, requires prior speci�c permissionand/or a fee. Request permissions from [email protected] ’17, August 13-17, 2017, Halifax, NS, Canada© 2017 Copyright held by the owner/author(s). Publication rights licensed to ACM.978-1-4503-4887-4/17/08. . . $15.00DOI: 10.1145/3097983.3098058
Under KDD’s Discovery theme, as cities adapt to continuingchanges in transportation technology, it is of interest to study howsuch changes to the transportation system may a�ect consumers,local businesses, and social mobility patterns. This research canprovide social insights for planners and government o�cials con-sidering future changes, such as self-driving cars, increased transit-oriented development, or increased global urbanization. There aremanagerial implications for such planners and government o�cials.For example, when ride-sharing platforms were initially emerging,many local planners and o�cials were wary of embracing them,unsure about the pros and cons. This research aims to provide moreanalysis into the potential pros and cons on the urban environmentfrom existing and future transportation changes.
This is a challenging set of issues to study for a few reasons. Firstis availability of appropriate data, second is identifying an appro-priate causal estimation of e�ects. To date, discussion around theimpact of the entry of these ride-sharing services has not been ableto study individual-level analysis or heterogeneity, instead studyingthe impact at the city level, such as aggregate entrepreneurship,drunk-driving, or tra�c levels [2, 8, 12]. Furthermore, using datamining techniques to identify patterns of local consumption datamay not provide useful causal insights for policy counterfactualanalysis. Such patterns could be at risk of being in�uenced by city-speci�c unobservable local or national time trends, or self-selectionbias of consumers.
Our motivating hypothesized mechanism is that mobile-app-enabled transportation services enable easier access to transporta-tion — rather than just a replacement for existing transportation— which leads to lower transportation frictions for adopting con-sumers. Following from these lower frictions, we can expect severalpossible e�ects from the entry of Uber/Lyft. In this paper’s analysis,we focus on the hypothesis that lower frictions lead to increasedindividual consumption with local restaurants and bars. If thishypothesis were not true, we would expect no changes in the con-sumption behavior of adopting consumers (relative to a comparablereference group), despite observing high usage of Uber/Lyft, sinceit would simply be replacing existing consumer transportation.
In this study, we use a novel and �ne-grained panel dataset toestimate how such peer-to-peer transportation services might a�ectindividual urban behaviors. We investigate the impact of the entryof the UberX and Lyft ride-sharing platforms. Our unique contribu-tions will be taking advantage of a natural experiment of the entryof peer-to-peer sharing platforms across time and locations, andlinking that with longitudinal, detailed data sources of consumertransactions and information. This estimation is further strength-ened by controlling for potentially endogenous entry of Uber/Lyft
KDD 2017 Applied Data Science Paper KDD’17, August 13–17, 2017, Halifax, NS, Canada
1683
(location-speci�c trends) and self-selection of adopters, by identi-fying an appropriately comparable non-adopter reference group.This enables a di�erence-in-di�erences analysis with propensityscore matching to estimate the treatment e�ect on the treated, i.e.how adopters of Uber/Lyft may change their consumption patternsrelative to a similar, but non-adopter reference group. This methodof studying of the e�ect of adoption on adopters is similar to recentliterature [17].
The �ne-grained panel data we use are based on �ne-grainedindividual credit card transactions from 2012-2016, from a totalof over 40K continuously active accounts and 25M transactions.This range includes time periods both before and after the avail-ability of Uber/Lyft. In our main �ndings, we identify, for the post-Uber/Lyft-entry period in various locations: �rst, an increase in thefrequency and total amount spent on local food/drink businesses,but no notable increase in the amount spent per food/drink trans-action. Second, we identify a strong relationship between an indi-vidual’s usage intensity of Uber or Lyft and increases in food/drinkfrequency/spending. This is consistent with our hypothesis thatthe proposed mechanism is the usage of these P2P transportationplatforms that leads to reduced local consumption frictions, moreso than just the availability or adoption.
1.1 Related LiteraturePeer-to-peer ride-sharing services, such as Uber and Lyft, are largecompanies associated with the broader “sharing economy” — AirBnBwith lodging, Uber, Lyft, Didi or BlaBlaCar with transportation,TaskRabbit with freelance labor, etc [16]. According to a recentstudy by Pew Research Center in May 20161, 72% of U.S. populationhave engaged with such shared or on-demand services. A usefulstream of recent research has provided empirical evidence on theimpact of the entry of these “sharing economy” platforms. Based onthe growth of various sharing economy platforms and companies,there have been several recent studies analyzing the impacts of thesharing economy. Several papers have focused on impacts on com-petitors within the related industry. In transportation, Uber datahas been used to analyze New York City transportation patterns aswell as corresponding relationship with taxi competition2. Uber’sinternal research team has also studied Uber’s impact on increasingtransportation availability in New York City [9]. [18] �nd a reducedrevenue e�ect of AirBnB entry on the Texas hotel industry by usinga natural experiment approach. By using a structural economet-ric approach, [5] conducted demand estimation and also found areduced revenue impact of AirBnB growth on the national hotelindustry.
Other papers have studied how the sharing economy has im-pacted complementary or indirectly-related sectors. [8] studied theentry of the Uber platform’s e�ect in a societal context, using thevaried entry times of Uber to estimate a reduction in alcohol-relatedmotor vehicle homicides. [2] studied the impact of Uber entry onthe volume of campaign launches on Kickstarter to examine thelocal entrepreneurial activity. [12] and [14] also studied the impactof Uber on aggregate local tra�c and debt, respectively. A common
1http://www.pewinternet.org/2016/05/19/the-new-digital-economy/2https://�vethirtyeight.com/features/uber-is-taking-millions-of-manhattan-rides-away-from-taxis/
thread for all of the above literature is looking at aggregate impactsof the sharing economy, rather than individual-level changes. Othertheoretical literature on the impact of indirect impact of the sharingeconomy focus on how the impact on manufacturers of the sharedgoods may be a�ected by the entry peer-to-peer rental markets[1, 11]. Regarding the sharing economy itself, [4, 7, 10] focus theo-retically on the management or preferences of the sharing economycompanies, platforms, or participating consumers.
More broadly, outside of the sharing economy itself, this paperalso contributes to a growing literature on the societal and o�ineimpacts of changes in information/digital technology. In this vein,papers have looked at the entry of Craigslist had impacts beyondon the classi�ed ads sector [15], but also on local behavior. [3] and[13] look at the impact of the availability of Craigslist on HIV trans-mission and prostitution trends, respectively. [6] study generallythe growth of Internet investment and local wages. Methodologi-cally, we reference a literature of using matching techniques to per-form di�erence-in-di�erences analyses on adoption e�ects. In ourdataset, we identify adopters, before and after an exogenous shockof Uber/Lyft availability. To ensure our comparison of adopters tonon-adopters is more apt, we use matching techniques to identifya closer comparison group of non-adopters, similar to [17], in theirstudy of iPad app adoption on purchases.
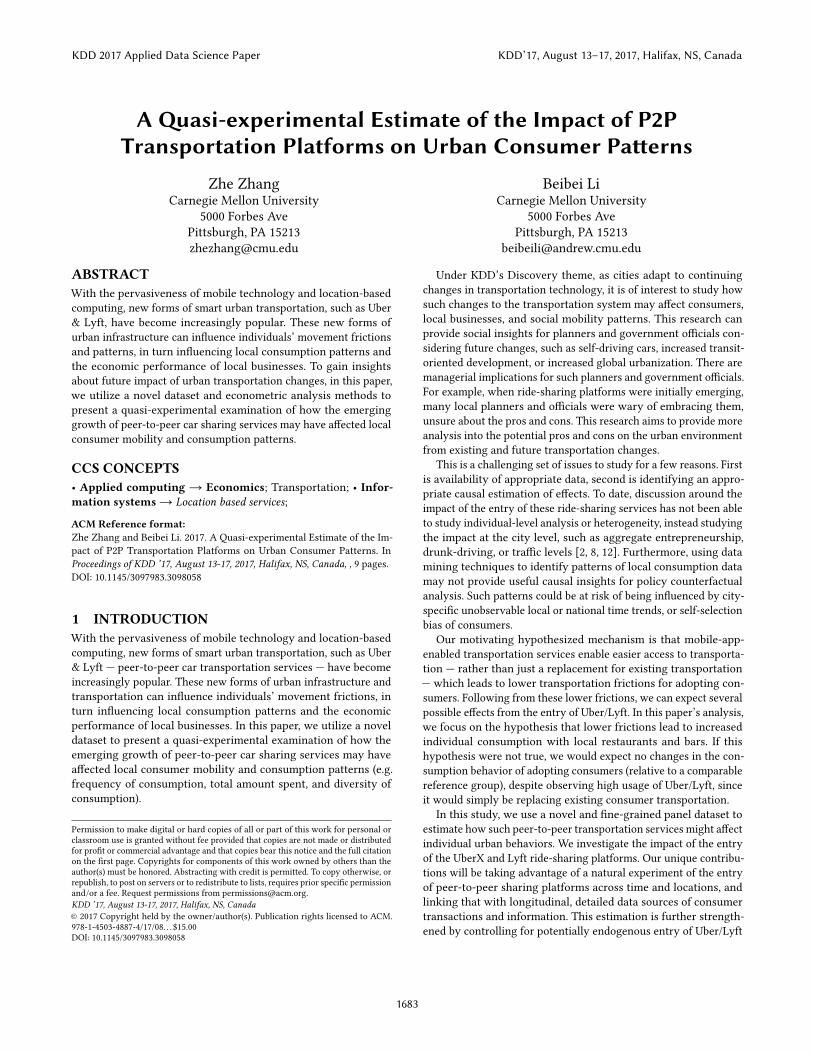
2 FINE-GRAINED LONGITUDINAL DATAFrom a large U.S. �nancial institution, we have access to all customer-level transactions from a random, anonymized national sample ofindividuals across over 8 years (100 months). It is over-sampledin two particular metropolitan areas of interest to the institution.Several sources of spending are available; in this analysis we focuson the credit card consumers and transactions from January 2012through May 2016, about four and a half years of observations. Thisdate range is an appropriate data range to use because while bothUberX and Lyft (popular peer-to-peer transportation platforms)were both introduced in San Francisco in mid-2012, their nationalexpansion and growth mostly occurred in 2013 and 2014, as seenin Figure 1 for several metropolitan areas, and the large majorityof our observed consumers are not from San Francisco.
For each transaction, we observe the account ID, day of trans-action, amount spent, the standardized SIC store categorization,and importantly, the name of the store3. Debit, prepaid card, andATM transactions also have more speci�c zip code, city, and ad-dress information of the store. With information on each speci�cstore’s merchant name, we can identify individual Uber and Lyfttransactions.
While the data contains many observed transactions and con-sumers, our focus of interest is on consumers in metropolitan areasthat received the Uber/Lyft entry. This enables study of the e�ectof entry and adoption by having enough consumers in each area toestimate city-speci�c, counterfactual time trends. Additionally, toavoid possible confounding in the data from exogenous changes inconsumption, we want to only consider consumers who did not join
3Any stores with fewer than 10 transactions will be truncated to ensure it does nothave personally identi�able information. For example, in some credit card transactions,the transaction number will be described in the store name. These unique numbers arescrubbed from our dataset to ensure privacy, but the more general store information,if no longer identi�able, is still kept.
KDD 2017 Applied Data Science Paper KDD’17, August 13–17, 2017, Halifax, NS, Canada
1684
or leave their credit card account between 2012 and 2016. Lastly,we want to ensure a minimum level of activity and transactionfrequency to ensure that we are only comparing consumers whoare active users of their credit card. These constraints are impor-tant to ensure that we appropriately identify patterns of consumerspending both before and after the availability of Uber/Lyft.
To do so, we de�ne a “core sample” of the consumers in the data.We identify each consumer’s mailing address city in each month.We remove consumers who were in multiple cities during 2012 -2016 to again reduce potential confounding. Having connected eachconsumer to a city, we then identify Uber/Lyft transactions usingthe transaction merchant names (described below) and identifythe top 30 cities based on total number of Uber/Lyft transactions.These 30 cities correspond to 12 broader metropolitan areas. Wekeep only consumers living in these 30 cities because we want tostudy the e�ect of Uber/Lyft on adopters. If the adoption and usageof Uber/Lyft is small in a city, then this city is not as useful inestimating an e�ect. Lastly, we also ensure a minimum of at least10 transactions in each complete year of our sample. This resultsin 14% of the original number of consumers in the data. With thisreduced core sample, our analysis is representative for a sample ofnon-moving consumers, in cities with notable Uber/Lyft adoption,who already had their credit card accounts in 2012, and maintainedspending activity in each year of 2012-2016.
While this reduction of our data into a “core sample” reduces theamount of data substantially, for this analysis, we prefer this smallersample. The data in this sample is more trustworthy against risksfrom possible external confounding in�uences. The core sample stillhas enough data to use for the main analysis and in our robustnessand heterogeneity analysis, we relax the de�nitions of our sampleof interest.
2.0.1 Measuring Uber/Ly� Usage. We can identify whether eachtransaction is an Uber/Lyft transaction. We take all of our trans-actions and keep only those that speci�cally match certain Ubermerchant name strings (identi�ed by manually looking at all oc-curring strings with the string “UBER” in the merchant name andremoving false positive merchant names). We also do the same forthe “LYFT” string, which has no confounding occurrences. For thecities where we observe the most consumers, we plot the usage ofUber/Lyft per consumer below in Figure 1. The median number oftrips amongst adopters in our core sample is 7 total trips, with amedian price of $13.70. Approximately 8% of our observed uniqueaccounts are observed to have paid for Uber/Lyft in our time sample.
2.0.2 Measuring Outcomes of Interest. Our �rst outcome ofinterest is an individual’s number of transactions, in a week, atfood/drink merchants. This follows from our proposed mechanism:lower transportation frictions will lead consumers to engage morefrequently with local businesses. We further hypothesize that thise�ect from lower frictions will be stronger for leisure activities,such as going out to eat or drink. Thus, we keep only transac-tions for merchants that have Standard Industrial Classi�cation(SIC) (which describes the store type) of 5812 (Retail-Eating Places)or 5813 (Retail-Drinking Places). These are considered food/drinktransactions. There is an average of 0.7 food/drink transactions perweek per account.
Figure 1: Showing the Uber/Lyft transactions per day, beforeand after the entry of Uber/Lyft, in 6 major metropolitan ar-eas. On the bottom-left, in City I, the �uctuation in usagere�ects a shutdown and re-opening of Uber/Lyft in that lo-cale.
Correspondingly, a second outcome variable of interest is thetotal amount spent by an individual, in a week, at food/drink mer-chants. We expect that if the number of transactions increases,the total amount spent should also increase. However, when weconsider a third outcome variable: the average amount spent byan individual, in a week, at food/drink merchants; we do not ex-pect this to increase, because we hypothesize that frictions shouldnot notably a�ect the price range of chosen merchants. There isan average of $33 spent on food/drink transactions per week peraccount.
Additionally, we are also interested in the geographical nature ofthe Uber/Lyft treatment. As we discussed, for consumers in a city,lower transportation frictions could ease access to some merchantsor neighborhoods. Some merchants may be in di�cult-to-accessplaces, such as far away from a subway or public transit stop, havinglimited parking, or simply being further away from a consumer’shome. Detailed geographic locations are unavailable, so as a simplemeasure and our fourth outcome variable of interest, we measurethe number of unique food/drink merchants an individual visits, ina month. There is an average of 11 unique food/drink merchantsper month per account.
Lastly, for each of the outcome variables, we use the natural-logof each variable plus 1 as the outcome of interest. This is becauseeach of the four outcome variables are skewed. This also allows us toestimate the elasticity of our outcome variables with respect to thepredictive features. Also, we identify robustness in the qualitativeresults by aggregating them at di�erent time windows: {day, half-week, week, and month}.
3 ECONOMETRIC MODELING FOR CAUSALANALYSIS
In our main estimation, we use a di�erence-in-di�erences styleapproach to estimate the treatment e�ect entry of ride-sharing
KDD 2017 Applied Data Science Paper KDD’17, August 13–17, 2017, Halifax, NS, Canada
1685
services on our outcomes of interest for the Uber/Lyft adopters,but keeping only a limited matched control group. As describedabove, these outcomes include individual spending frequency, totalamount spent, amount spent per transaction, and number of uniquemerchants. To do so, we adopt a similar di�erence-in-di�erencesapproach as previous literature studying adoption e�ects (e.g., studyof iPad app adoption by [17]).
Our key identi�cation �rst comes from the variation of the timesof the entry of Uber and Lyft services into di�erent U.S. metro-politan areas. This variation enables identi�cation between thepotential impact of entry versus national time trends. We arguethat this entry date is exogenous to individuals, suggesting a natu-ral experiment on adopters — i.e., we observe adopters who wereinitially unable to adopt and use the service, until an exogenousoutcome enabled a new service for such consumers. Combined withcontrolling for individual �xed e�ects (identi�ed by pre-entry data),this potentially exogenous entry supports identi�cation of a rela-tionship between outcomes and a constant e�ect in the post-entryperiod.
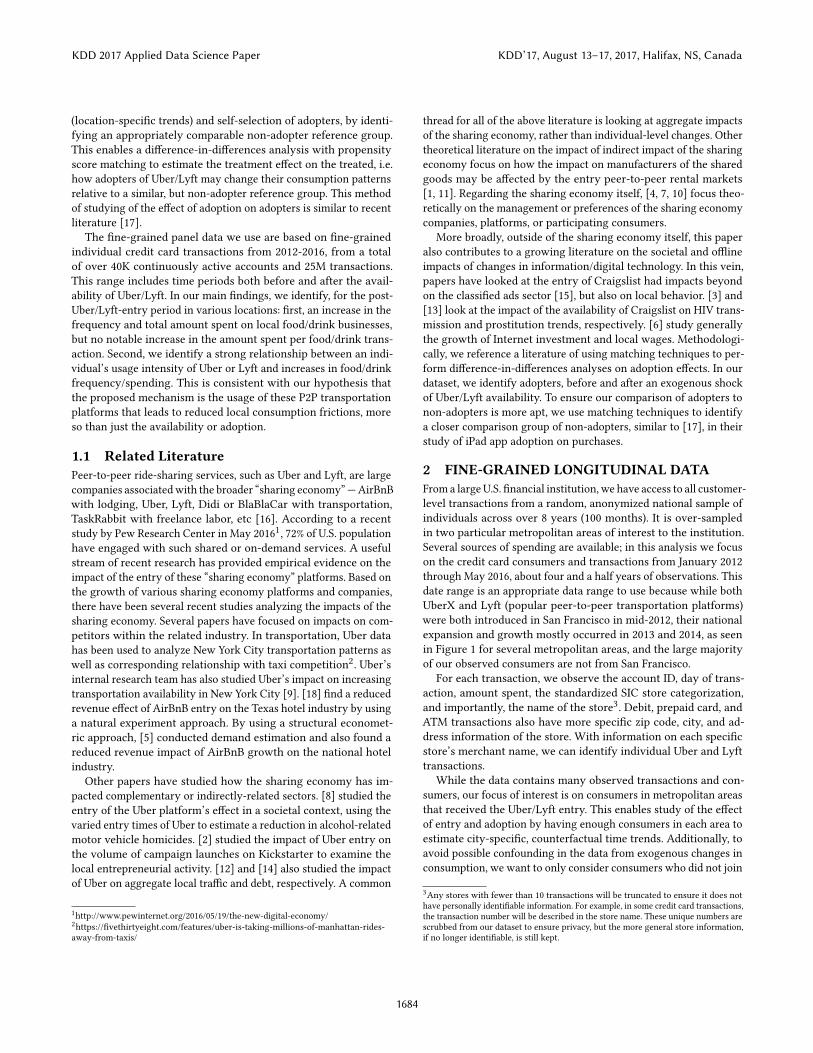
However, there may be local-speci�c time-trends, or correlationbetween entry and local-speci�c unobservables. Additionally, con-sumers who do not adopt soon after entry may be susceptible toindividual-speci�c time-varying unobservables, such as changes inincome. To control for such local time trends and the self-selectionof the non-immediate adopters, we use propensity score matchingto identify an appropriate, similar reference group of non-adoptersto compare against the adopters of interest. These consumers arematched on their propensity to adopt, using various features, in-cluding consumption behavior and locale. This enables a di�erence-in-di�erences panel data analysis, at the local city level. As we showin Figure 2, matching also improves the parallel trends assumptionpre-entry at the individual level.
If our hypothesis is incorrect and the alternate explanation isthat the Uber/Lyft services simply just replace existing transporta-tion choices — e.g., driving or taxis — we should not expect to seepositive associations between Uber/Lyft entry or usage and ouroutcomes of interest. Since we show that the adopters are similarto the non-adopters in their consumption behavior before adoption,if Uber/Lyft have no impact on consumption behavior, then con-sumption should also remain similar after the entry and usage ofUber/Lyft.
Importantly, in our main estimation, we use the sample of adoptersand matched reference group. We keep all the consumers who weidenti�ed as adopters, having paid for Uber/Lyft (n = 664), and acorresponding propensity score matched sample of non-adopters(n = 664), with a similar estimated propensity to adopt. These twosets of consumers and their transactions are the matched groupand data. The propensity score matching procedure is described inmore detail below.
Without matching, the adopters appear to be quite di�erent onaverage than the non-adopters, perhaps due to many non-adoptersnot utilizing their credit card frequently. However, once we onlyconsider the propensity matched group, there appears to be a strongparallel trend between the adopters and non-adopters in multi-ple metropolitan areas. This parallel trend is consistent with ourdi�erence-in-di�erences hypothesis that the matched reference
group provides an estimate of the counterfactual consumption out-comes for the adoption group, including time trend e�ects pre-entry.Of course, adoption is still a choice by consumers, which is whywe emphasize that, unlike a policy analysis, we focus on potentiale�ects on just those treated. (Potential spillover e�ects of Uber/Lyfton non-adopters are possible, but captured by the reference groupin this analysis.)
With this matched data, we perform the following di�erence-in-di�erences style estimation. We control for time-invariant, individual-level di�erences using account-level �xed e�ects. We also includecity-level �xed e�ects and time dummies to control for seasonalityin our outcome variables.
Importantly, since �nancial activity is varying over time andmay be correlated with both Uber/Lyft and our outcome variables,we want to avoid confounding our estimates with periods in timewith higher spending. Thus, as a control, for each correspondingmonth, we include each individual’s total number of transactions,spending, and average spent per transaction. Lastly, we also useclustered robust standard errors at the city-level in case there arecity-level correlations in errors among consumers. This results inthe following estimating equation:
Yi jt = αi + λj + τt + βXit + νEjt + γ IiEjt + εi jt
where Yi jt are an individual i’s observed outcomes in time period tand location t , Xit are observed individual time-varying character-istics (e.g., monthly total spending attributes), Ii is an indicator ifan individual is an adopter of Uber/Lyft, and Ejt is an indicator iflocation j has Uber or Lyft services available. In this case, γ is ourcoe�cient of interest, for the post-entry period treatment e�ect.
We focus primarily on the post-entry period because, due to net-work e�ects, an adopter may be exposed to the impact of Uber/Lyfteven before their �rst trip. For example, they may share a ride withfriends, or friends of our adopter sample who also utilize Uber/Lyftmay encourage food/drink consumption on our adopter sample.Additionally, the post-entry period has a simpler identi�cation, dueto the exogenous availability of Uber/Lyft — though estimatinglong-term impacts is more di�cult.
Next, we introduce the key aspect of interest, measuring individ-ual actual usage of Uber/Lyft, our speci�c hypothesized mechanismof the e�ect. As a reminder, we propose that Uber/Lyft lower trans-portation frictions for some consumers, enabling them to engagemore with local businesses. We introduce Qit , which measuresboth the number of and amount spent on Uber/Lyft transactionsfor an individual i in time t . In this case, we expect if actual usageis observed, this should drive the associations we observe, whereasafter controlling for usage, Uber/Lyft entry or adoption should nothave a direct associated relationship with outcomes.
An important note is that usage may be correlated with an in-dividual consumer being in a period of high consumption. Theissue is that this would only be observed for adopters, while wecannot observe if non-adopters are in a high period. Thus, the esti-mate for the association of Uber/Lyft usage with outcomes couldinclude both the in�uence from usage itself (mechanism) alongwith in�uence from being more likely in a high consumption timeperiod. To address this concern, we control for individual-speci�cspending trends in all categories (Xit ), and in Table 3, we vary thetime window of analysis, expecting reduced confounding when the
KDD 2017 Applied Data Science Paper KDD’17, August 13–17, 2017, Halifax, NS, Canada
1686
0.0
0.1
0.2
0.3
2012 2013 2014 2015 2016Transaction Day of Year
Tota
l Tra
nsac
tions
Per
Day
Per
Use
r
Ever Adopt0
1
Matched Sample − Per Day Per User Total Transactions Trend Line(Metro Area A − All Cities)
0.005
0.010
0.015
0.020
0.025
2012 2013 2014 2015 2016Transaction Day of Year
Tota
l Tra
nsac
tions
Per
Day
Per
Use
r
Ever Adopt0
1
Matched Sample − Per Day Per User Total Transactions Trend Line(Metro Area B − Main City)
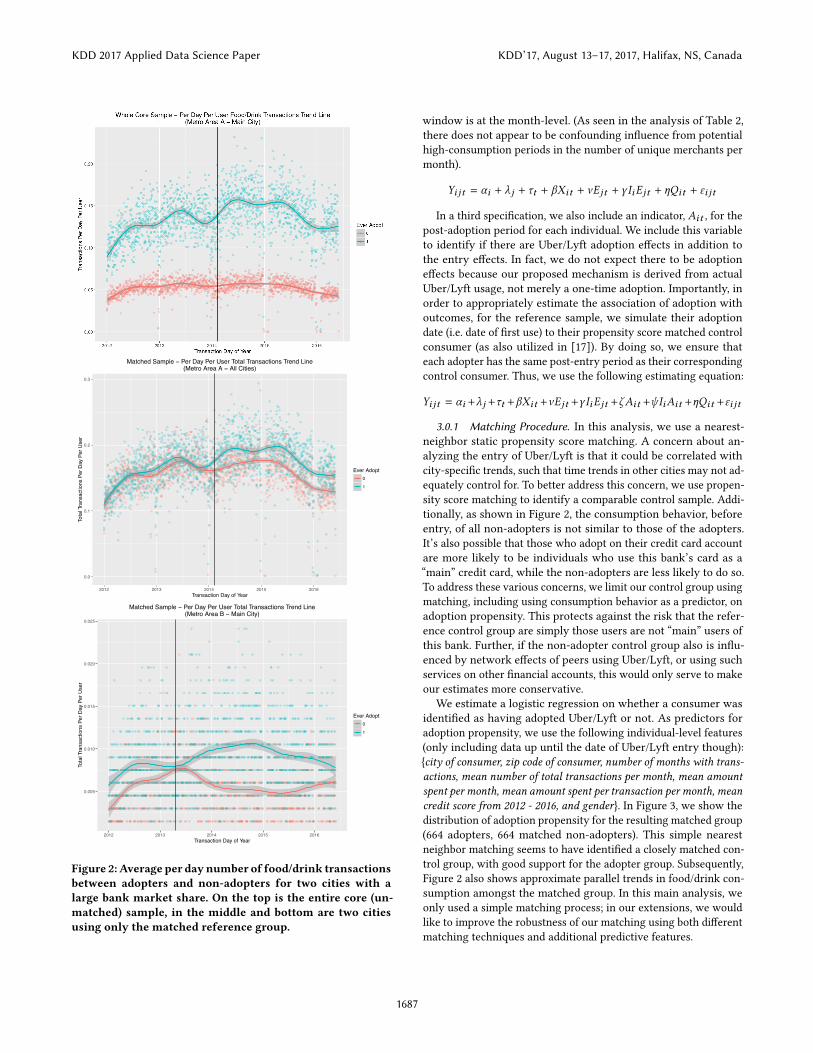
Figure 2: Average per daynumber of food/drink transactionsbetween adopters and non-adopters for two cities with alarge bank market share. On the top is the entire core (un-matched) sample, in the middle and bottom are two citiesusing only the matched reference group.
window is at the month-level. (As seen in the analysis of Table 2,there does not appear to be confounding in�uence from potentialhigh-consumption periods in the number of unique merchants permonth).
Yi jt = αi + λj + τt + βXit + νEjt + γ IiEjt + ηQit + εi jt
In a third speci�cation, we also include an indicator, Ait , for thepost-adoption period for each individual. We include this variableto identify if there are Uber/Lyft adoption e�ects in addition tothe entry e�ects. In fact, we do not expect there to be adoptione�ects because our proposed mechanism is derived from actualUber/Lyft usage, not merely a one-time adoption. Importantly, inorder to appropriately estimate the association of adoption withoutcomes, for the reference sample, we simulate their adoptiondate (i.e. date of �rst use) to their propensity score matched controlconsumer (as also utilized in [17]). By doing so, we ensure thateach adopter has the same post-entry period as their correspondingcontrol consumer. Thus, we use the following estimating equation:
Yi jt = αi +λj +τt +βXit +νEjt +γ IiEjt +ζAit +ψ IiAit +ηQit +εi jt
3.0.1 Matching Procedure. In this analysis, we use a nearest-neighbor static propensity score matching. A concern about an-alyzing the entry of Uber/Lyft is that it could be correlated withcity-speci�c trends, such that time trends in other cities may not ad-equately control for. To better address this concern, we use propen-sity score matching to identify a comparable control sample. Addi-tionally, as shown in Figure 2, the consumption behavior, beforeentry, of all non-adopters is not similar to those of the adopters.It’s also possible that those who adopt on their credit card accountare more likely to be individuals who use this bank’s card as a“main” credit card, while the non-adopters are less likely to do so.To address these various concerns, we limit our control group usingmatching, including using consumption behavior as a predictor, onadoption propensity. This protects against the risk that the refer-ence control group are simply those users are not “main” users ofthis bank. Further, if the non-adopter control group also is in�u-enced by network e�ects of peers using Uber/Lyft, or using suchservices on other �nancial accounts, this would only serve to makeour estimates more conservative.
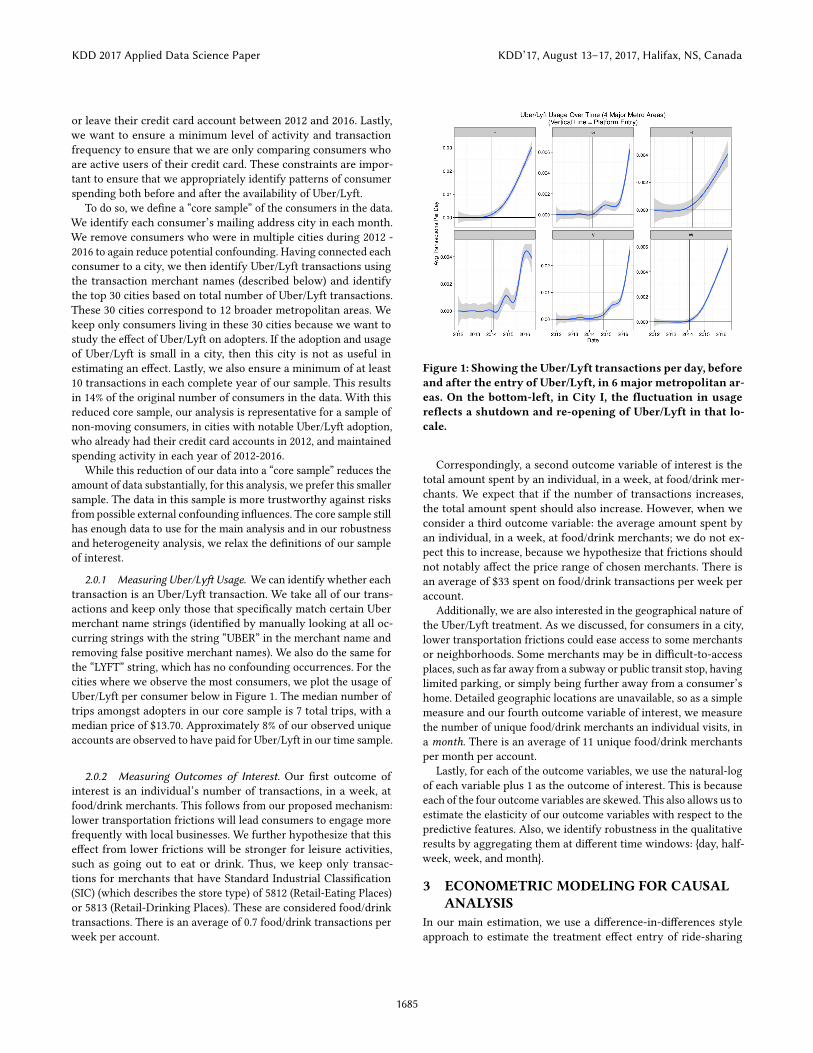
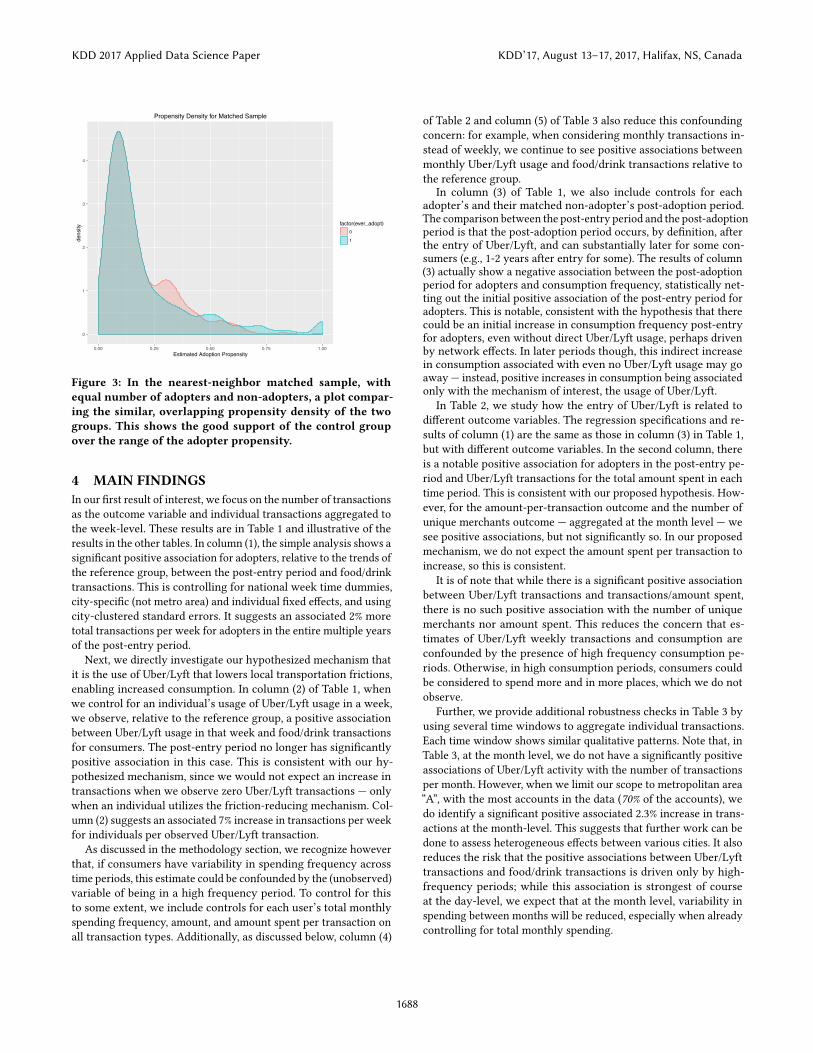
We estimate a logistic regression on whether a consumer wasidenti�ed as having adopted Uber/Lyft or not. As predictors foradoption propensity, we use the following individual-level features(only including data up until the date of Uber/Lyft entry though):{city of consumer, zip code of consumer, number of months with trans-actions, mean number of total transactions per month, mean amountspent per month, mean amount spent per transaction per month, meancredit score from 2012 - 2016, and gender}. In Figure 3, we show thedistribution of adoption propensity for the resulting matched group(664 adopters, 664 matched non-adopters). This simple nearestneighbor matching seems to have identi�ed a closely matched con-trol group, with good support for the adopter group. Subsequently,Figure 2 also shows approximate parallel trends in food/drink con-sumption amongst the matched group. In this main analysis, weonly used a simple matching process; in our extensions, we wouldlike to improve the robustness of our matching using both di�erentmatching techniques and additional predictive features.
KDD 2017 Applied Data Science Paper KDD’17, August 13–17, 2017, Halifax, NS, Canada
1687
0
1
2
3
4
0.00 0.25 0.50 0.75 1.00Estimated Adoption Propensity
dens
ity
factor(ever_adopt)0
1
Propensity Density for Matched Sample
Figure 3: In the nearest-neighbor matched sample, withequal number of adopters and non-adopters, a plot compar-ing the similar, overlapping propensity density of the twogroups. This shows the good support of the control groupover the range of the adopter propensity.
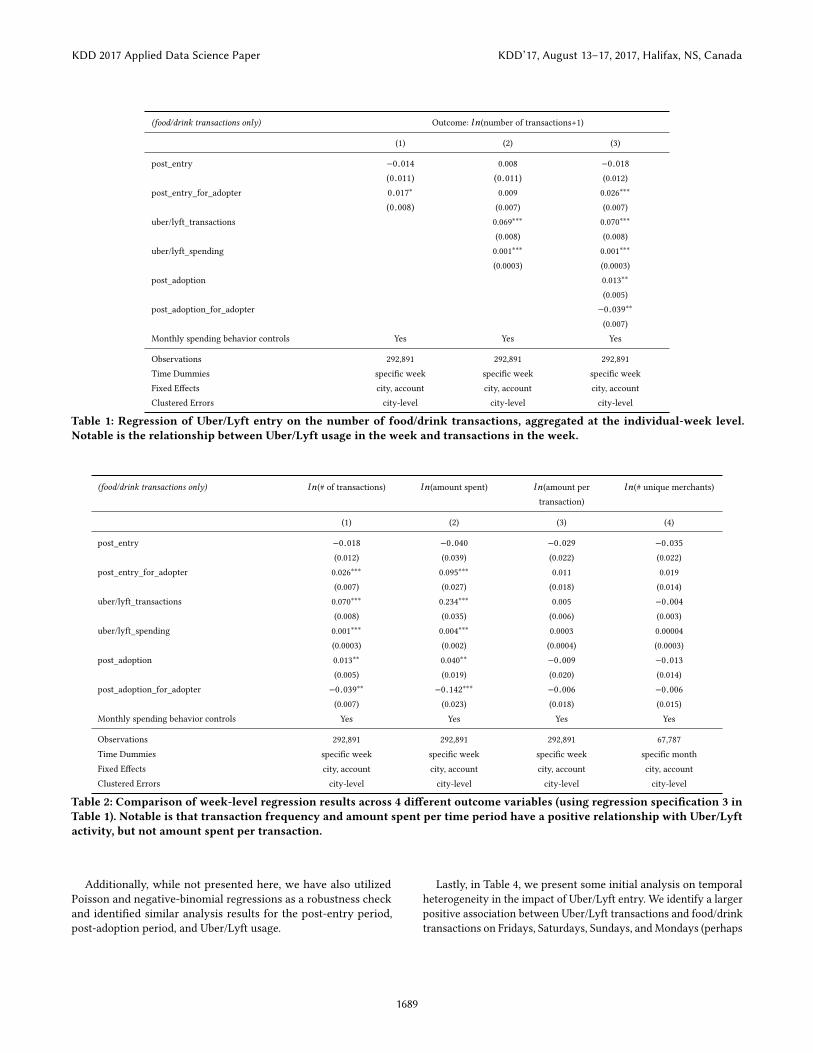
4 MAIN FINDINGSIn our �rst result of interest, we focus on the number of transactionsas the outcome variable and individual transactions aggregated tothe week-level. These results are in Table 1 and illustrative of theresults in the other tables. In column (1), the simple analysis shows asigni�cant positive association for adopters, relative to the trends ofthe reference group, between the post-entry period and food/drinktransactions. This is controlling for national week time dummies,city-speci�c (not metro area) and individual �xed e�ects, and usingcity-clustered standard errors. It suggests an associated 2% moretotal transactions per week for adopters in the entire multiple yearsof the post-entry period.
Next, we directly investigate our hypothesized mechanism thatit is the use of Uber/Lyft that lowers local transportation frictions,enabling increased consumption. In column (2) of Table 1, whenwe control for an individual’s usage of Uber/Lyft usage in a week,we observe, relative to the reference group, a positive associationbetween Uber/Lyft usage in that week and food/drink transactionsfor consumers. The post-entry period no longer has signi�cantlypositive association in this case. This is consistent with our hy-pothesized mechanism, since we would not expect an increase intransactions when we observe zero Uber/Lyft transactions — onlywhen an individual utilizes the friction-reducing mechanism. Col-umn (2) suggests an associated 7% increase in transactions per weekfor individuals per observed Uber/Lyft transaction.
As discussed in the methodology section, we recognize howeverthat, if consumers have variability in spending frequency acrosstime periods, this estimate could be confounded by the (unobserved)variable of being in a high frequency period. To control for thisto some extent, we include controls for each user’s total monthlyspending frequency, amount, and amount spent per transaction onall transaction types. Additionally, as discussed below, column (4)
of Table 2 and column (5) of Table 3 also reduce this confoundingconcern: for example, when considering monthly transactions in-stead of weekly, we continue to see positive associations betweenmonthly Uber/Lyft usage and food/drink transactions relative tothe reference group.
In column (3) of Table 1, we also include controls for eachadopter’s and their matched non-adopter’s post-adoption period.The comparison between the post-entry period and the post-adoptionperiod is that the post-adoption period occurs, by de�nition, afterthe entry of Uber/Lyft, and can substantially later for some con-sumers (e.g., 1-2 years after entry for some). The results of column(3) actually show a negative association between the post-adoptionperiod for adopters and consumption frequency, statistically net-ting out the initial positive association of the post-entry period foradopters. This is notable, consistent with the hypothesis that therecould be an initial increase in consumption frequency post-entryfor adopters, even without direct Uber/Lyft usage, perhaps drivenby network e�ects. In later periods though, this indirect increasein consumption associated with even no Uber/Lyft usage may goaway — instead, positive increases in consumption being associatedonly with the mechanism of interest, the usage of Uber/Lyft.
In Table 2, we study how the entry of Uber/Lyft is related todi�erent outcome variables. The regression speci�cations and re-sults of column (1) are the same as those in column (3) in Table 1,but with di�erent outcome variables. In the second column, thereis a notable positive association for adopters in the post-entry pe-riod and Uber/Lyft transactions for the total amount spent in eachtime period. This is consistent with our proposed hypothesis. How-ever, for the amount-per-transaction outcome and the number ofunique merchants outcome — aggregated at the month level — wesee positive associations, but not signi�cantly so. In our proposedmechanism, we do not expect the amount spent per transaction toincrease, so this is consistent.
It is of note that while there is a signi�cant positive associationbetween Uber/Lyft transactions and transactions/amount spent,there is no such positive association with the number of uniquemerchants nor amount spent. This reduces the concern that es-timates of Uber/Lyft weekly transactions and consumption areconfounded by the presence of high frequency consumption pe-riods. Otherwise, in high consumption periods, consumers couldbe considered to spend more and in more places, which we do notobserve.
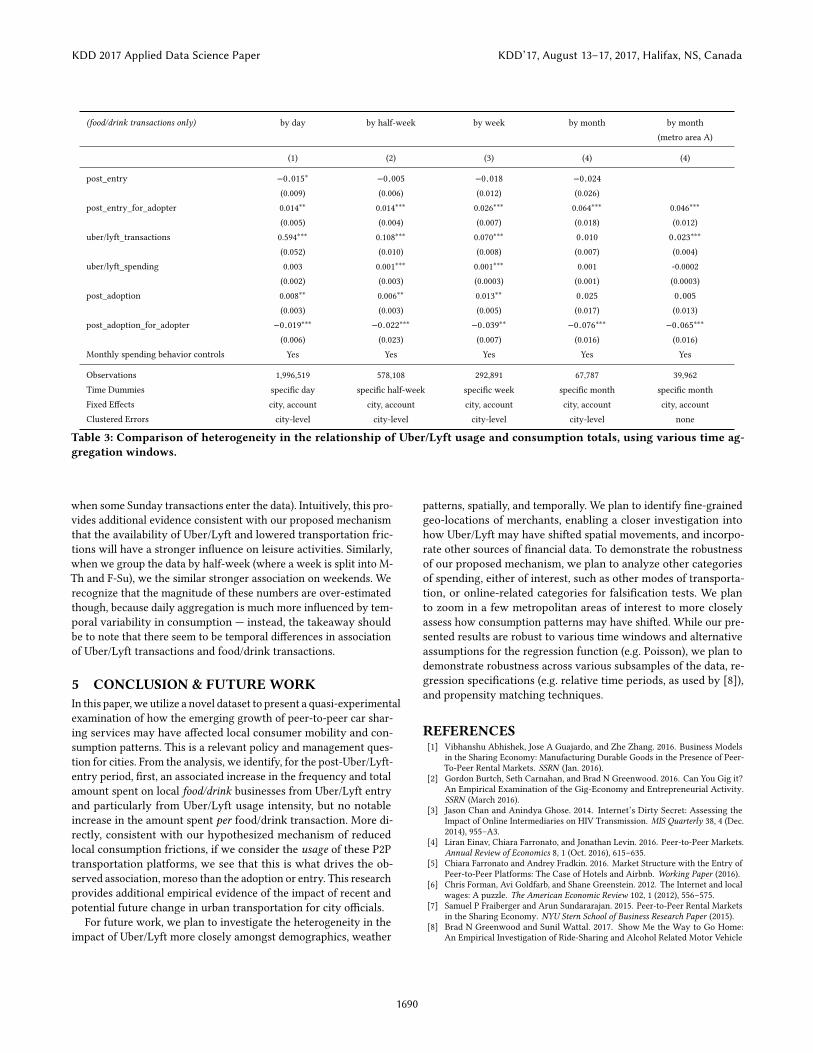
Further, we provide additional robustness checks in Table 3 byusing several time windows to aggregate individual transactions.Each time window shows similar qualitative patterns. Note that, inTable 3, at the month level, we do not have a signi�cantly positiveassociations of Uber/Lyft activity with the number of transactionsper month. However, when we limit our scope to metropolitan area“A”, with the most accounts in the data (70% of the accounts), wedo identify a signi�cant positive associated 2.3% increase in trans-actions at the month-level. This suggests that further work can bedone to assess heterogeneous e�ects between various cities. It alsoreduces the risk that the positive associations between Uber/Lyfttransactions and food/drink transactions is driven only by high-frequency periods; while this association is strongest of courseat the day-level, we expect that at the month level, variability inspending between months will be reduced, especially when alreadycontrolling for total monthly spending.
KDD 2017 Applied Data Science Paper KDD’17, August 13–17, 2017, Halifax, NS, Canada
1688
(food/drink transactions only) Outcome: ln(number of transactions+1)
(1) (2) (3)
post_entry −0.014(0.011)
0.008(0.011)
−0.018(0.012)
post_entry_for_adopter 0.017∗
(0.008)0.009
(0.007)0.026∗∗∗
(0.007)uber/lyft_transactions 0.069∗∗∗
(0.008)0.070∗∗∗
(0.008)uber/lyft_spending 0.001∗∗∗
(0.0003)0.001∗∗∗
(0.0003)post_adoption 0.013∗∗
(0.005)post_adoption_for_adopter −0.039∗∗
(0.007)Monthly spending behavior controls Yes Yes Yes
Observations 292,891 292,891 292,891Time Dummies speci�c week speci�c week speci�c weekFixed E�ects city, account city, account city, accountClustered Errors city-level city-level city-level
Table 1: Regression of Uber/Lyft entry on the number of food/drink transactions, aggregated at the individual-week level.Notable is the relationship between Uber/Lyft usage in the week and transactions in the week.
(food/drink transactions only) ln(# of transactions) ln(amount spent) ln(amount pertransaction)
ln(# unique merchants)
(1) (2) (3) (4)
post_entry −0.018(0.012)
−0.040(0.039)
−0.029(0.022)
−0.035(0.022)
post_entry_for_adopter 0.026∗∗∗
(0.007)0.095∗∗∗
(0.027)0.011
(0.018)0.019
(0.014)uber/lyft_transactions 0.070∗∗∗
(0.008)0.234∗∗∗
(0.035)0.005
(0.006)−0.004(0.003)
uber/lyft_spending 0.001∗∗∗
(0.0003)0.004∗∗∗
(0.002)0.0003
(0.0004)0.00004(0.0003)
post_adoption 0.013∗∗
(0.005)0.040∗∗
(0.019)−0.009(0.020)
−0.013(0.014)
post_adoption_for_adopter −0.039∗∗
(0.007)−0.142∗∗∗
(0.023)−0.006(0.018)
−0.006(0.015)
Monthly spending behavior controls Yes Yes Yes Yes
Observations 292,891 292,891 292,891 67,787Time Dummies speci�c week speci�c week speci�c week speci�c monthFixed E�ects city, account city, account city, account city, accountClustered Errors city-level city-level city-level city-level
Table 2: Comparison of week-level regression results across 4 di�erent outcome variables (using regression speci�cation 3 inTable 1). Notable is that transaction frequency and amount spent per time period have a positive relationship with Uber/Lyftactivity, but not amount spent per transaction.
Additionally, while not presented here, we have also utilizedPoisson and negative-binomial regressions as a robustness checkand identi�ed similar analysis results for the post-entry period,post-adoption period, and Uber/Lyft usage.
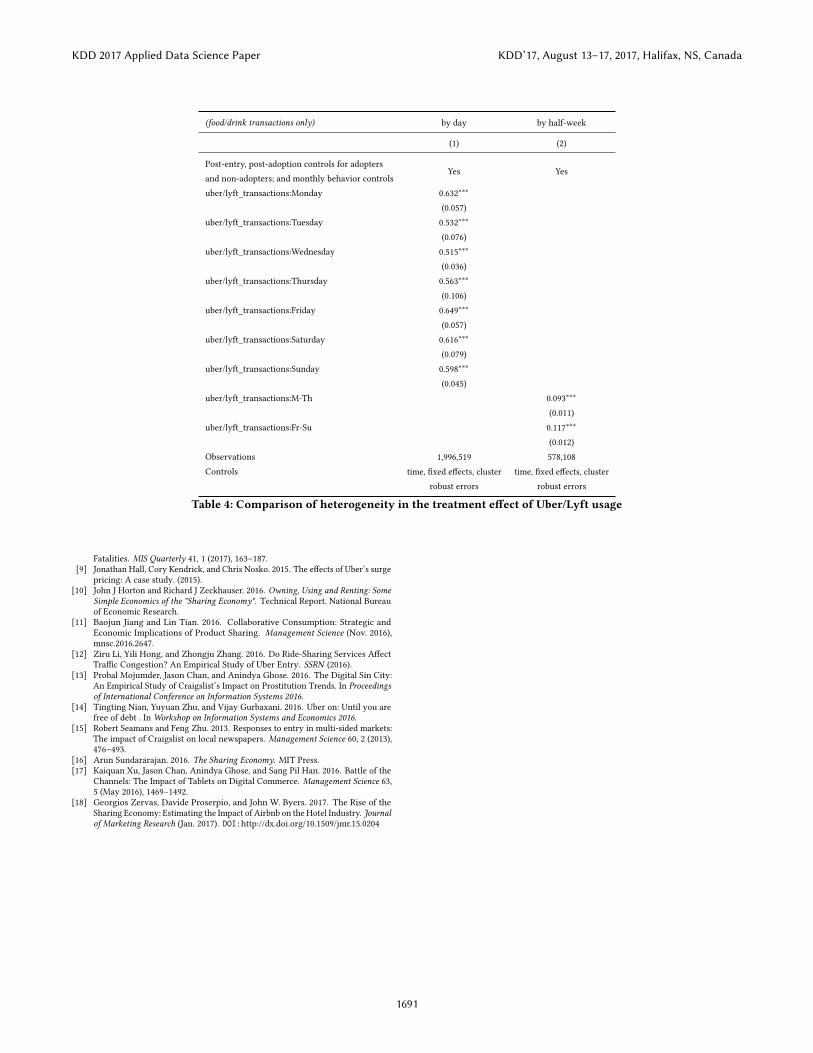
Lastly, in Table 4, we present some initial analysis on temporalheterogeneity in the impact of Uber/Lyft entry. We identify a largerpositive association between Uber/Lyft transactions and food/drinktransactions on Fridays, Saturdays, Sundays, and Mondays (perhaps
KDD 2017 Applied Data Science Paper KDD’17, August 13–17, 2017, Halifax, NS, Canada
1689
(food/drink transactions only) by day by half-week by week by month by month(metro area A)
(1) (2) (3) (4) (4)
post_entry −0.015∗
(0.009)−0.005(0.006)
−0.018(0.012)
−0.024(0.026)
post_entry_for_adopter 0.014∗∗
(0.005)0.014∗∗∗
(0.004)0.026∗∗∗
(0.007)0.064∗∗∗
(0.018)0.046∗∗∗
(0.012)uber/lyft_transactions 0.594∗∗∗
(0.052)0.108∗∗∗
(0.010)0.070∗∗∗
(0.008)0.010(0.007)
0.023∗∗∗
(0.004)uber/lyft_spending 0.003
(0.002)0.001∗∗∗
(0.003)0.001∗∗∗
(0.0003)0.001
(0.001)-0.0002(0.0003)
post_adoption 0.008∗∗
(0.003)0.006∗∗
(0.003)0.013∗∗
(0.005)0.025(0.017)
0.005(0.013)
post_adoption_for_adopter −0.019∗∗∗
(0.006)−0.022∗∗∗
(0.023)−0.039∗∗
(0.007)−0.076∗∗∗
(0.016)−0.065∗∗∗
(0.016)Monthly spending behavior controls Yes Yes Yes Yes Yes
Observations 1,996,519 578,108 292,891 67,787 39,962Time Dummies speci�c day speci�c half-week speci�c week speci�c month speci�c monthFixed E�ects city, account city, account city, account city, account city, accountClustered Errors city-level city-level city-level city-level none
Table 3: Comparison of heterogeneity in the relationship of Uber/Lyft usage and consumption totals, using various time ag-gregation windows.
when some Sunday transactions enter the data). Intuitively, this pro-vides additional evidence consistent with our proposed mechanismthat the availability of Uber/Lyft and lowered transportation fric-tions will have a stronger in�uence on leisure activities. Similarly,when we group the data by half-week (where a week is split into M-Th and F-Su), we the similar stronger association on weekends. Werecognize that the magnitude of these numbers are over-estimatedthough, because daily aggregation is much more in�uenced by tem-poral variability in consumption — instead, the takeaway shouldbe to note that there seem to be temporal di�erences in associationof Uber/Lyft transactions and food/drink transactions.
5 CONCLUSION & FUTUREWORKIn this paper, we utilize a novel dataset to present a quasi-experimentalexamination of how the emerging growth of peer-to-peer car shar-ing services may have a�ected local consumer mobility and con-sumption patterns. This is a relevant policy and management ques-tion for cities. From the analysis, we identify, for the post-Uber/Lyft-entry period, �rst, an associated increase in the frequency and totalamount spent on local food/drink businesses from Uber/Lyft entryand particularly from Uber/Lyft usage intensity, but no notableincrease in the amount spent per food/drink transaction. More di-rectly, consistent with our hypothesized mechanism of reducedlocal consumption frictions, if we consider the usage of these P2Ptransportation platforms, we see that this is what drives the ob-served association, moreso than the adoption or entry. This researchprovides additional empirical evidence of the impact of recent andpotential future change in urban transportation for city o�cials.
For future work, we plan to investigate the heterogeneity in theimpact of Uber/Lyft more closely amongst demographics, weather
patterns, spatially, and temporally. We plan to identify �ne-grainedgeo-locations of merchants, enabling a closer investigation intohow Uber/Lyft may have shifted spatial movements, and incorpo-rate other sources of �nancial data. To demonstrate the robustnessof our proposed mechanism, we plan to analyze other categoriesof spending, either of interest, such as other modes of transporta-tion, or online-related categories for falsi�cation tests. We planto zoom in a few metropolitan areas of interest to more closelyassess how consumption patterns may have shifted. While our pre-sented results are robust to various time windows and alternativeassumptions for the regression function (e.g. Poisson), we plan todemonstrate robustness across various subsamples of the data, re-gression speci�cations (e.g. relative time periods, as used by [8]),and propensity matching techniques.
REFERENCES[1] Vibhanshu Abhishek, Jose A Guajardo, and Zhe Zhang. 2016. Business Models
in the Sharing Economy: Manufacturing Durable Goods in the Presence of Peer-To-Peer Rental Markets. SSRN (Jan. 2016).
[2] Gordon Burtch, Seth Carnahan, and Brad N Greenwood. 2016. Can You Gig it?An Empirical Examination of the Gig-Economy and Entrepreneurial Activity.SSRN (March 2016).
[3] Jason Chan and Anindya Ghose. 2014. Internet’s Dirty Secret: Assessing theImpact of Online Intermediaries on HIV Transmission. MIS Quarterly 38, 4 (Dec.2014), 955–A3.
[4] Liran Einav, Chiara Farronato, and Jonathan Levin. 2016. Peer-to-Peer Markets.Annual Review of Economics 8, 1 (Oct. 2016), 615–635.
[5] Chiara Farronato and Andrey Fradkin. 2016. Market Structure with the Entry ofPeer-to-Peer Platforms: The Case of Hotels and Airbnb. Working Paper (2016).
[6] Chris Forman, Avi Goldfarb, and Shane Greenstein. 2012. The Internet and localwages: A puzzle. The American Economic Review 102, 1 (2012), 556–575.
[7] Samuel P Fraiberger and Arun Sundararajan. 2015. Peer-to-Peer Rental Marketsin the Sharing Economy. NYU Stern School of Business Research Paper (2015).
[8] Brad N Greenwood and Sunil Wattal. 2017. Show Me the Way to Go Home:An Empirical Investigation of Ride-Sharing and Alcohol Related Motor Vehicle
KDD 2017 Applied Data Science Paper KDD’17, August 13–17, 2017, Halifax, NS, Canada
1690
(food/drink transactions only) by day by half-week
(1) (2)
Post-entry, post-adoption controls for adoptersand non-adopters; and monthly behavior controls
Yes Yes
uber/lyft_transactions:Monday 0.632∗∗∗
(0.057)uber/lyft_transactions:Tuesday 0.532∗∗∗
(0.076)uber/lyft_transactions:Wednesday 0.515∗∗∗
(0.036)uber/lyft_transactions:Thursday 0.563∗∗∗
(0.106)uber/lyft_transactions:Friday 0.649∗∗∗
(0.057)uber/lyft_transactions:Saturday 0.616∗∗∗
(0.079)uber/lyft_transactions:Sunday 0.598∗∗∗
(0.045)uber/lyft_transactions:M-Th 0.093∗∗∗
(0.011)uber/lyft_transactions:Fr-Su 0.117∗∗∗
(0.012)Observations 1,996,519 578,108Controls time, �xed e�ects, cluster
robust errorstime, �xed e�ects, cluster
robust errors
Table 4: Comparison of heterogeneity in the treatment e�ect of Uber/Lyft usage
Fatalities. MIS Quarterly 41, 1 (2017), 163–187.[9] Jonathan Hall, Cory Kendrick, and Chris Nosko. 2015. The e�ects of Uber’s surge
pricing: A case study. (2015).[10] John J Horton and Richard J Zeckhauser. 2016. Owning, Using and Renting: Some
Simple Economics of the "Sharing Economy". Technical Report. National Bureauof Economic Research.
[11] Baojun Jiang and Lin Tian. 2016. Collaborative Consumption: Strategic andEconomic Implications of Product Sharing. Management Science (Nov. 2016),mnsc.2016.2647.
[12] Ziru Li, Yili Hong, and Zhongju Zhang. 2016. Do Ride-Sharing Services A�ectTra�c Congestion? An Empirical Study of Uber Entry. SSRN (2016).
[13] Probal Mojumder, Jason Chan, and Anindya Ghose. 2016. The Digital Sin City:An Empirical Study of Craigslist’s Impact on Prostitution Trends. In Proceedingsof International Conference on Information Systems 2016.
[14] Tingting Nian, Yuyuan Zhu, and Vijay Gurbaxani. 2016. Uber on: Until you arefree of debt . In Workshop on Information Systems and Economics 2016.
[15] Robert Seamans and Feng Zhu. 2013. Responses to entry in multi-sided markets:The impact of Craigslist on local newspapers. Management Science 60, 2 (2013),476–493.
[16] Arun Sundararajan. 2016. The Sharing Economy. MIT Press.[17] Kaiquan Xu, Jason Chan, Anindya Ghose, and Sang Pil Han. 2016. Battle of the
Channels: The Impact of Tablets on Digital Commerce. Management Science 63,5 (May 2016), 1469–1492.
[18] Georgios Zervas, Davide Proserpio, and John W. Byers. 2017. The Rise of theSharing Economy: Estimating the Impact of Airbnb on the Hotel Industry. Journalof Marketing Research (Jan. 2017). DOI:http://dx.doi.org/10.1509/jmr.15.0204
KDD 2017 Applied Data Science Paper KDD’17, August 13–17, 2017, Halifax, NS, Canada
1691