Embed Size (px)
Citation preview

Contemporary Engineering Sciences, Vol. 7, 2014, no. 1, 19 - 37
HIKARI Ltd, www.m-hikari.com
http://dx.doi.org/10.12988/ces.2014.3951
A Quasi-dimensional Three-zone Combustion
Model of the Diesel Engine to Calculate
Performances and Emission Using
the Diesel-Ethanol Dual Fuel
Paramust Juntarakod
Department of Mechanical and Aerospace Engineering
King Mongkut’s University of Technology North Bangkok
1518 Pracharat 1 Road, Wongsawang, Bangsue, Bangkok 10800, Thailand [email protected]
Thanakom Soontornchainacksaeng
Energy Management Systems and Monitoring & Verification Control,
Research & Development Center Science and Technology Research Institute
Department of Mechanical and Aerospace Engineering
King Mongkut’s University of Technology North Bangkok
1518 Pracharat 1 Road, Wongsawang, Bangsue, Bangkok 10800, Thailand [email protected]
Copyright © 2013 Paramust Juntarakod and Thanakom Soontornchainacksaeng. This is an
open access article distributed under the Creative Commons Attribution License, which permits
unrestricted use, distribution, and reproduction in any medium, provided the original work is
properly cited.
Abstract
In the present study, develop the multi zone thermodynamic model for the
simulation of a small diesel engine operating on the mixture of diesel and ethanol
and comparing results with an experiment. This paper discussed analytically and
provides data of nitrogen oxide and performance parameters such as power, speci-
20 Paramust Juntarakod and Thanakom Soontornchainacksaeng
fic fuel consumption and thermal efficiency, indicated mean effective pressure.
For this purpose, quasi-dimensional phenomenological three zone combustion
process (unburned, adiabatic core region and boundary layer gas) has been
modeled based on equilibrium constants method with MATLAB program to
calculate the mole fractions of 11 combustion products when the new equilibrium
constants function developed by Gill which are lowly-highly temperature
dependent. To compute diesel engine cycles, zero-dimensional compression and
expansion model have given by Ferguson and developed with new assumptions.
These results involve various combination sequence effects of compression ratio
(23-25), equivalence ratio (0.8-0.9), burn duration angle (60-70 CA) and engine
speed (1000-1500 rpm) which volume fraction of fuel compositions (10-30%
ethanol) (Diesel-Ethanol blend).
The results of the study as the power was calculated by this method are the error
range within around 5% or 0.5 kW from the maximum experiment results. The
specific fuel consumption was less than 5% or 15-20 g (Fuel)/kW-hr from
experiment results. The resulted show that nitrogen oxide has changed very little,
corresponding results of various sequence effects. The performance parameters
were changed with varying engine computing conditions. Maximum performance
parameters be raised by increases the engine speed and equivalence ratio, its can
increase the thermal efficiency are approximately value 15-20%.
Keywords: Newton-Raphson iteration; Nitrogen Oxide; Engine Performances;
Three zone Combustion modeling; Burned; Unburned Adiabatic core region
Boundary layer gas
1 Introduction
Three zone thermodynamic model by numerical method which employed three
zones for the combustion process: (1) unburned, (2) adiabatic core region, and (3)
boundary-layer gas of a internal combustion engine has been studied and since
published automotive engineering work by Caton [1], Sahin [2] and Kodavasal [3]
with validated experiment. They documented which have demonstrated the use of
novel combustion techniques the new methodology as two zone combustion to
achieve low nitric oxide emissions with concurrent high thermal efficiencies. It
has attracted great attention due to its superior potential applications, resulting in a
reduction in the time scales and costs of the design process experiment or
commercial program. For examples in this methodology of two zone
thermodynamic model by numerical method and compare with experiments.
Hanson et al. [4] provided results from a heavy-duty, direct-injection
compression-ignition engine using gasoline with various injection strategies.
Their work centered on 1300 rpm operation at two different loads: IMEP of 11.5
and 6.5 bar. Using 41% and 30% EGR, for the high and moderate loads,
respectively, they reported low emissions with about 50% net indicated thermal
efficiency.

Quasi-dimensional three-zone combustion model of the Diesel engine 21
Kokjohn et al. [5] applied the work of Hanson et al. [4], but using both a
dual-fueled diesel engine and pre-mixed charge compression ignition concept to
comparing, resulted in a net indicated thermal efficiency of 50%. In document, he
used in-cylinder blends of gasoline and diesel to extend the range of operation of
the diesel engine type combustion. They were able to better match the desired
ignition and combustion properties to specific (but changing) fuel blends. They
demonstrated successful operation for several operating conditions. One such case
was a 1300 rpm, 11 bar imepnet condition, that resulted in negligible emissions and
a 50% net indicated thermal efficiency. This was achieved using an overall lean
mixture (u = 0.77), a high level of EGR (45.5%) and an inlet pressure of 200 kPa.
Combustion was stable and repeatable.
Wilhelmsson et al. [6] presented work that was based on the diesel engine with
supercharging using the mixture of natural gas and n-heptane. Although they
stated that natural gas appeared to be an ill-suited fuel for pure diesel engine
operation, they were able to adopt an operating strategy to minimize emissions
while attaining a relatively high efficiency. They reported net indicated thermal
efficiencies of 45% and 50% for two cases.
In recent paper, the study of two zone thermodynamic model by numerical
method of a diesel engine has more focused on equilibrium constants functions
were developed by Gill [7] which are lowly-highly temperature dependent,
because of a new time specific energy polynomial temperature-pressure function
than the old time function of JANAF [8] and CHEMKIN [9] for solving nonlinear
equations. In this study, the derivations of governing equations for the reaction
combustion equations were performed by assuming 11 combustion products. A
system of 11 nonlinear equations appears in the derivation of the reaction
combustion equations and it can be solved using Newton–Raphson methods prior
to its implementation into MATLAB program [10]. The first example of the new
method was presented by Paramust [11]. Since then, other three zone
thermodynamic model by numerical method have been reported Buttsworth [12],
Ramachandran [13], Adnan [14] and Mohammad [15] but with equilibrium
constants functions specific energy polynomial temperature function from JANAF
as different form this in this methodology.
Now a day, some methods have been proposed for three zone thermodynamic
model of the combustion systems such as, for examples, a combustion chamber of
gasoline engine combustor of gas turbine and premixed combustion flame and
alternative fuel combustion. When the parameters of the combustion equation are
uncertain or unknown, adaptive equilibrium constants can be solved using
numerical techniques as following Ramachandran [13], Adnan [14] and
Mohammad [15].
The thermodynamic model which employed three zones for the combustion
process at this present is a three-zone thermodynamic [1 and 2] and developments
have included the effect of compression ratio ( r ), equivalence ratio ( ),burn
duration angle (b ), pressure intake ratio (
0/inP P ), engine speed (rpm) and volume
fraction of two fuels ( /p sV V ). The design that provides the most effective

22 Paramust Juntarakod and Thanakom Soontornchainacksaeng
operation is not yet known, but these types of features are clearly important. The
most important assumptions were that,
1) The working medium was considered a mixture of 11 species.
2) All 11 species were considered as ideal gas of combustion products.
3) The mixture fuels are limited to C H O Na b g d species.
The study described in this paper provides the emission that is nitric oxide and
performance parameters of a small diesel engine such as power, specific fuel
consumption, furthermore also be considered, thermal efficiency and indicated
mean effective pressure operating on diesel and ethanol. Results were compared
with an experiment Tanakom [16] and [17].
2 Modeling and Analysis
2.1 A Three-zone, Zero-dimensional model
The following is the derivative version of the equations modified based on
Kreiger [18] which using for determination of three-zone of unburned, burned
(adiabatic core region) and boundary-layer gas to analyze the rate of temperature,
pressure and mass transfer based on equally pressure of a diesel engine. Consider
the schematic of an engine cylinder while combustion products are occurring in
combustion stroke as in Fig. 1.
Assumptions: Pressure (P) in the burned and unburned zones is equal, u bP P
bQ
uQ
m
, ,
, ,
U n b u rn e d
u u
u u u
P V m
R T u
, ,
, ,
B u rn e d
b b
b b b
P V m
R T u
u bP d V V d W
B o u n d a ry L a ye r G a s
B o u n a ry
Q
Figure 1 : Burned, unburned and boundary-layer gas based on constant pressure
The method is assumed that the fuel-air is supplied from a perfect system (port
injection of fuel or induction) and mixed completely. No chemical reactions take
place in the unburned zone (zone is said to be frozen)
Quasi-dimensional three-zone combustion model of the Diesel engine 23
0, 0u u u u u u ux x M R M R u
T P T T P P P
The total cylinder volume and mass is taken up by the burned and unburned
volumes and masses only, Determining is defined from Amagat’s law [20].
,b u b uV V V m m m . It can write 1 2 1 2,u u b bm m m m m m .
This leads to u bm m .
2.2 The thermodynamic model
The mathematical engine model was applicable in detail mass and energy balance
for four stroke diesel engine and is based on three zone thermodynamic analysis
of the ideal fuel-air cycle. The method is assumed that the fuel-air is supplied
from a perfect system and mixed completely. Mass balance, the equation of state
for an ideal gas is,
PV mRT (1)
The rate of change of mass within any open system is the net flux of mass across
the system boundaries. Hence for a control volume enclosing the air-fuel mixture,
we have,
i
i
m m (2)
From the first law of thermodynamics,
i i
i
E Q W m H (3)
Taking the derivative of Eq. 2 and 3 as the function of the crank angle q yields as,
i
i
dmdm
d dq q (4)
( ) ii
i
dmd mu dQ dWh
d d d dq q q q (5)
2.3 Thermodynamic properties
The specific heat change as the function of the crank angle in eq. (2) and eq. (5),
those indicate the enthalpy change with respect to temperature and pressure,
which was obtained from curve fitted polynomial equation. Table 1 shows the
thermodynamics properties expressed as a function of crank angle, pressure and
temperature. Where, Lewis [20] has represented the thermodynamic properties of
fuels and air Ferguson [21] and Heywood [22] proposed the thermodynamic
properties of air and combustion products by the form of coefficient 1 2 3 5, , ...a a a a .

24 Paramust Juntarakod and Thanakom Soontornchainacksaeng
3 Methodologies for Analysis
3.1 The Mathematical model of a cylinder engine
In the combustion stroke, we consider the temperature in the term of burned
mixture ( bT ) and unburned ( uT ) as separate open systems. Recalling eq.(5) and
combining all the derivatives of thermodynamic properties will enable the
pressure and temperature to be expressed as a function of crank angle, pressure,
unburned gas temperature and burned gas temperature.
Table 1. The thermodynamic properties.
Air and Combustion products
2 3 41 2 3 4 5
2 3 43 5 62 41
02 3 43 54
1 1 7
ln2 3 4 5
ln3 4 4
Pca a T a T a T a T
R
a a aa aha T T T T T
RT T
a aasa T a T T T T a
R
Fuels
20 0 0
20 0 00
020
0 0 0
2 3
ln2
Pca b T c T
R
b c dha T T
RT T
csa T b T T e
R Internal energy, Volume, Entropy, Enthalpy
ln ln ln,
ln ln lnP P
P
du Pv v dT v v dP hc v C
d T T d T P d Tq q q
ln ln ln,
ln ln ln
PCdv v v dT v v dP ds dT v v dP
d T T d P P d d T d T T dq q q q q q
1, , , ( , , , )b ub u
dT dTdP dWf L P T T
d d d dq q q q (6)
Modified algorithm from Ferguson [21] as following the arbitrary heat release
conditions and solving the above equations with appropriate input data enable
determination of the indicated work, enthalpy and heat loss throughout the
system. Those can be expressed as a function of pressure and temperature.
dP A B C
d D Eq (7)
21/ 2
Pb Pb
2
Pb
4
2 ln
v c c ln
c v
b W
b b b
b
u b
b Vh x T T
bdT v v dP
d m x T d
h h dx Cx x
x d
p
q q
q
(8)

Quasi-dimensional three-zone combustion model of the Diesel engine 25
21/ 2
Pb Pu
41
2 ln
v c 1 c ln
u W
u u u
u
b Vh x T T
bdT v v dP
d m x T d
p
q q (9)
From the derivatives of eq. (7–9) let us defined the constant term with respect to the
combination of the thermodynamic properties equations are,
1( )
v
dV VCA
m dq (10)
1/ 2
Pb
1/ 2
Pu
ln( ) c lnv
lnv1
c ln
b b b u
b b
u u b u
u b
v v T TdV VC xT TdB h
v v T Tmx
T T
q (11)
2
Pb
ln ( )
ln c v
b u bb u b
b b
v h hdx dx x x CC v v v
d T T dq q (12)
22
Pb
ln ln
c ln ln
b b b b
b b
v v v vD x
T T P P (13)
22
Pu
ln ln1
c ln ln
u u u u
u u
v v v vE x
T T P P (14)
3.2 Chemical equilibrium with the fuel mixture
The basis of the equilibrium combustion products with fuel mixture model
α β γ δC H O N is a solution to the atom balance equations from the chemical reaction
equation of fuel and air forming and the subscript 1 and 2 represent the one of the
Diesel and Ethanol respectively as shown in Table 2.
Table 2. The diesel and ethanol mixture fuel [20, 21]
Name Structure Atom Fuel-Air Ratio (Stoich)
Diesel 14.4 24.9C H 1 1=14.4, =24.9a b 14.3
Ethanol 2 6C H O 2 2 2=2, =6, 1a b g 8.94
This mixture equation is given in Eq.15 for the condition of equivalence ratio f ,
where 1n through 11n are mole fractions of the product species, e is the molar
fuel-air ratio required to react with one mole of air. This process based on the
work of modified [21, 22] as given below,

26 Paramust Juntarakod and Thanakom Soontornchainacksaeng
1 α1 β1 γ1 δ1 1 2 2 2 3 2
1 2 α2 β2 γ2 δ2 4 2 5 6 2
2 7 8
2 9 10 11
(1 )C H O N CO H O N
( ) C H O N O CO H
0.21O H O
0.79N OH NO Nv
ef c n n n
ef c c n n n
n n
n n
(15)
Where, 1x is the molar ratio of multi-fuel having the condition, 10 1x . 2x
are the fuel in the second and third which having the condition, 1 2 1x x .
There is the conservation of 4 atoms, C,H,O and N from mixture equation, so
atom balancing can be written,
1 1 2 1 5C (1 ) 1 α2 ( ) y y N (16)
1 1 2 2 6 7 9H (1 ) 1 2 (2 2 )y y y y N (17)
1 1 2 1 2 4 5
8 9 10
O (1 ) 1 2+0.42 (2 2
)
y y y y
y y y N
(18)
1 1 2 3 10 11N (1 ) 1 2 1.58 (2 )y y y N (19)
Where, N is the total number of moles and y is the mole fraction. Thus, the total
number of mole fraction must be equal to one and this gives,
11
11 0ii
y
(20)
The expression for atom balance of each equation can be eliminated by dividing
(eq. 17-19) by eq. 16. The equation can be written as next equation.
2 6 7 9 1 1 52 2 ( ) 0y y y y d y y (21)
1 2 4 5 8 9 10 2 1 52 2 ( ) 0y y y y y y y d y y (22)
2 10 11 3 1 52 ( ) 0y y y d y y (23)
where
1 1 2 1 1 2
1 1 2
1 2 3
1 1 2 1 1 2 1 1 2
0.42 1.58(1 ) 1 2+ (1 ) 1 2
(1 ) 1 2, ,
(1 ) 1 α2 (1 ) 1 α2 (1 ) 1 α2d d d
Eq. (20-23) have 11 unknowns ( 1 2 3 11, , ....y y y y ), therefore in order to solve for
these 11 unknowns other 7 more equations are needed which may be derived from
the consideration of equilibrium among products. The equilibrium constant can be
related to the partial pressure of the reactants and products. And the partial
pressure of a component is defined relative to the total pressure and the mole
faction, thus the equilibrium constant can be rewritten as Table 3.
The equilibrium constant in Table 3, 1K through 7K are curve fitted form Gill
[7] and their expressions are of the from,

Quasi-dimensional three-zone combustion model of the Diesel engine 27
2 3 4
2 3 4 5 61 7exp ln 1
2 6 12 20P
a T a T a T a T aK a T a
T
(24)
Through algebraic manipulations, the ten equations can be reduced into four
equations with four unknowns. The equations are nonlinear and solved by using
the Newton-Raphson method [10]. Each of these may be expanded in Taylor’s
series 3 4 5 6( , , , ) 0jf y y y y , where 1,2,3,4j (neglecting the second order
and higher order) as,
3 4 5 63 4 5 6
0j j j j
j
f f f ff y y y y
y y y y (25)
Table 3. Dissociation of mole fraction of Equilibrium Constant Method (ECM).
1/ 2 1/ 2 1/ 22 1/ 25 4
1 1 1 5 4 1
2 1 1
, where CO O
CO
P P y y P PK y c y y c
P y K
1/ 2 1/ 22 22 2 2 4 6 2 21/ 2 1/ 2
4 62 2
, where H O
H O
P yK y c y y c K P
y y PP P
1/ 2 1/ 293 9 3 4 6 3 31/ 2 1/ 2
4 62 2
, where OH
H O
P yK y c y y c K
y yP P
1/ 21/ 27 4
4 7 4 6 41/ 2 1/ 2
62
, where H
H
y PP KK y c y c
y PP
1/ 21/ 28 5
5 8 5 4 51/ 2 1/ 2
42
, where O
O
P y P KK y c y c
y PP
1/ 21/ 2 611
6 11 6 3 61/ 2 1/ 2
32
, where N
N
P Ky PK y c y c
y PP
1/ 2 1/ 2107 10 7 4 3 7 71/ 2 1/ 2
4 32 2
, where NO
O N
P yK y c y y c K
y yP P
Functions jf are evaluated from the solution of interested functions (eq.20-23)
the independent set of derivatives is obtained by solution of matrix equation that
results from differentiating with respect to mole faction. The above can be
arranged as set of linear equations in the matrix form,
[ ] [ ] 0i
i
fy f
y
(26)
This set of linear equations can then be solved for 3 4 5 6, , ,y y y y and iterative
procedures undertaken until the corrections are less than a specified tolerance ( ).
28 Paramust Juntarakod and Thanakom Soontornchainacksaeng
For convenience, defining following partial derivatives and defining the constant
values for a simple studied and the Jacobian of solution are given as Table 4.
Eq.26 may be solved using by Gauss elimination. The second approximation is
then 1
3, 4,5,6k k k
y y y . The process of forming the Jacobian, solving
Eq.24 and calculating new values for y is repeated until a stop criterion is met,
results in the molar concentrations of the 11 product species[11].
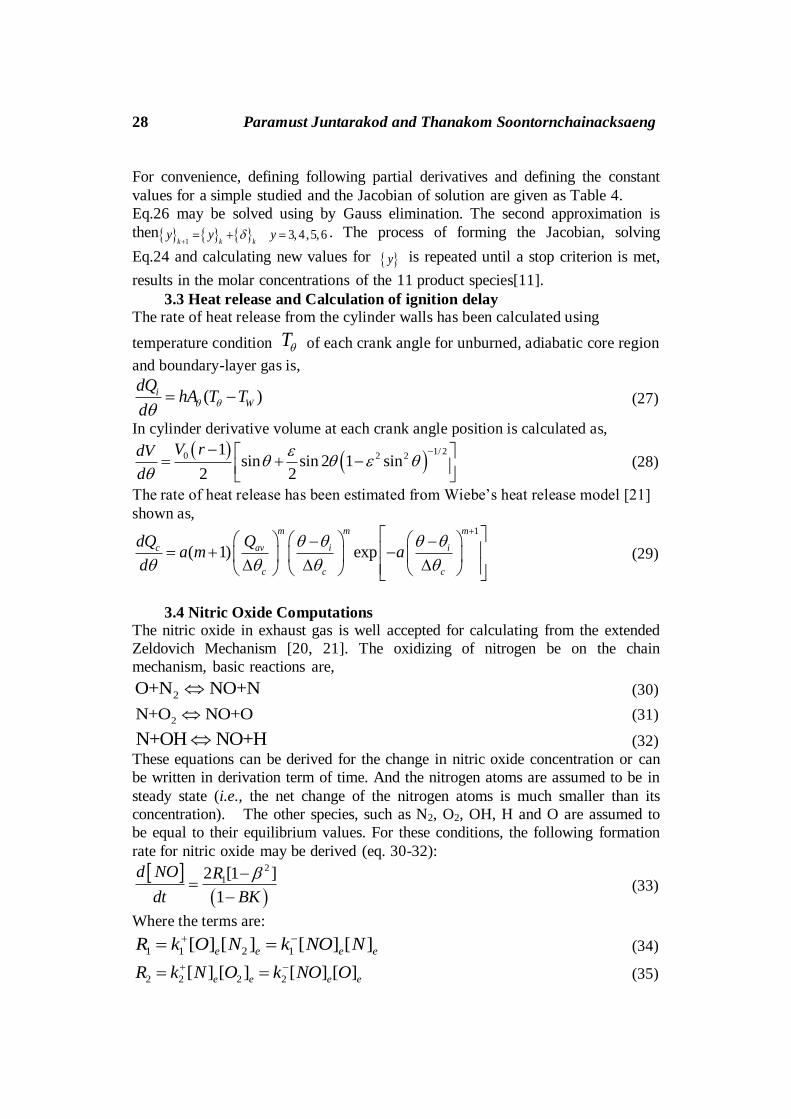
3.3 Heat release and Calculation of ignition delay
The rate of heat release from the cylinder walls has been calculated using
temperature condition T of each crank angle for unburned, adiabatic core region
and boundary-layer gas is,
( )iW
dQhA T T
d
(27)
In cylinder derivative volume at each crank angle position is calculated as,
1/ 20 2 2
1sin sin 2 1 sin
2 2
V rdV
d
(28)
The rate of heat release has been estimated from Wiebe’s heat release model [21]
shown as, 1
( 1) exp
m m m
c av i i
c c c
dQ Qa m a
d
(29)
3.4 Nitric Oxide Computations
The nitric oxide in exhaust gas is well accepted for calculating from the extended
Zeldovich Mechanism [20, 21]. The oxidizing of nitrogen be on the chain
mechanism, basic reactions are,
2O+N NO+N (30)
2N+O NO+O (31)
N+OH NO+H (32)
These equations can be derived for the change in nitric oxide concentration or can
be written in derivation term of time. And the nitrogen atoms are assumed to be in
steady state (i.e., the net change of the nitrogen atoms is much smaller than its
concentration). The other species, such as N2, O2, OH, H and O are assumed to
be equal to their equilibrium values. For these conditions, the following formation
rate for nitric oxide may be derived (eq. 30-32):
2
12 [1 ]
1
d NO R
dt BK
(33)
Where the terms are:
1 1 2 1[ ] [ ] [ ] [ ]e e e eR k O N k NO N (34)
2 2 2 2[ ] [ ] [ ] [ ]e e e eR k N O k NO O (35)

Quasi-dimensional three-zone combustion model of the Diesel engine 29
3 3 3[ ] [ ] [ ] [ ]e e e eR k N OH k NO H (36)
a
e
NO
NO ,
1
2 3
RK
R R
[NO]a is the actual nitric oxide concentration and [NO]e is the equilibrium
concentration for species.
3.5 Engine Performances
A study of gases as models of internal combustion engines is useful for
qualitatively illustrating some of the important parameters influencing combustor
performances, that is, the work outputCVw from fuel-air cycle. In theoretical of
control volume, the combustor performances can be calculated by meaning of the
indicated values which the following definitions are done by the gas. That is
thermal efficiency, specific fuel consumption and the indicated mean effective
pressure.
Thermal Efficiency (%, neglected combustion loss)
0[1 (1 )]/ (1 )CV s sw F f F a f 37)
Specific fuel consumption
/f CVSEC m w (38)
The indicated mean effective pressure (bar)
[1 (1 )]/CV sIMEP w F f V (39)
Where, the stoichiometric fuel-air ratio by mass issF , residual fraction is f ,
available energy of fuel is ca (LHV), and V is the constant volume of a cylinder.
Table 4. Constant values and the jacobians of solution.
1/ 2
1 5 2 6 8 5 9 3 61 214 24 84 941/ 2 1/ 2 1/ 2 1/ 2
4 4 4 4 4 4 4 4
1/ 2 1/ 2 7 9 31 2 415 1 4 26 2 4 76 961/ 2
5 6 6 6 6
1,2,7,8,9,10,11
3,4,5,6
1 1 1 1, ,
2 2 2 2
1 1, ,
2 2
iij
i
y iD
y j
c y c y y c y c yy yD D D D
y y y y y y y y
y y cy y cD c y D c y D D
y y y y y
1/ 2
4
1/ 2
6
1/ 2 1/ 2
10 7 4 10 7 3 611103 104 1131/ 2 1/ 2 1/ 2
3 3 4 4 3 3
1 1 1,
2 2 2
y
y
y c y y c y cyD D D
y y y y y y
4 Engine and operating conditions
The main engine specifications for numerical simulation are summarized in Table
5. The engine selected for this study is a small diesel single cylinder, cooling
system by radiation method, rated output 6.5 kW at 2400 rpm and configuration
with a bore and stroke of 90 and 94 mm, respectively. For the Wiebe combustion
parameters, the following values were used as recommended by Heywood [21], m
30 Paramust Juntarakod and Thanakom Soontornchainacksaeng
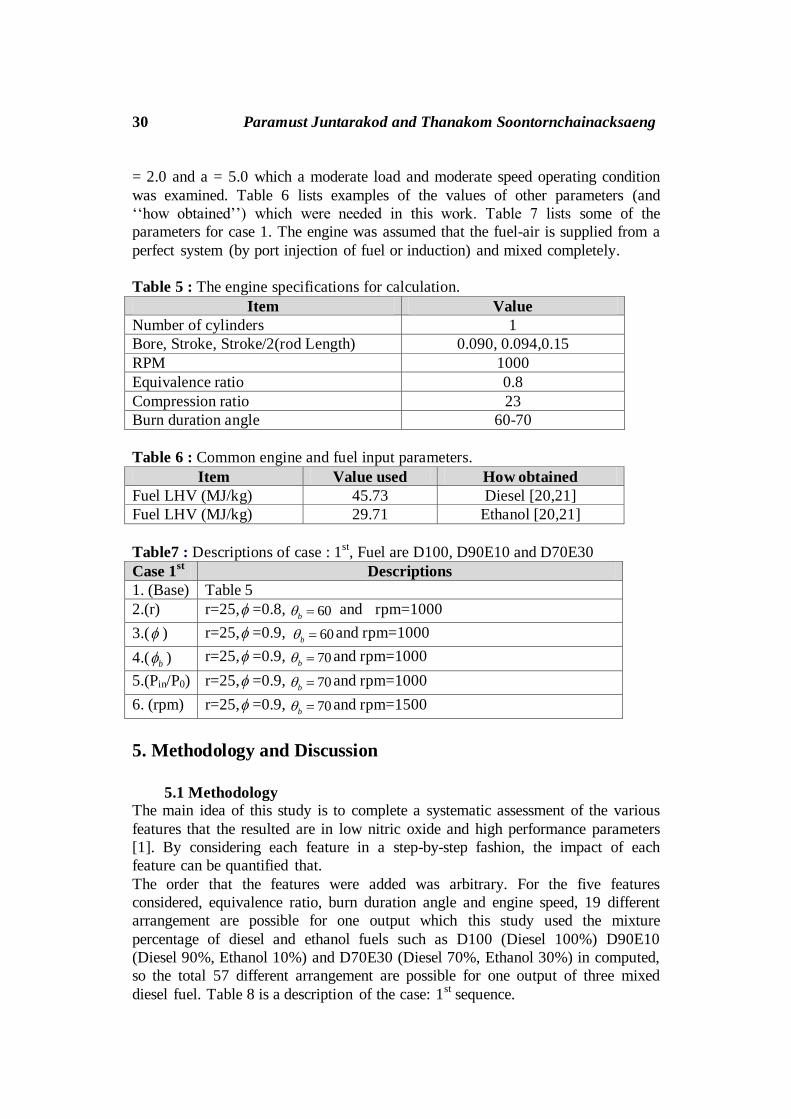
= 2.0 and a = 5.0 which a moderate load and moderate speed operating condition
was examined. Table 6 lists examples of the values of other parameters (and
‘‘how obtained’’) which were needed in this work. Table 7 lists some of the
parameters for case 1. The engine was assumed that the fuel-air is supplied from a
perfect system (by port injection of fuel or induction) and mixed completely.
Table 5 : The engine specifications for calculation.
Item Value
Number of cylinders 1
Bore, Stroke, Stroke/2(rod Length) 0.090, 0.094,0.15
RPM 1000
Equivalence ratio 0.8
Compression ratio 23
Burn duration angle 60-70
Table 6 : Common engine and fuel input parameters.
Item Value used How obtained
Fuel LHV (MJ/kg) 45.73 Diesel [20,21]
Fuel LHV (MJ/kg) 29.71 Ethanol [20,21]
Table7 : Descriptions of case : 1st, Fuel are D100, D90E10 and D70E30
Case 1st
Descriptions
1. (Base) Table 5
2.(r) r=25, =0.8, 60b and rpm=1000
3.( ) r=25, =0.9, 60b and rpm=1000
4.( b ) r=25, =0.9, 70b and rpm=1000
5.(Pin/P0) r=25, =0.9, 70b and rpm=1000
6. (rpm) r=25, =0.9, 70b and rpm=1500
5. Methodology and Discussion
5.1 Methodology
The main idea of this study is to complete a systematic assessment of the various
features that the resulted are in low nitric oxide and high performance parameters
[1]. By considering each feature in a step-by-step fashion, the impact of each
feature can be quantified that.
The order that the features were added was arbitrary. For the five features
considered, equivalence ratio, burn duration angle and engine speed, 19 different
arrangement are possible for one output which this study used the mixture
percentage of diesel and ethanol fuels such as D100 (Diesel 100%) D90E10
(Diesel 90%, Ethanol 10%) and D70E30 (Diesel 70%, Ethanol 30%) in computed,
so the total 57 different arrangement are possible for one output of three mixed
diesel fuel. Table 8 is a description of the case: 1st sequence.
Quasi-dimensional three-zone combustion model of the Diesel engine 31
The following results are based on a set of assumptions and approximations which
did not consider a few engine characteristics. For example, combustion stability,
cycle-to-cycle variations, or other combustion issues are not included. In addition,
knock or other abnormal combustion phenomena are not considered [1].
Some items are not known. For example, the burn duration angle ( )b will be a
function of a port direct-injection of fuel, air pressure induced and open-close
inlet valves and exhaust valves. For this work, a simple schedule was assumed the
60 CA. The burn duration angle was assumed equal to the greater of 60 CA or the
burn duration angle plus 10 CA for special cases. The sensitivity of this
assumption is examined below.
5.2 Discussion
The study discussed in this paper provides nitric oxide and performance
parameters of a small diesel engine such as power, specific fuel consumption,
furthermore also be considered, thermal efficiency and indicated mean effective
pressure operating on diesel and ethanol. By considering each feature in a
step-by-step fashion, the impact of each feature will be quantified of the fourth of
different sequences of the five features considered as in Table 8.
The resulting will be reported, and the reasons for the high performance will be
determined that. The fourth section describes the thermodynamic model results as,
1) Comparison of the thermodynamic model results with the experimental results.
2) Thermal efficiencies and indicated mean effective pressures.
3) Powers and specific energy consumption.
4) The thermodynamic model results of nitric oxide.
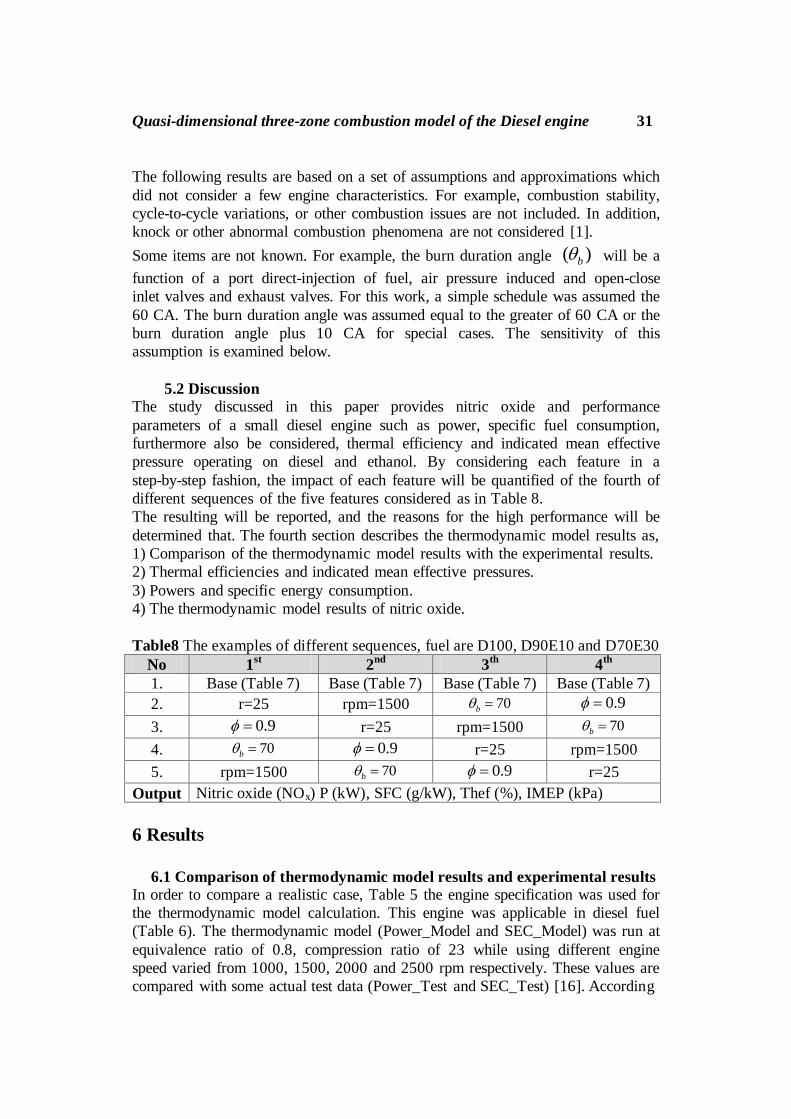
Table8 The examples of different sequences, fuel are D100, D90E10 and D70E30
No 1st 2
nd 3
th 4
th
1. Base (Table 7) Base (Table 7) Base (Table 7) Base (Table 7)
2. r=25 rpm=1500 70b 0.9
3. 0.9 r=25 rpm=1500 70b
4. 70b 0.9 r=25 rpm=1500
5. rpm=1500 70b 0.9 r=25
Output Nitric oxide (NOx) P (kW), SFC (g/kW), Thef (%), IMEP (kPa)
6 Results
6.1 Comparison of thermodynamic model results and experimental results
In order to compare a realistic case, Table 5 the engine specification was used for
the thermodynamic model calculation. This engine was applicable in diesel fuel
(Table 6). The thermodynamic model (Power_Model and SEC_Model) was run at
equivalence ratio of 0.8, compression ratio of 23 while using different engine
speed varied from 1000, 1500, 2000 and 2500 rpm respectively. These values are
compared with some actual test data (Power_Test and SEC_Test) [16]. According

32 Paramust Juntarakod and Thanakom Soontornchainacksaeng
to fig. 2, it can be seen that the relative power and SEC results change of engine
speed increases, which can be seen from the curves are almost the same of the
actual test (Consistent with actual test data from specification engine).
The results of the study as the power was calculated by the methods differ by
around 5% or 0.5 kW from the maximum experiment results. The specific fuel
consumption was less than 3% or 20 g(Fuel)/kW-hr from experiment results. The
results show that the thermodynamic model is consistent with the real test of both
models in each engine speed. So, the thermodynamic model can be applied to
predict the primary engine for use with other conditions, as shown in the
following 6.2 to 6.4.
Figure 2 : Comparison the power and SEC model with the experimental results[16]
6.2 Thermal efficiencies and Indicated mean effective pressures
Fig. 3 shows, thermal efficiencies and indicated mean effective pressures for this
operating condition for each case as described in Table 7 and Table 8.
The greatest thermal efficiency increases were achieved for the increase of burn
duration angel and engine speed and the decrease of equivalence ratio. But, the
increase of compression ratio affects resulted in a slight increase. In the case of
mixed fuel, the result is higher thermal efficiencies, greater than 10% every time
there is a change for the sequence. The maximum is 70% of thermal efficiency for
D70E30 (Diesel 70%, Ethanol 30%). And case 3th, the trend of resulted curve
raises thermal efficiency more than other case. Reasons for the increased oxygen
content in ethanol. Result in a more complete combustion thus increasing the
amount of ethanol that result in greater efficiency.
The greatest indicated mean effective pressures increases were achieved for the
increase of all case and sequences, but similar value of fuels. The maximum is
1800 kPa (18 bars) of indicated mean effective pressures. The condition of
resulted burn duration angel was the greater slope of the graph than other types.

Quasi-dimensional three-zone combustion model of the Diesel engine 33
6.3 Powers and Specific energy consumptions
Fig. 4 shows, powers and specific energy consumption for this operating
condition for each case as described in Table 7 and Table 8. The greatest thermal
efficiency increases were achieved for the increase of engine speed (rpm) and the
decrease of burn duration angel. But, the increase of compression ratio and
equivalence ratio affect resulted in a slight increase. Diesel fuel (D100) has a
higher power than others (D90E10 and D70E30). Power than any other fuel is
about 0.25 kW. The condition of round per minute (rpm) reported the greater
slope of the graph than other types. The maximum power is 3.6 kW of (D100) and
equal of cases. And case 2nd
, the trend of resulted curve raises power more than
other cases.
The greatest specific energy consumption was achieved for the increase of
equivalence ratio and equivalence ratio affect resulted in a slight increase. . Diesel
and ethanol blend (D70E30) has higher specific energy consumption than others
and diesel (D100) is the minimum value. . The maximum was 245 g/kW-hr of
diesel and ethanol blend (D70E30) in case 4th for increased equivalence ratio 0.8
to 0.9. Specific energy consumption, the difference is less than 10 g/kW-hr.
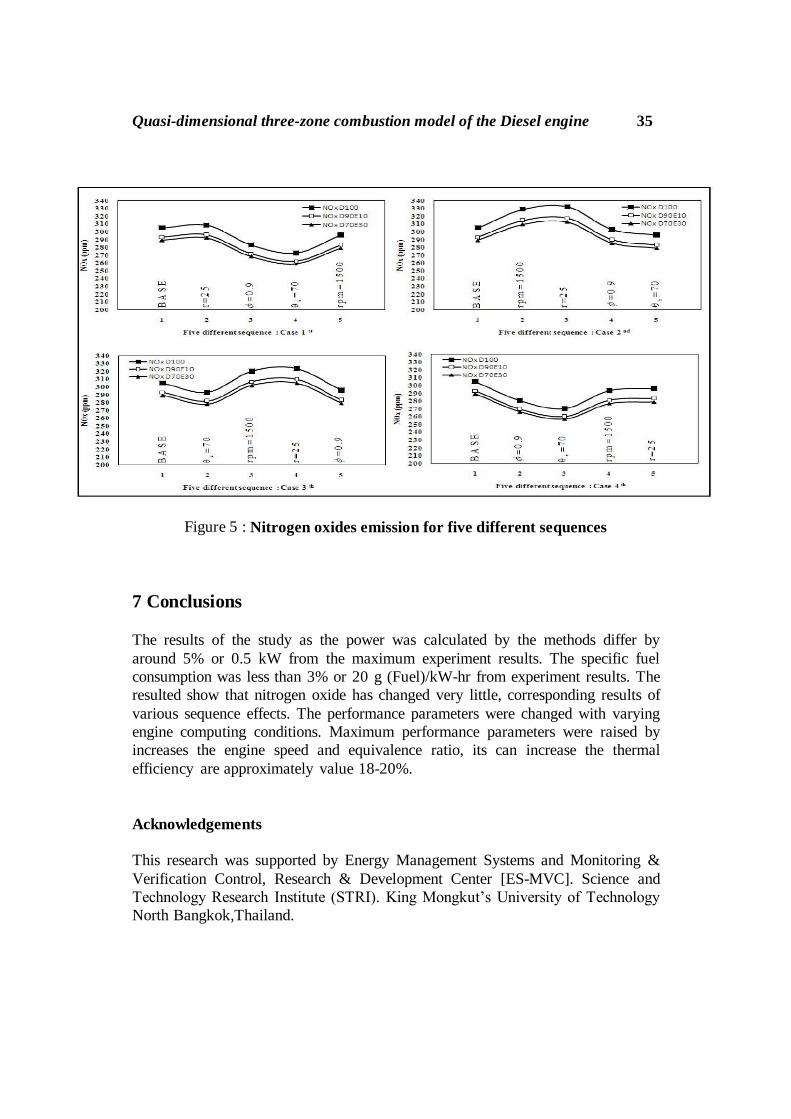
6.4 The thermodynamic model results of nitric oxide
The variations of computed NOX emissions and four different cases with five
difference sequences are shown in Fig. 5. It shows that NOX emission with
changed diesel and ethanol blend, NOX emission increases were achieved for the
increase of engine speed and compression, but, the decrease of equivalence ratio
and burn duration angle. The maximum is 330 ppm on case 2nd
on increase the
sequence of engine speed and compression ratio.

34 Paramust Juntarakod and Thanakom Soontornchainacksaeng
Figure 3: Thermal efficiencies and Indicated mean effective pressures
Figure 4 : Powers and Specific energy consumption for five different sequences
Quasi-dimensional three-zone combustion model of the Diesel engine 35
Figure 5 : Nitrogen oxides emission for five different sequences
7 Conclusions
The results of the study as the power was calculated by the methods differ by
around 5% or 0.5 kW from the maximum experiment results. The specific fuel
consumption was less than 3% or 20 g (Fuel)/kW-hr from experiment results. The
resulted show that nitrogen oxide has changed very little, corresponding results of
various sequence effects. The performance parameters were changed with varying
engine computing conditions. Maximum performance parameters were raised by
increases the engine speed and equivalence ratio, its can increase the thermal
efficiency are approximately value 18-20%.
Acknowledgements
This research was supported by Energy Management Systems and Monitoring &
Verification Control, Research & Development Center [ES-MVC]. Science and
Technology Research Institute (STRI). King Mongkut’s University of Technology
North Bangkok,Thailand.

36 Paramust Juntarakod and Thanakom Soontornchainacksaeng
References
[1] A. Caton. The thermodynamic characteristics of high efficiency,
internal-combustion engines. Energy Conversion and Management
58(2012), 84–93,
[2] Z. Sahin, O. Durgun, Multi-zone combustion modeling for the prediction of
diesel engine cycles and engine performance parameters, Applied Thermal
Engineering 28(2008), 2245–2256.
[3] J. Kodavasal, S. Keum, D. N. Assanis, A. Babajimopoulos, An Extended
Multi-Zone Combustion Model for PCI Simulation, International
Conference Multidimensional Engine Modeling User’s Group Meeting,
2011.
[4] R. Hanson, D. Splitter, R.R. Reitz, Operating a heavy-duty direct-injection
compression-ignition engine with gasoline for low emissions. Society of
Automotive Engineers, 2009-01-1442(2009).
[5] S.L. Kokjohn, R.M. Hanson, D.A. Splitter, R.D. Reitz,. Experiments and
modeling of dual-fuel HCCI and PCCI combustion using in-cylinder fuel
blending. Society of Automotive Engineers, 2009-01-2647(2009).
[6] C. Wilhelmsson, P. Tunestal, B. Johansson, Operation strategy of a dual fuel
HCCI engine with VGT, Society of Automotive Engineers,
2007-01-1855(2007).
[7] M. Grill, M. Chiodi, H. Berner, M. Bargende, Calculating the
Thermodynamic Properties of Burnt Gas and Vapor Fuel for User-Defined
Fuels, MTZ 05-2007(2007).
[8] JANAF, Thermochemical Tables, National Bureau of Standards
Publication,Washington NSRDS-NSBS37, DC, 1971.
[9] S. R. Turns, An Introduction to Combustion, Concepts and Applications.
McGraw- Hill, New York, 1996.
[10] S. C. Chapra. Applied Numerical Methods with MATLAB, International
edition. Singapore, McGraw-Hill, 2012.
[11] J, Paramust and S. Thanakom,. The Thermodynamic model of a Small Size
Single Cylinder Four Stroke Spark Ignition Engine using Gasoline RON
91 Thailand Fuel and Comparisons with Experiment. The 8th International
Conference on Automotive Engineering, 2012.
[12] D.R. Buttsworth, Spark Ignition Internal Combustion Engine Modeling using
Matlab, Faculty of Engineering & Surveying Technical Reports, University
of Southern Queensland, (2002).
[13] S. Ramachandran, Rapid Thermodynamic Simulation Model of an Internal
Combustion Engine on Alternate Fuels, Proceedings of the
International Multi Conference of Engineers and Computer Scientists, Vol
III, (2009).

Quasi-dimensional three-zone combustion model of the Diesel engine 37
[14] R. Adnan, H.H. Masjuki, T.M.I. Mahlia, Mathematical modeling on the
Effect of equivalence ratio in emission characteristics of compression
Ignition Engine with hydrogen substitution, Applied Mathematics
and Computation 217(2011), 6144–6158.
[15] M. Mohamed. E, Awad, A.M. Elseory, M.O.E. Faroug, Determining the
Thermodynamic Properties of Fuel Blends for Use with Air-Fuel Models of
IC Engines. International Conference on Trends in Industrial and
Mechanical Engineering, (2012).
[16] S, Thanakom, The Final Report, “Study on the Small Size Single Cylinder
Gasoline and Diesel Engines, Draft of Ministerial Regulation on
specification on Energy Efficiency with the Energy Conservation Promotion
Act (No.2) B.E. 2550 (2007)”. Department of Alternative Energy
Development and Efficiency (DEDE), Ministry of Energy, (2011).
[17] Test Rig Standard performance test Method of Small size air cooled
Gasoline-Diesel Engines for Land Use, JIS B 8017-1989, 1989.
[19] R. B. Krieger, and G. L. Borman, The Computation of Apparent Heat
Release for Internal Combustion Engines, America Society of Mechanical
Engineers, 66-WA/DGP-4(1966).
[20] G. N. Lewis and M. Randall, Thermodynamics, New York, McGraw-Hill,
1961.
[21] C. R. Ferguson, Internal Combustion Engines, Applied Thermo sciences.
New York, John Wiley and Sons, 1986.
[22] J. B. Heywood, Internal Combustion Engine Fundamentals, McGraw-Hill,
New York, 1988.
Received: September 11, 2013