Embed Size (px)
Citation preview
1 Copyright © 2012, Elsevier Inc. All rights reserved.
Chapter 6
Warehouse-Scale Computers
to Exploit Request-Level and
Data-Level Parallelism
Computer Architecture A Quantitative Approach, Fifth Edition
2
Contents
1. Cloud computing – basic conceptrs
2. Request-level parallelism and WSCs (Warehouse Scale
Computers).
3. Programming models – MapReduce
4. WSC architecture
5. Energy-proportional systems
6. Scientific applications and WSC
7. Cloud computing
Copyright © 2012, Elsevier Inc. All rights reserved.
3
Network-centric computing Information processing can be done more efficiently on large farms
of computing and storage systems accessible via the Internet.
Grid computing – initiated by the National Labs in the early
1990s; targeted primarily at scientific computing
Utility computing – initiated in 2005-2006 by IT companies
and targeted at enterprise computing.
The focus of utility computing is on the business model for providing
computing services; it often requires a cloud-like infrastructure.
Cloud computing is a path to utility computing embraced by major IT
companies including: Amazon, HP, IBM, Microsoft, Oracle, and
others.
DCM - CAED. September 2014 3
4
Network-centric content
Content: any type or volume of media, be it static or dynamic,
monolithic or modular, live or stored, produced by aggregation, or
mixed.
The “Future Internet” will be content-centric; the creation and
consumption of audio and visual content is likely to transform the
Internet to support increased quality in terms of resolution, frame rate,
color depth, stereoscopic information.
DCM - CAED. September 2014 4
5
Evolution of concepts and technologies The web and the semantic web - expected to support composition of
services. The web is dominated by unstructured or semi-structured
data, while the semantic web advocates inclusion of sematic content
in web pages.
The Grid - initiated in the early 1990s by National Laboratories and
Universities; used primarily for applications in the area of science
and engineering.
Peer-to-peer systems
Computer clouds
DCM - CAED. September 2014 5
6
Cloud computing
Uses Internet technologies to offer scalable and elastic services. The
term “elastic computing refers to the ability of dynamically acquiring
computing resources and supporting a variable workload.
The resources used for these services can be metered and the users
can be charged only for the resources they used.
The maintenance and security are ensured by service providers.
The service providers can operate more efficiently due to specialization
and centralization.
DCM - CAED. September 2014 6
7
Cloud computing (cont’d)
Lower costs for the cloud service provider are past to the cloud
users.
Data is stored:
closer to the site where it is used.
in a device and in a location-independent manner.
The data storage strategy can increases reliability, as well as
security and lower communication costs
DCM - CAED. September 2014 7
8
Types of clouds Public Cloud - the infrastructure is made available to the general
public or a large industry group and is owned by the organization
selling cloud services.
Private Cloud - infrastructure operated solely for an organization.
Community Cloud - the infrastructure is shared by several
organizations and supports a specific community that has shared.
Hybrid Cloud - composition of two or more clouds (public, private, or
community) bound by standardized technology that enables data
and application portability.
DCM - CAED. September 2014 8
9
The “good” about cloud computing Resources such as CPU cycles, storage, network bandwidth are
shared.
When multiple applications share a system their peak demands for
resources are not synchronized thus, multiplexing leads to a higher
resource utilization.
Resources can be aggregated to support data-intensive
applications.
Data sharing facilitates collaborative activities. Many applications
require multiple types of analysis of shared data sets and multiple
decisions carried out by groups scattered around the globe.
DCM - CAED. September 2014 9
10
More “good” about cloud computing
Eliminate the initial investment costs for a private computing
infrastructure and the maintenance and operation costs.
Cost reduction: concentration of resources creates the opportunity to
pay as you go for computing.
Elasticity: the ability to accommodate workloads with very large
peak-to-average ratios.
User convenience: virtualization allows users to operate in familiar
environments rather than in idiosyncratic ones.
DCM - CAED. September 2014 10
11
Why cloud computing could be successful
when other paradigms have failed? It is in a better position to exploit recent advances in software, networking,
storage, and processor technologies promoted by the same companies
who provide cloud services.
It is focused on enterprise computing; its adoption by industrial
organizations, financial institutions, government, and so on could have a
huge impact on the economy.
A cloud consists of a homogeneous set of hardware and software
resources.
The resources are in a single administrative domain (AD). Security,
resource management, fault-tolerance, and quality of service are less
challenging than in a heterogeneous environment with resources in
multiple ADs.
DCM - CAED. September 2014 11
12
Challenges for cloud computing
Availability of service; what happens when the service provider
cannot deliver?
Diversity of services, data organization, user interfaces available
at different service providers limit user mobility; once a customer is
hooked to one provider it is hard to move to another.
Standardization efforts at NIST!
Data confidentiality and auditability, a serious problem.
Data transfer bottleneck; many applications are data-intensive.
DCM - CAED. September 2014 12
13
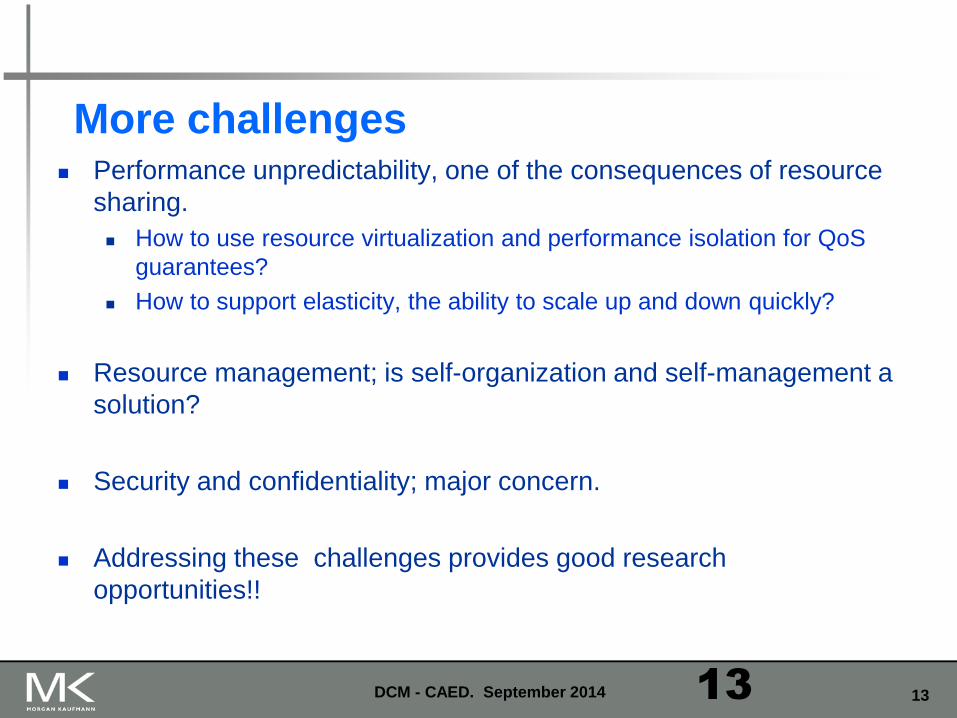
More challenges Performance unpredictability, one of the consequences of resource
sharing.
How to use resource virtualization and performance isolation for QoS
guarantees?
How to support elasticity, the ability to scale up and down quickly?
Resource management; is self-organization and self-management a
solution?
Security and confidentiality; major concern.
Addressing these challenges provides good research
opportunities!!
DCM - CAED. September 2014 13
14 DCM - CAED. September 2014
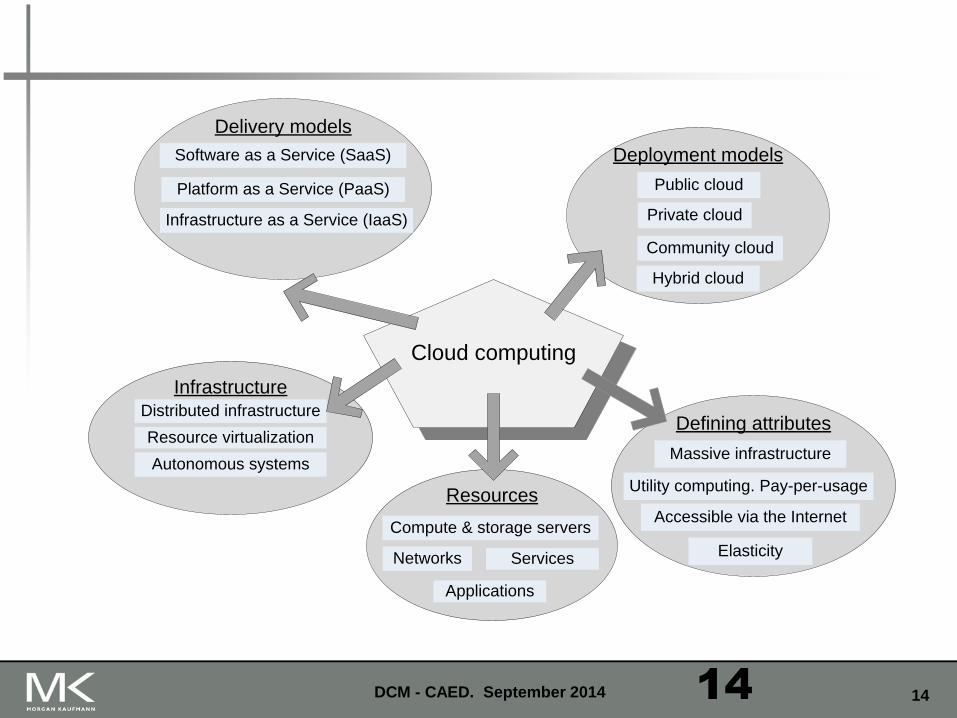
Delivery models
Infrastructure as a Service (IaaS)
Software as a Service (SaaS)
Platform as a Service (PaaS)
Deployment models
Private cloud
Hybrid cloud
Public cloud
Community cloud
Defining attributes
Massive infrastructure
Accessible via the Internet
Utility computing. Pay-per-usage
Elasticity
Cloud computing
Resources
Networks
Compute & storage servers
Services
Applications
Infrastructure
Distributed infrastructure
Resource virtualization
Autonomous systems
14
15 DCM - CAED. September 2014
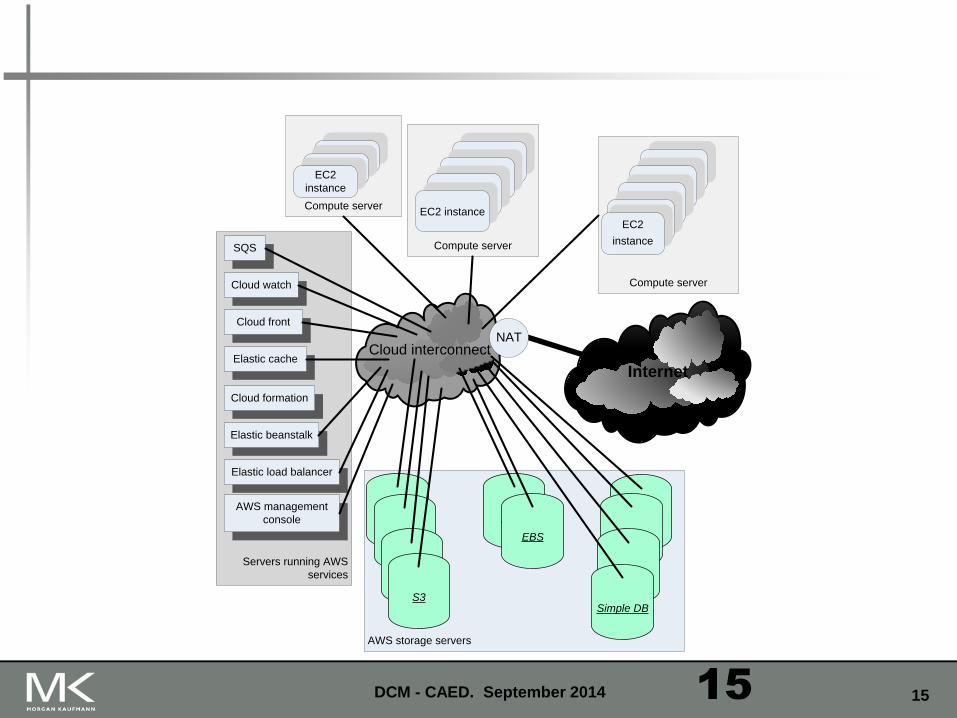
Internet
Cloud interconnect
AWS storage servers
S3
S3
S3
S3
EBS
EBS
SDB
SDB
SDB
Simple DB
Compute server
EC2 instanceCompute server
EC2
instance
Compute server
InstanceEC2
instance
Servers running AWS
services
SQS
Cloud watch
AWS management
console
Elastic beanstalk
Cloud front
Elastic cache
Elastic load balancer
Cloud formation
NAT
15
16 Copyright © 2012, Elsevier Inc. All rights reserved.
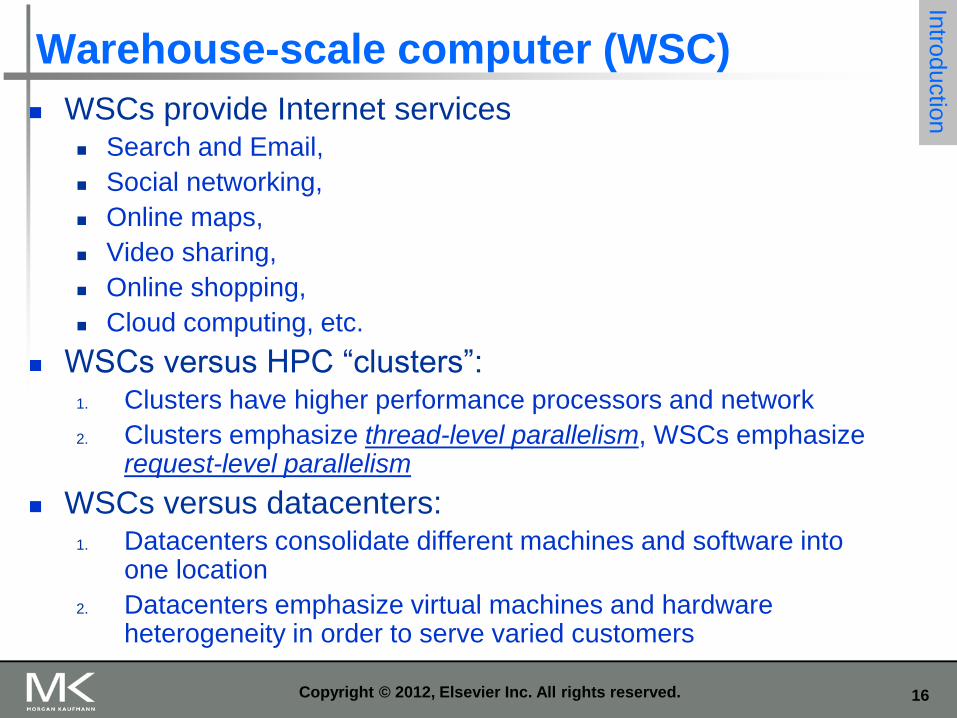
Warehouse-scale computer (WSC)
WSCs provide Internet services Search and Email,
Social networking,
Online maps,
Video sharing,
Online shopping,
Cloud computing, etc.
WSCs versus HPC “clusters”: 1. Clusters have higher performance processors and network
2. Clusters emphasize thread-level parallelism, WSCs emphasize request-level parallelism
WSCs versus datacenters: 1. Datacenters consolidate different machines and software into
one location
2. Datacenters emphasize virtual machines and hardware heterogeneity in order to serve varied customers
Intro
ductio
n
17
Request-level parallelism
Popular Internet services like Google search
Hundreds or thousands of requests per second
Requests are largely independent
Mostly involve read-only databases
Producer-consumer sharing
Rarely involve read-write data sharing or synchronization
across requests
Computations easily partitioned within a request and across
different requests
Copyright © 2012, Elsevier Inc. All rights reserved.
18 Copyright © 2012, Elsevier Inc. All rights reserved.
WSCs design factors
1. Cost-performance small savings add up
2. Energy efficiency Affects power distribution and cooling
3. Operational costs count Power consumption is a primary, not secondary, constraint when designing system
4. Dependability via redundancy
5. Network I/O
6. Interactive and batch processing workloads
7. Ample computational parallelism is not important Most jobs are totally independent
8. Scale and its opportunities and problems Can afford to build customized systems since WSC require volume purchase
Intro
ductio
n
19 Copyright © 2012, Elsevier Inc. All rights reserved.
Programming models
Batch processing framework: MapReduce Map: applies a programmer-supplied function to each logical
input record
Runs on thousands of computers
Provides new set of key-value pairs as intermediate values
Reduce: collapses values using another programmer-supplied function
Pro
gra
mm
ing M
odels
and W
ork
loads fo
r WS
Cs
20
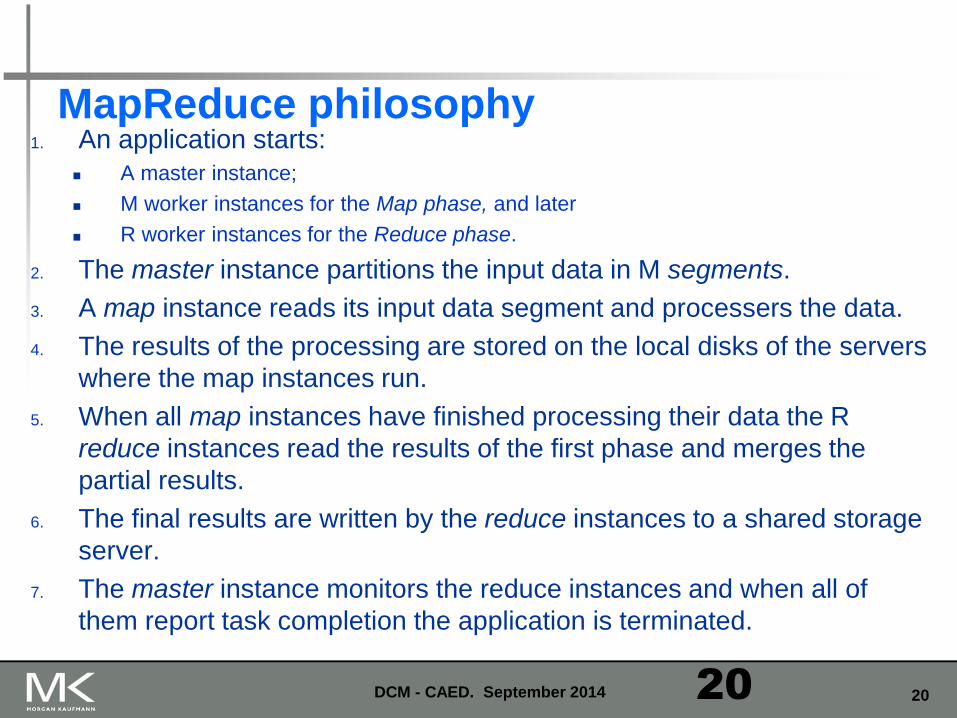
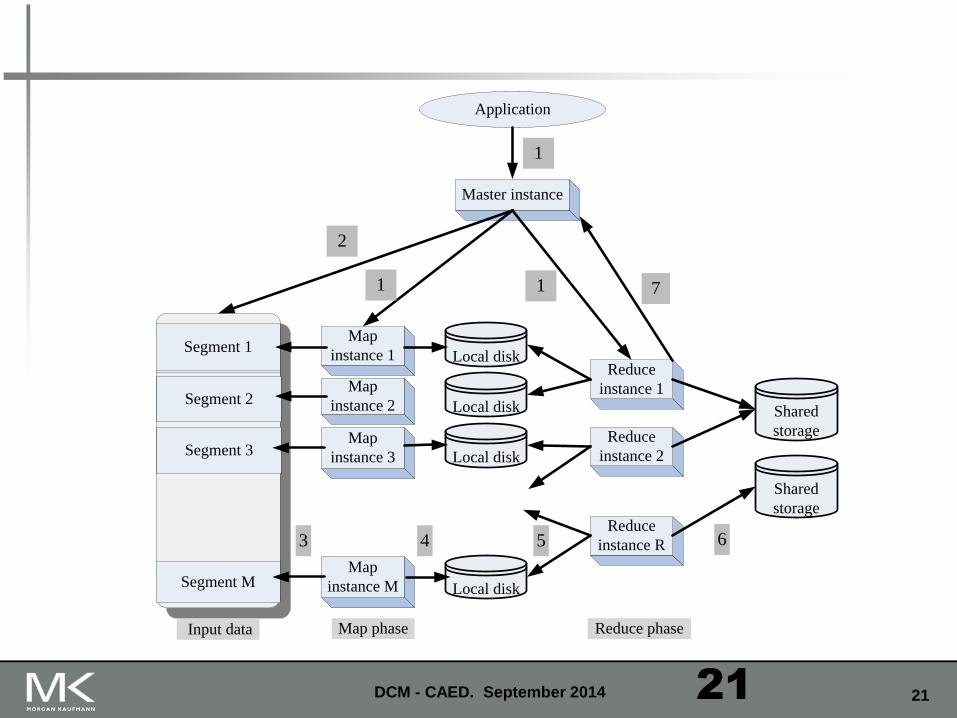
MapReduce philosophy 1. An application starts:
A master instance;
M worker instances for the Map phase, and later
R worker instances for the Reduce phase.
2. The master instance partitions the input data in M segments.
3. A map instance reads its input data segment and processers the data.
4. The results of the processing are stored on the local disks of the servers
where the map instances run.
5. When all map instances have finished processing their data the R
reduce instances read the results of the first phase and merges the
partial results.
6. The final results are written by the reduce instances to a shared storage
server.
7. The master instance monitors the reduce instances and when all of
them report task completion the application is terminated.
DCM - CAED. September 2014 20
21 DCM - CAED. September 2014
Segment 1
Segment 1Segment 2
Segment 3
Segment M
Map
instance 1
Map
instance 2
Map
instance 3
Map
instance M
Local disk
Local disk
Local disk
Local disk
Master instance
Application
1
2
1
3 4
1
Reduce
instance 1
Reduce
instance 2
Reduce
instance R
Map phase Reduce phase
Shared
storage
Shared
storage
5 6
Input data
7
21
22 Copyright © 2012, Elsevier Inc. All rights reserved.
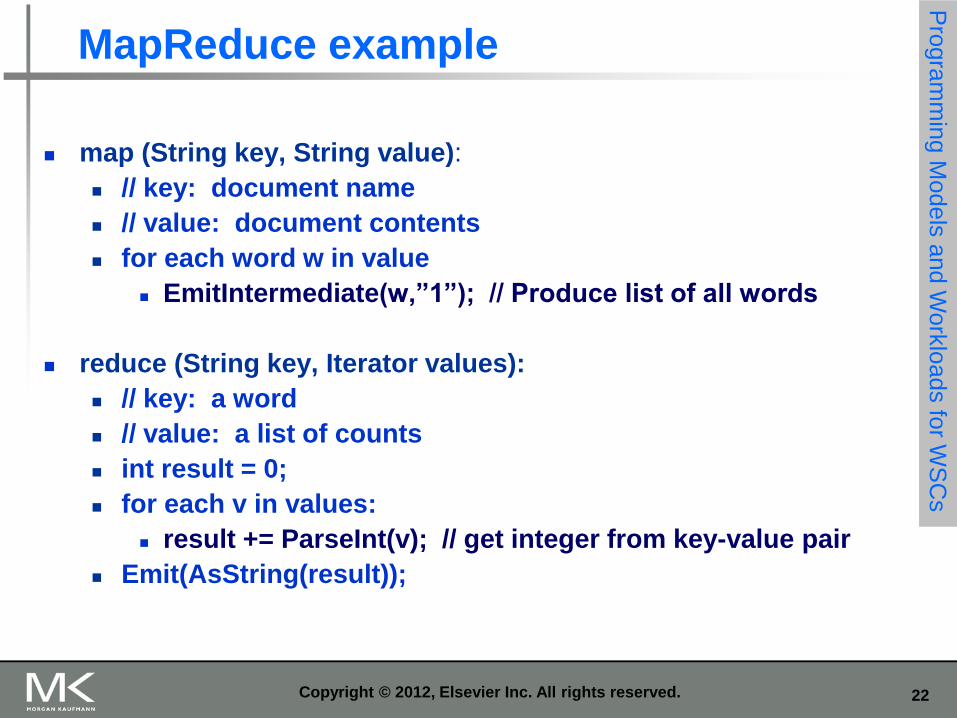
MapReduce example
map (String key, String value):
// key: document name
// value: document contents
for each word w in value
EmitIntermediate(w,”1”); // Produce list of all words
reduce (String key, Iterator values):
// key: a word
// value: a list of counts
int result = 0;
for each v in values:
result += ParseInt(v); // get integer from key-value pair
Emit(AsString(result));
Pro
gra
mm
ing M
odels
and W
ork
loads fo
r WS
Cs
23
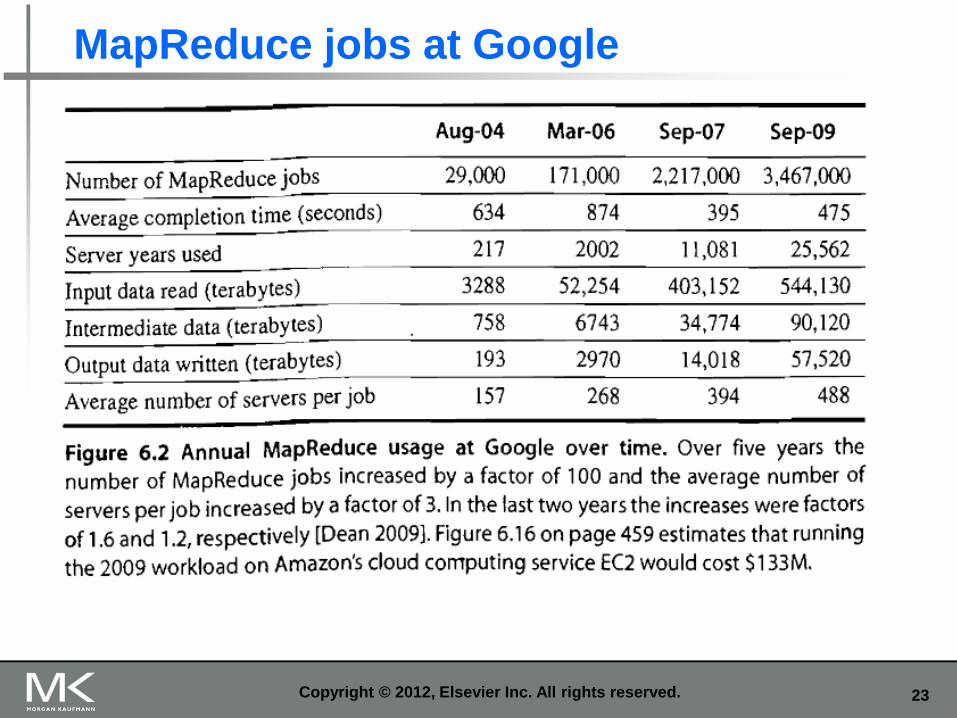
MapReduce jobs at Google
Copyright © 2012, Elsevier Inc. All rights reserved.
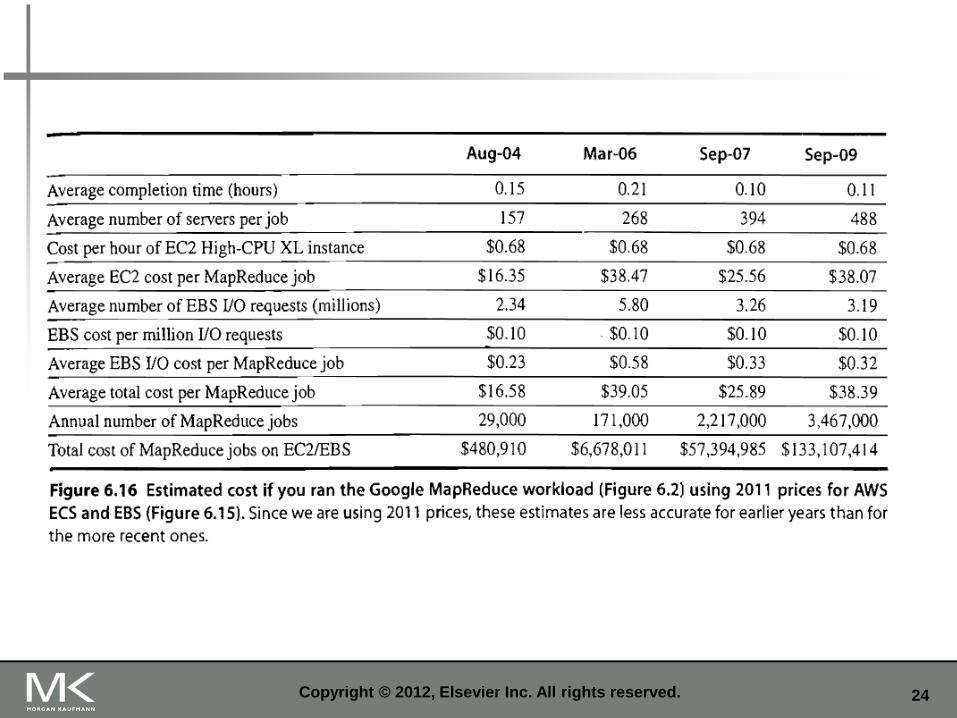
24 Copyright © 2012, Elsevier Inc. All rights reserved.
25 Copyright © 2012, Elsevier Inc. All rights reserved.
MapReduce runtime environment
Schedules map and reduce task to WSC nodes
Availability: Use replicas of data across different servers
Use relaxed consistency No need for all replicas to always agree
Workload demands
Often vary considerably
Pro
gra
mm
ing M
odels
and W
ork
loads fo
r WS
Cs
26 Copyright © 2012, Elsevier Inc. All rights reserved.
WSC architecture
Hierarchy of networks for interconnection
Each 19” rack holds 48 servers connected to a rack switch
Rack switches are uplinked to switch higher in hierarchy Uplink has 48 / n times lower bandwidth, where n = # of uplink
ports “Oversubscription” Goal is to maximize locality of communication relative to the rack
Com
pute
r Ar4
chite
ctu
re o
f WS
C
27
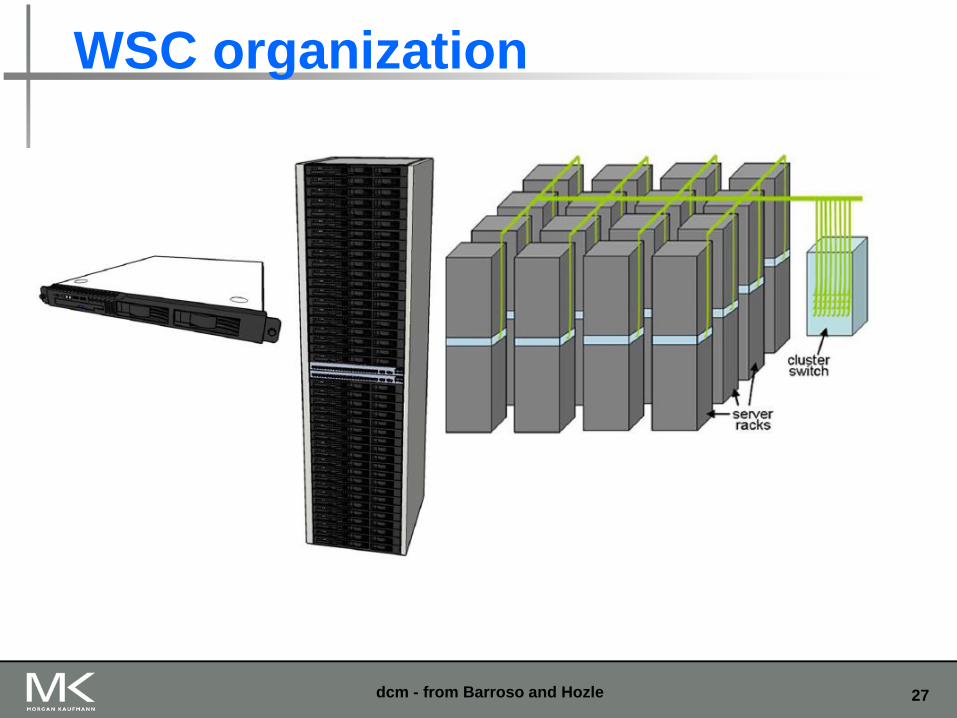
WSC organization
dcm - from Barroso and Hozle
28 Copyright © 2012, Elsevier Inc. All rights reserved.
Storage options
Two options Use disks inside the servers, or
Network attached storage through InfiniBand
WSCs generally rely on local disks
Example: Google File System (GFS) uses local disks and maintains at least three replicas
Com
pute
r Ar4
chite
ctu
re o
f WS
C
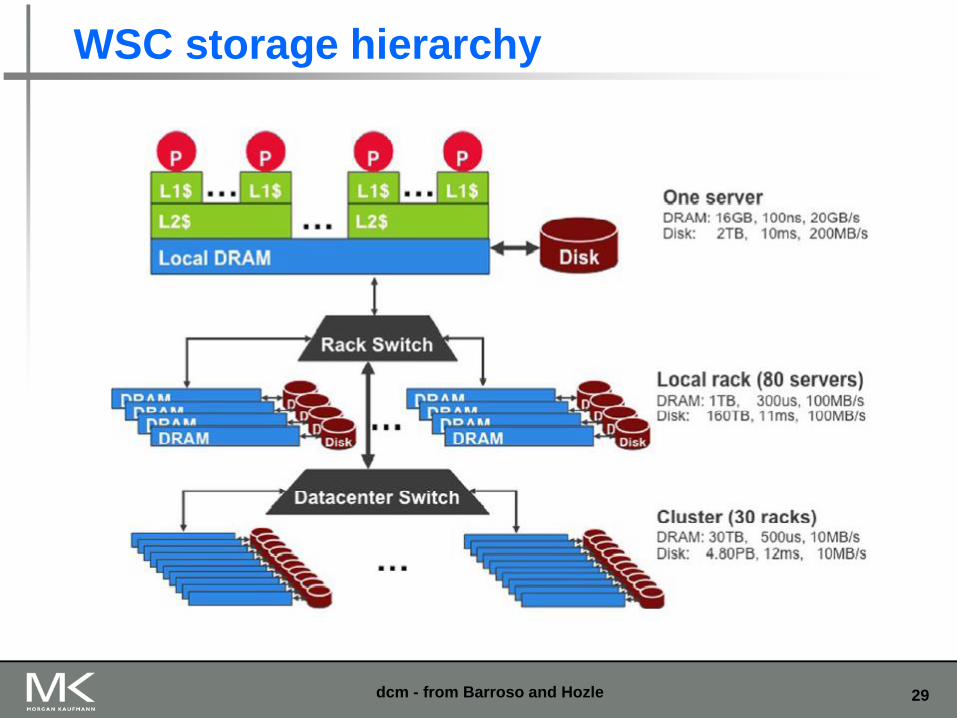
29
WSC storage hierarchy
dcm - from Barroso and Hozle
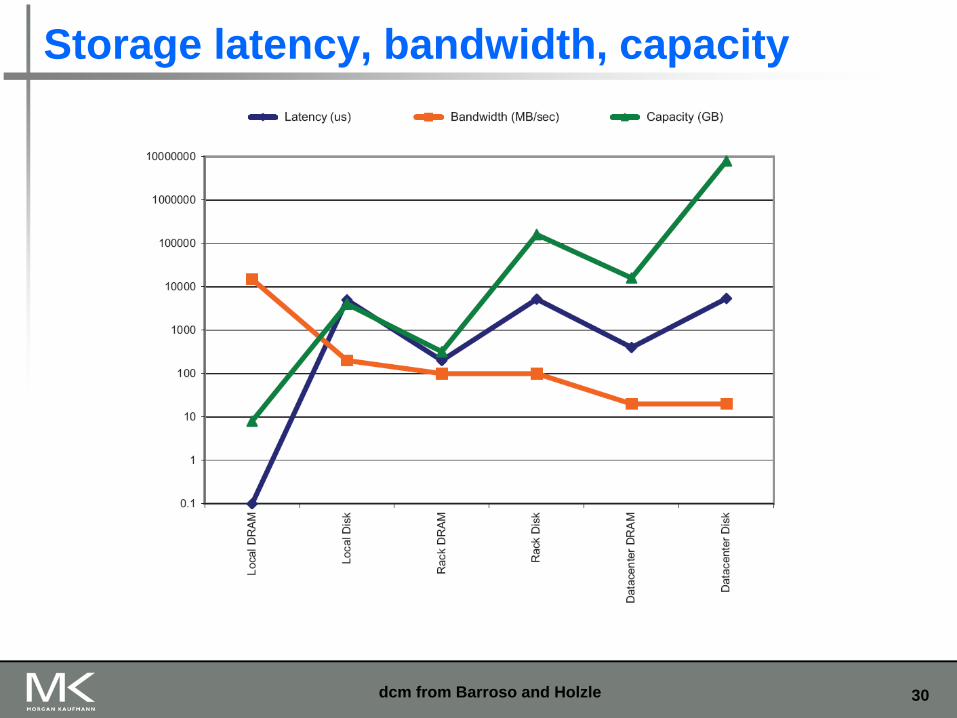
30
Storage latency, bandwidth, capacity
dcm from Barroso and Holzle
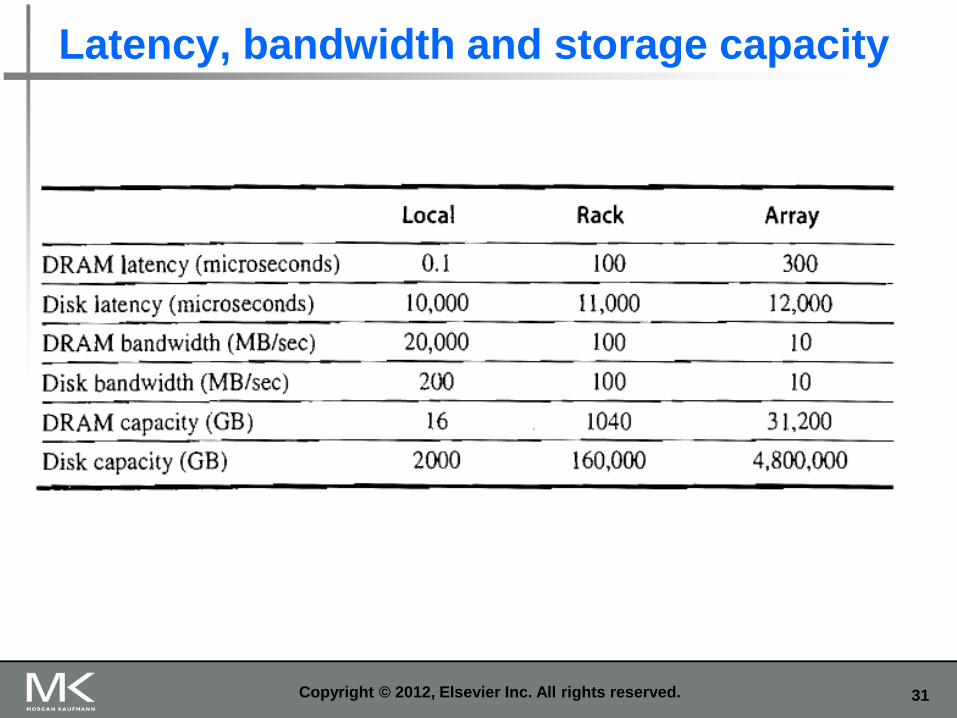
31
Latency, bandwidth and storage capacity
Copyright © 2012, Elsevier Inc. All rights reserved.
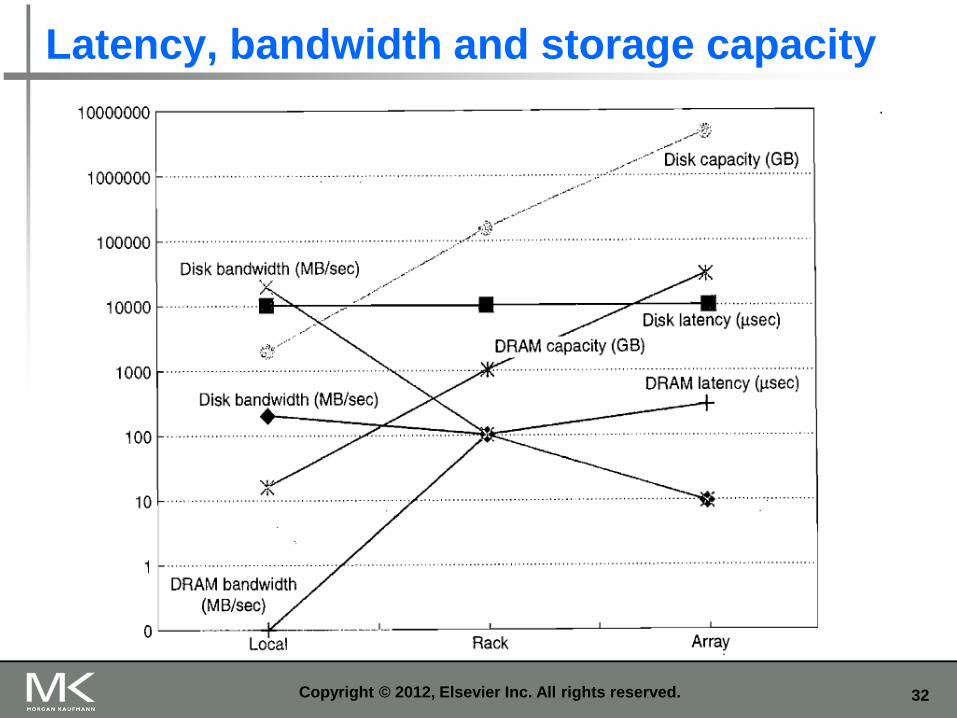
32
Latency, bandwidth and storage capacity
Copyright © 2012, Elsevier Inc. All rights reserved.
33 Copyright © 2012, Elsevier Inc. All rights reserved.
Array switch
Switch that connects an array of racks
Should have 10 X the bisection bandwidth of rack switch
The cost of n-port switch grows as n2
Often utilize content addressable memory chips and FPGAs (Field Programmable Gate Arrays)
Com
pute
r Ar4
chite
ctu
re o
f WS
C
34
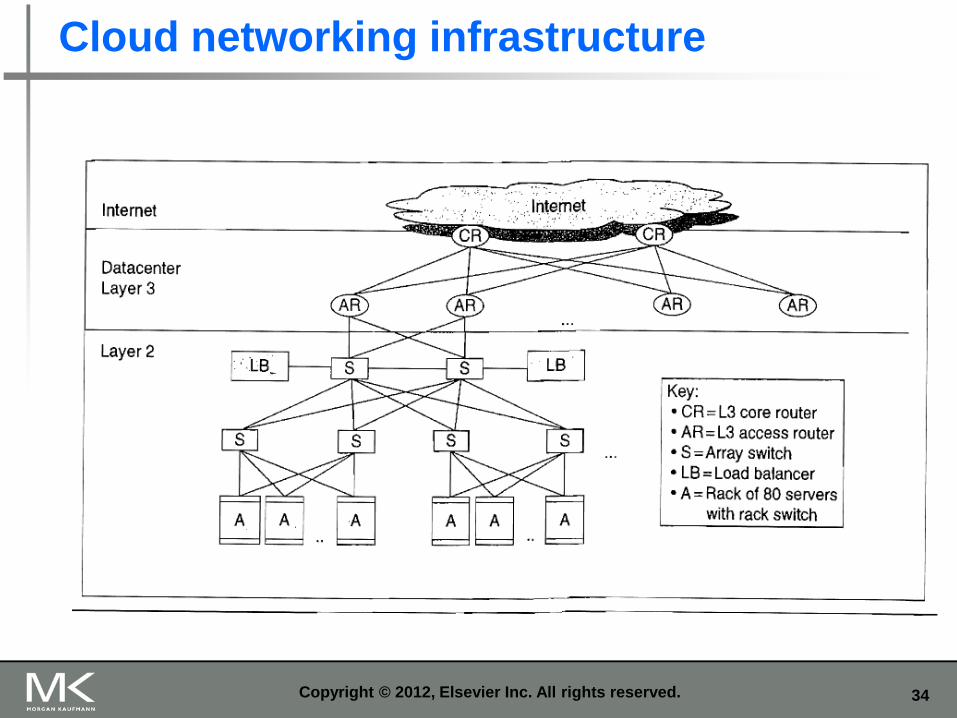
Cloud networking infrastructure
Copyright © 2012, Elsevier Inc. All rights reserved.
35 Copyright © 2012, Elsevier Inc. All rights reserved.
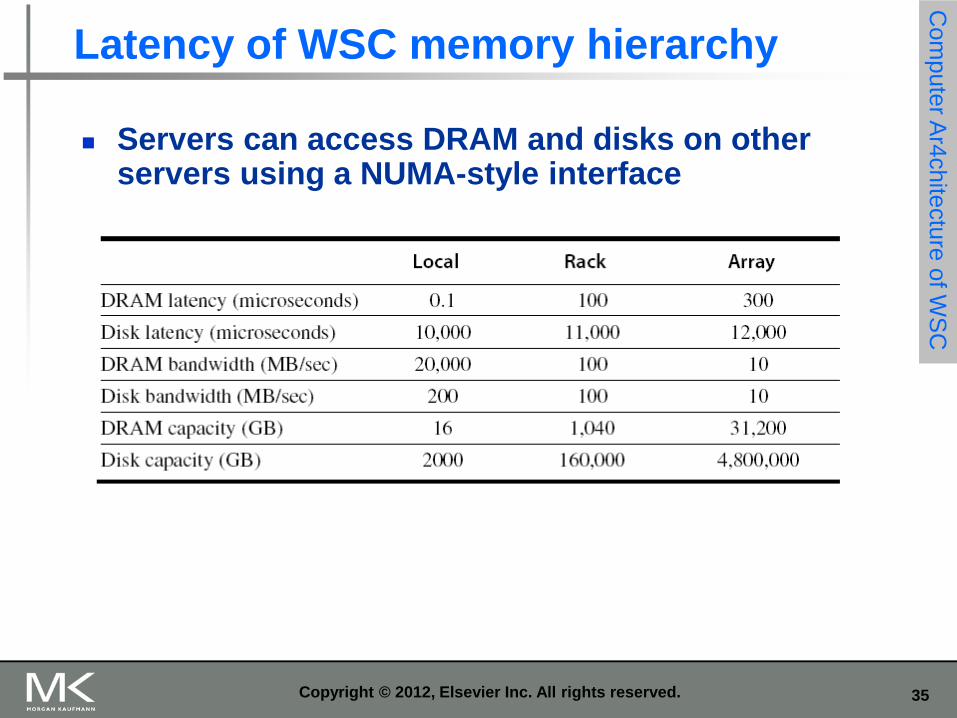
Latency of WSC memory hierarchy
Servers can access DRAM and disks on other servers using a NUMA-style interface
Com
pute
r Ar4
chite
ctu
re o
f WS
C
36
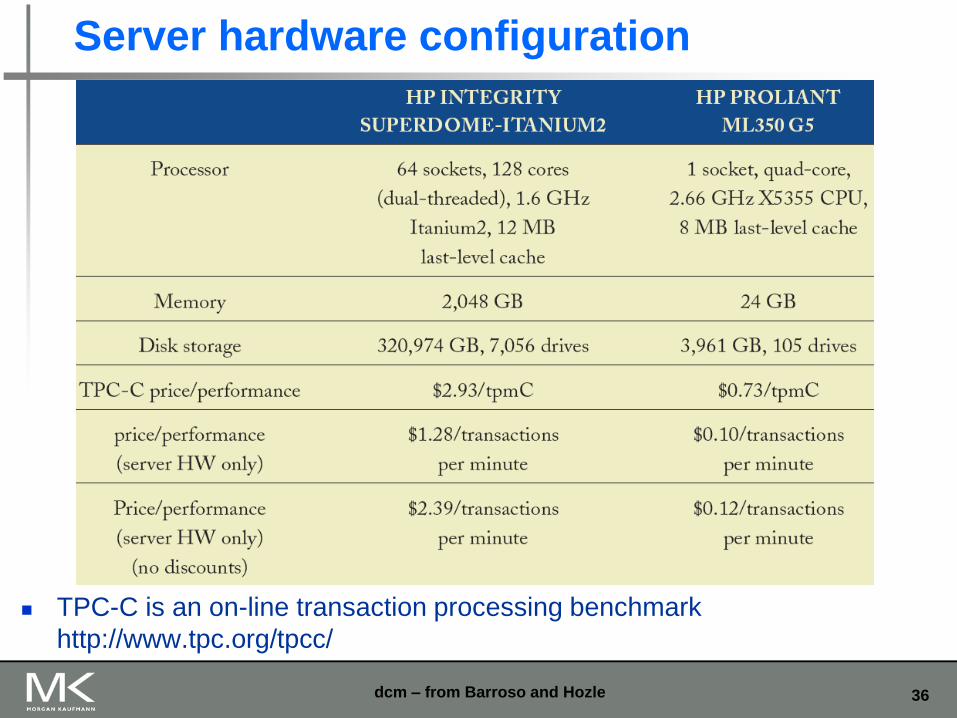
Server hardware configuration
TPC-C is an on-line transaction processing benchmark
http://www.tpc.org/tpcc/
dcm – from Barroso and Hozle
37
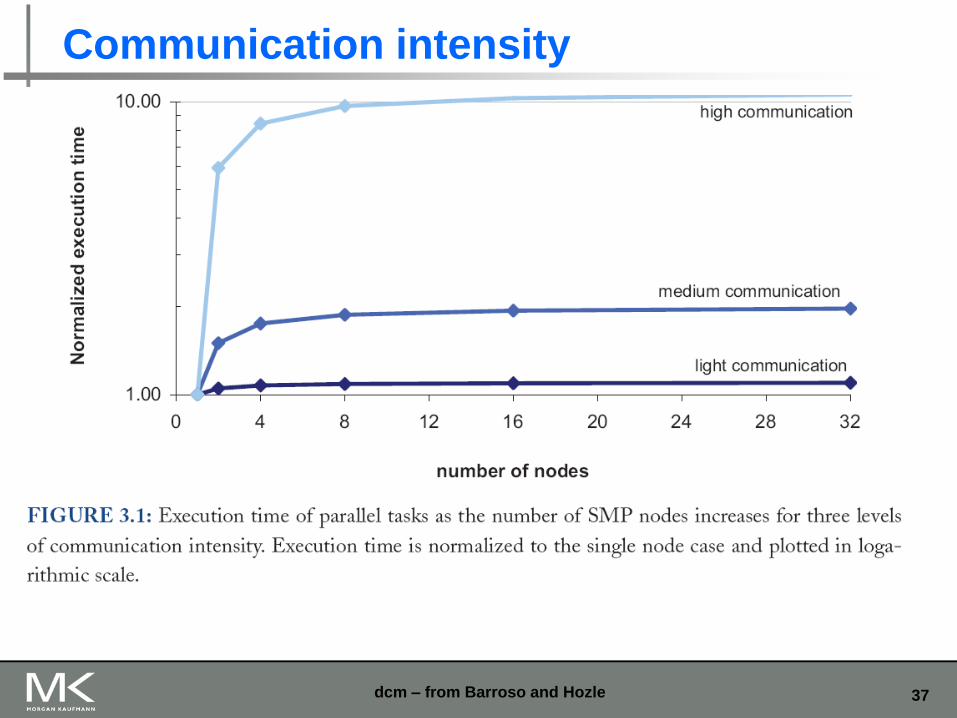
Communication intensity
dcm – from Barroso and Hozle
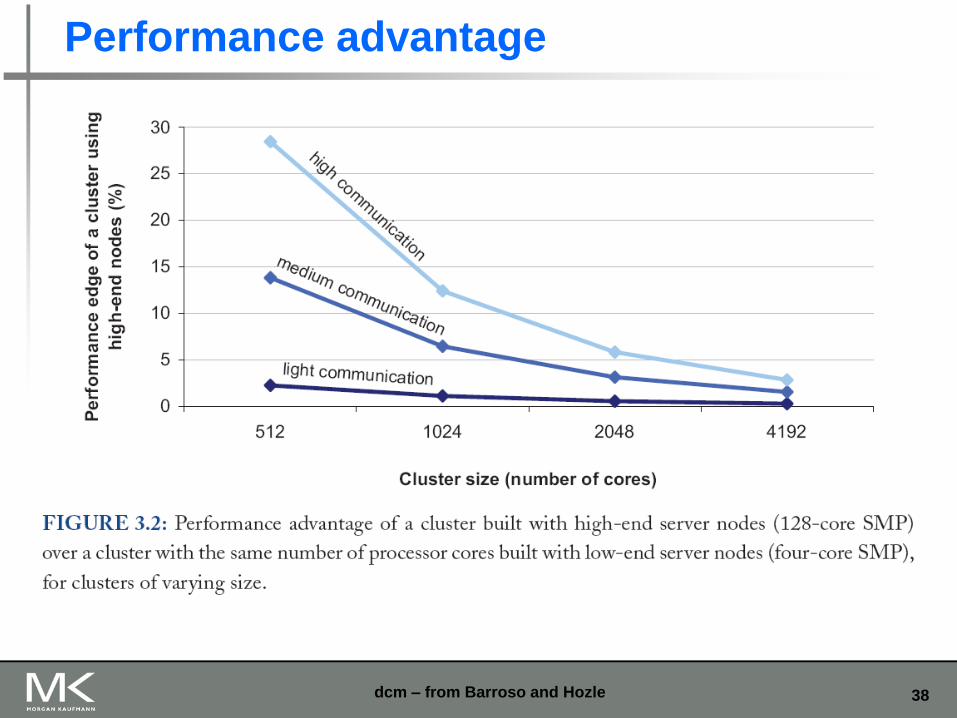
38
Performance advantage
dcm – from Barroso and Hozle
39
Scientific applications and WSC
Applications in computational science and engineering
typically exhibit fine-grain parallelism.
Do not perform well on WSCs!!
WSC are designed to support request-level rather than
tread-level parallelism
dcm
40
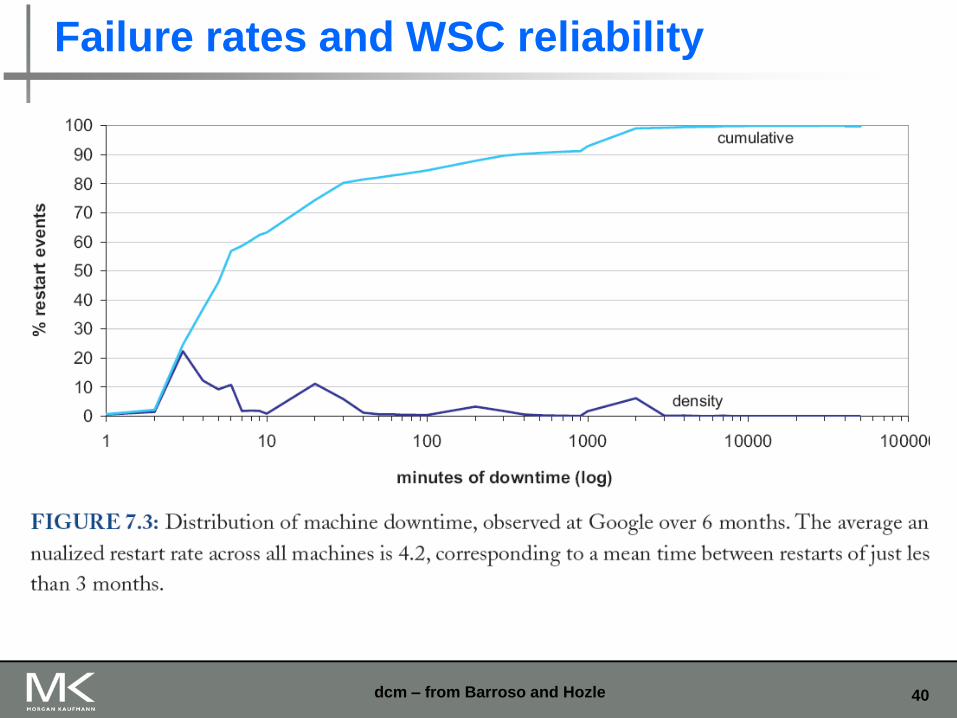
Failure rates and WSC reliability
dcm – from Barroso and Hozle
41 Copyright © 2012, Elsevier Inc. All rights reserved.
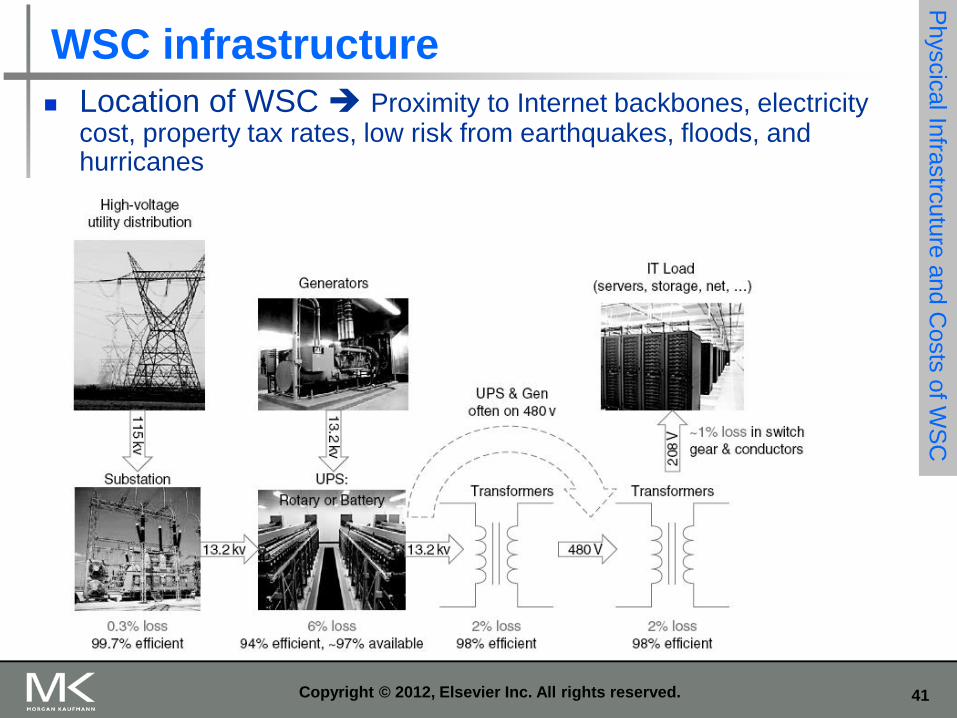
WSC infrastructure
Location of WSC Proximity to Internet backbones, electricity cost, property tax rates, low risk from earthquakes, floods, and hurricanes
Physcic
al In
frastrc
utu
re a
nd C
osts
of W
SC
42 Copyright © 2012, Elsevier Inc. All rights reserved.
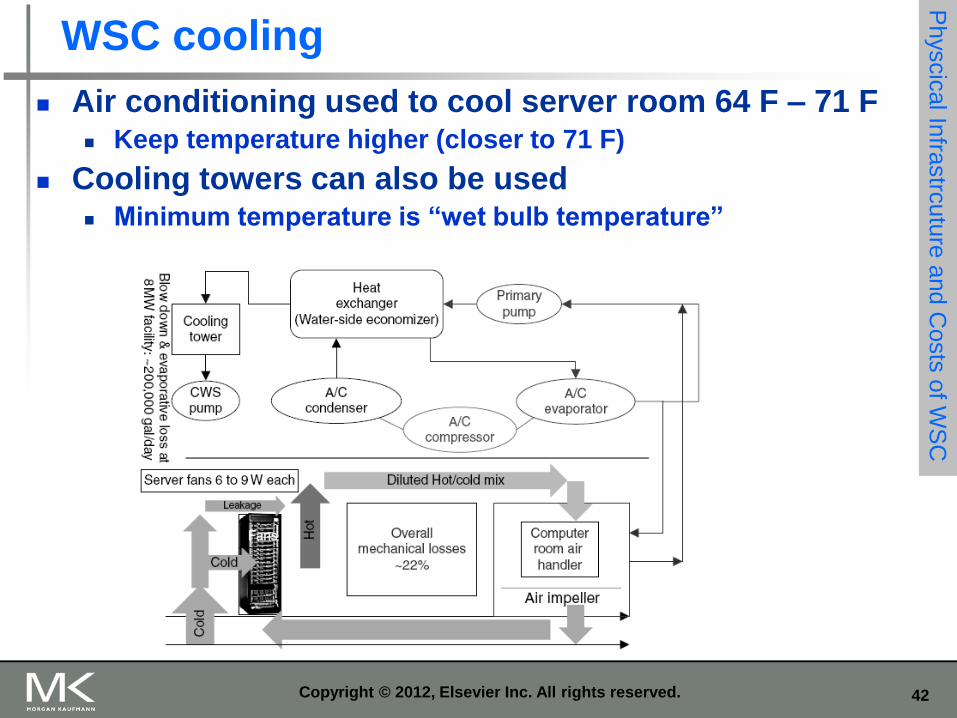
WSC cooling
Air conditioning used to cool server room 64 F – 71 F Keep temperature higher (closer to 71 F)
Cooling towers can also be used Minimum temperature is “wet bulb temperature”
Physcic
al In
frastrc
utu
re a
nd C
osts
of W
SC
43 Copyright © 2012, Elsevier Inc. All rights reserved.
WSC cooling
Cooling system also uses water (evaporation and spills) E.g. 70,000 to 200,000 gallons per day for an 8 MW facility
Power cost breakdown: Chillers: 30-50% of the power used by the IT equipment
Air conditioning: 10-20% of the IT power, mostly due to fans
How many servers can a WSC support? Each server:
“Nameplate power rating” gives maximum power consumption
To get actual, measure power under actual workloads
Oversubscribe cumulative server power by 40%, but monitor power closely
Physcic
al In
frastrc
utu
re a
nd C
osts
of W
SC
44 Copyright © 2012, Elsevier Inc. All rights reserved.
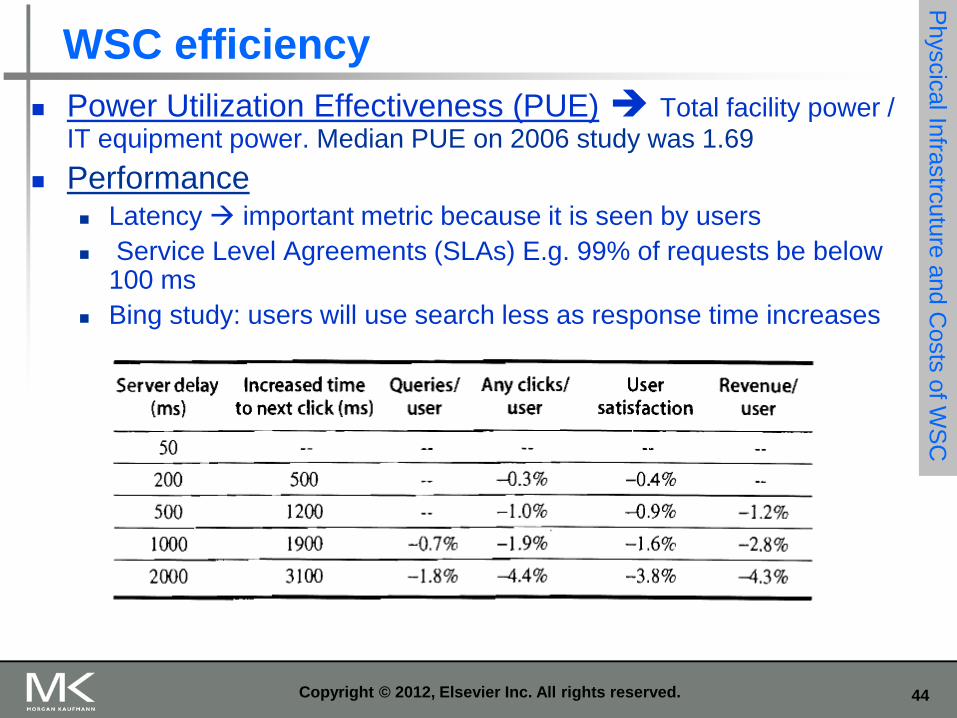
WSC efficiency
Power Utilization Effectiveness (PUE) Total facility power / IT equipment power. Median PUE on 2006 study was 1.69
Performance Latency important metric because it is seen by users
Service Level Agreements (SLAs) E.g. 99% of requests be below 100 ms
Bing study: users will use search less as response time increases
Physcic
al In
frastrc
utu
re a
nd C
osts
of W
SC
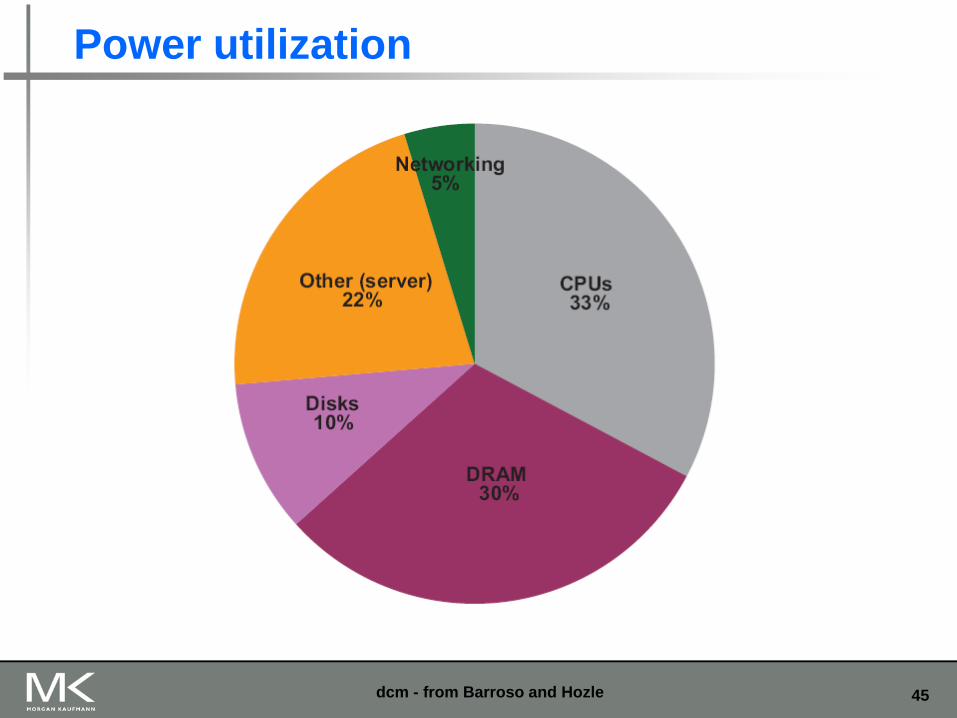
45
Power utilization
dcm - from Barroso and Hozle
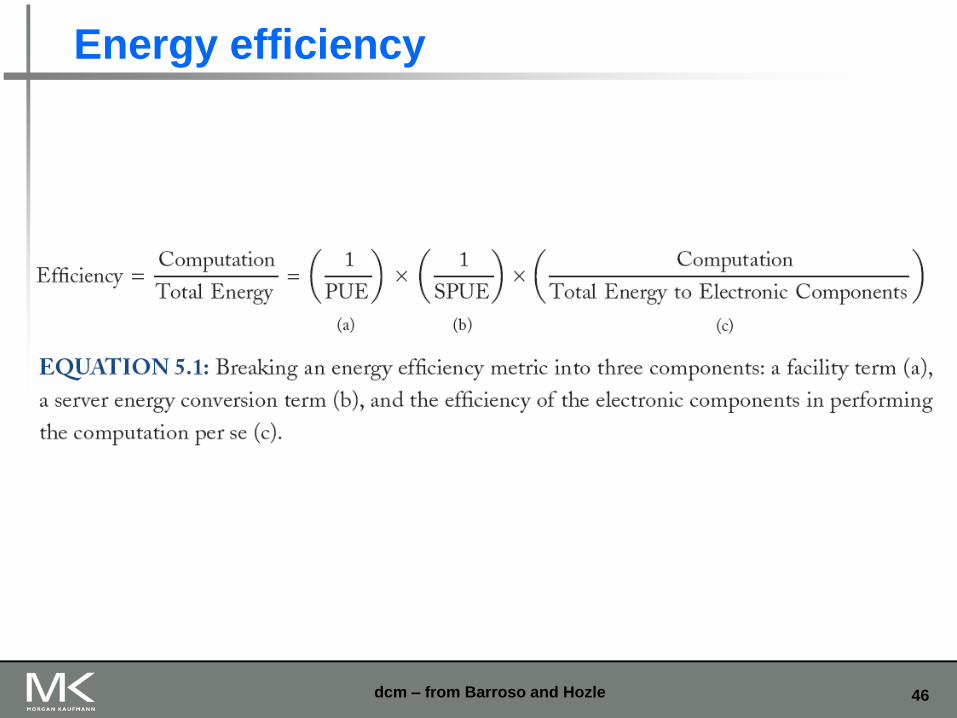
46
Energy efficiency
dcm – from Barroso and Hozle
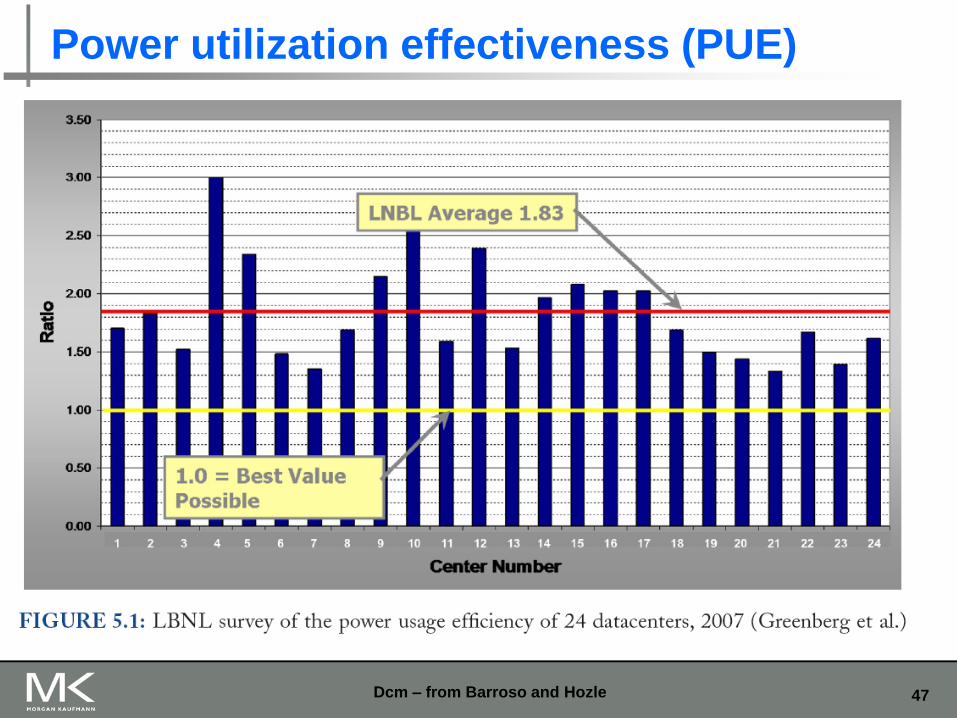
47
Power utilization effectiveness (PUE)
Dcm – from Barroso and Hozle
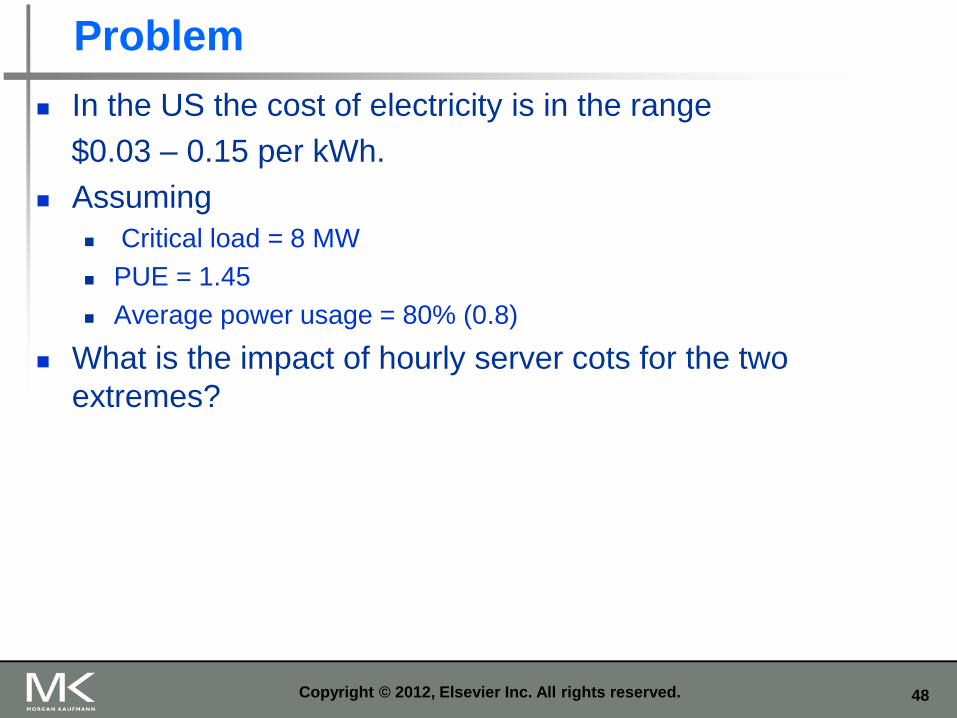
48
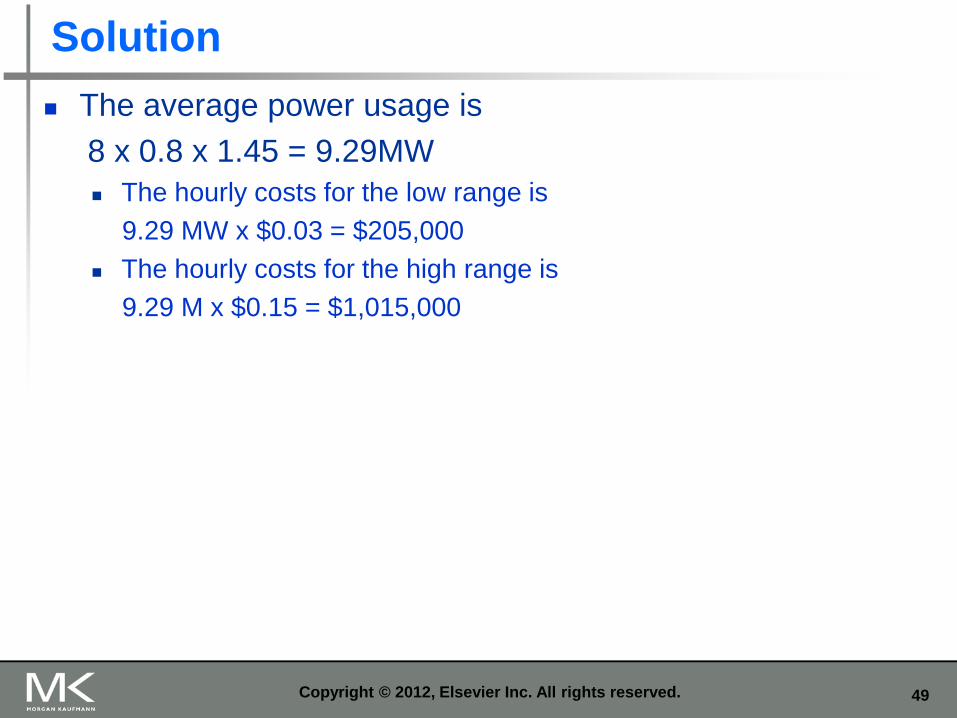
Problem
In the US the cost of electricity is in the range
$0.03 – 0.15 per kWh.
Assuming
Critical load = 8 MW
PUE = 1.45
Average power usage = 80% (0.8)
What is the impact of hourly server cots for the two
extremes?
Copyright © 2012, Elsevier Inc. All rights reserved.
49
Solution
The average power usage is
8 x 0.8 x 1.45 = 9.29MW
The hourly costs for the low range is
9.29 MW x $0.03 = $205,000
The hourly costs for the high range is
9.29 M x $0.15 = $1,015,000
Copyright © 2012, Elsevier Inc. All rights reserved.
50
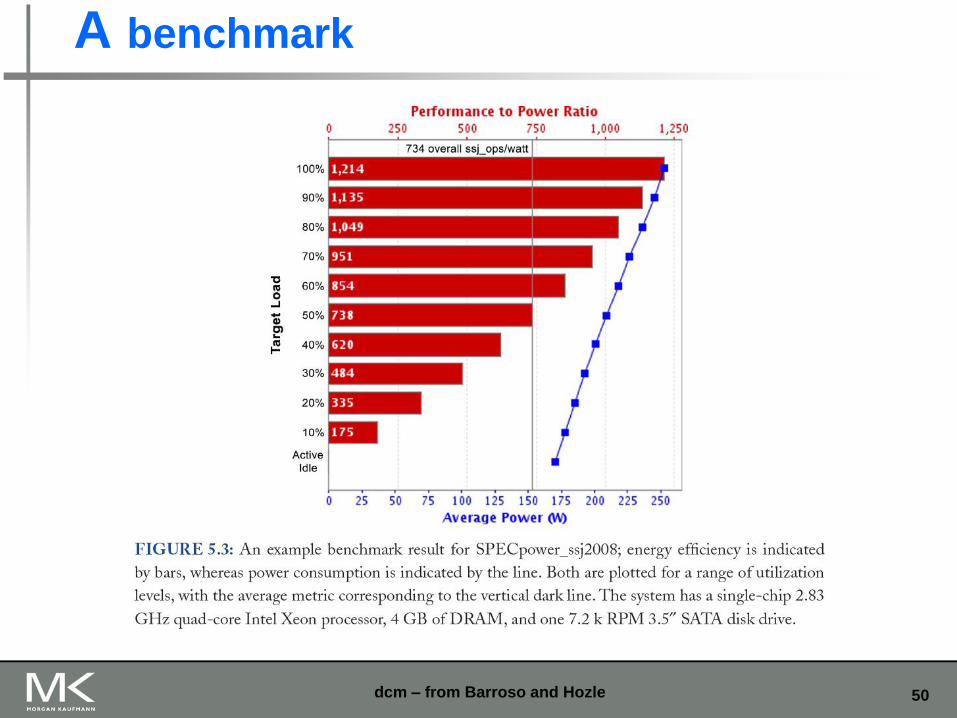
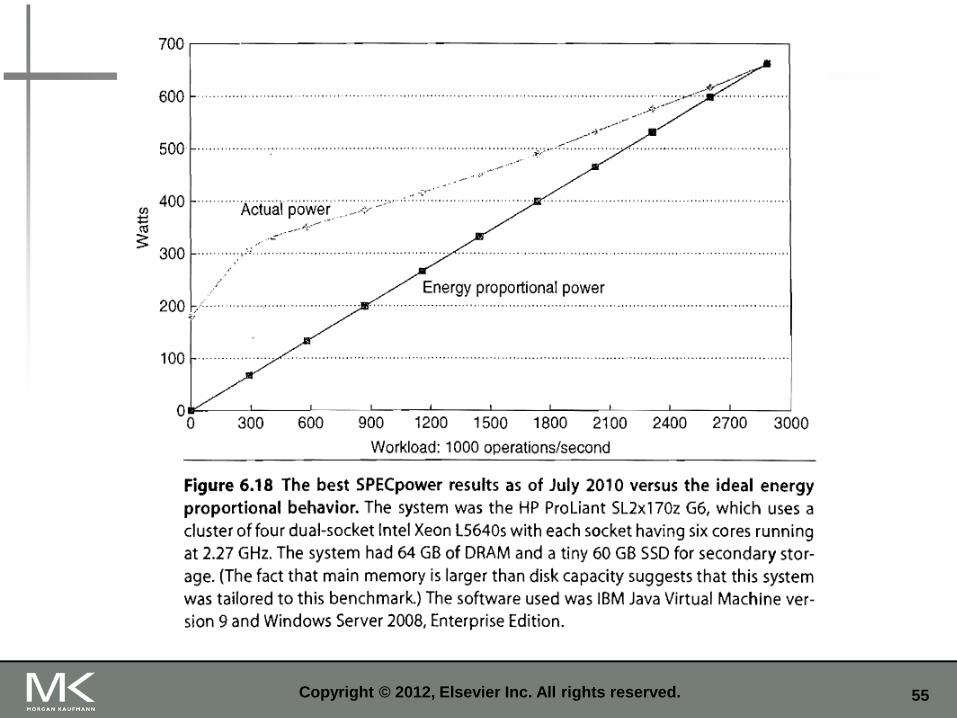
A benchmark
dcm – from Barroso and Hozle
51
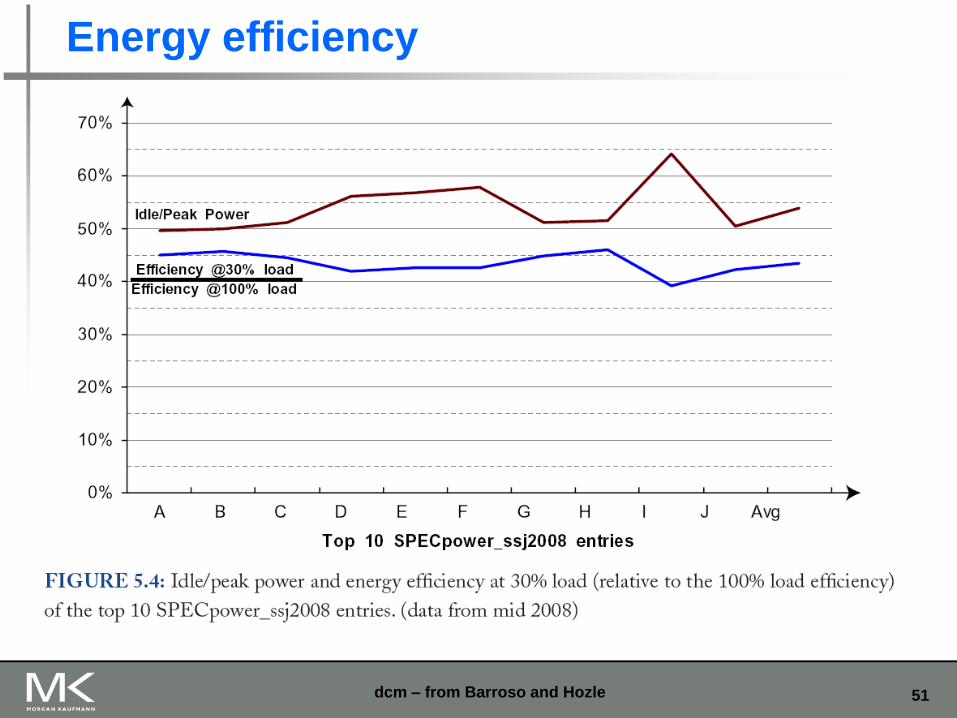
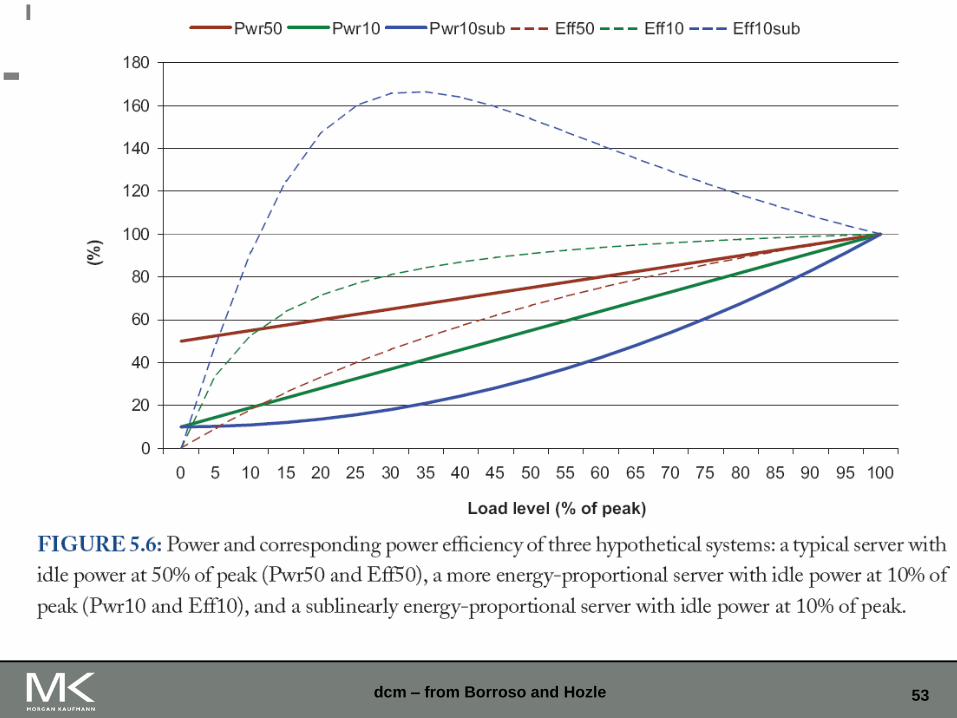
Energy efficiency
dcm – from Barroso and Hozle
52
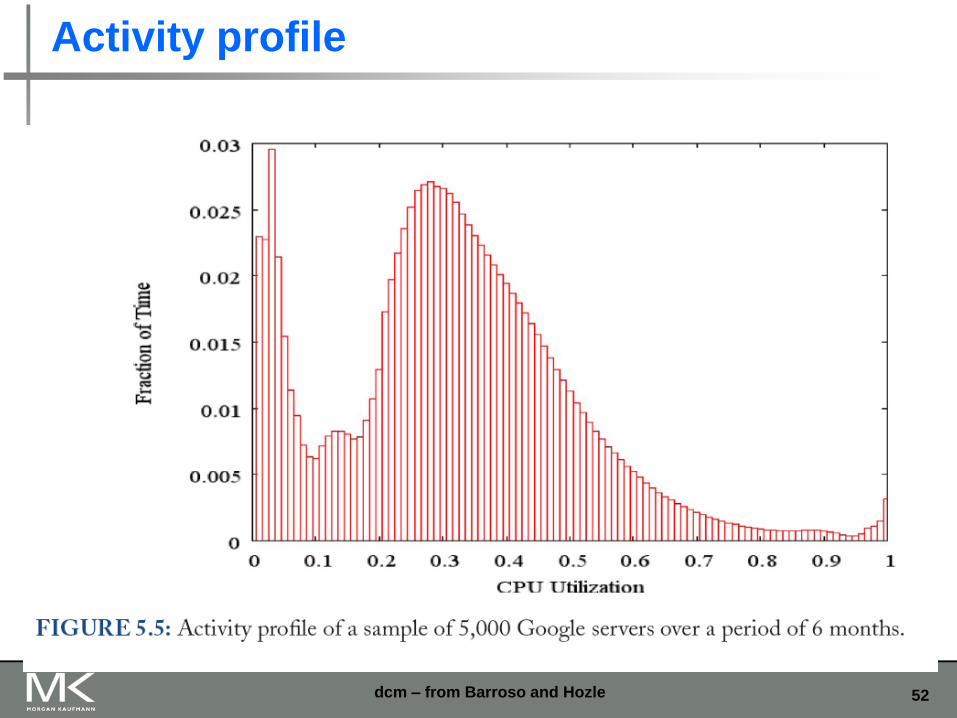
Activity profile
dcm – from Barroso and Hozle
53 dcm – from Borroso and Hozle
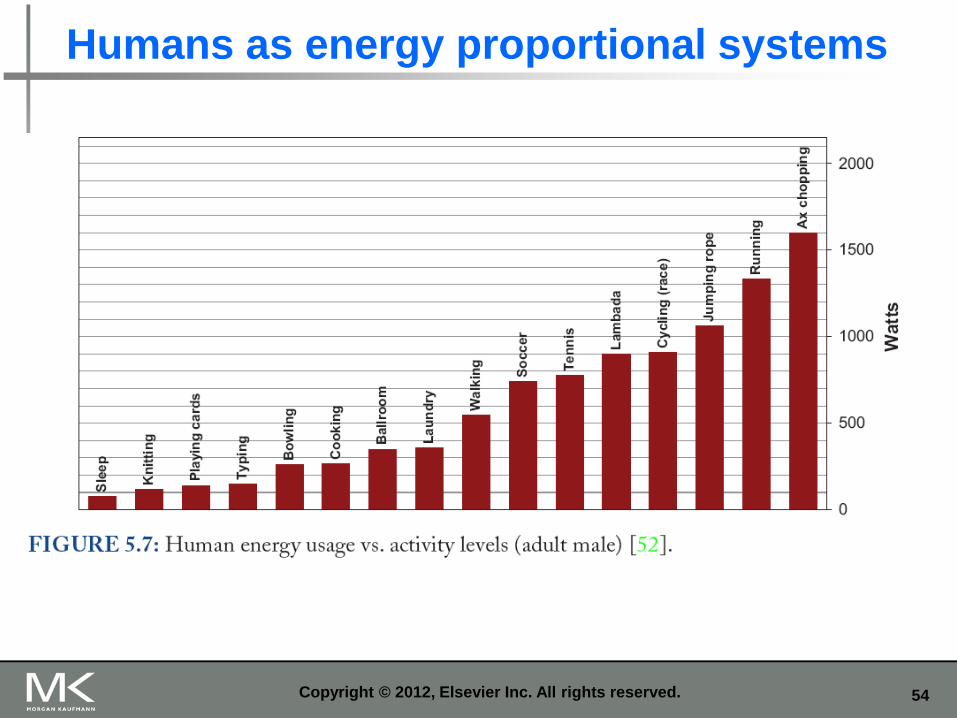
54
Humans as energy proportional systems
Copyright © 2012, Elsevier Inc. All rights reserved.
55 Copyright © 2012, Elsevier Inc. All rights reserved.
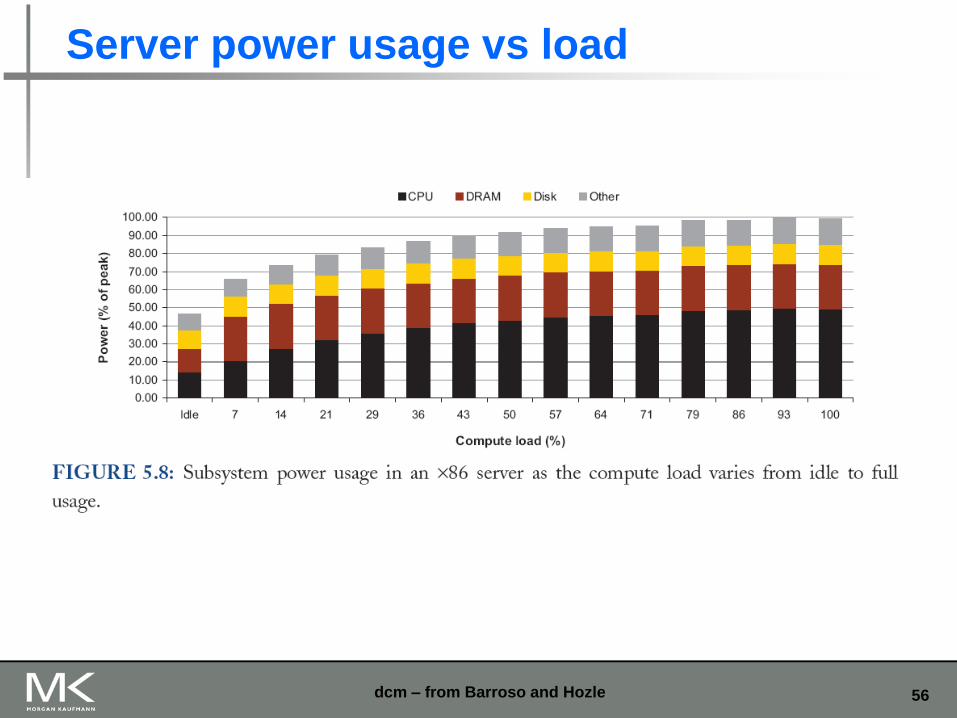
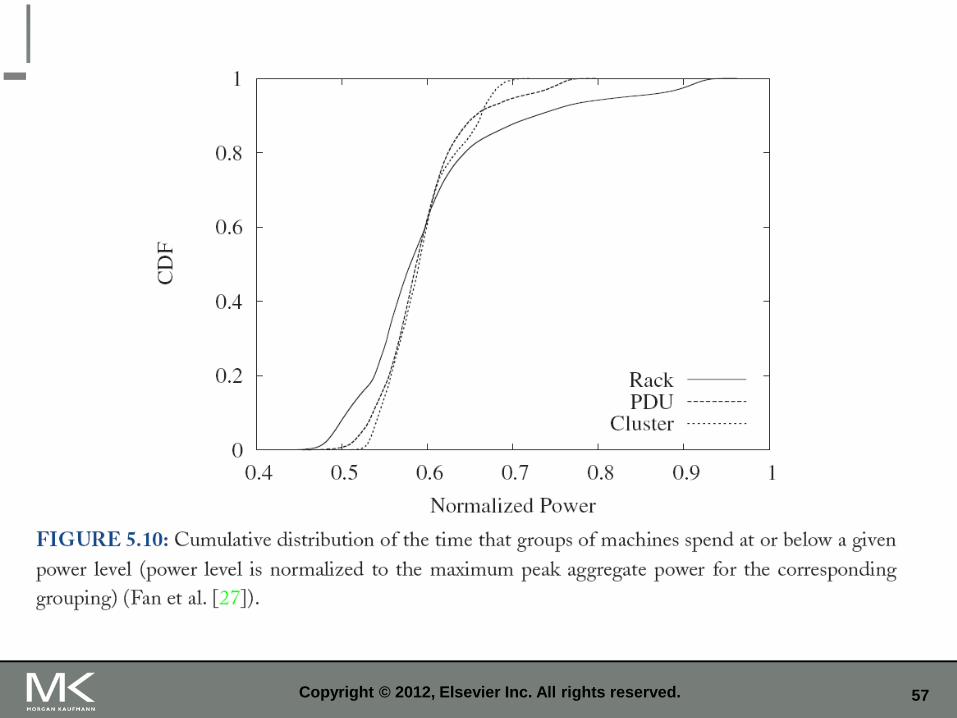
56
Server power usage vs load
dcm – from Barroso and Hozle
57 Copyright © 2012, Elsevier Inc. All rights reserved.
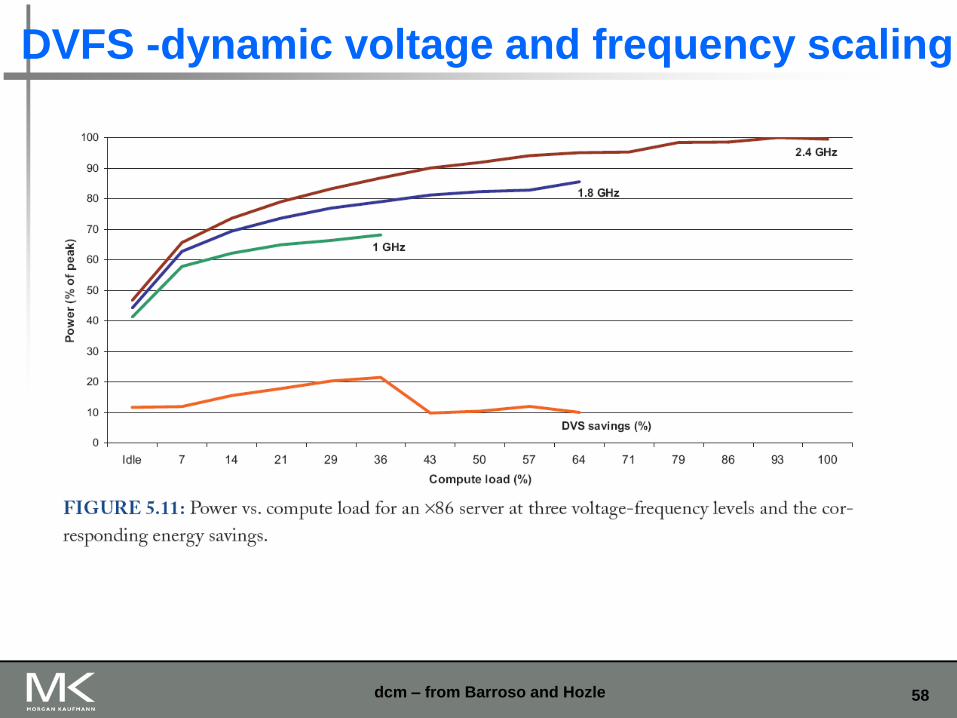
58
DVFS -dynamic voltage and frequency scaling
dcm – from Barroso and Hozle
59 Copyright © 2012, Elsevier Inc. All rights reserved.
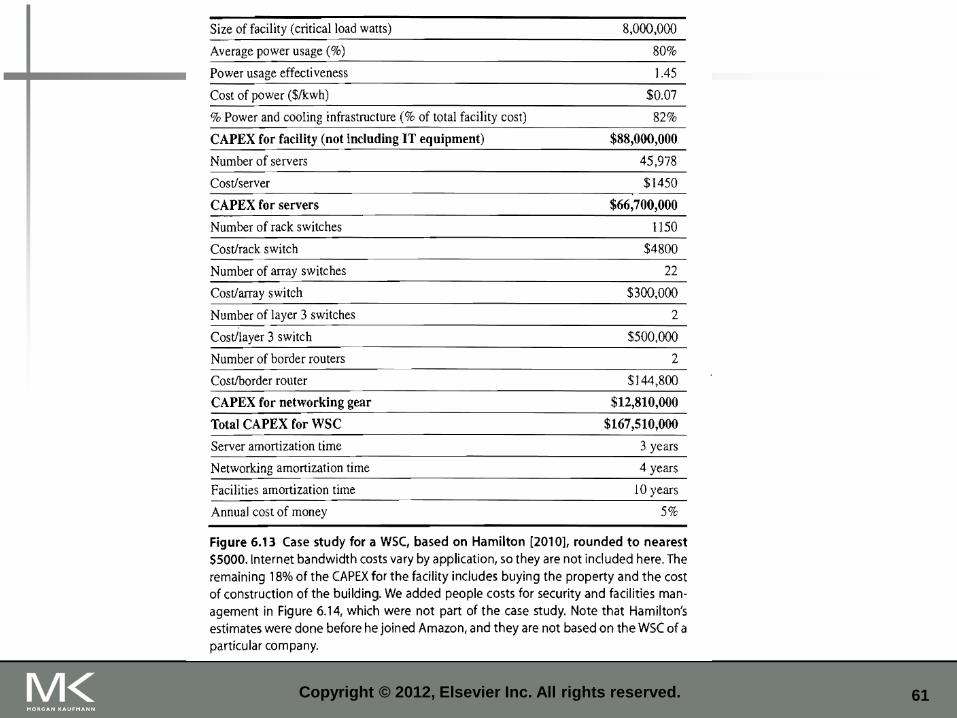
WSC costs
Capital expenditures (CAPEX) Cost to build a WSC
Operational expenditures (OPEX) Cost to operate a WSC
Physcic
al In
frastrc
utu
re a
nd C
osts
of W
SC
60
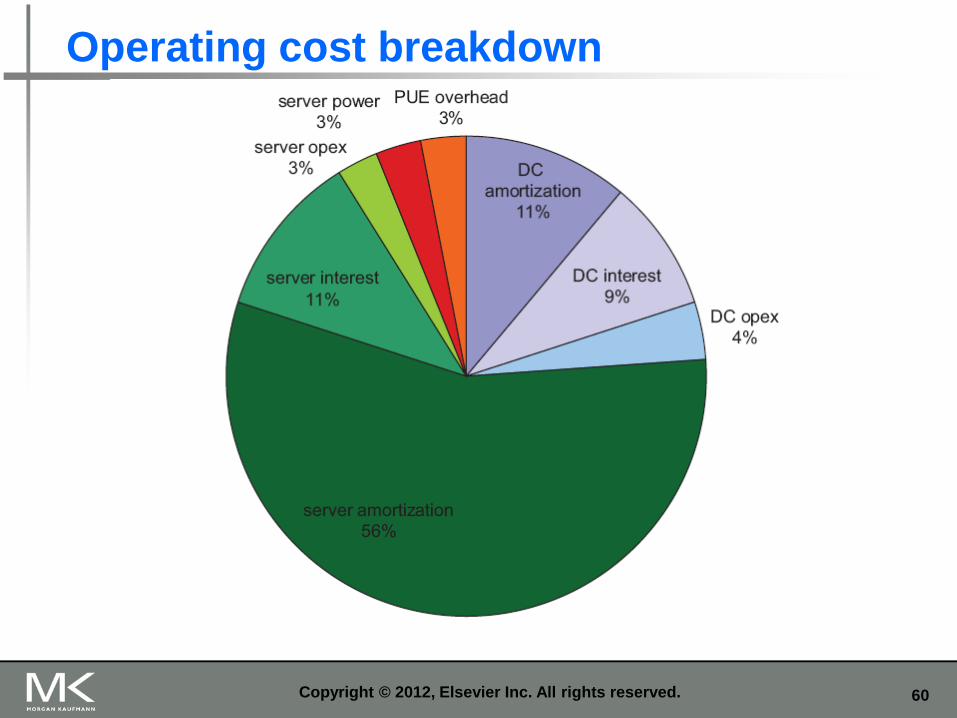
Operating cost breakdown
Copyright © 2012, Elsevier Inc. All rights reserved.
61 Copyright © 2012, Elsevier Inc. All rights reserved.
62
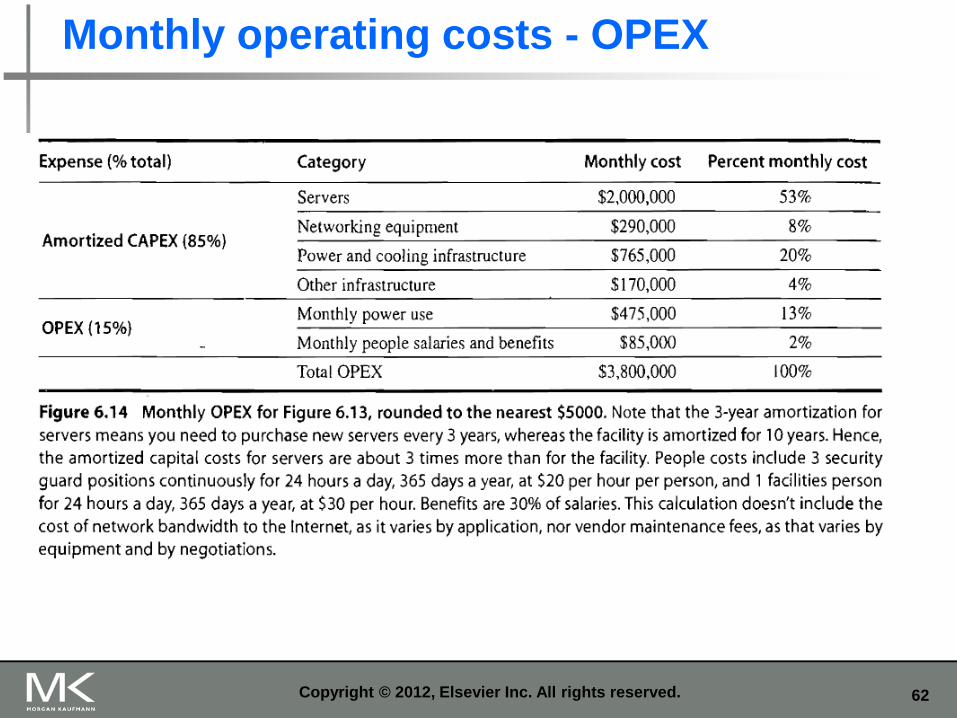
Monthly operating costs - OPEX
Copyright © 2012, Elsevier Inc. All rights reserved.
63 Copyright © 2012, Elsevier Inc. All rights reserved.
Cloud computing
WSCs offer economies of scale that cannot be achieved with a datacenter:
5.7 times reduction in storage costs
7.1 times reduction in administrative costs
7.3 times reduction in networking costs
This has given rise to cloud services such as AWS (Amazon Web Services) “Utility Computing”
Based on using open source virtual machine and operating system software
Clo
ud C
om
putin
g
64 Copyright © 2012, Elsevier Inc. All rights reserved.
65
Fallacies
1. CSPs (Cloud Service Providers) are loosing money.
Statistics show that the average income at AWS is
$0.55/hour for reserved instances $0.45 for on-demand
Gross margins are 75% - 80%
2. Capital costs of a WSC facility are higher than for the servers it hosts.
The servers need to be replaced every 3-4 years
The facility lasts 10-15 years
The amortization makes a difference
3. Improved DRAMS availability and software based fault-tolerance
diminish the need for ECC memory in a WSC
Measurements show that 1/3 of the servers experience memory
errors with 22,000 correctable and 1 uncorrectable errors/year, one
error is corrected every 2.5 hours
4. Turning off servers during periods of low activity improves WSC cost
performance.
Copyright © 2012, Elsevier Inc. All rights reserved.