Embed Size (px)
Citation preview
Author: Will Graham
Financial Conduct Authority
A quantitative analysis of victims of
investment crime
Executive Summary
Project description and aims
This report presents the findings from the first phase of a project designed to help us
proactively combat investment fraud. The aim of the project was threefold:
To develop insight into the characteristics of victims of financial crime.
To support the training and development needs of financial crime investigators.
To develop proactive interventions (e.g. communication campaigns) delivered to
specific groups/specific locations.
In order to achieve these goals, the project has two distinct phases: quantitative analysis and
qualitative research. This report relates to the quantitative analysis.
Quantitative analysis methodology
We commissioned Experian to carry out an analysis of the geographic, demographic and
socio-economic profile of victims of investment fraud using 11,359 individual records. This
provided us with an understanding of which individuals are most vulnerable to investment
fraud. The different types of investment fraud captured in the data included share fraud,
recovery fraud, pyramid schemes, as well as carbon credits, fine wines, rare earth metals and
land banking.
Quantitative analysis findings
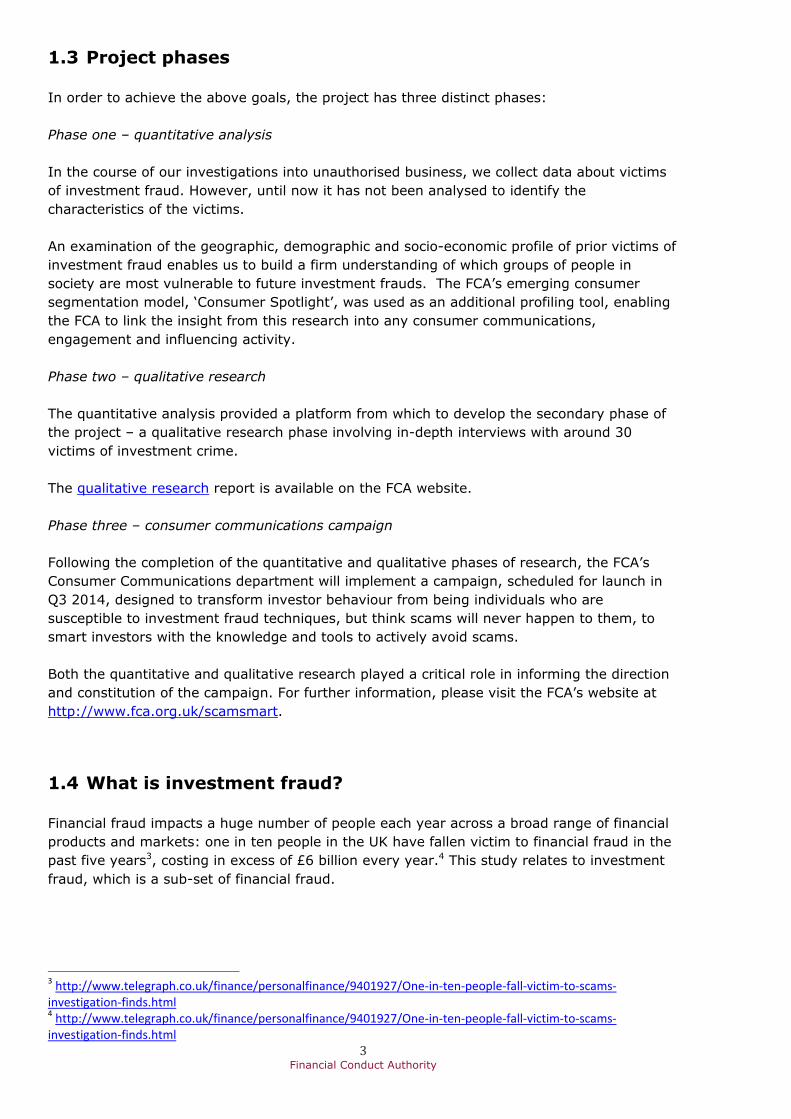
Analysis of the quantitative data gave a robust, empirical understanding of the profile of
victims of investment fraud. It found that victims tended to be wealthy, financially
sophisticated males with an escalating correlation to older ages. There was particularly strong
representation from residents of the South or East of England, and from either very urban or
very rural locations.
The FCA consumer segmentation model, Consumer Spotlight, was applied to the results.
There was very strong representation from the ‘Retired with Resources’, ‘Affluent and
Ambitious’ and ‘Mature and Savvy’ segments. For example, the Retired with Resources
segment (more likely to be over 65 with savings in excess of £10,000) were 3.5 times more
likely to be victimised, and the Mature and Savvy segment (more likely to be highly
educated, middle-aged males) were 2.5 times more likely to be victimised.
2 Financial Conduct Authority
These findings largely reinforced investment crime investigators’ anecdotal experiences,
however the analysis also offered some surprises – such as the over-representation of
income brackets as low as £10,000-£14,999 a year, or the high vulnerability to recovery
fraud of women and the ‘Retired on a Budget’ segment.
Intended project outcomes
It is hoped that the outputs from this project will lead to improved consumer outcomes by
providing an understanding of the profile, behaviour and vulnerabilities of victims of
investment fraud. This insight enables us to develop and target interventions aimed at
increasing the proportion of investors who take proper measures when considering an
investment, including; being wary of any firm attempting to make cold calls, verifying the
authenticity of a firm via appropriate channels (e.g. by contacting the FCA or the Police),
ensuring they have appropriate protections in place, and making sure any evidence of fraud
is reported to the authorities.
1.1 Introduction This report sets out the project overview identifying the rationale and methodology for this
phase of the project. It introduces the main types of investment fraud, and provides analysis
of investment fraud victim characteristics.
1.2 Aims and purpose of this project The FCA receives 5,000 calls a year about suspected investment frauds. 20% of the investors
had already paid money to fraudsters; it takes an average of four calls before people contact
the FCA.1 This project was therefore designed to achieve several aims to enable the FCA to
make earlier interventions to disrupt investment fraud.
The project’s aims support the FCA’s consumer protection objective and demonstrate the
FCA’s proactive approach to tackling investment fraud. These aims can be summarised as
follows:
1. Improved victim profiling. Many studies of investment fraud have sought to analyse
the fraudsters themselves – who they are, what type of schemes they run, and how to
restrain them. However, very few studies have sought to focus on who the victims of
investment fraud are. This project will help the FCA and its partners understand which
specific sectors of society are particularly at risk for each type of investment crime.
2. Earlier and more proactive interventions. We hope that the project will enable us to
develop more advanced techniques to intervene in investment frauds earlier and more
often than at present. Just 10% of investment crimes are believed to be reported;2 we
hope that this publication and our subsequent communication activity will enhance
awareness among investors of the actions they can take to protect themselves against
fraudsters. These actions include engaging with the FCA and other crime-fighting
organisations at as early a stage in the process as possible.
3. Better training. The findings will support the training and development needs of
investment fraud investigators. Conducting both qualitative and quantitative studies
affords us the opportunity to challenge, as well as verify, assumptions about the
nature of victims of investment fraud. We are able to draw out nuanced insights which
may not be immediately obvious to investigators equipped only with anecdotal
knowledge.
1 http://www.fca.org.uk/consumers/scams/investment-scams/share-fraud-and-boiler-room-scams 2 http://www.actionfraud.police.uk/thedevilsintheirdetails-overconfident-uk-investors-fall-prey-to-1.2bn-of-fraud-nov12
3 Financial Conduct Authority
1.3 Project phases
In order to achieve the above goals, the project has three distinct phases:
Phase one – quantitative analysis
In the course of our investigations into unauthorised business, we collect data about victims
of investment fraud. However, until now it has not been analysed to identify the
characteristics of the victims.
An examination of the geographic, demographic and socio-economic profile of prior victims of
investment fraud enables us to build a firm understanding of which groups of people in
society are most vulnerable to future investment frauds. The FCA’s emerging consumer
segmentation model, ‘Consumer Spotlight’, was used as an additional profiling tool, enabling
the FCA to link the insight from this research into any consumer communications,
engagement and influencing activity.
Phase two – qualitative research
The quantitative analysis provided a platform from which to develop the secondary phase of
the project – a qualitative research phase involving in-depth interviews with around 30
victims of investment crime.
The qualitative research report is available on the FCA website.
Phase three – consumer communications campaign
Following the completion of the quantitative and qualitative phases of research, the FCA’s
Consumer Communications department will implement a campaign, scheduled for launch in
Q3 2014, designed to transform investor behaviour from being individuals who are
susceptible to investment fraud techniques, but think scams will never happen to them, to
smart investors with the knowledge and tools to actively avoid scams.
Both the quantitative and qualitative research played a critical role in informing the direction
and constitution of the campaign. For further information, please visit the FCA’s website at
http://www.fca.org.uk/scamsmart.
1.4 What is investment fraud?
Financial fraud impacts a huge number of people each year across a broad range of financial
products and markets: one in ten people in the UK have fallen victim to financial fraud in the
past five years3, costing in excess of £6 billion every year.4 This study relates to investment
fraud, which is a sub-set of financial fraud.
3 http://www.telegraph.co.uk/finance/personalfinance/9401927/One-in-ten-people-fall-victim-to-scams-investigation-finds.html 4 http://www.telegraph.co.uk/finance/personalfinance/9401927/One-in-ten-people-fall-victim-to-scams-investigation-finds.html
4 Financial Conduct Authority
Investment fraud can be defined as the illegal activity of providing false information to
someone so that they will invest in something.5 Fraudsters contact unsuspecting individuals
and offer them exciting investment opportunities with seemingly very high returns. However,
the investments turn out be non-existent, impossible to sell, or worthless. Every year in the
UK, an estimated £1.2 billion6 is lost to investment frauds, with an average loss of £20,000
per investor.7 Investment frauds include:
Share fraud occurs where a fraudster sells worthless or unsaleable shares from call
centres known as ‘boiler rooms’, typically using high-pressure sales techniques. This
represents the most common form of investment fraud seen by the FCA.
Recovery fraud occurs when fraudsters contact a previous investment fraud victim,
and offer to recover their lost investment – in exchange for an advance fee. The
victim is thus defrauded twice as no genuine attempt to recover the original funds is
ever made.
Pyramid or Ponzi schemes are multiple-investor structures whereby capital
received from new investors is used to pay returns to existing investors, creating the
illusion of high profitability.
Pension liberation fraud takes place when people are encouraged to access their
pension before retirement, without being properly informed of the potentially severe
tax consequences (for most people the likely result is a tax bill of more than half of
the pension's value). The fraudsters charge consumers a fee for facilitating the
transaction.
Carbon credits are commercial permits to emit carbon dioxide. They can be traded,
however selling carbon credits is extremely difficult for individual investors as they
tend to be purchased in very high quantities by buying firms.8
Fine wines. Rogue wine traders sell people investments in wine which is either not
the vintage quality it is claimed to be, or simply does not exist in the first place.
Trading in wine before it is bottled and released to the market (known as en primeur
wine) is particularly open to exploitation by fraudsters as it is not usually delivered
until two to three years after the vintage.9
Rare earth metals – chemical elements used in the manufacture of products like
computers and mobile phones are not a viable market for retail investors as they are
almost always bought in very large quantities by manufacturing companies. This
makes it highly unlikely they will deal with small independent retail consumers.10
Land banking. Land banking companies divide land into smaller plots to sell it to
investors on the basis that once it is available for development it will increase in
value.11 However, the land is often in areas of natural beauty or historical interest,
with little chance of it being built on.
Foreign exchange trading fraud occurs whereby investors are persuaded that high
profitability exists in the foreign exchange market, when in reality the market for
foreign exchange is a ‘negative-sum game’12 for individual speculators once brokerage
commissions and transaction costs are factored in.
5 http://dictionary.cambridge.org/dictionary/business-english/investment-fraud 6 http://www.actionfraud.police.uk/thedevilsintheirdetails-overconfident-uk-investors-fall-prey-to-1.2bn-of-fraud-nov12 7 http://www.fsa.gov.uk/library/communication/pr/2006/053.shtml 8 http://www.fca.org.uk/consumers/scams/investment-scams/carbon-credit-trading 9 http://content.met.police.uk/Article/Investing-in-fine-wine/1400013278591/1400013278591 10 http://www.fca.org.uk/consumers/scams/investment-scams/rare-earth-metals 11 http://www.fca.org.uk/consumers/scams/investment-scams/land-banking 12 A negative-sum game occurs when the sum of winnings (positives) and losses (negatives) is negative.
5 Financial Conduct Authority
1.5 The FCA’s role in fighting financial crime
We have an overarching strategic objective of ensuring markets function well. To support this
we have three operational objectives: to secure an appropriate degree of protection for
consumers; to protect and enhance the integrity of the UK financial system; and, to promote
effective competition in the interests of consumers.
An important part of our work is to shut down illegal investment scams perpetrated by rogue
operators, many of whom ride on the coat-tails of the reputations of legitimate investment
managers and stockbrokers. Many go so far as to try to pass themselves off as well-known
FCA-authorised businesses, using identical or similar names and copycat web addresses to
those of long-established City firms. Those who invest their money with businesses that are
unregulated are not protected by the Financial Services Compensation Scheme, and all too
frequently lose all their money.
Overall, however, the trend for investment fraud shows a steady decline – which we attribute
in part to the efforts we, and law enforcement partners in the UK and overseas, have put into
making life more difficult for the fraudsters and to educating potential victims about the risks.
Conducting investigations and prosecutions in response to reports of investment fraud is key
to achieving our objectives. The Financial Services and Markets Act 2000 gave the FCA
powers to investigate and prosecute unauthorised business cases. These powers have been
deployed in recent years with notable successes – for example, an investigation in 2009 by
the Financial Services Authority13
and City of London Police exposed a boiler room scam that
defrauded an estimated 1,700 investors of a total £27.5 million.14
Meanwhile in February
2014, 110 people were arrested following ‘Operation Rico’15
, a two-year, multi-jurisdiction
investigation.
Just a few years ago, 60% of the 5,000 investors who contact us each year had already paid
money to the criminals;16 this figure has since dropped to about 20%. We are making
significant progress, but there is still a great deal left to accomplish. We hope to encourage
even more investors to contact us before committing to an investment, giving us the
opportunity to intervene in the fraud process before investors transfer funds which may be
very difficult, or impossible, to recover.
Part of the funding for this project was derived from the Home Office Asset Recovery
Incentivisation Scheme (ARIS), which enables the FCA, as a criminal investigation and
prosecution authority, to benefit from a percentage of the monies recovered from its criminal
investigations and the associated Proceeds of Crime Confiscation Orders, for the purpose of
mitigating the impact of financial crime.
1.6 Methodology
We retain details of every reported incident of investment crime, including the victims’
personal details such as name, age, and address. These records were collated into a master
13 The Financial Services Authority (FSA) was the predecessor to the Financial Conduct Authority (FCA). 14 http://www.fsa.gov.uk/library/communication/pr/2011/073.shtml 15 http://www.bbc.co.uk/news/uk-26367166 16 http://www.fca.org.uk/consumers/scams/investment-scams/share-fraud-and-boiler-room-scams
6 Financial Conduct Authority
database. To ensure that the findings would not be outdated or obsolete, records were only
taken from the preceding two years and only from cases that were closed.
The legal basis for collating and analysing victim data comes from using the data to improve
the ‘information or advice’ the FCA can give under Section 157 of the Financial Services and
Markets Act 200017 to further our consumer protection and financial crime objectives. The
data was handled at all times with due consideration of the Data Protection Act18, particularly
when transferring personal data to and from third parties.
Non-UK residents were excluded from the database as it was only possible to cross-reference
the data with UK addresses. Incomplete records were also eliminated to ensure maximum
accuracy. Approximately 3,400 complete records remained, though they did not provide a
sufficiently representative sample of the population to deliver robust statistical insights. In
order to increase the sample size, the FCA approached the City of London Police (CoLP), who
supplied around 8,000 further records from their databases, again drawn exclusively from the
preceding two years.
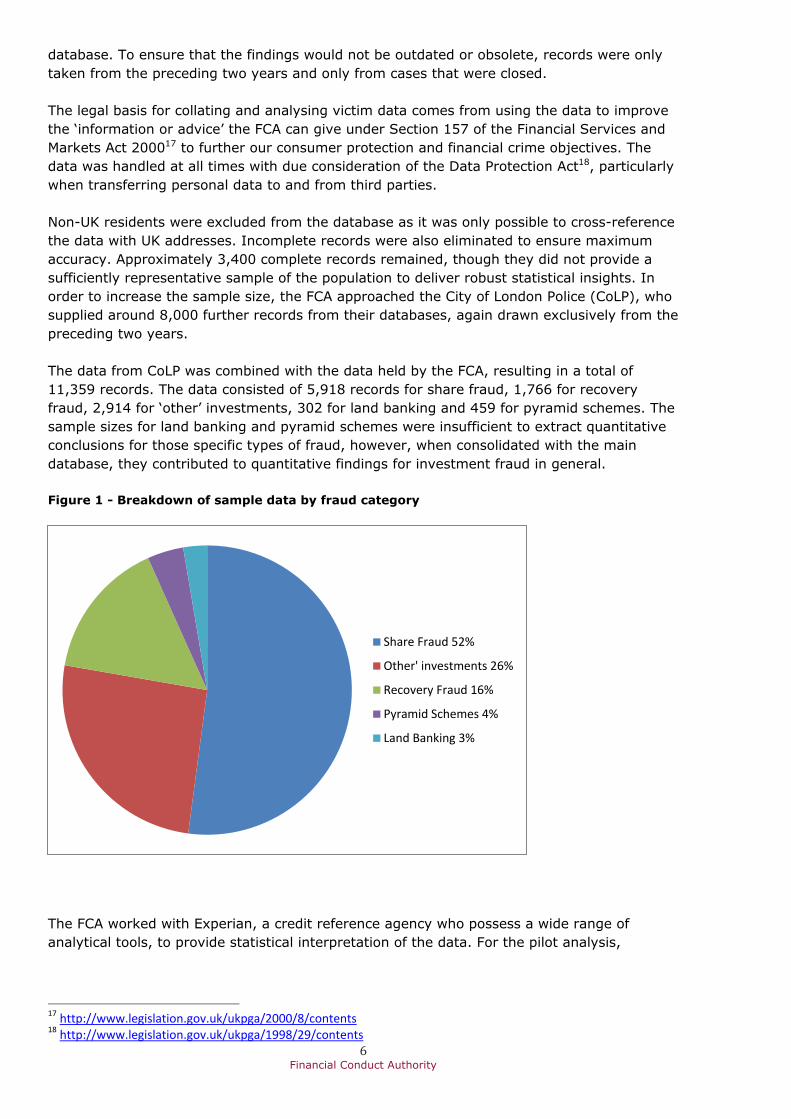
The data from CoLP was combined with the data held by the FCA, resulting in a total of
11,359 records. The data consisted of 5,918 records for share fraud, 1,766 for recovery
fraud, 2,914 for ‘other’ investments, 302 for land banking and 459 for pyramid schemes. The
sample sizes for land banking and pyramid schemes were insufficient to extract quantitative
conclusions for those specific types of fraud, however, when consolidated with the main
database, they contributed to quantitative findings for investment fraud in general.
Figure 1 - Breakdown of sample data by fraud category
The FCA worked with Experian, a credit reference agency who possess a wide range of
analytical tools, to provide statistical interpretation of the data. For the pilot analysis,
17 http://www.legislation.gov.uk/ukpga/2000/8/contents 18 http://www.legislation.gov.uk/ukpga/1998/29/contents
Share Fraud 52%
Other' investments 26%
Recovery Fraud 16%
Pyramid Schemes 4%
Land Banking 3%
7 Financial Conduct Authority
Experian correlated the data with its consumer database19, which holds extensive information
on 45 million UK customers.
Experian correlated the 11,359 records with its consumer database and the FCA’s Consumer
Spotlight segmentation model.20 This facilitated the in-depth profiling of the victims by a
variety of personal and household demographics, including: age, gender, wealth,
geographical location (region and urban/rural), household composition, employment status,
financial sophistication, income, financial stress, and FCA Consumer Spotlight segment.
2. Main findings This section presents the key findings describing the geography, characteristics and
demographics of the victims of investment fraud in the UK. Analysis of criteria such as age,
gender, employment status, income and location is followed by an analysis of consumer
segments, and finally, a comparison between the different types of fraud to pick out any
characteristics which are unique to a certain type of investment crime.
The trends seen in this section can be inferred to be relevant for investors generally, rather
than just victims of investment crime – a comparison of demographic profiles between
victims and non-victims would be unlikely to show significant differences as many victims are
experienced investors with existing shareholdings.
19 Experian’s consumer database retains information on UK consumers including: postcode addresses, electoral register, address links, aliases and associations, public information (e.g. bankruptcies, County Court Judgments etc.), previous credit searches, credit account records, telephone numbers, CIFAS fraud reports, repossessions history, postal redirection addresses, accommodation addresses, sanctions data, mortality data, CitizenCard information and Gone Away Information Network data. 20 See Appendix 3 for further information
8 Financial Conduct Authority
2.1 Demographics The index charts in this section show whether there are proportionally more or fewer of each
type in the sample population (i.e. investors included in the study) compared to the wider UK
population. A value over 100 means there are proportionally more in the target group than
there are in the broader UK population. A value of 200 would mean there are proportionally
twice as many in the target group as there are in the broader UK population. Conversely, a
value of 50 would mean there are half as many in the target group as there are in the
broader UK population. Unless stated, the sample population for each finding is 11,359.
2.1.1 Key characteristics of investment fraud victims The following charts describe the key characteristics of investment fraud victims: age,
gender, employment status and level of income.
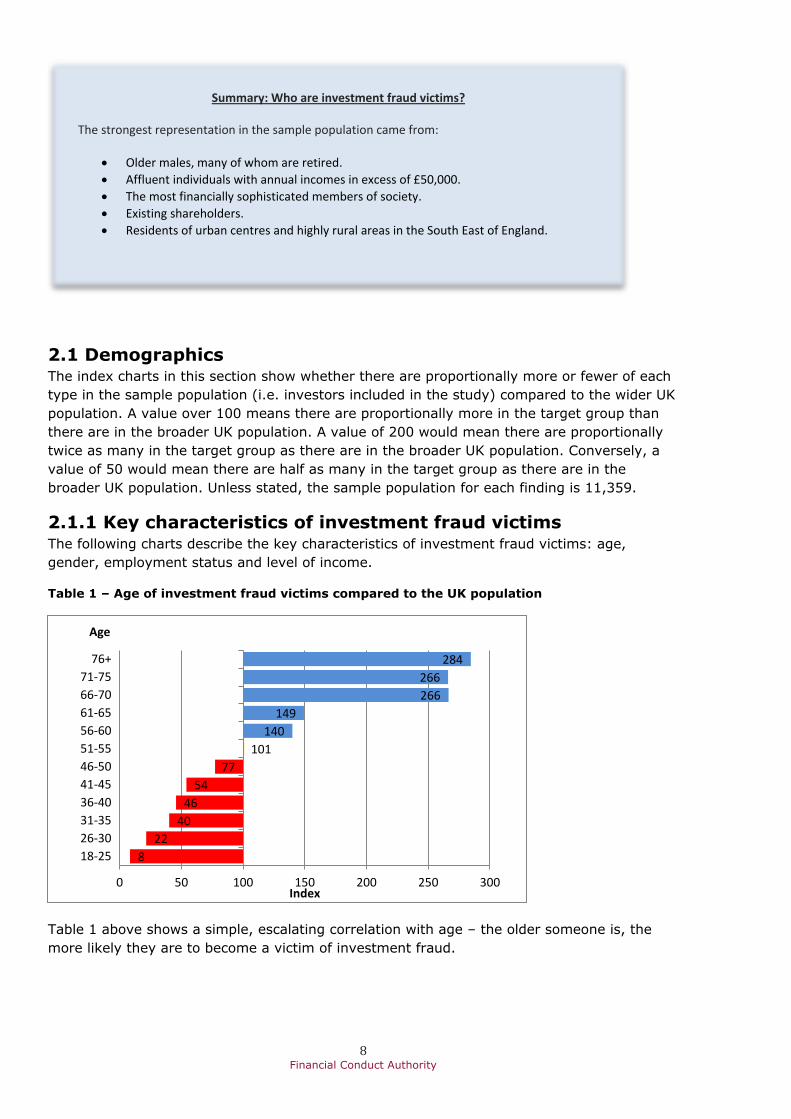
Table 1 – Age of investment fraud victims compared to the UK population
Table 1 above shows a simple, escalating correlation with age – the older someone is, the
more likely they are to become a victim of investment fraud.
8
22
40
46
54
77
101
140
149
266
266
284
0 50 100 150 200 250 300
18-25
26-30
31-35
36-40
41-45
46-50
51-55
56-60
61-65
66-70
71-75
76+
Index
Age
Summary: Who are investment fraud victims?
The strongest representation in the sample population came from:
Older males, many of whom are retired.
Affluent individuals with annual incomes in excess of £50,000.
The most financially sophisticated members of society.
Existing shareholders.
Residents of urban centres and highly rural areas in the South East of England.
9 Financial Conduct Authority
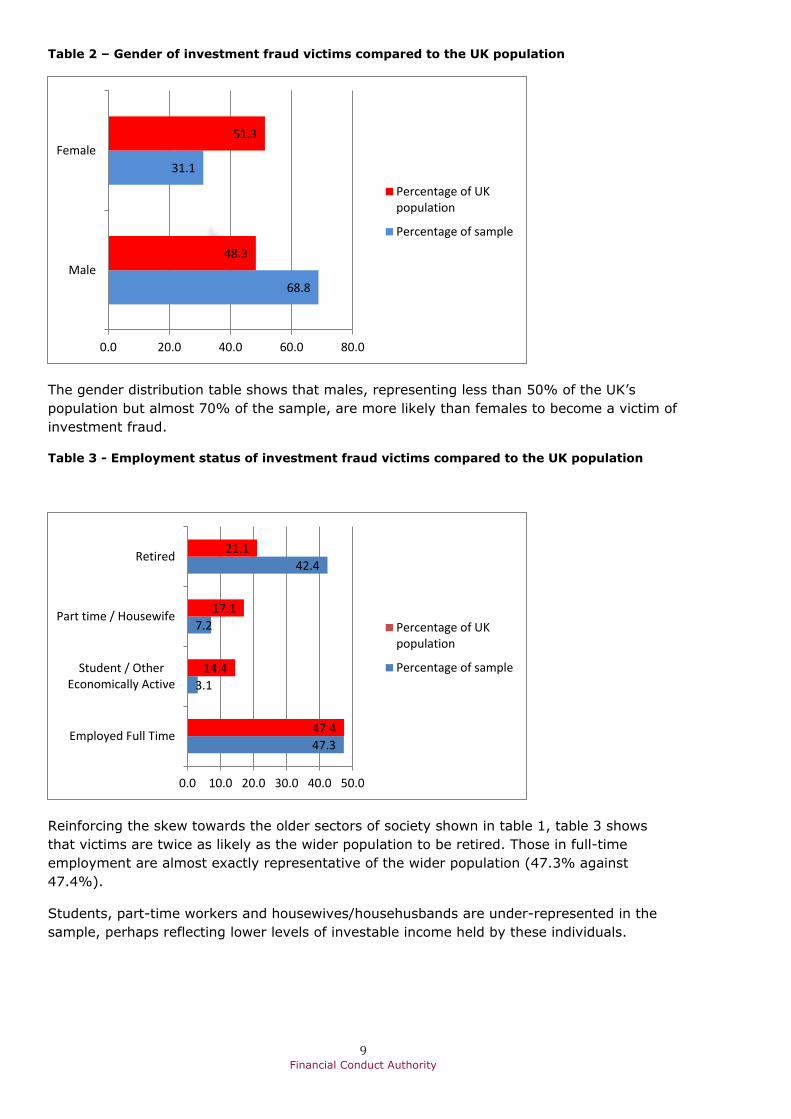
Table 2 – Gender of investment fraud victims compared to the UK population
The gender distribution table shows that males, representing less than 50% of the UK’s
population but almost 70% of the sample, are more likely than females to become a victim of
investment fraud.
Table 3 - Employment status of investment fraud victims compared to the UK population
Reinforcing the skew towards the older sectors of society shown in table 1, table 3 shows
that victims are twice as likely as the wider population to be retired. Those in full-time
employment are almost exactly representative of the wider population (47.3% against
47.4%).
Students, part-time workers and housewives/househusbands are under-represented in the
sample, perhaps reflecting lower levels of investable income held by these individuals.
68.8
31.1
48.3
51.3
0.0 20.0 40.0 60.0 80.0
Male
Female
Percentage of UKpopulation
Percentage of sample
47.3
3.1
7.2
42.4
47.4
14.4
17.1
21.1
0.0 10.0 20.0 30.0 40.0 50.0
Employed Full Time
Student / OtherEconomically Active
Part time / Housewife
Retired
Percentage of UKpopulation
Percentage of sample
10 Financial Conduct Authority
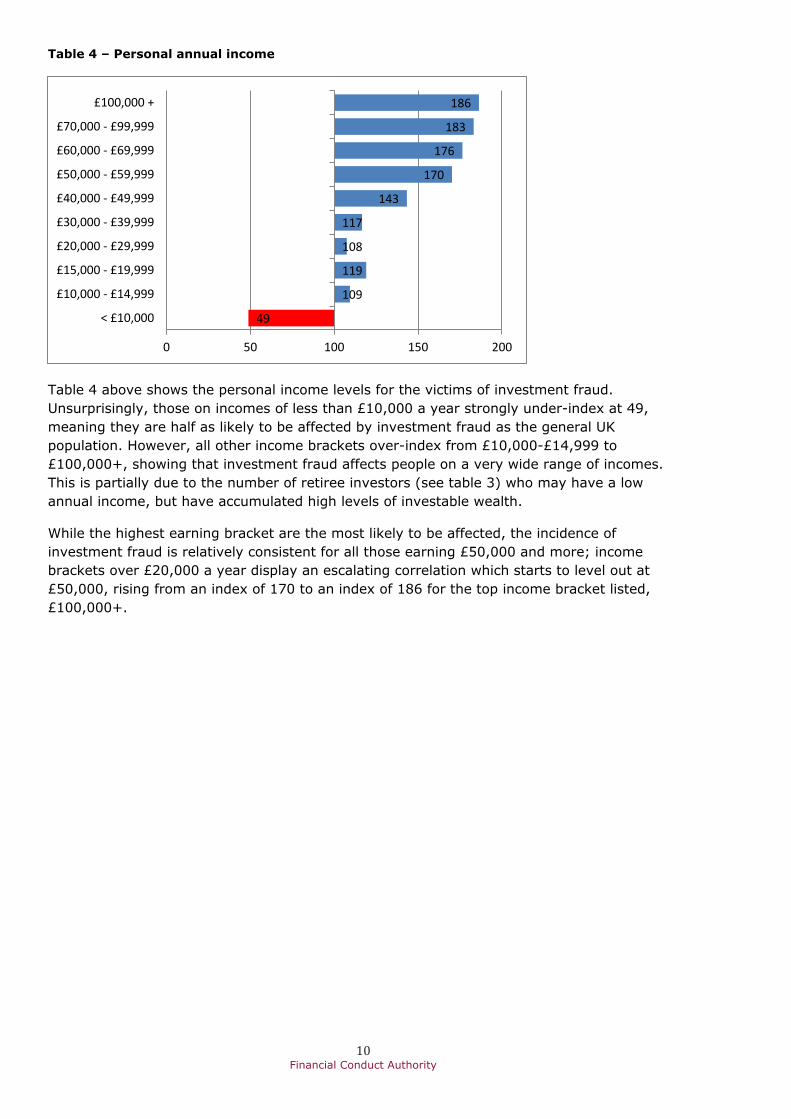
Table 4 – Personal annual income
Table 4 above shows the personal income levels for the victims of investment fraud.
Unsurprisingly, those on incomes of less than £10,000 a year strongly under-index at 49,
meaning they are half as likely to be affected by investment fraud as the general UK
population. However, all other income brackets over-index from £10,000-£14,999 to
£100,000+, showing that investment fraud affects people on a very wide range of incomes.
This is partially due to the number of retiree investors (see table 3) who may have a low
annual income, but have accumulated high levels of investable wealth.
While the highest earning bracket are the most likely to be affected, the incidence of
investment fraud is relatively consistent for all those earning £50,000 and more; income
brackets over £20,000 a year display an escalating correlation which starts to level out at
£50,000, rising from an index of 170 to an index of 186 for the top income bracket listed,
£100,000+.
49
109
119
108
117
143
170
176
183
186
0 50 100 150 200
< £10,000
£10,000 - £14,999
£15,000 - £19,999
£20,000 - £29,999
£30,000 - £39,999
£40,000 - £49,999
£50,000 - £59,999
£60,000 - £69,999
£70,000 - £99,999
£100,000 +
11 Financial Conduct Authority
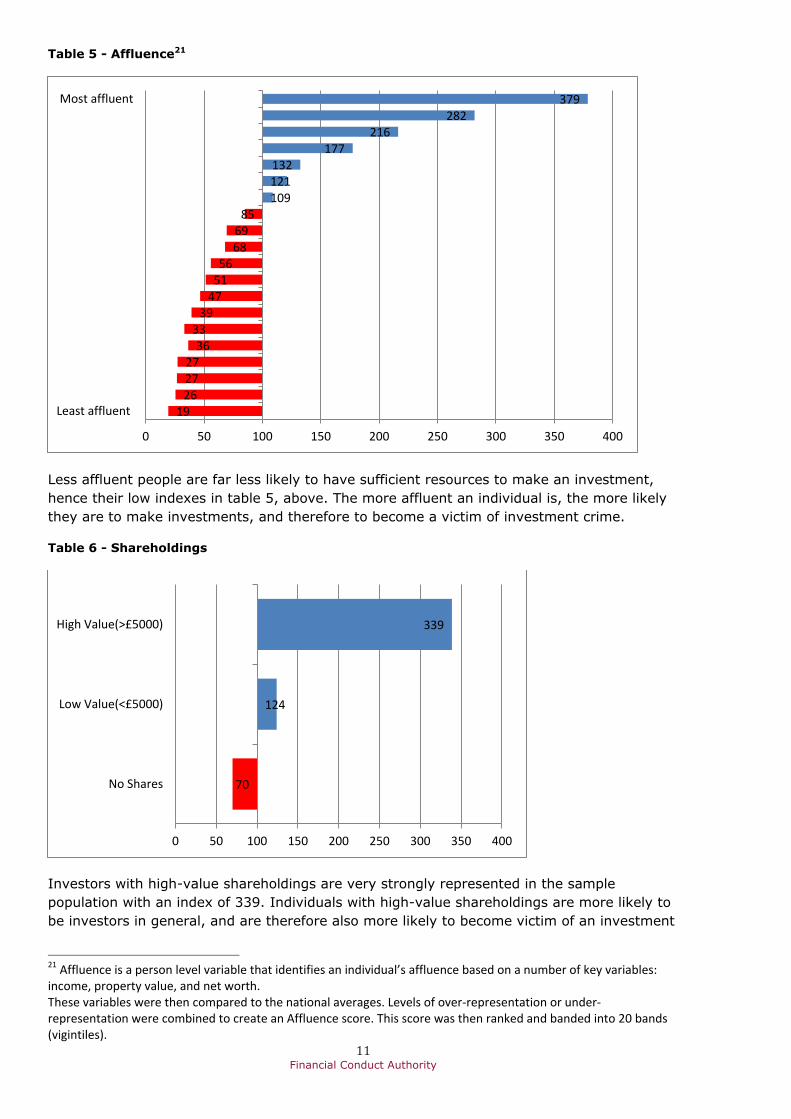
Table 5 - Affluence21
Less affluent people are far less likely to have sufficient resources to make an investment,
hence their low indexes in table 5, above. The more affluent an individual is, the more likely
they are to make investments, and therefore to become a victim of investment crime.
Table 6 - Shareholdings
Investors with high-value shareholdings are very strongly represented in the sample
population with an index of 339. Individuals with high-value shareholdings are more likely to
be investors in general, and are therefore also more likely to become victim of an investment
21 Affluence is a person level variable that identifies an individual’s affluence based on a number of key variables: income, property value, and net worth. These variables were then compared to the national averages. Levels of over-representation or under-representation were combined to create an Affluence score. This score was then ranked and banded into 20 bands (vigintiles).
19 26 27 27
36 33
39 47 51 56
68 69
85 109 121 132
177 216
282 379
0 50 100 150 200 250 300 350 400
Least affluent
Most affluent
70
124
339
0 50 100 150 200 250 300 350 400
No Shares
Low Value(<£5000)
High Value(>£5000)
12 Financial Conduct Authority
fraud. It is believed that boiler rooms often use a company shareholder index as a list of
people to contact22, further increasing the likelihood that victims will be already be
shareholders.
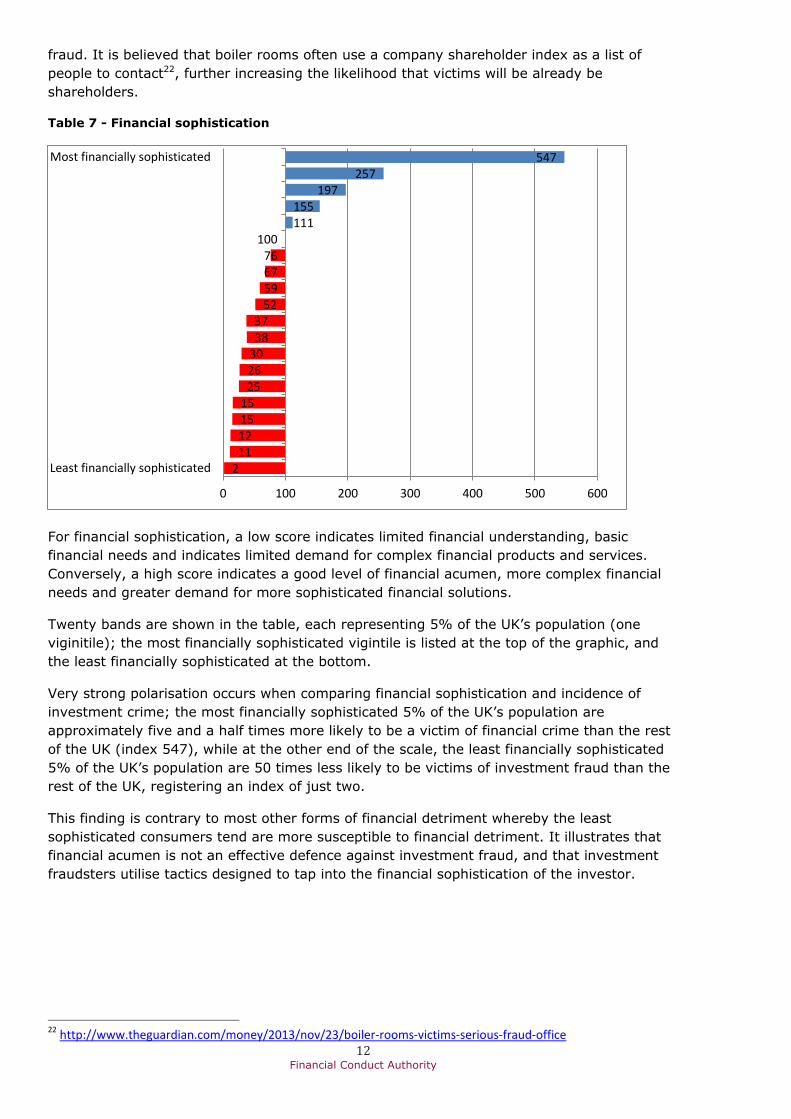
Table 7 - Financial sophistication
For financial sophistication, a low score indicates limited financial understanding, basic
financial needs and indicates limited demand for complex financial products and services.
Conversely, a high score indicates a good level of financial acumen, more complex financial
needs and greater demand for more sophisticated financial solutions.
Twenty bands are shown in the table, each representing 5% of the UK’s population (one
viginitile); the most financially sophisticated vigintile is listed at the top of the graphic, and
the least financially sophisticated at the bottom.
Very strong polarisation occurs when comparing financial sophistication and incidence of
investment crime; the most financially sophisticated 5% of the UK’s population are
approximately five and a half times more likely to be a victim of financial crime than the rest
of the UK (index 547), while at the other end of the scale, the least financially sophisticated
5% of the UK’s population are 50 times less likely to be victims of investment fraud than the
rest of the UK, registering an index of just two.
This finding is contrary to most other forms of financial detriment whereby the least
sophisticated consumers tend are more susceptible to financial detriment. It illustrates that
financial acumen is not an effective defence against investment fraud, and that investment
fraudsters utilise tactics designed to tap into the financial sophistication of the investor.
22 http://www.theguardian.com/money/2013/nov/23/boiler-rooms-victims-serious-fraud-office
2 11 12 15 15
25 26 30 38 37
52 59 67 76
100 111 155
197 257
547
0 100 200 300 400 500 600
Least financially sophisticated
Most financially sophisticated
13 Financial Conduct Authority
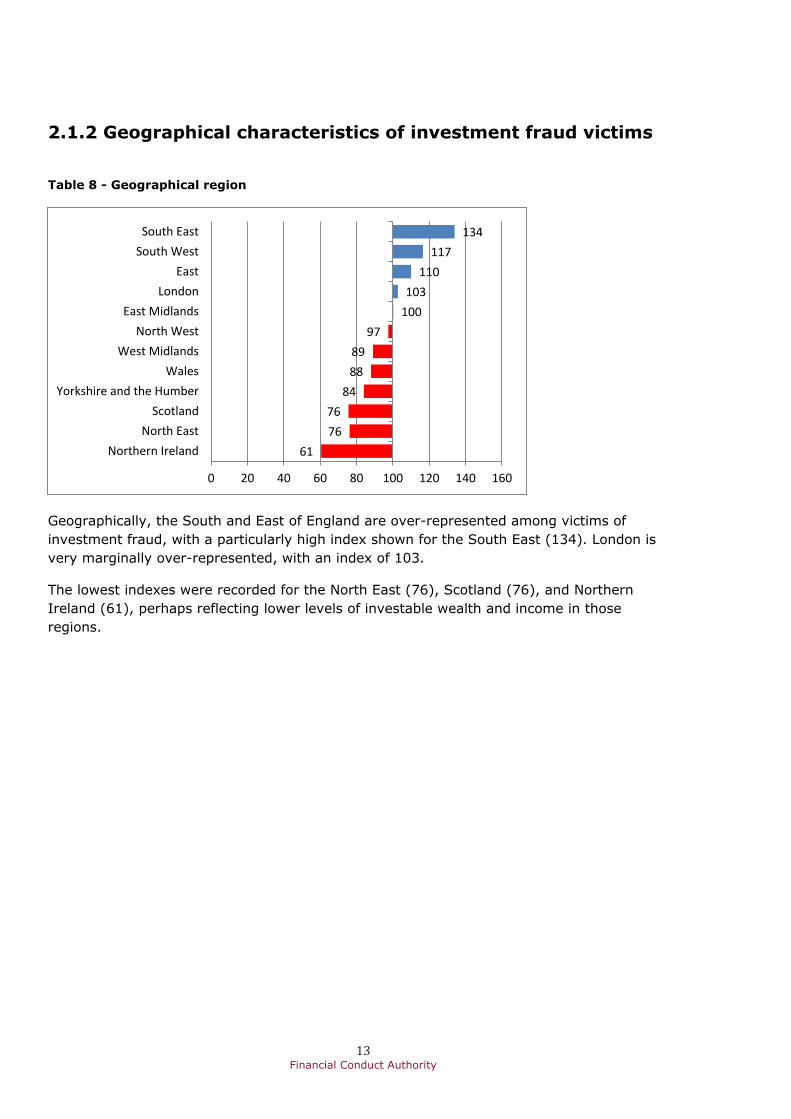
2.1.2 Geographical characteristics of investment fraud victims
Table 8 - Geographical region
Geographically, the South and East of England are over-represented among victims of
investment fraud, with a particularly high index shown for the South East (134). London is
very marginally over-represented, with an index of 103.
The lowest indexes were recorded for the North East (76), Scotland (76), and Northern
Ireland (61), perhaps reflecting lower levels of investable wealth and income in those
regions.
61
76
76
84
88
89
97
100
103
110
117
134
0 20 40 60 80 100 120 140 160
Northern Ireland
North East
Scotland
Yorkshire and the Humber
Wales
West Midlands
North West
East Midlands
London
East
South West
South East
14 Financial Conduct Authority
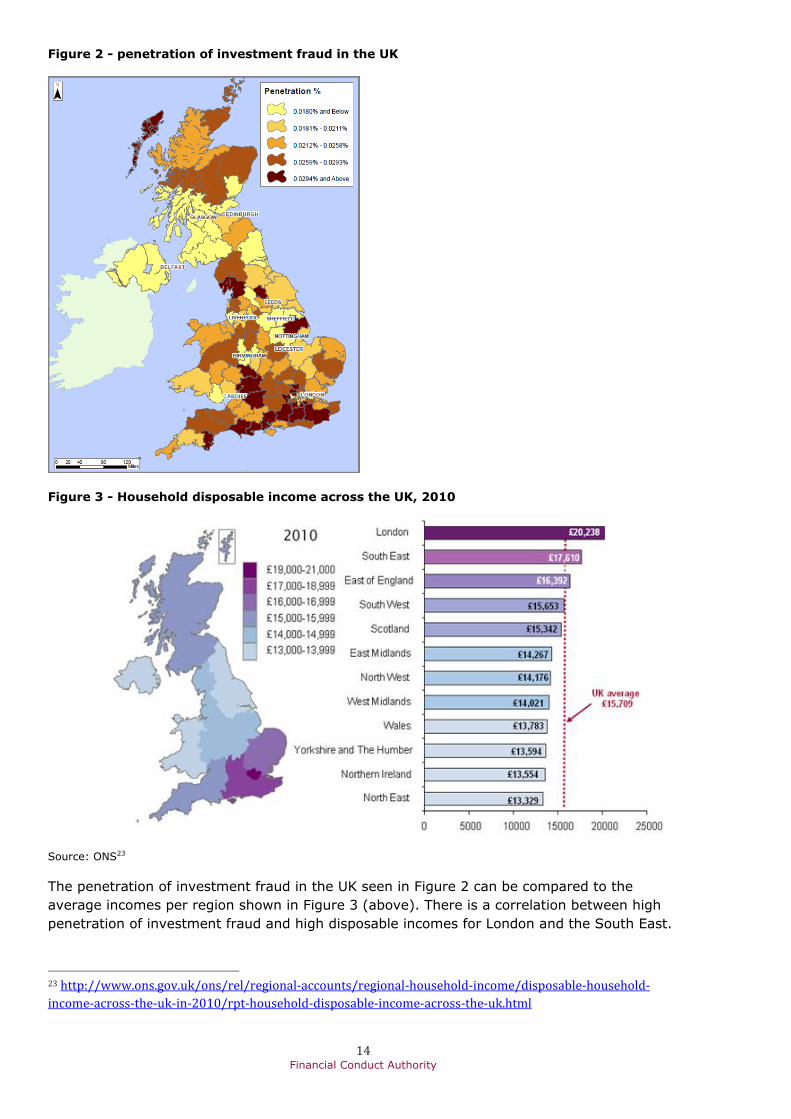
Figure 2 - penetration of investment fraud in the UK
Figure 3 - Household disposable income across the UK, 2010
Source: ONS23
The penetration of investment fraud in the UK seen in Figure 2 can be compared to the
average incomes per region shown in Figure 3 (above). There is a correlation between high
penetration of investment fraud and high disposable incomes for London and the South East.
23 http://www.ons.gov.uk/ons/rel/regional-accounts/regional-household-income/disposable-household-
income-across-the-uk-in-2010/rpt-household-disposable-income-across-the-uk.html

15 Financial Conduct Authority
However, when other regions are compared, the correlation weakens significantly and no firm
conclusions can be drawn.
Table 9 - rural/urban location24
Table 9 shows an interesting trend among the sample base – investors are far more likely to
live in either city centres, or highly rural areas. Urban centres index at 193 (town and city
centres) and 337 (large city centres), while extremely rural areas index at 176, and very
rural areas index at 154.
Meanwhile, some urban areas are far less well represented – mid urban (73), inner city living
(64), and city high-rise (54) residents all significantly under-index.
2.2 FCA Consumer Spotlight Segments In 2013 the FCA, in collaboration with Experian, built ‘Consumer Spotlight’, its own consumer
segmentation model (see Appendix 3). Experian applied the investment fraud victim data to
Consumer Spotlight to ascertain which segments were more, or less, affected by each type of
investment crime.
24 The Rural/Urban Code segments areas depending on the level of rurality/urbanity exhibited. Each postal sector and output area is classified into one of eleven types.
54
64
73
104
110
114
150
154
176
193
337
0 100 200 300 400
City High Rise
Inner City Living
Mid Urban
Outer Urban
Urban
Rural
Urban/Rural Edge
Very Rural
Extremely Rural
Town and City Centres
Large City Centres
16 Financial Conduct Authority
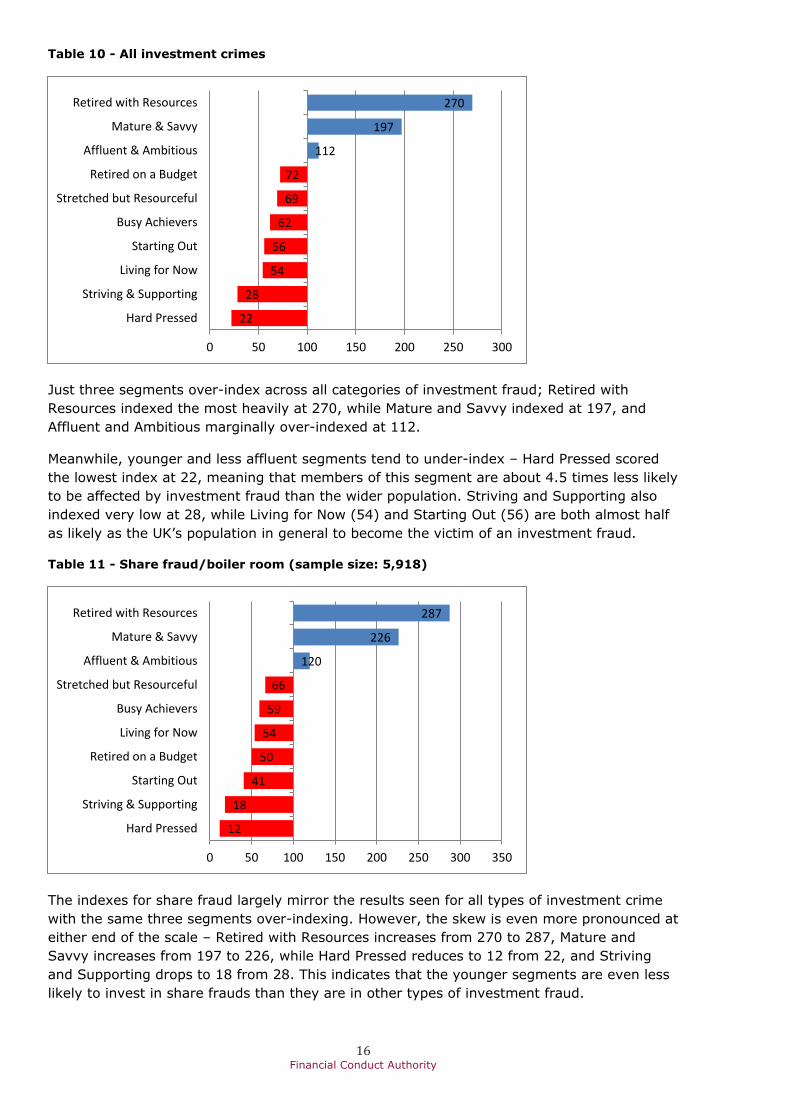
Table 10 - All investment crimes
Just three segments over-index across all categories of investment fraud; Retired with
Resources indexed the most heavily at 270, while Mature and Savvy indexed at 197, and
Affluent and Ambitious marginally over-indexed at 112.
Meanwhile, younger and less affluent segments tend to under-index – Hard Pressed scored
the lowest index at 22, meaning that members of this segment are about 4.5 times less likely
to be affected by investment fraud than the wider population. Striving and Supporting also
indexed very low at 28, while Living for Now (54) and Starting Out (56) are both almost half
as likely as the UK’s population in general to become the victim of an investment fraud.
Table 11 - Share fraud/boiler room (sample size: 5,918)
The indexes for share fraud largely mirror the results seen for all types of investment crime
with the same three segments over-indexing. However, the skew is even more pronounced at
either end of the scale – Retired with Resources increases from 270 to 287, Mature and
Savvy increases from 197 to 226, while Hard Pressed reduces to 12 from 22, and Striving
and Supporting drops to 18 from 28. This indicates that the younger segments are even less
likely to invest in share frauds than they are in other types of investment fraud.
22
28
54
56
62
69
72
112
197
270
0 50 100 150 200 250 300
Hard Pressed
Striving & Supporting
Living for Now
Starting Out
Busy Achievers
Stretched but Resourceful
Retired on a Budget
Affluent & Ambitious
Mature & Savvy
Retired with Resources
12
18
41
50
54
59
66
120
226
287
0 50 100 150 200 250 300 350
Hard Pressed
Striving & Supporting
Starting Out
Retired on a Budget
Living for Now
Busy Achievers
Stretched but Resourceful
Affluent & Ambitious
Mature & Savvy
Retired with Resources
17 Financial Conduct Authority
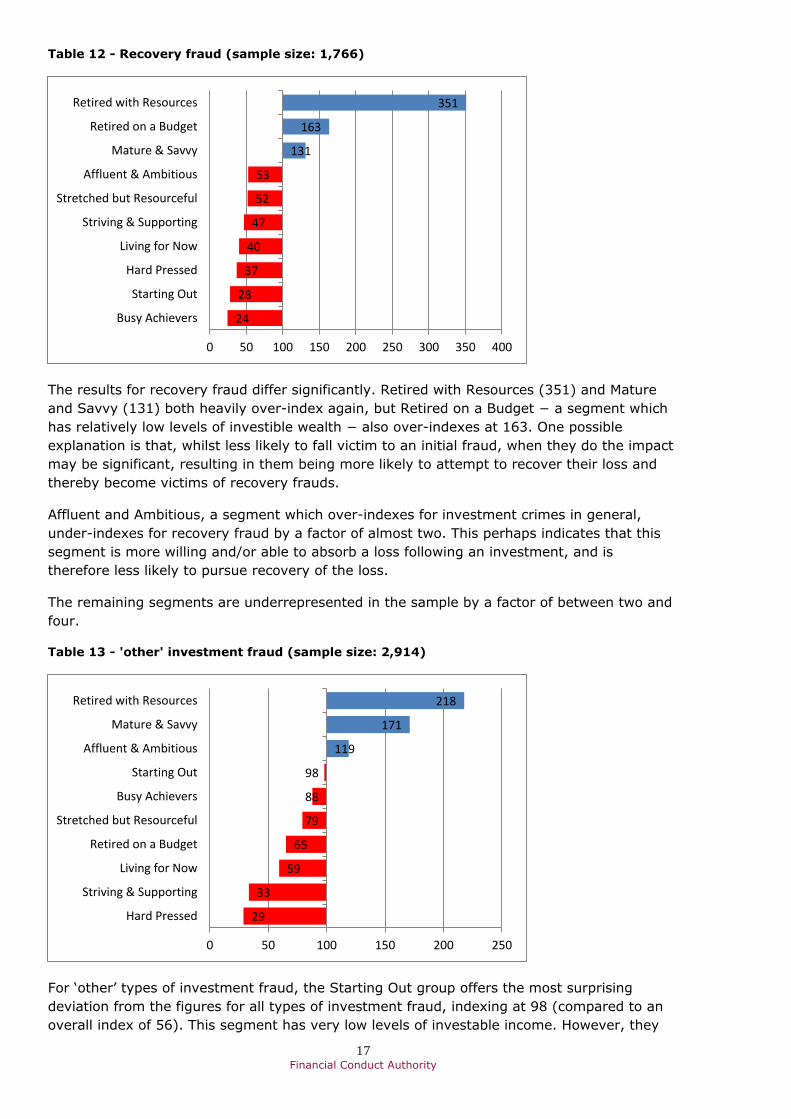
Table 12 - Recovery fraud (sample size: 1,766)
The results for recovery fraud differ significantly. Retired with Resources (351) and Mature
and Savvy (131) both heavily over-index again, but Retired on a Budget − a segment which
has relatively low levels of investible wealth − also over-indexes at 163. One possible
explanation is that, whilst less likely to fall victim to an initial fraud, when they do the impact
may be significant, resulting in them being more likely to attempt to recover their loss and
thereby become victims of recovery frauds.
Affluent and Ambitious, a segment which over-indexes for investment crimes in general,
under-indexes for recovery fraud by a factor of almost two. This perhaps indicates that this
segment is more willing and/or able to absorb a loss following an investment, and is
therefore less likely to pursue recovery of the loss.
The remaining segments are underrepresented in the sample by a factor of between two and
four.
Table 13 - 'other' investment fraud (sample size: 2,914)
For ‘other’ types of investment fraud, the Starting Out group offers the most surprising
deviation from the figures for all types of investment fraud, indexing at 98 (compared to an
overall index of 56). This segment has very low levels of investable income. However, they
24
28
37
40
47
52
53
131
163
351
0 50 100 150 200 250 300 350 400
Busy Achievers
Starting Out
Hard Pressed
Living for Now
Striving & Supporting
Stretched but Resourceful
Affluent & Ambitious
Mature & Savvy
Retired on a Budget
Retired with Resources
29
33
59
65
79
88
98
119
171
218
0 50 100 150 200 250
Hard Pressed
Striving & Supporting
Living for Now
Retired on a Budget
Stretched but Resourceful
Busy Achievers
Starting Out
Affluent & Ambitious
Mature & Savvy
Retired with Resources
18 Financial Conduct Authority
may be more likely to be persuaded by ‘get rich quick’ schemes as they have little experience
of financial services and seek to get a head start in life.
2.3 Variations between different types of investment fraud Each of the different types of investment fraud carries slight demographic variations when
compared to the wider sample base. These can be summarised as follows:
2.3.1 Share fraud
• Slightly more likely to be male than the wider sample base.
• Older profile than other victims.
• More affluent, sophisticated, higher net worth, income, shareholdings and assets.
• Much less likely to live in town/city centres.
• Lower levels of ‘financial stress’.
2.3.2 Fraud recovery
• Significantly more likely to be female than other frauds.
• Less affluent than other victims of investment fraud.
• Lower levels of income. The only two income brackets to over-index when victims of
fraud recovery are compared to the UK’s population are £10,000-£14,999 (index:
155) and £15,000-£19,999 (index: 140).
• Much less likely to be based in London (index: 61), town/city centres (index: 25) or
large city centres (index: 11).
• More likely to live in mid/outer urban areas.
2.3.3 Other investment fraud
• Much younger age profile.
• Lower levels of liquid and non-liquid assets as well as net worth.
• Much more likely to have recently moved home (less than a year’s residency index:
184).
• Far more likely to live in town and city centres (index: 249) or large city centres
(index: 291).
Conclusions and recommendations These quantitative findings broadly support the anecdotal evidence collected by organisations
that work against investment crime. The findings confirm that it is older, wealthier investors
– generally male – who are victims of investment fraud.
The findings also show that the more financially sophisticated a person is, the more likely
they are to become a victim of investment fraud. This highlights how highly evolved
fraudsters’ techniques are. It also demonstrates that it is not possible to protect yourself
against investment fraud simply by educating yourself on financial matters.
Where a person lives is also significant as an indicator of vulnerability to investment fraud.
London and the commuter belt across the South and East of England are most strongly
represented by victims of investment fraud. These areas have the highest levels of income in
the UK, meaning individuals here are more likely to make investments, and therefore become
victims to investment fraud. Meanwhile, those who live either in large urban centres, or
extremely rural areas, are much more likely to experience investment fraud than those who
live in suburban, or fairly rural, areas.
Discrepancies between the different categories of investment fraud were limited, with some
notable exceptions. For example, the weighting towards males was especially pronounced for
share fraud victims, while fraud recovery was more likely to affect women than other
categories. ‘Other’ investment types, including carbon credits, Ponzi schemes and land
banking, tend to affect a younger profile of investor.
19 Financial Conduct Authority
Finally, the population segments most likely to suffer from investment crimes are Mature and
Savvy, Retired with Resources, and Affluent and Ambitious. However, while the Retired on a
Budget segment was less likely to fall victim to investment fraud generally, they are
particularly prone to the ‘double-whammy’ of fraud recovery.
No investor is safe from investment fraud. It affects the most experienced investors, and the
least experienced investors. It affects richer investor profiles, but it also affects poorer
investor profiles. Discerning a fraud from a legitimate investment opportunity is not a simple
process.
What the quantitative analysis highlights is that no-one is immune from investment fraud
because of prior experience or success as an investor; fraudsters specifically look to exploit
investors’ over-confidence and use it against them.
Whilst these findings describe the key characteristics of victims of investment fraud and
provide a solid platform, they do not provide insights into victim attitudes and behaviours, or
the key touch points during their engagement with fraudsters.
These quantitative findings have therefore been used as a guide to help determine which
victims to include in a qualitative study. The qualitative phase of this project involves in-
depth interviews with 31 victims of investment fraud. It explores all of the key stages of
victims’ experiences with investment frauds, including how they were made to feel by
fraudsters, how they were persuaded to invest, and possible interventions which could have
been made to alter their investment decision-making process.
Acknowledgements The FCA would like to extend sincere gratitude to partner organisations who contributed to
this project, and who work with us to reduce the impact of investment fraud. These include:
Experian, the City of London Police, Action Fraud, the National Fraud Intelligence Bureau and
the National Fraud Authority.

20 Financial Conduct Authority
Appendix 1 – How to avoid investment scams
Investment scams come in many forms and with different tricks but a common feature is
being promised a high return or tax-free benefits. See the steps you can take to spot and
avoid investment scams.
Fraudsters might contact you out of the blue after taking your phone number from publicly
available shareholder lists. But the high-pressure sales tactics can also come by email, post,
word of mouth or at a seminar.
You might be told you could get inside information, trade secrets, a hot tip or special
expertise, often in overseas markets or in companies you have never heard of. But this
should be a warning sign that this could be a scam that will mean you lose most or all of the
investment.
To help you spot and avoid investment scams, follow these ten steps to protect yourself.
Step 1: Be firm in saying ‘no’
Keep in mind that authorised firms are unlikely to contact you out of the blue with
investment opportunities. A legitimate company is also unlikely to use harassment, high-
pressure sales tactics, or long and persistent phone calls, to get you to invest.
Be firm: if they can keep you talking, you have not really said ‘no’.
Step 2: Avoid unwanted sales calls
Reduce the number of unsolicited mailings and cold calls you receive by registering with the
Telephone Preference Service and Mailing Preference Service.
Step 3: Check the Register
We strongly advise you to only deal with financial services firms that are authorised by us,
and check the Register to ensure they are.
If there are no contact details on the Register or the firm claims they are out of date, contact
our Consumer Helpline on 0800 111 6768.
Step 4: Confirm the firm is genuine
To confirm the identity of an authorised firm ask for their ‘firm reference number’ (FRN) and
contact details, but always call them back on the switchboard number given on the Register.
You should access the Register from our website – www.fca.org.uk/register – rather than
through links in emails or on the website of a firm offering you an investment. Also check the
address of our website is correct and there are not subtle changes that mean it is a fake.
Step 5: Search our list of unauthorised firms
Search our list of unauthorised firms to avoid doing business with, although their names are
likely to change regularly.
21 Financial Conduct Authority
We add new names to this list as soon as possible, but if the firm which has approached you
does not appear on our list, do not assume it is legitimate – it may not have been reported to
us yet.
Step 6: See warnings from abroad
If you are dealing with an overseas firm or scheme you should check how it is regulated and
follow similar steps to these.
We also have some warnings from foreign regulators about firms conducting unauthorised
business.
Step 7: Ensure you are protected
Remember that if you give money to a firm that is not authorised by us or is based abroad,
you will not have access to the Financial Ombudsman Service (FOS) or Financial Services
Compensation Scheme (FSCS) if things go wrong.
Step 8: Get professional advice
Consider getting independent professional advice before making any investment decision,
particularly if the type of investment is unfamiliar to you.
Fraudsters are often vague about the investment and how it gives such high returns, or will
explain it in complex detail – but if you don’t understand how it works, do not invest.
Step 9: Beware of a second scam
Be especially careful if you have already been scammed by fraudsters as they are likely to
target you again or sell your details to other criminals.
The follow-up scam may be completely separate or related to the previous fraud, such as an
offer to buy the investment after you pay an administration fee.
Step 10: Report the scam
If you have been approached about an investment scam or think you are a victim of a share
scam, contact our Consumer Helpline on 0800 111 6768 or use our share fraud reporting
form.
You can also see what to do if you think you have been scammed.
22 Financial Conduct Authority
Appendix 2 − What to do if you have been scammed
You can report the firm or scam to us by contacting our Consumer Helpline on 0800 111
6768 or using our share fraud reporting form. Please provide as much information as you can
about your investment and the company involved, including their contact details and ’firm
reference number’ (FRN).
If you have already bought or sold shares through a boiler room, be especially careful as
fraudsters are likely to target you again or sell your details to other criminals. The follow-up
scam may be completely separate or related to the previous fraud, such as an offer to get
your money back or buy back the shares after you pay an administration fee.
Find out more about what to do if you think you have been scammed.
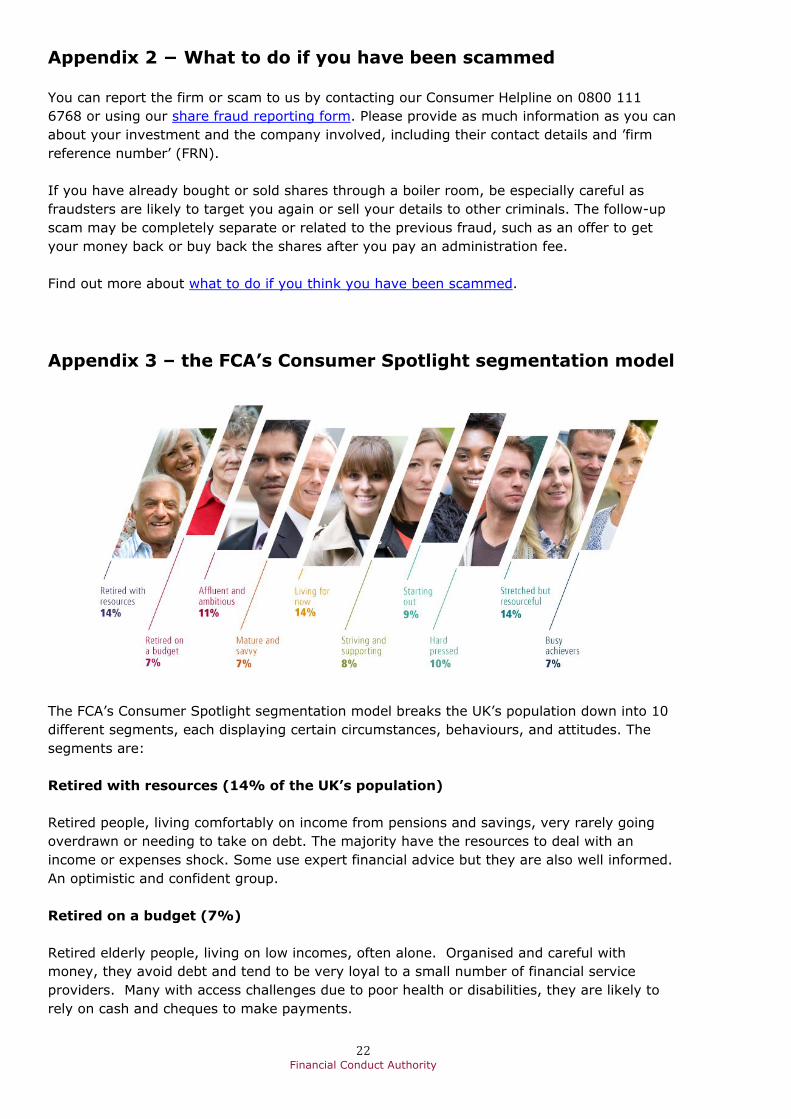
Appendix 3 – the FCA’s Consumer Spotlight segmentation model
The FCA’s Consumer Spotlight segmentation model breaks the UK’s population down into 10
different segments, each displaying certain circumstances, behaviours, and attitudes. The
segments are:
Retired with resources (14% of the UK’s population)
Retired people, living comfortably on income from pensions and savings, very rarely going
overdrawn or needing to take on debt. The majority have the resources to deal with an
income or expenses shock. Some use expert financial advice but they are also well informed.
An optimistic and confident group.
Retired on a budget (7%)
Retired elderly people, living on low incomes, often alone. Organised and careful with
money, they avoid debt and tend to be very loyal to a small number of financial service
providers. Many with access challenges due to poor health or disabilities, they are likely to
rely on cash and cheques to make payments.
23 Financial Conduct Authority
Affluent and ambitious (11%)
An affluent working age segment more likely to be men, many are married with children
living at home. Financially secure, confident and optimistic, they are likely to own a large
number of financial products, including savings and mainstream credit. They enjoy shopping
around for the best deals, often online.
Mature and Savvy (7%)
An affluent, middle aged segment, more likely to be male. Working and usually home
owners, most have some form of savings and investments. They are very confident money
managers and generally find it easy to keep up with their financial commitments. A secure
and optimistic group.
Living for now (14%)
A relatively low income group, more often younger and male. The majority work and keep
on top of bills but they tend to be less organised with money than others and can be prone to
risk taking. Although internet savvy, they lack confidence in financial decision making, often
relying on friends or family for advice.
Striving and supporting (8%)
A low income segment, mostly female and the majority with dependent children. Most work
but although risk averse, money management is a struggle. They may fall behind on
payments, find it difficult to meet an unexpected expense, and rarely switch providers. A
busy and pressured group.
Starting out (9%)
A young segment of men and women, with more than half from minority ethnic groups.
Despite many having higher level qualifications with some still studying, incomes are
relatively low. They may struggle to make ends meet, often relying on credit to get by, but
they have a strong support network and are confident and optimistic about the future.
Hard pressed (10%)
A low income segment of men and women, most are single but many live with dependent
children. The majority are out of work and keeping up with bills is a struggle. With low
financial confidence and limited access to mainstream credit, this segment finds it hard to
make ends meet.
Stretched but resourceful (14%)
A family segment of men and women with children, almost all in work. Incomes are
relatively high and more than half own their home with a mortgage. Although generally able
to keep up with bills, credit use is high. Confident but time poor, many would struggle to
cope with an income or expense shock.
Busy achievers (7%)
Mainly female and married, most have children living at home. The majority work and
household incomes tend to be high. Most have savings as well as loans and credit cards and

24 Financial Conduct Authority
although often overdrawn, they are able to keep up with household bills. Very time poor, but
optimistic and confident about the future.