Embed Size (px)
Citation preview
Evolving Water Resources Systems: Understanding, Predicting and Managing Water–Society Interactions Proceedings of ICWRS2014, Bologna, Italy, June 2014 (IAHS Publ. 364, 2014).
492
A prototype platform for water resources monitoring and early recognition of critical droughts in Switzerland MASSIMILIANO ZAPPA1, LUZI BERNHARD1, CHRISTOPH SPIRIG2, MARTIN PFAUNDLER3, KERSTIN STAHL4, SYLVIA KRUSE1, IRMI SEIDL1 & MANFRED STÄHLI1 1 Swiss Federal Research Institute WSL, Zürcherstrasse 111, CH-8903 Birmensdorf, Switzerland [email protected] 2 Federal Office of Meteorology and Climatology MeteoSwiss, Zürich, Switzerland 3 Swiss Federal Office for Environment, FOEN, Berne, Switzerland 4 University of Freiburg, Hydrology, Freiburg, Germany Abstract In recent years Switzerland has experienced some unprecedented drought situations. At a political level solutions have been requested for early recognition of hydrological droughts. A prototype information platform has been developed to guide water resources management during situations where water resources drop below critical levels. The development was steered by stakeholders from national administrations and different economic sectors. Since June 2013 the platform has presented daily updated real-time information on several drought indicators including precipitation, streamflow, lake levels, groundwater levels, soil moisture deficit, snow resources, dryness in forests and stream temperatures. For three basins, ensemble forecasts of runoff, soil moisture, snowpack and groundwater storage have been provided. Furthermore, a nationwide operational hydrological simulation at 600 × 600 m resolution gives indications on local water resources deficits. Information for each variable has been used to create automatic “awareness maps” for nine large regions. Three levels of information with increasing detail and complexity can be accessed by over 180 registered users. The operators of the platform give interpreted comments on the content of the platform each week-day. The test phase of the platform will last until the end of 2014. Key words hydrological droughts; communication; early recognition; internet platform INTRODUCTION
Regarding the two hydrological extremes, too much and too little water, Switzerland has traditionally been more concerned with problems related to floods, but driven by the climate change debate and reinforced by some recent dry spells (especially the summers of 2003 and 2009 and the spring of 2011; Seneviratne et al. 2013), drought issues have entered the political agenda. Drought is a natural hazard with potentially severe impacts and economic loss or damage in a number of environmental and socio-economic sectors. As droughts develop slowly there is time to prepare and pre-empt some of these impacts. Real-time information and forecasting of a drought situation can therefore be an effective component of drought management. Thus, many regions, countries, or other authorities have recently developed drought monitoring and early-warning systems. One of the first was the US Drought Monitor (USDM: http://droughtmonitor.unl.edu/), which integrates a number of drought indicators with expert knowledge (Svoboda et al. 2002). In Europe, the Joint Research Centre of the European Commission operates a European Drought Observatory (EDO: http://edo.jrc.ec.europa.eu). Existing systems vary with respect to the indicators they display and in the interpretation of these indicators, ideally reflecting different regions’ needs. To create a comparable umbrella, there are current efforts to develop a Global Drought Information System that integrates the regional systems for more specific information (Pozzi et al. 2013). Through these international efforts, experience has been exchanged and consensus has been achieved about the need for the integration of stakeholders and users into the development of useful drought information systems. As such, the task is a good example for the need to consider societal perception, together with hydro-climatic analysis and information, to create successful tools and applications for operation.
On 2 March 2012 the Swiss government adopted the strategy for adaptation on climate change in Switzerland (FOEN 2012) recognizing increasing summer droughts (in intensity and frequency) as one of the major challenges. This is partly based on studies on the impacts of climate change on the hydrologic conditions. Accordingly, the action plan for adaptation on climate change proposes a measure on early recognition of droughts with the aim to make available pertinent information on
Copyright 2014 IAHS Press
Early recognition of critical droughts in Switzerland
493
the status and evolution of the relevant water balance components such that decision makers are prepared and in a position to implement the necessary measures in due time. The Swiss federal government charged the administration to examine the feasibility, benefits and costs for an early recognition and warning system concerning droughts and a suitable operational information platform. This paper shows a solution to that end. A TWO STEP PARTICIPATIVE APPROACH WITH STAKEHOLDERS
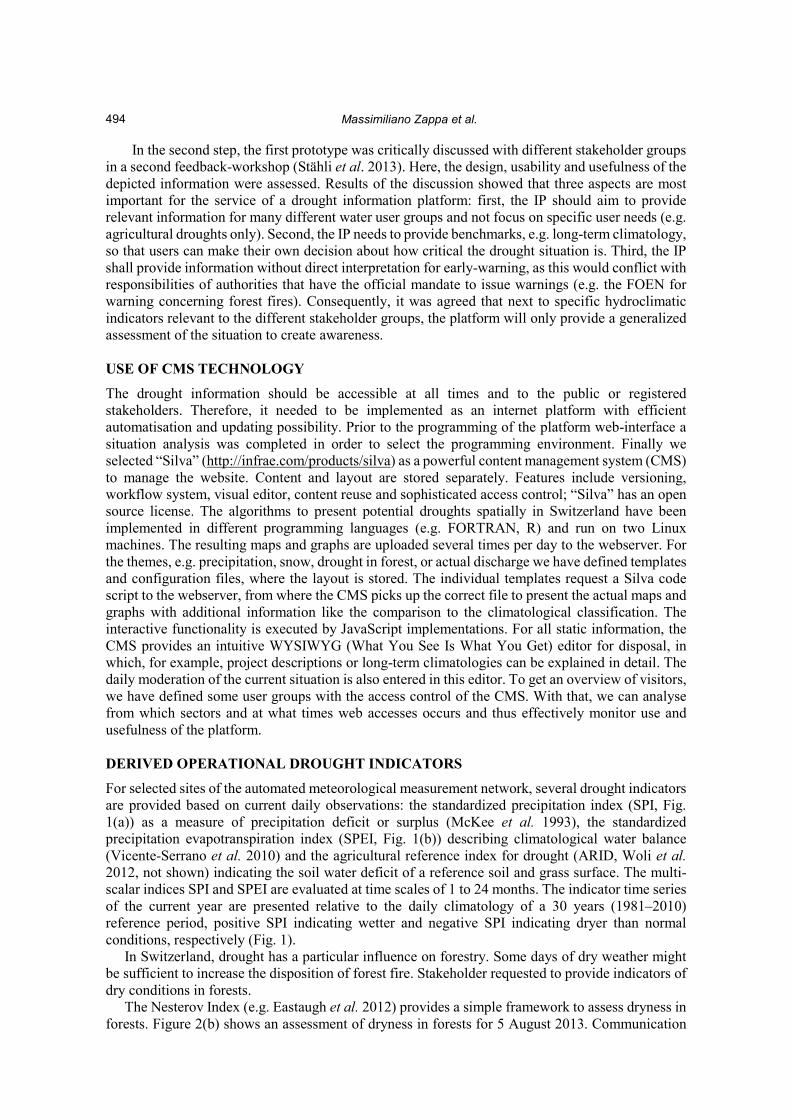
In order to gain insights about the information needs of different stakeholder groups concerning early recognition of critical droughts in Switzerland we realized a two-step process. First, we identified relevant water user groups affected by drought events and evaluated their general information needs (Kruse et al. 2010, Kruse and Seidl 2013). Representatives of water user groups from agriculture, forestry, water supply, shipping industry, fishery and tourism participated in surveys, interviews and workshops that accompanied the development of the information platform (IP, hereafter) since 2010. One result of this consultation step was a list of drought variables that are of relevance to the different stakeholder groups. This list was the basis for the design of the information platform and was complemented by indicators, indices and thresholds used in drought monitoring and prediction, depending on the available spatial scale, feasible prediction period and accuracy of information available from a scientific perspective (cf. Table 1). Table 1 Variables for the early recognition of droughts from the perspective of user groups and availability of information (adapted and reduced from Kruse and Seidl 2013). Bold variables have been implemented in www.drought.ch for monitoring purposes at the Swiss scale. Underlined variables have been implemented for three catchments in forecasting mode and compared to seasonal model climatology. Q347 is a threshold indicating the minimal discharge that needs to be reached or passed for more than 347 days per year.
Variables Relevant for the following user groups/ stakeholders
Indicator/ indices/ thresholds used in monitoring and prediction
Prediction period scientifically feasible Accuracy of prediction available
Precipitation Agriculture, forestry, shipping, hydropower, water management, fishery
Precipitation amount in last and next days / deviation in the last x days from long-term average
< 10 days High accuracy for < 5 days; low for long-term prediction
Evaporation Agriculture Deviation of last and next days from long-term seasonal average
< 10 days Low
Soil moisture agriculture, forestry, FOEN
Deviation of last & next days from long-term seasonal average
< 1–3 months high <2 Weeks; medium < 2 month
Litter moisture
Forestry 3-5 qualitative categories (very dry, dry, slightly wet, wet)
< 10 days n.a.
Water temperature
Fishery, energy sector Max. temperature < 10 days n.a.
Ground water level
Agriculture (irrigation), water management
Deviation from long-term seasonal average
< 2–3 months High accuracy
Water level surface water
Shipping, agriculture (irrigation)
Deviation from long-term seasonal average
< 15 days High accuracy
Runoff fishery, water management, hydropower, FOEN
Q347, deviation of last x days from long-term seasonal average
< 15 days High accuracy
Snow water equivalent
Shipping, agriculture (irrigation)
Max. value at the end of the accumulation period [mm], deviation of long-term seasonal average
During accumulation <10 days; during ablation <20 days Depends on season
Massimiliano Zappa et al.
494
In the second step, the first prototype was critically discussed with different stakeholder groups in a second feedback-workshop (Stähli et al. 2013). Here, the design, usability and usefulness of the depicted information were assessed. Results of the discussion showed that three aspects are most important for the service of a drought information platform: first, the IP should aim to provide relevant information for many different water user groups and not focus on specific user needs (e.g. agricultural droughts only). Second, the IP needs to provide benchmarks, e.g. long-term climatology, so that users can make their own decision about how critical the drought situation is. Third, the IP shall provide information without direct interpretation for early-warning, as this would conflict with responsibilities of authorities that have the official mandate to issue warnings (e.g. the FOEN for warning concerning forest fires). Consequently, it was agreed that next to specific hydroclimatic indicators relevant to the different stakeholder groups, the platform will only provide a generalized assessment of the situation to create awareness.
USE OF CMS TECHNOLOGY
The drought information should be accessible at all times and to the public or registered stakeholders. Therefore, it needed to be implemented as an internet platform with efficient automatisation and updating possibility. Prior to the programming of the platform web-interface a situation analysis was completed in order to select the programming environment. Finally we selected “Silva” (http://infrae.com/products/silva) as a powerful content management system (CMS) to manage the website. Content and layout are stored separately. Features include versioning, workflow system, visual editor, content reuse and sophisticated access control; “Silva” has an open source license. The algorithms to present potential droughts spatially in Switzerland have been implemented in different programming languages (e.g. FORTRAN, R) and run on two Linux machines. The resulting maps and graphs are uploaded several times per day to the webserver. For the themes, e.g. precipitation, snow, drought in forest, or actual discharge we have defined templates and configuration files, where the layout is stored. The individual templates request a Silva code script to the webserver, from where the CMS picks up the correct file to present the actual maps and graphs with additional information like the comparison to the climatological classification. The interactive functionality is executed by JavaScript implementations. For all static information, the CMS provides an intuitive WYSIWYG (What You See Is What You Get) editor for disposal, in which, for example, project descriptions or long-term climatologies can be explained in detail. The daily moderation of the current situation is also entered in this editor. To get an overview of visitors, we have defined some user groups with the access control of the CMS. With that, we can analyse from which sectors and at what times web accesses occurs and thus effectively monitor use and usefulness of the platform. DERIVED OPERATIONAL DROUGHT INDICATORS
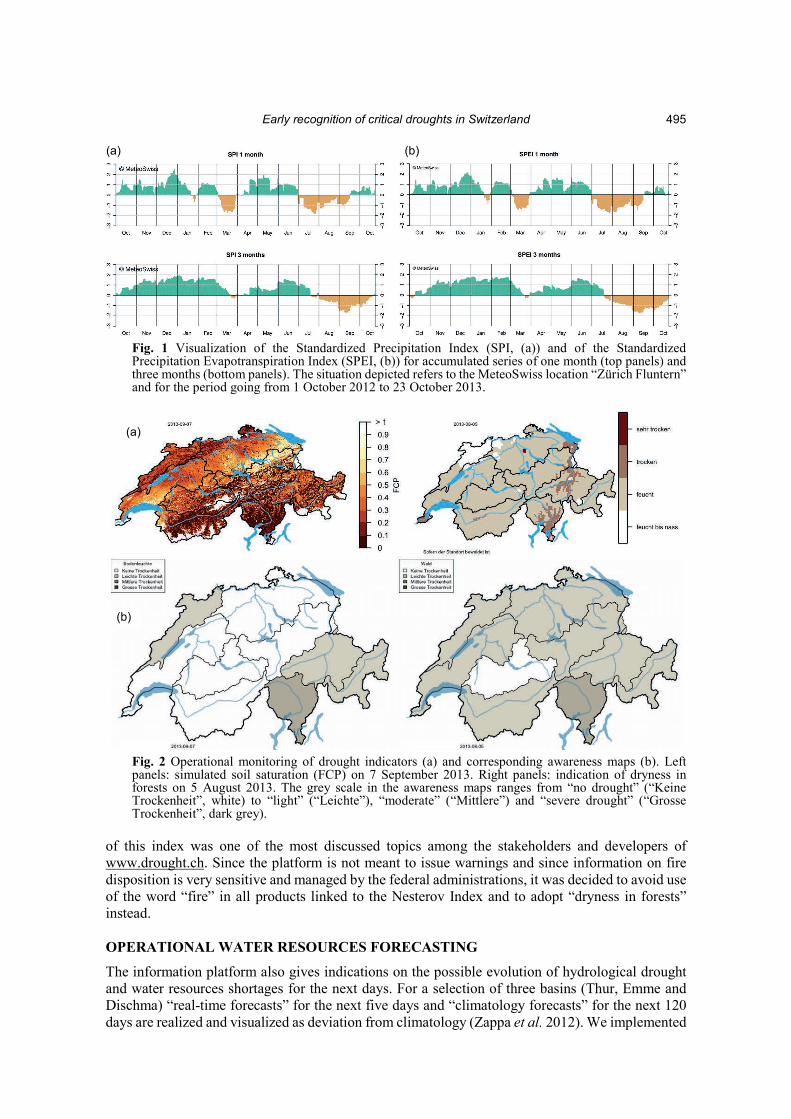
For selected sites of the automated meteorological measurement network, several drought indicators are provided based on current daily observations: the standardized precipitation index (SPI, Fig. 1(a)) as a measure of precipitation deficit or surplus (McKee et al. 1993), the standardized precipitation evapotranspiration index (SPEI, Fig. 1(b)) describing climatological water balance (Vicente-Serrano et al. 2010) and the agricultural reference index for drought (ARID, Woli et al. 2012, not shown) indicating the soil water deficit of a reference soil and grass surface. The multi-scalar indices SPI and SPEI are evaluated at time scales of 1 to 24 months. The indicator time series of the current year are presented relative to the daily climatology of a 30 years (1981–2010) reference period, positive SPI indicating wetter and negative SPI indicating dryer than normal conditions, respectively (Fig. 1).
In Switzerland, drought has a particular influence on forestry. Some days of dry weather might be sufficient to increase the disposition of forest fire. Stakeholder requested to provide indicators of dry conditions in forests.
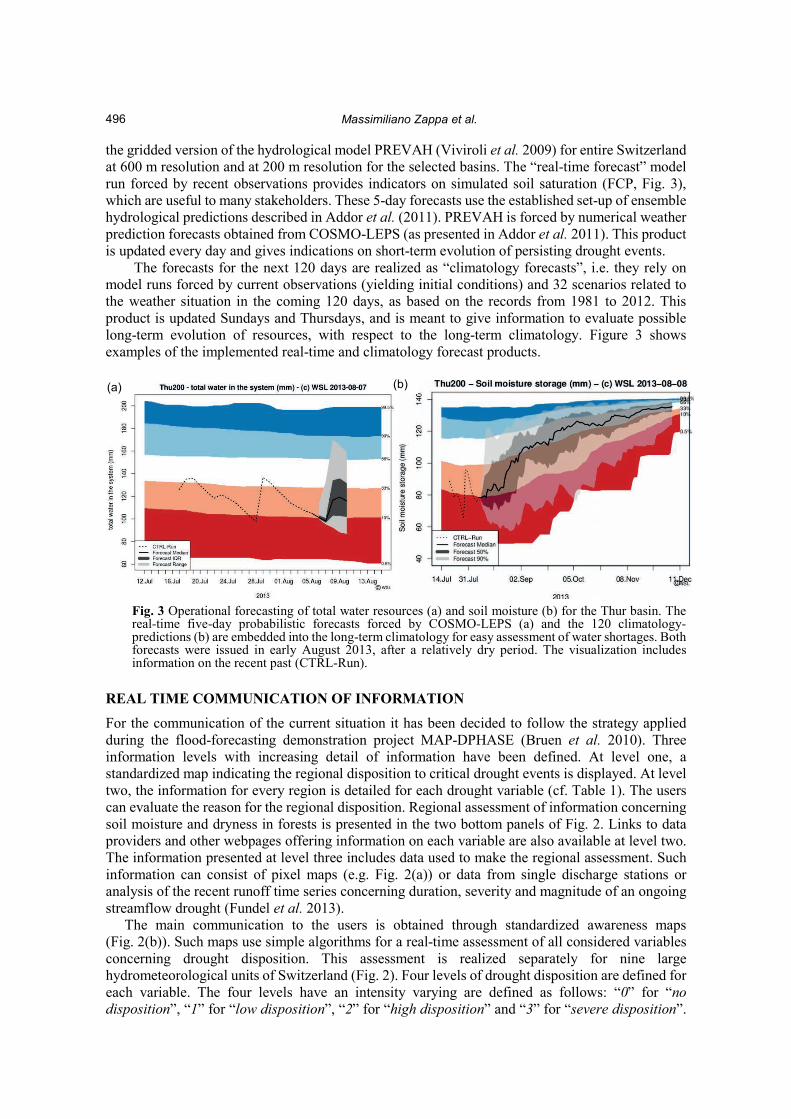
The Nesterov Index (e.g. Eastaugh et al. 2012) provides a simple framework to assess dryness in forests. Figure 2(b) shows an assessment of dryness in forests for 5 August 2013. Communication
Early recognition of critical droughts in Switzerland
495
Fig. 1 Visualization of the Standardized Precipitation Index (SPI, (a)) and of the Standardized Precipitation Evapotranspiration Index (SPEI, (b)) for accumulated series of one month (top panels) and three months (bottom panels). The situation depicted refers to the MeteoSwiss location “Zürich Fluntern” and for the period going from 1 October 2012 to 23 October 2013.
Fig. 2 Operational monitoring of drought indicators (a) and corresponding awareness maps (b). Left panels: simulated soil saturation (FCP) on 7 September 2013. Right panels: indication of dryness in forests on 5 August 2013. The grey scale in the awareness maps ranges from “no drought” (“Keine Trockenheit”, white) to “light” (“Leichte”), “moderate” (“Mittlere”) and “severe drought” (“Grosse Trockenheit”, dark grey).
of this index was one of the most discussed topics among the stakeholders and developers of www.drought.ch. Since the platform is not meant to issue warnings and since information on fire disposition is very sensitive and managed by the federal administrations, it was decided to avoid use of the word “fire” in all products linked to the Nesterov Index and to adopt “dryness in forests” instead. OPERATIONAL WATER RESOURCES FORECASTING
The information platform also gives indications on the possible evolution of hydrological drought and water resources shortages for the next days. For a selection of three basins (Thur, Emme and Dischma) “real-time forecasts” for the next five days and “climatology forecasts” for the next 120 days are realized and visualized as deviation from climatology (Zappa et al. 2012). We implemented
(a) (b)
(a)
(b)
Massimiliano Zappa et al.
496
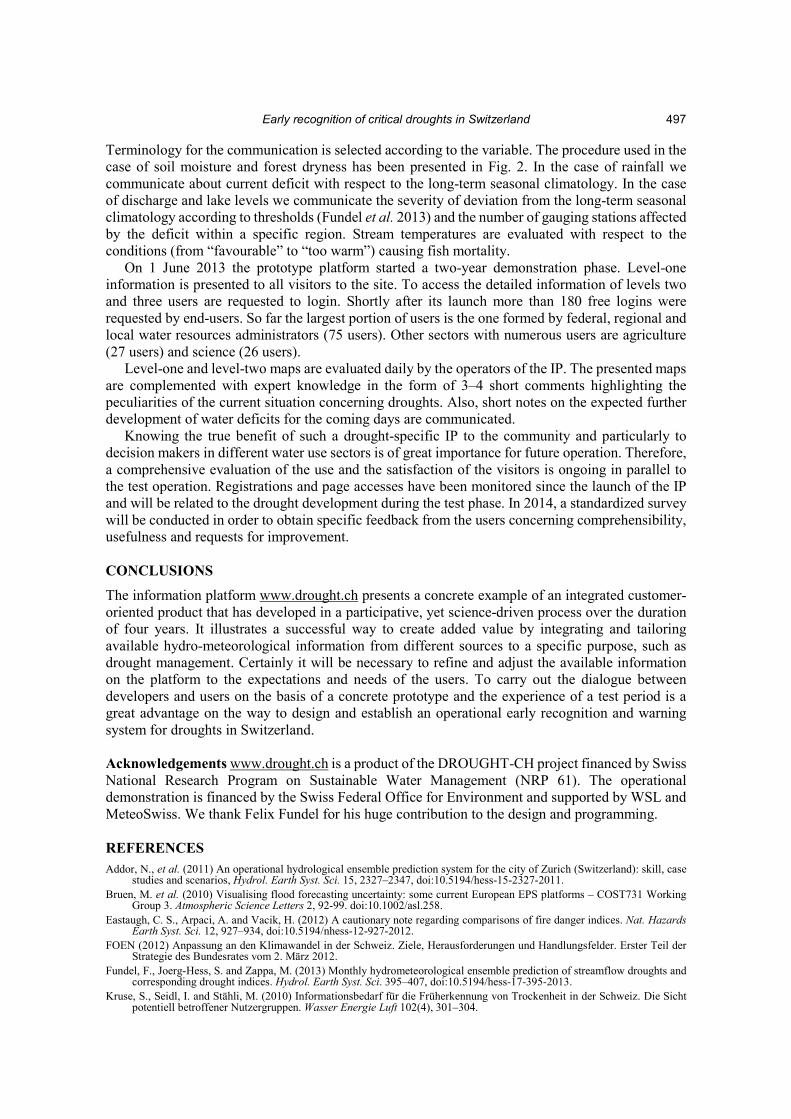
the gridded version of the hydrological model PREVAH (Viviroli et al. 2009) for entire Switzerland at 600 m resolution and at 200 m resolution for the selected basins. The “real-time forecast” model run forced by recent observations provides indicators on simulated soil saturation (FCP, Fig. 3), which are useful to many stakeholders. These 5-day forecasts use the established set-up of ensemble hydrological predictions described in Addor et al. (2011). PREVAH is forced by numerical weather prediction forecasts obtained from COSMO-LEPS (as presented in Addor et al. 2011). This product is updated every day and gives indications on short-term evolution of persisting drought events.
The forecasts for the next 120 days are realized as “climatology forecasts”, i.e. they rely on model runs forced by current observations (yielding initial conditions) and 32 scenarios related to the weather situation in the coming 120 days, as based on the records from 1981 to 2012. This product is updated Sundays and Thursdays, and is meant to give information to evaluate possible long-term evolution of resources, with respect to the long-term climatology. Figure 3 shows examples of the implemented real-time and climatology forecast products.
Fig. 3 Operational forecasting of total water resources (a) and soil moisture (b) for the Thur basin. The real-time five-day probabilistic forecasts forced by COSMO-LEPS (a) and the 120 climatology-predictions (b) are embedded into the long-term climatology for easy assessment of water shortages. Both forecasts were issued in early August 2013, after a relatively dry period. The visualization includes information on the recent past (CTRL-Run).
REAL TIME COMMUNICATION OF INFORMATION
For the communication of the current situation it has been decided to follow the strategy applied during the flood-forecasting demonstration project MAP-DPHASE (Bruen et al. 2010). Three information levels with increasing detail of information have been defined. At level one, a standardized map indicating the regional disposition to critical drought events is displayed. At level two, the information for every region is detailed for each drought variable (cf. Table 1). The users can evaluate the reason for the regional disposition. Regional assessment of information concerning soil moisture and dryness in forests is presented in the two bottom panels of Fig. 2. Links to data providers and other webpages offering information on each variable are also available at level two. The information presented at level three includes data used to make the regional assessment. Such information can consist of pixel maps (e.g. Fig. 2(a)) or data from single discharge stations or analysis of the recent runoff time series concerning duration, severity and magnitude of an ongoing streamflow drought (Fundel et al. 2013).
The main communication to the users is obtained through standardized awareness maps (Fig. 2(b)). Such maps use simple algorithms for a real-time assessment of all considered variables concerning drought disposition. This assessment is realized separately for nine large hydrometeorological units of Switzerland (Fig. 2). Four levels of drought disposition are defined for each variable. The four levels have an intensity varying are defined as follows: “0” for “no disposition”, “1” for “low disposition”, “2” for “high disposition” and “3” for “severe disposition”.
(a) (b)
Early recognition of critical droughts in Switzerland
497
Terminology for the communication is selected according to the variable. The procedure used in the case of soil moisture and forest dryness has been presented in Fig. 2. In the case of rainfall we communicate about current deficit with respect to the long-term seasonal climatology. In the case of discharge and lake levels we communicate the severity of deviation from the long-term seasonal climatology according to thresholds (Fundel et al. 2013) and the number of gauging stations affected by the deficit within a specific region. Stream temperatures are evaluated with respect to the conditions (from “favourable” to “too warm”) causing fish mortality.
On 1 June 2013 the prototype platform started a two-year demonstration phase. Level-one information is presented to all visitors to the site. To access the detailed information of levels two and three users are requested to login. Shortly after its launch more than 180 free logins were requested by end-users. So far the largest portion of users is the one formed by federal, regional and local water resources administrators (75 users). Other sectors with numerous users are agriculture (27 users) and science (26 users).
Level-one and level-two maps are evaluated daily by the operators of the IP. The presented maps are complemented with expert knowledge in the form of 3–4 short comments highlighting the peculiarities of the current situation concerning droughts. Also, short notes on the expected further development of water deficits for the coming days are communicated.
Knowing the true benefit of such a drought-specific IP to the community and particularly to decision makers in different water use sectors is of great importance for future operation. Therefore, a comprehensive evaluation of the use and the satisfaction of the visitors is ongoing in parallel to the test operation. Registrations and page accesses have been monitored since the launch of the IP and will be related to the drought development during the test phase. In 2014, a standardized survey will be conducted in order to obtain specific feedback from the users concerning comprehensibility, usefulness and requests for improvement. CONCLUSIONS
The information platform www.drought.ch presents a concrete example of an integrated customer-oriented product that has developed in a participative, yet science-driven process over the duration of four years. It illustrates a successful way to create added value by integrating and tailoring available hydro-meteorological information from different sources to a specific purpose, such as drought management. Certainly it will be necessary to refine and adjust the available information on the platform to the expectations and needs of the users. To carry out the dialogue between developers and users on the basis of a concrete prototype and the experience of a test period is a great advantage on the way to design and establish an operational early recognition and warning system for droughts in Switzerland. Acknowledgements www.drought.ch is a product of the DROUGHT-CH project financed by Swiss National Research Program on Sustainable Water Management (NRP 61). The operational demonstration is financed by the Swiss Federal Office for Environment and supported by WSL and MeteoSwiss. We thank Felix Fundel for his huge contribution to the design and programming. REFERENCES Addor, N., et al. (2011) An operational hydrological ensemble prediction system for the city of Zurich (Switzerland): skill, case
studies and scenarios, Hydrol. Earth Syst. Sci. 15, 2327–2347, doi:10.5194/hess-15-2327-2011. Bruen, M. et al. (2010) Visualising flood forecasting uncertainty: some current European EPS platforms – COST731 Working
Group 3. Atmospheric Science Letters 2, 92-99. doi:10.1002/asl.258. Eastaugh, C. S., Arpaci, A. and Vacik, H. (2012) A cautionary note regarding comparisons of fire danger indices. Nat. Hazards
Earth Syst. Sci. 12, 927–934, doi:10.5194/nhess-12-927-2012. FOEN (2012) Anpassung an den Klimawandel in der Schweiz. Ziele, Herausforderungen und Handlungsfelder. Erster Teil der
Strategie des Bundesrates vom 2. März 2012. Fundel, F., Joerg-Hess, S. and Zappa, M. (2013) Monthly hydrometeorological ensemble prediction of streamflow droughts and
corresponding drought indices. Hydrol. Earth Syst. Sci. 395–407, doi:10.5194/hess-17-395-2013. Kruse, S., Seidl, I. and Stähli, M. (2010) Informationsbedarf für die Früherkennung von Trockenheit in der Schweiz. Die Sicht
potentiell betroffener Nutzergruppen. Wasser Energie Luft 102(4), 301–304.
Massimiliano Zappa et al.
498
Kruse, S. and Seidl, I. (2013) Social capacities for drought risk management in Switzerland. Natural Hazards and Earth System Sciences 13, 3429–3441, doi:10.5194/nhess-13-3429-2013.
McKee, T. B., Doesken, N. J. and Kleist, J. (1993) The relationship of drought frequency and duration to time scales. Preprints, Eighth Conf. on Applied Climatology. Anaheim, CA, Amer. Meteor. Soc., 179–184.
Pozzi, W., et al. (2013) Towards Global Drought Early Warning Capability: Expanding international cooperation for the development of a framework for global drought monitoring and forecasting. Bulletin of the American Meteorological Society 94, 776–785.
Senevirartne, S. I., et al. (2013) Trockenheit in der Schweiz. Aqua & Gas, Heft 9/2013: S. 38–47. Stähli, M., et al. (2013) drought.ch – auf dem Weg zu einer Trockenheits-Informationsplattform für die Schweiz. Wasser,
Energie, Luft 105, 117–121. Svoboda, M., et al. (2002) The Drought Monitor. Bulletin of the American Meteorological Society 83, 1181–1190. Vicente-Serrano S. M., Beguería, S. and López-Moreno, J. I. (2010) A Multiscalar Drought Index Sensitive to Global Warming:
The Standardized Precipitation Evapotranspiration Index. Journal of Climate 23, 1696–1718. Viviroli, D., et al. (2009) An introduction to the hydrological modelling system PREVAH and its pre- and post-processing-tools.
Environmental Modelling & Software 24(10), 1209–1222. Woli, P., et al. (2012) Agricultural Reference Index for Drought (ARID). Agronomy Journal 104(2), 287–300. Zappa, M., et al. (2012) Vorhersage und Szenarien von Schnee- und Wasserressourcen im Alpenraum. WSL (ed.): Alpine Schnee-
und Wasserressourcen gestern, heute, morgen. Forum für Wissen 2012, 19–27.