Embed Size (px)
Citation preview
SS104 A Proposed National Dataset of 8 Key Quality Indicators
presented by Paul N. Valenstein, MD, FCAP
September 20, 2004 8:30 – 10:00 AM

College of American Pathologists 2004. Materials are used with the permission of Paul N. Valenstein, MD, FCAP. SS104 A Proposed National Dataset of 8 Key Quality Indicators
CAP ’04 – The Pathologists’ Meeting™ September 19 - 22, 2004
Phoenix, AZ
Disclosure Statements
All speakers must disclose to the program audience any financial interest or relationship with the manufacturer(s) of any commercial product(s) that may be discussed in the educational presentation or with the manufacturer of a product that is directly competitive with a product discussed in the presentation. In addition, all speakers must disclose whether non-FDA approved uses of pharmaceutical products or medical devices are included in the presentation The College of American Pathologists does not view the existence of these interests or uses as implying bias or decreasing the value to participants. The CAP, along with the Accreditation Council for Continuing Medical Education (ACCME), feels that this disclosure is important for the participants to form their own judgment about each presentation. The following speakers have financial interests/relationships or non-FDA approved uses to disclose:
The following speakers have no financial interests/relationships or non-FDA approved uses to disclose:
Paul N. Valenstein, MD, FCAP
The following speakers have not provided information on financial interests/relationships or non-FDA approved uses:
Learning Objectives Upon completion of this course, participants should be able to:
• Define eight core indicators of pre- and post-analytic performance that address basic accreditation and patient safety concerns
• Apply each indicator in the laboratory and compare performance to a national reference database
• Explain how the laboratory can promote patient safety by improving performance beyond its walls

1
College of American Pathologists 2004. Materials are used with the permission ofPaul N. Valenstein, MD, FCAP. SS104 A Proposed National Dataset of 8 Key Quality Indicators
A Proposed National Dataset of 8 Key Quality IndicatorsPaul N. Valenstein, MD, FCAP
September 20, 2004
1
The Pathologists’ MeetingTM
Education by the Experts
2
A Proposed National Dataset of 8 Key Quality
Indicators
Paul N. Valenstein, MD, FCAP
3
Disclosure
• Dr. Valenstein has no financial interests/relationships or non-FDA approved uses to disclose.

Page 1
3
Course Objectives
● Define 8 core indicators. Address basic accreditation requirements and safety issues.
● Apply each indicator. How to measure in the laboratory. Compare performance to a national reference database.
● Promote patient safety. Explain how use of indicators can promote safety beyond laboratory walls.
___________________________________
___________________________________
___________________________________
___________________________________
___________________________________
___________________________________
___________________________________
5
VA?
SOLUCIENTHEALTHGRADES
Quality Report Cards
JCAHO
NCQA
CDC?
CMS LEAPFROG
NQF
CAP
___________________________________
___________________________________
___________________________________
___________________________________
___________________________________
___________________________________
___________________________________
6
Good Quality Indicators are…Important
• Linked to patient outcome• Variation in quality among laboratories• Actionable
Scientifically Acceptable• Precisely specified• Reliable• Valid• Adaptable• Risk adjustable
Usable• Field tested• Economically applied• Not proprietary
___________________________________
___________________________________
___________________________________
___________________________________
___________________________________
___________________________________
___________________________________

Page 2
7
8 Key Quality Indicators
1. Patient Identification
2. Blood Culture Contamination
3. Critical Value Reporting
4. Order Accuracy
5. Stat Test Turnaround Time
6. Specimen Acceptability
7. Anatomic Pathology Discrepancies
8. Blood Product Wastage
___________________________________
___________________________________
___________________________________
___________________________________
___________________________________
___________________________________
___________________________________
1. Patient Identification
9
Regulatory Imperative
• CAP requires two patient identifiers before collecting a specimen
• JCAHO lists patient identification as a 2004 National Patient Safety Goal
___________________________________
___________________________________
___________________________________
___________________________________
___________________________________
___________________________________
___________________________________
10
Quality Indicator
Number of Wristband Errors -------------------------------------------- Number of Wristbands Checked
x 100
Wristband Error Rate (%) =
Phlebotomists check wristband accuracy during normal phlebotomy sweeps and classify any errors that are detected.
___________________________________
___________________________________
___________________________________
___________________________________
___________________________________
___________________________________
___________________________________

Page 3
11
Wristband Error Types
Missing wristband (72.8%)
Conflicting wristbands
(4.2%)
Wrong wristband
(3.4%)
Illegible wristband
(6.5%)
Erroneous ID (4.5%)
Missing information
(8.5%)
___________________________________
___________________________________
___________________________________
___________________________________
___________________________________
___________________________________
___________________________________
12
Wristband Errors (%)Spread in Institutional Performance
N 10th 25th 50th 75th 90th
138 0.15 0.46 1.45 3.13 5.81
All Institutions 2003 Percentiles
___________________________________
___________________________________
___________________________________
___________________________________
___________________________________
___________________________________
___________________________________
13
Wristband Errors Over Time
___________________________________
___________________________________
___________________________________
___________________________________
___________________________________
___________________________________
___________________________________

Page 4
14
Improving Performance
• Monitor error rates monitoring associated with improved performance
• Provide immediate feedback about errorspolicy associated with improved performance
• Use staff other than nurses to place wristbandsinstitutions that use nurses have higher error rates
• Require written orders for wristband removalpolicy has been associated with lower error rates
• Develop “zero tolerance” for incorrect wristbandsdiscrepancies must be corrected prior to specimen collection
• Place wristband confirmation on admission checklist
• Report wristband errors to hospital QA committee
___________________________________
___________________________________
___________________________________
___________________________________
___________________________________
___________________________________
___________________________________
2. Blood Culture Contamination
16
Importance
• Longer median LOS (12.5 vs. 8 days) for patients with contaminated blood cultures.
• Higher total charges (median, $13,116 vs. $8,731).
• An institution that processes 10 blood cultures per day and reduces contamination by 0.5% will:
– free up 82 bed days per year – save $80,000 in charges
___________________________________
___________________________________
___________________________________
___________________________________
___________________________________
___________________________________
___________________________________
17
Quality Measure
Blood Culture Contamination Rate (%) =
Number of contaminated blood cultures ----------------------------------------------------
Total number of blood cultures accessionsx 100
Contamination = growth in only one bottle of coagulase-negative Staphylococcus, Propionibacterium acnes acnes, Micrococcus, “Viridans” group Streptococci, diphtheroids, or Bacillus species.
___________________________________
___________________________________
___________________________________
___________________________________
___________________________________
___________________________________
___________________________________

Page 5
18
Blood Culture Contamination (%)Spread in Institutional Performance
N 10th 25th 50th 75th 90th
Total 152 1.7 2.07 2.69 3.47 4.08
Neonatal 109 0 0.45 1.49 3.18 5.21
Non-neonatal 139 1.69 2.01 2.75 3.63 4.09
All Institutions 2003 Percentiles
___________________________________
___________________________________
___________________________________
___________________________________
___________________________________
___________________________________
___________________________________
19
Contamination Over Time
___________________________________
___________________________________
___________________________________
___________________________________
___________________________________
___________________________________
___________________________________
20
Improving Performance
• Monitor blood culture contamination
• by patient care unit• by phlebotomist• provide performance feedback
• Use dedicated phlebotomy teams
• Use tincture of iodine as disinfectant
• Do not collect blood through catheters
___________________________________
___________________________________
___________________________________
___________________________________
___________________________________
___________________________________
___________________________________

Page 6
3. Critical Value Reporting
22
Critical Value Cutoffs Differ…
50th 50th10th (Median) 90th 10th (Median) 90th
Arterial pH 7.2 7.2 7.3 7.5 7.6 7.6Platelet count, x10^9/L 20 40 60 600 999 1000Creatinine, mmol/L 0 18 44 265 442 884Activated partial thromboplastin time, s 0 19 23 40 78 118
Low Critical Value Percentile High Critical Value Percentile
___________________________________
___________________________________
___________________________________
___________________________________
___________________________________
___________________________________
___________________________________
23
Quality Measure
Critical Value Reporting Rate (%) =
Number of Documented Critical Value Notifications ----------------------------------------------------------------------
Number of Reportable Critical Value Results x 100
Documentation must follow local policy. General hematology, coagulation, general chemistry included. Microbiology, drug monitoring, ABGs, cardiac markers excluded. Up to 20 values/day.
___________________________________
___________________________________
___________________________________
___________________________________
___________________________________
___________________________________
___________________________________
24
Critical Value Reporting (%)Spread in Institutional Performance
N 10th 25th 50th 75th 90th
Overall 89 90.07 96.31 98.68 99.58 99.86
Inpatient 79 88.98 96.22 98.81 99.61 100
Outpatient 82 92 95.21 98.5 99.65 100
All Institutions 2003 Percentiles
___________________________________
___________________________________
___________________________________
___________________________________
___________________________________
___________________________________
___________________________________

Page 7
25
Critical Value ReportingOverall Performance
Time in MinutesAverage (No. labs)
Completing Call
Night Shift 5.3 (546)Evening Shift 6.5 (578)Day Shift 6.4 (599)Outpatients 13.7 (550)
Abandoning Call
Night Shift 8.5 (19)Evening Shift 25.3 (26)Day Shift 23.9 (25)Outpatients 46.3 (63)
___________________________________
___________________________________
___________________________________
___________________________________
___________________________________
___________________________________
___________________________________
26
Critical Value Reporting Over Time
___________________________________
___________________________________
___________________________________
___________________________________
___________________________________
___________________________________
___________________________________
27
Improving Performance
• Follow-up with tech when no call made
• Dedicated callers vs. performing technologist
• New technology• Use of LIS critical call reports• Automated pagers, faxes
• Problems verifying communication
• Policy when caregiver unreachable• Pathologist assesses significance
• Pathologist communicates with patient
___________________________________
___________________________________
___________________________________
___________________________________
___________________________________
___________________________________
___________________________________
Page 8
4. Order Accuracy
29
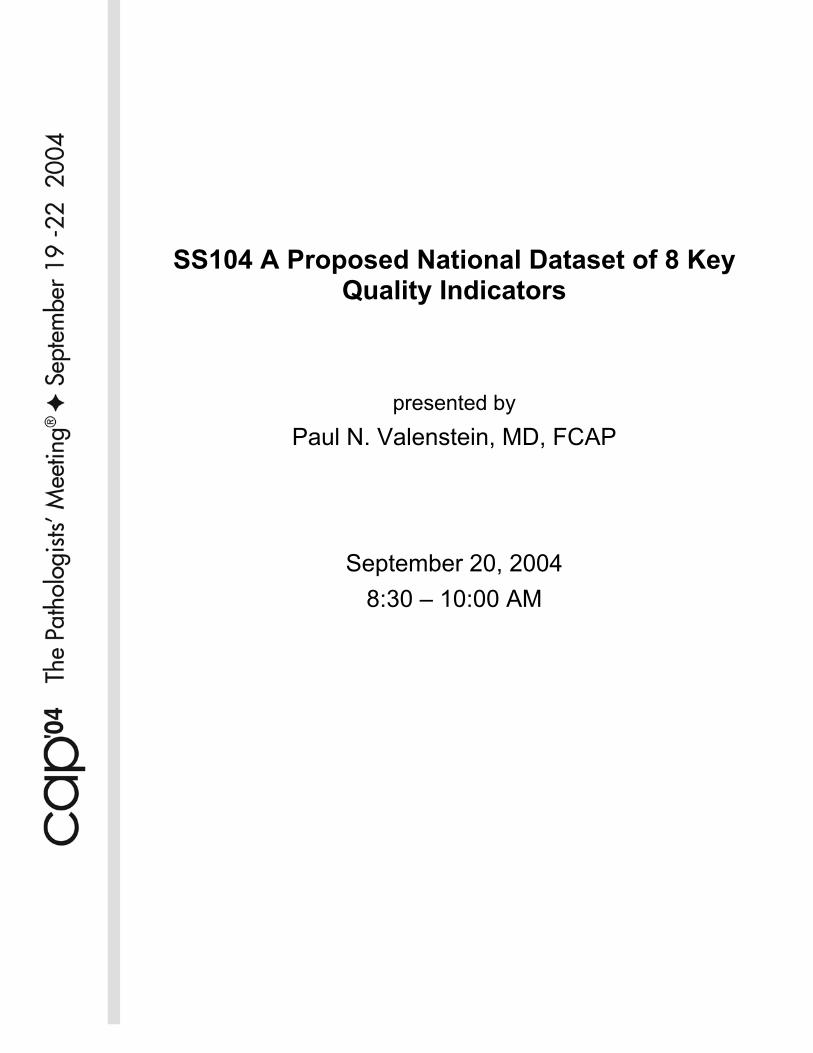
Quality Indicator
Ordered, But Not Performed Rate (%) =
Number of Ordered, But Not Performed Tests* ------------------------------------------------------------ Total Number of Written or Verbal Orders *
x 100
*Obtain two days worth of orders from 20 inpatient charts or from 30 outpatient requisitions. Verbal orders must be documented in laboratory to be counted.
Performed, But Not Ordered Rate (%) =
Number of Performed, But Not Ordered Tests* ------------------------------------------------------------
Total Number of Tests Performed* x 100
___________________________________
___________________________________
___________________________________
___________________________________
___________________________________
___________________________________
___________________________________
30
Order AccuracySpread in Institutional Performance
10th 50th 90thInpatient Orders
Ordered tests that were not performed 8.1% 2.3% 0.2%Performed tests that were not ordered 5.9% 0.6% 0.0%Orders absent from the medical record 16.5% 1.1% 0.0%
Outpatient OrdersOverall error rate 18.0% 6.0% 1.0%Ordered tests that were not performed 6.0% 1.0% 0.0%Performed tests that were not ordered 5.0% 1.0% 0.0%Physician name discrepancies 8.0% 1.9% 0.0%Test priority errors 3.9% 0.0% 0.0%
___________________________________
___________________________________
___________________________________
___________________________________
___________________________________
___________________________________
___________________________________
31
Economic Imperative…
• L.L. Bean ships 99.9% of its orders correctly, even during the busy Christmas season.
• Can a clinical laboratory afford to misdirect 1% of its resources?
___________________________________
___________________________________
___________________________________
___________________________________
___________________________________
___________________________________
___________________________________
Page 9
32
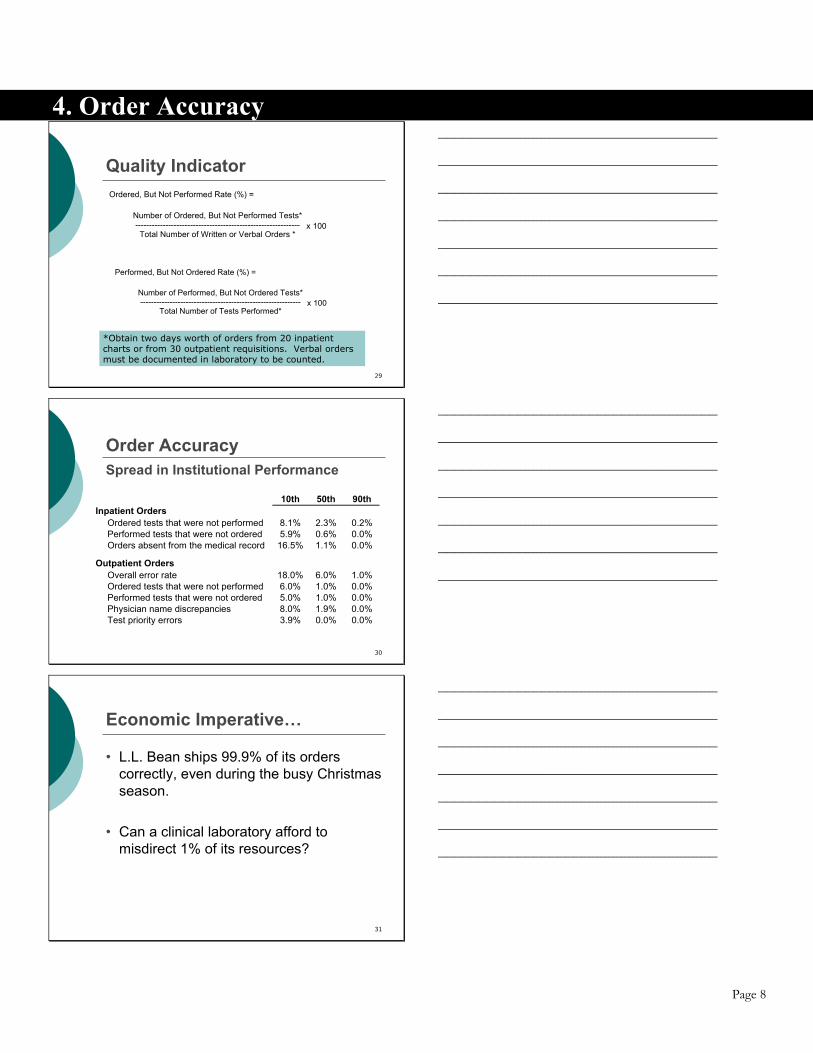
Improving Performance
• Require staff to recheck computer orders Manual check against order sheetDual order entry into computerCompare reported results against order sheet
• Careful attention to requisition design
• Clinical physician order entry (CPOE)
___________________________________
___________________________________
___________________________________
___________________________________
___________________________________
___________________________________
___________________________________
5. STAT Test Outliers
33
Provider Orders Test
Specimen Drawn
SpecimenReaches Lab
Results Verified
Order Arrives
in Lab
Pre-analytic Processing
Analytic Testing
ResultReaches
Provider
5. STAT Test Turnaround Time
___________________________________
___________________________________
___________________________________
___________________________________
___________________________________
___________________________________
___________________________________
34
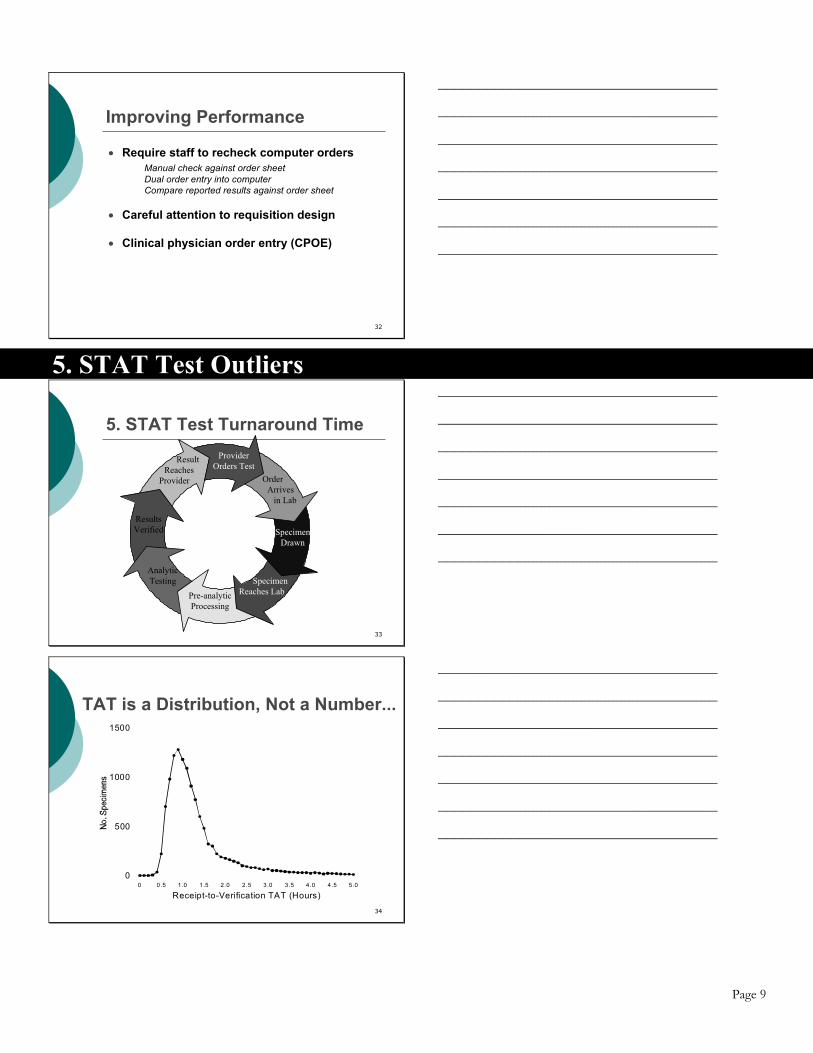
Receipt-to-Verification TAT (Hours)0 0 .5 1.0 1.5 2.0 2.5 3.0 3.5 4.0 4.5 5.0
0
500
1000
1500
TAT is a Distribution, Not a Number...
___________________________________
___________________________________
___________________________________
___________________________________
___________________________________
___________________________________
___________________________________

Page 10
37
Quality Measure
STAT Test Outlier Rate (%) =
Number of STAT Potassium Results Exceeding Institutional Benchmark for ED STAT TAT
---------------------------------------------------------------------- Number of STAT ED Potassium Results
x 100
TAT is receipt-in-laboratory to report-verification. Only STAT ED potassium on plasma, serum, blood. Potassium in panels can be counted; no “add orders” on specimens already collected.
___________________________________
___________________________________
___________________________________
___________________________________
___________________________________
___________________________________
___________________________________
38
STAT ED TAT Outliers (%)Spread in Institutional Performance
N 10th 25th 50th 75th 90th
94 2.16 4.47 9.38 15.19 26.85
All Institutions 2003 Percentiles
___________________________________
___________________________________
___________________________________
___________________________________
___________________________________
___________________________________
___________________________________
39
STAT ED Outliers Over Time
___________________________________
___________________________________
___________________________________
___________________________________
___________________________________
___________________________________
___________________________________

Page 11
40
Improving Performance
• Computer test order entry• Automatic label printing at acquisition• Draw tubes before order• Colored labels for stat specimens• 3-minute stat centrifuge• Use of plasma/whole blood • Pneumatic tube system• Training of laboratory personnel re STAT• Stat laboratory located in the ED
___________________________________
___________________________________
___________________________________
___________________________________
___________________________________
___________________________________
___________________________________
6. Specimen Acceptability
42
Quality Indicator
A rejected specimen is a blood specimen for which one or more requested tests can not be performed because the specimen does not meet laboratory standards for acceptability.
Specimen Rejection Rate (%) =
Number of Rejected Specimens --------------------------------------------
Total Number of Specimens
x 100
___________________________________
___________________________________
___________________________________
___________________________________
___________________________________
___________________________________
___________________________________
43
Rejected Specimens (%)Spread in Institutional Performance
N 10th 25th 50th 75th 90th
154 0.11 0.23 0.5 1.03 1.41
All Institutions 2003 Percentiles
___________________________________
___________________________________
___________________________________
___________________________________
___________________________________
___________________________________
___________________________________
Page 12
44
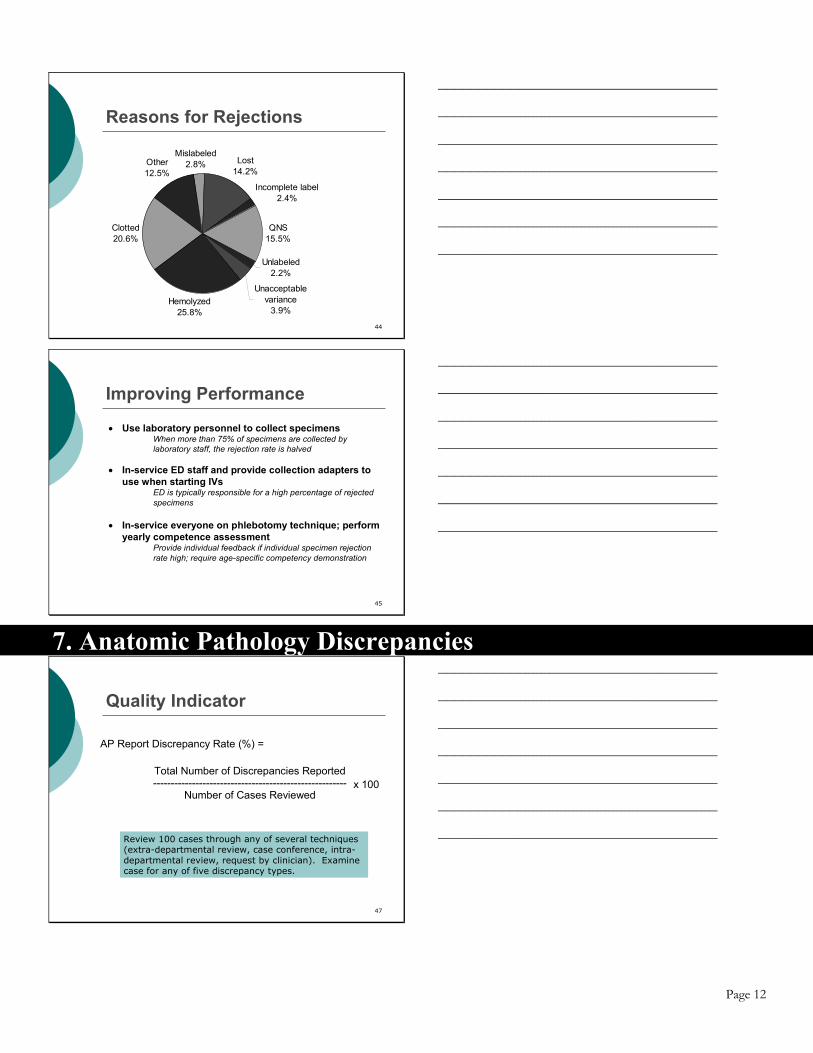
Reasons for Rejections
Hemolyzed25.8%
Clotted20.6%
Other12.5%
Mislabeled2.8% Lost
14.2%
Incomplete label2.4%
QNS15.5%
Unlabeled2.2%
Unacceptable variance
3.9%
___________________________________
___________________________________
___________________________________
___________________________________
___________________________________
___________________________________
___________________________________
45
Improving Performance
• Use laboratory personnel to collect specimens When more than 75% of specimens are collected by
laboratory staff, the rejection rate is halved
• In-service ED staff and provide collection adapters to use when starting IVs
ED is typically responsible for a high percentage of rejected specimens
• In-service everyone on phlebotomy technique; perform yearly competence assessment
Provide individual feedback if individual specimen rejection rate high; require age-specific competency demonstration
___________________________________
___________________________________
___________________________________
___________________________________
___________________________________
___________________________________
___________________________________
7. Anatomic Pathology Discrepancies
47
Quality Indicator
Review 100 cases through any of several techniques (extra-departmental review, case conference, intra-departmental review, request by clinician). Examine case for any of five discrepancy types.
AP Report Discrepancy Rate (%) =
Total Number of Discrepancies Reported -------------------------------------------------------
Number of Cases Reviewed
x 100
___________________________________
___________________________________
___________________________________
___________________________________
___________________________________
___________________________________
___________________________________

Page 13
48
AP Discrepancies (%)Spread in Institutional Performance
N 10th 25th 50th 75th 90th
74 21.0 10.0 5.1 1.0 0.0
All Institutions 2003 Percentiles
___________________________________
___________________________________
___________________________________
___________________________________
___________________________________
___________________________________
___________________________________
49
Reasons for Review
Review per QA policy,
2944
Extra-departmental review, 1082
Intra-departmental conference,
663
Request by clinician, 348
Other, 140
Clinical conference,
998
___________________________________
___________________________________
___________________________________
___________________________________
___________________________________
___________________________________
___________________________________
50
Types of Discrepancies
Within category, 194
New category, 85
Patient information,
37
Margin status, 15
Typographic, 75
___________________________________
___________________________________
___________________________________
___________________________________
___________________________________
___________________________________
___________________________________

Page 14
51
Improving Performance
• Expunge errant reports and replace, rather than amend Institutions that flagged original errant report had fewer
discrepancies; institutions that expunged original report had fewest. The practice may not be causing better performance.
• Pay particular attention to clinician requests for review Reviews requested by clinicians are four times as likely to
reveal discrepancies as other reviews.
• Automatically review high-risk cases before sign-out In this study, breast, gynecologic, and lung specimens were
more likely to demonstrate discrepancies on review.
___________________________________
___________________________________
___________________________________
___________________________________
___________________________________
___________________________________
___________________________________
8. Blood Product Wastage
53
Quality Indicator
Units must be discarded before expiration date, but after they were placed in circulation. The reason for wastage is determined for each wasted unit.
Blood Wastage Rate (%) =
Number of Units Wasted -------------------------------------------------------
Number of Transfused + Wasted Units
x 100
___________________________________
___________________________________
___________________________________
___________________________________
___________________________________
___________________________________
___________________________________
54
Blood Product Wastage (%)Spread in Institutional Performance
N 10th 25th 50th 75th 90th
Overall rate 85 0.7 1.0 1.4 2.2 3.3
Whole blood 11 0.0 0.0 0.0 0.0 31.3
Red blood cell 85 0.1 0.2 0.4 0.6 1.3
Fresh frozen plasma 85 1.5 2.5 4.2 6.8 9.1
Platelet concentrates 58 0.0 0.0 1.1 3.8 12.3
Single donor platelets 83 0.0 0.0 0.5 3.1 7.2
Cryoprecipitate 78 0.0 0.0 2.4 6.3 11.1
All Institutions 2003 Percentiles
___________________________________
___________________________________
___________________________________
___________________________________
___________________________________
___________________________________
___________________________________
Page 15
55
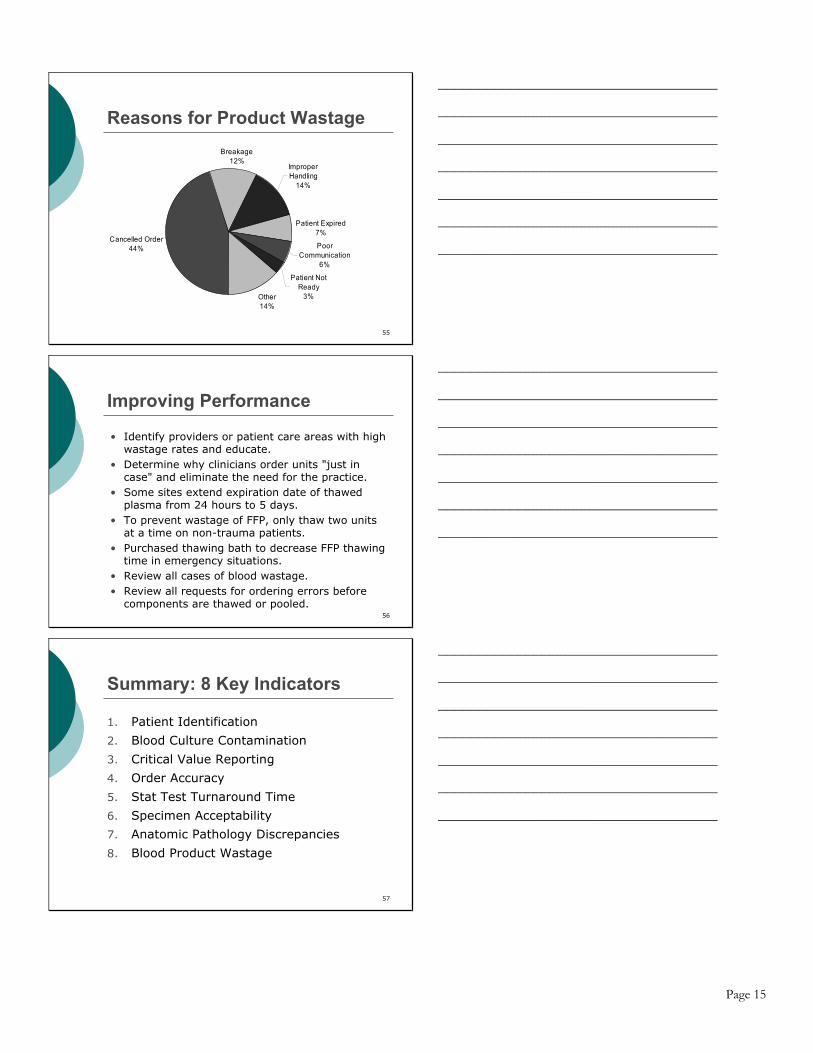
Reasons for Product Wastage
Cancelled Order44%
Breakage12%
Patient Expired7%
Poor Communication
6%
Patient Not Ready
3%Other14%
Improper Handling
14%
___________________________________
___________________________________
___________________________________
___________________________________
___________________________________
___________________________________
___________________________________
56
Improving Performance
• Identify providers or patient care areas with high wastage rates and educate.
• Determine why clinicians order units "just in case" and eliminate the need for the practice.
• Some sites extend expiration date of thawed plasma from 24 hours to 5 days.
• To prevent wastage of FFP, only thaw two units at a time on non-trauma patients.
• Purchased thawing bath to decrease FFP thawing time in emergency situations.
• Review all cases of blood wastage.• Review all requests for ordering errors before
components are thawed or pooled.
___________________________________
___________________________________
___________________________________
___________________________________
___________________________________
___________________________________
___________________________________
57
Summary: 8 Key Indicators
1. Patient Identification
2. Blood Culture Contamination
3. Critical Value Reporting
4. Order Accuracy
5. Stat Test Turnaround Time
6. Specimen Acceptability
7. Anatomic Pathology Discrepancies
8. Blood Product Wastage
___________________________________
___________________________________
___________________________________
___________________________________
___________________________________
___________________________________
___________________________________

Page 16
Growing Interest in Quality Measurement Interest in systematically measuring quality of health care operations has grown dramatically in the United States over the past decade. Quality is being assessed at the health-plan level, the hospital or health system level, and at the level of individual physicians and small physician groups. Interest in systematically measuring the quality of laboratories is still in its infancy, and forms the subject of this presentation. In this seminar we will discuss quality measurements that are quantitative. With quantitative measures a laboratory is ranked somewhere along a continuum, based on the organization’s performance on one or more well-defined quality indicators. We will not discuss the all-or-nothing quality assessment determinations that are made for accreditation purposes, such as in the accreditation program of the College of American Pathologists (CAP) or Joint Commission on Accreditation of Healthcare Organizations (JCAHO). These programs serve important regulatory functions and can stimulate quality improvement, but do not for the most part involve measuring quality quantitatively. Similarly, we will not discuss the variety of quality awards that are bestowed upon organizations and individuals in the health care industry, because these awards generally do not involve systematic quantitative measurement of quality. A number of organizations are involved in qualitative quality assessment in healthcare; few are focused upon laboratories. Some of the more prominent organizations include:
National Committee for Quality Assurance (NCQA) issues an annual quality “report card” grading health plans using a defined set of quality indices. www.ncqa.org College of American Pathologists (CAP) is a not-for-profit organization that has developed quantitative measures of laboratory quality distributed as Q-PROBES® and Q-TRACKS.® www.cap.org Joint Commission on Accreditation of Healthcare Organizations (JCAHO) grades health care institutions (but not laboratories) using a semi-quantitative process that the organization calls Quality Check.® www.jcaho.org Solucient offers several proprietary quality benchmarking services for hospitals. www.solucient.com Healthgrades offers proprietary quality benchmarking programs for hospitals and physicians. www.healthgrades.com Leapfrog is a group of approximately 150 large employers that together have identified systems to improve hospital safety (such as clinical physician order entry). Hospitals are graded on conformance with leapfrog group standards. www.leapfroggroup.org Centers for Medicare and Medicaid Services (CMS) has recently launched a quality incentive program that grades hospitals on conformance with a set of care standards for common illnesses (e.g., pneumonia, congestive heart failure, acute myocardial infarction). www.cms.hhs.gov/quality/hospital National Quality Forum (NQF) is a private not-for-profit organization that creates and

Page 17
validates healthcare quality measurement and reporting tools. www.qualityforum.org Veterans Administration (VA) is considering the adoption of a set of quantitative laboratory quality measures for the entire VA system. www.va.gov Centers for Disease Control (CDC) has helped form the Institute for Quality in Laboratory Medicine (IQLM), which is working on developing a set of “condition-specific” indicators of laboratory quality (i.e., applicable to specific diseases, such as diabetes) and a set of “condition-independent” indicators that will be applicable to commercial, hospital-based, and physician office laboratories. The institute may decide to promote a national set of quality indicators for laboratories. www.phppo.cdc.gov/dls/IQLM
The purposes for making quantitative quality measurements vary. In some cases the efforts are directed primarily to employers (as with NCQA) or the public (as with JCAHO). It is not clear whether employers or the public are using these measures, many of which have been criticized for methodological flaws, poor quality data, and failure to case-mix adjust results. In other cases, such as the CAP’s Q-PROBES and Q-TRACKS initiatives, efforts are focused on guiding self-improvement within the healthcare industry. Self-improvement is the focus of today’s presentation. Each of the eight indices that are discussed in this seminar are field-tested and validated measures of pre-analytic or post-analytic laboratory quality. No claim is made that these indices are comprehensive or necessarily the most useful measures that could be developed to assess laboratory quality. In fact, important measures of customer satisfaction and analytic quality (e.g., proficiency testing and proper use of calibrators and controls) are deliberately omitted. Nevertheless, the measures discussed in this program touch important areas of laboratory service, demonstrate reasonable inter-institutional spread, and address qualities that can be improved by implementing well-defined interventions. The measures fulfill most (but not always all) of the criteria of a good quality measure: Important • Linked to patient outcome –association between practice pattern and meaningful outcome • Variation in quality among laboratories – no point in measuring if all perform similarly • Actionable – practice pattern should be realistically changeable by health care managers Scientifically Acceptable • Precisely specified – unambiguous directions for collecting and analyzing data • Reliable – same results obtained when applied repeatedly and in different settings • Valid – causal connection between quality being measured and patient outcome • Adaptable – can be applied in many health care settings (POL, commercial labs, hospital labs) • Risk adjustable – correction for unmanageable factors that impact quality Usable • Field tested – tool has been refined in clinical settings • Economically applied – can be measured with reasonable cost • Not proprietary - published data collection instructions and reference databases

Page 18
1. Patient Identification Misidentification of patients or specimens is a major cause of medical error. Patient misidentification causes test results to be reported for the wrong patient, which may result in incorrect diagnosis or treatment. Misidentification of specimens destined for the transfusion service can lead to fatal transfusion of incompatible blood products. The College of American Pathologists’ Laboratory Accreditation Program requires compliance with a number of standards designed to insure proper patient identification. Phlebotomists are required to positively identify patients by checking at least two identifiers before collecting a specimen (for example, the patient’s wristband may be checked for name and unique hospital number). The Joint Commission for Accreditation of Health Care Organizations (JCAHO) has made patient identification one of its 2004 National Patient Safety Goals. For inpatients, the first step in obtaining properly identified specimens is to properly identify the patient from whom the specimen is to be obtained. Since inpatients may be too ill to identify themselves accurately, the universal practice in the United States is to require all inpatients to have their names and other identifying information clearly displayed on a band worn on their wrists. Phlebotomists must first check a patient's wristband and match the name on the wristband with the name of the patient for whom phlebotomy is requested before obtaining blood. If the patient can communicate, the phlebotomist is also required to ask the patient to identify him or herself by name. Failure of patients to wear their wristbands, substitution of another patient’s wristband, or incomplete information on wristbands have been identified as important causes of incorrectly labeled specimens and therefore represent a serious patient safety issue. The requirement that inpatients wear an accurate identifying wristband would appear simple to fulfill. However, data from the College of American Pathologists Q-PROBES and Q-TRACKS studies indicate that in many of the institutions in the United States, more than 10% of patients are not wearing accurate wristbands at the time phlebotomy is performed. The CAP has collected data on wristband accuracy from more than five million patients. In 2003 the median institution in one CAP study reported one or more wristband problems with 1.45% of patients. There was wide inter-institutional variation in performance. Participants with high rates of problems in one quarter tended to report high rates in other quarters, underscoring that the differences between institutions are real and not the result of random sampling variation. Measurement of wristband accuracy is made by phlebotomists at the time specimens are collected from inpatients. Rates of performance among institutions and factors associated with improved performance are shown in the accompanying slides and reference 1. References 1. Howanitz PJ, Renner SW, Walsh MK. Continuous wristband monitoring over 2 years decreases
identification errors: a College of American Pathologists Q-Tracks Study. Arch Pathol Lab Med. 2002; 126:809-815.
2. Valenstein PN, Sirota RL. Identification Errors in Pathology and Laboratory Medicine. In
Press, Clinics in Laboratory Medicine, 2004.

Page 19
2. Blood Culture Contamination Occasional contamination of blood cultures is probably unavoidable. Nevertheless, blood culture contamination is associated with increased length of hospital stay, additional expense, and the administration of unnecessary antibiotics. The incremental cost of blood culture contamination to a hospital is many fold greater than the incremental cost incurred by the clinical laboratory. CAP Q-PROBES and Q-TRACKS monitors have been implemented to measure blood culture contamination rates using a uniform definition that facilitates inter-institutional comparisons. Experience with more than two million blood cultures has been accumulated. Institutional participants' blood culture contamination rates vary widely. In 2003 the median institution reported a contamination rate of approximately 2.7%. Participants with high contamination rates in one quarter tended to report high contamination rates in other quarters, underscoring that the differences between institutions are real and not the result of random variation. Best Performer institutions consistently achieved quarterly contamination rates that were less than 2.5%. This level of contamination should serve as a goal for other facilities. Measurement of blood culture contamination is performed by the laboratory. Determination that a culture is contaminated is made on the basis of blood culture results. Any blood culture set containing growth in only one bottle of coagulase-negative Staphylococcus species, Micrococcus species, “viridans” group Streptococci, Corynebacterium species (diphtheroids), Propionibacterium acnes, or Bacillus species is considered to be a contaminate. This definition is appropriate for calculating institutional blood culture contamination rates, but can not be used for clinical decision-making as rare isolates (1-4%) classified as contaminates in this monitor may be associated with clinical infection in individual cases. Inpatient and outpatient cultures are included in the measure Rates of performance among institutions and factors associated with improved performance are shown in the accompanying slides, reference 2, and the Q-TRACKS annual summary. References 1. Bates DW, Goldman L, Lee TH. Contaminant blood cultures and resource utilization--the true
consequences of false-positive results. JAMA. 1991;265:365-369. 2. Schifman RB, Strand CL, Meier FA, Howanitz PJ. Blood Culture contamination: a College of
American Pathologists Q-PROBES study involving 640 institutions and 497,134 specimens from adult patients. Arch Pathol Lab Med. 1998; 122:216-221.
3. Weinstein MP. Blood Culture Contamination: Persisting Problems and Partial Progress. Journal
Of Clinical Microbiology. 2003; 41: 2275–2278.

Page 20
3. Critical Value Reporting Most clinical laboratory results do not require urgent attention, but the occasional result signals a potentially lethal situation that requires immediate notification and action by a caregiver. Lundberg defined critical values as laboratory results that indicate life-threatening pathophysiology which can be corrected if addressed promptly. Many vitally important laboratory results are not “critical” if they do not require immediate attention (e.g., the diagnosis of colon cancer and HIV infection). Critical value results are important. In a Q-PROBES study of 623 institutions by Howanitz et al more than 45% of critical values were unexpected and 65% resulted in a change in therapy. 94.9% of 514 surveyed physicians found critical values lists valuable (although somewhat surprisingly only 20.8% of 2,301 nursing supervisors thought critical values lists helpful). Given these data, failure to notify caregivers of a critical value in a timely manner would appear to be a serious quality concern worthy of measurement. One problem studying critical value reporting is that institutions place different analytes on their critical list and the cutoff value for reporting varies. The following table of critical values is based on the Howanitz et al study. Not all institutions had established critical values for every analyte.
50th 50th10th (Median) 90th 10th (Median) 90th
ChemistryAmmonia, mmol/L 0 4.4 22.2 19.4 43.3 110.8Arterial pH 7.2 7.2 7.3 7.5 7.6 7.6Arterial PCO2, kPa 2.5 2.7 4 6.7 9.3 9.3Arterial PO2, kPa 5.3 5.3 8 7.3 14.8 33.3Bilirubin (neonatal), mmol/L 0 0 17.1 206.2 256.5 307.8Calcium (ionized), mmol/L 0.22 0.75 1.5 0.35 1.58 1.75Calcium (total), mmol/L 1.5 1.5 1.75 3 3.25 3.5Carbon dioxide, mmol/L 10 10 15 40 40 45Chloride, mmol/L 70 80 90 115 120 130Creatinine, mmol/L 0 18 44 265 442 884Glucose (cerebrospinal fluid), mmol/L 1.1 2.15 2.31 4.13 11 27.5Glucose (serum), mmol/L 2.2 2.2 2.75 16.5 24.75 38.5Lactic acid, mmol/L 0 0.06 0.33 0.27 0.44 3.4Lecithin/sphingomyelin (L/S) ratio 1 1.5 2 2 2 3Magnesium, mmol/L 0.39 0.41 0.57 1.23 1.91 2.5Phosphorus, mmol/L 0.32 0.32 0.65 1.78 2.58 3.23Potassium, mmol/L 2.5 2.8 3 6 6.2 6.5Osmolality, mOsmol/kg 219 250 270 300 323 350Sodium, mmol/L 110 120 125 150 160 170Urea nitrogen, mmol/L 0 1.1 2.1 17.9 28.6 35.7Uric acid, mmol/L 0 0.059 0.118 0.599 0.7611 0.885
HematologyActivated partial thromboplastin time, s 0 19 23 40 78 118Fibrinogen, mmol/L 0.5 1 1.5 3.75 8 8Hemoglobin, g/L 50 70 80 180 200 210Hematocrit, % 0.15 0.2 0.25 0.55 0.6 0.65Platelet count, x10^9/L 20 40 60 600 999 1000Prothrombin time, s 0 9 15 17 30 40White blood cell count, x10^9/L 1 2 3 20 30 60
Low Critical Value Percentile High Critical Value Percentile

Page 21
Requirements from agencies and accrediting organizations such as CMS, JCAHO, and the CAP Laboratory Accreditation Program have mandated that laboratories develop and implement an alert system for critical values. Between 1 in 100 and 1 in 1,000 test results are considered “critical” by local institutional standards. On average approximately 98.5% of critical results are called to caregivers. In some hospitals, fewer than 10% of critical values were documented as being reported to an attending physician and acted upon. Weaknesses in the reporting process included (1) critical values were not always reported by the clinical laboratory; (2) when critical values were reported, it was often to someone not directly involved in the patient’s care; (3) documentation of critical value reporting by the laboratory was incomplete; (4) clinicians’ awareness of critical values was not always documented; (5) clinicians’ decisions on corrective actions were not documented adequately; and (6) the time interval between the availability of critical test results and the institution of corrective measures was sometimes unacceptably long. Based on more than 13,000 critical values accumulated in a CAP Q-PROBES study, most critical values reports (92.8%) were made by the person who performed the test, and 65% of reports for inpatients were received by nurses. For outpatients, physicians' office staff received the largest percentage (40%) of reports. The majority of participants (71.4%) had no policy on how repeat critical calls should be handled. On average, completion of notification required about 6 minutes for inpatients and 14 minutes for outpatients. Rates of performance among institutions and factors associated with improved performance are shown in the accompanying slides and references 2 and 4. In calculating how well an institution performs, documentation that a critical value has been called must conform with local policy and local critical values are used. General hematology, coagulation, and general chemistry tests are included. Microbiology, drug monitoring, ABGs, cardiac markers are excluded. Daily measurements are made, with up to 20 critical values recorded per day. References 1. Clinical Laboratory Improvement Amendments of 1988:Final Rule (CFR Part 405, et al). Federal
Register. 1992;57:7001-7186. 2. Howanitz PJ, Steindel SJ, Heard NV. Laboratory critical values policies and procedures: a college
of American Pathologists Q-Probes Study in 623 institutions. Arch Pathol Lab Med. 2002;126:663-669.
3. Lundberg GD. Critical (panic) value notification: an established laboratory practice policy
(parameter). JAMA.1990; 263:709. 4. Schifman RB, Dale JC. Timeliness of Critical Value Reporting. 97-04. Q-PROBES. Northfield,
IL: College of American Pathologists; 1998. 3 5. Steindel SJ, Heard NV. Critical values: data analysis and critique. 92-04. Q-PROBES. Northfield,
IL: College of American Pathologists; 1993.
Page 22
4. Order Accuracy Ordering accuracy bears an obvious relationship to the quality of laboratory testing. When the laboratory fails to complete a requested test the diagnostic evaluation is delayed, potentially extending a patient's hospital stay and prolonging therapy. When the laboratory completes a test that was not requested, the cost of care increases and patients may be subjected to unnecessary phlebotomy. Every laboratory director receives an occasional complaint from a clinician about a test that was purportedly ordered, but never completed by the laboratory. The laboratory director may choose to investigate the facts and circumstances surrounding the individual incident, but generally he or she has little sense of whether such incidents occur more or less frequently than at other institutions. The CAP has completed Q-PROBES studies of order accuracy on inpatients and outpatients. 577 facilities participated in the inpatient order accuracy study (Valenstein et al 1995) and 666 facilities in the first outpatient order accuracy study (Valenstein et al, 1999). A repeat study of outpatient accuracy has also been conducted, producing similar results. In all studies, orders in the medical record or laboratory requisition were compared to tests actually performed by the laboratory. For inpatients, orders during the first two days of hospitalization were examined. In the case of outpatients, the laboratory requisition was examined. A verbal order that was documented in a written laboratory record was considered a valid order, even if it did not appear on the requisition or in the medical record. Participants examined 20 inpatient charts or 30 outpatient requisitions in order to calculate their order accuracy rate. When one test was incorrectly substituted for another, laboratories recorded one instance of an ordered test not being performed, and one instance of a performed test not having been ordered. Rates of performance among institutions and factors associated with improved performance are shown in the accompanying slides and references 2 – 4. References 1. Finn AF, Valenstein P, Burke MD. Alteration of physician orders by nonphysicians. JAMA.
1988; 259:2549-2552. 2. Valenstein PN, Howanitz PJ. Ordering accuracy. A College of American Pathologists Q-Probes
study of 577 institutions. Arch Pathol Lab Med. 1995; 119:117-122. 3. Valenstein PN, Meier FR. Outpatient Order Accuracy. Arch Pathol Lab Med. 1999; 123: 1145–
1150. 4. Valenstein PN, Walsh M. Five-Year Follow-up of Routine Outpatient Test Turnaround Time: A
College of American Pathologists Q-Probes Study. Arch Pathol Lab Med. 2003. 127:1421–1423.

Page 23
5. STAT Test Turnaround Time In some situations short laboratory turnaround may impact a patient’s clinical course more than achieving a high level of accuracy. The physician taking care of a comatose patient in the emergency department will make more use of a serum glucose level of 30 mg/dl reported after 5 minutes than a more accurate report of 36 mg/dl reported after an hours' delay. The speed with which laboratory results are reported impacts institutions as well as patients. When results of routine laboratory tests are delayed physicians show a tendency to reorder the same test. In the commercial laboratory marketplace, speed assumes special importance because laboratory customers demand it. Whether or not faster turnaround time is likely to make any medical difference, patients and their physicians want reports as rapidly as possible. The study of laboratory turnaround time could fill an entire seminar. Before we recommend a single quality measure for laboratory turnaround time, two considerations should be discussed: The testing cycle, illustrated on the accompanying slide, can be divided into number intervals. Turnaround time (TAT) can potentially be measured between each milestone, although the CAP uses only some of the intervals in its inter-institutional turnaround time surveys. To avoid confusion, it is best to specify the interval of interest when reporting turnaround time performance. Thus, it is desirable to speak of order-to-receipt turnaround time or collection-to-verification turnaround time, rather than use the term “turnaround time” without any modifiers. The three most important turnaround time intervals are: (i) clinical-order-to-result-verification, (ii) collection-to-verification, and (iii) receipt-in-laboratory-to-verification. It is helpful to keep in mind that for any given laboratory turnaround time represents a distribution. Not all tests performed by the laboratory are completed in the same amount of time. The accompanying slide shows turnaround time of more than 10,000 stat prothrombin times performed by a single laboratory. The distribution is not Gaussian or “normal” – it is positively skewed, having a longer tail on the right than the left. Laboratories with turnaround time problems generally have more skewed turnaround time distributions. The mean or median are good measures for tracking turnaround time of the typical test. But for the majority of clinical laboratories, which are meeting clinicians’ needs most of the time, it is better to track the size of the “tail” to the right – the tests that take an unusually long time to complete. For these laboratories the 90th percentile turnaround time (the time it took to complete 90% of tests), or the proportion of acceptable tests (the fraction of tests that met an institution’s threshold for acceptable TAT) are more useful measures than the mean and median. The CAP has performed both Q-PROBES and Q-TRACKS studies on test turnaround time, covering hundreds of institutions, more than five million STAT and routine tests, and different approaches to measuring turnaround time. Several other studies have reported on smaller multi-institutional surveys of TAT. The index of turnaround time we wish to emphasize in this course is the proportion of STAT turnaround time outliers – the proportion of tests that do not meet an institution’s local standards for acceptable TAT. A reliance on local standards limits somewhat the ability to make inter-institutional comparisons. Laboratory “A” may adopt a turnaround time standard of 30 minutes for collection-to-report time of STAT potassium levels from the Emergency Department, while Laboratory “B” may adopt a standard of 40 minutes. If Laboratory “A” reports

Page 24
a higher percentage of outliers than Laboratory “B” it will not be clear which facility is doing a better job. The CAP decision to use local laboratory standards when measuring turnaround time outliers – rather than a common national standard -- reflected a desire to make allowances for differences in the patient population laboratories serve and differences in the type of care laboratories support. An acceptable TAT in one facility may not be acceptable in another. Rates of performance among institutions and factors associated with improved performance are shown in the accompanying slides, in reference 1, and in the Q-TRACK annual summary. The TAT monitor used by the CAP is focused upon STAT potassium turnaround time in the Emergency Department (ED). In most hospitals this measure is highly correlated with STAT TAT for other common ED tests, and for STAT testing in the ICU. The particular interval the College elected to emphasize was the time between specimen receipt-in-laboratory to result-verification. While order-to-result or collection-to-result turnaround time may be more clinically important, order times and collection times are difficult to measure precisely in many settings. Only whole blood, serum, and plasma potassium testing is included in this measure. Potassium assays on other body fluids are excluded. Potassium tests ordered as part of a panel (e.g., electrolytes) are included. However, potassium orders added to existing specimens are excluded, as are potassium assays ordered on a “routine” basis or ordered as part of a timed study. References 1. Novis DA, Walsh MK, Dale JC, Howanitz PJ. Continuous Monitoring of Stat and Routine
Outlier Turnaround Times. Two College of American Pathologists Q-Tracks Monitors in 291 Hospitals. Arch Pathol Lab Med. 2004; 128:621–626.
2. Novis DA, Steindel SJ. Stat test turnaround time outliers: data analysis and critique. 96-02. Q-
PROBES. Northfield, IL: College of American Pathologists; 1997. 3. Steindel SJ, Novis DA. Using outlier events to monitor test turnaround time: a College of
American Pathologists Q-Probes study in 495 laboratories. Arch Pathol Lab Med. 1999; 123:607–614.
4. Valenstein P. Laboratory turnaround time. Am J Clin Pathol 1996; 105:676-688.

Page 25
6. Specimen Acceptability A substantial amount of rework, diagnostic and therapeutic delay, and patient inconvenience can result from specimen rejection. In general chemistry and hematology sections of the laboratory, specimen rejection rates average around 0.5%. There is wide inter-institutional variation in performance. Hemolysis and clotting are the dominant reasons for rejecting specimens in most institutions. Hemolysis causes problems primarily for chemistry testing, and clotting for hematology testing. Focusing on these two issues provides for substantial improvement opportunities. Hemolysis results from both operator and equipment failure. Vigorous syringe drawing and the use of small gauge needles or collapsible catheters have been shown to contribute to hemolysis. Specimen clotting is generally caused by inadequate mixing of specimen and anticoagulant or by specimen collection in micro-collection devices. One cause of specimen rejection that has been widely commented upon is inadequately trained phlebotomists. An assessment of phlebotomist training and competency may identify areas requiring increased attention, and has been mentioned by best performing facilities as a technique they find useful to keep specimen rejection rates low. A dedicated team of laboratory-based phlebotomists has also been shown to draw specimens that are less likely to be rejected, a finding that will be of particular interest to institutions considering the institution of “patient-centered” (non-laboratory) phlebotomy teams. As with any survey of defective processes, we can not exclude the possibility that some facilities with low rejection rates may simply be processing inadequate specimens, leading to the release of inaccurate results. Before concluding that laboratory performance is acceptable, managers of laboratories with low rejection rates must assure themselves that their laboratory has an adequate specimen rejection policy and all necessary personnel conscientiously follow it. Rates of performance among institutions and factors associated with improved performance are shown in the accompanying slides, reference 2, and in the Q-TRACKS annual summary. In the CAP Q-TRACKS program that monitors specimen rejection, some laboratories have been able to demonstrate performance improvement, however, the performance of many remains unchanged. References 1. Jones BA, Meier F, Howanitz PJ. Complete blood count specimen acceptability. Arch Pathol Lab
Med. 1995;119: 203-208. 2. Jones BA, Calam RR, Howanitz PJ. Chemistry specimen acceptability. Arch Pathol Lab Med.
1997;121:19-26. 3. Carraro P, Servidio G, Plebani M. Hemolyzed specimens: a reason for rejection or clinical
challenge. Clin Chem. 2000;46:306-307. 4. Kennedy C, Angermuller S, King R, et al. A comparison of hemolysis rates using intravenous
catheters versus veni-puncture tubes for obtaining blood samples. J Emerg Nurs. 1996;22:566-9.

Page 26
7. Anatomic Pathology Discrepancies Incorrect or incomplete pathology diagnoses can compromise care. In a CAP Q-PROBES study involving 74 institutions, the majority of pathology reports that were later found to require correction had not compromised care. However, in 5.3% of cases the correction was believed to have made a “marked” or “moderate” impact on care. There are a number of methods for determining error rates in anatomic pathology reports; none are perfect. Waiting for clinicians to point out errors or omissions will cause many problems to be missed as a number of incorrect reports do not impact care and will never come to a clinician’s attention. Review of case slides by a second pathologist may reveal discrepancies, but is time consuming. When second-pathologist review is performed selectively the process is subject to selection; some institutions will select cases for review that have a higher likelihood of error than other institutions. In addition, it is not always clear whether a discrepancy between two pathologist examinations represents a problem with the initial examination or with the review. In the CAP Q-PROBES study, a discrepancy rate is calculated from second pathologist review of cases conducted during the normal course of providing care. Some reviews were intradepartmental and were performed as part of standard departmental quality assurance procedures. Other reviews were performed in preparation for clinical conferences. Still others were extra-departmental, when a pathologist at another institution examined a case. One hundred reviews from each participating institution were analyzed. A discrepancy was said to have occurred if there was any difference between the original interpretation and the interpretation after the second review. There were five types of discrepancies: • Change in categorical interpretation: An interpretation was changed from one category (e.g.,
benign) to another (e.g., malignant). For cases that involved an indeterminate diagnosis (e.g., “atypical” or “suspicious”) a change in categorical interpretation required a “two-step” difference (assuming benign = 1, atypical = 2, suspicious = 3, and malignant = 4).
• Change in margin status • Change within the same category of interpretation: An interpretation was changed from one
benign interpretation to another or from one malignant interpretation to another. • Change in patient information • Change in the organ site or laterality • Typographical error Rates of performance among institutions are shown in the accompanying slides and reference 1. References 1. Raab S, Ruby SG, Nakhleh R. Anatomic Pathology Discrepancy Rates. QP033. Q-PROBES.
Northfield, IL: College of American Pathologists; 2003. 2. Hocking GR, Niteckis N, Cairns BJ, Hayman JA. Departmental audit in surgical anatomical
pathology. Pathology. 1997;29:418-421.

Page 27
8. Blood Product Wastage Blood for transfusion is a precious resource. At a minimum, wastage of blood that is not out-of date represents a financial loss to the healthcare system. More ominously, systematic wastage of blood may reflect an environment of care that is out of control and poses risks to patient safety. Based on several Q-PROBES studies of in-date blood wastage, the CAP has instituted a Q-TRACKS indicator that tracks overall wastage rates, wastage rates of individual major blood components, and the reasons for wastage. These reasons include: • Miscommunication or failure to inform the laboratory of cancelled blood orders, patient demise,
or a change in the kind of blood component requested. • Physical breakage or contamination of the blood unit. • Patient not ready for transfusion at the time the product was prepared and/or released. • Physician canceling orders after a unit was prepared. • Improper handling of units, including lost or misplaced units. • Patient death after units were prepared. • Any other circumstance where units were wasted while in-date. Although the number of units wasted was a small percentage of all units transfused, the authors of the Q-TRACKS study suggest that wastage should be less than one percent with no wastage due to misplaced units or miscommunication. Rates of performance among institutions and factors associated with improved performance are shown in the accompanying slides, in references 3 – 5, and in the Q-TRACKS annual summary. References 1. Clark JA, Ayoub MM. Blood and component wastage report: a quality assurance function of the
hospital transfusion committee. Transfusion. 1989; 29:139-142. 2. Jeffries L, Smith ME, Magee D, Wallace P, Horgan M. A team approach to wasted blood
products. Lab Med. 1996;27:833-837. 3. Novis DA, Renner S, Friedberg R, Walsh MK, Saladino AJ. Quality indicators of blood
utilization: three College of American Pathologists Q-Probes studies of 12,288,404 red blood cell units in 1639 hospitals. Arch Pathol Lab Med. 2002;126:150-156.
4. Novis DA, Renner S, Friedberg RC, Walsh MK, Saladino AJ. Quality indicators of fresh frozen
plasma and platelet utilization. Arch Pathol Lab Med. 2002; 126:527-532. 5. Zarbo RJ, Jones BA, Friedberg RC, Valenstein PN, Renner SW, Schifman RB, Walsh MK,
Howanitz PJ. Q-tracks: a College of American Pathologists program of continuous laboratory monitoring and longitudinal tracking. Arch Pathol Lab Med. 2002;126:1036-1044.


![EV-IMO: Motion Segmentation Dataset and Learning Pipeline ... · EV-IMO: Motion Segmentation Dataset ... Zhu et al. [44] proposed the first unsupervised learning approach and applied](https://img.pdfslide.us/doc/110x75/5f0f2f997e708231d442e9ad/ev-imo-motion-segmentation-dataset-and-learning-pipeline-ev-imo-motion-segmentation.jpg)