Embed Size (px)
Citation preview

A PROPOSED MEDIATION MODEL OF THE EFFECTS OF MOTIVATION FOR A HEALTHY LIFESTYLE: IMPACTS ON EMOTIONAL EXHAUSTION,
MEDICATION REGIMENS, AND LOW-DENSITY LIPOPROTEIN
THESIS
Nathan M. Leuthold, Captain, USAF
AFIT/GEM/ENV/12-M12
DEPARTMENT OF THE AIR FORCE AIR UNIVERSITY
AIR FORCE INSTITUTE OF TECHNOLOGY
Wright-Patterson Air Force Base, Ohio
DISTRIBUTION STATEMENT A APPROVED FOR PUBLIC RELEASE; DISTRIBUTION IS UNLIMITED.

The views expressed in this thesis are those of the author and do not reflect the official policy or position of the United States Air Force, Department of Defense, or the United States Government.

AFIT/GEM/ENV/12-M12
A PROPOSED MEDIATION MODEL OF THE EFFECTS OF MOTIVATION FOR A HEALTHY LIFESTYLE: IMPACTS ON EMOTIONAL EXHAUSTION,
MEDICATION REGIMENS, AND LOW-DENSITY LIPOPROTEIN
THESIS
Presented to the Faculty
Department of Systems and Engineering Management
Graduate School of Engineering and Management
Air Force Institute of Technology
Air University
Air Education and Training Command
In Partial Fulfillment of the Requirements for the
Degree of Master of Science in Engineering Management
Nathan M. Leuthold, BS
Captain, USAF
March 2012
DISTRIBUTION STATEMENT A APPROVED FOR PUBLIC RELEASE; DISTRIBUTION IS UNLIMITED.

AFIT/GEM/ENV/12-M12
A PROPOSED MEDIATION MODEL OF THE EFFECTS OF MOTIVATION FOR A HEALTHY LIFESTYLE: IMPACTS ON EMOTIONAL EXHAUSTION,
MEDICATION REGIMENS, AND LOW-DENSITY LIPOPROTEIN
Nathan M. Leuthold, BS Captain, USAF
Approved:
/signed/ 24 Feb 12 John J. Elshaw, Lt Col, USAF (Chairman) Date /signed/ 24 Feb 12 R. David Fass, Lt Col, USAF (Member) Date /signed/ 24 Feb 2012 Alfred E. Thal, Jr., PhD (Member) Date

AFIT/GEM/ENV/12-M12
iv
Abstract
This research addressed the question of, “How are behavioral indicators related to
physiological responses?” There were three theories (Conservation of Resources;
Planned Behavior; and Achievement Motivation) employed to build a proposed model of
the effects that an individual’s motivation for a healthy lifestyle will have on their
emotional exhaustion, daily medication usage, and low-density lipoprotein. Motivation
for a healthy lifestyle was hypothesized to have a negative relationship with emotional
exhaustion, while utilizing body mass index as a partial mediator. Emotional exhaustion
was hypothesized to have positive relationships with daily medication usage and low-
density lipoprotein. The model was tested using linear regression modeling and an
archival dataset that contained a behavioral survey, anthropometric measurements, and
blood samples. All the relationships except those between motivation for a healthy
lifestyle and emotional exhaustion, and the partial mediation were supported. An
alternate explanation for the lack of support for two of the hypotheses is included. This
research is unique, in that it incorporates behavioral constructs and physical outcomes, a
combination that has been identified as underutilized in the realms of organizational and
behavioral research.

v
Acknowledgments
Foremost, I am greatly indebted to my advisor, Lt Col John Elshaw for his
guidance and willingness to see me through to the end. I also greatly appreciate the
expertise and assistance provided by my committee: Lt Col Fass and Dr. Thal. I would
also like to thank Dr. Schlub and Dr. Moore at the WPAFB Health and Wellness Center
for their assistance with technical matters pertaining to the dataset; I would have been lost
in the data without them. Lastly, I would like to express my tremendous gratefulness to
my wonderful wife and children for their unending support!
Nathan M. Leuthold

vi
Table of Contents
Page
Abstract .............................................................................................................................. iv
Acknowledgments............................................................................................................... v
Table of Contents ............................................................................................................... vi
List of Figures .................................................................................................................. viii
List of Tables ..................................................................................................................... ix
List of Equations ................................................................................................................. x
I. Introduction .................................................................................................................... 1
Background .................................................................................................................... 2 Research Question & Theoretical Model ....................................................................... 2 How are behavioral indicators related to physiological responses? ............................... 2 Preview of Chapters ....................................................................................................... 4
II. Background of the Hypotheses of the Theoretical Model .............................................. 5
Definition of Constructs ................................................................................................. 5 Derivation of Hypotheses ............................................................................................... 9
III. Methodology & Results .............................................................................................. 20
Participants ................................................................................................................... 20 Data Collection ............................................................................................................ 22 Data Analysis Strategy ................................................................................................. 25 Power Analysis ............................................................................................................ 27 Results .......................................................................................................................... 32
IV. Discussion & Conclusion ........................................................................................... 38
Theoretical Implications .............................................................................................. 38 Managerial Implications .............................................................................................. 40 Limitations of the Research ......................................................................................... 40 Recommendations for Future Research ....................................................................... 42 Concluding Thoughts ................................................................................................... 43
Bibliography ..................................................................................................................... 44

vii
Page
Appendix A ....................................................................................................................... 61
Appendix B ....................................................................................................................... 78
Appendix C ....................................................................................................................... 79
Appendix D ....................................................................................................................... 85
Appendix E ....................................................................................................................... 88
Appendix F...................................................................................................................... 102

viii
List of Figures
Page
Figure 1: Proposed Mediation Model ................................................................................. 3
Figure 2: Scree Plot for Time 1 PCA ................................................................................ 24
Figure 3: Scree Plot for Time 2 PCA ................................................................................ 24

ix
List of Tables
Page
Table 1: Sampling of Existing Research on Stress Employing Physiological Measures . 17
Table 2: Number of Data Entries per Data Type at Times 1 & 2 ..................................... 21
Table 3: Power Analysis for Hypotheses 1, 2, & 3 ........................................................... 30
Table 4: Power Analysis for Hypothesis 4 ....................................................................... 30
Table 5: Power Analysis for Hypothesis 5 ....................................................................... 31
Table 6: Power Analysis for Hypothesis 6 ....................................................................... 31
Table 7: Pearson Correlations of Constructs .................................................................... 32
Table 8: Consolidated Results of Linear Regressions ...................................................... 33

x
List of Equations
Page
Equation 1 ......................................................................................................................... 29
Equation 2 ......................................................................................................................... 29

1
A PROPOSED MEDIATION MODEL OF THE EFFECTS OF MOTIVATION FOR A
HEALTHY LIFESTYLE: IMPACTS ON EMOTIONAL EXHAUSTION,
MEDICATION REGIMENS, AND LOW-DENSITY LIPOPROTEIN
I. Introduction
Organizational leaders and managers benefit from the good health of their
employees (Aldana & Pronk, 2001; Schultz & Edington, 2007). Beyond reductions in
sickness, benefits such as reduced anxiety and absenteeism have been linked to employee
health (Focht & Koltyn, 1999; Kobasa et al., 1982; Kobasa, Maddi, & Puccetti, 1982;
Long & van Stavel, 1995). Therefore, behaviors associated with good health could be
advocated by leaders and managers to help organizations reap the benefits associated
with better employee health (Goetzel et al., 2002; Mills, Kessler, Cooper, & Sullivan,
2007). Examples of such behaviors are healthy eating (Elmer et al., 2006), exercise
(Long & van Stavel, 1995), smoking cessation (Lisspers et al., 1999), even responsible
management of personal finances (James & Brown, 1997). Physiological indices have
been shown to be predictive of future health issues such as hypertension, diabetes, and
cardiovascular disease (Calle, Thun, Petrelli, Rodrequez, & Heath, 1999; Janssen,
Katzmarzyk, & Ross, 2002). Physiological indices have also been used as measures of
psychological constructs with negative effects on physical health, such as stress (Juster,
McEwen, & Lupien, 2010; Porges, 1995; Segerstrom & Miller, 2004) and anxiety
(Toker, Shirom, Shapira, Berliner, & Melamed, 2005).

2
Background
Psychological researchers have been interested in the body’s physiological
responses to psychological constructs for many years (Ilies, Dimotakis, & De Pater,
2010), but the employment of physiological measures are far less prevalent in the
behavioral research realm. Heaphy and Dutton (2008) observed that behavioral
researchers could greatly benefit from using physiological indices, but that the current
use is sparse. This research integrates behavioral, psychological, and physiological
constructs that can contribute to filling this gap in the existing literature. By integrating
these constructs, behavioral researchers can begin to examine the impact on an
individual’s physiology when they are experiencing various behavioral and psychological
phenomena. Additionally, the integration of constructs can provide researchers with
insight into how individual and organizational relationships can affect an individual’s
physiology, and how organizations can better allocate resources to mitigate potential
negative effects of those relationships (Heaphy & Dutton, 2008).
Research Question & Theoretical Model
In an effort to fill the gap identified by Heaphy and Dutton (2008), the following
research question is addressed:
How are behavioral indicators related to physiological responses?
The research question is accompanied by a theoretical model (Figure 1) depicting a
proposed relationship between behavioral constructs and physical outcomes.

3
Figure 1: Proposed Mediation Model
The model suggests an individual’s motivation for a healthy lifestyle, along with a
mediator variable, body mass index (BMI), predicts the level of emotional exhaustion
that an individual will experience in their work environment. The level of emotional
exhaustion will then be predictive of their daily medication usage and low-density
lipoprotein (LDL) levels in their blood. The model is underpinned by three theories:
Theory of the Conservation of Resources (Hobfoll, 1989), Theory of Planned Behavior
(Ajzen, 1991), and Achievement Motivation Theory (Atkinson & Feather, 1966). The
Theory of the Conservation of Resources is employed to explain the relationships in
hypotheses 2 through 6; additional resources gained through a healthy lifestyle will be
utilized in the work environment, therefore affecting emotional exhaustion and the
physical outcomes of daily medication usage and low-density lipoprotein. The
relationship in hypothesis 1 is explained by the theories of Planned Behavior and
Achievement Motivation; an individual will engage in those activities that they deem as
necessary to achieving a healthy lifestyle, and that these activities will impact their body
mass index.

4
Preview of Chapters
The remainder of this paper will consist of three chapters. Chapter II will define
each of the constructs and address the derivation of each hypothesis in turn, while
reviewing the relevant literature associated and the theoretical underpinnings. Chapter III
(Methodology & Results) will address the particulars of the archival dataset that was used
to test the theoretical model, as well as the data analysis strategy, and results of the
analysis. Chapter IV will discuss the research findings, its limitations, implications, and
recommendations for future research.

5
II. Background of the Hypotheses of the Theoretical Model
Definition of Constructs
The following paragraphs define the behavioral constructs and physical outcomes
that are being integrated in the proposed theoretical model. The constructs of the model
will be addressed in the order of hypothesis, as indicated in Figure 1. The first behavioral
construct to be defined is motivation. Motivation is defined as “a disposition to strive for
a certain kind of satisfaction, as a capacity for satisfaction in the attainment of a certain
class of incentives (Atkinson & Feather, 1966). Its definition has been expanded by other
theorists to include “nondirective, but energizing drive” (Brown, 1961). Motivation is a
proposed predecessor to the first physical outcome, body mass index (BMI). Body mass
index is an anthropometric measure calculated by dividing one’s body weight in
kilograms by the square of their height in meters (BMI = weight / height2 ) (Frankel &
Staeheli, 1992). A recommended BMI value is between 18.5 and 24.9; those under 18.5
are considered underweight, those between 25.0 and 29.9 are considered overweight and
those greater than 30.0 are considered obese (National Institutes of Health, 2010;
National Institutes of Health, ). Body mass index has been shown to be predictive of
health risks associated with obesity (Calle et al., 1999); however, some argue that waist
circumference is a better predictor of obesity- related health risks (Janssen, Katzmarzyk,
& Ross, 2004).
The second behavioral construct in the model is emotional exhaustion, which has
its roots in human stress. Human stress research started during the mid 1930s when
Walter Cannon suggested that stress was what he termed a “stimuli,” which was anything

6
that threatened the internal environment of the subject, such as oxygen deprivation or
cold temperatures (Elliot & Eisdorfer, 1982). In the 1950s, Hans Selye generated the
theory that stress was the body’s physiological response to an external stimulus that
threatened the body’s processes (Harries, 1997). The next 30 years of stress research saw
the introduction of additional theories, such as those regarding stress as a specific
response to a specific stimulus (Elliot & Eisdorfer, 1982), stimulus-based theories
merged with characteristics of the individual which Hobfoll termed, “Event-Perception
Viewpoints,” and models put forth by McGrath and Trumbull based on imbalances
between demands required of stressors, and the response capacity of the individual
(Hobfoll, 1989). Stressors can either present the individual with an opportunity for
personal development and growth or seen as obstacles to personal development and
growth; these two types of stressors are referred to as challenge stressors and hindrance
stressors, respectively (Podsakoff, Lepine, & LePine, 2007). Hindrance stressors usually
originate externally to the individual. In the case of work related hindrance stressors,
they can come from areas such as increased bureaucracy, role ambiguity, or inter-
personal conflicts (Rodell & Judge, 2009). Therefore, stress is to be defined as a state the
body assumes when external pressures are applied, which cause a shift in the body’s
physical, chemical, or emotional equilibrium (Elliot & Eisdorfer, 1982; Hobfoll, 1989).
Exposure to prolonged or chronic stress is why an individual experiences
emotional exhaustion. A body under chronic stress will be less likely to adapt to
environmental changes since the chronic stress depletes the physical and psychological
resources beyond the level required for adaptation (Epel, McEwen, & Ickovics, 1998).
Resources are defined as “those entities that are centrally valued in their own right or act

7
as a means to obtain centrally valued ends” (Hobfoll, 2002). Depletion of physiological
and psychological resources also allows chronic stress to hinder various aspects of daily
life, such as decision-making (McEwen, 2004), immunity (Herbert & Cohen, 1993),
psychological thriving (Epel et al., 1998), weight management (Dallman et al., 2003), and
motivation (Maslach, 2003). Additionally, research has demonstrated that individuals
under prolonged exposure to chronic stress are likely to suffer burnout (Bakker,
Schaufeli, Leiter, & Taris, 2008). Burnout is defined as exhaustion of physical and/or
emotional strength or motivation, commonly characterized by emotional exhaustion and
cynicism (Gonzalez-Roma, Schaufeli, Bakker, & Lloret, 2006; Hakanen, Bakker, &
Schaufeli, 2006; Schabracq, Winnubst, & Cooper, 2003). Reduced personal efficacy and
physical exhaustion have been postulated as additional characteristics of burnout, but
some researchers disagree (Brand et al., 2010; Cordes & Dougherty, 1993; Gonzalez-
Roma et al., 2006). The second behavioral construct of the theoretical model is
emotional exhaustion. Emotional exhaustion is defined as the draining of emotional
resources as a result of overtaxing work resulting in feelings of chronic fatigue
(Gonzalez-Roma et al., 2006; Hakanen et al., 2006; Langelaan, Bakker, van Doornen, &
Schaufeli, 2006).
In order to explain why the relationships in the model may exist, it is important to
define two more behavioral constructs: vigor and work engagement. These two
constructs play an important part in how the behavioral constructs of the model relate to
the physical outcomes. Vigor is conceptualized as the theoretical opposite of emotional
exhaustion (Bakker et al., 2008; Gonzalez-Roma et al., 2006). Vigor is defined as
possessing high levels of energy and mental resilience while working, the willingness to

8
invest effort in one’s work, and persistence in the face of difficulties (Bakker et al., 2008;
Gonzalez-Roma et al., 2006; Hakanen et al., 2006). Others argue that vigor is a separate
construct that can be experienced simultaneously with emotional exhaustion (Shraga &
Shirom, 2009). In this context, vigor is conceptualized as being divisible into three
categories: physical strength, such as that exerted during athletic activities; emotional
energy, such as feelings of pleasantness and contentment; and cognitive liveliness, such
as the feeling of being mentally awake (Shraga & Shirom, 2009). In the context of being
an opposite of emotional exhaustion, vigor is considered to be one of the three core
characteristics of work engagement. Work engagement is defined as positive feelings of
fulfillment and motivation regarding one’s work, characterized by vigor, absorption, and
dedication (Bakker, Demerouti, & Schaufeli, 2005; Kuhnel, Sonnentag, & Westman,
2009; Sonnentag, 2003). Work engagement differs from motivation in that motivation is
a means, while work engagement is an end-state of mind (Schaufeli, Salanova, Gonzalez-
Roma, & Bakker, 2002). Motivation for one’s work, or that “disposition to strive…”
(Salanova, Agut, & Peiro, 2005) or “energizing drive” (Atkinson & Feather, 1966), is a
predecessor to an individual being able to experience work engagement. Motivation has
been conceptualized as a process, in which physical and psychological inputs contribute
to a worker’s ability to experience work engagement (Brown, 1961).
The two physical outcomes on the right-hand side of the model are daily
medication usage and low-density lipoprotein (LDL). Daily medication usage is simply
an individual’s daily regime of prescription or non-prescription pharmacological
medications. Low-density lipoprotein is defined as a molecule found in the blood that is

9
composed of a lipid and a protein, the purpose of which is to transport fuel to bodily
tissues (Fulton, 1950; Worsiewicz, 1991).
Derivation of Hypotheses
The proposed theoretical model (Figure 1) rests on the Conservation of Resources
(COR) theory introduced by Hobfoll (1989):
This resource-oriented model is based on the supposition that people strive to retain, protect, and build resources and that what is threatening to them is the potential or actual loss of these valued resources. (p. 1)
The COR theory divides resources into four categories: objects, conditions, personal
characteristics, and energies. When any of these are reduced, humans attempt to
replenish or replace them (Hobfoll, 1989). Energy resources are further broken down
into physical, emotional, and cognitive domains (Hobfoll, 2002). Hobfoll’s theory has
been employed numerous times in recent years (Kuhnel et al., 2009; Llorens, Schaufeli,
Bakker, & Salanova, 2007; Mauno, Kinnunen, & Ruokolainen, 2007; Shraga & Shirom,
2009; Xanthopoulou, Bakker, Demerouti, & Schaufeli, 2007). As an example of its
recent application, Kuhnel et al. (2009) used COR theory as the framework for their study
on the effects of two to three day work respites on employee recovery and work
engagement. They hypothesized and found that since physical, emotional, and
psychological resources are necessary for work engagement (Kahn, 1990), the resource
recovery provided by two to three day work respites would increase work engagement
(Kuhnel et al., 2009). In the same way, physical and psychological resources necessary
for work engagement may be able to be replenished or replaced through motivation for a
healthy lifestyle. Individuals could utilize the physical and psychological strength and

10
endurance gained through a healthy lifestyle to either undergo the task of replenishing the
lost resources or to serve as replacements for the lost resources.
The Theory of Planned Behavior states, “Intentions are assumed to capture the
motivational factors that influence a behavior; they are indications of how hard people
are willing to try, of how much of an effort they are planning to exert, in order to perform
the behavior” (Ajzen, 1991). Individuals will engage in the behaviors necessary to
achieve success in the activities in which they desire to succeed. The greater their
intention to succeed, the more effort they will exert toward those behaviors that they have
determined are necessary for success; this is their strength of motivation. According to
the Theory of Achievement Motivation, “
The strength of the motivation to perform some act is assumed to be a multiplicative function of the strength of the motive (achievement in this case, which is the disposition to approach success), the expectancy that the act will have as a consequence the attainment of an incentive, and the value of the incentive. (Atkinson & Feather, 1966)
The success of motivation in fostering the adoption and continuance of healthy lifestyle
behaviors is well documented in existing literature (Dzewaltowski, 1989; Kilpatrick,
Hebert, & Bartholomew, 2005; Miller, Koceja, & Hamilton, 1997; Pinto et al., 2002;
Standage, Sebire, & Loney, 2008; Teixeira et al., 2006). A potential indicator of a
healthy lifestyle is Body Mass Index (BMI). Lowering body mass index over time is
linked to a healthy lifestyle through losses in body fat, as a result of increased calorie
utilization and decreased caloric intake; therefore, if an individual is determined to
succeed at implementing healthy lifestyle behaviors, then their BMI will decrease
(National Institutes of Health, 2010). Therefore, the following relationship is posited:

11
Hypothesis 1: Motivation for a healthy lifestyle has a negative relationship
with BMI.
In line with the COR theory of reasoning, the physical and psychological
resources gained through a healthy lifestyle could benefit individuals in terms of reducing
their experiences of burnout and its core characteristic of emotional exhaustion. The
existing literature indicates that the employment of physical exercise for the purposes of
influencing burnout and work engagement can range from highly individualized, user
specific plans (Mills et al., 2007), to web-based initiatives for wide implementation
across an organization (Cook, Billings, Hersch, Back, & Hendrickson, 2007), to group
efforts designed to increase cohesion and engagement while reducing conflict (Stockton,
Rohde, & Haughey, 1992). Existing studies report significant relationships between
exercise programs and illness, anxiety, and absenteeism (Focht & Koltyn, 1999; Kobasa
et al., 1982; Kobasa et al., 1982; Long & van Stavel, 1995), but not unanimously
(Hughes, Casal, & Leon, 1986). Additionally, some researchers have suggested that low
to moderate intensity was superior to high intensity (Steptoe & Cox, 1988), but not
exclusively (Altchiler & Motta, 1994). Salmon (2001) published a meta-analytical
review of existing literature regarding exercise and stress. The studies he compiled tend
to address aerobic exercise, as opposed to anaerobic exercise, and measures of the
cardiovascular system (Salmon, 2001). Salmon (2001) delineates between laboratory and
real-life stressors, as well as experimental and cross-sectional studies, for which he
defines cross-sectional studies as those that select participants based on current fitness
and past exercise participation, as opposed to experimental studies in which exercise
participation is controlled. The laboratory stressors predominately fell in the realm of

12
acute stress introduced through various tasks or interpersonal interactions, while the real-
life stressors would tend to be more representative of chronic stress. Real-life stress was
found to be reduced in individuals who reported higher levels of physical activity
(Salmon, 2001). These studies are of particular interest, because the real-life stress
situations defined by Salmon (2001) include the day-to-day aspects that could contribute
to chronic stress and burnout. Healthy eating has also been shown to correlate with
decreased burnout (Eastman, 1996; Fall, Wolf, Schiller, & Wilson, 2003).
Decreases in BMI could lead to increased physical resources, because of lower
body fat content and greater overall health. These physical resources can then be carried
over and expended in the work environment. The expenditure of carried-over physical
resources in the work environment could lead to less emotional exhaustion. Therefore,
the following relationship is posited:
Hypothesis 2: BMI has a positive relationship with emotional exhaustion.
Just as the COR theory allows for the carryover of resources from non-work to
work activities, the Theory of Achievement Motivation states that an individual’s
motivation for achievement does not need to be specific to a certain activity but can be a
general motivation to succeed (Atkinson & Feather, 1966). While existing studies
support how and why one’s motivation for a healthy lifestyle influences one’s
engagement in activities concomitant with a healthy lifestyle, such as exercising and
healthy eating (Dansinger, Tatsioni, Wong, Chung, & Balk, 2007; Plonczynski, 2000),
and how motivation for work effects job performance (Latham & Pinder, 2005; Lu,
1999), there is a gap in the existing literature regarding how motivation for a healthy

13
lifestyle impacts one’s work related emotional exhaustion. The following relationship
was posited to address this gap:
Hypothesis 3: Motivation for a healthy lifestyle has a negative relationship
with emotional exhaustion.
Along with the relationships posited in Hypotheses 1-3, a mediation relationship
is also depicted in the theoretical model (Figure 1). Mediators are said to “explain how
external physical events take on internal psychological significance” and “speak to the
how and why such effects occur” (Baron & Kenny, 1986). Mediation can be either
complete or partial. Partial mediation is present in a model when the product of the
effects of the independent variable and the mediator (the indirect effect) is smaller than,
and of the same sign as, the total effect of the independent variable on the dependent
variable when the mediator is excluded (Shrout & Bolger, 2002). When the indirect
effect and the total effect are equal, complete mediation is said to exist (Shrout & Bolger,
2002). The mediation of the relationship between the independent variable and
emotional exhaustion may be due to the increased vigor experienced by the individual
that they carry over from the non-work to the work environment. Current literature
supports the notion that vigor can carry over from non-work to work environments
(Shraga & Shirom, 2009). Studies have also shown positive relationships between
exercise and vigor (Hughes et al., 1986; Steptoe & Cox, 1988; Wilfey & Kunce, 1986).
Successes in BMI reduction due to a healthy lifestyle could serve as a psychological
replacement for expended resources. Along with the carry-over of vigor supported by the
COR theory, this notion is also supported by the Theory of Counter-conditioning. The
Theory of Counter-conditioning posits that the repeated exposure to a controlled stressor

14
would hasten one’s adaptation to stress (Weiss, Glazer, Pohorecky, Brick, & Miller,
1975). The physical act of exercise, and the self discipline required for healthy eating,
may fill the role of a controlled stressor. Salmon (2001) agrees that “The particular value
of exercise might therefore be that it is a controllable stressor.” A decrease in BMI may
be viewed by the individual as success due to a behavior they determined as necessary for
success, thereby resulting in increased emotional energy, a category of vigor, which can
be carried over for expenditure in the work environment. This would explain the
“psychological significance” of the “external physical event” of decreased BMI. The
following relationship is, thus, posited:
Hypothesis 4: BMI will partially mediate the relationship between motivation
for a healthy lifestyle, and emotional exhaustion.
Individuals lacking sufficient physical and psychological resources may be more
prone to take short-cuts, such as daily medication usage, to compensate for those
resources. Sonnenshchein et al. (2007) observed that test subjects experiencing burnout
had a greater affinity for sleep medication usage than those not experiencing burnout.
Similarly, Ahola et al. (2007) showed that individuals suffering from burnout had higher
rates of antidepressant usage, even when controlling for depression and anxiety disorders,
than those not suffering from burnout. However, other studies have shown no correlation
between burnout and affinity for medication use (Lindeberg et al., 2008). The issues that
are commonly treated by regular medication usage, such back pain, chronic fatigue,
trouble sleeping, type 2 diabetes, and high cholesterol, could be treated through long-term
lifestyle changes, such as increased exercise and healthier eating to promote weight loss
or overall increased health (Kaplan, Hartwell, Wilson, & Wallace, 1987; Sonnenschein,

15
Sorbi, van Doornen, Schaufeli, & Maas, 2007; Tekur, Singphow, Romarao Nagendra, &
Raghuram, 2008; Ueno et al., 1997; Wood et al., 1988). In line with the COR theory
though, individuals experiencing emotional exhaustion will not possess the excess
personal resources necessary to make the long-term lifestyle changes. Medication
provides a quicker solution, requiring less expense of personal resources; therefore, the
following relationship is posited:
Hypothesis 5: Emotional exhaustion will have a positive relationship with
daily medication use.
Along with depleting physical and psychological resources needed for long-term
lifestyle changes, emotional exhaustion has also been shown to have physiological effects
on the human body (Melamed, Kushnir, & Shirom, 1992; Melamed et al., 1999).
Existing literature contains numerous studies demonstrating the physiological effects of
stress, which is a known predecessor of emotional exhaustion (Gonzalez-Roma et al.,
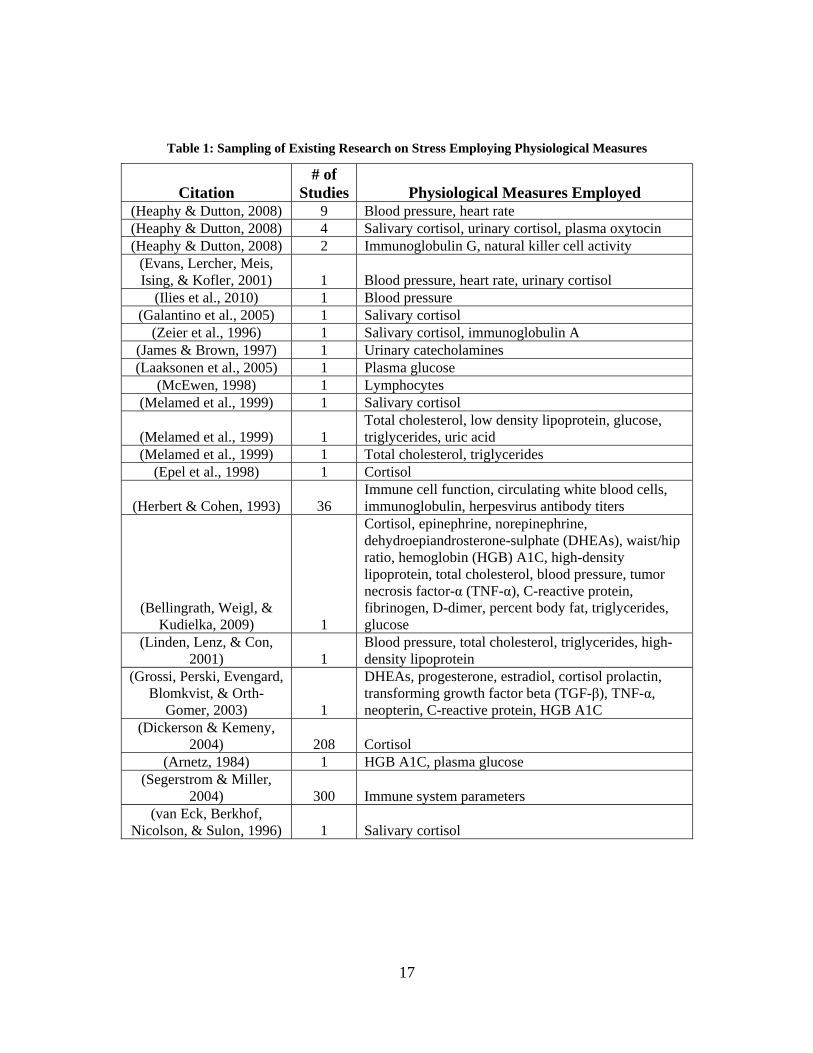
2006; Langelaan et al., 2006). Table 1 provides a sampling of some of those studies. A
quick inspection of the table shows that, by and large, acute stress is the most commonly
measured psychological construct and that cardiovascular (blood pressure and heart rate),
hypothalamic-pituitary-adrenal (HPA) axis, and immune system responses are the most
often employed items of physiological measure. Further examination of the table shows
that immune system factors such as lymphocytes (McEwen, 1998), white blood cell count
(Herbert & Cohen, 1993), and salivary immunoglobulin A (Zeier, Brauchli, & Joller-
Jemelka, 1996), along with many others (Segerstrom & Miller, 2004), have been
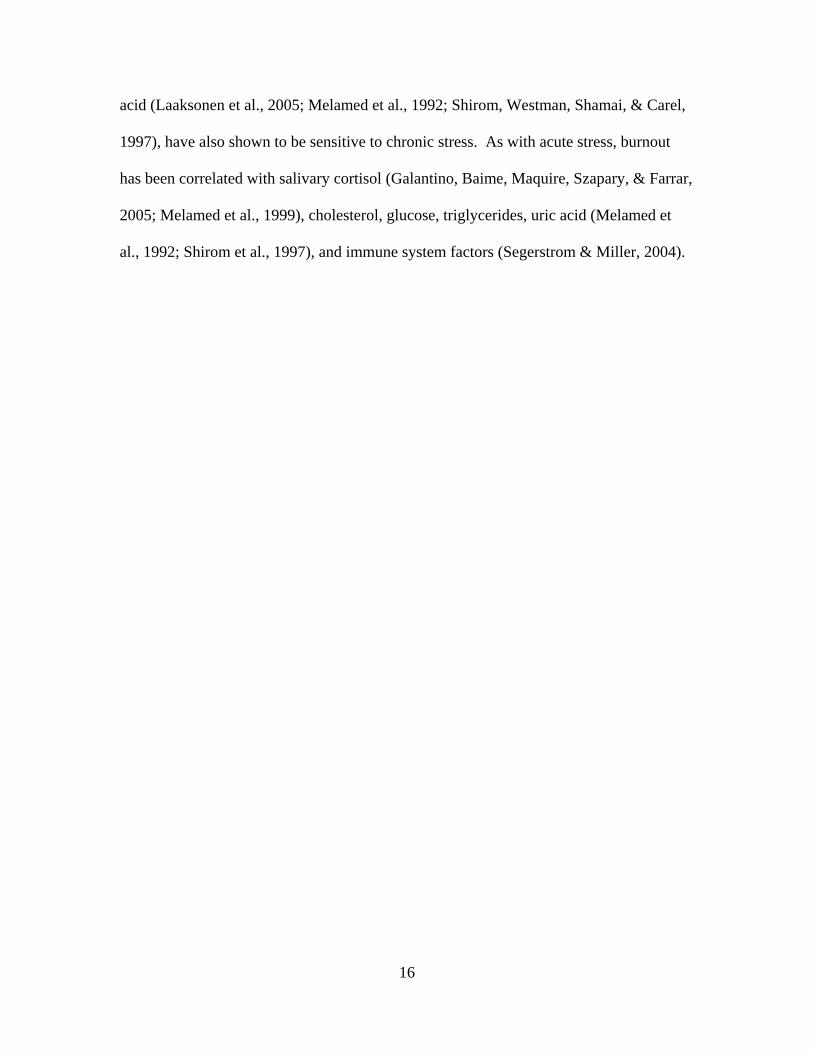
correlated with chronic stress and burnout. Factors associated with cardiovascular
disease, such as glucose, total cholesterol, low-density lipoprotein, triglycerides, and uric
16
acid (Laaksonen et al., 2005; Melamed et al., 1992; Shirom, Westman, Shamai, & Carel,
1997), have also shown to be sensitive to chronic stress. As with acute stress, burnout
has been correlated with salivary cortisol (Galantino, Baime, Maquire, Szapary, & Farrar,
2005; Melamed et al., 1999), cholesterol, glucose, triglycerides, uric acid (Melamed et
al., 1992; Shirom et al., 1997), and immune system factors (Segerstrom & Miller, 2004).
17
Table 1: Sampling of Existing Research on Stress Employing Physiological Measures
Citation # of
Studies Physiological Measures Employed (Heaphy & Dutton, 2008) 9 Blood pressure, heart rate (Heaphy & Dutton, 2008) 4 Salivary cortisol, urinary cortisol, plasma oxytocin (Heaphy & Dutton, 2008) 2 Immunoglobulin G, natural killer cell activity
(Evans, Lercher, Meis, Ising, & Kofler, 2001) 1 Blood pressure, heart rate, urinary cortisol
(Ilies et al., 2010) 1 Blood pressure (Galantino et al., 2005) 1 Salivary cortisol
(Zeier et al., 1996) 1 Salivary cortisol, immunoglobulin A (James & Brown, 1997) 1 Urinary catecholamines (Laaksonen et al., 2005) 1 Plasma glucose
(McEwen, 1998) 1 Lymphocytes (Melamed et al., 1999) 1 Salivary cortisol
(Melamed et al., 1999) 1 Total cholesterol, low density lipoprotein, glucose, triglycerides, uric acid
(Melamed et al., 1999) 1 Total cholesterol, triglycerides (Epel et al., 1998) 1 Cortisol
(Herbert & Cohen, 1993)
36 Immune cell function, circulating white blood cells, immunoglobulin, herpesvirus antibody titers
(Bellingrath, Weigl, & Kudielka, 2009) 1
Cortisol, epinephrine, norepinephrine, dehydroepiandrosterone-sulphate (DHEAs), waist/hip ratio, hemoglobin (HGB) A1C, high-density lipoprotein, total cholesterol, blood pressure, tumor necrosis factor-α (TNF-α), C-reactive protein, fibrinogen, D-dimer, percent body fat, triglycerides, glucose
(Linden, Lenz, & Con, 2001) 1
Blood pressure, total cholesterol, triglycerides, high-density lipoprotein
(Grossi, Perski, Evengard, Blomkvist, & Orth-
Gomer, 2003) 1
DHEAs, progesterone, estradiol, cortisol prolactin, transforming growth factor beta (TGF-β), TNF-α, neopterin, C-reactive protein, HGB A1C
(Dickerson & Kemeny, 2004) 208 Cortisol
(Arnetz, 1984) 1 HGB A1C, plasma glucose (Segerstrom & Miller,
2004) 300 Immune system parameters (van Eck, Berkhof,
Nicolson, & Sulon, 1996) 1 Salivary cortisol
18
Low-density lipoprotein (LDL) is a molecule made up of a lipid and a protein; its
purpose is to transport triglycerides and free fatty acids to the bodily tissues to be used as
fuel (Fulton, 1950; Worsiewicz, 1991). Low-density lipoprotein is a derivative of very
low-density lipoprotein which has had some of its triglycerides hydrolyzed for use by the
bodily tissues. As the triglycerides are removed, the lipoprotein is left with higher
concentrations of cholesterol and phospholipids; this results in a low-density lipoprotein
(Worsiewicz, 1991). Low-density lipoprotein is a known factor in the development of
arteriosclerosis (hardening of the arteries) and cardiovascular disease (Juster et al., 2010;
Melamed et al., 1992). Cardiovascular disease has been shown to have a positive
association with allostatic load, which is the wear and tear that the body experiences as a
result of over-activation of the sympathetic nervous system (SNS) (Juster et al., 2010).
The SNS is responsible for what are often referred to as the “fight-or-flight” responses.
The engagement of the SNS can cause glycogen stores in the liver to be converted back
into glucose and reabsorbed into the blood, thereby increasing blood glucose levels. The
desire of the body to maintain homeostasis causes the beta cells of the islets of
Langerhans, contained in the pancreas, to secrete insulin in reaction to an elevated blood
glucose level. Prolonged activation of the beta cells of the islets of Langerhans can lead
to depleted production of insulin (Worsiewicz, 1991). Reduced presence of insulin in the
blood causes the body to convert fat deposits in the adipose tissue into triglycerides and
free fatty acids for use by bodily cells, which are transported by lipoproteins in the
plasma (Worsiewicz, 1991). This re-absorption of stored fat occurs because the lack of
insulin, wherein insulin is required for up-take of glucose by cells, prohibits the body

19
from burning glucose for energy as it normally would; the body thus resorts to burning
stored fats (Worsiewicz, 1991).
Another potential explanation for the relationship between emotional exhaustion
LDL is that individuals experiencing emotional exhaustion may be prone to consume
foods that are higher in saturated fat. Overeating, alcohol abuse, and engagement in other
behaviors related to ill-health have been linked to individuals experiencing burnout
(Laurie, 2001; Pompili et al., 2006). Consumption of foods high in saturated fat is known
to cause increases in LDL (Fulton, 1950). Rather than either the physiological
explanation or the consumption explanation being responsible for the emotional
exhaustion – LDL relationship on its own, the two explanations may be complementary;
therefore, the following relationship is hypothesized:
Hypothesis 6: Emotional exhaustion will have a positive relationship with
LDL.

20
III. Methodology & Results
Participants
The theoretical model will be tested using an archival dataset. The dataset
resulted from a study conducted by the Wright Patterson Air Force Base (WPAFB)
Health and Wellness Center (HAWC) titled, “Effect of Dietary, Exercise, Motivational
Interventions, and Goal-Setting Strategies on Positive Lifestyle Change and Reducing
Health Risk Factors among Civilian Personnel with Various Disease Risk Parameters.”
According to the Proposal for Clinical Investigation (Appendix A), the purpose of the
study was to “determine if active intervention with education and support in
motivation/goal setting strategies for positive lifestyle changes in the areas of fitness and
nutrition positively affects risk for disease.” The motivation for the study was to address
concerns related to an observed increase in morbidity and mortality rates among WPAFB
civilian employees. Participants for the study were solicited from the WPAFB civilian
population, with the requirement that each individual be between the ages of 18 and 65
years, and possess at least two of the following criteria:
Blood Pressure > 140/90
Total Cholesterol > 240
Body Mass Index > 30
Fasting Blood Glucose > 140
Waist Circumference:
Men > 40 inches
Women > 35 inches
21
Active smoker
Aerobic exercise < twice a week
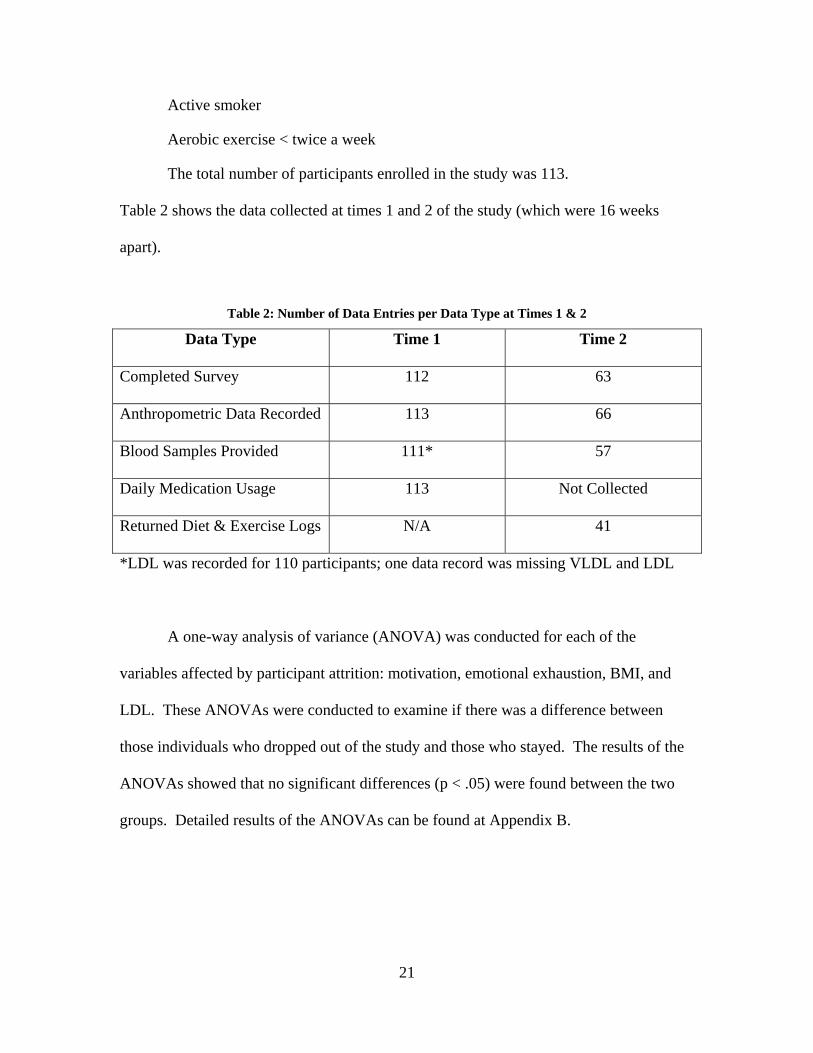
The total number of participants enrolled in the study was 113.
Table 2 shows the data collected at times 1 and 2 of the study (which were 16 weeks
apart).
Table 2: Number of Data Entries per Data Type at Times 1 & 2
Data Type Time 1 Time 2
Completed Survey 112 63
Anthropometric Data Recorded 113 66
Blood Samples Provided 111* 57
Daily Medication Usage 113 Not Collected
Returned Diet & Exercise Logs N/A 41
*LDL was recorded for 110 participants; one data record was missing VLDL and LDL
A one-way analysis of variance (ANOVA) was conducted for each of the
variables affected by participant attrition: motivation, emotional exhaustion, BMI, and
LDL. These ANOVAs were conducted to examine if there was a difference between
those individuals who dropped out of the study and those who stayed. The results of the
ANOVAs showed that no significant differences (p < .05) were found between the two
groups. Detailed results of the ANOVAs can be found at Appendix B.

22
Data Collection
The participant’s levels of emotional exhaustion and motivation for participation
in a healthy lifestyle program were evaluated by a survey (Appendix C) administered at
the beginning (Time 1) and end (Time 2) of the 16-week study period. For the purposes
of this thesis, “healthy lifestyle” will be operationalized as “exercise and healthy eating.”
A seven-point Likert scale ranging from “1 = Strongly Disagree” to “7 = Strongly Agree”
was used for the emotional exhaustion and motivation items. There were nine items
measuring emotional exhaustion and nine items measuring motivation. Examples of the
emotional exhaustion items are: “I feel burned-out from my work” and “I feel used up at
the end of the day.” No reversed-coded items were used for emotional exhaustion.
Examples of the motivational items are: “I want to do well in this program” and “I am
extremely motivated to do well in this program.” Two reverse-coded motivation items
were used (e.g., “I just don’t care how I do in this program”). Reliability analysis was
conducted for the motivation items at Time 1 (α = .91) and Time 2 (α = .95), and
emotional exhaustion items at Time 1 (α = .92) and Time 2 (α = .92). Detailed output of
the reliability analysis can be found at Appendix D.
A principal component analysis (PCA) was conducted on the eighteen motivation
and emotional exhaustion items for Time 1 and Time 2. The PCA utilized varimax
rotation, with a fixed number of factors to be extracted (2), and coefficient values below
.4 suppressed. The Kaiser-Meyer-Olkin (KMO) measure verified the sampling adequacy
of the analysis: KMO for Time 1 = .85, with all KMO values for individual items > .7;
KMO for Time 2 = .76, with all KMO values for individual items > .64, which is above
the acceptable limit of .5(Field, 2009). Bartlett’s test of sphericity yielded: Time 1 Χ2

23
(153) = 1910.31, p < .001; Time 2 Χ2 (153) = 1134.94, p < .001, which indicated that the
correlations between items were sufficiently large for PCA. Two components explained
66.65% of the variance for Time 1, and 68.29% of the variance for Time 2; this was
depicted by the scree plots at Figure 2 and Figure 3. Detailed output of the PCA can be
found at Appendix E.

24
Figure 2: Scree Plot for Time 1 PCA
Figure 3: Scree Plot for Time 2 PCA

25
Anthropometric measurements and blood samples were taken at times 1 and 2 of
the study. The following anthropometric data were collected: height, waist measurement,
inter-iliac crest width, weight, body fat analysis, and body mass index (BMI. Blood
samples were collected by venipuncture at the WPAFB medical center. All blood
samples were analyzed for the following factors: C-reactive protein, blood glucose,
hemoglobin A1C, homocysteine, lipid profile, and complete blood count with
differentiation.
Data regarding daily medication usage were collected at Time 1 of the study. The
medications were broken into the following categories: asthma, gastro-esophageal reflux,
high blood pressure, diabetes, non-steroidal anti-inflammatory, mental health, anti-lipids,
hypothyroid, and a miscellaneous category for any other daily medications, such as a
daily regimen of aspirin or ibuprofen for back or muscle pain. Daily participation in
exercise and healthy eating was logged by the participant for the following categories and
submitted at Time 2 of the study: days at/below recommended calories, days consuming
> 5 servings fruits/vegetables, days consuming > 5 glasses of water, days consuming >
25mg of fiber, days doing at least 20 minutes of aerobic exercise, days doing strength
training, days with total steps taken > 10,000.
Data Analysis Strategy
Due to the sample size of the archival dataset, linear regression modeling was
employed to test the hypotheses of the theoretical model. The dataset contains 113
records, which is too few for structural equation modeling or path analysis (Field, 2009).
Regression modeling does not provide the same level of causal analysis as structural

26
equation modeling or path analysis; however, it does allow for the testing of, and control
for, more variables than would a simple t-test conducted for each hypothesis.
To prepare the data for regression analysis, a mean value was calculated for
emotional exhaustion and motivation from the Likert values entered in the surveys.
Separate means were calculated for times 1 and 2. Deltas between times 1 and 2 were
then calculated for each participant’s emotional exhaustion and motivation; the deltas
were calculated as “Delta = Time 2 – Time 1” in order to depict increases as positive
values. For example, if someone had a higher mean emotional exhaustion at Time 2, then
their delta of emotional exhaustion would be a positive number; if they had a lower mean
emotional exhaustion at Time 2, then their delta of emotional exhaustion would be
negative. The deltas were not made absolute values in order to predict that an
increase/decrease in one construct would be related to an increase/decrease in another
construct.
Along with linear regression modeling, the Baron and Kenny (1986) method for
testing for mediation was conducted in order to test Hypothesis 4. Baron and Kenny
(1986) indicates that for mediation to be present, the following three conditions must to
true: 1) the independent variable must affect the mediator when regressing the mediator
on the independent variable, 2) the independent variable must affect the dependent
variable when regressing the dependent variable on the independent variable, and 3) the
mediator must affect the dependent variable when regressing the dependent variable on
the mediator and independent variable, simultaneously. If the effect of the independent
variable is greater in condition 2 than condition 3, and in accordance with the
hypothesized direction, then mediation is present (Baron & Kenny, 1986).
27
Power Analysis
Statistical power (1 – β), significance criterion (α), sample size (N), and effect
size are the four basic parameters of statistical inference, of which three are usually
known, or estimated, and used in calculating the fourth (Cohen, 1987). Cohen (1987)
argues that a power analysis should be completed to either ascertain the required sample
size needed to achieve adequate statistical power to reject a null hypothesis or, in a case
such as this thesis, to determine the statistical power provided by an archival data set.
Historically, employment of rules-of-thumb has been popular in calculating a
required sample size for regression modeling (Cohen, 1987). While some rules-of-thumb
simply call for a baseline number of subjects for regression analysis regardless of the
number of predictor variables, others are more complex and are computed based on the
number of predictor variables to be incorporated into the regression model (Green, 1991).
Rules-of-thumb are attractive due to their ease of use, but Cohen (1987) argues that such
an approach ignores the importance of effect size, thereby leading to either premature
rejection of the null hypothesis or unnecessary reluctance to reject the null hypothesis.
Cohen (1987) is not alone in his preference for power analysis over rules-of-thumb
(Field, 2009; Green, 1991). When conducting a power analysis to determine sample size,
the estimation of effect size is said to be the most difficult parameter to establish because
it must be posited prior to testing, when a researcher may not know how much of an
effect a predictor variable, or combination of variables, may have on a dependent variable
(Maxwell, 2000). Cohen (1987) posits three ways to estimate effect size: theory, past
research, and setting operational definitions. He established operational definitions for
regression analysis as .10, .30, and .50 for small, medium, and large effect sizes,

28
respectively; a power of .80 is typically regarded as sufficient for behavioral research
(Cohen, 1987). Cohen (1987) asserts that small effect sizes are likely observed in areas
such as “personality, social, and clinical-psychological research,” while behavioral
science studies often yield medium effect sizes and large effect sizes may be likely in
“sociology, economics, and experimental and physiological psychology…or the presence
of good experimental control…” While operational definitions of the effect sizes are
helpful for narrowing estimation, the true effect size being employed for sample size
calculations should be firmly based in the researcher’s knowledge of the subject and
theory supporting the hypothesized outcome of the study (Cohen, 1987; Field, 2009;
Green, 1991).
When employing an archival dataset, the need is not to determine sample size to
achieve sufficient statistical power, but rather to calculate the power provided by the
dataset and evaluate whether or not it will be adequate to detect the effects of the
predictor variable(s). In order to facilitate conducting the power analysis, Cohen
provides tables containing recommended sample sizes broken down by expected effect
size and proposed significance criterion (α). As opposed to the earlier stated definitions
of small, medium, and large effect size recommended for simple hypothesis testing, an
index of f2 values (which Cohen (1987) describes in detail how to compute) is used for
entering the tables with values of .02, .15, and .35 for small, medium, and large,
respectively (Cohen, 1987).
Table 3 through 6 show the power provided by the dataset for each hypothesis.
For evaluation of the power values provided in the tables, a minimum power requirement
of .8 is utilized, based on Cohen’s (1987) recommended 4:1 ratio of α to β. A power of .8

29
represents an 80% chance of detecting an existing effect (Field, 2009). Effect sizes are
from Cohen’s (1987) operational definitions for behavioral sciences. The non-centrality
parameter (L) is calculated in the following way:
L = f2 * v
Equation 1
(1)
Where: L = Non-centrality parameter f2 = Effect size v = Error value
The error value (v) is calculated in the following way:
v = (N – u – 1)
Equation 2
(2)
Where: v = Error value N = Sample size u = Number of independent variables

30
Table 3: Power Analysis for Hypotheses 1, 2, & 3
Utilizing Table 9.3.2 (Cohen, 1987) α = 0.05; N = 63
Effect Size f2 v L Power
Small .02 61 1.22 *
Medium .15 61 9.15 .856
Large .35 61 21.35 .99
* Value of L was too small for entering Cohen (1987) Table 9.3.2
Table 4: Power Analysis for Hypothesis 4
Utilizing Table 9.3.2 (Cohen, 1987) α = 0.05; N = 63
Effect Size f2 v L Power
Small .02 60 1.2 *
Medium .15 60 9.0 .77
Large .35 60 21.0 .99
* Value of L was too small for entering Cohen (1987) Table 9.3.2

31
Table 5: Power Analysis for Hypothesis 5
Utilizing Table 9.3.2 (Cohen, 1987) α = 0.05; N = 112
Effect Size f2 v L Power
Small .02 110 2.2 .313
Medium .15 110 16.5 .983
Large .35 110 38.5 .99
Table 6: Power Analysis for Hypothesis 6
Utilizing Table 9.3.2 (Cohen, 1987) α = 0.05; N = 54
Effect Size f2 v L Power
Small .02 52 1.04 *
Medium .15 52 7.8 .798
Large .35 52 18.2 .99
* Value of L was too small for entering Cohen (1987) Table 9.3.2

32
Results
Table 7 shows the results of the Pearson correlations of the constructs within the
model, while Table 8 provides a consolidated view of the linear regression results. It is
important to note that there are two forms of the emotional exhaustion construct in Table
7, but only one in the model. One shows the change in mean emotional exhaustion
between times 1 and 2, while the other one shows the mean level of emotion exhaustion
at Time 1. These two forms of the emotional exhaustion construct are needed, because in
order to regress the daily use of miscellaneous medication, which was recorded at Time 1
only, with emotional exhaustion, a Time 1 mean of emotional exhaustion was required.
A detailed output for each regression can be found at Appendix F.
Table 7: Pearson Correlations of Constructs
Delta of
Mot. Delta of
BMI
Delta of Emo.
Exhaust
Emo. Exhaust (Time 1)
Misc. Meds
(Time 1)
Delta of LDL
Delta of Motivation
Pearson Correlation
Delta of BMI
Pearson Correlation
-.376*
Delta of Emotional Exhaustion
Pearson Correlation
-.186 .377*
Emotional Exhaustion (Time 1)
Pearson Correlation
.032 -.227 -.354*
Misc. Meds (Time 1)
Pearson Correlation
-.010 -.116 -.021 .256*
Delta of LDL
Pearson Correlation
-.058 .304* .289* -.117 -.068
* Significant at the p < .05 level

33
Table 8: Consolidated Results of Linear Regressions
Hypothesis Unstandardized Beta
Standardized Beta (β)
R2-value F-ratio (df)
Significance
H1 -.724 -.376 .141 10.033 (1, 61)
.002
H2 .248 .377 .142 10.082 (1, 61)
.002
H3 -.236 -.186 .035 2.195 (1, 61)
.144
H4* Ind. Var. = -.066 Mediator = .235
Ind. Var. = -.052 Mediator = .357
.144 5.054 (2, 60)
.009
H5 .072 .256 .066 7.713 (1, 110)
.006
H6 5.721 .289 .083 4.731 (1, 52)
.034
* Values are for step 3 of the Baron and Kenny (1986) test for mediation: dependent variable regressed on mediator and independent variable
When evaluating the hypotheses, it is important to consider the Pearson’s
correlation coefficient, the standardized Beta, the R2-value, the F-ratio, and the
significance (Field, 2009). In the case of single variable regressions, such as Hypotheses
1, 2, 3, 5, and 6, the magnitude of the Pearson’s correlation coefficient represents the
overall fit of the regression model (Field, 2009). Pearson’s correlation coefficient is also
a measure of effect size. The standardized Beta indicates the strength of the relationship
between the independent and dependent variables by representing the amount of change
in the dependent variable that will be observed based on a single unit change in the
independent variable (Field, 2009). The R2-value represents that amount of variation in
the dependent variable that can be explained by the independent variable (Field, 2009).
The F-ratio indicates the average amount of variability in the data that the model can
explain, compared to the amount it cannot explain; an F-ratio of greater than 1 is
desirable, because this means that the amount of variability in the data that the model can
34
explain is greater than the amount that it cannot explain (Field, 2009). The significance
indicates if the independent variable is making a significant contribution to the outcome
of the dependent variable; a significance of < .05 is indicative of a genuine effect by the
independent variable (Field, 2009).
Hypothesis 1
Hypothesis 1, “motivation for a healthy lifestyle has a negative relationship with
BMI,” was supported (β = -.376, p < .05). The Pearson’s correlation coefficient (-.376) is
greater than the estimated large effect size (.35), thus yielding a power (.99) well above
the required .8. The negative sign on the Pearson’s coefficient indicates that the
hypothesized negative relationship is supported. The R2-value of .141 indicates that a
change in motivation for a healthy lifestyle accounts for 14.1% of the variance in the
change in BMI, and the F-ratio (F (1,61) = 10.033, p = .002) indicates that the amount of
explainable variance is greater than the amount of unexplainable variance. The
relationship between the independent and dependant variables is significant (p < .05),
thereby indicating that a change in motivation is negatively related to a change in BMI.
Hypothesis 2
Hypothesis 2, “BMI has a positive relationship with emotional exhaustion,” was
supported (β = .377, p < .05). The Pearson’s correlation coefficient (.377) is greater than
the estimated large effect size (.35), thus, yielding a power (.99) well above the required
.8. The positive sign on the Pearson’s coefficient indicates that the hypothesized positive
relationship is supported. The R2-value of .142 indicates that a change in BMI accounts
for 14.2% of the variance in the change in emotional exhaustion, and the F-ratio (F (1,
61) = 10.082, p = .002) indicates that the amount of explainable variance is greater than
35
the amount of unexplainable variance. The relationship between the independent and
dependant variables is significant (p < .05), thereby indicating that a change in BMI is
positively related to emotional exhaustion.
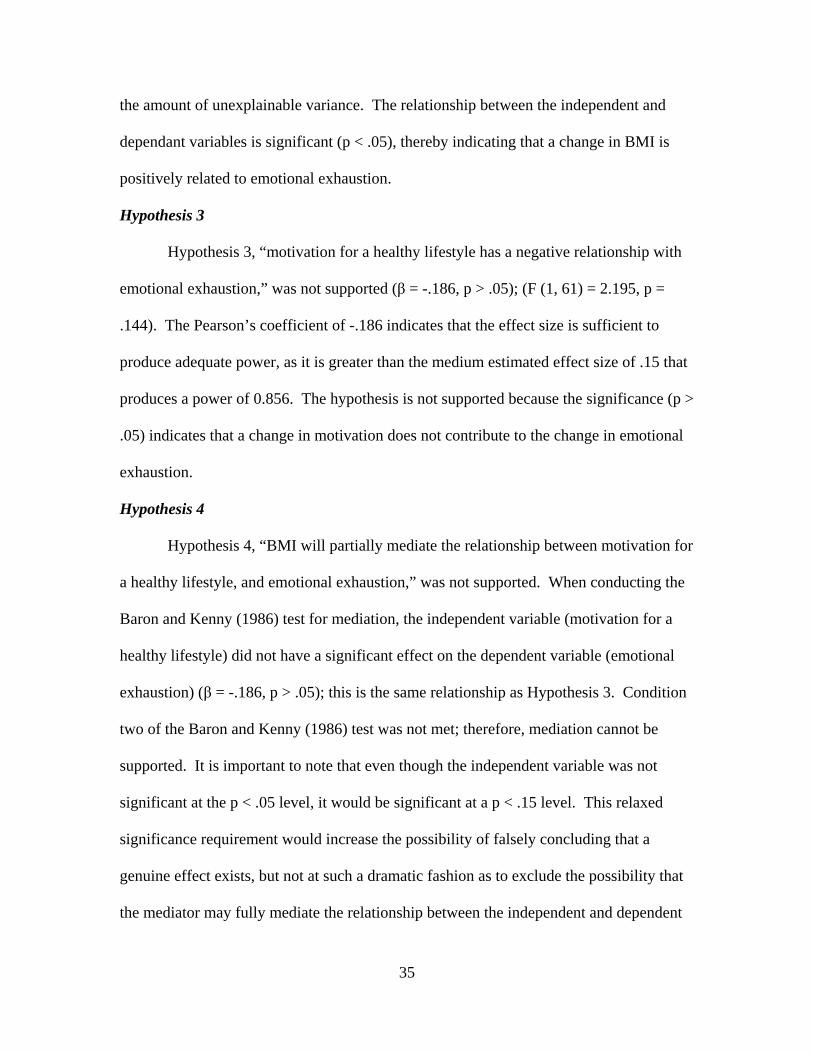
Hypothesis 3
Hypothesis 3, “motivation for a healthy lifestyle has a negative relationship with
emotional exhaustion,” was not supported (β = -.186, p > .05); (F (1, 61) = 2.195, p =
.144). The Pearson’s coefficient of -.186 indicates that the effect size is sufficient to
produce adequate power, as it is greater than the medium estimated effect size of .15 that
produces a power of 0.856. The hypothesis is not supported because the significance (p >
.05) indicates that a change in motivation does not contribute to the change in emotional
exhaustion.
Hypothesis 4
Hypothesis 4, “BMI will partially mediate the relationship between motivation for
a healthy lifestyle, and emotional exhaustion,” was not supported. When conducting the
Baron and Kenny (1986) test for mediation, the independent variable (motivation for a
healthy lifestyle) did not have a significant effect on the dependent variable (emotional
exhaustion) (β = -.186, p > .05); this is the same relationship as Hypothesis 3. Condition
two of the Baron and Kenny (1986) test was not met; therefore, mediation cannot be
supported. It is important to note that even though the independent variable was not
significant at the p < .05 level, it would be significant at a p < .15 level. This relaxed
significance requirement would increase the possibility of falsely concluding that a
genuine effect exists, but not at such a dramatic fashion as to exclude the possibility that
the mediator may fully mediate the relationship between the independent and dependent

36
variables. Full mediation is present “if the independent variable has no effect when the
mediator is controlled” (Baron & Kenny, 1986). When the dependent variable is
regressed simultaneously on the mediator and the independent variable (F (2, 60) = 5.054,
p = .009), the mediator is significant (β = .357, p < .05) and the independent variable (β =
-.052, p > .05) is far enough above .05 as to indicate that it has no effect. Therefore, it is
possible that a change in BMI may fully mediate the relationship between a change in
motivation for a healthy lifestyle and a change in emotional exhaustion.
Hypothesis 5
Hypothesis 5, “emotional exhaustion will have a positive relationship with daily
medication use,” was supported (β = .256, p < .05). The Pearson’s correlation coefficient
(.256) is greater than the estimated medium effect size (.15), thus yielding a power (.983)
well above the required 0.8. The positive sign on the Pearson’s coefficient indicates that
the hypothesized positive relationship is supported. The R2-value of .066 indicates that
emotional exhaustion at Time 1 accounts for 6.6% of the variance in the change in
emotional exhaustion, and the F-ratio (F (1, 110) = 7.713, p = .006) indicates that the
amount of explainable variance is greater than the amount of unexplainable variance.
The relationship between the independent and dependant variables is significant (p < .05),
thereby indicating that emotional exhaustion at Time 1does have a significant positive
relationship to daily miscellaneous medication use at Time 1.
Hypothesis 6
Hypothesis 6, “emotional exhaustion will have a positive relationship with LDL,”
was supported (β = .289, p < .05). The Pearson’s correlation coefficient (.289) falls in
between the predefined medium and large effect sizes in Table 6, with the medium effect
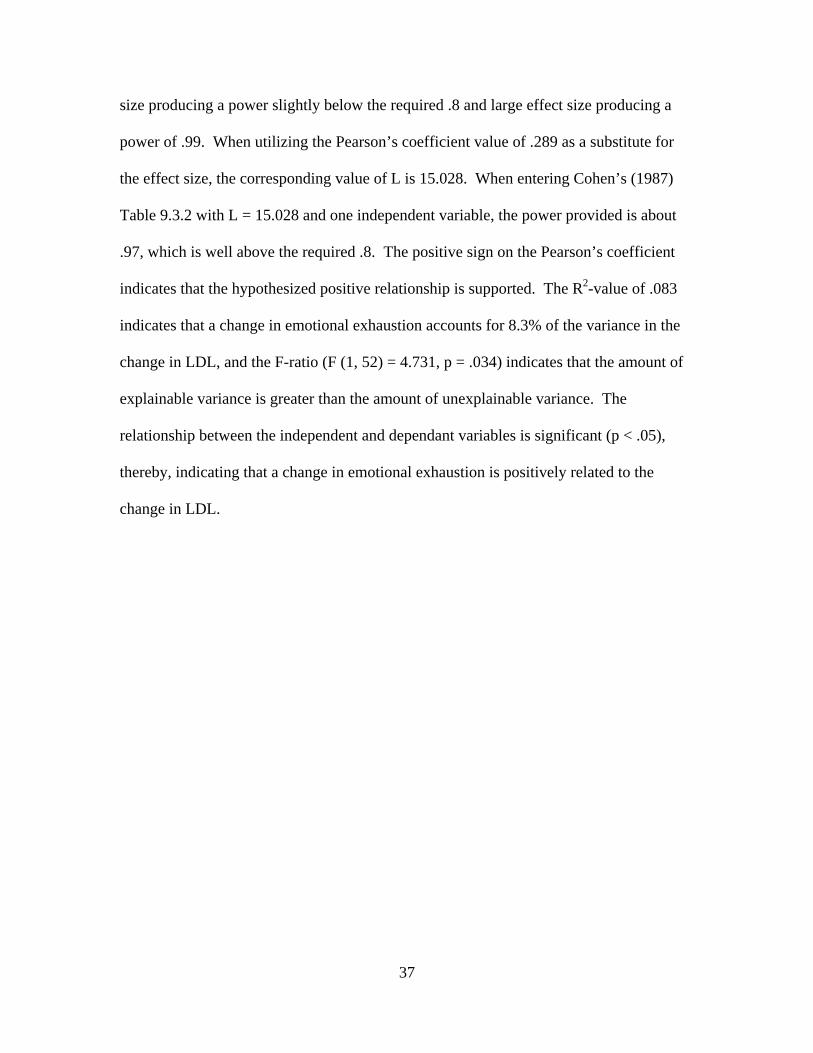
37
size producing a power slightly below the required .8 and large effect size producing a
power of .99. When utilizing the Pearson’s coefficient value of .289 as a substitute for
the effect size, the corresponding value of L is 15.028. When entering Cohen’s (1987)
Table 9.3.2 with L = 15.028 and one independent variable, the power provided is about
.97, which is well above the required .8. The positive sign on the Pearson’s coefficient
indicates that the hypothesized positive relationship is supported. The R2-value of .083
indicates that a change in emotional exhaustion accounts for 8.3% of the variance in the
change in LDL, and the F-ratio (F (1, 52) = 4.731, p = .034) indicates that the amount of
explainable variance is greater than the amount of unexplainable variance. The
relationship between the independent and dependant variables is significant (p < .05),
thereby, indicating that a change in emotional exhaustion is positively related to the
change in LDL.

38
IV. Discussion & Conclusion
The purpose of this research has been to examine how behavioral indicators are
related to physiological responses. A theoretical model was built and tested in order to
evaluate hypothesized relationships between motivation for a healthy lifestyle and
emotional exhaustion as well as the subsequent relationship of emotional exhaustion with
the physical outcomes of daily medication usage and low-density lipoprotein. This
research has addressed a gap in the existing literature by beginning to integrate
behavioral, psychological, and physiological constructs. As Heaphy and Dutton (2008)
said, “human physiology deserves greater attention in organizational research.” If the
relationships found in this research hold, then that would be additional justification to
pursue identifying potential causal relationships between behavioral indicators and
physical outcomes.
Theoretical Implications
Three theories were utilized to build the theoretical model: Conservation of
Resources (COR) Theory, Theory of Planned Behavior, and the Theory of Achievement
Motivation. As the predominate theory in the model, the COR theory appears to have fit
the model fairly well. The hypotheses that were directly underpinned by the COR theory
(2, 5, and 6) were all supported by the results of the linear regressions. In Hypothesis 2,
the additional physical type of energy resources gained by a reduction in BMI could be
said to have aided in reducing the emotional exhaustion experienced at work. The
subsequent reduction in emotional exhaustion could be said to have led to a reduction in

39
daily medication regimens and reduced LDL, each of which are factors contributing to
overall good health.
The Theories of Planned Behavior and Achievement Motivation appear to be
good fits for the proposed relationship between an individual’s motivation for a healthy
lifestyle and their BMI. Hypothesis 1 was supported by the results of the linear
regression. This supports the theory that an individual will engage in the behaviors
necessary to achieve success in the activities in which they desire to succeed, and that
their motivation to succeed is a function of the strength of their motive, their expectancy
to succeed when engaging in those activities, and the value of their incentive. In the case
of Hypothesis 1, those activities were participation in physical exercise and healthier
eating, which led to a reduction in BMI.
Hypotheses 3 and 4 were not supported by the results of the regressions.
Hypothesis 3 was the proposed negative relationship between an individual’s motivation
for a healthy lifestyle and their emotional exhaustion, based on the idea that motivation
could be carried over from the non-work to the work environment. The lack of
significant findings does not support the idea of motivation being a non-directional,
general drive. Hypothesis 4 was the proposed partial mediation of the Hypothesis 3
relationship by BMI. It is important to note that the relationship may be closer to full
mediation than partial, but that the non-significance of Hypothesis 3 resulted in failure of
the Baron and Kenny (1986) test for mediation. Consideration should be given to testing
if full mediation can be supported, possibly utilizing a combined construct of BMI and
waist circumference, as the combination of the two has been shown to be a better
predictor of obesity- related health issues than BMI alone (Janssen et al., 2004).

40
Managerial Implications
This research could be beneficial to organizations looking for ways to reduce
emotional exhaustion in their employees. This research has reviewed existing studies
highlighting the effective use of a healthy lifestyle to reduce burnout, anxiety, and
absenteeism, while fostering engagement and cohesion (Cook et al., 2007; Eastman,
1996; Fall et al., 2003; Focht & Koltyn, 1999; Long & van Stavel, 1995; Mills et al.,
2007; Stockton et al., 1992). It also presented further empirical evidence that reducing
BMI can aid in reducing emotional exhaustion. Additionally, it presented empirical
evidence for relationships between emotional exhaustion and daily medication usage, as
well as emotional exhaustion and LDL, a contributing factor to arteriosclerosis and
cardiovascular disease (Melamed et al., 1992; Worsiewicz, 1991). This research also has
specific implications to the U.S. Air Force since all the participants in the study were Air
Force employees. The Air Force is currently facing budgetary reductions and looking for
ways to reduce costs. One such way to reduce financial obligations would be to reduce
employee medical costs. This research has shown that reducing emotional exhaustion
may lead to reductions in medication need, as well as reductions in factors contributing to
required medications, such as LDL.
Limitations of the Research
The use of the archival dataset presents a couple of limitations to this research.
The first limitation is that all the participants in the study had to possess two of the seven
criteria that placed them at increased health risk. This presents a limit to the
generalizability since not all people possess two of those specific entry criteria. The

41
presence of these entry criteria may have predisposed them to the observed physiological
response, thereby bringing into question the observed effect of the predictor variables in
the regressions.
A second limitation inherent with the archival dataset is the accuracy and
consistency of the self-reported survey data. Self-reported data has the potential to be
manipulated by the individual, either unintentionally or maliciously. Individuals may
misreport an item because they are embarrassed by what it says about them, or they may
have just misunderstood what the item was asking. User error or manipulation can also
create issues with regard to consistency between their answers within each construct
being measured. User reluctance to take a side on a specific topic and/or item can cause
problems in regard to obtaining statistically significant results. As in the case of the
seven-point Likert scale utilized by the archival dataset to gauge emotional exhaustion, a
participant has the opportunity to answer each question in the middle, rather than taking a
side of either agreement or disagreement with the statement given; this could reduce the
chance of observing a significant effect between the independent and dependent
variables. A particular strength of this research is that the constructs of the model
incorporated survey data, anthropometric measures, and physiological data. The
construct measurements were also broken up over time. This helps to buffer potential
threats to validity of self-reported survey data.
A third limitation presented by the archival dataset is due to the attrition of
participants experienced from Time 1 to Time 2 of the study. This attrition reduced the
sample size significantly, especially the number of participants that were willing to
provide blood samples at Time 2. The reduced sample size did not create a statistical

42
power issue for any of the regressions necessary for testing this model, but it did preclude
the possibility of using more statistically rigorous analysis methods, such as structural
equation modeling or path analysis. The small sample size also limits the number of
independent variables that can be used as predictors before the statistical power becomes
too low. In order to minimize the effect of participant attrition, a one-way ANOVA was
conducted to examine if there was a significant difference between those individuals who
stayed and those who dropped out. No significant difference was found (p < .05).
Recommendations for Future Research
Future research in the constructs discussed in this research may include utilizing
healthy individuals for a replication of the study conducted at WPAFB. This would
increase the generalizability of the findings to an audience beyond those already
possessing factors known to be health adverse. Another recommendation would be to
expand the use of anthropometric and physiological indices. Studies have shown that a
model incorporating waist circumference and BMI may be superior to one utilizing BMI
alone (Janssen et al., 2002; Janssen et al., 2004). As was discussed in Chapter II, links
between stress, ill-health, and the body’s stress hormones have been well documented;
therefore, incorporating physiological indicator from the stress hormones may be
beneficial. A third recommendation for future research is to incorporate a leader
directed/led exercise and diet program. The dataset utilized for this research employed
self-led exercise and diet regimens that were self-reported by the participants at the end
of the study. A study that incorporates a leader to direct or lead the exercise and diet
program could provide greater fidelity to the exercise and diet data, possibly yielding
43
significant results for the effects of specific types of exercises. An exercise and diet
program with a leader may also provide the opportunity of evaluating the potential
benefits of group participation in a program, as opposed to a personal trainer approach.
Concluding Thoughts
Chapter I presented the research question of, “How are behavioral indicators
related to physiological responses?” Upon completion of this research, the research
question was partially answered. The usefulness of behavioral indicators to predict
physiological responses is supported by the evidence; it is possible to see a relationship
between motivation for a healthy lifestyle and low-density lipoprotein, but through BMI
and emotional exhaustion. In some ways, the research question is only partially
answered since the study participants all had pre-existing conditions that may have
predisposed them to the observed physiological response. More research is needed to
further explore the potential of predicting physiological responses through behavioral
indicators, but this research addressed the need to incorporate physiological indicators in
behavioral research (Heaphy & Dutton, 2008).

44
Bibliography
Ahola, K., Honkonen, T., Virtanen, M., Kivimaki, M., Isometsa, E., Aromaa, A., &
Lonnqvist, J. (2007). Interventions in relation to occupational burnout: The
population-based health 2000 study. Journal of Occupational and Environmental
Medicine, 49(9), 943-952.
Ajzen, I. (1991). The theory of planned behavior. Organizational Behavior and Human
Decision Processes, 50
Aldana, S. G., & Pronk, N. P. (2001). Health promotion programs, modifiable health
risks, and employee absenteeism. Journal of Occupational and Environmental
Medicine, 43(1), 36-46.
Altchiler, L., & Motta, R. (1994). EFFECTS OF AEROBIC AND NONAEROBIC
EXERCISE ON ANXIETY, ABSENTEEISM, AND JOB SATISFACTION.
Journal of Clinical Psychology, 50(6), 829-840.
Arnetz, B. B. (1984). The potential role of psychosocial stress on levels of hemoglobin
A1c (HbA,1c) and fasting plasma glucose in elderly people [Abstract]. Journal of
Gerontology, 39(4) 424-429. doi:10.1093/geronj/39.4.424
Atkinson, J. W., & Feather, N. T. (Eds.). (1966). A theory of achievement motivation (1st
ed.). Huntington, New York: Robert E. Krieger Publishing Co., Inc.

45
Bakker, A. B., Demerouti, E., & Schaufeli, W. B. (2005). The crossover of burnout and
work engagement among working couples. Human Relations, 58(5), 661-689.
doi:10.1177/0018726705055967
Bakker, A. B., Schaufeli, W. B., Leiter, M. P., & Taris, T. W. (2008). Work engagement:
An emerging concept in occupational health psychology. Work & Stress, 22(3),
187-201.
Baron, R. M., & Kenny, D. A. (1986). The moderator-mediator variable distinction in
social psychological research: Conceptual, strategic, and statistical considerations.
Journal of Personality and Social Psychology, 51(6), 1173-1182.
Bellingrath, S., Weigl, T., & Kudielka, B. M. (2009). Chronic work stress and exhaustion
is associated with higher allostastic load in female school teachers. Stress, 12(1),
37-48. doi:10.1080/10253890802042041
Brand, S., Beck, J., Hatzinger, M., Harbaugh, A., Ruch, W., & Holsboer-Trachsler, E.
(2010). Associations between satisfaction with life, burnout-related emotional and
physical exhaustion, and sleep complaints. World Journal of Biological
Psychiatry, 11(5), 744-754. doi:10.3109/15622971003624205
Brown, J. S. (Ed.). (1961). The motivation of behavior (1st ed.). New York: McGraw-
Hill.

46
Calle, E. E., Thun, M. J., Petrelli, J. M., Rodrequez, C., & Heath, C. W. (1999). Body-
mass index and mortality in a prospective cohort of U.S. adults. The New England
Journal of Medicine, 341(15), 1097-1105.
Cohen, J. (1987). Statistical power analysis for the behavioral sciences. Hillsdale:
Lawrence Erlbaum Associates, Inc.
Cook, R. F., Billings, D. W., Hersch, R. K., Back, A. S., & Hendrickson, A. (2007). A
field test of a web-based workplace health promotion program to improve dietary
practices, reduce stress, and increase physical activity: Randomized controlled
trial. Journal of Medical Internet Research, 9(2), 1-27. doi:10.2196/jmir.9.2.e17
Cordes, C. L., & Dougherty, T. W. (1993). A REVIEW AND AN INTEGRATION OF
RESEARCH ON JOB BURNOUT [Abstract]. The Academy of Management
Review, 18(4) 621-656.
Dallman, M. F., Pecoraro, N., Akana, S. F., la Fleur, S. E., Gomez, F., Houshyar, H., . . .
Manolo, S. (2003). Chronic stress and obesity: A new view of "comfort food".
PNAS, 100(20), 11696-11701.
Dansinger, M. L., Tatsioni, A., Wong, J. B., Chung, M., & Balk, E. M. (2007). Meta-
analysis: The effect of dietary counseling for weight loss. Annals of Internal
Medicine, 147(1), 41-50.

47
Dickerson, S. S., & Kemeny, M. E. (2004). Acute stressors and cortisol responses: A
theoretical integration and synthesis of laboratory research [Abstract].
Psychological Bulletin, 130(3) 355-391.
Dzewaltowski, D. A. (1989). Toward a model of exercise motivation [Abstract]. Journal
of Sports & Exercise Psychology, 11(3) 251-269.
Eastman, W. (1996). Avoiding faculty burnout through the wellness approach. Annual
Conference of the Association of Canadian Community Colleges, Toronto,
Ontario, Canada.
Elliot, G. R., & Eisdorfer, C. (1982). Stress and human health: Analysis and implications
of research. New York, NY: Springer Publishing Company, LLC.
Elmer, P. J., Obarzanek, E., Vollmer, W. M., Simons-Morton, D., Stevens, V. J., Young,
D. R., . . . Appel, L. J. (2006). Effects of comprehensive lifestyle modification on
diet, weight, physical fitness, and blood pressure control: 18-month results of a
randomized trial. Annals of Internal Medicine, 144(7), 485-495.
Epel, E. S., McEwen, B. S., & Ickovics, J. R. (1998). Embodying psychological thriving:
Physical thriving in response to stress. Journal of Social Issues, 54(2), 301-322.
Evans, G. W., Lercher, P., Meis, M., Ising, H., & Kofler, W. W. (2001). Community
noise exposure ans stress in children. Journal of the Acoustical Society of America,
109(3), 1023-1027.

48
Fall, M. L., Wolf, K. N., Schiller, M. R., & Wilson, S. L. (2003). Dietetic technicians
report low to moderate levels of burnout. Journal of the American Dietetic
Association, 103(11), 1520-1522. doi:10.1016/j.jada.2003.08.018
Field, A. (2009). Discovering statistics using SPSS (3rd ed.). Thousand Oaks: SAGE
Publications Inc.
Focht, B. C., & Koltyn, K. F. (1999). Influences of resistance exercise of different
intensitieson state anxiety and blood pressure. Medicine & Science in Sports &
Exercise, 31(3), 456-463.
Frankel, H. M., & Staeheli, J. C. (1992). Calculating body mass index. Annals of Internal
Medicine, 117(8), 698-699.
Fulton, J. F. (Ed.). (1950). Textbook of physiology (16th ed.). Philadelphia: W.B.
Saunders Company.
Galantino, M. L., Baime, M., Maquire, M., Szapary, P., & Farrar, J. T. (2005).
Association of psychological and physiological measures of tress in healthcare
professionals during an 8-week mindfulness meditation program: Mindfulness in
practice. Stress & Health: Journal of the International Society for the Investigation
of Stress, 21(4), 255-261.
Goetzel, R. Z., Ozminkowski, R. J., Bruno, J. A., Rutter, K. R., Isaac, F., & Wang, S.
(2002). The long-term impact of johnson & johnson's health & wellness program

49
on employee health risks. Journal of Occupational and Environmental Medicine,
44(5), 417-424.
Gonzalez-Roma, V., Schaufeli, W. B., Bakker, A. B., & Lloret, S. (2006). Burnout and
work engagement: Independent factors or opposite poles? Journal of Vocational
Behavior, 68, 165-174.
Green, S. B. (1991). How many subjects does it take to do A regression analysis?
Multivariate Behavioral Research, 26(3), 499-510.
Grossi, G., Perski, A., Evengard, B., Blomkvist, V., & Orth-Gomer, K. (2003).
Physiological correlates of burnout among women. Journal of Psychosomatic
Research, 55, 309-316.
Hakanen, J. J., Bakker, A. B., & Schaufeli, W. B. (2006). Burnout and work engagement
among teachers. Journal of School Psychology, 43, 495-513.
Harries, K. (1997). SOCIAL STESS AND TRAUMA: SYNTHESIS AND SPATIAL
ANALYSIS. Social Science Medicine, 45(8), 1251-1264.
Heaphy, E. D., & Dutton, J. E. (2008). POSITIVE SOCIAL INTERACTIONS ND THE
HUMAN BODY AT WORK: LINKING ORGANIZATIONS AND
PHYSIOLOGY. Academy of Management Review, 33(1), 137-162.
Herbert, T. B., & Cohen, S. (1993). Stress and immunity in humans: A meta-analytic
review [Abstract]. Psychosomatic Medicine, 55(4) 364-379.

50
Hobfoll, S. E. (1989). Conservation of resources: A new attempt at conceptualizing
stress. American Psychologist, 44(3), 513-524.
Hobfoll, S. E. (2002). Social and psychological resources and adaptation. Review of
General Psychology, 6(4), 307-324. doi:10.1037/1089-2680.6.4.307
Hughes, J. R., Casal, D. C., & Leon, A. S. (1986). Psychological effects of exercise: A
randomized cross-over trial. Journal of Psychosomatic Research, 30(3), 355-360.
doi:DOI: 10.1016/0022-3999(86)90013-9
Ilies, R., Dimotakis, N., & De Pater, I. E. (2010). Psychological and physiological
reactions to high workloads: Implications for well-being. Personnel Psychology,
63(2), 407-436.
James, G. D., & Brown, D. E. (1997). THE BIOLOGICAL STRESS RESPONSE AND
LIFESTYLE: Catecholamines and blood pressure. Annual Review of
Anthropology, 26, 313-335.
Janssen, I., Katzmarzyk, P. T., & Ross, R. (2002). Body mass index, waist circumference,
and health risk. Archives of Internal Medicine, 162, 2074-2079.
Janssen, I., Katzmarzyk, P. T., & Ross, R. (2004). Waist circumference and not body
mass index explains obesity-related health risk. The American Journal of Clinical
Nutrition, 79(3), 379-384.

51
Juster, R., McEwen, B. S., & Lupien, S. J. (2010). Allostatic load biomarkers of chronic
stress and impact on health and cognition. Neuroscience & Biobehavioral Reviews,
35(1), 2-16. doi:DOI: 10.1016/j.neubiorev.2009.10.002
Kahn, W. A. (1990). Psychological conditions of personal engagement and
disengagement at work. The Academy of Management Journal, 33(4), 692-724.
Kaplan, R. M., Hartwell, S. L., Wilson, D. K., & Wallace, J. P. (1987). Effects of diet and
exercise interventions on control and quality of life in non-insulin-dependent
diabetes mellitus. Journal of General Internal Medicine, 2(4), 220-228.
doi:10.1007/BF02596443
Kilpatrick, M., Hebert, E., & Bartholomew, J. (2005). College students' motivation for
physical activity: Differentiating men's and women's motives for sport
participation and exercise [Abstract]. Journal of American College Health, 54(2)
87-94.
Kobasa, s. C., Maddi, S. R., & Puccetti, M. C. (1982). Personality and exercise as buffers
in the stress-illness relationship [Abstract]. Journal of Behavioral Medicine, 5(4)
391-404. doi:10.1007/BF00845369
Kuhnel, J., Sonnentag, S., & Westman, M. (2009). Does work engagement increase after
a short respite? the role of job involvement as a double-edged sword. Journal of
Occupational and Organizational Psychology, 82, 575-594.

52
Laaksonen, D. E., Lindstrom, J., Lakka, T. A., Eriksson, J. G., Niskanen, L., Wikstrom,
K., . . . Uusitupa, M. (2005). Physical activity in the prevention of type 2 diabetes.
Diabetes, 54, 158-165.
Langelaan, S., Bakker, A. B., van Doornen, L. J. P., & Schaufeli, W. B. (2006). Burnout
and work engagement: Do individual differences make a difference? Personality
and Individual Differences, 40, 521-532.
Latham, G. P., & Pinder, C. C. (2005). Work motivation theory and research at the dawn
of the twenty-first century. Annual Review of Psychology, 56, 485-516.
Laurie, L. (2001). Dealing with stress, burnout, and grief in the practice of oncology. The
Lancet Oncology, 2(12), 750-755. doi:10.1016/S1470-2045(01)00590-3
Lindeberg, S. I., Eek, F., Lindbladh, E., Östergren, P., Hansen, Å. M., & Karlson, B.
(2008). Exhaustion measured by the SF-36 vitality scale is associated with a
flattened diurnal cortisol profile. Psychoneuroendocrinology, 33(4), 471-477.
doi:10.1016/j.psyneuen.2008.01.005
Linden, W., Lenz, J. W., & Con, A. H. (2001). Individual stress management for primary
hypertension. Archives of Internal Medicine, 161, 1071-1080.
Lisspers, J., Sundin, O., Hofman-Bang, C., Nordlander, R., Nygren, A., Ryden, L., &
Ohman, A. (1999). BEHAVIORAL EFFECTS OF A COMPREHENSIVE,
MULTIFACTORIAL PROGRAM FOR LIFESTYLE CHANGE AFTER
PERCUTANEOUS TRANSLUMINAL CORONARY ANGIOPLASTY: A

53
PROSPECTIVE, RANDOMIZED, CONTROLLED STUDY. Journal of
Psychosomatic Research, 46(2), 143-154.
Llorens, S., Schaufeli, W., Bakker, A., & Salanova, M. (2007). Does a positive gain
spiral of resources, efficacy beliefs and engagement exist? Computers in Human
Behavior, 23(1), 825-841. doi:DOI: 10.1016/j.chb.2004.11.012
Long, B. C., & van Stavel, R. (1995). Effects of exercise training on anxiety: A meta-
analysis [Abstract]. Journal of Applied Sport Psychology, 7(2) 167-189.
Lu, L. (1999). Work motivation, job stress and employees' well-being. Journal of Applied
Management Studies, 8(1), 61-72.
Maslach, C. (2003). Job burnout: New directions in research and intervention [Abstract].
Current Directions in Psychological Science, 12(5) 189-192. doi:10.1111/1467-
8721.01258
Mauno, S., Kinnunen, U., & Ruokolainen, M. (2007). Job demands and resources as
antecedents of work engagement: A longitudinal study. Journal of Vocational
Behavior, 70(1), 149-171. doi:DOI: 10.1016/j.jvb.2006.09.002
Maxwell, S. E. (2000). Sample size and multiple regression analysis. Psychological
Methods, 5(4), 434-458.
McEwen, B. S. (1998). Protective and damaging effects of stress mediators. New
England Journal of Medicine, 338(3), 171-179.

54
McEwen, B. S. (2004). Protection and damage from acute and chronic stress: Allostasis
and allostatic overload and relevance to the pathophysiology of psychiatric
disorders. Annals of the New York Academy of Sciences, 1032(1), 1-7.
doi:10.1196/annals.1314.001
Melamed, S., Kushnir, T., & Shirom, A. (1992). Burnout and risk factors for
cardiovascular diseases [Abstract]. Behavioral Medicine, 18(2) 53-60.
Melamed, S., Ugarten, U., Shirom, A., Kahana, L., Lerman, Y., & Froom, P. (1999).
CHRONIC BURNOUT, SOMATIC AROUSAL AND ELEVATED SALIVARY
CORTISOL LEVELS. Journal of Psychosomatic Research, 46(6), 591-598.
Miller, W. C., Koceja, D. M., & Hamilton, E. J. (1997). A meta-analysis of the past 25
years of weight loss research using diet, exercise or diet plus exercise intervention.
International Journal of Obesity, 21, 941-947.
Mills, P. R., Kessler, R. C., Cooper, J., & Sullivan, S. (2007). Impact of a health
promotion program on employee health risks and work productivity. American
Journal of Health Promotion, 22(1), 45-52.
National Institutes of Health.Body mass index table. Retrieved 1/16, 2012, from
http://www.nhlbi.nih.gov/guidelines/obesity/bmi_tbl.pdf
National Institutes of Health. (2010). The kidneys and how they work. Retrieved 12/5,
2011, from http://kidney.niddk.nih.gov/kudiseases/pubs/yourkidneys/

55
Pinto, B. M., Maruyama, N. C., Clark, M. M., Cruess, D. G., Park, E., & Roberts, M.
(2002). Motivation to modify lifestyle risk behaviors in women treated for breat
cancer. Mayo Clinic Proceedings, 77, 122-129.
Plonczynski, D. J. (2000). Measurement of motivation for exercise. Health Education
Research, 15(6), 695-705.
Podsakoff, N. P., Lepine, J. A., & LePine, M. A. (2007). Differential challenge stressor-
hindrance stressor relationships with job attitudes, turnover intentions, turnover,
and withdrawal behavior: A meta-analysis. [Abstract]. Journal of Applied
Psychology, 92(2) 438-454. doi:10.1037/0021-9010.92.2.438
Pompili, M., Rinaldi, G., Lester, D., Girardi, P., Ruberto, A., & Tatarelli, R. (2006).
Hopelessness and suicide risk emerge in psychiatric nurses suffering from burnout
and using specific defense mechanisms. Archives of Psychiatric Nursing, 20(3),
135-143. doi:10.1016/j.apnu.2005.12.002
Porges, S. W. (1995). Cardiac vagal tone: A physiological index of stress. Neuroscience
& Biobehavioral Reviews, 19(2), 225-233.
Rodell, J. B., & Judge, T. A. (2009). The good, the bad, and the ugly of stress at work.
Retrieved 3/7, 2011, from http://www.ioatwork.com/ioatwork/2010/01/the-good-
the-bad-the-ugly-of-stress-at-work
56
Salanova, M., Agut, S., & Peiro, J. M. (2005). Linking organizational resources and work
engagement to employee performance and customer loyalty: The mediation of
service climate. Journal of Applied Psychology, 90(6), 1217-1227.
Salmon, P. (2001). EFFECTS OF PHYSICAL EXERCISE ON ANXIETY,
DEPRESSION, AND SENSITIVITY TO STRESS: A UNIFYING THEORY.
Clinical Psychology Review, 21(1), 33-61.
Schabracq, M. J., Winnubst, J. A. M., & Cooper, C. L. (Eds.). (2003). The handbook of
work and health psychology John Wiley & Sons, Ltd.
Schaufeli, W. B., Salanova, M., Gonzalez-Roma, V., & Bakker, A. B. (2002). The
measurement of engagement and burnout: A two sample confirmatory factor
analytical approach. Journal of Happiness Studies, 3, 71-92.
Schultz, A. B., & Edington, D. W. (2007). Employee health and presenteeism: A
systematic review [Abstract]. Journal of Occupational Rehabilitation, 17(3) 547-
579.
Segerstrom, S. C., & Miller, G. E. (2004). Psychological stress and the human immune
system: A meta-analytic study of 30 years of inquiry. Psychological Bulletin,
130(4), 601-630. doi:10.1037/0033-2909.130.4.601
Shirom, A., Westman, M., Shamai, O., & Carel, R. S. (1997). Effects of work overload
and burnout on cholesterol and triglycerides levels: The moderating efffects of

57
emotional reactivity among male and female employees [Abstract]. Journal of
Occupational Health Psychology, 2(4) 275-288.
Shraga, O., & Shirom, A. (2009). The construct validity of vigor and its antecedents: A
qualitative study. Human Relations, 62(2), 271-291.
doi:10.1177/0018726708100360
Shrout, P. E., & Bolger, N. (2002). Mediation in experimental and nonexperimental
studies: New procedures and recommendations. Psychological Methods, 7(4), 422-
445.
Sonnenschein, M., Sorbi, M. J., van Doornen, L. J. P., Schaufeli, W. B., & Maas, C. J. M.
(2007). Evidence that impaired sleep recovery may complicate burnout
improvement independently of depressive mood. Journal of Psychosomatic
Research, 62, 487-494.
Sonnentag, S. (2003). Recovery, work engagement, and proactive behavior: A new look
at the interface between nonwork and work. Journal of Applied Psychology, 88(3),
518-528.
Standage, M., Sebire, S. J., & Loney, T. (2008). Does exercise motivation predict
engagement in objectively assessed bouts of moderate-intensity exercise?: A self-
determination theory perspective. Journal of Sports & Exercise Psychology, 30,
337-352.

58
Steptoe, A., & Cox, S. (1988). Acute effects of aerobic exercise on mood. Health
Psychology, 7(4), 329-340.
Stockton, R., Rohde, R. I., & Haughey, J. (1992). The effects of structured group
exercises on cohesion, engagement, avoidance, and conflict [Abstract]. Small
Group Research, 155-168. doi:10.1177/1046496492232001
Teixeira, P., Going, S., Houtkooper, L., Cussler, E., Metcalfe, L., Blew, R., . . . Lohman,
T. (2006). Exercise motivation, eating, and body image variables as predictors of
weight control [Abstract]. Medicine & Science in Sports & Exercise, 38(1) 179-
188.
Tekur, P., Singphow, C., Romarao Nagendra, H., & Raghuram, N. (2008). Effect of
short-term intensive yoga program on pain, functional disability and spinal
flexibility in chronic low back pain: A randomized control study. The Journal of
Alternative and Complementary Medicine, 14(6), 637-644.
doi:10.1089/acm.2007.0815
Toker, S., Shirom, A., Shapira, I., Berliner, S., & Melamed, S. (2005). The association
between burnout, depression, anxiety, and inflammation biomarkers: C-reactive
protein and fibrinogen in men and women. Journal of Occupational Health
Psychology, 10(4), 344-362.
Ueno, T., Sugawara, H., Sujaku, K., Hashimoto, O., Tsuji, R., Tamaki, S., . . . Tanikawa,
K. (1997). Therapeutic effects of restricted diet and exercise in obese patients with

59
fatty liver. Journal of Hepatology, 27(1), 103-107. doi:10.1016/S0168-
8278(97)80287-5
van Eck, M., Berkhof, H., Nicolson, N., & Sulon, J. (1996). The effects of perceived
stress, traits, mood states, and stressful daily events on salivary cortisol.
Psychosomatic Medicine, 58, 447-458.
Weiss, J. M., Glazer, H. I., Pohorecky, L. A., Brick, J., & Miller, N. E. (1975).
Effects of chronic exposure to stressors on avoidance-escape behavior and on
brain norepinephrine*. Psychosomatic Medicine, 37(6), 522-534.
Wilfey, D., & Kunce, J. T. (1986). Differential physical and psychological effects of
exercise. Journal of Counseling Psychology, 33(3), 337-342.
Wood, P. D., Stefanick, M. L., Dreon, D. M., Frey-Hewitt, B., Garay, S. C., Williams, P.
T., . . . Haskell, W. L. (1988). Changes in plasma lipids and lipoproteins in
overweight men during weight loss through dieting as compared with exercise. N
Engl J Med, 319(18), 1173-1179. doi:10.1056/NEJM198811033191801
Worsiewicz, M. J. (Ed.). (1991). Textbook of medical physiology (8th ed.). Philadelphia:
W.B. Saunders Company.
Xanthopoulou, D., Bakker, A. B., Demerouti, E., & Schaufeli, W. B. (2007). The role of
personal resources in the job demands model. International Journal of Stress
Management, 14(2), 121-141. doi:10.1037/1072-5245.14.2.121
60
Zeier, H., Brauchli, P., & Joller-Jemelka, H. I. (1996). Effects of work demands on
immunoglobulin A and cortisol in air traffic controllers. Biological Psychology,
42, 413-423.
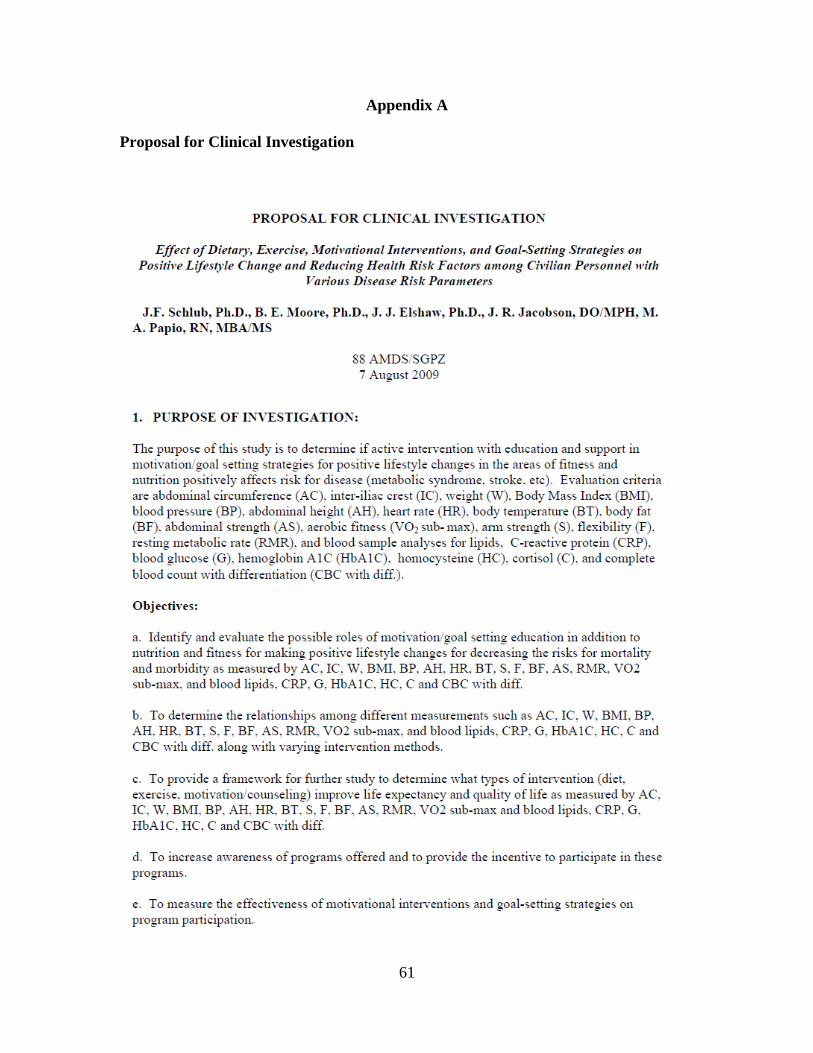
61
Appendix A
Proposal for Clinical Investigation
PROPOSAL FOR CLI NICAL INVE STIGATION
Effect of Dietary, Exercise, 1~1otivational Intervemions, and Goal-Setting Strategies on Positive Lifestyle Change and Reducing H ealth Risk Factors among Civilia11 Personnel with
Various Disease Risk Parameters
J .F. Schlub, Ph.D., B. E. Moore, Ph.D., J . J . Elsh.aw, Ph.D., J . R. Jac.obson, DO/M PH, M. A. Papio, Rl'l, MBA/MS
88 AMDS/SGPZ 7 August 2009
1. P URPOSE OF INVESTIGATION:
The pmpose of this study is to determine if active intervention with education and support in motivation/goal setting strategies for positive lifestyle changes in the areas of fitness and nutrition positively affects risk for disease (metabolic syndrome, stroke, etc). Evaluation criteria are abdominal circumferenc:e (AC), inter-iliac crest (IC), weight cyv), Body Mass Index (BMI), blood pressure (BP), abdominal height (AH), heart rate (HR), body temperature (BT), body fat (BF), abdominal strength (AS), aerobic fitness (V02 sub- max) , ann strength (S), flexibility (F), resting metabolic rate (RMR), and blood sample analyses for lipids, C-reactive protein (CRP), blood glucose (G), hemoglobin A lC (HbAl C), homocysteine (HC), cortisol (C), and complete blood count with differentia.tion (CBC with cliff.) .
Objectiv~s:
a. Identify and evaluate the possible roles of motivation/goal setting education in addition to nutrition and fitness for making positive lifestyle changes for decreasing the ris ks for mortality and morbidity as measured by AC, IC, W, BMI, BP, AH, HR, BT, S, F, BF, AS, RMR, V02 sub-max, and blood lipids, CRP, G, HbAlC, HC, C and CBC with diff.
b. To determine the relationships among different measurements such as AC, IC, W, BMI, BP, AH, HR, BT, S, F, BF, AS, RMR, V02 sub-max, and blood lipids, CRP, G, HbAlC, HC, C and CBC with diff. along with va1ying intervention methods.
c. To provide a framework for further study to detennine what types of intervention (diet, exercise, motivation/counseling) improve life expectancy and quality oflife as measured by AC, IC, W, BMI, BP, AH, HR, BT, S, F, BF, AS, RMR, V02 sub-max and blood lipids , CRP, G, HlbA l C, HC, C and CBC with diff.
d. To increase awareness of programs offered and to provide the incentive to participate in these programs.
e. To measure the effectiveness of motivational interventions and goal-setting strategies on program participation.

62
Effect of Dietary, Exercise, Motivational Interventions, and Goal-Setting Strategies on Positive Lifestyle Change and Reducing Health Risk Factors among Civilian Personnel with Various Disease Risk Parameters
f. To foster a culmre of wellness among: civilian base persom1el (AFI 40-101).
BRIEF SUMMARY OF THE STUDY:
The US population is ever increasing: both in munber and size. The number of adults considered "overweight" have exceeded 50% and those considered obese nearly 25%. The civilian population at Wright-Patterson Air Force Base consists of approximately 11,500 personnel (Civilian Personnel) . Approximately 43% of this population are 50 years of age or older. With increasing: age, the risks of developing: health related diseases increase. Available data indicate that approximately 33.4% are overweight, with 14.6% considered to be obese and 3.8% morbidly obese (Civilian Health Promotion Services). In addition, it is estimated that 29.4-45.6% of the tested civilian population have at least one risk factor as indicated by plasma blood lipid levels (Civilian Health Promotion Services). The method by which people are labeled oven :veig:ht usually refers to their body mass index and these indices have been con·elated with increased health risks. In addition, it has been shown it is not only the amount of weight that increases health risks, but even more importantly, where it is can·ied. Research indicates that persons who are ' 'apple'' shaped (larger waist, smaller hips) have a greater health risk than pear shaped persons (larger hips and smaller waists). These risks are typically measured by blood profiles (lipids, A1C, glucose, etc.) as well as BMI and AC. In addition to the typical strategies for measuring: these factors, AS, AH, RMR, HC and CBC with diff will be added to better assess and quantify risks and outcomes for assessing: the effectiveness of behavior modification through motivational and goal setting: strategies. These factors will be included within this study to help detennine what factors play the greatest role in encouraging: participants to make positive lifestyle changes.
·w hile the Ctlll"ent program offers facilities and education to all base personnel, participation in the offered programs is less than stellar . By recruiting: persons into a study, it is hoped that greater awareness is achieved as well as increased motivation for participation. Effectiveness will be measured by numbers of participants in the offered programs as well as changes in physiological parameters. In addition to the Ctlll"ent classes, participants in the treatment group will be required to attend an initial attendance in the motivational and goal setting: class and will include strong: encouragement to attend monthly motivational classes. Weekly specialized classes on various topics as well as cun·ent programs will be offered to participants for the duration of the trial.
Statistical analyses will be employed to examine the strength of predictions of various widely accepted body composition, anthropometric measurements and physiological markers and the effec t of motivation/goal setting: education on reducing: cardiovascular and metabolic disease. Physiological parameters utilized will include blood pressure, anthropomorphic values, and lipid profiles, as well as complete blood counts with differentiation, Hg:bA1C, CRP, homocysteine and fasting: blood glucose. It is the goal of this sntdy to te~t the hypothe~is that the addition of specific classes and support of behavioral modification and goal-setting: strategies will make a more positive influence on lifestyle change than the opportunity to participate in fitness and nutrition programs alone.
Page 2 of 17 Pages

63
Effect of Dietary, Exercise, Motivational Interventions, and Goal-Setting Strategies on Positive Lifestyle Change and Reducing Health Risk Factors among Civilian Personnel with Van·ous Disease Risk Parameters
The pmpose of this study is to determine if specific interventions can decrease health risks as measured by the above parameters. Because motivation to change is a major factor in the successful application of known beneficial lifestyle changes (diet, exercise, etc.), determining the types of intervention which can positively effect change is invaluable to improving the quality of life for non-military persom1el. All measurements will be taken at the beginning of the program and again upon completion. The types and amount of intervention will be compared to the measured physiological parameters to detennine effec tiveness. Statistical analyses will be employed to establish relationships amon_!Z these factors in order to obtain more in-depth health risk factor analyses. From these data, it may be possible to predict what types of intervention work the most effectively among the base civilian population for reducing preventable morbidity and mortality health risk factors.
Hypoth~sis (Explanation): Motivation to change plays a major role in how effective programs are in promoting a healthy lifestyle. While having great programs, facilities and equipment available to all base personnel is a start to changing the culmre to wellness, it is by no means a guarantee for success. Individuals must decide for themselves to make changes. Several factors may play a role in that decision. Good leadership, setting examples, team programs, positive feedback and encouragement, incentives to improve and proven goal setting strategies are ways to foster that change. Outcomes must be measurable and have a scientific basis. Physiological parameters can be utilized and are quantifiable, providing a means to detennine how effective available programs are. Participants will be randomly assigned to either group, with (educational group) or without motivation and goal-setting strategies. These variables will be accounted for within the applied statistics. A brief medical questionnaire will be completed at the time of the first initial introduction to the study, when the ICD will also be administered . Reduction of health risks will be assessed and quantified by the physiological measurements of AC, IC, W, BMI, BP, AH, HR, BT, S, F.BF, AS, RMR , S, F, and blood lipids, CRP, G, HbA lC, HC, C and CBC with cliff. By adding motivational education to the existing programs, it is hypothesized that civilians are more likely to stay motivated and make long tenn lifestyle changes that may reduce health risks and improve morbidity and mortality rates among our civilian population. These factors can then be utilized by way of prediction equations to better assess health risks and the effectiveness of intervention on positive lifestyle changes among civilians, which could decrease morbidity and mortality.
Treatments: Participants will be divided into two groups: 1. with motivation/ goal setting as an initial class, with monthly classes optional
thl'oug:hout the tl'ial st!'ong:ly encou!'ag:ed; new media such as weekly emails and progress (group) reports will be included (AFIT resource)
2. no education in motivation/goal setting
Other Parameters: 1. all persons will have all other options the same (education, physical activity, etc.) 2. all persons will have blood drawn and analyzed at the begilming of the trial and at
the end 3. types and numbers of classes, and nutrition and exercise (honor system) will be
included
Page 3 of 17 Pages

64
Effect of Dietary, Exercise, Motivational Interventions, and Goal-Setting Strategies on Posifive Lifestyle Change and Reducing Health Risk Factors among Civilian Personnel with Various Disease Risk Parameters
Hypothesis (Sta tistical) : The addition ofbehavioral change support (education) increases participation of healthy lifestyle changes, resulting in the quantifiable improvement of measured health risk factors and program participation.
Null hypothesis : No con·elation exits among these factors. Supporting behavioral change through motivation and goal setting has no effect on any other factor'S.
Statistics: Con·e!ations amon.!Z variables, standard deviation, variance analyses, confidence intervals, linear regression, prediction equations. Alpha = 0.05, 95th percentile, n= 100
Several published studies indicate that there are strong relationships for reducing health risks by making positive lifestyle changes. However, these relationships as well as included parameters have never been studied as they apply to the civilian population at WPAFB. In addition, the possible benefits of these studies will become more transparent as the munber and types of measurements utilized to measure change improve. These new measmements include the addition of the IC, the combination ofBF and RMR, AS, HC, C and CBC with diff. , and will include the more common measurements such as blood lipids, glucose, etc. as listed above. This study will be expanded to include these parameters to better quantify health risks and to assess the effec tiveness of intervention to cultural change and civilian health.
Study Design: Volunteers will be recruited from the civilian populace who meet the required health risk assessment standards. The objective is to determine which participants are most likely to benefit from intervention. Candidates must meet two of the following risk factor criteria: blood pressure> l40/90; total cholesterol>240; body mass index>30; fasting blood glucose> l40; waist>40 inches for men or waist>35 inches for women; smoking; aerobic exercise less than n:vice a. week. From this pool, candidates will be selected and randomly assigned to attend the motivation/goal setting educational group of the study and receive email/group progress reports or to the control. Qualified candidates will be solicited by email, poster-s, flyer-s, the Skywriter (general article), other appropriate base media (attachment #3), and per-sonal contact, providing information to civilians on the oppornmity to participate in this smdy. A registration site will be available to all civilian base per-sonnel. hlVestigator contact information will be provided tiu·ough these media as well with the registration site provided and interested civilians can sign up or request more infonnation. The appropriate health risk factor form can be completed and remmed via the registration site. Upon receipt of tllis fonn either in person or by email, the candidate will be contacted by the appropriate investigator, who will explain the smdy and extend an invitation to the candidate for participation. Paliicipants will be t•andomly assigned to the education or control group. Behavior/motivation of ail participants will be assessed utilizing standard forms (attaclunent # 8) as well as a demographics survey (attaclunent #7) which will be included in the statistical analyses. As these questionnaires are completed, responses may generate uncomfortable feelings (sadness, anxiety or won-y) or thoughts of which the participant was previously unaware. Should these concerns be generated, participants will be encouraged to speak with one of the investigators who will assist in the process of obtaining counseling tlu·ough the Employee Assistance Program (EAP) or health benefits plan. These forms may also be administered at the end of a required class (standard nutrition or standard exercise), midpoint and end of the study for as sessment. The ICD and medical histor-y questionnaire (attaclunents #5 and #6) will be completed upon initial meeting with the
Page 4 of 17 Pages

65
Effect of Dietary, Exercise, Motivational Interventions, and Goal-Setting Strategies on Posilive Lifestyle Change and Reducing Healih Risk Factors among Civilian Personnel with Various Disease Risk Parameters
appropriate investigators. Measurements will include body fat analysis (IronMan scale, BOD POD optional), height, weight, RMR, BMI, AB, IC, HR, BP, BT, S, F, BF, blood lipid profiles (HDL, LDL, total cholesterol, TG), blood levels of A lC, cortisol and homocysteine, and sit ups performed for one minute to determine abdominal strength. Blood salll})les will be collected via venipuncmre.
2. PERSONNEL DATA:
Principal hwest.igator(s):
Staff E-ntail Date of Resident (if other
Investigator Fellow Department/ than Name Rank Training Civilian Office Symbol Phone Pager Outlook)
James F. Schlub YD2 10/ 08 CIV 88AMDS/SGPZ 904-9356
Associate hwest.igator(s):
Staff Date of Resident
Investigator Fellow Department/ Name Rank Training Civilian Office Svmbol Phone Pager
Brenda E. Moore Ph.D. 10/08 CTR 88AMDS/SGPZ 904-9362 Michael A. Papio YH601 10/08 CIV 88AMDS/SGPZ 904-9361
02 Jon R. Jacobson Ma jor 10/08 Staff/DO 88AMDS/SGPO 904-8398 Jolm J. Elshaw LtCol 8/09 Staff/Ph.D AFIT/ENV 255-3636
Medical Facility Commander:
E-mail Name Rank Department/Office Symbol Phone (if other than Outlook)
Kimberly SlawillSki Col 88MDG/CC
4. FACILITY:
Hea lth and Wellness Center at WPAFB, OH 88 AMDS/SGPZ 2690 C St. Bldg 571 WPAFB OH 45433
7-8762
5. CATEGORY OF STUDY: Prevention (Screening for health risks factors)
6. MEDICAL RESEARCH AREA: Welh1ess
7. ICD LOCATION: HAWC and Occupational Medicine
Page 5 of 17 Pages

66
Effect of Dietary, Exercise, Motivational Interventions, and Goal-Setting Strategies on Positive Lifestyle Change and Reducing Health Risk Factors among Civilian Personnel with Van·ous Disease Risk Parameters
8. RESEARCH PLAN:
S.L Hypoth~s~s 01' R~search Questions 01' Objectiv~s:
The addition ofbehavioral change support (education) increases participation of healthy lifestyle changes, in addition to participation in nutrition and fitness classes, resulting in the quantifiable improvement of measured health risk factors.
The pmpose of this study is to determine if education in motivation/goal setting as well as on going support for behavioral change results in decreased morbidity /mortality risks compared to persons with the same program opportunities but without this education/support. Evaluation criteria are based on blood values for Al C, CRP, CBC with diff., glucose, cortisol, lipids, and homocysteine, as well as anthropometric measurements of body temperature, ann strength, flexibility, heart rate, blood pressure, inter-iliac crest, body mass index, abdominal strength, body fat, abdominal circmnference and height, and resting metabolic rate measurement, taken at the beginning and ending of the program. Participants must have two or more of the following risks to be considered for participation in this study: blood pressure> l40/90; total cholesterol>240; body mass inclex>30; fasting blood glucose> l 40; waist>40 inches for men or waist>35 inches for women.
Hypoth~sis: Supporting behavioral change through motivation and goal setting has a positive effect on lifestyle changes among participants , as measured by improvements in the listed parameters.
·w hile excellent programs are offered to all pet'S01Ulel on the base for participation in classes and fitness programs, participation and utilization are less than stellar. It is thought that by offering behavioral support for change, participation and completion of programs will increase and quantifiable health risks may show improvement.
Null hypoth~sis : No con·elations exist between motivation/goal setting education and support on health risks as measured by AC, AS, AH, BMI,IC, W, BMI, BT, S, F, BF and blood measurements of AlC, CRP, G,C, lipids, CBC with cliff., and HC.
Statistics: Con·elations among variables, standard deviation, variance analyses, confidence intervals, linear regression, prediction equations. Alpha = 0.05, 95th percentile, n= 100
Previous studies indicate strong relationships among the various parametet'S listed above.
Study Design: Civilian pet-sonnel who have at least two known health risk factors (blood pressure> l40/90; total cholesterol>240; body mass inclex>30; fasting blood glucose>l 40; waist>40 inches for men or waist>35 inches for women); smoking; aerobic exercise lee than twice a week; and who may be at risk for increased morbidity /mortality as measured by the above parametet'S will be selected for participation. Participants will be randomly assigned to one of two groups, either with motivation/goal setting (education group) or without it. All other education and fitness participation will be the same for both groups. Number and types of classes attended will be tracked by class rostet'S, and individual exercise/nutrition monitoring will
Page 6 of 17 Pages

67
Effect of Dietary, Exercise, Motivational Interventions, and Goal-Setting Strategies on Positive Lifestyle Change and Reducing Health Risk Factors among Civilian Personnel with Van·ous Disease Risk Parameters
be tracked by the individual based on the honor system. Motivation/behavior factors will be assessed for ail participants utilizing: standard evaluation forms attached). Measurements will include body fat analysis (IronMan Inner Scale with a BOD POD measurement optional), strength, flexibility and V0 2 sub-max (MicroFit Analysis System), height, weight, AC (tape measure), AH (calipers), IC (calipers), heart rate (HR), blood pressure (BP), blood lipid profiles (HD, LD, total cholesterol, TG), blood levels of Al C, cortisol (C) and homocysteine, Hg:bAlC, blood glucose, CBC with differentiation, abdominal strength (maximum munber of sit ups which can be performed in one minute), and resting metabolic rate (MedGem). Blood samples will be collected via venipuncture.
8.2. Significance:
Several published studies indicate that there are strong: relationships for reducing: health risks by making: positive lifestyle changes. However, these relationships have never been studied as they apply to the civilian population at WPAFB. In addition, the possible benefits of these smdies will become more transparent as the number and types of measurements utilized to measure change improve. These new measurements include the addition of the IC, the combination of BF and RMR, AS, HC and CBC with diff., and will include the more common measurements such as blood lipids, glucose, etc. as listed above. Tllis study will be expanded to include these parameters to better quantify health risks and to assess the effectiveness of intervention to cultural change and civilian health.
Results of tllis study will help improve the delivery and effectiveness of civilian Health Promotion prog:ranuning: at WPAFB. It may also help decrease morbidity/mortality risks for civilian persormel by fostering: beneficial lifestyle change. In addition, it is hoped that analyses of these data will provide clues to the best methods for supporting: a healthy lifestyle among: base civilians.
8.3. Military Relevance:
hnproving: the health of the civilian workforce may have military relevance in nvo primary areas - increased health/fitness leading: to increased productivity while performing: their AF mission and reduced sick days - both of which reduce costs. These data will also be utilized to improve the ability of HA WC personnel to foster change among: AD to support weight loss (Body Composition Improvement Program) and fitness efforts (Healthy Living: Program) in order to meet AF PT requit·ements . By improvu1g p:ut icipation an d utilization in nutt-ition and fitness programs among: civilians, the Air Force mission of Fit to Fight is also optimized.
Background and L iterature Review
The major push towards improving: the health of the civilian population at Wright Patterson AFB began with the start up of the AF 's first Health and Wellness Centers in 1987 under the direction of Jean Herbst BSN (Health Promotion Director) and then Col. Charles '·Chip'' Roadman. Col Roadman over the next decade was promoted to AF Lt Gen Roadman and served as the AF Surgeon General. During: his tenure, HA WCs were brought on board at ail major AF bases.
Page 7 of 17 Pages

68
Effect of Dietary, Exercise, Motivational Interventions, and Goal-Setting Strategies on Positive Lifestyle Change and Reducing Healih Risk Factors among Civilian Personnel with Various Disease Risk Parameters
HA we persom1el and "wellness" representatives across each base became part of the base wide Health Promotion Working Group (HPWG), chaired by the base wing commander. The primmy mission of the HA we and HPWG was to improve health of our base community through programs on exercise, nutrition, stress reduction and tobacco cessation. Smoking cessation classes (taught by the HA WC director or volunteers) and Health Risks appraisals developed by the Carter Center and blood screenings taken at the unit (by the single HA WC med tech) were hallmarks of the program. Later HA WC persom1el would tabulate results and brief members on health risks as unit commander on overall stats and changes from previous visits. However, year to year individual changes were not as effectively monitored . Over the ensuing years, the HA we staff grew to include a dietitian, an exercise physiologist and, periodically, a health educator, and the variety of programs increased. A study of HA WC programming on base was published in 1995 in the American Journal of Health Promotion and in the medical service digest (1 ,2) . Several physiological as well as psychological/behav ioral improvements were noted and were positively related to program involvement. Other organizations/companies have found similar outstanding results for their Health promotion programming (3 ,4) . These smdies also demonstrated a reduction in health care costs and a variety of markers for health risks, with promotion of healthy behaviors that improve risk factor'S such as lipid profile, stress levels, overweight, A lC, glucose levels, blood pressure, integrated risk score and increased exercise frequency.
During· the late 1990 's, base wellness programs were becoming more diverse while at the same time the HA WC involvement in the military fitness and weight management program was expanded. Soon, the HA WC was in charge of all training, rehab education and program management, with expanded roles in medical profiles for the fitness program. Tllis added comnlitment and civilian interest without added personnel and impacted the HA WC 's ability to continue servicing all the base conununity to the extent it once did or meet the increased demand for new services.
h1 December 2004 under the direction of AFMC General Gregory '·Speedy"' Martin the Civilian Health Promotion Services (CHPS) program (under the ausp ices of the Federal Occupational Health division under the Department of Health and Humaru Services) came on board for all AFMC bases. This program ftmded approximately 4 contract slots on each base to direct health promotion programs solely to the non-nlilitary population. Since their inception, the HA WC, CHPS, Services and other base organizations have worked together to address the needs of our civilian population. Many health/fitness promotion efforts have been spearheaded by these groups, in addition to other organizations on base , w ith vaty in g amounts of success for decreasing health risk and increasing healthy behaviors. Health promotion improvement incentive programs such as the '·500 Club" (1992-1999), 2000-2003 "A Fitness Odyssey", Winter Exercise Challenge (02-03), the Team Lean Challenge (07-09), the Wellness Cup (1999-2004), Portion Off the Pounds (05-08), 10,000 Steps Program (07 -,09), Get Moving (09), President 's Challenge (08) and the AFMC wellness website itself (05-09) are just a few of the programs/websites initiated on the base to increase exercise/health behaviors. However, even with a good working relationship, there was overlap of progranuning and sometimes a lack of targeted education where it was needed, or lackluster participation. Tl1erefore, a renewed push was started to get civilian wellness programs charged up. In 2008 the wing appointed a director
Page8 of17 Pages

69
Effect of Dietary, Exercise, Motivational Interventions, and Goal-Setting Strategies on Positive Lifestyle Change and Reducing Health Risk Factors among Civilian Personnel with Van·ous Disease Risk Parameters
of the h1stallation Civilian Wellness Program at WPAFB to spearhead increased collaboration, marketing and programming for civilian wellness programs on base.
CHPS has had an aggressive screening and education program providing health risk information to individuals either at the HAWC or in briefings at different worksites. For example, if it is found that a unit has 40% smokers or high numbers of individuals with elevated blood pressure, it will be suggested to the unit to schedule smoking cessation or blood pressure control classes. However, follow-up longitudinal statistics on the effect of programming on these clara have been unavailable either on the individual or unit bas is. In other words, we are presently not effectively tracking the results of these programs (either for the initial screening or later added classes, etc.) on changes in health risk. Results thus far have been tabulated primarily on participation and disease prevalence rates but not for change over time.
This smcly is an attempt to quantify the effects of a 16 week welh1ess program with interventions/classes on a group of 100 civilian employees. Anthropomorphic and physiological measurements will be detenninecl pre and post and comparisons made as well as cone lations on the number and type of welh1ess interventions offered and health/behavior improvements. One important additional variable will be as certained that was not in previous bas e studies: waist measurement which has been found to have a high con·elation with cardiovascular mortality, and the risk of metabolic syndrome, both more so than BMI or weight alone (5,6,7,8,9). In addition, market'S of inflammation (which have been shown to have a large role in risk of cardiovascular disease) such as C reactive protein will also be analyzed in tlus study (6) . Lastly, sit up perfonnance to evaluate abdominal strength will be detenninecl. Poor perfotmance for sit ups has also been highly correlation to increase risk of cardiovascular disease mortality (I 0). New parameters for evaluation criteria also include CBC with diff., HgbAI C, and HC.
The AF has recognized the importance of behavior change education in its fitness program (behavior change is a large manclatoty component of its Healthy Living Program cla>s for militaty membet'S who fail their fitness tests). Yet in other health settings we often talk what we "need to do" but not ''how we get ourselves to do it .. , In previous base programs or smclies -although behavior change was included in vatying degrees in most education class - it was not given primary stams on its own so it 's effect ancl/or importance could not be quantified. The primaty objective of the present study is to correct for this problem. A major stand alone education focus of this smcly will be education on motivation and goal setting to promote beneficial behavior change. Therefore, two main treatment groups will be randomly selected with the only d ifference being exposure in one group to initial and monthly motivation/ behavioral change focused education.
This smcly will also serve as a valuable tool to detennine which programs are effective on what health risk. Presently the HA WC receives data on a ''needs assessment'' tool biannmlly. Respondents reply on what classes they would like to see offered - this gives a measure of interest- but this study would give an even more important measure of effectiveness. Om role then post study is not only to improve program effectiveness but also to increase interest for civilians to participate in programs which are the most effective for their individual health risk. Effective programs/behaviors that people will enjoy and take part in for a lifetime is where we will achieve the most bang for our wellness buck.
Page 9 of 17 Pages

70
Effect of Dietary, Exercise, Motivational Interventions, and Goal-Setting Strategies on Posifive Lifestyle Change and Reducing Health Risk Factors among Civilian Personnel with Various Disease Risk Parameters
8.5. R~search D~sign and M~thods :
Materials and M~thods :
Approximately 100 individuals from the DoD civilian population (ages 18-65 years) employed at WPAFB will be recruited. Marketing for tllis study will be accomplished by personal contact, base emails, newspaper, brochures, pamphlets, flyers, and posters. Contact infonnation will be provided within all marketing materials and volunteers will be able to express interest in participating by email, phone or personal contact with investigators. An assessment sheet attached) will be provided to vohmteers who will be asked to respond to the presence or absence of risk factor criteria. Participants must be able to participate in physical activity and have the required fonn for three hours of leave completed and signed by their physician prior to starting the program. Qua lifying participants will meet personally with one of the investigators who will describe and discuss all of the procedmes, risks, and benefits which will also be detailed on a statement of informed consent which the participant will sign. Participants will be allowed to leave the study at anytime without constraint. Participants will be asked to follow pre-testing guidelines which include a 3 hour fast with no exercise, tobacco or caffeine during tllis time. Upon meeting the criteria for participation, volunteers will be asked to meet with the PI and another investigator for explanation of the study and to complete the ICD the medical history questionnaire (while these responses will be recorded, the specific medication(s) will not be recorded). These fonns will be kept in a locked metal cabinet in the HA WC. Upon completion, participants will make an appointment to complete the non-invasive pre-screening requirements listed above. Blood work will be ordered by Dr. Jacobson. Participants will be asked to fast overnight ( 12 hours) and report to the Medical Center for the blood draw. All data will be received and evaluated by the physician, data recorded and tabulated by the appropriate investigator for statistical analyses. To ensure privacy of data, all da ta will be coded and only the appropriate investigator will have access/knowledge of that code.
The following non-invasive procedures will be perfonned in the following sequence, with individuals ' initials :
Oral temperamre, heart rate and blood pressure (Welch Allyn maclline ): BEM Height (ACCUSTAT Genetech Stadiometer): BEM Resting metabolic rate (MedGem): BEM \:V:1ist m e:1surem ent (t.:1pe m e:1sure, :1ver:1g:e oftlu·ee me:1s urements): MAP IC width (ANTHROPOMETER calipers, average of three measurements): MAP Weight (BOD POD digital scale): MAP Body fat analysis (Irorunan ltlller Scale; BOD POD optional) : MAP BMI (calculation): MAP V02 sub-max (MicroFit Analysis System): MAP Ann strength (Microflex): BEM/MAP Flexibility (MicroFit Analysis System): BEM/MAP Sit ups (exercise mat): JFS Statistical Analyses: BEM with JH
Page 10 of 17 Pages
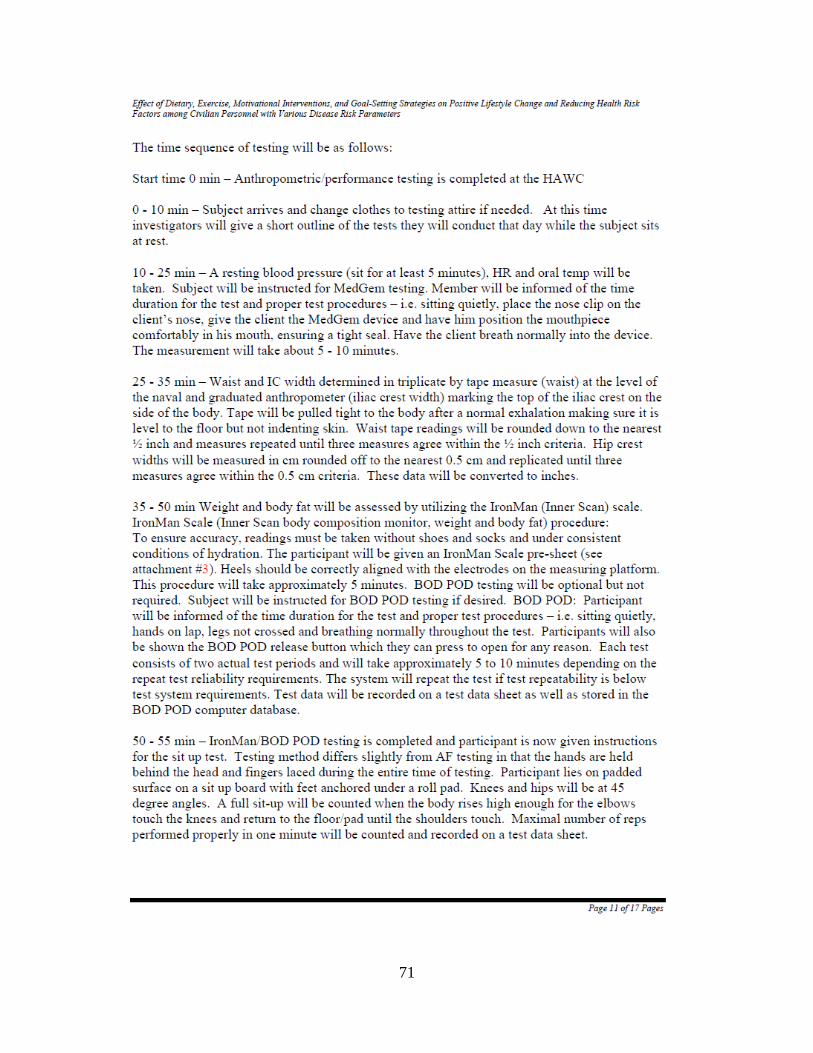
71
Effect of Dietary, Exercise, Motivational Interventions, and Goal-Setting Strategies on Posifive Lifestyle Change and Reducing Health Risk Factors among Civilian Personnel with Various Disease Risk Parameters
The time sequence of testing: will be as follows:
Start time 0 min - Anthropometric/peifonnance testing: is completed at the HA WC
0 - I 0 min - Subject an·ives and change clothes to testing: attire if needed. At this time investigators will give a short outline of the tests they will conduct that day while the subject sits at rest.
IO- 25 min - A resting: blood pressm-e (sit for at least 5 minutes), HR and oral temp will be taken. Subject will be instmcted for MedGem testing:. Member will be informed of the time duration for the test and proper test procedures - i.e . sitting: quietly, place the nose clip on the client's nose, give the client the MedGem device and have him position the mouthpiece comfortably in his mouth, ensuring: a tight seal. Have the client breath nonnally into the device. The measuremen t will take about 5 - I 0 minutes.
25 - 35 min - Waist and IC width detennined in triplicate by tape measure (waist) at the level of the naval and graduated anthropometer (iliac crest width) marking: the top of the iliac crest on the side of the body. Tape will be pulled tight to the body after a nonnal exhalation making: sure it is level to the floor but not indenting: skin. Waist tape readings will be rounded down to the nearest Y, inch and measures repeated until three measures agree within the Y, inch criteria. Hip crest widths will be measured in em rounded off to the nearest 0.5 em and replicated until three measures agree within the 0.5 em criteria. These data will be converted to inches.
3 5 - 50 min Wei g:ht and body fat will be assessed by utilizing: the IronMan (Illller Scan) scale. IronMan Scale (Im1er Scan body composition monitor, weight and body fat) procedure: To ensure accuracy, readings must be taken without shoes and socks and under consistent conditions of hydration. The participant will be given an IronMan Scale pre-sheet (see attachment #3). Heels should be con·ectly aligned with the electrodes on the measuring: platform. This procedure will take approximately 5 minutes. BOD POD testing: will be optional but not required. Subject will be instmcted for BOD POD testing: if desired. BOD POD: Participant will be infonned of the time duration for the test and proper test procedures - i.e. sitting: quietly, hands on lap, legs not crossed and breathing: nonnally throughout the test. Participants will also be shown the BOD POD release button which they can press to open for any reason. Each test consists of two actual test periods and will take approximately 5 to I 0 minutes depending: on the repeat test reliability requirements. The system will repeat the test if test repeatability is below test system requi rem ents . Test d ata w ill be recorde d on a test data sh eet as w ell as stored in the
BOD POD computer da tabase.
50 - 55 min - IronMan/BOD POD testing: is completed and participant is now given instmctions for the sit up test . Testing: method diffe1-s slightly from AF testing: in that the hands are held behind the head and fmg:ers laced during: the entire time of testing:. Participant lies on padded surface on a sit up board with feet anchored under a roll pad. Knees and hips will be at 45 degree angles. A full sit-up will be counted when the body rises high enough for the elbows touch the knees and retum to the floor/pad tmtil the shoulders touch. Maximal number of reps perfonned properly in one minute will be counted and recorded on a test data sheet.
Page 11 of 17 Pages

72
Effect of Dietary, Exercise, Motivational Interventions, and Goal-Setting Strategies on Positive Lifestyle Change and Reducing Healih Risk Factors among Civilian Personnel with Various Disease Risk Parameters
55 - 75 min - MicroFit Health and Fitness Analysis System procedure: The MicroFit will provide the participant with a fitness assessment of their ann strength, back flexibility and cardiovascular fitness. First, the participant will be required to ride an Ergometry bike for approximately 8 to 12 minutes, this will provide a V02 sub-maximal aerobic fitness score. Secondly, they will stand on a platform which has an attached ann bar, and will pull the bar (one time) at maximal strength for about 10-20 seconds, tllis will provide a one max rep score. Finally, they will sit on the floor and perfonn a reach test - three times and the best score will be recorded, this will provide a flexibility score. There is a minimal risk of injmy; please stop exertion if pain or discomfort is experienced during any part of the assessment.
75 min - Participant is then di.t·ected to the Medical Center for the blood draw. Blood samples will be taken during that same week if possible, adhering to the 12 hour fasting guidelines. The sample will then be handled, prepared, treated and stored accordi.t1g to standard procedure and transported to the WP medical center lab for analysis.
Blood will be collected accordi.t1g to standard WPAFB 88 MDG (Medical Center) Lab protocol i.t1 the WP AFB Medical Center. Approxi.tnately a 20 cc blood sample will be collected.
All procedm-es perfonned that have been described are within 88 MDG standard care protocol. Statistical Analyses: All statistics will be conducted by primary and associate investigators with consultation from Joseph Huelsman GS-11, AFMC/A49, phone 257-4239 who has underwent ulVestigator training Oct 08. To ensure privacy of data, all data will be coded and only the appropriate investigator will have access/knowledge of that code. Mr Huelsman will work with coded data only and will have no access/knowledge of the subject code.
Statistics: Con·elations among variables, standard deviation, variance analyses, linear regression, prediction equations. P=0.05, 95th percentile, n=I OO to ISO
'·All specimens kept at 88 MDG laboratories and will be handled and disposed of in accordance with federal regulations."
8.6. Source of Resear·ch Material pet· Par ticipa nt:
Source of Research Mater·ial per Par ticipant Standat·d Care Research Driven Blood Sample - Lipid profile 0 2 Blood Sample - H2bAIC, 2lucose 0 2 Blood Sample- Homocysteine 0 2 HA WC Record Data 0 2 Blood Sample - CBC with diff 0 2 Blood Sample - Cortisol Blood Sample - CRP 0 2
Page 12 of 17 Pages

73
Effrct of Dietary, Exercise, Motivafionallntervenffons, and Goal-Setting Strategies on Positive Lifestyle Change and Reducing Healih Risk Factors among Civilian Personnel with Van·ous Disease Risk Parameters
8.7. I nd usion/exclusion n iteria:
The target population is DoD Civilians 18-65 years of age and employed at WPAFB. Participants must have two or more of the following risks to be considered for p articipation in this smdy: blood pressure> I40/90; total cholesterol>240; body mass index>30; fasting blood glucose> I40; waist>40 inches for men or waist>35 inches for women; aerobic exercise less than twice a week; smoking. Participants will be asked whether they are ctmently ta king medications for hypertension, cholesterol or diabetes. If the answer is affirmative, which condition(s) will be noted but no specific medication list will be required. Participants must be able to participate in physical activity and have th e required form for three hours of! eave completed and signed by their physician prior to starting the program.
There are no exclusion criteria with the exception of the lack of parameters listed in the previous pa.ragraph.
8.8. Number of Subjects:
TOTAL NUMBER OF SUBJECT S (smdy-wide): 100 Civilians from WPAFB
9. H UMAN SUBJECT PROTECTION
9.1. Renuitment :
Volunteers will be recmited from the DoD civilian population on WPAFB who meet at least two of the health risk parameters and are cleared by their t)hysician to participate in physical activity. Presence of these parameters will be obtained through the attached form. Solicitation for participation in this opportunity will be by email, personal contact, base newspaper, flyers , posters and other base media . An ICD and a family l1istory questionnaire will be provided at the in itial study information meeting (PI with another investigator).
Subjects will not be paid for participation in this study.
9.2. Benefits:
Subjects will receive information regarding their body fat, blood profiles, and h ealth risk factor'S. It may promote the subject 's involvement in self-care, disease prevention and possibly support beneficial lifestyle changes.
9.3. Risks :
There is only one possible risk associated with the non-invasive measurements used in this smdy and that is subjects may experience some claustrophobic feelings while in the BOD POD (optional). Body fat analys is will be assessed utilizing the IronMan (Itmer Scale) . For the invas ive techniques there are some minimal risks associated by drawing blood w hich include: brillising (hematoma) , soreness and excessive oozing at the site of the venipuncture. Additional
Page 13 of 17 Pages
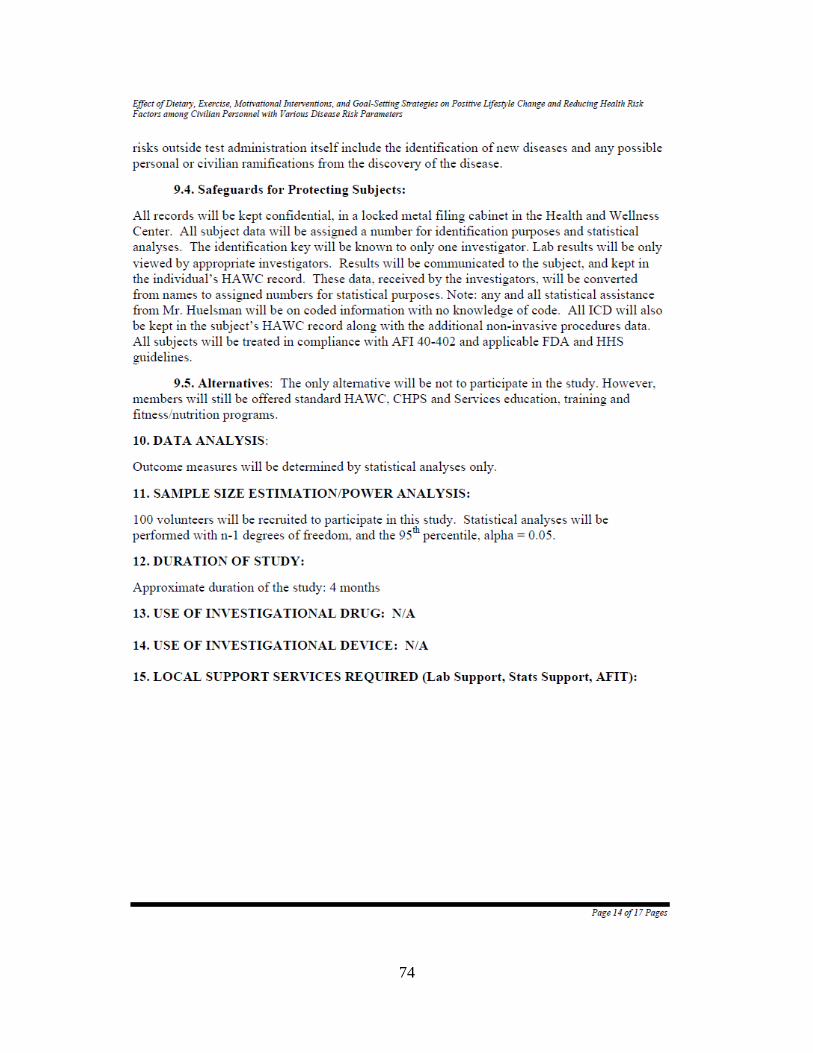
74
Effect of Dietary, Exercise. Motivational Intervenffo1JS, and Goal-Setting Strategies on Positive Lifestyle Change and Reducing Healih Risk Factors among Civilian Personnel with Van·ous Disease Risk Parameters
risks outside test administration its elf include the identification of new diseases and any possible personal or civilian ramifications from the discovery of the disease.
9.4. Safegua1·ds fol' P1·otecting Subjects:
All records will be kept confidential, in a locked metal filing cabinet in the Health and Wellness Center. All subject da ta will be assigned a number for identification pmposes and statistical analyses. The identification key will be known to only one investigator. Lab results will be only viewed by approp.riate investigators. Results will be communicated to the subject, and kept in the individual 's HA we record. These data, received by the investigators, will be converted from names to assigned numbers for statistical purposes. Note: any and ail statistical assistance from Mr. Huelsman will be on coded infonnation with no knowledge of code. Ail reD will also be kept in the subj ect's HA WC record along with the additional non-invasive procedures da ta . All subjects will be treated in compliance with AFI 40-402 and applicable FDA and HHS guidelines.
9.5. Altel'natives: The only altemative will be not to participate in the study. However, members will still be offered standard HA we. e HPS and Services education, training and fitness/nutrition p1·ograms.
10. DATA ANALYSIS:
Outcome measures will be determined by statistical analyses only.
11. SAMPLE SIZE ESTIMATION/POWER ANALYSIS:
n 00 volunteers will be recmited to participate in tllis study. Statistical analyses will be perfonned with n- 1 degrees of freedom, and the 95th percentile, alpha = 0.05.
12. DURATION OF STUDY:
Approximate duration of the study: 4 months
13. USE OF 11\f\TESTIGATIONAL DRUG: N/A
14. USE OF 11\f\TESTIGATIONAL DEVICE : N/A
15. LOCAL SUPPORT SERVICE S REQUIRED (Lab Suppo1·t, Stats Suppol't, AFIT):
Page I 4 of !7 Pages

75
Effect of Dietary, Exercise, Motivational Interventions, and Goal-Setting Strategies on Posifive Lifestyle Change and Redu:cing Health Risk Factors among Civilian Personnel with Various Disease Risk Parameters
15.L Lab Supp o1·t :
D~scrip tion Ol ' T est Nam~ R~s~a 1·ch W hich lab will per form ~ach t~st? Driven
Blood lipids Yes WPMC Blood glucose Yes WPMC
Blood homocysteine Yes WPMC Hemo2lobin A l C Yes WPMC CBC with diff. Yes WPMC C Reactive Protein Yes WPMC Cortisol Yes WPMC
15.2. Radiology Su ppo1·t R~quind: N/A
15.3. Phar macy Support: N/A
15-4. Nu r sing Sup por t : N/A
15.5. Radioactive Matel'ials: N/A
15.6. Oth~r Local Support: N/A
16. COLLABORA TING INSTITUTION SUPPORT: Air Force Institute ofTeclmology
17. BUD GET : MedGem: $3,000.00 Refill for MedGem, PIN 609-0075-01 D: $3,300.00 Blood work cost: $14,500.00
This protocol has kindly been funded by the 88 A i.:r Base Wing and the Installation Civilian Wellness Program.
18. EXTERNAL RESOUR CES: N/A
19. MANPO\VER: (hours per completed smdy, including publications preparation, etc.) Principle Investigator, J.F. Schlub: 250 hours, on <iuty Associate hlVestigator, B.E. Moore: 50 hours, on <iuty Associate hlVestigator, J.J. Elshaw: 7 5 hours, on duty Associate Investigator, M .A. Papio: 150 hours, on duty Associate Investigator, J.R. Jacobson: 60 hours, on duty
Page 15 of !7 Pages

76
Effect of Dietary, Exercise, Motivational Interventions, and Goal-Setting Strategies on Posilive Lifestyle Change and Reducing Healih Risk Factors among Civilian Personnel with Various Disease Risk Parameters
20- BIBLIOGRAPHY
1. "A Study of a USAF Wellness Program" J. Schlub, D. Herbst, L. Seas, P.Jenks, C. Lamoreaux, F. Kelly, L. Guttersolu1. USAf Med. Digest, Fall, 1994.
2. "DOD Health and Wellness Center: Wellness Makes Impact" J. Schlub, D. Herbst, L. Seas, P. Jenks, C. Lamoreaux, F. Kelly, L. Guttersolm . AJHP, May/Jun Vol.9, No.5, 1995 .
3. Cianbro Develops World Class Wellness h1itiative - Wellness Cotmcils of America, 2006 http ://www.welcoa . or2/wellworkplace/index.php?cate~toiy=20
4. Intemationai: A Platinum Well Workplace Case Study - Wellness Cotmcils of America, 2006 http://www. welcoa. org/wellworkplace/ index. php? category=2•0
5. Janssen, L. et al. , Waist circmnference not body mass index explains obesity related Health Risk. Am. J. Clin. Nutrition., 79(3) : 379-384,2004.
6. Klein, Set al. Waist Circumference and Cardiomet.abolic Risk: A c onsensus statement from Shaping America's Health : Association for Weight management and Obesity Prevention:NAASO, The Obesity Society; The American Society for Nutrition and the American Diabetes Association, D iabetes Care, 30: 1657-1692, 2007.
7. Koster, K. et. al. , Waist Circmnference and Mortality. Am. J. Epidemiology ., 167(12) : 1465-1475, 2008.
8. Lakka, T et. a!., Abdominal obesity is associated with accelerated progression of carotid atherosclerosis in men. Atherosclerosis, 154(2): 497-504, 2001.
9. Chan , D. et al Waist circumference, waist-to-hip ratio and body mass index as predictors of adipose tissue compartments in men. QJM 96(6):44 1-447, 2003.
10 . Katzmarzyk, P and Craig C. Musculoskeletal fitness and risk of mortality. Med. Sci. Sports Exerc., Vol 34 (5), pp 740-744, 2002.
2L RISK CAT EGORY: Minimal
Page 16 of 17 Pages

77
Effect of Dietary, Exercise, Motivational Interventions, and Goal-Setting Strategies on Posilive Lifestyle Change and Reducing Healih Risk Factors among Civilian Personnel with Various Disease Risk Parameters
22. SIGNAT URE SECTION
Pl'incipal I nvestigatol': I am aware that I am not authorized to accept any funds or other form of compensation for conducting research. All subjects will be treated in compliance with all applicable organizational, service, DoD and Federal regulations, and all applicable FDA and HHS guidelines. I have read, tmderst.and, and signed the attached Certificate of Compliance. I understand I must complete a review o f this protocol at least every 12 months to prevent expiration of the study's approval. I will notify the protocol office p r·iol' to PCS/separations actions, or closure.
James F Schlub, YD-2, Civilian Exercise Physiologist
Date
Flight Commandel': I have cons idered this protocol and the personnel and resource support involved. I find this protocol to have sufficient scientific merit for consideration by the Squadron Commander and Institutional Review Board.
Theresa Siejack, YJ-2, USAF, Civilian Hea lth Promotion Manager
Date
Squadr·on Commandn : I have considered this protocol and am able to approve Squadron persormel and resource support. I understand that I will be the point of contact for con·ection of deficiencies should the principal investigator fail to meet the requiremen ts agreed to in the Cert ificate of Compliance completed by the PI. I find this protocol to l1ave sufficient scientific merit for consideration by the Institutional Review Board.
Dawn E. Wilson, Col, USAF, BSC Commander, 88 AMDS
Date
Page 17 of 17 Pages

78
Appendix B
Results of Analysis of Variance
ANOVA
Motivation
Sum of Squares df Mean Square F Sig.
Between Groups .653 1 .653 3.109 .081
Within Groups 23.109 110 .210
Total 23.763 111
ANOVA
EmoExhaust
Sum of Squares df Mean Square F Sig.
Between Groups 2.952 1 2.952 1.787 .184
Within Groups 181.770 110 1.652
Total 184.722 111
ANOVA
T1-BMI
Sum of Squares df Mean Square F Sig.
Between Groups 33.279 1 33.279 .722 .397
Within Groups 5113.117 111 46.064
Total 5146.396 112
ANOVA
T1-LAB LDL
Sum of Squares df Mean Square F Sig.
Between Groups 443.310 1 443.310 .376 .541
Within Groups 127340.046 108 1179.074
Total 127783.356 109

79
Appendix C
Behavioral & Demographic Survey:
Motivation Questions (1-9)/Emotional Exhaustion Questions (46-54)
Read each statement and using the scale below as a reference, circle the num ber rat ing from 1 "St rongly
Disagree" to 7 "Strongly Agree" which indicat es how you feel.
1 2 3 4 5 6 7
Strongly Slight ly Nei ther
Sl ight ly Strongly Disagree Agree nor Agree
Disagree Disagree Disagree
Agree Agree
1. Doing well in this program is important to me. 1 2 3 4 5 6 7
2. I want t C> do well in this program. 1 2 3 4 5 6 7
3. I will t ry m y best in this program. 1 2 3 4 5 6 7
4. I will t ry to do the very best I can w hile in this program. 1 2 3 4 5 6 7
5. While participat ing in this program, I will work hard and t ry to do well. 1 2 3 4 5 6 7
6. I want t C> be among the top performers in this program. 1 2 3 4 5 6 7
7. I am ext remely motivated to do well in this program. 1 2 3 4 5 6 7
8. I just don' t care how I do in this program. 1 2 3 4 5 6 7
9. I won' t p ut much effort into this program. 1 2 3 4 5 6 7
10. I would like to do well in this program. 1 2 3 4 5 6 7
11. It would be good to succeed w hile in this program. 1 2 3 4 5 6 7
12. I want t C> succeed while in this program. 1 2 3 4 5 6 7
13. If you do well in this program, you have a good chance of increasing 1 2 3 4 5 6 7
your hea lth.
14. I think you will improve your health i f you succeed in this program. 1 2 3 4 5 6 7
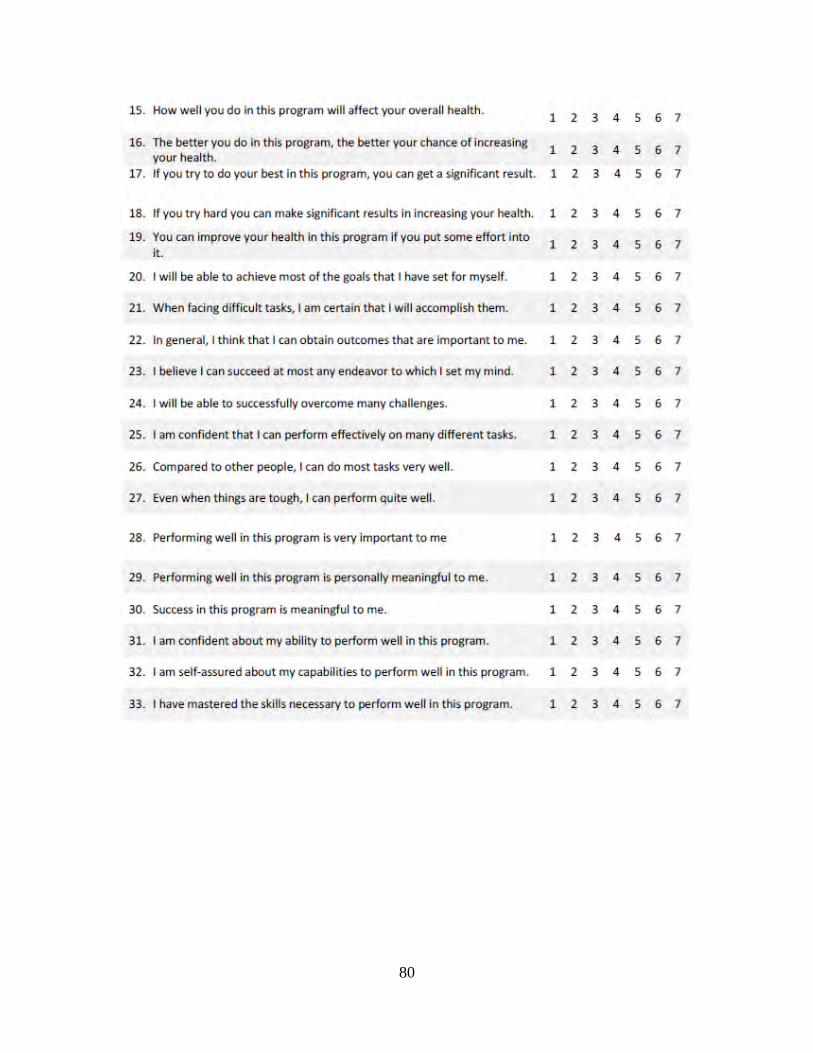
80
15. How well you do in this program wi ll affect your overall health. 1 2 3 4 5 6 7
16. The bet ter you do in this program, the better your chance of increasing 1 2 3 4 5 6 7
your health. 17. If you t ry to do your best in th is program, you can get a significant result . 1 2 3 4 5 6 7
18. If you t ry hard you can make significant results in increasing your health. 1 2 3 4 5 6 7
19. You can improve your health in this program if you put some effort into 1 2 3 4 5 6 7
it.
20. I will be able to achieve most of the goals that I have set for myself . 1 2 3 4 5 6 7
21. When facing difficult tasks, I am certain that I wi ll accomplish them. 1 2 3 4 5 6 7
22. In general, I th ink that I can obtain outcomes that are important to me. 1 2 3 4 5 6 7
23. I believe I can succeed at most any endeavor to which I set my mind. 1 2 3 4 5 6 7
24. I will be able to successfully overcome many challenges. 1 2 3 4 5 6 7
25. I am conf ident that I can perform effectively on many di fferent tasks. 1 2 3 4 5 6 7
26. Compared to other people, I can do most tasks very well. 1 2 3 4 5 6 7
27. Even when things are tough, I can perform quite well. 1 2 3 4 5 6 7
28. Performing well in this program is very important to me 1 2 3 4 5 6 7
29. Performing well in this program is personally meaningful t o me. 1 2 3 4 5 6 7
30. Success in this program is meaningful to me. 1 2 3 4 5 6 7
31. I am conf ident about my ability to perform well in th is program. 1 2 3 4 5 6 7
32. I am self-assured about my capabil it ies to perform well in this program. 1 2 3 4 5 6 7
33. I have mastered the ski lls necessary to perform well in this program. 1 2 3 4 5 6 7

81
34. I have significant autonomy in determining how I perform in this program .
1 2 3 4 5 6 7
35. I can decide on my own how to go about obtaining results in this 1 2 3 4 5 6 7
program . 36. I have considerable opportunity for independence and freedom in how I
1 2 3 4 5 6 7 perform in this program.
37. My impact on what happens in my life is large. 1 2 3 4 s 6 7
38. I have a great deal of control over what happens in m y li fe. 1 2 3 4 5 6 7
39. I have significant influence over what happens in my life. 1 2 3 4 5 6 7
40. My opinion of myself goes up w hen I perform well in this program. 1 2 3 4 5 6 7
41. I feel a gr eat sense of personal sat isfaction when I perform well in this 1 2 3 4 5 6 7
program . 42. I feel bad and unhappy w hen I d iscover that I have performed poorly in
2 3 5 6 7 this program.
1 4
43. My own feel ings generally are not affected much one way or the other 1 2 3 4 5 6 7
by how w ell I do in this program. 44. Most people in this program fe~l a great sense of personal satisfact ion
2 3 5 6 7 when they do well.
1 4
45. Most people in this program feel bad or unhappy when they find that 1 2 3 4 5 6 7
they hav.e performed poorly.
46. Working with people all day is a strain for me. 1 2 3 4 5 6 7
47. I feel burned-out from my worl'<. 1 2 3 4 5 6 7
48. I feel frust rated by my job. 1 2 3 4 5 6 7
49. I feel I'm working too hard on my job. 1 2 3 4 5 6 7
50. Working with people directly puts too much stress on me. 1 2 3 4 5 6 7
51. I feel like I'm at the end of my r ope. 1 2 3 4 5 6 7
52. I feel emotionally drained from my work. 1 2 3 4 5 6 7
53. I feel used up at the end of the day. 1 2 3 4 5 6 7
54. I feel fat ig ued when I get up in the morning and have to face another 2 3 5 6 7 day on the job. 1 4
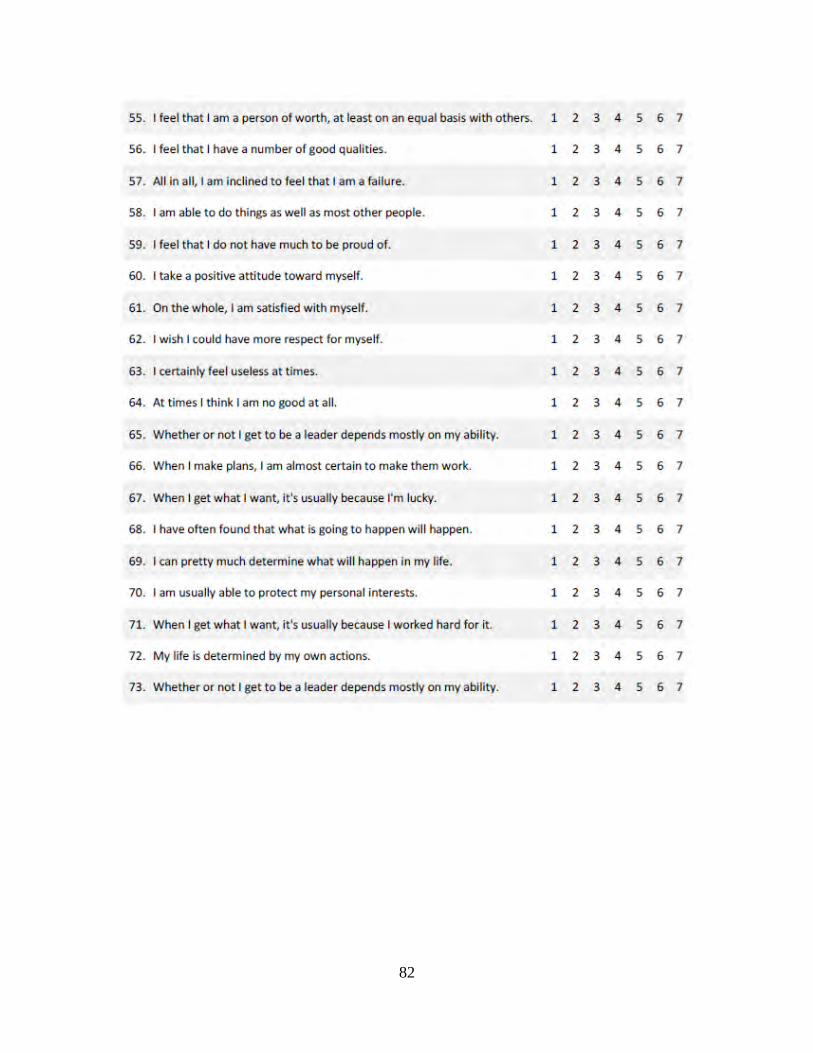
82
55. I feel that I am a person of worth, at least on an equal basis with others. 1 2 3 4 5 6 7
56. I feel that I have a number of good qualit ies. 1 2 3 4 5 6 7
57. All in all, I am inclined! to feel that I am a failure. 1 2 3 4 5 6 7
58. I am able to do things as well as most other people. 1 2 3 4 5 6 7
59. I feel that I do not ha11e much to be proud of . 1 2 3 4 5 6 7
60. I take a posi tive at titude toward myself . 1 2 3 4 5 6 7
61. On the whole, I am sartisfied w ith myself . 1 2 3 4 5 6 7
62. I wish I could have mo re respect for myself. 1 2 3 4 5 6 7
63. I certainly feel useless at times. 1 2 3 4 5 6 7
64. At times I think I am no good at all. 1 2 3 4 5 6 7
65. Whether or not I get to be a leader depends most ly on my abi lity. 1 2 3 4 5 6 7
66. When I make plans, I am almost certain to make them work. 1 2 3 4 5 6 7
67. When I get what I want, it 's usually because I'm lucky. 1 2 3 4 5 6 7
68. I have often found that what is going to happen w ill happen. 1 2 3 4 5 6 7
69. I can pret ty much determine what w ill happen in my life. 1 2 3 4 5 6 7
70. I am usually able to protect my personal interests. 1 2 3 4 5 6 7
71. When I get what I want, it 's usually because I worked hard for it. 1 2 3 4 5 6 7
72. My life is determined by my own act ions. 1 2 3 4 5 6 7
73. Whether or not I get to be a leader depends most ly on my abi lity. 1 2 3 4 5 6 7

83
74. My feelings are easily hurt. 1 2 3 4 5 6 7
75. I'm a nervous person. 1 2 3 4 5 6 7
76. I'm a worrier. 1 2 3 4 5 6 7
77. I am often tense or "high strung." 1 2 3 4 5 6 7
78. I often suffer from "nerves." 1 2 3 4 5 6 7
79. I am often troubled by feelings o f guilt. 1 2 3 4 5 6 7
80. My mood often goes up and down. 1 2 3 4 5 6 7
81. Sometimes I feel miserable for no reason. 1 2 3 4 5 6 7
82. I am an Irritable person. 1 2 3 4 5 6 7
83. I often feel fed up. 1 2 3 4 5 6 7
84. I often worry too long after an embarrassing experience. 1 2 3 4 5 6 7
85. I often feel lonely. 1 2 3 4 5 6 7
1 2 3 4 5
Very slight ly A Uttle Moderately Quite a Bit Ext remely
or not at all
Rate the following items as to what extent you generally feel this way, that is, how you feel on average
86. Interested 1 2 3 4 5 87. Distressed 1 2 3 4 5 88. Exci ted 1 2 3 4 5 89. Upset 1 2 3 4 5 90 . Strong 1 2 3 4 5 91. Guilty 1 2 3 4 5 92. Host ile 1 2 3 4 5 93. Enthusiastic 1 2 3 4 5 94 . Proud 1 2 3 4 5 95. Irritable 1 2 3 4 5 96. Alert 1 2 3 4 5 97. Ashamed 1 2 3 4 5 98. Inspired 1 2 3 4 5 100. Nervous 1 2 3 4 5 101. Determined 1 2 3 4 5 10 2. Attentive 1 2 3 4 5 10 3. Jit tery 1 2 3 4 5 104. Active 1 2 3 4 5 10 5. Afraid 1 2 3 4 5

84
Demographics Survey
Please provide the following demographic information.
1. Gender:----------------------------
2. Job type (e.g. Program Management, Contracting, Finance, Cost, Logist i'cs, etc.):_
3. Years of work experience: _____________________ _
4. Highest level of education:·---------------------
5. Organizat ional level of current posit ion (e.g. HQ Staff, Functional Staff, Wing, Group, Squadron,
Program level):. _______________________ _
6. Organizat ion: _________________________ _
7. Do you use tobacco products? ------- If yes, how often? _____ _
8. How often do you consume alcohol? _________________ _
9. How far do you need to travel to get to the gym where you typically work out? ___ _

85
Appendix D
Results of Reliability Analysis Motivation at Time 1
Reliability Statistics
Cronbach's
Alpha
Cronbach's
Alpha Based on
Standardized
Items N of Items
.905 .941 9
Item-Total Statistics
Scale Mean if
Item Deleted
Scale Variance
if Item Deleted
Corrected Item-
Total
Correlation
Squared
Multiple
Correlation
Cronbach's
Alpha if Item
Deleted
mot1 53.0000 13.928 .798 .733 .887
mot2 52.9375 14.257 .817 .829 .888
mot3 52.9464 14.051 .834 .866 .886
mot4 52.9286 13.869 .870 .912 .884
mot5 52.9375 13.843 .869 .937 .884
mot6 53.6250 12.345 .465 .261 .948
mot7 53.1607 13.542 .714 .550 .892
mot8r 52.9196 14.435 .710 .848 .894
mot9r 52.9018 14.504 .740 .876 .893
Motivation at Time 2
Reliability Statistics
Cronbach's
Alpha
Cronbach's
Alpha Based on
Standardized
Items N of Items
.945 .956 9

86
Item-Total Statistics
Scale Mean if
Item Deleted
Scale Variance
if Item Deleted
Corrected Item-
Total
Correlation
Squared
Multiple
Correlation
Cronbach's
Alpha if Item
Deleted
T2Q1 48.3871 44.831 .877 .923 .937
T2Q2 48.3387 45.769 .819 .897 .940
T2Q3 48.6129 42.995 .884 .884 .934
T2Q4 48.6774 41.566 .911 .917 .932
T2Q5 48.6935 42.347 .867 .877 .934
T2Q6 49.4032 38.638 .708 .680 .953
T2Q7 48.9032 40.679 .872 .856 .934
T2Q8r 48.3548 44.790 .692 .816 .943
T2Q9r 48.4355 43.889 .721 .849 .942
Emotional Exhaustion at Time 1
Reliability Statistics
Cronbach's
Alpha
Cronbach's
Alpha Based on
Standardized
Items N of Items
.923 .926 9
Item-Total Statistics
Scale Mean if
Item Deleted
Scale Variance
if Item Deleted
Corrected Item-
Total
Correlation
Squared
Multiple
Correlation
Cronbach's
Alpha if Item
Deleted
EE1 21.49 111.658 .597 .671 .922
EE2 21.11 100.547 .854 .789 .905
EE3 21.17 105.638 .726 .684 .914
EE4 21.28 106.670 .728 .605 .914
EE5 21.97 112.945 .757 .748 .914
EE6 22.39 115.394 .695 .581 .918
EE7 21.72 103.103 .820 .738 .908
EE8 21.33 103.070 .733 .669 .914
EE9 21.46 108.737 .666 .517 .918

87
Emotional Exhaustion at Time 2
Reliability Statistics
Cronbach's
Alpha
Cronbach's
Alpha Based on
Standardized
Items N of Items
.920 .922 9
Item-Total Statistics
Scale Mean if
Item Deleted
Scale Variance
if Item Deleted
Corrected Item-
Total
Correlation
Squared
Multiple
Correlation
Cronbach's
Alpha if Item
Deleted
T2Q46 22.52 107.963 .589 .680 .919
T2Q47 22.25 99.580 .797 .739 .905
T2Q48 22.11 98.810 .817 .839 .903
T2Q49 22.37 102.881 .733 .604 .909
T2Q50 23.06 112.738 .629 .685 .916
T2Q51 23.56 112.864 .718 .691 .913
T2Q52 22.78 100.627 .828 .832 .902
T2Q53 22.44 102.477 .696 .704 .912
T2Q54 22.59 105.956 .679 .655 .913

88
Appendix E
Results of Factor Analysis
Time 1

89
Anti-image Matrices
mot1 mot2 mot3 mot4 mots mot6
Anti-innage Covariance moll .232 · .071 .014 · .031 · .OOS · .037
mot2 · .071 .166 · .054 .012 · .024 .014
mot3 .014 · .054 .124 · .018 · .029 · .016
mot4 · .031 .012 · .018 .08S · .042 .019
mots · .OOS · .024 · .029 · .042 .OS6 · .024
mot6 · .037 .014 · .016 .019 · .024 .668
mot7 · .OS3 .010 · .002 · .007 · .012 · .021
mot8r · .OOS · .043 .007 · .017 .031 · .06S
II1Ul91 .007 .038 .003 .0 10 · .036 .043
EE1 · .OS9 .009 .014 .01S · .018 .OS6
EE2 .027 · .017 .014 · .009 · .001 .020
EE3 · .031 .011 .004 .010 · .006 · .020
EE4 · .010 · .012 · .006 · .009 .012 .021
EES .054 .000 · .006 · .004 .003 · .042
EE6 · .024 .019 .016 · .003 · .003 · .OS7
EE7 · .014 · .007 · .017 · .007 .01S .004
EE8 .04S · .001 .016 .022 · .031 .080
EE9 · .041 .000 · .OOS · .001 .01S · .OS4
Anti-innage Correlation moll .902" · .360 .081 -.221 · .047 · .093
mot2 · .360 .ass• · .377 .102 -.24S .041
mot3 .081 · .377 .929° · .171 · .34S · .OSS
mot4 · .221 .102 · .171 .8963
· .610 .079
mots · .047 · .24S · .34S · .610 .8203 - 123
mot6 · .093 .041 · .OSS .079 · .123 .882°
mot7 · .179 .040 · .008 · .039 · .082 · .041
mot8r · .027 · .29S .OS9 · .1S8 .362 · .222
mot9r .043 .28S .023 .102 · .462 .1S9
EE1 · .229 .043 .076 .096 · .14S .129
EE2 .134 · .098 .092 · .076 · .012 .OS8
EE3 · . 119 .052 .023 .063 · .046 · .045
EE4 · .034 · .OSO · .028 · .OS3 .082 .043
EES .239 .001 · .038 · .027 .02S · .108
EE6 · .079 .073 .072 · .016 · .023 · .109
EE7 · .OS7 · .033 · .098 · .OS2 .130 .009
EE8 .176 · .004 .084 .142 -.246 .182
EE9 · .131 .000 · .021 · .004 .09S · .102
a. Measures of Sampling Adequacy(MSA)

90
Arnti·image Matrices
mot7 mot8r mot9r EE1 EE2 EE3
Anti-image Covariance mot1 · .OS3 ·.OOS .007 ·.OS9 .027 · .031
mot2 .010 ·.043 .038 .009 ·.017 .0 11
mot3 · .002 .007 .003 .014 .014 .004
mot4 · .007 ·.017 .0 10 .01S ·.009 .0 10
mots · .012 .031 · .036 ·.018 ·.001 · .006
mot6 · .021 ·.06S .043 .OS6 .020 · .020
mot7 .380 ·.066 .027 .066 ·.022 .046
mot8r · .066 .129 · .'100 ·.016 .033 · .029
mot9r .027 ·.100 .'108 .023 ·.03S .031
EE1 .066 ·.016 .023 .28S ·.073 .026
EE2 · .022 .033 · .03S ·.073 .17S · .131
EE3 .046 ·.029 .031 .026 ·.131 .284
EE4 · .073 .039 · .028 .037 .008 · .073
EE5 · .007 ·.006 .004 ·.162 .000 .004
EE6 .002 .OOS .004 .084 ·.040 .023
EE7 · .008 ·.016 .0 14 .012 ·.037 · .04S
EE8 .007 ·.03S .02S ·.021 ·.021 .066
EE9 .08S ·.029 .0 14 .036 ·.OS7 · .0 16
Anti-image Correlation mot1 · .179 ·.027 .043 ·.229 .134 · .119
mot2 .040 ·.29S .28S .043 ·.098 .OS2
mot3 · .008 .OS9 .023 .076 .092 .023
mot4 · .039 ·.1S8 .'102 .096 ·.076 .063
mots · .082 .362 · .462 - 14S ·.012 · .046
mot6 · .041 ·.222 .'1S9 .129 .OS8 · .04S
mot7 .9163
· .299 .'136 .199 ·.08S .139
mot8r · .299 .707° · .BS1 ·.084 .221 · .149
mot9r .136 ·.8S1 .7413
.129 ·.254 .17S
EE1 .199 ·.084 .'129 .7S33
· .328 .090
EE2 · .08S .221 · .254 ·.328 .83S3
· .58S
EE3 .139 ·.149 .'17S .090 ·.S8S .8323
EE4 · .199 .183 · .'143 .116 .031 · .229
EES · .024 ·.038 .027 ·.643 ·.002 .0 16
EE6 .006 .022 .0 17 .247 ·.149 .068
EE7 · .02S ·.088 .086 .046 ·.178 · .169
EE8 .021 ·.180 .'143 ·.074 ·.093 .231
EE9 .211 - 122 .066 .102 ·.210 · .046
a. Measures of Samp11ng Adequacy(MSA)

91
Anti-image Matrices
EE4 EES EE6 EE7 EE8 EE9
Anti- image Covariance moll · .010 .054 · .024 · .014 .04S · .041
mot2 · .012 .000 .019 · .007 · .001 .000
mot3 · .006 · .006 .016 · .017 .016 · .OOS
mot4 · .009 · .004 · .003 · .007 .022 · .001
mots .012 .003 · .003 .01S · .031 .01S
mot6 .021 · .042 · .OS? .004 .080 · .054
mot? · .073 · .007 .002 · .008 .007 .08S
mot8r .039 · .006 .OOS · .016 · .03S · .029
mot9r · .028 .004 .004 .014 .02S .014
EEl .037 · .162 .084 .012 · .021 .036
EE2 .008 .000 · .040 · .037 · .021 · .OS?
EE3 · .073 .004 .023 · .04S .066 · .016
EE4 .353 · .11S · .002 · .OS1 · .036 · .017
EES · .11S .222 · .068 · .007 .01S · .007
EE6 · .002 · .068 .402 · .081 · .OS8 · .038
EE7 · .OS1 · .007 · .081 .24S · .108 .020
EE8 · .036 .01S · .OS8 · .108 .287 · .119
EE9 · .017 · .007 · .038 .020 · .119 .42S
Anti- image Correlation moll · .034 .239 · .079 · .OS? .176 · .131
mot2 · .050 .001 .073 · .033 · .004 .000
mot3 · .028 · .038 .072 · .098 .084 · .021
mot4 · .053 · .027 · .016 · .OS2 .142 · .004
mots .082 .02S · .023 .130 · .246 .09S
mot6 .043 · .108 · .109 .009 .182 · .102
mot? · .199 · .024 .006 · .02S .021 .211
mot8r .183 · .038 .022 · .088 · .180 · .122
mot9r · .143 .027 .017 .086 .143 .066
EEl .116 · .643 .247 .046 · .074 .102
EE2 .031 · .002 · .149 · .178 · .093 · .210
EE3 · .229 .016 .068 · .169 .231 · .046
EE4 .. 877a · .410 · .004 · .174 · .113 · .044
EES · .410 .828" · .228 · .031 .OS9 · .022
EE6 · .004 · .228 .9083
· .259 · .172 · .091
EE7 · .174 · .031 · .2S9 .901a · .407 .063
EE8 · .113 .OS9 · .172 · .407 .8343
· .342
EE9 · .044 · .022 · .091 .063 · .342 .902a
a. Measures of Samp11ng Adequacy(MSA)

92
Total Variance Explained
Component Initial Eigenvalues Extraction Sums of Squared Loadings
Total % of Valiance Cumulative % Total % of Valiance Cumulative %
1 7.209 40.052 40.052. 7.209 40.052 40.052
2 4.787 26.595 66.647 4.787 26.595 66.647
3 1.104 6.133 72.780
4 .824 4.575 77.355·
5 .741 4.119 81.474
6 .611 3.395 84.869•
7 .574 3.191 88.060
8 .397 2.206 90.266
9 .353 1.960 92.226
10 .320 1.777 94.003·
11 .263 1.461 95.464
12 .197 1.092 96.556
13 .171 .950 97.506
14 .144 .798 98.304
15 .117 .650 98.954
16 .084 .467 99.421
17 .070 .392 99.813·
18 .034 .187 100.000
Extraction Method: Pnnc1pal Component Analysis.
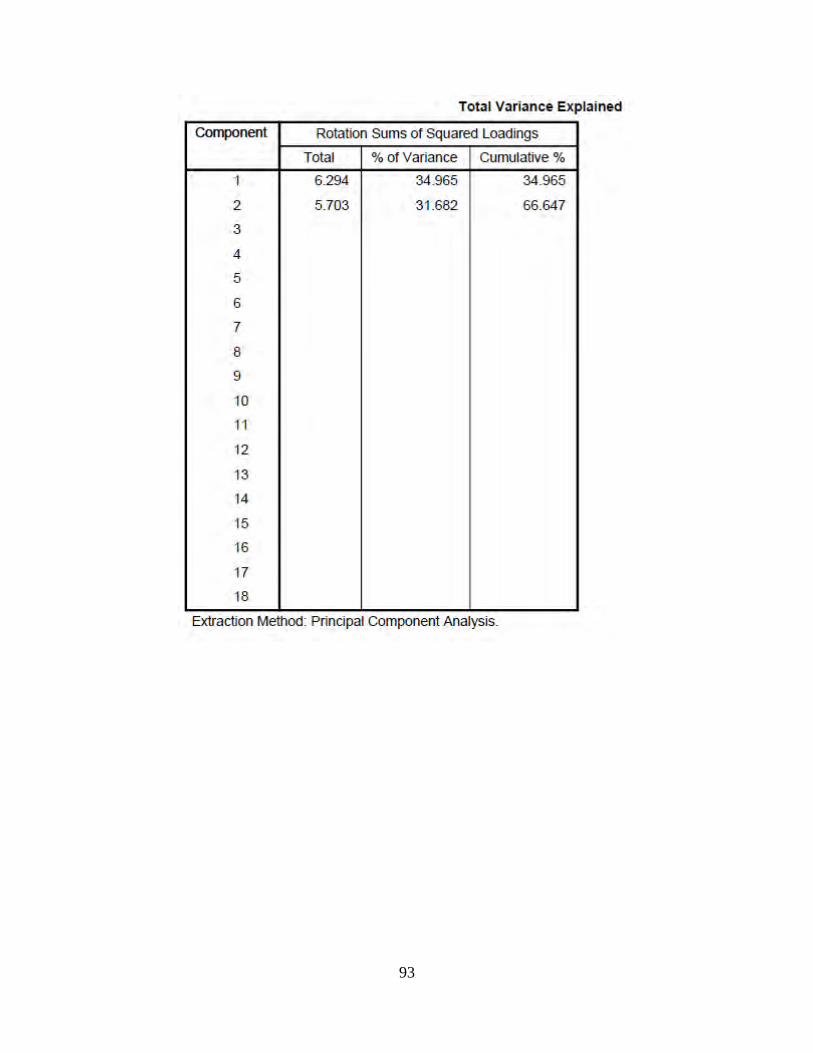
93
Total Variance Explained
COmponent Ro1ation Sums of Squared Loadings
Total % of Variance Cumulative %
1 6.294 34.965 34.965
2 5.703 31 .682 66.647
3
4
5
6
7
8
9
10
11
12
13
14
15
16
17
18
Extraction Method: Pnnc1pa1 Component Analysis.

94

95
Time 2

96
Anti-image Matrices
T2Q1 T2Q2 T2Q3 T2Q4 T2Q5 T2Q6
Anti-image Covariance T2Q1 .056 ·.054 ·.014 ·.021 .037 .006
T2Q2 ·.054 .079 .004 .015 · .050 ·.017
T2Q3 ·.014 .004 .OB7 ·.042 · .014 .005
T2Q4 ·.021 .015 ·.042 .071 · .034 ·.033
T2Q5 .037 ·.050 ·.014 ·.034 .094 .046
T2Q6 .006 ·.017 .005 ·.033 .046 .279
T2Q7 ·.03B .041 ·.001 .016 · .05B ·.090
T2QBr ·.003 ·.017 .01B .005 .005 ·.042
T2Q9r .009 .OOB ·.026 ·.006 .001 .04B
T2Q46 ·.022 .020 ·.016 .029 · .034 ·.04B
T2Q47 .002 ·.014 ·.015 -1.455E-5 .009 .015
T2Q4B ·.025 .034 .01B .004 · .031 ·.01B
T2Q49 ·.031 .034 .001 .01B · .004 .060
T2Q50 .034 ·.021 ·.01B ·.005 .024 .032
T2Q51 ·.014 .019 .031 ·.015 · .016 ·.019
T2Q52 .02B ·.034 ·.007 ·.OOB .01B .007
T2Q53 ·.007 .012 .040 ·.015 · .007 ·.045
T2Q54 .020 ·.027 ·.049 .004 .045 .055
Anti-image Correlation T2Q1 .73B" ·.BOB ·.202 ·.327 .503 .049
T2Q2 ·.BOB .7263
.053 .200 · .575 · 112
T2Q3 ·.202 .053 .B66° ·.535 · .15B .032
T2Q4 ·.327 .200 ·.535 .B67° · .40B ·.232
T2Q5 .503 ·.575 ·.15B ·.40B .7613
.2B6
T2Q6 .049 · 112 .032 ·.232 .2B6 .B19°
T2Q7 ·.484 .449 ·.OOB .1B5 · .5B2 ·.521
T2QBr ·.031 ·.157 .156 .049 .043 ·.206
T2Q9r .107 .OBO ·.260 ·.064 .005 .265
T2Q46 ·.1B3 .141 ·.106 .206 · .217 ·.176
T2Q47 .01B ·.09B ·.105 .000 .05B .055
T2Q4B ·.290 .329 .167 .036 · .275 ·.094
T2Q49 ·.233 .218 .004 .123 · .023 .203
T2Q50 .281 ·.142 ·.116 ·.039 .154 .116
T2Q51 ·.116 .132 .205 ·.10B · .102 ·.069
T2Q52 .30B ·.321 ·.062 ·.078 .157 .034
T2Q53 ·.05B .084 .271 ·.109 · .045 ·.169
T2Q54 .174 ·.205 ·.349 .032 .309 .219
a. Measures of Sampling Adequacy(MSA)

97
Anti-image Matrices
T207 T208r T209r T2046 T2047 T2048
Anti-image Covariance T201 · .038 · .003 .009 · .022 .002 · .025
T202 .041 · .017 .008 .020 · .014 .034
T203 · .001 .018 · .026 · .016 · .015 .018
T204 .016 .005 · .006 .029 -1.455E-5 .004
T205 · .058 .005 .001 · .034 .009 · .031
T206 · .090 · .042 .048 · .048 .015 · .018
T207 .107 .000 · .019 .045 .010 .030
T208r .000 .150 · .111 · .036 .01[)3 .002
T209r · .019 · .111 .116 .034 .001 · .019
T2046 .045 · .036 .034 .268 · .063 .003
T2047 .010 .003 .001 · .063 .248 · .087
T2048 .030 .002 · .019 .003 · .087 .136
T2049 · .011 · .032 .033 .037 · .036 · .035
T2050 · .052 .011 .000 · .184 .009 · .010
T2051 .009 .050 · .042 .024 · .023 .063
T2052 · .028 · .002 .015 · .027 .035 · .093
T2053 · .007 .009 · .020 .026 · .117 .080
T2054 · .009 · .045 .048 .000 .05 1 · .091
Anti-image Correlation T201 · .484 · .031 .107 · .183 .018 · .290
T202 .449 · .157 .080 .141 · .098 .329
T203 · .008 .156 · .260 · .106 · .105 .167
T204 .185 .049 · .064 .206 .000 .036
T205 · .582 .043 .005 · .217 .058 · .275
T206 · .521 · .206 .265 · .176 .055 · .094
T207 .762a .002 · .171 .268 .06 1 .247
T208r .002 .763" · .842 · .178 .017 .014
T209r · .171 · .842 .7603 .193 .007 · .149
T2046 .268 · .178 .193 .691a · .244 .017
T2047 .061 .017 .007 · .244 .825" · .474
T2048 .247 .014 · .149 .017 · .474 .662"
T2049 · .061 · .148 .172 .127 · .129 · .170
T2050 · .308 .053 · .003 · .688 .033 · .054
T2051 .052 .247 · .235 .089 · .087 .329
T2052 · .226 · .010 .118 · .138 .187 · .668
T2053 · .045 .048 · .117 .100 · .467 .434
T2054 · .056 · .246 .297 .002 .214 · .522
a. Measures of Samp11ng Adequacy(MSA)

98
Anti-image Matrices
T2049 T2050 T2051 T2052 T2053 T2054
Anti-image Covariance T201 · .031 .034 · .014 .028 · .007 .020
T202 .034 · .021 .019 · .034 .012 · .027
T203 .001 · .018 .031 · .007 .040 · .049
T204 .018 · .005 · .015 · .008 · .015 .004
T205 · .004 .024 · .016 .018 · .007 .045
T206 .060 .032 · .019 .007 · .045 .055
T207 · .011 · .052 .009 · .028 · .007 · .009
T208r · .032 .011 .050 · .002 .009 · .045
T209r .033 .000 · .042 .015 · .020 .048
T2046 .037 · .184 .024 · .027 .026 .000
T2047 · .036 .009 · .023 .035 · .117 .051
T2048 · .035 · .010 .063 · .093 .080 · .091
T2049 .313 · .060 · .031 · .029 · .059 .058
T2050 · .060 .266 · .072 .031 .002 · .003
T2051 · .031 · .072 .271 · .098 .035 · .123
T2052 · .029 .031 · .098 .144 · .075 .056
T2053 · .059 .002 .035 · .075 .251 · .128
T2054 .058 · .003 · .123 .056 - 128 .226
Anti-image Correlation T201 · .233 .281 · .116 .308 · .058 .174
T202 .218 - 142 .132 · .321 .084 · .205
T203 .004 · .116 .205 · .062 .271 · .349
T204 .123 · .039 · .108 · .078 · .109 .032
T205 · .023 .154 · .102 .157 · .045 .309
T206 .203 .116 · .069 .034 · .169 .219
T207 · .061 · .308 .052 · .226 · .045 · .056
T208r · .148 .053 .247 · .010 .048 · .246
T209r .172 · .003 · .235 .118 · .117 .297
T2046 .127 · .688 .089 · .138 .100 .002
T2047 · .129 .033 · .087 .187 · .467 .214
T2048 · .170 · .054 .329 · .668 .434 · .522
T2049 .8713
· .207 · .106 · .136 · .210 .219
T2050 · .207 .724° · .268 .158 .006 · .011
T2051 · .106 -268 .7423 · .494 .133 · .495
T2052 · .136 .158 · .494 .7153
· .395 .310
T2053 · .210 .006 .133 · .395 .7033
· .537
T2054 .219 · .011 · .495 .310 · .537 .6433
a. Measures of Sampling Adequacy(MSA)

99
Total Variance Explained
Component Initial Eigenvalues Extraction Sums of Squared Loadings
Total %of Variance Cumulative % Total % of Variance Cumulative %
1 7.119 39.549 39.549 7.119 39.549 39.549
2 5.174 28.745 68.294 5.174 28.745 68.294
3 1.128 6.264 74.558
4 .902 5.013 79.572
5 .715 3.974 83.546
6 .675 3.749 87.295
7 .519 2.886 90.181
8 .368 2.042 92.223
9 .303 1.681 93.904
10 .258 1.432 95.336
11 .221 1.228 96.564
12 .157 .874 97.438
13 .138 .769 98.207
14 .108 .598 98.804
15 .082 .458 99.263
16 .063 .352 99.615
17 .045 .251 99.866
18 .024 .134 100.000
Extraction Method: Pnnc1pal Component Analysis.

100
Total Variance Explained
component Rotation Sums of Squared loadings
Total % of Variance Cumulauve %
1 6.758 37.546 37.546
2 5.535 30.748 68.294
3
4
5
6
7
8
9
10
11
12
13
14
15
16
17
18
Extraction Method: Pnnc1pa1 Component Analysis.

101

102
Appendix F
Regression Analysis Results for Hypothesis 1
REGRESSI ON
/ MI SSI NG LI STWISE
/ STATI STICS COEFF OUTS R ANOVA
/ CRI TERIA= PIN ( . 0 5 ) POUT ( . lO)
/ NOORI GI N
/ DEPENDENT delta _ BMI
/ METHOD=ENTER delta_ a vg_ Mot .
Regression
Var iables Entered/Removel
Model Variables Variables Entered Removed
1 delta avg a- -Mot
a. All requested vanables entered.
b. Dependent Variable: delta_BMI
Model Summary
Method
Enter
Model Adjusted R Std. Error of R R Square Square the Estimate
1 .376" .141 .127 1.36355
a. Predictors: (Constant), delta_avg_Mot
Model Sum of Squares df Mean Square
1 Regression 18.655 1 18 .655
Residual 113.416 61 1.859
Total 132.071 62
a. Predictors: (Constant), delta_avg_Mot
b. Dependent Variable: delta_BMI
Coefficients a
Model Standardized unstandardized Coefficients Coefficients
B std. Error Beta
1 (Constant) -1.480 .209
delta_avg_Mot · .724 .228 -.376
a. Dependent Variable: delta_BMI
F Sig.
10.033 .002
t Sig.
·7.088 .000
·3 .168 .002
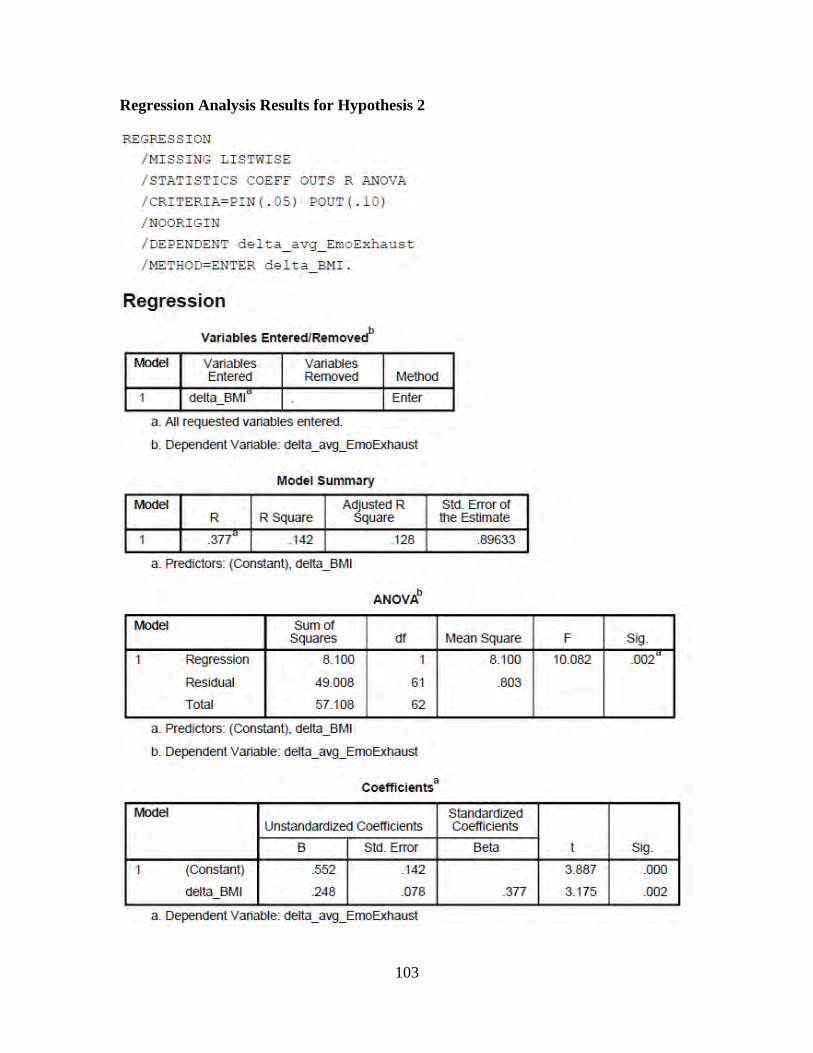
103
Regression Analysis Results for Hypothesis 2
REGRESSI ON
/ MI SSI NG LISTWISE
/ STATI STI CS COEFF OUTS R ANOVA
/ CRITERI A= PIN ( . OS) POUT ( . lO)
/ NOORI GI N
/ DEPENDENT delta _avg_ EmoExha u s t
/ METHOD=ENTER delta BMI .
Regression
Variables Entered/Removedb
Model Variables Variables Entered Removed Method
1 delta_BMI Enter
a. All requested variables entered.
b. Dependent Variable: delta_avg_EmoExhaust
Model Summary
Model Adjusted R R R Square Square
1 .377" .142 .128
a. Predictors: (Constant), delta_BMI
Model Sum of Squares df
1 Regression 8.100 1
Residual 49008 61
Total 57.108 62
a. Predictors: (Constant), delta_BMI
b. Dependent Variable: delta_avg_EmoExhaust
Coefficients 3
Model unstandardized Coefficients
B Std. Error
1 (Constant) .552 .142
delta_BMI .248 .078
a. Dependent Vanable: delta_avg_EmoExhaust
Sid. Error of the Estimate
.89633
Mean Square F Sig.
8.100 10.082 .002
.803
Standardized Coefficients
Beta t Sig.
3.887 .000
.377 3.175 .002

104
Regression Analysis Results for Hypothesis 3
REGRESS I ON
/ MI SS I NG LISTWISE
/ STATI STI CS COEFF OUTS R ANOVA
/ CRITERIA= PIN ( . 0 5 ) POUT ( . 10 )
/ NOORI GI N
/ DEPENDENT delta _avg_ EmoExha u s t
/ METHOD=ENTER delta_ a vg_ Mot .
Regression
Variables Entered/Removed'
Model Variables Variables Entered Removed Method
1 delta avg Enter Mot" - -
a. All requested variables entered.
b. Dependent Variable: delta_avg_EmoExhaust
Model Summary
Model Adjusted R Std. Error of R R Square Square the Estimate
1 .186" .035 .019 .95062
a. Predictors: (Constant), delta_avg_Mot
Model Sum of Squares df Mean Square
1 Regression 1.984 1 1.984
Residual 55.124 61 .904
Total 57.108 62
a. Predictors: (Constant), delta_avg_Mot
b. Dependent Variable: delta_avg_EmoExhaust
Coefficients 3
Model Standardized unstandardized Coefficients Coefficients
B std. Error Beta
1 (Constant) .156 .146
delta_avg_Mot · .236 .159 -.186
a. Dependent Variable: delta_avg_EmoExhaust
F Sig.
2.195 .144"
t Sig.
1.073 .287
-1.482 .144

105
Regression Analysis Results for Hypothesis 4
REGRESSION
/ MI SSING LI ST!VI SE / STAT I STICS COEFF OUTS R ANOVA
/ CRITERIA=PI N( . 05 ) POUT ( . lO )
/ NOORIGI N
/DE~ENDENT d elta _ a vg_ Emo Exha us t / METHOD=ENTER d e l t a _ av g_Mot d e lta BMI .
Regrression
Variables Entered/Removedb
Model Variables Variables Entered Removed Method
1 delta_BMI, Enter delta avg .- -Mot
a. All requested variables entered.
b. Dependent Variable: delta_avg_EmoExhaust
Model Summary
Model Adjusted R Std. Error of R R Square Square the Estimate
1 .380" .144 .116
a. Predictors: (Constant), delta_BMI, delta_avg_Mot
ANOVAb
Model Sum of
.90254
Squares df Mean Square
1 Regression 8.234 2 4.117
Residual 48.874 60 .815
Total 57.108 62
a. Predictors: (Constant), delta_BMI, delta_avg_Mot
b. Dependent Variable: delta_avg_EmoExhaust
Coeffi cients •
Model Standardized unstandard ized Coefficients Coefficients
B std. Error Beta
1 (Constant) .504 .187
delta_avg_Mot -.066 .163 -.052
delta_BMI .235 .085 .357
a. Dependent Variable: delta_avg_EmoExhaust
F Sig.
5.054 .009"
t Sig.
2.699 .009
-.405 .687
2.770 .007

106
Regression Analysis Results for Hypothesis 5
REGRESS I ON
/ MI SS I NG LISTWliSE
/ STATI STI CS COEFF OUTS R ANOVA
/ CRI TERIA= PIN ( . 0 5 ) POUT ( . lO)
/ NOORI GI N
/ DEPENDENT ME DSMI SC
/ METHOD=ENTER Emo Exhau s t .
Regression
Variables Entered/Removed'
Model Variables Variables Entered Removed Method
1 EmoExhaust • Enter
a. All requested variables entered.
b. Dependent Variabl:e: MEDS-MISC
Model Summary
Model Adjusted R R R Square Square
1 .256" .066 .057
a. Predictors: (Constant), EmoExhaust
Model Sum of Squares df
1 Regression .945 1
Residual 13.475 110
Total 14.420 111
a. Predictors: (Constant), EmoExhaust
b. Dependent Variabl:e: MEDS-MISC
Std. Error of the Estimate
.350
Mean Square
.945
.122
Coefficients •
Model Standardized Unstandardized Coefficients Coefficients
B Std. Error Beta
1 (Constant) · .041 .077
EmoExhaust .072 .026 .256
a. Dependent Variabl:e: MEDS-MISC
F Sig.
7.713 .006"
t Sig.
· .532 .596
2.777 .006

107
Regression Analysis Results for Hypothesis 6
REGRESS I ON
/ MI SS I NG LISTWISE
/ STATI STI CS COEFF OU'TS R ANOVA
/ CRITERIA= PIN( . OS) POUT ( . lO)
/ NOORI GI N
/ DEPENDENT de l ta_ Lab_ LDL
/ METHOD=ENTER de l ta_ ,avg_ EmoExhaus t .
Regression
Variables Entered/Removel
Model Variables Variables Entered Removed Method
1 delta_avg_ a Enter EmoExhaust
a, All requested vanables entered,
b, Dependent Variable: delta_Lab_LDL
Model Summary
Model Adjusted R Std, Error of R R Square Square the Estimate
1 .289" .083 .066 18.10153
a. Predictors: (Constant), delta_avg_EmoExhaust
Model Sum of Squares df Mean Square
1 Regression 1550.308 1 1550.308
Residual 17038.594 52 327.665
Total 18588.901 53
a. Predictors: (Constant), delta_avg_EmoExhaust
b. Dependent Variable: delta_Lab_LDL
Coetfieients •
F
4.731
Model Standardized Unstandardized Coefficients Coefficients
B std. Error Beta
1 (Constant) 2.982 2.576
delta_avg_EmoExhaust 5.721 2.630 .289
a. Dependent Variable: delta_Lab_LDL
Sig.
.034
t Sig.
1158 .252
2.175 .034

108
REPORT DOCUMENTATION PAGE Form Approved OMB No. 074-0188
The public reporting burden for this collection of information is estimated to average 1 hour per response, including the time for reviewing instructions, searching existing data sources, gathering and maintaining the data needed, and completing and reviewing the collection of information. Send comments regarding this burden estimate or any other aspect of the collection of information, including suggestions for reducing this burden to Department of Defense, Washington Headquarters Services, Directorate for Information Operations and Reports (0704-0188), 1215 Jefferson Davis Highway, Suite 1204, Arlington, VA 22202-4302. Respondents should be aware that notwithstanding any other provision of law, no person shall be subject to anypenalty for failing to comply with a collection of information if it does not display a currently valid OMB control number. PLEASE DO NOT RETURN YOUR FORM TO THE ABOVE ADDRESS. 1. REPORT DATE (DD-MM-YYYY)
22-03-2012 2. REPORT TYPE
Master’s Thesis 3. DATES COVERED (From – To)
Oct 2010 – Mar 2012 4. TITLE AND SUBTITLE
A Proposed Mediation Model of the Effects of Motivation for a Healthy Lifestyle: Impacts on Emotional Exhaustion, Medication Regimens, and Low-Density Lipoprotein
5a. CONTRACT NUMBER
5b. GRANT NUMBER
5c. PROGRAM ELEMENT NUMBER
6. AUTHOR(S)
Leuthold, Nathan M., Captain, USAF
5d. PROJECT NUMBER
N/A5e. TASK NUMBER
5f. WORK UNIT NUMBER
7. PERFORMING ORGANIZATION NAMES(S) AND ADDRESS(S)
Air Force Institute of Technology Graduate School of Engineering and Management (AFIT/EN) 2950 Hobson Way, Building 640 WPAFB OH 45433-7765
8. PERFORMING ORGANIZATION REPORT NUMBER
AFIT/GEM/ENV/12-M12
9. SPONSORING/MONITORING AGENCY NAME(S) AND ADDRESS(ES)
Intentionally Left Blank
10. SPONSOR/MONITOR’S ACRONYM(S)
11. SPONSOR/MONITOR’S REPORT NUMBER(S)
12. DISTRIBUTION/AVAILABILITY STATEMENT
Distribution Statement A. Approved for Public Release; Distribution Unlimited
13. SUPPLEMENTARY NOTES
14. ABSTRACT
This research addressed the question of, “How are behavioral indicators related to physiological responses?” There were three theories (Conservation of Resources; Planned Behavior; and Achievement Motivation) employed to build a proposed model of the effects that an individual’s motivation for a healthy lifestyle will have on their emotional exhaustion, daily medication usage, and low-density lipoprotein. Motivation for a healthy lifestyle was hypothesized to have a negative relationship with emotional exhaustion, while utilizing body mass index as a partial mediator. Emotional exhaustion was hypothesized to have positive relationships with daily medication usage and low-density lipoprotein. The model was tested using linear regression modeling and an archival dataset that contained a behavioral survey, anthropometric measurements, and blood samples. All the relationships except those between motivation for a healthy lifestyle and emotional exhaustion, and the partial mediation were supported. An alternate explanation for the lack of support for two of the hypotheses is included. This research is unique, in that it incorporates behavioral constructs and physical outcomes, a combination that has been identified as underutilized in the realms of organizational and behavioral research. 15. SUBJECT TERMS
Motivation,, Emotional Exhaustion, Healthy Lifestyle, Low-density Lipoprotein, Conservation of Resources
16. SECURITY CLASSIFICATION OF: 17. LIMITATION OF ABSTRACT
UU
18. NUMBER OF PAGES
118
19a. NAME OF RESPONSIBLE PERSON
Lt Col John J. Elshaw, AFIT/ENV a. REPORT
U
b. ABSTRACT
U
c. THIS PAGE
U 19b. TELEPHONE NUMBER (Include area code) (937) 255-3636, x4574
Standard Form 298 (Rev. 8-98) Prescribed by ANSI Std. Z39-18

![[PPT]PowerPoint Presentation - US Tax Disputes · Web viewNOTE: Although the proposed Rule 124 providing for mediation is not yet adopted, the Tax Court has long allowed for mediation](https://img.pdfslide.us/doc/110x75/5ac361117f8b9ae06c8c1633/pptpowerpoint-presentation-us-tax-viewnote-although-the-proposed-rule-124-providing.jpg)