Embed Size (px)
Citation preview

A Proposed Lead Corrosion Control Plan: A Review of Potential Health Impacts from the addition of phosphate
Chemical Inhibitors in the Drinking Water Treatment Process
Prepared by Marie McKeary, Research Consultant
[email protected] McMaster Institute for Healthier Environments (MIHE)
On behalf of Jim Dunn, Director
[email protected] McMaster Institute for Healthier Environments (MIHE)
Prepared for
Eric Mathews and Dave King Safe Water Program
Hamilton Public Health Services
2015

A Proposed Lead Corrosion Control Plan: A Review of Potential Health Impacts from the addition of phosphate Chemical Inhibitors in the Drinking Water Treatment Process, Marie McKeary, Researcher, McMaster Institute for Healthier Environments, McMaster University for Hamilton Public Health Services, 2015
Pag
e- 2
-
EXECUTIVE SUMMARY .......................................................................................................... 7
SECTION ONE - BACKGROUND/INTRODUCTION ........................................................... 9
1.1 Drinking Water Legislation – Ontario ................................................................................. 9
1.2 City of Hamilton Lead Test Results in Drinking Water .................................................... 9
1.3 Past Initiatives and Intervention Strategies for Lead Reduction .................................... 10
1.4 Mitigation Strategy: Chemical Inhibitor and Health Assessment .................................. 11
SECTION TWO - LEAD “Defining the Issue” ........................................................................ 12
2.1 Lead Sources in Municipal Drinking Water ..................................................................... 12
2.2 Global Extent of the Lead Problem in Drinking Water ................................................... 13
2.3 Lead Content Variables - P l u mbo so lv en cy . . . . . . . . . . . . . . . . . . . . . . . . . . . . . . . . . . . . . . . . . . 1 3
2.4 How Scale is formed............................................................................................................. 14
2.5 Legislation for Lead in Drinking Water –Compliance ..................................................... 15
2.6 Legislation – International .................................................................................................. 15
2.7 Legislation – USA ................................................................................................................. 15
2.8 Legislation – Canada ........................................................................................................... 16
2.9 Canada – Ontario ................................................................................................................. 16
2.10 Background: Health Impact of Lead in Drinking Water .............................................. 17
A Proposed Lead Corrosion Control Plan: A Review of Potential Health Impacts from the addition of phosphate Chemical Inhibitors in the Drinking Water Treatment Process, Marie McKeary, Researcher, McMaster Institute for Healthier Environments, McMaster University for Hamilton Public Health Services, 2015
Pag
e- 3
-
SECTION THREE - CORROSION CONTROL “Response to the Issue” ........................... 22
3.1 Corrosion Control Measures .............................................................................................. 22
3.2 Corrosion Control: Impact of Time on Lead Corrosion the ‘Do nothing’ approach .... 22
3.3 Corrosion Control: Infrastructure Solutions - Lead Pipe Reduction/Replacement
Program (LPR)............................................................................................................................ 23
o 3.3.1 Efficacy of LPR
o 3.3.2 Efficacy LPR – UK
o 3.3.3 Efficacy LPR - USA
o 3.3.4. Efficacy LPR –Canada (Ontario)
o 3.3.5 City of Toronto
Corrosion Control for Lead – Chemical and Process Solutions ............................................ 25
o 3.4.1 pH
o 3.4.2 Alkalinity and Dissolved Inorganic Carbonate (DIC)
o 3.4.3 Optimizing pH and Alkalinity Adjustment
3.5 Supplementary Critical Variables with regards to Corrosion Control .......................... 27
o 3.5.1 Natural Colour and Organic Matter (NOM)
o 3.5.2 Temperature
o 3.5.3 Microbiological

A Proposed Lead Corrosion Control Plan: A Review of Potential Health Impacts from the addition of phosphate Chemical Inhibitors in the Drinking Water Treatment Process, Marie McKeary, Researcher, McMaster Institute for Healthier Environments, McMaster University for Hamilton Public Health Services, 2015
Pag
e- 4
-
SECTION FOUR – Corrosion Control with the application of the Chemical Inhibitor
‘Phosphorous’ .............................................................................................................................. 28
4.1 Background Primer on Phosphorous……………………………………………………..28
4.2 Phosphorus and Water…………………………………………………………………….28
4.3 Environmental Impact -Freshwater system impacts…………………………………….28
4.4 Environmental Legislative Criteria for Phosphorous in Water………………………...29
o 4.4.1 Environmental Health Impact: UK Perspective
o 4.4.2 Environmental Health Impact: USA Perspective
o 4.4.3 Environmental Health Impact: Canadian Perspective
4.5 Phosphorous as a Scarce Commodity …………………………………………………...30
o 4.5.1. Natural
o 4.5.2 Commercial
4.6 Commercial Application of Phosphates for Corrosion Control in Drinking Water…31
o 4.6.1. Pipe Loop Testing
o 4.6.2. Categories of Phosphate Inhibitors
SECTION FIVE - ORTHOPHOSPHATE .............................................................................. 32
5.1 Orthophosphate Introduction ............................................................................................. 32
5.2 Orthophosphate – Cuprosolvency - Copper vs Lead Corrosion ..................................... 34
5.3 Secondary Environmental Impacts of Phosphate and Silicate Inhibitors ...................... 35
5.4 Optimisation of Orthophosphate – Critical Role of Sampling ........................................ 36
o 5.4.1 Samples after flushing

A Proposed Lead Corrosion Control Plan: A Review of Potential Health Impacts from the addition of phosphate Chemical Inhibitors in the Drinking Water Treatment Process, Marie McKeary, Researcher, McMaster Institute for Healthier Environments, McMaster University for Hamilton Public Health Services, 2015
Pag
e- 5
-
o 5.4.2. Samples after over-night standing
o 5.4.3. Samples after 30 minutes standing
o 5.4.4. Random daytime(RDT) samples
o 5.4.5. Sequential sampling after standing
o 5.4.6. Split-flow composite sampling
5.5 Efficacy of Orthophosphate – Europe................................................................................ 38
5.6 Efficacy of Orthophosphate – UK ...................................................................................... 39
o 5.6.1 Impact of NOM-UK
5.7 Efficacy of Orthophosphate - USA .................................................................................... 40
5.8 Orthophosphate Summary .................................................................................................. 40
5.9 Health Impact of Phosphorous ........................................................................................... 41
o 5.9.1 Dietary Phosphorous and Chronic Kidney Disease
o 5.9.2 Food Labelling and Consumer Awareness
SECTION SIX: ENVIRONMENTAL SCAN OF CORROSION CONTROL
MITIGATION STRATEGIES FOR LEAD IN DRINKING WATER ................................. 43
6.1 Ontario Municipalities Drinking Water Systems – Corrosion Control Plans (CCP) ... 44
6.2 North American Municipalities Mitigation Strategies for Lead in Drinking Water..... 44
o 6.2.1 Canada
o 6.2.2 U.S.A.
SECTION SEVEN: CONCLUSION ......................................................................................... 52

A Proposed Lead Corrosion Control Plan: A Review of Potential Health Impacts from the addition of phosphate Chemical Inhibitors in the Drinking Water Treatment Process, Marie McKeary, Researcher, McMaster Institute for Healthier Environments, McMaster University for Hamilton Public Health Services, 2015
Pag
e- 6
-
APPENDICES ............................................................................................................................. 54
o Appendix A – Phosphorous Daily Dietary Recommendations
o Appendix B –Table of Ontario municipalities Corrosion Control Plans
BIBLIOGRAPHY ....................................................................................................................... 60
ANNOTATED BIBLIOGRAPHY OF KEY REFERENCES ................................................ 73
ADDITIONAL REFERENCES ................................................................................................. 83

A Proposed Lead Corrosion Control Plan: A Review of Potential Health Impacts from the addition of phosphate Chemical Inhibitors in the Drinking Water Treatment Process, Marie McKeary, Researcher, McMaster Institute for Healthier Environments, McMaster University for Hamilton Public Health Services, 2015
Pag
e- 7
-
EXECUTIVE SUMMARY
The following paper is a literature review and evaluation of the potential health risks and benefits
of current mitigation strategies for lead in drinking water, specifically the addition of a phosphate
based chemical inhibitor introduced into the drinking water distribution system for the purpose
of corrosion control. The author would suggest that the efficacy of the chosen corrosion control
strategy is the most critical question in terms of both human and environmental health. The
mandate of the Health Protection Division of Hamilton Public Health Services (HPHS) is to
protect the health of the public and enhance their quality of life by assessing, correcting,
controlling, and preventing those factors in the environment that can adversely affect both the
health of the public and the environment. Lead is a potent, neurotoxic metal that accumulates in
both soft tissue and bones. Over time evidence has mounted within the scientific literature of the
contribution of drinking water to our overall lead exposure burden. Both nationally and
internationally there is increasing consensus there are no ‘safe’ levels of exposure to lead and
some have advocated for a zero tolerance position to be enacted.
Any health/risk assessment arising from the addition of phosphates into the drinking water
system must be multifaceted. The critical factor is the known health risk of lead and thus any
mitigation strategy which has proven efficacy in reducing lead levels must be considered. If a
chosen lead mitigation strategy (i.e. a chemical inhibitor) is rendered ineffective, for example,
due to inappropriate choice of product or lack of monitoring and evaluation then not only is the
public still at risk from lead but other more efficacious strategies may have been overlooked
ultimately, causing more harm than good. Evidence reveals a number of common mitigation
practices have a range of impact and some can even have an adverse effect on health, for
example by increasing lead levels. The most critical variable in choosing an appropriate and thus
efficacious Corrosion Control strategy for lead reduction in drinking water is in-depth knowledge
of the water profile of any particular system.
Locally, Hamilton Water (HW) has responsibility for City of Hamilton municipal water under
the Drinking Water Quality Management System (DWQMS), a legislated set of policies and
procedures which ensure the consistent delivery of clean, safe drinking water to the citizens of
Hamilton (http://www.ontario.ca/page/municipal-drinking-water-systems-licencing-registration-and-
permits). Hamilton Water approached Hamilton Public Health Services (HPHS) with a request to
assess the lead reduction efforts being proposed as part of their Corrosion Control Plan in terms
of potential human and environmental health impact and safety considerations. HPHS conducts
all reviews from within an equity paradigm, including a request for assistance from the research
consultant at the McMaster Institute for Healthier Environments (MIHE). HPHS is operationally
guided by the Ontario Public Health Standards.
The first section (1) of the paper introduces the major issues with regards to lead in drinking
water, in particular the specific lead levels and sources found in the City of Hamilton drinking
water. In Ontario, the Ministry of the Environment and Climate Change (MOECC) directs
drinking water system operators to develop and implement a Corrosion Control Plan (CCP)
whenever lead is found to be above 0.010 mg/L (or 10 μg/dL) in more than 10% of samples
taken, at the point of consumption. This section will clarify the roles and responsibilities of both

A Proposed Lead Corrosion Control Plan: A Review of Potential Health Impacts from the addition of phosphate Chemical Inhibitors in the Drinking Water Treatment Process, Marie McKeary, Researcher, McMaster Institute for Healthier Environments, McMaster University for Hamilton Public Health Services, 2015
Pag
e- 8
-
Hamilton Water (HW) and Hamilton Public Health Services (HPHS) with respect to lead in
drinking water, as well as, outlining potential areas of intersection.
Section two (2) offers an overview of the major health and environmental concerns with respect
to lead in drinking water. It illustrates the global scope of the problem, defines plumbosolvency
for the reader, and summarizes the national and international legislative response focused on
controlling lead levels.
Section three (3) investigates the ‘response to the issue’ by outlining common
practices/mitigation strategies to decrease lead levels in water and evaluates their efficacy in
achieving this goal. Critical variables which have an impact on the corrosion control strategy are
also identified, for example, temperature and organic matter. At the time of writing this report
the specific chemical product Hamilton Water has proposed as an inhibitor was not available to
the author, however, the most common family of chemical products utilized elsewhere are
phosphorous based.
Thus, section four (4) offers the reader a background primer on phosphorous in both its natural
and commercial form. Phosphorous not only has a potential health impact, both positive and
negative, for humans but also for their environment. Findings reviewed are both national and
international. The major environmental concern is eutrophication and a subsequent proliferation
of Cyanobacteria (blue-green algae) which is currently a recurring issue in Hamilton recreational
waters and one that can affect the health of humans and animals that may come in physical
contact with the blooms.
According to the literature, the most common, and the most efficacious (if utilized appropriately)
phosphate product for corrosion control of lead is orthophosphate, thus section five (5) focuses
on its application and the critical role of monitoring via sampling. The scope of the literature
review encompasses both national and international experiences with orthophosphate. The UK
has the longest and most successful orthophosphate corrosion control program.
Any potential adverse human health effects from phosphates were found within the nephrology
literature and referred to ingestion of phosphates through food/diet. No studies were found
which discussed adverse effects specifically from chemical inhibitors added to drinking water.
There are two broad categories of phosphates found in food, natural and commercial. In its
natural form phosphorous is a mineral that is part of every cell in our bodies but found mainly in
our bones and teeth. It works in conjunction with calcium and other nutrients to build healthy
bones and teeth. Phosphorus also helps maintain normal acid/base balance, supports growth, and
is involved with the storage and use of energy. On the one hand, there are a number of
authoritative bodies who have developed Recommended Daily Allowances (RDAs) for
phosphorous in our diets (see Appendix A) but for those with Chronic Kidney Disease (CKD)
their dietary intake from food must be severely restricted.
The final section six (6) of the paper summarizes the results of an environmental scan conducted
of selected North American municipalities to review their chosen corrosion control strategies and
the rationale behind the selection. It is also a summary of any evaluation conducted and any
recorded levels of success leading to a decrease in lead levels in drinking water. The section

A Proposed Lead Corrosion Control Plan: A Review of Potential Health Impacts from the addition of phosphate Chemical Inhibitors in the Drinking Water Treatment Process, Marie McKeary, Researcher, McMaster Institute for Healthier Environments, McMaster University for Hamilton Public Health Services, 2015
Pag
e- 9
-
allows for lessons learned but also contextualizes the Hamilton situation. In the USA,
municipalities surrounding the Great Lakes were chosen since there may be shared source water.
In Canada, specifically Ontario, a few key municipalities were chosen to represent a range of
strategies chosen and illustrate the role of the water profile in dictating those choices. Overall,
there are 20 communities in Ontario mandated by the MOECC to develop and implement a
Corrosion Control Plan (CCP) for lead reduction (see Appendix B).
Section One – Background/Introduction
1.1 Drinking Water Legislation – Ontario
The Ontario Drinking Water Quality Standards (ODWQS) O.Reg.169/03 under the Safe
Water Drinking Act (SDWA) for lead is 0.010 mg/L (or 10 μg/dL) and applies at the point of
consumption. The operational guideline identified in the ODWQS for pH is a range between 6.5
and 8.5 (MOE, 2009). When Lead Sampling is conducted by municipalities the process
guidelines are outlined under Ontario Reg. 170/03 for testing at the consumer tap level and
Ontario Reg. 243/03 for higher risk settings such as Schools, Private Schools and Day Nurseries.
The Ministry of the Environment and Climate Change (MOECC), under the Community Lead
Testing Program, introduced sampling and testing for lead in drinking water distribution systems
in 2007 (Reg.170/03). At that time, all Ontario municipalities participated in the lead sampling
program.
1.2 City of Hamilton Lead Test Results in Drinking Water
Public Health Units in Ontario focus on three primary areas: preventing conditions that may put
health at risk (health protection), early detection of health problems (screening), and changing
peoples and societies attitudes and practices regarding lifestyle choices (health promotion)
(MOHLTC, 2002). Public Health Units, through local Boards of Health advise on legislation,
policy and standards. Locally Hamilton Water (HW) has jurisdiction over the distribution of the
municipal water supply under the Safe Drinking Water Act (SDWA) and the Drinking Water
Quality Management System (DWQMS), a set of legislated policies and procedures administered
by the Ontario Ministry of Environment and Climate Change (MOECC) which must ensure the
consistent delivery of clean, safe drinking water within the Hamilton community.
In 2007, Hamilton Water drinking water test results revealed more than 10% of representative
residential samples were higher than the provincial Maximum Allowable Concentration (MAC)
for lead in drinking water (BOH07049(a)/PW08036, 2008). As discussed, under provincial
legislation, the City of Hamilton, specifically Hamilton Water (HW) was mandated to respond to
these findings by developing a Corrosion Control Plan (CCP). According to the MOECC, the
goal of the CCP must be to strategically reduce the lead concentration levels in the
municipalities’ drinking water which would ultimately, protect Hamilton citizens from the
potential health impacts of a known toxic metal.

A Proposed Lead Corrosion Control Plan: A Review of Potential Health Impacts from the addition of phosphate Chemical Inhibitors in the Drinking Water Treatment Process, Marie McKeary, Researcher, McMaster Institute for Healthier Environments, McMaster University for Hamilton Public Health Services, 2015
Pag
e- 1
0 -
At that time, Hamilton Water (HW) reported the City of Hamilton had a total of 25,000 to 30,000
lead water service pipes, mostly found in homes built prior to the mid 1950’s. These lead water
pipes connect older homes and buildings to the municipal water distribution system hence
ownership is shared privately with the homeowner and publicly by the City of Hamilton.
Research has shown that lead service pipes and connections are the most likely source of
elevated lead concentration in drinking water. According to Hamilton Water, lead was found in
26.6% of the tap water samples collected by them (786 homes were tested between May 1, 2007
and February 8, 2008). The Ministry of the Environment (MOE) suggested flushing as an
intervention with the goal of removing overnight lead accumulation in pipes
(BOH07049(a)/PW08036, 2008). HPHS, specifically Health Protection Division conducted a
pilot tap water survey to assess the efficacy of flushing with respect to decreasing lead levels.
Although, HPHS supported flushing as a mitigation strategy based on their survey findings they
added a caution that flushing needed to be a constant and consistent practice and in terms of
efficacy the action did not always decrease lead levels to below the MAC
(BOH07049(a)/PW08036, 2008).
1.3 Past Initiatives and Intervention Strategies for Lead Reduction
HPHS and Hamilton Water have since collaborated on a number of initiatives to address lead
concerns, with HPHS viewing the issue from a public health perspective. The role of HPHS has
been to review the efforts proposed by Hamilton Water in terms of potential human and
environmental health impact and safety considerations. HPHS reviews and assesses any chosen
mitigation strategies from within an equity paradigm and assists where directed according to
public health standards. Some of the past activities undertaken by HPHS include education and
outreach campaigns including offering PHI support to the public in terms of information. HPHS
has reiterated and re-emphasized public health advisories on the dangers of lead in drinking
water. Both organizations have been active partners in the distribution of water filters (a practice
which continues to the present day). HPHS also focused on raising awareness of the City of
Hamilton Replacement Loan Program (LWSRLP) which assists homeowners with replacement
of water pipes on their private property line. Hamilton Water data revealed that at the current rate
of replacement (400-500 service lines annually) it could take approximately 50 years to remove
all public lead service connections (BOH07049(a)/PW08036, 2008).
In the Fall of 2007, HPHS organized the distribution of inserts to be enclosed with water bill
accounts which outlined the LWSRL program and the availability of a filter subsidy through
Community Services. In addition, seventy-three thousand (73,000) Public Health Advisories
were distributed to the families of elementary school children, daycare attendees, Early Years
Centres attendees, all new and expecting parents, and local physicians, Municipal Service
Centres, Community Centres, and Councillors Offices. Hamilton Water and Public Health
Services also created and maintained websites and received Customer Contact service inquiries
(Personal Consultation HPHS, 2015). In summary, communication on the issues, risks, and
precautions related to lead in drinking water was comprehensively delivered to both the general
public as well as targeted local high risk groups (BOH 07049(a)/PW 08036).

A Proposed Lead Corrosion Control Plan: A Review of Potential Health Impacts from the addition of phosphate Chemical Inhibitors in the Drinking Water Treatment Process, Marie McKeary, Researcher, McMaster Institute for Healthier Environments, McMaster University for Hamilton Public Health Services, 2015
Pag
e- 1
1 -
1.4 Mitigation Strategy: Chemical Inhibitor and Health Assessment
Both organizations are aware of the need for ongoing diligence to reduce lead levels in municipal
water while complying with Ministry directions and protecting the health of affected residents
(BOH 07049(a)/PW 08036). The most recent research has shown lead is even more toxic to
human health than originally suspected, in fact Toronto Public Health has advocated to the
province, for a zero tolerance level to be enacted. Lead exceedances have also been found in
newer home builds and thus the issue may be even more widespread than originally estimated
(Cantor, 2000). Thus, from a public health equity perspective there are potential health
consequences for all members of the general public from lead and it is within the mandate of
public health to address those concerns. In summary, many of the local efforts outlined and
others, to be discussed in the paper, have become standard mitigation practices in Corrosion
Control programs to reduce lead in drinking water and are well documented within the literature.
The collaboration between Hamilton Water and Hamilton Public Health Services with regards to
lead levels in Drinking Water is a relationship mirrored in other jurisdictions, for example, the
Toronto Medical Officer of Health (MOH) after reviewing the latest data on the toxicity of lead
in drinking water combined with current mitigation strategies being employed by Toronto Water
for corrosion control chose to endorse the adoption of chemical inhibitors, specifically
orthophosphate to the drinking water (Richmond Hill Committee of the Whole, 2014).
According to Hamilton Public Health Services (HPHS), Hamilton Water (in 2014) chose to
investigate the possibility of extending their lead remediation program to include the addition of
chemical inhibitors to expedite the process of corrosion control throughout the water distribution
system. The author understands that Hamilton Water approached (HPHS), specifically the Water
Safety Program to request their expertise and assistance in terms of assessing any potential health
impacts from the extension of their program efforts. HPHS, as an evidence based organization,
fulfilled their due diligence and responded to the request by the following actions: 1) PHS staff
were invited to attend information meetings hosted by Hamilton Water and their contracted
consultants and reviewed any documents shared; 2) consultation took place within HPHS with
their own medical and public health experts; 3) and finally, staff approached the McMaster
Institute for Healthier Environments (MIHE) at McMaster University and relying on a long
standing consultancy relationship, requested an international literature review of Corrosion
Control for lead in drinking water in particular, the addition of chemical inhibitors and any
potential health concerns. The following paper is the completion of that request, authored by the
research consultant from MIHE who is the primary liaison to the Health Protection Division of
HPHS. Hamilton Water did not consult with MIHE during the development of their Corrosion
Control Plan.

A Proposed Lead Corrosion Control Plan: A Review of Potential Health Impacts from the addition of phosphate Chemical Inhibitors in the Drinking Water Treatment Process, Marie McKeary, Researcher, McMaster Institute for Healthier Environments, McMaster University for Hamilton Public Health Services, 2015
Pag
e- 1
2 -
Section Two – Lead “Defining the Issue”
The following section begins by defining the issue(s) through an identification of the most
common sources of lead found in municipal drinking water; measuring the global extent of the
problem; reviewing plumbosolvency and the process of scale formation; comparing legislated
actions intended to control the problem and to prompt action nationally and internationally, and
finally, an updated review of the known short and long term health consequences for individuals
from the toxicity of lead exposure.
2.1 Lead Sources in Municipal Drinking Water
For the most part, the amount of lead in natural water sources in Canada is very low; however,
lead can be leached into the drinking water supply from a number of sources. The most common
source of lead concentrate found in drinking water is endemic to the delivery infrastructure
where it is dislodged or dissolved from pipes, fittings, fixtures and lead service lines connecting
the private residence to the public water supply network (Walker & Oliphant 1982; Health
Canada HC, 2009). It is also found in fittings and fixtures leached from PVC pipes with lead
stabilisers (Packham, 1971), from sub-quality brasses or released from galvanic corrosion
involving lead-soldered joints (Walker & Oliphant 1982; Maas et al. 2007), in brass or bronze
faucets, fittings, valves, meters, etc., and unplasticized polyvinyl chloride pipe (uPVC) (MOE,
2009).
The corrosion process (amount of lead leached) is affected by a number of factors, including the
age of the plumbing system, the chemistry of the water, and the length of time the water remains
in the pipes. Lead in drinking water is considered the most bioavailable source of lead (Moore et
al., 1985); this is because soluble lead is more readily absorbed in the intestine than lead from
dietary sources. Furthermore, lead intake is increased from water absorbed into food during
cooking (Moore et al., 1979).
Lead levels increase through dissolution; thus it is predominantly in the dissolved form that lead
concentration is found in drinking water. In old homes the problem often arises because of
leaded distribution lines and service connections. It is an issue particularly for those residences
built in the 1950’s and earlier and plumbing installed before 1930 is the most likely to contain
lead. Although not as widespread it can also be found in homes constructed after this time
period in the pipe connections and even at the consumer level in the faucets. New brass faucets
and fittings can leach lead, even though they are advertised as "lead-free" the lead content could
be as high as 8% (AWWA, 2015). Some scientific research indicates that the newer the home,
the greater the risk of lead contamination. In newer homes, excessive leaching from leaded
solder and brass fixtures (e.g., faucets), may occur from 1-5 years until a protective oxide layer
has formed in the pipes (EPA, 1993; AWWA, 2015). The lead levels decrease as the building
ages because over time the mineral deposits form a coating on the inside of the pipes (if the
water is not corrosive) and this coating insulates the water from the solder (Hayes, 2014).

A Proposed Lead Corrosion Control Plan: A Review of Potential Health Impacts from the addition of phosphate Chemical Inhibitors in the Drinking Water Treatment Process, Marie McKeary, Researcher, McMaster Institute for Healthier Environments, McMaster University for Hamilton Public Health Services, 2015
Pag
e- 1
3 -
Solder with a high lead content (often 50%) was used to join copper pipes up until mid-1980s,
before it was prohibited. Galvanic corrosion of the lead in the solder is considered by experts to
be a major cause of lead contamination of household water in U.S. homes today. Brass fittings
and components (major contributors include brass meters and faucets) may also contribute lead
to drinking water, particularly the older brass that had a lead content >8%. However, lead
release from brass is unlikely to contribute more than 1 to 3 µg/l in most cases (Hayes, 2014). On
the basis of experience in the UK, the main source of lead in drinking water is lead piping
(Hayes et al. 2006, 2008).
Lead-based solders comprised of 50:50 lead:tin were used up until the 1980s in the United States
and the late 1980s in Canada. Since 1990, the Canadian National Plumbing Code has restricted
the use of lead solder in new plumbing and in repairs to plumbing for drinking water supplies.
Several provinces have also passed legislation limiting the amount of lead in solder used for
drinking water supply lines (Health Canada (HC), 2009).
2.2 Global Extent of the Lead Problem in Drinking Water
The percentage of homes in the US with a lead service line, lead pipe or lead gooseneck has been
estimated to be between 3 and 6% (Triantafyllidou & Edwards (2012). The UK has the most
accurate information and understanding of the extent of lead concentrations in drinking water as
a result of widespread sampling at consumers' taps for over thirty years. In contrast, many other
European countries have very little knowledge of the extent of the problem because they have
not routinely monitored at private residences, or have done so only after flushing the pipework
(CIWEM, 2012). However, on the basis of evidence gained by an international research network
(COST Action 637) it appears that problems with lead in drinking water are widespread in
Europe (Hayes, 2014; H. C., 2009). Estimates suggest approximately 25% of houses in the EU
have a lead pipe, putting 120 million people at risk in today’s 27 member states. Overall, it has
been estimated (IWA, 2010) that up to one in four children in Europe could be at risk from lead
in drinking water (CIWEM, 2012).
2.3 Lead Content Variables - Plumbosolvency
The four main variables which determine the level of lead contamination found in Municipal
drinking water are:
the plumbosolvency (how readily it dissolves lead) of the water.
the length and internal diameter of the lead service line, since the longer the lead service
line and any internal lead plumbing, the higher will be the average concentration of lead
in the drinking water.
the contact time between the water and the lead service line – the length of time the water
is left standing in residential plumbing systems.

A Proposed Lead Corrosion Control Plan: A Review of Potential Health Impacts from the addition of phosphate Chemical Inhibitors in the Drinking Water Treatment Process, Marie McKeary, Researcher, McMaster Institute for Healthier Environments, McMaster University for Hamilton Public Health Services, 2015
Pag
e- 1
4 -
the larger the internal diameter of the lead piping, the higher will be the average
concentration of lead in the drinking water (Hayes, 2014).
The level of lead concentrate found at the consumer’s faucet is also influenced by the time of
day/evening, the season of the year and the standing time of the water before testing. Variation
over a day is determined by how long the water has stood in the lead piping. In general, the
lower the plumbosolvency of the water, the lower the lead concentration that builds up over time.
The temperature of the water in the lead piping also has a significant bearing on lead
concentrations, with concentrations twice as high in the summer than in the winter (Hayes,
2014).
2.4 How Scale is formed
Depending on water quality characteristics, metal ions formed by the corrosion reaction combine
with various constituents in the water to form carbonate compounds on the surface of the pipe
(this is referred to as scale). The properties of the scale will impact the rate of the corrosion
reaction, and the solubility of the particular scale that is formed will determine the concentration
of the metal in the water. If the scale is relatively soluble, then lead can go into solution. Once in
solution, the lead can be transported in the bulk water to the consumer’s tap. When water
chemistry changes, for example when corrosion control treatment is implemented, the scale
can be modified to be less soluble, resulting in lower lead levels in the water (MOE, 2009).
The metallic lead at the inside wall of the lead pipe initially oxidizes to lead oxide (PbO). In
most water systems, the lead oxide converts to lead carbonate due to the presence of carbonate or
bicarbonate in the water. The lead carbonate occurs in two forms (basic or hydroxy-carbonates).
The solubility of lead carbonate is dependent on the pH and alkalinity of the water (Hayes,
2014). In general, the more corrosive the water (lower alkalinity and pH) the greater will be the
concentration of lead. However, in very high alkalinity waters, pH has a lesser impact and
preventative measures must be supplemented by a corrosion inhibitor, such as
orthophosphate, in order to reduce lead levels (Schock 1980, 1989; Sheiham & Jackson 1981).
In both types of water, an increase in the water pH to a value of 8–8.5 at consumers’ taps tends to
reduce solubility (Comber et. al., 2011). Natural organic matter (NOM) is also a major player in
determining the plumbosolvency of the water. If humic and fulvic acids are present in the water
(organic colour) the plumbosolvency can be greatly increased, by several orders of magnitude
(Hayes, 2014).

A Proposed Lead Corrosion Control Plan: A Review of Potential Health Impacts from the addition of phosphate Chemical Inhibitors in the Drinking Water Treatment Process, Marie McKeary, Researcher, McMaster Institute for Healthier Environments, McMaster University for Hamilton Public Health Services, 2015
Pag
e- 1
5 -
2.5 Legislation for lead in drinking water: Compliance
2.6 Legislation – International
The WHO’s guideline value for lead in drinking water is 10mg/L based on a tolerable weekly
lead intake of 25mg/L body weight with 50% of this intake allocated to drinking water. This
guideline value has been adopted by EU Directive 98/83/EC (European Commission 1998) to
become a legal requirement as of December 2013, which includes the UK (Hayes & Skubala,
2009).
The Joint FAO/WHO Expert Committee on Food Additives re-evaluated lead allowances in June
2010 and withdrew the provisional tolerable weekly intake guideline value for lead on the
grounds that it was inadequate to protect against IQ loss. This guideline value had been used as
a basis for determining WHOs guideline value for lead in drinking water of 10 µg/l. It is
therefore possible, some experts have suggested, that WHO may lower its guideline value for
drinking water in the future. For the time being, WHO (2011) has retained its guideline value of
10 µg/dl for lead in drinking water, but as a provisional guideline on the basis of achievability
(CIWEM, 2012).
2.7 Legislation – USA
The US federal maximum contaminant level goal (MCLG) for lead in drinking water is zero; a
non-enforceable health goal based solely on possible health risks. EPA has set these levels based
on the best available science which shows there is no safe level of exposure to lead (EPA, 2014).
For most contaminants, the EPA sets an enforceable regulation called a maximum contaminant
level (MCL) based on the MCLG however, because lead contamination of drinking water often
results from corrosion of the plumbing materials belonging to water system customers, the EPA
has established a treatment technique rather than an MCL with regards to lead. A treatment
technique is an enforceable procedure or level of technological performance which water
systems must follow to ensure control of a contaminant. The treatment technique regulation for
lead (referred to as the Lead and Copper rule 1991 and updated 2007) requires water systems to
control the corrosivity of the water when the action level is activated. The regulation also
requires systems to collect tap samples from sites served by the system that are most likely to
have plumbing materials containing lead. Similar to Ontario, Canada, if more than 10% of tap
water samples exceed the lead action level, although in the case of the USA it is 15 parts per
billion (15 ug/L), then water system operators are required to take additional actions including:
A Proposed Lead Corrosion Control Plan: A Review of Potential Health Impacts from the addition of phosphate Chemical Inhibitors in the Drinking Water Treatment Process, Marie McKeary, Researcher, McMaster Institute for Healthier Environments, McMaster University for Hamilton Public Health Services, 2015
Pag
e- 1
6 -
Taking further steps to optimize their corrosion control treatment (for water systems
serving 50,000 people that have not fully optimized their corrosion control).
Educating the public about lead in drinking water and actions consumers can take to
reduce their exposure to lead.
Replacing the portions of lead service lines (lines that connect distribution mains to
customers) under the water system’s control (public system).
2.8 Legislation - Canada
In Canada the primary jurisdiction over most areas of water management and protection resides
at the provincial level. The provinces then delegate certain authorities to the municipalities,
especially drinking water and wastewater treatment, distribution and operations for urban areas.
They may also delegate some water resource management functions to local authorities that may
be responsible for a particular area or river basin. Most major uses of water in Canada are
permitted or licensed under provincial water management authorities (Environment Canada,
2010).
Guidelines for Canadian Drinking Water Quality limit the lead content of drinking water to a
maximum acceptable concentration (MAC) of 10 ppb (μg/dL) in drinking water, measured at the tap.
The guideline for drinking water was established to be protective of the most vulnerable
population, children. Consuming water over the course of a lifetime (i.e., 70 years) with lead
levels at or near the guideline value is considered to be protective of human health (Health
Canada (HC), 2009).
In 2009, Health Canada (HC) released a guidance document, aimed at decision-makers,
operators and water utilities, developed by the Federal-Provincial-Territorial Committee on
Drinking Water to be utilized as a tool to identify and address corrosion issues, with the
objective of reducing the levels of some contaminants at the tap, and complement the existing
guideline for lead by providing additional guidance on how the drinking water treatment process
can be optimized to reduce the potential for corrosion in the distribution system(Health Canada
(HC), 2009).
2.9 Canada – Ontario
The Province of Ontario adopted the 10 ppb (μg/dL) limit as the Ontario Drinking Water Quality
Standard for lead (O.Reg 169/03 Ontario Drinking Water Quality Standards-ODWQS) under the
Safe Water Drinking Act (SDWA) and it applies at the point of consumption. The operational
guideline identified in the ODWQS for pH is a range between 6.5 and 8.5 (MOE, 2009). This
standard is partially based on the World Health Organization's (WHO) provisional tolerable weekly
intake (PTWI) for lead. In 2007, the MOE determined that drinking water samples taken from
some consumers' taps in southern Ontario contained levels of lead above the drinking water

A Proposed Lead Corrosion Control Plan: A Review of Potential Health Impacts from the addition of phosphate Chemical Inhibitors in the Drinking Water Treatment Process, Marie McKeary, Researcher, McMaster Institute for Healthier Environments, McMaster University for Hamilton Public Health Services, 2015
Pag
e- 1
7 -
quality standards set out in provincial regulations. Consequently, the Ontario government
initiated a water testing program making it mandatory for municipalities to test residential water
lead levels in homes that may still have lead connections in the water service.
When Lead Sampling is conducted by municipalities the process guidelines are outlined under
Ontario Reg. 170/03 for testing at the consumer tap level. The Ministry of the Environment
(MOE), under the Community Lead Testing Program, introduced sampling and testing for lead
in drinking water system plumbing in 2007 (Reg.170/03). All Ontario municipalities are required
to participate in the residential lead sampling program.
As mentioned in the introduction, City of Hamilton testing showed more than 10% of
representative residential samples were higher than the provincial MAC for lead in drinking
water. Consequently, Hamilton water system operators (Hamilton Water) were directed to
develop a strategy (Corrosion Control Plan (CCP)) for the reduction of lead levels in municipal
drinking water at the tap to be submitted to and approved by the Ministry of the Environment
and Climate Change (MOECC). The mandated Corrosion Control Plan (CCP) would be required
to outline the strategy/best practices to be adopted by the City (similar to other municipalities
found in exceedance of the MAC) with the goal of reducing lead in the Hamilton drinking water
system, and, ultimately, providing an improved level of protection to all residents.
2.10 Background: Health Impact of Lead in Drinking Water
Although lead has been used extensively for thousands of years in a wide range of manufactured
household products, including plumbing materials and paint, it is a potent, neurotoxic metal that
accumulates in both soft tissue and bones. According to Maas (2005), the 90’s in the US, saw an
increased awareness of the contribution of drinking water to the overall lead exposure burden
experienced in childhood. Subsequently, there was pressure from a number of organizations,
medical, public health and the EPA to take further action to reduce lead in drinking water.
During the same period, medical and epidemiological studies determined that even very low
level lead exposures cause substantial and permanent IQ and learning deficits in young children,
and that low-level but widespread lead exposures, such as from drinking water, may have
disproportionately large health effects (Maas, 2005). Canfield (2003) et.al., found that 14% to
20% of total lead exposure can be attributed to drinking water and may be responsible for a high
proportion of childhood neurological IQ and learning deficits.
Toronto Public Health (TPH) recently updated their investigation of the state of the evidence
with regards to the health impact of lead exposure on the human body, in particular with regards
to prenatal health and childhood (Archbold & Bassil, 2014). Their summary report was based
largely on the recent comprehensive reviews on lead conducted by the National Toxicity
Program (NTP, 2012), Health Canada (Health Canada, 2013a), and the US EPA (US EPA,
2013).

A Proposed Lead Corrosion Control Plan: A Review of Potential Health Impacts from the addition of phosphate Chemical Inhibitors in the Drinking Water Treatment Process, Marie McKeary, Researcher, McMaster Institute for Healthier Environments, McMaster University for Hamilton Public Health Services, 2015
Pag
e- 1
8 -
Archbold and Bassil (2014) conclude that the two main routes of lead exposure for the general
adult population are from ingestion of food and drinking water. For infants and children, the
primary routes of exposure are food, drinking water, and the incidental ingestion of house dust,
lead-based paint, soil, and consumer products (Health Canada, 2013a). Public health agencies
around the world identify drinking water as a significant source of exposure to lead when there
are lead constituents in the plumbing system (Health Canada, 2013a; NTP, 2012; WHO, 2011).
Thus, lead in drinking water should be considered a significant public health issue (Maas, 2005).
Given the health effects from prenatal and childhood exposure to lead and the effects that
can occur even at low levels, many health authorities argue that reducing this
preventable source of exposure should be a public health priority (Barn et al., 2014).
There is now a wealth of evidence to support the fact that exposure to even small amounts of
lead can be harmful to human health, differentially distributed across the population with infants,
young children, pregnant women and some immigrant populations most at risk. Health Canada
notes that those vulnerable adult populations that are susceptible to kidney dysfunction (those
with hypertension, diabetes, and/or chronic kidney disease are also more susceptible to the toxic
effects of lead, even at low levels of exposure in adults (blood lead levels of < 5 μg/dL) (Health
Canada, 2013a). Archbold and Bassil (2014) conclude from their recent review of the literature
that lead has a particularly adverse effect on those that are already experiencing other
vulnerabilities (i.e., individuals experiencing low income, poor nutrition, newcomers, racialized
individuals) (CDC, 2005; Health Canada, 2013a; Pfadenhauer et al., 2014; WHO, 2010). Lead is
primarily stored in bones, with the circulating blood representing only 1% of the total body
burden of lead (Health Canada, 2013a). The half -life of lead in blood is 30 days and in bone is
approximately 10 to 30 years (NTP, 2012). Lead release from bone into the blood stream occurs
at a higher rate during times of poor nutrition, pregnancy and lactation, menopause, andropause
and post-menopause (Health Canada, 2013a).
There are a number of studies that explore the association between blood lead levels and levels
of lead in drinking water. Triantafyllidou and Edwards (2012) provide a recent critical review of
the literature, concluding that lead in drinking water is positively and significantly associated
with blood lead levels. Archbold and Bassil (2014) also conclude that when drinking water levels
of lead are elevated, drinking water can be the dominant, or at the least a major contributor to
elevated blood lead. In their recent review Archbold and Bassil (2014) examine some of the key
studies recently conducted on drinking water. See below for a summary of those studies.
A Proposed Lead Corrosion Control Plan: A Review of Potential Health Impacts from the addition of phosphate Chemical Inhibitors in the Drinking Water Treatment Process, Marie McKeary, Researcher, McMaster Institute for Healthier Environments, McMaster University for Hamilton Public Health Services, 2015
Pag
e- 1
9 -
Montreal
A recent study in an old Montreal neighbourhood demonstrated that drinking water flowing
through lead service lines was a significant source of exposure to lead and a significant
contributor to children's blood lead levels (Levallois et al., 2014). The study examined the
relative importance of low levels of lead in drinking water to children’s blood lead levels
(Levallois et. al., 2014). Three hundred and six children, aged 1 to 5 years, living in old boroughs
of Montreal and currently drinking tap water from homes with lead service lines were enrolled in
a cross-sectional study. The study found low levels of lead in the drinking water (mean: 0.89 ppb
and 1.91 ppb, flushed for 5 minutes and 30 minutes of stagnation, respectively). The authors
concluded that despite relatively low levels, tap water contributed to an increase in blood lead
levels in young children who were exposed (Archbold & Bassil, 2014)
Hamilton Study
A blood lead study conducted in Hamilton, Ontario from 2008 to 2009 found that drinking water,
household dust, and yard soil were all significant predictors of children's blood lead levels (n =
643) (Richardson et al., 2011). However, when all three sources were considered concurrently
and controlling for modifying factors in a multivariate analysis, drinking water and household
dust were the only sources of exposure that remained significant predictors of children's blood
lead levels (Richardson et al., 2011; Archbold & Bassil, 2014).
British Columbia
A recent study of schools in British Columbia estimated that drinking water contributed to more
than 50% of total exposure to lead for elementary school aged children (6 to 11 years old) (Barn
et al., 2014; Archbold & Bassil, 2014) .
USA
The U.S. Centres for Disease Control and Prevention (CDC) studied the impact of the elevated
drinking water levels in Washington DC between 1998 and 2006 on the blood lead levels of
children. The study found that children tested after a partial replacement of their lead service
lines were more than 3 times as likely to have an elevated blood lead level (as defined by ≥ 10
μg/dL) compared with children who lived in a house without a lead service line (odds ratio [OR]
3.3, CI 2.2-4.9) (Brown et al. 2011; Archbold & Bassil, 2014).
Adverse Health Impact from Lead
The action level for blood lead in most countries, based on preventing the occurrence of lead
poisoning in children, is 10 µg/dL. However, it has been suggested (Gilbert & Weiss, 2006) that
it should be lowered to 2 µg/dL, as this lower level can be measured accurately and would
hopefully, encourage further action to reduce childhood lead exposure. Recent research suggests
that lead is associated with neurobehavioral damage at blood levels of 5 µg/dl and even lower
(Lanphear et. al., 2000; CDC, 2010). It would appear there is no threshold level below which
lead causes no injury to the developing human brain and an increase in blood lead level, for
example from < 1 to 10 µg/dL has been associated with an IQ loss of 6 points. Further IQ losses

A Proposed Lead Corrosion Control Plan: A Review of Potential Health Impacts from the addition of phosphate Chemical Inhibitors in the Drinking Water Treatment Process, Marie McKeary, Researcher, McMaster Institute for Healthier Environments, McMaster University for Hamilton Public Health Services, 2015
Pag
e- 2
0 -
of between 2.5 and 5 have been associated with an increase in blood level over the range 10 to 20
µg/dL (CIWEM, 2012). Documented health effects have been associated with blood lead levels
as low as 1-2 μg/dL (Health Canada, 2013a); levels which are currently present within the
Canadian population (Archbold & Bassil, 2014). It is also critical to note research indicates the relationship between BLLs and IQ deficits is not
linear; rather, the first small elevation of BLL in young children apparently causes most of the
neurological damage, with additional higher exposures causing disproportionately less additional
IQ reduction (Maas, 2005). This finding suggests the possibility of a more important role for the
relatively smaller exposures resulting from drinking water, as compared to exposure due to lead
based paint, since exposure to drinking water will reach the majority of children.
In general, symptoms of adverse effects to the nervous system, the primary target organ for lead,
include forgetfulness, tiredness, headache, changes in mood and behaviour, lower IQ, decreased
hand dexterity and weakness of arms, legs, wrists, fingers or ankles. Low-level effects could
include increased risk of developing kidney damage and disease; increases in blood pressure;
anemia; reduced sperm count and fertility; and future risk of osteoporosis in children exposed
(Health Canada HC, 2009). In addition to these health effects, people who are exposed to
moderate levels of lead for an extended period of time may be at a greater risk of experiencing
changes in hearing ability, digestive issues (abdominal pain, cramps, nausea, vomiting, etc.),
changes in the immune system and changes in levels of certain hormones (Health Canada HC,
2009 .
Archbold and Bassil (2014) conclude the adverse health effects from exposure to lead are well-
documented in children and adults (Brown and Marolis, 2012; WHO, 2010). Overall, lead is
associated with multiple health effects on multiple organ systems at both elevated and at typical
levels of exposure (Health Canada, 2013a). At extremely elevated levels, lead can lead to
seizures and ultimately death. At low levels of lead exposure, there is a large body of evidence to
demonstrate that lead is associated with a number of different neurological and developmental
outcomes (Bellinger, 2011; Health Canada, 2013a; NTP, 2012; US EPA, 2013).
Children
The most likely occurrence of health effects for children at low levels of exposure include:
reduced intelligence, attention deficit hyperactivity disorder (ADHD), conduct disorder, and
aggression and delinquency (Health Canada, 2013a; NTP, 2012). Fetuses and children are
particularly vulnerable to the effects of lead because they are at an increased risk of exposure and
also have greater susceptibility to the toxic effects (Archbold & Bassil, 2014).
In addition, multiple studies have shown that neurodevelopment deficits in children from lower
socioeconomic strata are greater in magnitude than those from higher strata at a given blood lead
level (Health Canada, 2013a; NTP, 2012). The possible reasons behind this finding include co-
exposure to other neurotoxicants, fewer opportunities for stimulation, reduced nutritional status,
and increased stress or reduced coping mechanisms (Bellinger, 2008). Recently, researchers have
recognized the potential for drinking water to be the dominant source of lead for formula-fed
infants (Brown and Margolis, 2012; Triantafyllidou and Edwards, 2012). Triantafyllidou and
Edwards (2012) estimate that drinking water can contribute up to 90 percent of a formula-fed

A Proposed Lead Corrosion Control Plan: A Review of Potential Health Impacts from the addition of phosphate Chemical Inhibitors in the Drinking Water Treatment Process, Marie McKeary, Researcher, McMaster Institute for Healthier Environments, McMaster University for Hamilton Public Health Services, 2015
Pag
e- 2
1 -
infant's total exposure to lead (assuming powdered formula reconstituted with drinking water)
(Archbold & Bassil, 2014).
Pregnancy
Lead can also cross the placenta during pregnancy to affect the unborn child, and can be released
into breast milk. Lead is a cumulative poison that affects the nervous system and can retard some
aspects of child development (both size and intelligence). Potential effects include premature
births, smaller babies, and decreased mental ability in infants, learning difficulties, and reduced
growth in young children (Health Canada HC, 2009; WHO, 2010; CEC, 2002). Infants and
children are most susceptible to harm since they absorb lead more easily than adults. Prenatal
effects of lead exposure on neurodevelopment have been demonstrated in epidemiological
studies (CDC, 2010).
Adults
In adults lead has been associated with an increase in blood pressure (hypertension), and
therefore an increased risk of coronary heart disease and strokes (ATSDR, 2001; Comber et.al.,
2011). Other negative effects for adults include: increased all-cause mortality and dysfunction in
the renal, cardiovascular, reproductive, and central nervous systems (Bellinger, 2011), with the
strongest evidence at low levels of exposure for decreased renal function (NTP, 2012; Archbold
& Bassil, 2014).
Immigrant and Refugees
The Canadian Health Measures Survey found that people who were born outside of Canada had
higher mean blood lead levels than those who were born in Canada (Bushnik et. al., 2010).
Studies in the United States have found a high prevalence of elevated blood lead levels in
newcomer populations. The majority of these observations have been in refugee children (CDC,
2005; Esenberg et. al., 2011) but high blood lead levels have also been found in internationally
adopted children (Aaronson et. al., 2000), pregnant immigrant women (Klitzman et. al., 2002)
and children with a foreign birthplace (Tehranifar et. al., 2008).
In summary, the most recent evidence clearly reveals the detrimental health consequences of
lead for the human body even at minimal levels of exposure. Thus, public health resources must
be focused on reducing and eliminating exposure before it occurs (Archbold & Bassil, 2014)
including the need to reduce lead concentrations in drinking water as much as possible (Barn and
Kosatsky, 2011; Brown and Marolis, 2012). This section has offered an overview of the health
issues associated with lead in drinking water from a social determinants perspective; reviewed
the global and local extent of the problem; the source, levels and process of plumbosolvency; and
the legislation enacted nationally and internationally in order to protect the health of the public
and the environment by the developing standards/action levels to monitor and respond to the
issue. The next section on corrosion control outlines the best practices and mitigation strategies
A Proposed Lead Corrosion Control Plan: A Review of Potential Health Impacts from the addition of phosphate Chemical Inhibitors in the Drinking Water Treatment Process, Marie McKeary, Researcher, McMaster Institute for Healthier Environments, McMaster University for Hamilton Public Health Services, 2015
Pag
e- 2
2 -
in effect locally, nationally and internationally including the critical variables to be assessed with
regards to efficacy.
Section Three – Corrosion Control “Response to the Issue”
As mentioned in the introduction, the paper takes a multidimensional approach to the health/risk
assessment of lead and currently available corrosion control strategies used to decrease levels in
drinking water. It is critical to incorporate both the intentional and unintentional health impact
from any particular environmental intervention strategy chosen. It is the foundation for the
Health Equity Impact Assessment (HEIA) tool developed by the MOHLTC to be utilized by
public health units (http://www.health.gov.on.ca/en/pro/programs/heia/). Thus, the following
section will include a national and international review of both the application and any
evaluation (both positive and negative) of the efficacy of commonly applied mitigation strategies
with the exception of chemical inhibitors which will be reviewed in Section Four.
3.1 Corrosion Control Measures
A wealth of literature exists on both the factors that contribute to corrosion, as well as, the
possible treatments to reduce lead-leaching corrosivity in water systems. The amount of lead
leached depends on PH, Alkalinity, concentrations of sulfate, chloride and orthophosphate and
the presence of natural organic matter (NOM) (Maas, 2005). Phosphates have been used
throughout Canada, the United States, and Europe as a method for reducing corrosion in drinking
water systems. Many Canadian cities such as Sudbury, Ontario; St. Foy, Quebec; Dartmouth,
Nova Scotia; and Bathurst and Campbellton, New Brunswick; all treat their water supplies with
phosphates. Some cities in the United States that use Phosphates as a method for reducing
corrosion in drinking water include: New York City, Detroit, Chicago, Atlanta and Nashville.
Below is a brief examination of Best Practices for Corrosion Control and their efficacy, currently
employed by water system operators in order to decrease lead levels in drinking water.
3.2 Corrosion Control for Lead: Impact of Time on Lead Corrosion the ‘Do
nothing’ approach
Some researchers believe if no actions are taken except to discontinue the use of lead-based
plumbing solder, lead levels would gradually decrease even in older homes, since eventually
available lead would dissolve completely out of the plumbing system (Maas, 2005). However,
the impact for the health of individuals over the waiting time would not only be negative but, as
mentioned earlier, would be differentially distributed amongst children and other vulnerable
groups.

A Proposed Lead Corrosion Control Plan: A Review of Potential Health Impacts from the addition of phosphate Chemical Inhibitors in the Drinking Water Treatment Process, Marie McKeary, Researcher, McMaster Institute for Healthier Environments, McMaster University for Hamilton Public Health Services, 2015
Pag
e- 2
3 -
3.3 Corrosion Control for Lead: Infrastructure Solutions - Lead Pipe
Reduction/Replacement Program (LPR)
Evidence has shown the most efficacious infrastructure action is a full lead service line
replacement. However, the water supply delivery system is often divided legally and regulatory
into the public section belonging to the municipality and the private residence section belonging
to the individual homeowner (CIWEM, 2012; Hayes, 2014; Cardew, 2009; Croll, 2000; Hayes,
2008; EPA, 1991, 1993). Municipalities are more inclined to undertake the necessary changes in
order to comply with legislation set by governments whereas individual citizens often prioritize
risks based on the accompanying financial expenditure and inconvenience involved. Often a
municipality will offer an interest free loan to home-owners in order to gain their co-operation.
In Ontario a number of public health units including, Toronto, Hamilton, and Guelph, have
collaborated with municipal public drinking water system operators in order to deliver education
and outreach programs focused on the negative health impact of lead with the goal of eliciting
citizen involvement with LPR loans and programs.
3.3.1. Efficacy of LPR
It is important to note that a partial pipe replacement does not result in an equal lead reduction
compared to other methods in the long term and in the short term there is often an actual increase
in dissolved lead levels. The increase is often due to lead particles detaching from the remaining
lead pipe for 2-3 months due to the disruption of the change in the pipe system. As a result, it is
important to monitor the lead levels during this time period (Health Canada HC, 2009; Hayes,
2014). However, partial lead service line replacement has been undertaken by many utilities in
the USA and Europe due to regulatory requirements relating to that part of the service line that is
the responsibility of the water utility.
3.3.2. Efficacy LPR – UK
The UK based, Chartered Institute of Water and Environmental Management (CIWEM, 2012) a
professional policy body representing members in 98 countries involved with protecting the
environment, does not recommend LPR as an efficacious corrosion control measure due to the
increase in lead concentrations as a result of the physical disturbance. However, they do support
the current UK policy of dosing with a corrosion inhibitor (most commonly orthophosphate)
which under optimal conditions offers a rapid, comprehensive and low-cost approach for
achieving substantial compliance with EU lead standards.

A Proposed Lead Corrosion Control Plan: A Review of Potential Health Impacts from the addition of phosphate Chemical Inhibitors in the Drinking Water Treatment Process, Marie McKeary, Researcher, McMaster Institute for Healthier Environments, McMaster University for Hamilton Public Health Services, 2015
Pag
e- 2
4 -
3.3.3. Efficacy LPR - USA
In 2011, the US Environmental Protection Agency (US EPA) convened a Science Advisory
Board (SAB) to review the evidence on partial lead service line replacement and report back to
the US EPA Office of Water. The US EPA SAB concluded that partial lead service line
replacement often causes drinking water levels of lead to significantly increase for a period of
days to weeks, or even for a longer duration. The risks of immediate spikes in lead from the
physical disturbance of the pipe during lead service line replacements are well known (US EPA
SAB, 2011; Health Canada, 2009). The US EPA SAB noted that the health risks associated with
even relatively short-term exposure to lead could be substantial depending on the magnitude and
duration of elevated lead levels and the water intake and vulnerability of the person exposed. At
the time, these spikes in lead concentrations were assumed to be acceptable as acute exposure to
lead was considered not as relevant as chronic exposure; however, this assumption is being
reconsidered in light of a new understanding of the toxicity of lead (Archbold and Bassil, 2014).
Research has emerged to suggest that partial lead service line replacement may also pose a risk
of longer-term releases of lead into the drinking water (Triantafyllidou and Edwards, 2012; US
EPA, 2011). The potential for longer-term risks was raised by the US Centre for Disease Control
(CDC) in June 2010 (US CDC, 2010). Since that time, there has been significant debate and
dialogue among regulators, experts and drinking water suppliers on the merits of the partial lead
service line replacement programs and the policies designed to encourage them.
The longer-term releases of lead into the drinking water are thought to occur due to contact
between the new copper and the old lead parts of the services line (US EPA SAB, 2011). The
available data suggest that elevated drinking water levels of lead tend to gradually stabilize over
time, sometimes to levels below and sometimes at levels similar to those before the partial
replacement (US EPA SAB, 2011). The ultimate goal is the removal of all lead pipes and
components from water supply systems (Hayes and Hoskstra, 2010) as it offers a permanent
solution to elevated lead in drinking water, but may be associated with high costs (Barn and
Kosatsky, 2011).
3.3.4 Efficacy LPR – Ontario, Canada
Some Ontario communities dependent on their water profile (a critical variable in risk analysis),
have either begun Corrosion Control with LPR and moved to chemical inhibitors; or chosen to
continue with LPR alone due to the particularities of their water system; or use both in
combination (see Appendix B for a summary of strategies adopted by Ontario communities).
3.3.5 City of Toronto (LPR)
On September 12, 2012 Toronto City Council, Public Works and the Infrastructure Committee
requested the General Manager of Toronto Water, in cooperation with the Toronto Medical
Officer of Health, to report back on a review of the recent research on the potential health
consequences of partial lead service line replacements. (The review is available at:
http://www.toronto.ca/legdocs/mmis/2013/ex/bgrd/backgroundfile-57362.pdf)
A Proposed Lead Corrosion Control Plan: A Review of Potential Health Impacts from the addition of phosphate Chemical Inhibitors in the Drinking Water Treatment Process, Marie McKeary, Researcher, McMaster Institute for Healthier Environments, McMaster University for Hamilton Public Health Services, 2015
Pag
e- 2
5 -
Toronto Public Health conducted the requested review on the potential health impacts of partial
lead pipe replacements (LPR) and found over the last few years, concerns have been raised by
researchers about the potential health impacts of partial lead service line replacements. The
review concluded that this practice is frequently associated with a short-term spike in lead
levels and thus there is the potential for health impacts if actions are not taken by the
homeowner to mitigate exposures. There are also concerns that partial lead service replacements
may increase lead exposure over the long term. This report is available at:
http://www.toronto.ca/legdocs/mmis/2013/ex/bgrd/backgroundfile-57362.pdf
Toronto Public Health (TPH) also discovered that homeowners are more likely to take action to
reduce their exposures to lead in drinking water when their drinking water is found to be in
excess of the drinking water quality standard. Thus, TPH advocated for a review of the Ontario
drinking water quality standard to ensure it reflects current understandings of the potential health
impacts of lead exposure and that it is protective of the most vulnerable groups in society
(TBOH, 2014).
3.4 Corrosion Control for Lead – Chemical and Process Solutions
Two primary treatment alternatives for controlling release of lead into the water are:
1. pH and/or alkalinity adjustment, and
2. Use of phosphate or silicate based inhibitors (MOE, 2009).
3.4.1 pH
pH is an important factor in corrosion because hydrogen ions (H+) are one of the major
substances that can accept the electrons given up by a metal when it corrodes. At values below
about pH 5, iron, lead, and copper corrode rapidly. At values higher than pH 9, these metals are
usually protected. The pH also greatly affects the formation and solubility of protective films
(Schock, 1999); for example, phosphate-based inhibitors are typically used at pH levels ranging
between 7.4 and 7.8 and pH affects the structure of the minerals that make up the scale (MOE,
2009).
3.4.2 Alkalinity and Dissolved Inorganic Carbonate (DIC)
Alkalinity is a measure of the ability of a water to neutralize strong acids and is a measure of
buffering capacity against a pH drop (Droste, 1997). Total alkalinity is a function of the
concentrations of bicarbonate, carbonate and hydroxide ions. Dissolved inorganic carbonate
(DIC) is defined as the sum of all dissolved carbonate-containing species, including bicarbonate,
carbonate, carbonic acid, and carbon dioxide (Schock, 1999). Bicarbonate and carbonate affect
many important reactions in corrosion chemistry, including a water’s ability to form a protective
metallic carbonate scale or passivating film (Schock, 1999).

A Proposed Lead Corrosion Control Plan: A Review of Potential Health Impacts from the addition of phosphate Chemical Inhibitors in the Drinking Water Treatment Process, Marie McKeary, Researcher, McMaster Institute for Healthier Environments, McMaster University for Hamilton Public Health Services, 2015
Pag
e- 2
6 -
3.4.3 Optimizing pH and Alkalinity Adjustment
The solubility of lead is a function of the pH and DIC of the water. Lead can form a variety of Pb
(II) carbonate/hydroxide compounds and the solubility of these compounds decreases with
increasing pH (Schock, 1980, Sheiham and Jackson, 1981; US EPA, 1992; Britton and Richards,
1981; Schock, 1989; Schock et al., 1996). These insoluble compounds form a passivating layer
on the lead surface that prevents corrosion of lead. In general, as pH increases, lead solubility
decreases. The influence of pH is stronger in low DIC waters when it comes to controlling lead.
Similarly, in water with higher pH, lead solubility can be better controlled. The ability to
maintain pH in the distribution system is a key factor in successful lead control using
pH/alkalinity adjustment, particularly for soft waters (MOE, 2009).
Given the above the first approach to Corrosion Control recommended by the literature is to
optimize the pH of drinking water. The operating pH conditions that are normally adequate are:
7.0 to 7.5 for ground waters;
7.5 to 8.0 for high alkalinity surface waters; and
8.0 to 8.5 (and often up to 9.0) for low alkalinity surface waters.
In the Netherlands, high alkalinity waters are softened centrally to enable pH elevation to 8.5 for
plumbosolvency control without calcite precipitation. In the UK, there is very little central
softening and a supplementary corrosion inhibitor (orthophosphate) is dosed. In North America,
some systems use a corrosion inhibitor for plumbosolvency control while others elevate pH to as
high as 10.0 (Hayes, 2014). However, at pH conditions above 8.5, the risk of dezincification of
brass is a consideration. Overall, evidence has shown that pH optimization alone will most
often not be sufficient for minimizing lead release from lead service lines and a supplementary
corrosion inhibitor should be considered (CIWEM, 2012).
In summary, optimization of plumbosolvency control needs to address the following variables in
order to be efficacious:
institute the correct pH conditions;
apply the correct orthophosphate dose;
institute adequate organics removal (particularly colour); and
achieving distribution networks free of significant iron discoloration problems (CIWEM,
2012).

A Proposed Lead Corrosion Control Plan: A Review of Potential Health Impacts from the addition of phosphate Chemical Inhibitors in the Drinking Water Treatment Process, Marie McKeary, Researcher, McMaster Institute for Healthier Environments, McMaster University for Hamilton Public Health Services, 2015
Pag
e- 2
7 -
Therefore, raising PH can be effective: with Optimal PH for lead and copper control (7.5 and
9.5). A survey of 365 water facilities under U.S. E.P.A. jurisdiction revealed those using
orthophosphate had lower lead levels only when pH was below 7.4 and alkalinity was below 74
mg/L as calcium carbonate (Health Canada HC, 2009). The optimal pH for lead control falls
between 7.5 and 9.5, while the optimal alkalinity ranges between 30 and 75 mg/L as calcium
carbonate and is typically adjusted in combination with pH adjustment (Health Canada HC,
2009)
3.5 Supplementary Critical Variable with regards to Corrosion Control
3.5.1 Natural Colour and Organic Matter (NOM)
Natural organic matter in the water can affect corrosion in several ways. Some natural organic
substances may react with the metal surface of pipes to form a protective film and reduce
corrosion. Others have been shown to react with the corrosion products to increase corrosion. In
some cases organic matter becomes food for microorganisms growing in the pipes (Schock,1999;
MOE, 2009).
3.5.2 Temperature
Theoretically, an increase in temperature will increase the rate of corrosion because for every
10°C rise in temperature, chemical reaction rates typically tend to double. The effect of
temperature varies depending on the characteristics of the water. Water that exhibits no
corrosive characteristics may become corrosive at high temperatures. Hot water may also reduce
corrosion by turning non-scaling water into scaling water. For example, calcium carbonate
(CaCO3) is less soluble at high temperatures and therefore results in the precipitate forming a
protective layer, and in turn reducing corrosion (Schock, 1999; MOE, 2009).
3.5.3 Microbiological
Changes in water chemistry from corrosion in the system and from application of corrosion
control can influence the environmental conditions to which microbes are exposed. As a result,
their growth can be affected by changes in turbidity, presence of tubercles, disinfection levels,
pH, or inhibitor concentrations (MOE, 2009).

A Proposed Lead Corrosion Control Plan: A Review of Potential Health Impacts from the addition of phosphate Chemical Inhibitors in the Drinking Water Treatment Process, Marie McKeary, Researcher, McMaster Institute for Healthier Environments, McMaster University for Hamilton Public Health Services, 2015
Pag
e- 2
8 -
Section Four : Corrosion Control with appl icat ion of Chemical
Inhibitor - Phosphorous
4.1 Background Primer on Phosphorous
Phosphorous (P), the 15th
element on the periodic table with an atomic weight of 30.974, is an
essential nutrient for life. As an essential biologic element, P is required by all cells for normal
function and is a critical component of all living organisms (Horne and Goldman 1994; Wetzel
2001). Phosphorus plays a role in deoxyribonucleic acid (DNA), ribonucleic acid (RNA),
adenosine diphosphate (ADP), and adenosine triphosphate (ATP) thus phosphorus is required for
all of these necessary components to occur. In the body, the great preponderance of P is found as
PO4, 85% of which exists in bone and teeth as the calcium PO
4 salt hydroxyapatite. Plants need
phosphorus to grow as much as they need water. Like nitrogen and potassium, it is an essential
nutrient that plants take up from the soil and it is crucial to soil fertility and crop growth.
Phosphate exists in three forms: Orthophosphate, me-pho sulfate, and organically bound
phosphate. P, a multivalent non-metal element of the nitrogen group (group 15) of the periodic
table, is naturally found in inorganic PO4 rocks (NCSU, 2015). The first recorded generation of
elemental P was in the late 17th
century from a preparation of urine, which usually contained
considerable quantities of dissolved PO4.
Bone ash was another major source of P until the mid-
19th
century. Elemental phosphorus was discovered in 1669, but commercial production of
orthophosphate did not begin until about 1850 when phosphoric acid was used for fertilizer
(Ashley et.al., 2011).
4.2 Phosphorus and Water
Phosphorus in freshwater and marine systems exists in either a particulate phase or a dissolved
phase. Particulate matter includes living and dead plankton, precipitates of phosphorus,
phosphorus absorbed to particulates, and amorphous phosphorus. The dissolved phase includes
inorganic phosphorus (generally in the soluble orthophosphate form), organic phosphorus
excreted by organisms, and macromolecular colloidal phosphorus.
The organic and inorganic particulate and soluble forms of phosphorus undergo continuous
transformations. The dissolved phosphorus (usually as orthophosphate) is assimilated by
phytoplankton and altered to organic phosphorus. The phytoplanktons are then ingested by
detritivores or zooplankton. Over half of the organic phosphorus taken up by zooplankton is
excreted as inorganic P.
4.3 Environmental Impact –Freshwater system impacts
Generally, phosphorus (as orthophosphate) is the limiting nutrient in freshwater aquatic systems.
That is, if all phosphorus is used, plant growth will cease, no matter how much nitrogen is
available. Many bodies of freshwater are currently experiencing influxes of phosphorus and
nitrogen from outside sources. The increasing concentration of available phosphorus allows
plants to assimilate more nitrogen before the phosphorus is depleted (Chambers et al. 2001).

A Proposed Lead Corrosion Control Plan: A Review of Potential Health Impacts from the addition of phosphate Chemical Inhibitors in the Drinking Water Treatment Process, Marie McKeary, Researcher, McMaster Institute for Healthier Environments, McMaster University for Hamilton Public Health Services, 2015
Pag
e- 2
9 -
Excessive amounts of phosphorous can lead to eutrophication in water ways which is now
considered one of the most common water quality impairments. Globally, some 37 million tons
of phosphorus spills into the environment each year (Childers et.al, 2011). It mostly flows down
sewers and agricultural drains into rivers and lakes, where it feeds the growth of toxic
cyanobacteria and consumes oxygen, creating eutrophication and “dead zones” (Pearce, 2011).
The recommended best solution to the coming shortage of phosphorous (it is a finite resource
critical to agricultural growth), may be to recover and recycle phosphates, with one method being
inside water-treatment plants. Phosphorous can be recovered and reused from the following
sources: crop residues, food waste, manures human faeces and other sources.
4.4 Environmental Legislative Criteria for Phosphorous in Water
4.4.1 Environmental Health Impact: UK Perspective
The UK began dosing with orthophosphate as a Corrosion Control measure for lowering lead in
drinking water over thirty years ago. Although some European countries have expressed concern
over a potential increase in eutrophication of natural bodies of water the UK experience does not
support these concerns. In the UK, 95% of drinking water supply systems are dosed with
orthophosphate and environmental problems have not been reported on the basis of heterotrophic
bacterial counts (Hayes, 2014).
The concentration added to drinking water supplies in the UK for the purpose of reducing
plumbosolvency is most commonly about 1 mg/l P, and the sewage derived from water use
commonly has an orthophosphate concentration of about 10 mg/l P, i.e. ten times as much
(derived mostly from human waste and to a lesser extent from detergents). Based on these
results it would appear orthophosphate dosing of drinking water supplies is not critical with
respect to eutrophication (Hayes, 2014). Thus, British research has concluded that the
environmental aspects of dosing phosphate to water supplies needs to be properly balanced with
the public health consequences of not taking comprehensive action to reduce plumbosolvency, at
least in the short to medium term (CIWEM, 2012).
4.4.2 Environmental Health Impact: USA Perspective
The EPA Environmental water quality criteria states that phosphate should not exceed .05mg/l if
streams discharge into lakes or reservoirs, .025mg/l within a lake or reservoir, and .1 mg/l in
streams or flowing waters not discharging into lakes or reservoirs to control algal growth.
Surface waters that are maintained at .01 to .03 mg/l of total phosphorous tend to remain
uncontaminated by algal blooms.

A Proposed Lead Corrosion Control Plan: A Review of Potential Health Impacts from the addition of phosphate Chemical Inhibitors in the Drinking Water Treatment Process, Marie McKeary, Researcher, McMaster Institute for Healthier Environments, McMaster University for Hamilton Public Health Services, 2015
Pag
e- 3
0 -
4.4.3 Environmental Health Impact: Canadian Perspective
Currently, there are no Canadian national environmental quality guidelines in existence for
phosphorus, although individual provinces may have guidelines or objectives (Environment
Canada 2004). The Protocol for the Derivation of Guidelines for the Protection of Aquatic Life
(CCME 1991) is intended to deal specifically with toxic substances, and provide numerical limits
or narrative statements based on the most current, scientifically defensible toxicological data.
Phosphorus does not fit this model because it is non-toxic to aquatic organisms at levels and
forms present in the environment; however, secondary effects, such as eutrophication and
oxygen depletion are serious concerns.
4.5 Phosphorous as a Scarce Commodity
4.5.1 Natural
Phosphorus is a mineral that is part of every cell in your body but found mainly in your bones
and teeth. It works in conjunction with calcium and other nutrients to build healthy bones and
teeth. Phosphorus also helps maintain normal acid/base balance, supports growth, and is
involved with the storage and use of energy. Phosphorus is found in high amounts in protein
foods such as milk and milk products and meat and alternatives, such as beans, lentils and nuts.
Grains, especially whole grains provide phosphorus. Phosphorus is found in smaller amounts in
vegetables and fruit. In fact, it is considered an essential nutritional supplement for the average
North American diet which requires a minimum recommended daily allowance (RDA) for
adequate metabolism. Appendix A offers examples of RDA’s from a variety of authoritative
health sources. Phosphorus can also be found in food as a regulated additive.
4.5.2 Commercial
The most widely utilized commercial use of P-based chemicals is the production of fertilizers
followed by food additives. It is also an ingredient in toothpastes and detergents. Phosphorous
supplies are finite and quickly disappearing. Phosphorus is applied to agricultural soils in
fertilizers (without phosphorous the fertilizer is rendered useless) to maintain high crop yields. It
takes one ton of phosphate to produce every 130 tons of grain, which is why the world mines
about 170 million tons of phosphate rock every year which is then shipped globally to keep soils
fertile. Phosphorus has no substitute in agricultural food production. It is estimated that at the
current rate of consumption, phosphate reserves will last no more than one hundred years.
However, all estimates are unreliable since information is controlled by global mining companies
which are private or under state control. Two thirds of the world’s resources are in China,
Morocco, and Western Sahara (Childers et.al., 2011; Cordell, 2010; Gilbert, 2009; Heckenmuller
et.al, 2014; Vaccari, 2009).

A Proposed Lead Corrosion Control Plan: A Review of Potential Health Impacts from the addition of phosphate Chemical Inhibitors in the Drinking Water Treatment Process, Marie McKeary, Researcher, McMaster Institute for Healthier Environments, McMaster University for Hamilton Public Health Services, 2015
Pag
e- 3
1 -
4.6 Commercial Application of Phosphates for Corrosion Control in Drinking
Water
Commercial phosphates are water treatment chemicals used to solve specific water quality
problems resulting from inorganic contaminants (iron, manganese, calcium, etc.) in ground water
supplies and also to maintain water quality (inhibit corrosion, scale, biofilm, reduce lead and
copper levels) in the distribution system. Orthophosphate and polyphosphate are two general
types used in water treatment. Ortho and polyphosphates work together, stabilizing water quality
and minimizing color, scale, deposits, corrosion, and chlorine demand in drinking water systems
(MECC, 2014). Utilities need to be aware that reductions in lead are orthophosphate dose
dependent, specific to individual systems and that the potential reductions from dosing take a
long time to be achieved.
Polyphosphate was first described in 1833, but not until 1929 was it used as a sequestering agent
that formed soluble complexes with metallic ions in water. In the 1960’s orthophosphate was
combined with zinc salts to produce zinc orthophosphate (ZOP) a corrosion inhibitor. ZOP was
patented and used extensively to control corrosion in water systems. During the period 1970-
2000, various blends of phosphates, both orthophosphate and polyphosphate, were recognized as
multi-functional chemicals used to sequester metals and inhibit corrosion (MECC, 2014).
Thus, phosphates can be used in municipal water systems to perform three broad functions:
inhibit corrosion of water mains/plumbing (iron, steel, galvanized, asbestos/cement, lead,
copper), sequester nuisance metals in the water supply (iron, manganese, calcium, magnesium,)
and to improve the quality of water in the distribution system by removing scale deposits &
tuberculation, discourage microbial film formation/regrowth, and stabilizing free chlorine
disinfectant residuals (MECC, 2014).
Corrosion control is a strategy that can reduce the release of lead from the various sources of
lead in drinking water. Hayes and Hoskstra (2010) note that dosing of orthophosphate, the
most effective corrosion inhibitor; can achieve over 99% compliance with the drinking water
standard, with risk reductions in the range of 100 to 500 fold. Numerous studies have found
associations between lowered blood lead levels and a reduction of lead in drinking water
concentrations in response to corrosion control (Triantafyllidou and Edwards, 2012). Barn et. al.
(2014) also note that corrosion control is likely to result in a more effective and consistent
solution to addressing elevated lead levels in schools when compared to flushing.
Phosphate inhibitors are available in a variety of compositions: phosphoric acid, orthophosphate,
zinc orthophosphate, polyphosphates, and blends of orthophosphate and polyphosphate. They are
generally proprietary compounds (with the exception of phosphoric acid) with varying
percentages of orthophosphate, the active agent in the formation of passivating films for lead
control (MOE, 2009; Korshin, 2000).

A Proposed Lead Corrosion Control Plan: A Review of Potential Health Impacts from the addition of phosphate Chemical Inhibitors in the Drinking Water Treatment Process, Marie McKeary, Researcher, McMaster Institute for Healthier Environments, McMaster University for Hamilton Public Health Services, 2015
Pag
e- 3
2 -
4.6.1 Pipe loop testing
Pipe loop testing will provide valuable information on design criteria and operating conditions,
and results from pipe loop testing can be used to compare the performance of different types of
phosphate inhibitors and assess secondary impacts (MOE, 2009). Pipe loop studies allow for a
relatively controlled comparison of metals release from specific materials of concern, under
different corrosion control conditions. They provide an evaluation of metals release which
closely simulates actual distribution and premise plumbing conditions. However, these studies
are relatively complex and labor intensive, and require a significant commitment of time and
resources to complete. It should also be noted that pipe loop studies may need to be conducted
for several months before stable metals release data are available, as lead levels measured
initially may be highly variable (MOE, 2009). Higher initial orthophosphate doses are usually
applied during the initial phase of operation, followed by lower maintenance dosages. When
using orthophosphates for lead control, the lead levels may continue to decrease for years due
to the slow formation of passivating films.
4.6.2 Categories of Phosphates Inhibitors
Phosphate inhibitor products applied to drinking water treatment can be separated into three
broad categories:
Orthophophates: This is the most common form used for lead control. The simplest source of
orthophosphate is phosphoric acid.
Polyphosphates: Polyphosphates are commonly considered for use as sequestering agents for
treatment of ground-waters with low to moderate levels of iron and/or manganese. Their use for
lead control is not recommended.
Orthophosphate/polyphosphate blends: varieties of proprietary blends are available, and are
typically applied when multiple treatment objectives need to be met (TEWG-EPA 2004).
Section Five - Orthophosphate
5.1 Orthophosphate Introduction
Orthophosphate may be added directly via phosphoric acid, or via a variety of proprietary
orthophosphate or orthophosphate/ polyphosphate blends. Different blends of proprietary
chemicals will have different ratios of orthophosphate to polyphosphate (10 to 30 percent)
(MOE, 2009). In 2006, the US Environmental Protection Agency (EPA) designated
orthophosphate treatment as the optimal corrosion control treatment for reducing the
presence of lead in drinking water (DC water, 2014).

A Proposed Lead Corrosion Control Plan: A Review of Potential Health Impacts from the addition of phosphate Chemical Inhibitors in the Drinking Water Treatment Process, Marie McKeary, Researcher, McMaster Institute for Healthier Environments, McMaster University for Hamilton Public Health Services, 2015
Pag
e- 3
3 -
Orthophosphate is a tasteless, odorless, food-grade additive derived from a natural source of
mineral rock that is used by many water systems to control corrosion. As stated earlier in the
paper, phosphates are naturally present in food, such as milk, nuts and beef, and have no impact
on the taste or odour of the drinking water. It has been estimated that the average person would
need to drink approximately 330 glasses of tap water to get the same amount of phosphate that
they would get from one glass of milk (only an increase of about 0.1-0.2% in daily phosphate
consumption) (Richmond Hill Committee of the Whole, 2014).
Phosphate treatment has been highly successful as a strategy for corrosion control of lead in
drinking water (it is the preferred treatment method for many water utilities, including: London
(UK), Winnipeg, Chicago and Detroit). Orthophosphate and Zinc Orthophosphate are most often
reported as successfully decreasing lead levels in drinking water. The solubility of lead
phosphate compounds is dependent on pH, DIC and orthophosphate levels. The effective pH
range for orthophosphates is 7.4 to 7.8 (MOE, 2009). It can be seen that lead solubility
decreases with increasing orthophosphate dosages. It is recommended that a minimum
orthophosphate residual of 0.5 mg/L as P (as phosphorous, rather than as phosphate, PO4 -) be
maintained in the distribution system, although higher levels may be needed to optimize lead
control (MOE, 2009). However, the efficacy of the phosphate depends on a number of
variables, esp. the pH of the water, temperature, how many households on leaded service, etc.,
water type also needs to be considered. For example in the UK the water supply consists of
80% surface waters and 20% ground water with surface waters being less responsive thus higher
doses are required to achieve the same reduction (Cardew, 2009).
The successful use of corrosion inhibitors is very much based on trial and error and depends on
both the water quality and the conditions prevailing in the distribution systems. Efficacy is
largely dependent on maintaining a residual of inhibitors throughout the distribution system
and on the PH and alkalinity of the water (Health Canada HC, 2009). The literature findings
are that the most critical factor in the success of any Corrosion Control program is having an
in-depth knowledge of the profile of the local water, since all corrosion inhibitors are specific
to individual water systems (Hayes, 2014). The optimum orthophosphate dose is likely to be
around 1 mg/l (P) on average but varies between 0.5 and 2.0 mg/l (P) for individual systems. It
can be noted that 1 mg/l (P) is equivalent to 3 mg/l (PO4) (Hayes, 2014). Research in the UK
supports the finding that there is a diminishing return to the use of orthophosphate. Further
increases above 1.0mg/L have limited benefits. In the UK the goal was a target phosphorus
concentration in the range 0.6–2 mg/L as P. Within this range, increasing the orthophosphate
concentration tends to reduce the solubility of lead, but above 2 mg P/L, the additional benefits
are minimal (Comber et. al., 2011).
Orthophosphate works by converting lead carbonate to lead phosphate in the corrosion deposits
within the lead service lines, which is significantly less soluble (Cardew, 2009). This method of
corrosion control is based on the theory that the addition of phosphate to a finished water will
result in the formation of low-solubility lead-phosphate complexes on interior pipe surfaces. The
protective layer acts as a barrier to corrosion, reducing dissolution of lead into the water (TEWG-
EPA 2004). The conversion is dependent on the concentration of orthophosphate and is
reversible. In general, the higher the concentration of orthophosphate, the more lead phosphate
will be formed and the lower will be the amount of lead that dissolves. The lead carbonate and

A Proposed Lead Corrosion Control Plan: A Review of Potential Health Impacts from the addition of phosphate Chemical Inhibitors in the Drinking Water Treatment Process, Marie McKeary, Researcher, McMaster Institute for Healthier Environments, McMaster University for Hamilton Public Health Services, 2015
Pag
e- 3
4 -
lead phosphate are in chemical equilibrium depending on both the orthophosphate and
bicarbonate/carbonate concentrations in the water. This means that more orthophosphate must be
dosed to high alkalinity waters than low alkalinity waters to achieve the same lead reduction
(Hayes, 2014; CIWEM, 2012; DC water, 2014; Moore, 2001; Jackson & Ellis, 2003).
According to solubility theory, lead phosphate is least soluble at a pH of 7.5 and an optimum pH
range of 7.2 to 7.8 has been considered to be appropriate when dosing with orthophosphate.
However, laboratory plumbosolvency testing has indicated that:
For high alkalinity waters, the pH is much less critical than the orthophosphate
concentration, within the normal operating range of 7.0 to 8.0;
For low alkalinity waters, the orthophosphate dose response is better at higher pH values
over the range 7.0 to 9.0, particularly for organically colored waters (Hayes, 2014).
5.2 Orthophosphate – Cuprosolvency - Copper vs Lead Corrosion
Evidence reveals that adding orthophosphate may increase copper corrosion in the system
(Moore, 2001). The increase can be tolerated if copper levels do not rise above 1,300 ug/L
(micrograms per litre) in homes (Moore, 2001). Copper is widely distributed in nature, and is
frequently found in surface water and some groundwater and is currently not designated as a
health issue. Copper is also found in a wide range of food products such as shellfish, organ
meats, nuts, dried beans, dried vine and stone fruits, and cocoa, are all rich in copper, ranging
from 20 to 400 µg/kg. Copper is an essential element in human metabolism, and it is well-
known that deficiency results in a variety of clinical disorders, including nutritional anaemia in
infants. We find a higher concentration of copper in distributed water due to the corrosion and
dissolution of copper from copper piping, used extensively in domestic plumbing in Canada
(Health Canada, 2008).
Health Canada (2008) has set the aesthetic objective for copper in drinking water at ≤1.0 mg/L in
order to ensure palatability and to minimize staining of laundry and plumbing fixtures.
The Maximum Contaminant Level Goal (MCLG) for copper is 1.3 mg/L or 1.3 ppm. EPA has
set this level of protection based on the best available science to prevent potential health
problems (EPA, 2013). The U.S. Environmental Protection Agency (EPA) recommends that
communities whose tap water contains high copper levels should raise the pH above 8 and the
alkalinity to 30 mg/L or more (EPA, 2013).
Although the intake of large doses of copper has resulted in adverse health effects, the levels at
which this occurs are much higher than the aesthetic objective (Health Canada, 2008). Acute
copper poisoning is rare in higher mammals owing to the potent emetic action of copper. In
humans, acute copper toxicity has usually been associated with accidental consumption;
symptoms include a metallic taste in the mouth, nausea, vomiting, epigastric pain, diarrhoea,
jaundice, haemolysis, haemoglobinuria, haematuria, and oliguria. In severe cases, the stool and
saliva may appear green or blue; in the terminal phases, anuria, hypotension, and coma precede
A Proposed Lead Corrosion Control Plan: A Review of Potential Health Impacts from the addition of phosphate Chemical Inhibitors in the Drinking Water Treatment Process, Marie McKeary, Researcher, McMaster Institute for Healthier Environments, McMaster University for Hamilton Public Health Services, 2015
Pag
e- 3
5 -
death (EPA, 2013). Limited data are available on the chronic toxicity of copper. The hazard
from dietary intakes of up to 5 mg/day appears to be low. Some people who drink water
containing copper in excess of the action level may, with short term exposure, experience
gastrointestinal distress, and with long-term exposure may experience liver or kidney damage
(EPA, 2013). Two groups are at increased risk from the toxic effects of chronic ingestion of high
doses: individuals with glucose-6-phosphate (G-6P) dehydrogenase deficiencies, and individuals
with Wilson's disease, an inborn error of copper metabolism in which copper accumulates in the
brain, liver, and kidney (EPA, 2013). People with Wilson's Disease should consult their personal
doctor if the amount of copper in their water exceeds the action level.
Given the proven effectiveness of phosphate dosing in reducing lead solubility, it is plausible to
suggest that a similar benefit might apply to copper corrosion (Comber et.al., 2011). The release
of copper as a result of the corrosion of pipes is reported to be a complex function of the pipe
age, water quality, stagnation time and the type of phosphate inhibitor used. One of the key
conclusions from research is that a dosing of 1 mg P/L of orthophosphate leads to reductions
in copper release ranging from 43 to 90% when compared with the same condition without an
inhibitor, regardless of the pipe age, water quality or stagnation period (Edwards et al. 2002).
However, the benefits of phosphate dosing on reducing the concentrations of copper in tap water
depends on both the solubilising effect of dissolved organic substances and the presence of the
disinfectant chlorine. Free chlorine has been shown to increase copper dissolution (Hong &
MacAuley 1998). Chlorine is a strong oxidising agent, acting on the surface of the copper pipe.
Comber et. al. (2011) conducted research which produced evidence of reductions in copper
discharged to surface via sewage works effluent that arise from plumbosolvency reduction
measures involving phosphate dosing of drinking water. The study data revealed through
monitoring copper concentrations in drinking water, from kitchen taps, that phosphate dosing
appears to decrease levels. The average copper concentrations were reduced by around 40%
from 65 to 35 mg/L, and, secondly the reduction was proportional to the phosphate dose – that
is, a higher dose lead to a greater reduction. The researchers also found that the result was
achieved at phosphate dose levels that are determined by the need to control plumbosolvency.
5.3 Secondary Environmental Impacts of Phosphate and Silicate Inhibitors
If orthophosphate dosing is instituted an objective assessment of its environmental impact in
wastewater catchments should be considered, to ensure that any subsequent environmental
controls are justified (CIWEM, 2012). When using phosphate inhibitors, it should be
remembered that phosphate is a nutrient and can impact algal growth in open reservoirs,
potentially causing aesthetic problems and turbidity. Consumers may also report issues related to
sludge build-up and scaling in water heaters, humidifiers, and water fountains (MOE, 2009).
A Proposed Lead Corrosion Control Plan: A Review of Potential Health Impacts from the addition of phosphate Chemical Inhibitors in the Drinking Water Treatment Process, Marie McKeary, Researcher, McMaster Institute for Healthier Environments, McMaster University for Hamilton Public Health Services, 2015
Pag
e- 3
6 -
5 .4 Optimisat ion of Orthophosphate – Cri t i cal Role o f
Sampling
Chemical Corrosion Control can be challenging when the goal is optimisation in order to
decrease lead levels. Optimisation is not straightforward because of the difficulty in assessing
the inherent limitations in both sampling water quality and controlling dosing as well as the
increase in uncertainty in the determination of best practice and the demonstration of its
effectiveness (CIWEM 2005). Because phosphates are most effective over a defined pH range,
maintaining stable pH throughout the distribution system is critical to the success of a
phosphate-based corrosion control program. Commercial phosphate-based inhibitors tend to be
acidic solutions, and their effect on finished water pH must also be considered (TEWG-EPA,
2004). However, phosphate treatment has been shown to be effective in the great majority of
cases (UKWIR, 2008). Thus, a critical factor in achieving efficacy is sampling as a diagnostic
tool and the literature revealed a number of debates in terms of Best Practices for most
efficacious sampling method.
5 . 4 . 1 S a mpl es a f t er f l ush i ng
Zonal surveys of consumers’ taps based on stagnation sampling methods for lead in drinking
water are invalidated by the potential for dilution from water standing in non-lead pipework. The
normal procedure is to flush the pipework for a few minutes, allow the water to stagnate for a
period (e.g. 30 minutes) and then sample the first litre of water that flows from the tap (Hayes &
Skubala, 2009). However, flushing the domestic pipework prior to sampling is more likely to
under-estimate the amount of lead that is present in the drinking water. Samples after flushing
provide no conceivable way for determining the extent of lead problems in a municipality or for
demonstrating the success or otherwise of mitigation measures (Hayes, 2014).
5 . 4 . 2 S a mpl es a f t er ov e r -n i gh t s tand in g
In North America the common practice is to take the first litre drawn from the cold water faucet
in the kitchen after prolonged stagnation of at least six hours. In the majority of cases, the
samples are of water that has stood in non-lead pipework, with much lower lead concentrations
than the water that has stood in the lead service line. This distortive effect is highly variable
dependent on pipework configuration. Further variable influences are changes in water
temperature during the year and differences in over-night standing times (Hayes, 2014).

A Proposed Lead Corrosion Control Plan: A Review of Potential Health Impacts from the addition of phosphate Chemical Inhibitors in the Drinking Water Treatment Process, Marie McKeary, Researcher, McMaster Institute for Healthier Environments, McMaster University for Hamilton Public Health Services, 2015
Pag
e- 3
7 -
5 . 4 . 3 S a mpl es a f t er 30 minu t es s t and in g
In Ontario, under the Safe Drinking Water Act 2002, Ontario Regulation 170/03 for Municipal
Drinking Water Systems the recommended practice is to sample the first four litres drawn
separately from the cold water faucet in the kitchen after flushing with a stagnation period of 30
minutes. Similar problems are encountered as with sampling after over-night standing (Hayes,
2014; Safe Drinking Water Act, 2002, S.O. 2002, chapter 32).
5 . 4 . 4 Rand o m d ay t i me( R DT ) s a mpl es
Research supports Random daytime (RDT) first-draw sampling at consumers’ taps is the most
appropriate method for determining the extent of problems with lead in drinking across a water
supply zone (Hayes & Skubala, 2009).
In the UK and the Netherlands, compliance with the lead standard is based on first draw one litre
samples without prior flushing, taken from randomly selected premises at a random time during
the day (Van den Hoven et. al., 1999; Jackson, 2003). There is evidence this sampling practice
provides an undistorted measure of the extent of problems across a water supply system,
however, the caution must be a sufficient number of samples must be taken to minimize
variability. Samples from several years can be aggregated if treatment conditions have remained
the same.
It is common in the UK for the lead connection pipe to run into a section of copper piping up to
the tap used for drawing drinking water. An 8.8 metre length of 12mm internal diameter copper
pipe has a volumetric capacity of 1 litre and it can be readily appreciated that even short lengths
will exert a significant dilution effect. Sampling prior to domestic pipework or sampling
consumers’ taps after flushing will clearly underestimate the concentrations of lead in drinking
water, whereas first-draw sampling after prolonged standing (e.g. overnight) may overestimate
(Hayes & Skubala, 2009).
RDT sampling is not recommended for any investigation of lead concentrations at individual
residences but is a proven diagnostic tool for systemic testing. In systems with few lead service
lines, the sensitivity of random daytime sampling will be increased if only homes with a lead
service line are selected. Random daytime sampling from all homes, regardless of whether or not
they have a lead service line, can provide an overview on the significance (if any) of legacy
leaded solder and lead leaching from brass, as well as other metals (e.g.: iron, copper, nickel,
zinc, etc.) (Hayes, 2014).
5 . 4 . 5 S equ en t i a l sa mp l in g a f t er s tand i ng
Sequential sampling after flushing and a period of standing can provide a better appreciation of
lead emissions in relation to pipework configuration, as a diagnostic tool. In several case studies,
lead concentration profiles from 12 or more sequential samples were generally only about 1.5
times higher than 6+ hours stagnation than after 30 minutes stagnation, less than had been
expected. In consequence, there appears to be little advantage in 6+ hours of stagnation and 30
minutes stagnation is considered entirely adequate, conferring logistical advantages. The

A Proposed Lead Corrosion Control Plan: A Review of Potential Health Impacts from the addition of phosphate Chemical Inhibitors in the Drinking Water Treatment Process, Marie McKeary, Researcher, McMaster Institute for Healthier Environments, McMaster University for Hamilton Public Health Services, 2015
Pag
e- 3
8 -
implication is that sequential sampling results can be influenced by sampling flow rate as well as
by pipework configuration (Hayes, 2014). Research in Alberta indicated that sequential sampling
profiles are reproducible for similar temperature conditions for an individual home, providing a
basis for performance monitoring of treatment changes designed to reduce plumbosolvency
(Hayes, 2014).
5 . 4 . 6 Sp l i t - f l ow comp o s i t e sa mpl ing
Split-flow composite (COMP) sampling emissions across a zone is RDT sampling, although
sufficient samples are needed to gain adequate reproducibility in making zonal judgements; (b)
COMP will be the most reliable method for investigating lead emissions at individual
dwellings, although there are logistical constraints (Hayes & Skubala, 2009).
It should be appreciated that first draw sampling after stagnation and sequential sampling after
stagnation do not determine the concentrations of lead ingested by consumers. In most homes,
the residents use water to flush toilets, shower, wash or clean teeth before they draw water for
drinking and cooking. This means that water that has stood over-night in a lead service line, and
has a higher lead concentration, will be flushed away one or more times before water is drawn
for drinking or cooking, leading to a false lower lead concentration. In cases where blood lead
has been found to be elevated, it is pointless referring to water sampling data that has been
obtained for regulatory assessment based on stagnation sampling. In order to assess directly the
contribution of lead from drinking water in a home requires split-flow composite sampling. This
entails fitting a flow-splitting device to the faucet where drinking water is drawn; each time
water is drawn for drinking or cooking, a lever is turned to obtain a small proportion of the
water being consumed; these split flows are collected in a bulk container enabling the average
lead concentration to be determined over a day or week, as preferred
5.5 Efficacy of Orthophosphate - Europe
Many European countries have stated a reluctance to dose their water supplies with
orthophosphate due to philosophical or environmental concerns (COST Action 637, 2007). For
example, in Brussels the water company has chosen instead to replace around 5,000 lead
connection pipes per annum. However, the water company is only replacing the public
infrastructure, not that of private residences (Hayes & Skubala, 2009). Thus, the challenge is
similar to that for other cities/countries in terms of gaining the cooperation of the householders in
order to achieve full LPR because of the disruption, inconvenience and cost involved (Van
Dongen et. al., 2007).

A Proposed Lead Corrosion Control Plan: A Review of Potential Health Impacts from the addition of phosphate Chemical Inhibitors in the Drinking Water Treatment Process, Marie McKeary, Researcher, McMaster Institute for Healthier Environments, McMaster University for Hamilton Public Health Services, 2015
Pag
e- 3
9 -
5.6 Efficacy of Orthophosphate - UK
In the UK corrective chemical treatment has been promoted, versus the widespread replacement
of lead pipes (LPR) strategy. The UK has the longest running and most widespread program
with regards to chemical based Corrosion Control, in particular the use of the corrosion
inhibitor, orthophosphate. As of 2010, around 95% of the UK’s public water supplies were
dosed with orthophosphate to minimize plumbosolvency. From a UK perspective
orthophosphate has been successful, once optimized. In England and Wales, plumbosolvency
control is required in order to achieve at least 98% compliance (Drinking Water Inspectorate
(DWI) 2000, 2001). Compliance in Scotland and Northern Ireland is fairly similar (CIWEM,
2012).
In 2010, the Drinking Water Inspectorate (DWI) issued further guidance to water companies,
based on an integrated package of measures to mitigate lead risks, including responding to
regulatory failures, requiring owners of public buildings to take appropriate action, opportunistic
removal of lead distribution pipes, working with health protection teams to identify vulnerable
consumers, and raising awareness in consumers and other stakeholders (CIWEM, 2012).
Since the UK has the longest standing chemical corrosion control strategy enough time has
passed to reveal some interesting findings. For example, in the UK dose optimisation was
completed at the end of 2003 and it was assumed there would be no significant improvement
after that time. However, the lead 90-percentile in 2005 was nearly 25% lower than in 2004
and nearly 40% lower in 2006. Orthophosphate might be expected to impact on lead absorbed
onto particulate material since the amount adsorbed should increase in proportion to the amount
of soluble lead (Stumm & Morgan 1996). In the UK, the proportion of particulate lead has also
reduced significantly over the last decade due to the improved mechanical robustness of the
corrosion layer. Indications are that orthophosphate must also be affecting the particulate
lead component. Research reveals the presence of lead phosphate throughout the corrosion
layer and not simply as a new layer forming on the outside of the original corrosion layer
(Cardew, 2009). It appears a large percentage of the gain is due the creation of a more insoluble
corrosion layer. These results have occurred only after a number of years. This slow response
could be explained by the time required for changes to the physical structure of the corrosion
layer where the composition of the corrosion layer transforms from lead carbonate to lead
phosphate. This hypothesis is in keeping with the observation of Davidson et al. (2004) which
revealed the presence of lead phosphate throughout the corrosion layer and not simply as a
new layer forming on the outside of the original corrosion layer (Cardew, 2009). Thus,
although dose optimization was completed in 2003 the system continues to record
improvements.

A Proposed Lead Corrosion Control Plan: A Review of Potential Health Impacts from the addition of phosphate Chemical Inhibitors in the Drinking Water Treatment Process, Marie McKeary, Researcher, McMaster Institute for Healthier Environments, McMaster University for Hamilton Public Health Services, 2015
Pag
e- 4
0 -
5.6.1 Impact of NOM - UK
Researchers however, also draw attention to the fact that in the same time period there has also
been a large reduction in organics to which up to 75% of the lead improvement since 2004
may be attributed (Cardew, 2009). The presence of organics is well known to enhance lead
concentrations. This issue needs further investigation since it may have significant implications
for the operation of treatment processes involved in removing organics from surface waters
(Cardew, 2009).
5.7 Efficacy of Orthophosphate USA
The EPA advocates for the use of orthophosphate and other corrosion control measures in order
to lower lead (Pb) levels in drinking water. In June 1991 the EPA developed the federal Lead
and Copper Rule, which mandated a projected 50% reduction of lead exposure in US drinking
water by end of the decade. Thus, every public water supply system is mandated to assess the
severity of lead contamination in the higher risk residences on its system (Maas, 2005).
If more than 10% of the residences exhibit first-draw lead levels (i.e., following a standing time
in the plumbing system of at least six hours) exceeding a concentration of 15 μg/l, 15 parts per
billion (the non-health-based “action level”, projected by the EPA to be exceeded by about 25%
of systems), the public water supplier is required to: (1) provide warning notices to all customers
and encourage private consumer testing; (2) determine experimentally (using “pipe loop tests”),
or based on studies conducted by similar water utilities, what treatment modifications could be
implemented (e.g., pH or alkalinity adjustment or introduction of film-forming phosphate or
silicate based corrosion inhibitors) to reduce lead corrosivity and thus potentially at-the-tap lead
levels; and (3) implement these corrosion-optimization methods and monitor at-the tap lead
levels (Maas, 2005).
The EPA estimates that 14% to 20% of total U.S. lead exposure originates in drinking water. In
the event that any of the water supply systems continues to exceed the lead action level after
optimal corrosion control treatment(s) is employed, the operator is mandated to replace the lead
service lines in the distribution system (Maas, 2005).
5.8 Orthophosphate Summary
Reducing lead concentrations in drinking water at the consumer tap can potentially cover a
number of chemical actions including: corrosion control treatment comprising pH adjustment,
increasing alkalinity to improve pH buffering capacity, the dosing of orthophosphate, and NOM
removal by optimized coagulation treatment (MOE, 2009). All of these actions are not mutually
exclusive and have often been combined.
A Proposed Lead Corrosion Control Plan: A Review of Potential Health Impacts from the addition of phosphate Chemical Inhibitors in the Drinking Water Treatment Process, Marie McKeary, Researcher, McMaster Institute for Healthier Environments, McMaster University for Hamilton Public Health Services, 2015
Pag
e- 4
1 -
In summary, when employing a chemical treatment based approach for corrosion control and
lead release, the objective is to effectively bind or “tie up” the lead in a scale so that it is not
available for release into the bulk water. This can be accomplished by promoting the formation
of protective or passivating scales in which the lead is bound within carbonate and/or hydroxide
scales, and in the case of phosphate inhibitors, the lead is bound within phosphate and carbonate
and/or hydroxide scales (MOE, 2009).
5.9 Health Impact of Phosphorous
5.9.1 Dietary Phosphorous and Chronic Kidney Disease
The research suggests that any potential risk assessment arising from the chemical addition of
phosphorous for corrosion control of lead in drinking water must be balanced against the known
toxic health impact of the consumption of any level of lead. As outlined in the paper there are
adverse effects from lead for all individuals with particular consequence for those who have pre-
existing social or medical ‘vulnerabilities’. Research reveals that those suffering from Chronic
Kidney Disease are among the groups most susceptible to the toxic effects of lead even at low
levels of exposure (Health Canada, 2013A).
No scientific studies were found during the literature review which documented adverse health
impacts for humans specifically, from the addition of phosphorous based chemical inhibitors
added to drinking water in order to achieve corrosion control of lead. The amounts generally
added by water system operators are quite small and spread over a large volume of water and the
potential health benefit from decreased levels of lead is much greater in comparison.
Any health concerns with phosphates were found within the nephrology literature and referred to
ingestion through diet. The author would suggest, as mentioned in the beginning of the paper,
that the efficacy of the chosen corrosion control strategy(s) is the more critical question in
terms of health for both humans and the environment. The research suggests individuals
suffering from Chronic Kidney Disease (CKD) need to be cognizant of the amount of
phosphorous generally consumed in their diet, much of which has a commercial utility and
remains ‘invisible’ on the package label. Health Canada and other authorities (see Appendix A)
have recommended dietary doses of phosphorous naturally found in some foods. However, both
Health Canada and the U.S. Department of Agriculture (USDA), have also certified the use of
phosphates as food additives in a number of foods. Phosphate-based food additives have been
used and consumed for over 75 years in foods such as colas; pasteurized process cheeses;
prepared cereals; meats such as ham, bacon and turkey; cakes and toothpastes.
Thus, phosphates found in our food take two different forms: the first occurs naturally and is
primarily found in protein based foods such as dairy products, meat, fish, and poultry, where
they are an integral part of the energy delivering molecules (e.g., adenosine triphosphate [ATP],
adenosine diphosphate [ADP], and phosphocreatine) for proteins and cell walls. Protein-rich
foods such as meat contain natural phosphorus compounds (nucleotides, phospholipids, etc.)
along with naturally occurring orthophosphates; and the second appears in the form of food
additives which as stated earlier have been approved by regulatory agencies, including Health

A Proposed Lead Corrosion Control Plan: A Review of Potential Health Impacts from the addition of phosphate Chemical Inhibitors in the Drinking Water Treatment Process, Marie McKeary, Researcher, McMaster Institute for Healthier Environments, McMaster University for Hamilton Public Health Services, 2015
Pag
e- 4
2 -
Canada. Food additives are utilized by the food industry during food preparations for
commercial purposes. For example, the meat industry utilizes phosphate as an additive in order
to increase meat PH levels and thus slow discoloration by stabilizing vitamin C. The additive is
also used to reduce cooking loss, retard the oxidative rancidity, maintain color, improve
protection against microbial growth, and improve textural properties (Benini et.al., 2011). It is
these hidden phosphorus-containing food additives which significantly increase the phosphorus
load from food sources of protein.
Evidence has shown the ‘danger’ in the inorganic (additive) forms of P versus the organic is that
they are not protein bound; they are salts that more readily disassociate and are absorbed into the
intestinal tract (Benini et.al., 2011). Indeed, it is believed that >90% of inorganic P may be
absorbed in the intestinal tract, as opposed to only 40 to 60% of the organic P present in natural
foods (Kalantar-Zadeh et. al., 2010). The major public health implication of these considerations
is that the P burden from inorganic P–containing food additives is disproportionately high
relative to organic P. In the early 1990s, P additives contributed approximately 500 mg/d P to
the American diet, whereas today P additives may contribute as much as 1000 mg/d P to the
average American diet (Kalantar-Zadeh et. al., 2010). Other studies estimate that the average
phosphorus dietary intake is between 14 to 16 mg/g of protein (Benini et.al., 2011).
This extra-phosphorus burden dramatically worsens the phosphate balance and phosphatemia,
thus increasing the need for phosphate binder agents and ultimately, becoming a health care
expense for individuals suffering from Chronic Kidney Disease (CKD). The phosphate-
containing additives work by sequestration of metal ions and dissociation of the acto– myosin
complex, bringing about an increase in water-holding capacity (Benini et.al., 2011).
Chronic kidney disease (CKD) affects more than 20 million Americans and is also associated
with high morbidity and mortality. The progressive deterioration of kidney function in CKD
leads to the retention of many substances, including phosphorus (P), that would normally be
excreted by the kidneys (Kalantar-Zadeh et. al., 2010). In individuals with chronic kidney
disease, high dietary phosphorus (P) burden may worsen hyperparathyroidism and renal
osteodystrophy, promote vascular calcification and cardiovascular events, and increase mortality
(Kalantar-Zadeh et. al., 2010). Individuals suffering from CKD must exercise caution in terms
of levels of phosphorous containing foods, whether the source is naturally occurring or in the
form of phosphate additives (Benini et.al., 2011). Epidemiologic studies reveal a relationship
between high serum P levels and increased risk of death in both dialysis-dependent patients with
ESRD and individuals with less advanced stages of CKD, hyperphosphatemia in these latter
patients also seems to be associated with a faster rate of CKD progression.
There is also a relationship between serum phosphate levels and cardiovascular disease, thus it
may be to the benefit of the general population to be cautious regarding phosphate intake in diet
(Benini et.al., 2011). Findings also show that for individuals who do not have apparent CKD
and have high normal serum P levels, the risk for coronary artery calcification and mortality is
increased. Hence, relative hyperphosphatemia may represent a novel cardiovascular and death
risk factor (Kalantar-Zadeh et. al., 2010).

A Proposed Lead Corrosion Control Plan: A Review of Potential Health Impacts from the addition of phosphate Chemical Inhibitors in the Drinking Water Treatment Process, Marie McKeary, Researcher, McMaster Institute for Healthier Environments, McMaster University for Hamilton Public Health Services, 2015
Pag
e- 4
3 -
5.9.2 Food Labelling and Consumer Awareness
Identification of the additional amount of phosphorus resulting from phosphate additives is
challenging, especially for the restricted diet of CKD patients, since there is no legislative
obligation for manufacturers to list amounts on food labels. Thus, some researchers have
referred to a “hidden phosphorous burden” (Benini et.al., 2011). Since processed foods are less
expensive than fresh foods, economic constraints may lead some to consume disproportionate
amounts of the former in their diet and consequently increase their risk levels. Some physicians
and researchers have advocated for changes to food labelling in order to raise educational
awareness and allow for consumer/patient choice. They advocate for transparency through the
dissemination of information and increased education as the way forward to address the extra-
phosphorous burden in food (Benini et.al., 2011).
Section Six: Environmental Scan of Corrosion Control Mitigation Strategies
for Lead in Drinking Water
6.1 Ontario Municipal Drinking Water Systems – Corrosion Control Plans (CCP)
As mentioned earlier in the report, Ontario drinking water legislation requires all owners and/or
operating authorities of municipal residential drinking water systems that serve more than 100
private residences to develop Corrosion Control plans if the following conditions are met:
1) More than 10 per cent of the samples from homes (i.e. plumbing) confirm lead
concentrations greater than the standard of 10 micrograms per litre in two out of three sampling
rounds.
2) In those two rounds, at least two sample results exceed the standard.
On an annual basis the Chief Drinking Water Inspector (CDWI) for Ontario issues a report on
the status of municipal drinking water systems. For the most current report available (2013-14)
samples were taken from 665 drinking water systems and only 20 of the Ontario systems
continue to meet the requirement of implementing a Corrosion Control Plan (approximately 3%)
(Lo, CDWI, 2013-14). Appendix B offers a summary of the CDWI findings with regard to the
twenty systems identified, as well as, the corrosion control strategies chosen and the status of
their implementation. The main strategies chosen include: Lead Pipe Replacement (LPR); the
addition of chemical inhibitors; adjustment of pH within the water system; public outreach
campaigns and finally, the rehabilitation of aging infrastructure. In summary, the strategies
being utilized by the drinking water operators are distributed as follows (some operators are
employing more than one strategy hence percentages do not total 100%).

A Proposed Lead Corrosion Control Plan: A Review of Potential Health Impacts from the addition of phosphate Chemical Inhibitors in the Drinking Water Treatment Process, Marie McKeary, Researcher, McMaster Institute for Healthier Environments, McMaster University for Hamilton Public Health Services, 2015
Pag
e- 4
4 -
Sixty percent (60%) have implemented Lead Pipe Replacement (LPR).
Thirty-five percent (35%) have implemented pH adjustment.
Fifteen percent (15%) have implemented the addition of a Chemical Inhibitor.
Ten percent (10%) are currently conducting a pilot program to assess the potential of adding a chemical
inhibitor.
Ten percent (10%) have chosen to upgrade their treatment plants infrastructure. Note: since the primary
source of lead is at the point of the consumers taps (the private section of the distribution section) this is an
interesting strategy to have chosen.
Five percent (5%) have conducted a Public Outreach Campaign to educate the general public with regards
to the potential dangers of lead in drinking water.
Five percent (5%) have chosen to focus on rehabilitating of their water mains.
6.2 North America Municipalities Mitigation Strategies for Lead in Drinking Water
The following section examines in more detail some of the Corrosion Control Plans including
strategies and any evaluation programs/successes achieved within North America, in particular
those municipalities surrounding Great Lakes region, as well as, some ‘key’ sites. Findings
reveal the most commonly utilized strategies are the use of chemical inhibitors or infrastructure
remediation efforts. The locations examined include: USA - Buffalo, Chicago, Cleveland,
Detroit, Milwaukee, Syracuse, New York, New York State, Wisconsin, and Washington: Canada
– Guelph, London, Thunder Bay, and Toronto.
6.2.1 Canada
The following offers an in-depth appraisal of chosen surrounding municipalities obligated to
develop CCP’s in order to illustrate the variety of interventions chosen, rationale for the choice,
and any evaluation/monitoring for efficacy established. For a complete overview of Ontario
municipalities mandated to institute a Corrosion Control Plan for Lead during 2013-14 refer to
Appendix B.
Guelph, Ontario http://guelph.ca/living/environment/water/
(LPR; Groundwater)
The City of Guelph is located in the Grand River Watershed, which is part of the Lake Erie
Source Protection Region. Guelph is one of the largest municipalities in Canada to rely almost
exclusively on groundwater for its drinking water supply. The City of Guelph’s Lead Reduction
Plan (LRP) was developed in lieu of a Corrosion Control Plan (as outlined in Ontario Regulation

A Proposed Lead Corrosion Control Plan: A Review of Potential Health Impacts from the addition of phosphate Chemical Inhibitors in the Drinking Water Treatment Process, Marie McKeary, Researcher, McMaster Institute for Healthier Environments, McMaster University for Hamilton Public Health Services, 2015
Pag
e- 4
5 -
170/03 Schedule 15) and was submitted to the Ministry of the Environment (MOE) in April,
2011. The MOE Guidance Document on Corrosion Control (December 2009) recognized lead
source reduction through physical replacement of lead service lines (a non-treatment solution) as
a viable alternative to chemical treatment. Thus, the city has been working proactively to
address the presence of lead service lines (LSL) in Guelph since 2007 through the identification
and replacement of both the public and private portions of LSLs.
LPR was the preferred method chosen based on an analysis of the Guelph Water System profile
and features (multi-source groundwater system, varying groundwater quality and chemistry, and
13 treatment facilities) and challenges with chemical corrosion control treatment. A Post-
Replacement Sampling Program to monitor lead levels before and after full and partial LSL
replacements for up to 18 months (with homeowner’s participation) was also developed and
instituted.
London, Ontario http://www.london.ca/residents/Water/Water-System/Pages/Lead-FAQ's.aspx
(LPR; pH Adjustment; Education/Outreach Campaign)
The City of London's drinking water system is well within the Ontario Ministry of the
Environment Standards. Tested annually, the City's distribution system lead levels are very low -
less than 1 microgram per litre which is significantly lower than the Ministry of the Environment
Standard of 10 micrograms per litre. The City has taken a multi-pronged approach by focusing
on Education and Outreach regarding the dangers of lead, LPR, and PH adjustment of the water
with Sodium Hydroxide.
The City replaces the public portion (referred to as the Service Stub) of approximately 300
service pipes annually in conjunction with various water main renewal projects. Homeowners are
encouraged to replace the private portion (referred to as the Service Extension) of their water
service pipe at the same time. The City provides advance notification to homeowners prior to the
start of these renewal projects.
In March of 2007, the City of London began working with an environmental consultant to
investigate methods of changing the water treatment process to reduce the tendency of the water
to pick up lead from lead service pipes. As mentioned earlier in this report, every water system
contains a unique water profile and Corrosion Control must match the particularities of each
water system in order to achieve efficacy. Research conducted by the London water operators
indicated that increasing the pH of the water would be the most appropriate strategy for lead
reduction. The water in Lake Huron has a pH of approximately 8.2. The water treatment
processes at the Grand Bend water treatment facility lower this pH to approximately 7.1, and it
was decided by the water operators that raising the pH after the treatment should result in a lead
decrease. The strategy began in January 2008. Significant lead reductions have been measured in
London homes since that time. Small amounts of Sodium Hydroxide are added to the water at
the treatment plant in order to increase the pH.

A Proposed Lead Corrosion Control Plan: A Review of Potential Health Impacts from the addition of phosphate Chemical Inhibitors in the Drinking Water Treatment Process, Marie McKeary, Researcher, McMaster Institute for Healthier Environments, McMaster University for Hamilton Public Health Services, 2015
Pag
e- 4
6 -
Thunder Bay, Ontario
http://www.thunderbay.ca/Living/Environment/Drinking_Water/Lead_in_Drinking_Water.htm
http://www.thunderbay.ca/Assets/Living/Environment/docs/Corrosion+Control+Plan.pdf
(LPR; pH Adjustment; Rehabilitation of Water Mains)
After conducting testing the City of Thunder Bay was required to develop a corrosion control
plan. All 5 rounds of mandated testing determined that more than 10% of plumbing samples
exceeded the 10 ug/L limit for lead. In accordance with Schedule 15.1-11 O.Reg170/03 the City
of Thunder Bay Corrosion Control Plan was approved on May 16, 2011.
The chosen strategy was to develop a phased approach for corrosion control with a focus on
reducing the amount of lead service lines and fixtures connected to the distribution system,
infrastructure replacement and public education on water quality. The water-main replacement
program ensures the piped water infrastructure is renewed. When water-mains are replaced, the
individual residential service connections are also replaced to the property line. The homeowner
then has the option to replace the service from the property line into the home at their expense.
The decision to use chemical inhibitors will be based on the success of the lead service line
replacement program and discussions with MOE and MOH. In preparation for chemical
remediation a study was conducted by McMaster University regarding the best choice of
chemical inhibitor and it was decided that sodium hydroxide was the most appropriate. It was
recommended that lead reduction would be most efficacious when pH was adjusted to between
9.0 and 9.6. There was some concern with raising the pH to this range (raw source water had a
pH of 7.8) since it may compromise the effectiveness of the sodium hypochlorite. Thus, London
water operators have chosen the phased in approach. The recommended flushing time given to
homeowners is five minutes.
Toronto, Ontario http://www1.toronto.ca/wps/portal/contentonly?vgnextoid=18b3946d1d592410VgnVCM100000
71d60f89RCRD
(LPR; Chemical Inhibitor)
On June 10th
, 2014 City Council directed the Toronto Medical Officer of Health (MOH) in
consultation with the General Manager of Toronto Water, (the water system operators for the
City of Toronto) to report to the Board of Health on the health impacts of the City of Toronto’s
Lead in Drinking Water Mitigation Strategy
(http://app.toronto.ca/tmmis/viewAgendaItemHistroy.do?item=2014.MM52.4) Toronto Board
of Health (TBOH, 2014).

A Proposed Lead Corrosion Control Plan: A Review of Potential Health Impacts from the addition of phosphate Chemical Inhibitors in the Drinking Water Treatment Process, Marie McKeary, Researcher, McMaster Institute for Healthier Environments, McMaster University for Hamilton Public Health Services, 2015
Pag
e- 4
7 -
The Recommendations of the Medical Officer of Health (MOH) contained in the response to the
Toronto Board of Health direction included:
Expand the distribution of free filters to vulnerable populations living in pre-1950s
homes and develop and promote a publicly accessible database and/or map of the status
of lead service lines;
Evaluate current public education and outreach efforts and implement enhancements as
necessary to reduce exposures to lead in drinking water, particularly for those
populations that are most at risk;
The Ontario Drinking Water Advisory Council should review and provide a
recommendation on updating the Drinking Water Quality Standard for lead to ensure it
is adequately protective of health (TBOH, 2014).
Toronto Public Health (TPH) endorsed the Toronto Water-Lead in Drinking Water Mitigation
Strategy since it was in agreement with the public health mandate of health access and equity.
TPH took the position that the availability of safe drinking water is a priority for all residents in
Toronto, in particular those most vulnerable to lead exposure: pregnant women, children and
infants, and some immigrant populations. The focus for TPH was one of outreach to all
residents, with a targeted focus on those at highest risk as the foundation for the development of
risk mitigation and outreach strategies (TBOH, 2014). Thus, TPH endorsed the corrosion
control strategy proposed by Toronto Water (TW) with the belief it would significantly reduce
lead leaching into drinking water, and subsequently the rate of public exposure. Evidence
revealed that corrosion control with the use of a corrosion inhibitor was both efficacious and
cost-effective from the perspective of water utilities (TBOH), 2014).
The report to TBOH states that the addition of a chemical inhibitor is, “considered to be one of
the most feasible and least expensive options available to reduce exposures to lead (TBOH,
2014).
“One of the key advantages of corrosion control is that the health benefits are experienced
by all Toronto residents regardless of their socioeconomic status and ability to take action
to reduce their exposures to lead in drinking water. Based on the results from TW's
corrosion control tests and from other municipalities that have implemented phosphoric
acid systems for corrosion control, Toronto Water anticipates a significant reduction in the
leaching of lead into drinking water, full compliance with MOE's Regulation 170/03, and a
reduction of the public's exposure to lead in drinking water. Toronto Public Health has
participated in the development of the Corrosion Control Plan and supports it as a key
component to reduce lead exposure to the residents of the City.” (TBOH, 2014).

A Proposed Lead Corrosion Control Plan: A Review of Potential Health Impacts from the addition of phosphate Chemical Inhibitors in the Drinking Water Treatment Process, Marie McKeary, Researcher, McMaster Institute for Healthier Environments, McMaster University for Hamilton Public Health Services, 2015
Pag
e- 4
8 -
Toronto Public Health Outreach Strategy
Toronto Public Health also developed a comprehensive strategy to support city residents who
live in households that receive a lead in drinking water result in excess of the drinking quality
water standard. The elements of this outreach campaign are listed below:
Residents are assigned a Public Health Inspector (PHI) from the district for follow up.
The PHI discusses the health impacts of elevated lead levels in drinking water and
identifies any vulnerable individuals in the household while discussing methods for
reducing exposure.
The City also sends an information package to residents, including a letter from the
Medical Officer of Health encouraging them to opt for a full lead service line removal.
Residents are directed to the City of Toronto programs such as the Priority Lead Water
Service Replacement program and the Faucet Filter Rebate Program (TBOH, 2014).
Toronto Corrosion Inhibitor - Orthophosphate
In 2014, as part of their Corrosion Control Program, the City of Toronto drinking water operator,
Toronto Water (TW) began enhancing its drinking water treatment process by adding phosphate,
specifically orthophosphate to its drinking water system. Treatment commenced in the spring of
2014 with one treatment plant and over the course of the year included a total of four water
treatment plants. TW estimates a timeline of two years to achieve an ideal level of protection,
throughout the entire network and ultimately, decrease lead corrosion. An initial dose of three
milligrams per litre (mg/L) was implemented and TW has a continuous monitoring program in
place which allows it to adjust its water treatment with a planned maintenance dose of 1 to 2
mg/L of phosphate (TBOH, 2014).
Commercial Customers
TW concluded that the majority of customers would not notice any change to their water,
however, if they rely on municipal water for commercial heating or cooling, manufacturing or
other uses, owners were encouraged to contact their heating/cooling supplier or process
consultant to determine if adjustments to their system were necessary (TBOH, 2014).

A Proposed Lead Corrosion Control Plan: A Review of Potential Health Impacts from the addition of phosphate Chemical Inhibitors in the Drinking Water Treatment Process, Marie McKeary, Researcher, McMaster Institute for Healthier Environments, McMaster University for Hamilton Public Health Services, 2015
Pag
e- 4
9 -
For example, York Region sent a letter in May 2014, to Industrial, Commercial and Institutional
Customers, see sample below:
“Toronto's Corrosion Control Plan Includes phosphate dosing at its water treatment plants
starting in March 2014. Based on results of comprehensive pilot studies, the initial dosage
will be three mg/L phosphate. It is expected that York Region customers could expect to see
up to one mg/L of phosphate in the water supply. Once the initial conditioning period of
approximately two years is complete, the dose will be adjusted to maintenance levels.”
6.2.2 USA
The following offers an in-depth appraisal of chosen American municipalities surrounding the
Great Lakes, in order to illustrate the variety of interventions chosen, rationale for the choice,
and any evaluation/monitoring for efficacy established.
Buffalo http://www.buffalowater.org/Quality/Treatment
As potable water leaves the plant, the corrosion control chemical inhibitor sodium
ortho/polyphosphate blend is added by the water operator to serve as a shield against lead
leaching into the water from aged residential water pipes and service lines.
Chicago
http://www.cityofchicago.org/city/en/depts/water/supp_info/education/water_treatment.html
The city of Chicago has chosen to add a blended polyphosphate, in particular orthophosphate
since 1993-94 with no public concerns, in order to coat pipes and prevent lead leaching. The
chemical amounts added to the drinking water are quite small. The total volume needed to treat
100 gallons of water is about a teaspoon full, approximately 15 parts of chemical to 1 million
parts of water (City of Chicago Water Supply Website, 2014). The position of the city water
operator is that phosphorous is ubiquitous to the ecosystem and has been approved as a ‘safe
method’ of corrosion control by the EPA. The city posts annual water quality reports to their
website allowing for transparency regarding lead mitigation measures and their efficacy.
A Proposed Lead Corrosion Control Plan: A Review of Potential Health Impacts from the addition of phosphate Chemical Inhibitors in the Drinking Water Treatment Process, Marie McKeary, Researcher, McMaster Institute for Healthier Environments, McMaster University for Hamilton Public Health Services, 2015
Pag
e- 5
0 -
Cleveland http://www.clevelandwater.com/2014WQR.pdf
The position of the water operator for Cleveland is that individual homeowners are responsible
for corrosion control (see below). Their annual 2014 water quality report states zero for lead
found. The suggested flushing time recommended is thirty (30) seconds to two (2) minutes.
Elevated lead levels may pose serious health risks for children and pregnant women.
Lead in drinking water is mainly from service lines that connect your home to the water
main and home plumbing. While Cleveland Water is responsible for delivering high
quality water, we are not responsible for your home’s plumbing materials or faucet
fixtures. Older homes, typically pre-1950, may use lead service lines and lead pipes. Pre-
1988 homes may use lead-based solder, often used to join copper pipes (Cleveland
Water, 2014).
Detroit (DWSD) http://www.dwsd.org/downloads_n/customer_service/customer_information/water_quality_repor
t.pdf
Detroit Water and Sewage Department (DWSD) adheres to the EPA action level for the USA of
15 ppb for lead. The website posts their Annual Water Quality reports for 2014 which record
zero for lead. Thus, they do not list any corrosion control strategy currently employed.
Milwaukee http://milwaukee.gov/water/about/LeadandWater.htm
The Milwaukee Water Works began a corrosion control program in 1996, which has resulted in a
significant improvement in lead levels at the customers' tap. The chemical inhibitor of choice is a
phosphorous compound which forms a coating on the inside of pipes to prevent lead from
leaching from plumbing materials into the water.
In accordance with EPA regulations, MWW has tested for lead every year since 1996 at selected
"at-risk" homes identified by the EPA as containing certain plumbing features. If an individual
home exceeds EPA action levels, the MWW advises those residents of the results and provides
guidance on mitigation measures to lead levels. Their suggested flushing times are one to two
minutes.
New York State http://www.nyc.gov/html/dep/html/drinking_water/wsstate.shtml
The New York City Department of Environmental Protection (DEP) treats the drinking water
with a combination of food grade phosphoric acid, sodium hydroxide, and fluoride.
Phosphoric acid is added to create a protective film on pipes that reduces the release of metals, such as
lead, from household plumbing. Sodium hydroxide is added to raise the pH and reduce corrosivity, which
also leads to a reduction in potential exposure to lead.

A Proposed Lead Corrosion Control Plan: A Review of Potential Health Impacts from the addition of phosphate Chemical Inhibitors in the Drinking Water Treatment Process, Marie McKeary, Researcher, McMaster Institute for Healthier Environments, McMaster University for Hamilton Public Health Services, 2015
Pag
e- 5
1 -
Syracuse, New York – http://www.syracuse.ny.us/Water_FAQs.aspx (2015 Newsletter)
For 121 years, the primary water supply for the City of Syracuse has been Skaneateles Lake, a
“Finger Lake” located approximately 20 miles southwest of the City. Syracuse has utilized this
lake for its water supply since 1894. Skaneateles Lake is one of the few large system surface
water supplies in the USA that is approved as an unfiltered water supply.
In the 1970’s the Onondaga County agency, known as the Metropolitan Water Board (MWB),
constructed a water line between Lake Ontario and Syracuse. As a result, the City is able to
supplement its Skaneateles Lake water supply with Lake Ontario water when necessary.
The City is required by federal law to reduce the amount of lead in its drinking water by
replacing 7% of existing lead water service lines in the public right-of-way each year until two
consecutive 6-month water quality sampling events result in the 90th percentile at a
concentration below the USEPA action level of 15 ppb.
The Syracuse Water Department treats the water with orthophosphate so that a sufficient
phosphate residual will be maintained in the water and cause a protective coating to form on the
interior surfaces of plumbing fixtures and lead water service pipe.
Wisconsin http://dnr.wi.gov/topic/drinkingwater/documents/forms/lead.pdf
The Department of Natural Resources, Water Supply Operators have published a brochure on
Lead in Water. In the brochure (see link to PDF) the corrosion control program is based on EPA
action levels and simply refers to ‘an additive’ used to control lead in the drinking water.
Washington, D. C. https://www.dcwater.com/waterquality/corrosion_control.cfm
The Washington Aqueduct, responsible for treating the drinking water of the District of
Columbia has added the common food-grade chemical orthophosphate (OP) to reduce lead pipe
corrosion since August 2004. When the program began citizens were notified that red or rust
coloured water may be a possible temporary side effect of OP treatment. Public Announcements
were made, a tip sheet was developed, consumer advisories were issued, and two public
meetings were held (EWG-EPA, 2004). DC Water has set strict target levels for
orthophosphate in the water distribution system and routinely tests the water to ensure levels
meet those standards. In addition to lead testing, DC Water tests the water for other
parameters that could influence the performance of the corrosion control treatment especially
pH.
The Washington Aqueduct water system operators are required to maintain a pH, leaving the
plant, between 7.4 and 8.0. DC Water monitors for pH in the distribution system daily to ensure
these levels stay within the optimum range for orthophosphate (DC water, 2014). During the
initial phase of the corrosion control treatment experts recommended a higher dose of
orthophosphate — 3.5 mg/L. However, once the orthophosphate formed a protective layer on the
pipe scales, the dose was reduced to 2.5 mg/L leaving the plant (DC water, 2014). DC Water
reported on July 2014 that 90 percent of the samples had lead levels of 2 parts per billion (ppb)
or less, well below EPA's lead action level of 15 ppb. DC Water has met the lead action level
since 2005 (TEWG-EPA 2004; DC water, 2014).

A Proposed Lead Corrosion Control Plan: A Review of Potential Health Impacts from the addition of phosphate Chemical Inhibitors in the Drinking Water Treatment Process, Marie McKeary, Researcher, McMaster Institute for Healthier Environments, McMaster University for Hamilton Public Health Services, 2015
Pag
e- 5
2 -
Caution: Relationship between corrosion control for lead and disinfection chemicals
(Chlorine/Chloramines)
In 2000, Washington, DC utilities switched from chlorine to chloramines as the residual
disinfectant in the distribution system. This caused very high levels of lead to leach, primarily
from the service lines. Data collected during this corrosion crisis revealed that lead levels were
not at the highest level in the first-draw samples at some homes, but were sometimes highest
after 1 min of flushing (Edwards and Dudi, 2004). Samples collected after flushing were found
to contain lead concentrations as high as 48 mg/L. In some cases, the concentration of lead in
samples did not return to safe levels even after 10 min of flushing. In the end, Washington, DC,
utilities advised their consumers to flush their water for 10 min prior to consumption and
provided them with filters to remove lead (Edwards and Dudi, 2004).
Section Seven: Conclusion
The original request to MIHE from HPHS was to conduct a literature review which assessed any
potential adverse health impacts from the addition of a phosphate based chemical inhibitor into a
drinking water system for the purpose of corrosion control of lead. As an evidence based
organization Hamilton Public Health Services relied on their research consultancy agreement
with MIHE to fulfill their due diligence and review recent scientific literature with regards to
lead and corrosion control. In conclusion, the author chose to reframe the question from: “What
is the potential health impact from the addition of chemical inhibitors, specifically
orthophosphate, to drinking water?” and instead approach the subject from a multidimensional
paradigm which incorporated the social determinants of health. Since HPHS is not responsible
for the administration of the Municipal water system nor the creation of a provincially mandated
Corrosion Control Plan (CCP) it is not possible to definitively answer questions of ‘health’ and
‘safety’ directly. At the time of writing this report, Hamilton Water had not yet specified the
chemical inhibitor to be purchased, the process of application, or any monitoring and
adjustments to be implemented and finally, any potential evaluation plan.
However, a review of the literature did support the potential for phosphate based chemical
inhibitors to decrease lead levels in drinking water in an expeditious and cost effective manner.
Since lead is a known toxic metal which has a known adverse impact on health any successful
mitigation strategy would be considered a ‘health good’. The research findings are based on a
combination of a review of the scientific literature, a comparative policy analysis by reviewing
legislation which propels action and an environmental scan which investigates the issues from a
local, provincial, national and international perspective.

A Proposed Lead Corrosion Control Plan: A Review of Potential Health Impacts from the addition of phosphate Chemical Inhibitors in the Drinking Water Treatment Process, Marie McKeary, Researcher, McMaster Institute for Healthier Environments, McMaster University for Hamilton Public Health Services, 2015
Pag
e- 5
3 -
The paper posits the position that the critical question is the efficacy of any chosen mitigation
strategy to decrease lead in drinking water. Thus, the paper identified the major
variables/barriers to achieving efficacy. The two most important are an intimate knowledge of
the water source in question in order to choose the most appropriate intervention and the
importance of sampling in order to monitor and evaluate the process. A ‘failed’ choice will do
more harm than ‘doing nothing’ since there will be a false sense of security in terms of the
toxicity of lead and other potentially effective strategies may be ignored. There is also a risk
from some mitigation strategies of increasing versus decreasing lead levels, for example, partial
LPR.
Overall, the review of the literature found that orthophosphate has exhibited a high degree of
success in lead reduction in both the UK and the USA, over a long time period. As discussed,
the addition of chemical inhibitors as a mitigation strategy is not mutually exclusive and can be
combined with other interventions, i.e. LPR. Phosphorous has both a natural and synthetic source
and acts as a sequestering agent for lead leaching. The literature suggests precautions apply only
to CKD patients in terms of a very small additional phosphorous burden in their diet. The
potential does exist for environmental damage which could eventually have a human health
impact. However, an increase in blue-green algae does not seem to have been an issue in the
U.K. where orthophosphate has been used for over thirty years.
As stated in the introduction, HPHS, specifically the Health Protection Division is committed to
protecting the health of the public and enhancing quality of life by assessing, correcting,
controlling, and preventing those factors in the environment that can adversely affect both the
health of the public and the environment. HPHS received this report in fulfillment of a
consultancy request made to MIHE and our summary findings are that the addition of a chemical
inhibitor into the municipal drinking water can be a potentially efficacious corrosion control
strategy for lead. However, lead reduction in Hamilton drinking water can only be mitigated by
Hamilton Water, the water system operators, who under the legislation, are ultimately
responsible for the administration and distribution for the City of Hamilton.

A Proposed Lead Corrosion Control Plan: A Review of Potential Health Impacts from the addition of phosphate Chemical Inhibitors in the Drinking Water Treatment Process, Marie McKeary, Researcher, McMaster Institute for Healthier Environments, McMaster University for Hamilton Public Health Services, 2015
Pag
e- 5
4 -

A Proposed Lead Corrosion Control Plan: A Review of Potential Health Impacts from the addition of phosphate Chemical Inhibitors in the Drinking Water Treatment Process, Marie McKeary, Researcher, McMaster Institute for Healthier Environments, McMaster University for Hamilton Public Health Services, 2015
Pag
e- 5
5 -
APPENDIX A
(Guides to dietary PhosphORUS)
Table 1. Common phosphate additives used by food industry
Phosphate Salt Purpose
Dicalcium phosphate
Calcium and phosphorus supplementation, dough conditioner
Bakery mixes, yeast-raised bakery products, cereals, dry powder beverages, flour, food bars, infant food, milk-based beverages, multivitamin tablets, yogurt
Disodium phosphate
Sequestrant, emulsifier, buffering agent, absorbent, pH control agent, protein modifier, source of alkalinity, stabilizer
Breakfast cereal, cheese, condensed milk, cream, evaporated milk, flavored milk powders, gelatin, half and half, ice cream, imitation cheese, infant food, instant cheesecake, instant pudding, isotonic drinks, nonfat dry milk, pasta, pet food, processed cheese, starch, vitamin capsules, whipped topping
Monosodium phosphate
Acidulant, buffering agent, emulsifier, leavening agent, protein modifier and sequestrant, gelling aid
Cola beverages, dry powder beverages, egg yolks, gelatin, instant cheesecake, instant pudding, isotonic beverages, and process cheese custard pudding and no-bake cheesecake mixes
Phosphoric acid
Acidulant, pH control agent, buffering agent, flavor enhancer, flavoring agent, sequestrant, stabilizer, thickener, synergist
Cola beverages, carbonated and noncarbonated beverages
Sodium hexameta-phosphate
Sequestrant, curing agent, dough strengthener, emulsifier, firming agent, flavor enhancer, flavoring agent, humectant, nutrient supplement, processing aid, stabilizer, thickener, surface-active agent, synergist, texturizer, buffering agent.
Meat, seafood, poultry, vegetables, cream, half and half, ice cream, whey, processed cheese, eggs, table syrup, toppings
Sodium tripolyphosphate
Sequestrant, pH control agent, emulsifier, providing alkalinity, buffering agent, coagulant, dispersing agent, protein modifier, antioxidant, curing agent, flavor enhancer, humectant, thickener, stabilizer, texturizer
Meat products, seafood, poultry, vegetable proteins, processed cheese, sour cream, dips, yogurt, eggs, table syrups, whipped toppings, pet food, vegetables, whey
Tetrasodium pyrophosphate
Buffering agent, pH control agent, alkalinity source, dispersing agent, protein modifier, coagulant, sequestrant, emulsification, color stabilizer
Processed meat, poultry, seafood, processed cheese, potato products, ice cream, frozen desserts
Trisodium phosphate Buffer, emulsifying agent, stabilizer, protein modifier, pH control, color stabilizer
Processed cheese, cheese products, imitation cheese, isotonic beverages, cooked breakfast cereals
** Follow the Link http://cjasn.asnjournals.org/content/5/3/519/T2.expansion
Clinical Journal of the American Society of Nephrology

A Proposed Lead Corrosion Control Plan: A Review of Potential Health Impacts from the addition of phosphate Chemical Inhibitors in the Drinking Water Treatment Process, Marie McKeary, Researcher, McMaster Institute for Healthier Environments, McMaster University for Hamilton Public Health Services, 2015
Pag
e- 5
6 -
Health Canada Dietary Reference Intakes November 2010
http://www.hc-sc.gc.ca/fn-an/nutrition/reference/table/index-eng.php

A Proposed Lead Corrosion Control Plan: A Review of Potential Health Impacts from the addition of phosphate Chemical Inhibitors in the Drinking Water Treatment Process, Marie McKeary, Researcher, McMaster Institute for Healthier Environments, McMaster University for Hamilton Public Health Services, 2015
Pag
e- 5
7 -
Institute of Medicine: Phosphorus in diet
0-6 months 100 milligrams per day (mg/day)
7-12 months 275 mg/day
1-3 years 460 mg/day
4-8 years 500 mg/day
9-18 years 1,250 mg/day
Adults 700 mg/day
Pregnant or lactating women: Younger than 18
Older than 18
1,250 mg/day
700 mg/day
** http://www.nlm.nih.gov/medlineplus/ency/article/002424.htm
Canadian Food Inspection Agency (CIFA)
http://www.inspection.gc.ca/food/labelling/food-labelling-for-industry/nutrition-labelling/information-
within-the-nutrition-facts-table/eng/1389198568400/1389198597278?chap=6
Recommended Daily Intake (RDI)
According to the Canadian Food Inspection Agency Recommended Daily Intake (RDI) pertains
to vitamins and mineral nutrients. It means the amount of a vitamin or mineral nutrient set out in
Table I of Divisions 1 and 2 of Part D of the Food and Drug Regulations [D.01.001, FDR]. In
the Nutrition Facts table, the term "Daily Value" is synonymous with "Recommended Daily
Intake" for vitamins and mineral nutrients [B.01.001, FDR]. Recommended Daily Intakes are
given for two different age groups: children less than two years of age and persons two years of
age or older. Below is the Recommended Daily Intake for phosphorous.
Children less than two years of age=500 mg
Persons two years of age or older= 1100 mg

A Proposed Lead Corrosion Control Plan: A Review of Potential Health Impacts from the addition of phosphate Chemical Inhibitors in the Drinking Water Treatment Process, Marie McKeary, Researcher, McMaster Institute for Healthier Environments, McMaster University for Hamilton Public Health Services, 2015
Pag
e- 5
8 -
APPENDIX B
Status of Corrosion Control Plans in Ontario communities for the year
2013-14
Municipality Date Identified
for Corrosion Control
Corrosion Control
Strategy Status
Amprior 2008 Treatment Plan upgrades CC Plan in development
Brantford 2008 Treatment Plan upgrades
LPR
LPR ongoing
Ear Falls 2009 pH adjustment CC Plan underway
Reduced Levels confirmed
Gananoque 2008 LPR Chemical Inhibitor
CC Plan underway
Guelph 2008 LPR
LPR ongoing
Hamilton 2008 Pilot to evaluate Chemical Inhibitor CC Plan underway
LPR ongoing
London 2008 LPR
pH adjustment
Public Outreach Campaign
CC Plan underway
LPR ongoing
Reduced Levels confirmed
Lucan Biddulph 2008 LPR
LPR completed
Owen Sound 2008 LPR
LPR completed
Red Lake 2008 pH adjustment CC Plan underway
Reduced Levels confirmed
Sarnia 2008 LPR
LPR ongoing
Sault St. Marie 2008 pH adjustment
Chemical Inhibitor
CC Plan on hold while
evaluating infrastructure
to water treatment process
Sioux Lookout 2008 pH adjustment CC Plan underway
Reduced Levels confirmed
Smiths Falls 2008 pH adjustment CC Plan underway
Reduced Levels confirmed
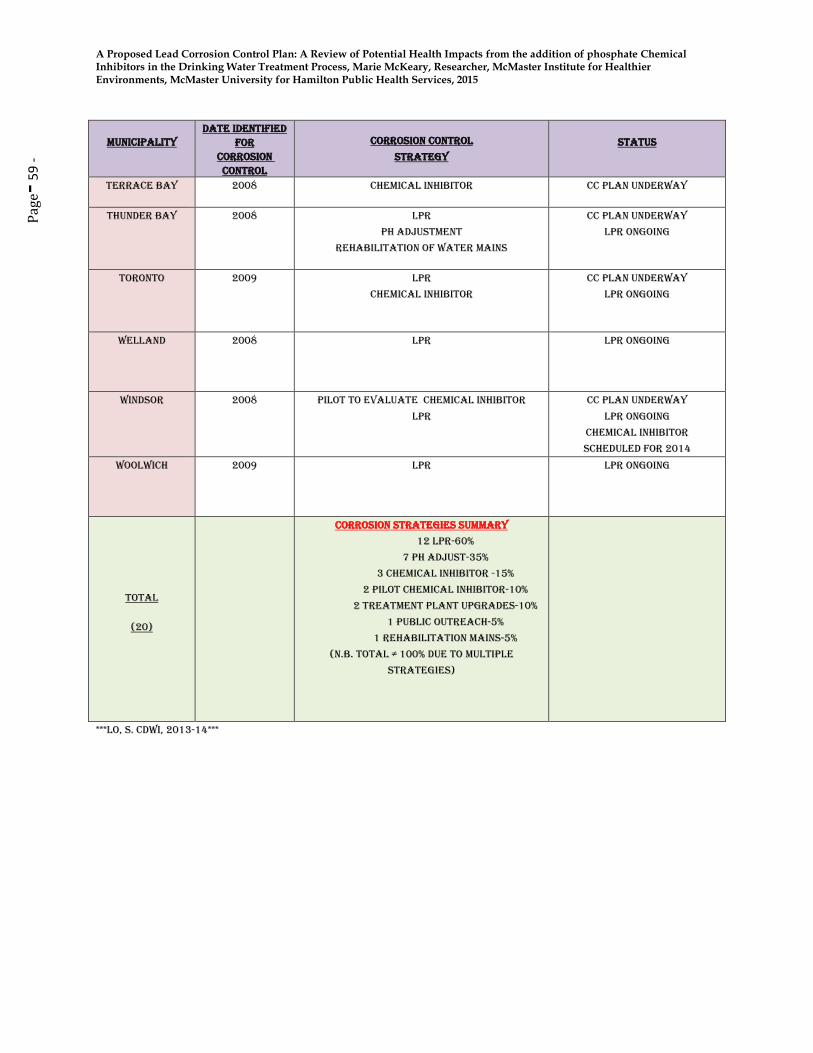
A Proposed Lead Corrosion Control Plan: A Review of Potential Health Impacts from the addition of phosphate Chemical Inhibitors in the Drinking Water Treatment Process, Marie McKeary, Researcher, McMaster Institute for Healthier Environments, McMaster University for Hamilton Public Health Services, 2015
Pag
e- 5
9 - Municipality
Date Identified for
Corrosion Control
Corrosion Control
Strategy Status
Terrace Bay 2008 Chemical Inhibitor CC Plan underway
Thunder Bay 2008 LPR
pH adjustment
Rehabilitation of Water Mains
CC Plan underway
LPR ongoing
Toronto 2009 LPR
Chemical Inhibitor
CC Plan underway
LPR ongoing
Welland 2008 LPR
LPR ongoing
Windsor 2008 Pilot to evaluate Chemical Inhibitor
LPR
CC Plan underway
LPR ongoing
Chemical Inhibitor
scheduled for 2014
Woolwich 2009 LPR
LPR ongoing
Total
(20)
Corrosion Strategies summary
12 LPR-60%
7 pH Adjust-35%
3 Chemical Inhibitor -15%
2 Pilot Chemical Inhibitor-10%
2 Treatment Plant Upgrades-10%
1 Public Outreach-5%
1 Rehabilitation Mains-5%
(N.B. Total ≠ 100% due to multiple
strategies)
***Lo, S. CDWI, 2013-14***

A Proposed Lead Corrosion Control Plan: A Review of Potential Health Impacts from the addition of phosphate Chemical Inhibitors in the Drinking Water Treatment Process, Marie McKeary, Researcher, McMaster Institute for Healthier Environments, McMaster University for Hamilton Public Health Services, 2015
Pag
e- 6
0 -
Aaronson, J.E. et.al., (2000). Elevated blood lead levels among internationally adopted children -
United States, 1998. Journal of the American Medical Association. 283 (11): 1416-1418.
Advisory Committee on Childhood Lead Poisoning Prevention (ACCLPP) (2012). Low Level
Lead Exposure Harms Children: A Renewed Call for Primary Prevention. Report of the
Advisory Committee on Childhood Lead Poisoning Prevention of the Centers for Disease
Control and Prevention, January. Retrieved from:
http://www.cdc.gov/nceh/lead/ACCLPP/Final_DDocument_030712.pdf
American Association of Pediatrics (2005). Lead Exposure in Children: Prevention, Detection,
and Management. Pediatrics.116:1036 – 1047.
American Water Works Association (2015) Lead. Retrieved from:
http://water.epa.gov/drink/info/lead/lead1.cfm.
Archbold, J. & K. Bassil (2014). Health Impacts of Lead in Drinking Water. Toronto Public
Health Services, Health Technical Report, 416.338.7600, August. Retrieved from:
http://www1.toronto.ca/City%20Of%20Toronto/Toronto%20Public%20Health/Healthy%20Publ
ic%20Policy/Report%20Library/PDF%20Reports%20Repository/Technical%20Report%20Healt
h%20Impact%20of%20Lead%20in%20DW%202014_8_Final.pdf
Ashley, K. et. al., (2011). A brief history of phosphorus: From the philosopher’s stone to
nutrient recovery and reuse. Chemosphere. 84:737-746.
Barn, P. & T. Kosatsky (2011). Lead in school drinking water: Canada can and should address
this important ongoing exposure source. Canadian Public Health Association. 102(2):118-121.
Barn, P. et. al., (2014). Investigation elevated copper and lead levels in school drinking water.
Environ. Health Rev. 56(4):96-02.
Bellinger, D.C. (2008). Lead Neurotoxicity and Socioeconomic Status: Conceptual and
Analytical Issues. Neurotoxicology. 29(5): 828-832.
Benini, O. et. al., (2011). Extra-Phosphate Load From Food Additives in Commonly Eaten
Foods: A Real and Insidious Danger for Renal Patients. Journal of Renal Nutrition, 21(4):303-
308, July.
Board of Health Information Report (2008) (BOH07049 (a)/PW 08036) Lead Water Service
Pipes, Information Report, Dr. Elizabeth Richardson (MOH), Hamilton Public Health Services &
Scott Stewart (GM), Public Works Department, March 17.
Britton, A. & W.N. Richards (1981) Factors Influencing Plumbosolvency in
Scotland. J. Inst. Water Engrs. and Scientists. 35(5):349-364.
A Proposed Lead Corrosion Control Plan: A Review of Potential Health Impacts from the addition of phosphate Chemical Inhibitors in the Drinking Water Treatment Process, Marie McKeary, Researcher, McMaster Institute for Healthier Environments, McMaster University for Hamilton Public Health Services, 2015
Pag
e- 6
1 -
BIBLIOGRAPHY (CONTINUED)
Brown, M.J. & S. Margolis (2012). Lead in drinking water and human blood lead levels in the
United States. Centres for Disease Control and Prevention. Morbidity and Mortality Weekly
Report. Supplement 61, August 10.
Bushnik, T. et. al., (2010). Lead and bisphenol A concentrations in the Canadian population.
Statistics Canada. Retrieved from: http://www.statcan.gc.ca/pub/82-003-
x/2010003/article/11324/findings-resultats-eng.htm
Canadian Council of Ministers of the Environment (CCME) (1991). Appendix IX— A protocol
for the derivation of water quality guidelines for the protection of aquatic life. In: Canadian water
quality guidelines, Canadian Council of Resource and Environment Ministers, 1987. Prepared by
the Task Force on Water Quality Guidelines.
Canadian Council of Ministers of the Environment (CCME) (2004). Canadian water quality
guidelines for the protection of aquatic life: Phosphorus In: Canadian environmental quality
guidelines, Canadian Council of Ministers of the Environment, Winnipeg. Retrieved from:
http://ceqg-rcqe.ccme.ca/download/en/205.
Canfield, R.L. et. al., (2003). Intellectual impairment in children with blood lead concentrations
below 10 micro per deciliter. New Engl J Med. 348:1517-26.
Cantor, A.F., et. al., (2000). Use of polyphosphate in corrosion control. Journal of AWWA,
February:95-102.
Cardew, P. T. (2000). Simulation of lead compliance data. Water Res. 34(8):2241–2252.
Cardew, P. T. (2003). A method for assessing the effect of water quality changes on
plumbosolvency using random daytime sampling. Water Res. 37:2821–2832.
Cardew, P. T. (2009). The impact of ortho-phosphate treatment on lead in drinking water in
North West of England. Proceedings of International Conference, COST Action 637, October
2008, Lisbon.
Cardew, P. T. (2009). Measuring the benefits of orthophosphate treatment on lead in drinking
water. Journal of Water and Health, 7(1):23-131.
Cardew, P. (2009) Measuring the Benefit of Orthophosphate Treatment on Lead in Drinking
Water. J. Water Health, 7 (1):123–131

A Proposed Lead Corrosion Control Plan: A Review of Potential Health Impacts from the addition of phosphate Chemical Inhibitors in the Drinking Water Treatment Process, Marie McKeary, Researcher, McMaster Institute for Healthier Environments, McMaster University for Hamilton Public Health Services, 2015
Pag
e- 6
2 -
BIBLIOGRAPHY (CONTINUED)
Center for Disease Control and Prevention (CDC) (2010). Guidelines for the Identification and
Management of Lead Exposure in Pregnant and Lactating Women. Centre for Disease Control
and Prevention Atlanta, GA. Retrieved from:
http://www.cdc.gov/nceh/lead/publications/leadandpregnancy2010.pdf
Center for Disease Control and Prevention (CDC) (2012). CDC Response to Advisory
Committee on Childhood Lead Poisoning Prevention Recommendations in “Low Level Lead
Exposure Harms Children: A Renewed Call of Primary Prevention”. Centre for Disease Control
and Prevention Atlanta, GA. Retrieved from:
http://www.cdc.gov/nceh/lead/acclpp/cdc_response_lead_exposure_recs.pdf
Chambers, P.A. et. al., (2001) Nutrients and their impact on the Canadian environment.
Agriculture and Agri-Food Canada, Environment Canada, Fisheries and Oceans Canada, Health
Canada and Natural Resources Canada. 241 p.
Chartered Institution of Water and Environmental Management (CIWEM) (2012). Policy
Position on Lead in Drinking Water. July. Retrieved from: http://www.ciwem.org/policy-and-
international/policy-position-statments/lead -in-drinking-water.aspx.
Childers, D. L. et al., (2011). Sustainability of Phosphorous and Food: Solutions from Closing
the Human Phosphorous Cycle. BioScience. 61(2):117–124.
City of Chicago Water Supply Website (2014) Retrieved from:
http://www.cityofchicago.org/city/en/depts/water/supp_info/education/water_treatment.html.
Clement, J. et al. (1998). Analyses and Interpretation of the Physical, Chemical, and Biological
Characteristics of Distribution System Pipe Scales. In Proceedings of the Water Quality
Technology Conference. AWWA. Denver, CO.
Comber, S. et.al., (2011). Phosphate treatment to reduce plumbosolvency of drinking water also
reduces discharges of copper into environmental surface waters. Water and Environment
Journal, 25:266-270.
Commission of the European Communities (EC).( 2002) Draft Revised Technical Guidance
Document in Support of Commission Directive 93/67/EEC on Risk Assessment for New
Notified Substances and Commission Regulation (EC) No. 1488/94 on Risk Assessment for
Existing Substances. Part II: Environment. Office for Official Publications of the European
Communities, Luxembourg.

A Proposed Lead Corrosion Control Plan: A Review of Potential Health Impacts from the addition of phosphate Chemical Inhibitors in the Drinking Water Treatment Process, Marie McKeary, Researcher, McMaster Institute for Healthier Environments, McMaster University for Hamilton Public Health Services, 2015
Pag
e- 6
3 -
BIBLIOGRAPHY (CONTINUED)
Cordell, D. (2010) The Story of Phosphorus : Sustainability implications of global phosphorus
scarcity for food security. Doctoral Dissertation, Linköping University, The Tema Institute,
Department of Water and Environmental Studies. Linköping University, Faculty of Arts and
Sciences. Sweden. Retrieved from: http://www.diva-
portal.org/smash/record.jsf?pid=diva2%3A291760&dswid=5791
Croll, B. T. (2000) Applying science to the optimisation of plumbosolvency control. Proceedings
of a Technical Seminar on Lead in Drinking Water, 3-8, CIWEM, London, 1st December.
COST Action 637 (2007) Proceedings of an International Conference on Metals and Related
Substances in Drinking Water, Antalya, Turkey, 24–26 October. Retrieved from:
www.meteau.org
COST Action 637 (2008). Research Plans: A review of copper, lead and nickel in drinking water,
Research Seminar: 29 April 2008, Brussels. Retrieved from:
www.meteau.org/conferences/29_04_08_Research
Davidson, C. M. et.al., (2004). Surface analysis and depth profiling of corrosion products formed
in lead pipes used to supply low alkalinity drinking water. Water Sci. Technol. 49(2):49–54.
D.C. Water (2014) Frequently Asked Questions(FAQ): Corrosion Control. District of Columbia
Water and Sewer Authority. District of Columbia, Washington, D. C. Retrieved from:
http://www.dcwater.com/waterquality/corrosion_control.cfm
Del Toral, M. A. et. al., (2013). Detection and evaluation of elevated lead release from service
lines: a field study. Environmental Science and Technology, dx.doi.org/10.1021/es40036361.
District of Columbia Water and Sewer Authority.
Retrieved November 25, 2014 http://www.dcwater.com/waterquality/corrosion_control.cfm
Drinking Water Inspectorate (2010). Guidance on the implementation of the Water Supply
(Water Quality) Regulations 2000 (as amended) in England, September.
Dodrill, D.M. & M. Edwards (1995). Corrosion Control on the Basis of Utility
Experience.” Jour. AWWA. 87:74.
Droste, R. L. (1997). Theory and Practice of Water and Wastewater Treatment, John
Wiley and Sons, Inc.

A Proposed Lead Corrosion Control Plan: A Review of Potential Health Impacts from the addition of phosphate Chemical Inhibitors in the Drinking Water Treatment Process, Marie McKeary, Researcher, McMaster Institute for Healthier Environments, McMaster University for Hamilton Public Health Services, 2015
Pag
e- 6
4 -
BIBLIOGRAPHY (CONTINUED)
Duthil, J.P. et.al., (1996). The Synergetic Effect of Chloride and Sulphate on Pitting Corrosion of
Copper. Corrosion Science, 38 (10):1839–1849.
Edwards, M. et.al., (2002). Phosphate Inhibition of Soluble Copper Corrosion By-Product
Release. Corros. Sci., 44:1057–1071.
Edwards, Marc & D. Abhijeet (2004). Role of Chlorine and Chloramine in
Corrosion of Lead-Bearing Plumbing Materials. Journal AWWA. 96(10): 69-81, October.
Edwards, M. (2014). Fetal death and reduced birth rates associated with exposure to lead-
contaminated drinking water. Environmental Science and Technology. 48:739-446.
Eisenberg, K.W., (2011). Blood Lead Levels of Refugee Children Resettled in Massachusetts,
2000 to 2007. American Journal of Public Health. 101(1): 485-454.
Environment Canada (EC) (2004). Canadian guidance framework for the management of
phosphorus in freshwater systems. Scientific Supporting Document. National Guidelines and
Standards Office, Water Policy and Coordination Directorate, Environment Canada, Ottawa,
ON. Retrieved from: http://ceqg-rcqe.ccme.ca/download/en/205
Environment Canada (EC) (2010) Water: Shared Responsibility. Retrieved from:
http://www.ec.gc.ca/eau-eater/default.asp?lang=En&n=035F6173-1
Estes-Smarigiasi, S. and A. Cantor (2006). Lead Service Line Contributions to Lead
Levels at the Tap. Presented at AWWA Water Quality Technology Conference.
Denver, CO. November.
European Council (1998). Council Directive 98/83/EC of the 3rd November 1998 on the quality
of water intended for human consumption, Official Journal of the European Communities.
Gilbert, S. G. & B. Weiss (2006.) A rationale for lowering the blood lead action level from 10 to
2mg/L. Neurotoxicology 27:693–701.
Gilbert, Natasha (2009) The Disappearing Nutrient. Nature 461:716-718, October 8.
Gregory R. (1985). Galvanic Corrosion of Lead and Copper Pipework: Phase I,
Measurement of Galvanic Corrosion Potential in Selected Waters. Water Research
Centre Engineering, Swindon, England
Hayes, C. R. et. al., (2006). Optimisation of plumbosolvency control using a computational
model. Water and Environment Journal, 20: 256-264.
Hayes, C. R. et. al., (2008). Experience in Wales (UK) of the optimisation of orthophosphate
dosing for controlling lead in drinking water. Journal of Water and Health 6(2): 177-185.

A Proposed Lead Corrosion Control Plan: A Review of Potential Health Impacts from the addition of phosphate Chemical Inhibitors in the Drinking Water Treatment Process, Marie McKeary, Researcher, McMaster Institute for Healthier Environments, McMaster University for Hamilton Public Health Services, 2015
Pag
e- 6
5 -
BIBLIOGRAPHY (CONTINUED)
Hayes, C. R. & N.D. Skubala (2009). Is there still a problem with lead in drinking water in the
European Union? Journal of Water and Health 7(4):569-580.
Hayes, C. R. (2009). Computational modelling to investigate the sampling of lead in drinking
water. Water Research 43:2647-2656.
Hayes, C. (2010). Best Practice Guide on the Control of Lead in Drinking Water. International
Water Association (IWA). ISBN 10: 1843393697 and 13: 9781843393696
Hayes, C. & E. J. Hoskstra ( 2010). Technical Digest on Lead in Drinking Water. Joint Research
Centre, Institute for Health and Consumer Protection, European Commission. EUR 24265 EN
2010.
Hayes, C. R. & O.D. Hydes (2012). UK experience in the monitoring and control of lead in
drinking water. Journal of Water and Health 10(3): 337-348.
Hayes, C. R. & T.N. Croft (2013). Optimisation of corrosion control for lead in drinking water
using computational modelling techniques. IWA Research Report Series. ISBN 9781780404783.
Hayes, C. R. & T.N. Croft (2014). Optimisation of plumbosolvency control using computational
modelling techniques: a demonstration project for the Government of Alberta, working with the
City of Calgary and EPCOR (Edmonton). February, Government of Alberta.
Hayes, C. (2014). FAQ on Lead and Corrosion Control. WQM Associates, U.K. Retrieved
from: http://www.minimizelead.com/frequently-asked-questions/
Health Canada (2008.) Copper. Environmental and Workplace Safety. Retrieved from:
http://www.hc-sc.gc.ca/ewh-semt/pubs/water-eau/copper-cuivre/index-eng.php
Health Canada (2009). Lead Information Package: Some Commonly Asked Questions about
Lead and Human Health. Retrieved from: http://www.hc-sc.gc.ca/ewh-semt/contaminants/lead-
plomb/asked_questions-questions_posees-eng.php.
Health Canada (2009). Guidance on Controlling Corrosion in Drinking Water Distribution
Systems. Water, Air and Climate Change Bureau, Healthy Environments and Consumer Safety
Branch, Health Canada, Ottawa, Ontario. (Catalogue No. H128-1/09-595E). June. ISBN: 978-1-
100-14193-0

A Proposed Lead Corrosion Control Plan: A Review of Potential Health Impacts from the addition of phosphate Chemical Inhibitors in the Drinking Water Treatment Process, Marie McKeary, Researcher, McMaster Institute for Healthier Environments, McMaster University for Hamilton Public Health Services, 2015
Pag
e- 6
6 -
BIBLIOGRAPHY (CONTINUED)
Health Canada (2013a). Final Human Health State of the Science Report on Lead. February.
Retrieved from: http://www.hc-sc.gc.ca/ewh-semt/alt_formats/pdf/pubs/contaminants/dhhssrl-
rpecscepsh/dhhssrl-rpecscepsh-eng.pdf
Health Canada (2013b). Second Report on Human Biomonitoring of Environmental Chemicals
in Canada. April, Retrieved from: www.healthcanada.gc.ca/biomonitoring.
Health Canada ( 2013c). Risk Management Strategy for Lead. February, Retrieved from:
http://www.hc-sc.gc.ca/ewh-semt/alt_formats/pdf/pubs/contaminants/prms_lead-
psgr_plomb/prms_lead-psgr_plomb-eng.pdf
Health Canada, (2014.) Minimizing Exposure to Lead from Drinking Water Distribution
Systems WATERTALK. http://www.hc-sc.gc.ca/ewh-semt/alt_formats/hecs-sesc/pdf/pubs/water-
eau/lead-plomb-eng.pdf
Heckenmüller, M. et.al., (2014.) Global availability of phosphorous and its implications for
global food supply: An economic overview. Kiel Working Paper, No. 1897, October 3.
Retrieved from: www.econstor.eu.
Hoekstra, E. J. et. al., (2008). The advice of the Ad-Hoc Working Group on Sampling and
Monitoring to the Standing Committee on Drinking Water concerning sampling and monitoring
for the revision of the Council Directive 98/83/EC. European Commission Joint Research
Centre, EUR 23374 EN - 2008.
Hong, P.K.A. & Y. Macauley (1998). Corrosion and Leaching of Copper Tubing Exposed to
Chlorinated Drinking Water. Water Air Soil Poll., 108:457–471.
Horne, A.J. & C.R. Goldman (1994). Limnology Second Edition. McGraw Hill Inc., New York.
pp. 576.
International Water Association (IWA) (2010a). Best Practice Guide on the Control of Lead in
Drinking Water. IWA Publishing. ISBN 9781843393696.
International Water Association (2010b). Guide for Small Community Water Suppliers and
Local Health Officials on Lead in Drinking Water. Editor, IWA Publishing. ISBN 13
9781843393801.
International Water Association (IWA) Code of Practice on Internal Corrosion Control (2012)
ISBN 9781780404547 and 9781780404554.

A Proposed Lead Corrosion Control Plan: A Review of Potential Health Impacts from the addition of phosphate Chemical Inhibitors in the Drinking Water Treatment Process, Marie McKeary, Researcher, McMaster Institute for Healthier Environments, McMaster University for Hamilton Public Health Services, 2015
Pag
e- 6
7 -
BIBLIOGRAPHY (CONTINUED)
Jackson, P.J. (2003). Demonstration of Optimisation of Plumbosolvency Treatment and Control
Measures. Final Report to the Drinking Water Inspectorate. Report No: DWI 6173.
Kalantar-Zadeh, K. et. al., (2010). Understanding Sources of Dietary Phosphorus in the
Treatment of Patients with Chronic Kidney Disease. Clin J Am Soc Nephrol, 5:519-530.King,
Dave (2015) Personal Consultation, Safe Water Program Specialist, Hamilton Public Health
Services, HPHS, Hamilton, Ontario.
Kirmeyer, G.J.; B. Murphy; A. Sandvig; G. Korshin; B. Shaha; M. Fabricino; G.
Burlingame. 2004. Post-Optimization Lead and Copper Control Monitoring
Strategies. Awwa Research Foundation. Denver. CO.
Klitzman, S. et.al., (2002). Lead poisoning among pregnant women in New York City: Risk
factors and screening practices. Journal of Urban Health. 79 (2): 225-237.
Korshin, G.V., J. F. Ferguson, & A. N. Lancaster (2000) Influence of natural organic matter on
the corrosion of leaded brass in potable water. Corrosion Sci . 42:53-66.
Korshin, G. V. et. al., (2005). Influence of natural organic matter on the morphology of
corroding lead surfaces and behavior of lead-containing particles. Water Res. 39:811–818.
Lanphear, B. et. al., (2000) Cognitive deficits associated with blood lead concentrations <10
μg/dl in U.S. children and adolescents. Public Health Reports 115:521-9.
Levallois, P. et. al., (2014). The impact of drinking water, indoor dust and paint on blood lead
levels of children aged 1-5 years in Montreal (Quebec Canada). Journal of Exposure Science and
Environmental Epidemiology. 24:185-191.
Letterman, R.D. & Kathari, S., 1996. “A Computer Program for the Design of
Limestone Contactors.” Jour. NEWWA, 110:1:42.
Letterman, R.D., 1995. Calcium Carbonate Dissolution Rate in Limestone
Contactors, Research and Development Report, EPA/600/SR-95/068, Risk
Reduction Engineering Laboratory, Cincinnati, OH.
Letterman, R.D., Driscoll, C.T., Haddad, M., and Hsu, H.A., 1986. Limestone Bed
Contactors for Control of Corrosion at Small Water Utilities. USEPA 600/S2-86/099

A Proposed Lead Corrosion Control Plan: A Review of Potential Health Impacts from the addition of phosphate Chemical Inhibitors in the Drinking Water Treatment Process, Marie McKeary, Researcher, McMaster Institute for Healthier Environments, McMaster University for Hamilton Public Health Services, 2015
Pag
e- 6
8 -
BIBLIOGRAPHY (CONTINUED)
Letterman, R.D., Haddad, M. & Driscoll, C.T., Jr., 1991. “Limestone Contactors:
Steady State Design Relationships.” Jour. Envir. Engrg. Div.- ASCE. 117:3:339.
Ministry of Environment. 2008. Design Guidelines for Drinking-Water Systems. PIBs
6881e. Toronto, ON.
Lo, Susan (2013-14) CDWI, Ministry of Environment and Climate Change, Annual Report of
Chief Drinking Water Inspector (CDWI) 2013-14, Ontario, Canada. Retrieved from:
http://www.ontario.ca/document/chief-drinking-water-inspector-annual-report-2013-2014-0
Maas, R. P. et. al., (2005). Reducing Lead Exposure from Drinking Water: Recent History and
Current Status. Public Health Reports, 120, May-June.
Ministry of the Environment (MOE) (2009) Guidance Document for Corrosion Control Planning
Final Report. Queen’s Printer for Ontario, December 14. Retrieved from:
https://dr6j45jk9xcmk.cloudfront.net/documents/1542/4-1a-19-corrosion-control-en.pdf
Ministry of Health and Long Term Care (MOHLTC) (2002) Public Health. Retrieved from:
http://www.health.gov.on.ca/english/public/program/pubhealth/public_mn.html
Moore, M. R. et. al., (1985). Successful abatement of lead exposure from water supplies in the
West of Scotland. Environ. Res. 38:67–76.
Moore, M. R. et. al., (1998). Decline of maternal blood lead concentrations in Glasgow.
J. Epidemiol. Community Health. 52:672–673.
Moore, M. (2001). Chlorine’s Effect on Corrosion in Drinking Water Systems. Midwest
Technology Assistance Center (MTAC), Small Public Water Systems National Drinking Water
Clearinghouse, West Virginia University, WV.
Mountain Empire Community College (MECC) (2014), Water/Wastewater Distance Learning
Website, Virginia, USA. Retrieved from: http://water.me.vccs.edu/exam_prep/phosphates.html.
National Toxicology Program Monograph (NTP) (2012). Health Effects of Low Levels of Lead.
National Toxicology Program, US Department of Health and Human Services. June, Retrieved
from: http://ntp.niehs.nih.gov/pubhealth/hat/noms/lead/index.html.
North Carolina State University (NCSU) (2015) Water Sheds – Phosphorous. Water Quality
Group. Retrieved from: http://www.water.ncsu.edu/watershedss/info/phos.html
Ontario Safe Drinking Water Act, 2002, S.O. 2002, c. 32. Retrieved from:
http://www.ene.gov.on.ca/environment/en/legislation/safe_drinking_water_act/index.htm

A Proposed Lead Corrosion Control Plan: A Review of Potential Health Impacts from the addition of phosphate Chemical Inhibitors in the Drinking Water Treatment Process, Marie McKeary, Researcher, McMaster Institute for Healthier Environments, McMaster University for Hamilton Public Health Services, 2015
Pag
e- 6
9 -
BIBLIOGRAPHY (CONTINUED)
Packham, R. F. (1971). The leaching of toxic stabilisers from unplasticised lead PVC water pipe:
part II: a survey of lead levels in UPVC distribution systems. J. Water Treat.Examination
20:144–151
Pfadenhauer, L.M. et. al., (2014). A protocol for the systematic review of the effectiveness of
interventions to reduce exposure to lead through consumer products and drinking water.
Systematic Reviews. 3:36. Retrieved from: www.systematicreviewsjournal.com/content/3/1/36
Rego, C.A. & M.R. Schock (2007). Case Studies in the Integrated Use of Scale
Analyses to Solve Lead Problems. In Proceedings of Distribution System Research
Symposium. AWWA. Denver, CO.
Richardson, E. et. al., (2011). North Hamilton Child Blood Lead Study. Public Health Report,
Hamilton Public Health Services. September, Retrieved from:
http://www.hamilton.ca/NR/rdonlyres/DEA93613-C59A-496C-B62C-
AFE10A215CEC/0/BLStudy_PHReport_FinalCompiledEDITED_CLEAN_09162011_Highres.
Richmond Hill Committee of the Whole (2014) City of Toronto – Water Distribution System
CCP, Maintenance and Operations Division, May 5. Retrieved from:
http://www.richmondhill.ca/documents/meetings/cow/5_5_2014_16_30/Item%2010%20-
%20City%20of%20Toronto%20-
%20Water%20Distribution%20System%20Corrosion%20Control%20Plan.pdf
Rhode Island Department of Health (2011) Effect of partial lead service line replacement on total
lead at the tap. Office of Drinking Water Quality, April 2011.
Sandvig, A. et. al., (2008). Contribution of Service Line and Plumbing Fixtures to Lead and
Copper Rule Compliance Issues. Awwa Research Foundation. Denver, CO.
Schock, M.R. (1980). Response of Lead Solubility to Dissolved Carbonate in Drinking Water.
J. Am. Water Works Assoc., 72 (12):695–704.
Schock, M.R. (1989). Understanding Control Strategies for Lead. J. Am. Water Works Assoc., 81
(7):88–100.
Schock, M.R. (1990). Causes of temporal variability of lead in domestic plumbing
systems. Environ Monitoring and Assessment. 15(1):59–82.

A Proposed Lead Corrosion Control Plan: A Review of Potential Health Impacts from the addition of phosphate Chemical Inhibitors in the Drinking Water Treatment Process, Marie McKeary, Researcher, McMaster Institute for Healthier Environments, McMaster University for Hamilton Public Health Services, 2015
Pag
e- 7
0 -
BIBLIOGRAPHY (CONTINUED)
Schock, M. R. et. al., (1996) Corrosion and solubility of lead in drinking water. In Internal
Corrosion of Water Distribution Systems. American Water Works Association and American
Water Works Research Foundation. Denver, CO.
Schock, M.R. (1999). Internal Corrosion and Deposition Control. in Water Quality
and Treatment, 5th Edition. Ed. R. Letterman. McGraw-Hill Inc., NY,NY.
Schock, M.R. (2005). Lead Chemistry Basics, Scale Formation, and Corrosion
Control Treatment. Presented at April 13, 2005 Virginia Section AWWA, Richmond,
Sheiham, I. & P.J. Jackson (1981). The Scientific Basis for Control of Lead in
Drinking Water by Water Treatment. J. Inst. Water Engrs. and Scientists. 35 (6):491-515.
Stumm, W. & J. J. Morgan (1996). Aquatic Chemistry: Chemical Equilibria and Rates in Natural
Waters, 3rd edition. JohnWiley & Sons, Inc., New York.
Tehranifar, P. (2008). Immigration and Risk of Childhood Lead Poisoning: Findings From a
Case-Control Study in New York City Children. American Journal of Public Health. 98 (1): 92-
97.
Toronto Medical Officer of Health (TMOH) (2014) Health Impacts of the City of Toronto's Lead
in Drinking Water Mitigation Strategy. Toronto Public Health Staff Report, July 31.
Retrieved from: http://www.toronto.ca/legdocs/mmis/2014/hl/bgrd/backgroundfile-72536.pdf.
Triantafyllidou, S. & M. Edwards (2012). Lead (Pb) in tap water and in blood: Implications for
lead exposure in the United States. Critical Reviews in Environmental Science and Technology.
42(13):1297-1352.
Troesken, W. (2006). The Great Lead Water Pipe Disaster. MIT Press, Cambridge,
Massachusetts.
UK Water Industry Research (UKWIR). (2008). Investigations into the Occurrence of Water
Supply Zones that Demonstrate Resistance to Phosphate Dosing for the Control of Lead in
Drinking Water (08/DW/04/10). UK Water Industry Research, St James, London, UK.
U. S. Environmental Protection Agency (EPA) (1993) Actions You Can Take To Reduce Lead
In Drinking Water. EPA 810-F-93-00, June. Retrieved from:
http://water.epa.gov/drink/info/lead/lead1.cfm. Update:
http://water.epa.gov/drink/info/lead/lead1.cfm
U.S. Environmental Protection Agency (EPA) (2000). Federal Register: January 12, 2000. 40
CFR Parts 9, 141, and 142. National Primary Drinking Water Regulations for Lead and Copper;
Final Rule.

A Proposed Lead Corrosion Control Plan: A Review of Potential Health Impacts from the addition of phosphate Chemical Inhibitors in the Drinking Water Treatment Process, Marie McKeary, Researcher, McMaster Institute for Healthier Environments, McMaster University for Hamilton Public Health Services, 2015
Pag
e- 7
1 -
BIBLIOGRAPHY (CONTINUED)
US Environmental Protection Agency (EPA) (2004) Lead in DC Drinking Water. Technical
Expert Working Group (TEWG-EPA). Retrieved from:
http://www.epa.gov/dclead/treatment_news.htm#news
US Environmental Protection Agency (EPA) (2007). Elevated Lead in D.C. Drinking Water – A
Study of Potential Causative Events, Final Summary Report. Office of Water. EPA 815-R-07-
021.
U.S. Environmental Protection Agency (EPA) (2011). Drinking Water Committee Augmented
for the Review of the Effectiveness of Partial Lead Service Line Replacements. US
Environmental Protection Agency, Science Advisory Board. Retrieved from:
http://yosemite.epa.gov/sab%5Csabproduct.nsf/964CCDB94F4E6216852579190072606F/$File/
EPA-SAB-11-015-unsigned.pdf
U.S. Environmental Protection Agency (EPA) (2012) Water Monitoring and Assessment 5.6
Phosphorous. Retrieved from http://water.epa.gov/type/rsl/monitoring/vms56.cfm
U.S. Environmental Protection Agency (EPA) (2013). Integrated Science Assessment for Lead.
National Center for Environmental Assessment-RTP Division Office of Research and
Development, U.S. Environmental Protection Agency, Research Triangle Park, NC. Retrieved
from: http://cfpub.epa.gov/ncea/isa/recordisplay.cfm?deid=255721#Download
U. S. Environmental Protection Agency (EPA) (2014).Drinking Water. Retrieved from:
http://www.epa.gov/dclead/treatment_news.htm#news
U. S. Environmental Protection Agency (EPA) (2015). Health Concerns regarding Lead and
Copper. Retrieved from:
http://safewater.supportportal.com/ics/support/KBList.asp?folderID=2290
Vaccari, D. A. (2009). Phosphorous Famine: The Threat to Our Food Supply. Scientific
American Magazine, June 3.
Van den Hoven, T. J. et.al., (1999). Developing a new protocol for the monitoring of lead in
drinking water. EUR 19087.
Van Dongen, C. et. al., (2008). Central conditioning and lead pipe removal in the drinking water
supply of the Hague. Proceedings of the International Conference on Metals and Related
Substances in Drinking Water, Antalya, Turkey, 29-31 October 2007. COST Action 637.
Van Dongen, C. et. al., (2007). Central conditioning and lead pipe removal in the drinking water
supply of the Hague. Proceedings of an International Conference on Metals and Related
Substances in Drinking Water, Antalya, Turkey, 29–31 October 2007. COST Action 637.

A Proposed Lead Corrosion Control Plan: A Review of Potential Health Impacts from the addition of phosphate Chemical Inhibitors in the Drinking Water Treatment Process, Marie McKeary, Researcher, McMaster Institute for Healthier Environments, McMaster University for Hamilton Public Health Services, 2015
Pag
e- 7
2 -
BIBLIOGRAPHY (CONTINUED)
Walker, R. & R. Oliphant (1982). Contamination of potable water from lead-based solders.
Anti-Corrosion 29:13–15.
Wetzel, R.G. (2001). Limnology. Academic Press, New York. pp. 1006.
World Health Organization (2010). Booklet on Childhood Lead Poisoning. ISBN 978 924
150033 3.
World Health Organization (WHO) (2010). Childhood Lead Poisoning. World Health
Organization. Retrieved from: http://www.who.int/ceh/publications/leadguidance.pdf
World Health Organization (WHO) (2010). Lead in Drinking Water – Background Document for
World Health Organization (2010). Development of WHO Guidelines for Drinking water
Quality. Geneva: World Health Organization. Retrieved from:
http://www.who.int/water_sanitation_health/WHS_WWD2010_guidelines_2010_6_en.pdf?ua=1
World Health Organization (2011). Guidelines for Drinking Water Quality. 4th
Edition. ISBN
978 924 1548151.

A Proposed Lead Corrosion Control Plan: A Review of Potential Health Impacts from the addition of phosphate Chemical Inhibitors in the Drinking Water Treatment Process, Marie McKeary, Researcher, McMaster Institute for Healthier Environments, McMaster University for Hamilton Public Health Services, 2015
Pag
e- 7
3 -
Archbold, J. & K. Bassil (2014). Health Impacts of Lead in Drinking Water. Toronto Public
Health Services, Health Technical Report, 416.338.7600, August.
Abstract
The report summarizes the most recent state of the evidence with regards to the health impact of
lead exposure on the human body, in particular with regards to prenatal health and childhood.
Comprehensive reviews on lead have been recently conducted by the National Toxicity
Program (NTP, 2012), Health Canada (Health Canada, 2013a), and the US EPA (US EPA,
2013). The research is consistent and it is now well documented that there are adverse health
effects from exposure to lead. Lead adversely affects those that are most vulnerable in our
society: infants, children and pregnant women, racialized individuals, newcomers, and
individuals experiencing low income and poor nutrition (Health Canada, 2013a; WHO, 2010).
The documented health effects have been associated with blood lead levels as low as 1-2 μg/dL
(Health Canada, 2013a); levels which are currently present in Canadians. Subsequently, the
position taken by Health Canada and supported by Public Health is a reduction of current levels
is warranted. Our exposure to lead is sourced from a number of different mediums. However, it
is now proven that drinking water is considered to be an important source of exposure to lead
occurring whenever lead service lines or other lead-bearing materials are present in the plumbing
system. Thus, the Public Health position is to direct their efforts to eliminating and reducing the
remaining exposure before it occurs, including the need to reduce lead concentrations in drinking
water as much as possible.
Brown, R. A. et.al, (2013). Strategies for assessing optimized corrosion control treatment of
lead and copper. American Water Works Association Journal (AWWA), Vol. 105:5, May.
Abstract
Three strategies are commonly used to optimize corrosion control: adjusting PH and alkalinity;
developing Pb (1V) scale by maintaining free chlorine residuals throughout the distribution
system, and applying orthophosphate-based corrosions inhibitors at appropriate dosages and pH
ranges.

A Proposed Lead Corrosion Control Plan: A Review of Potential Health Impacts from the addition of phosphate Chemical Inhibitors in the Drinking Water Treatment Process, Marie McKeary, Researcher, McMaster Institute for Healthier Environments, McMaster University for Hamilton Public Health Services, 2015
Pag
e- 7
4 -
Annotated Bibliography of Key References
(continued)
Cardew, P. T. (2009). Measuring the benefits of orthophosphate treatment on lead in drinking
water. Journal of Water and Health.,7(1):123-131.
Abstract
Many water companies are adding low concentrations of orthophosphate to the water supply in
order to reduce lead concentrations in drinking water produced from corrosion of lead service
pipes. Despite the erratic nature of lead concentrations measured at customer properties it has
been possible to quantify the impact of treatment on lead concentrations and thereby quantify the
effectiveness of treatment at both a regional and zonal level. This showed that the treatment
policy has delivered more than 90 per cent reduction in lead concentrations, and was largely in
accordance with theory. Across the region, lead performance and the reduction in lead
performance show significant variation. A large part of this variation can be accounted for by
variations in the proportion of leaded properties supplied through lead service pipes. Analysis
showed that the proportion of particulate lead has also reduced significantly over the last decade.
This is attributed to improved mechanical robustness of the corrosion layer caused by changes in
its physical structure. This appears to be a very slow process with a natural time-scale of years.
Cartier, Clement, et.al., (2012). Effect of Flow Rate and Lead/Copper Pipe Sequence on Lead
Release from Service Lines. Water Research, 46(13):4142-4152, September.
Abstract
A pilot experiment examined lead leaching from four representative configurations of service
lines including: (1) 100% lead (Pb), (2) 100% copper (Cu), (3) 50% Pb upstream of 50% Cu, and
(4) 50% Pb-downstream of 50% Cu using a range of flow rates. The cumulative mass of lead
release indicated that a typical partial replacement configuration (50% lead downstream of
copper) did not provide a net reduction in lead when compared to 100% lead pipe (85 mg for
50% Pb-downstream versus 83 mg for 100%-Pb) due to galvanic and deposition corrosion. The
partially replaced service line configuration also had a much greater likelihood of producing
water with "spikes" of lead particulates at higher flow rates, while tending to produce lower
levels of lead at very low flow rates. After the first 214 days the galvanic current between copper
and lead was only reduced by 34%, proving that galvanic impacts can be highly persistent even
in water with optimized corrosion control by dosing of zinc orthophosphate. Finally, this
experiment raises concern about the low flow rates used during some prior home sampling
events, which may underestimate exposure to lead during normal water use, especially when
galvanic Pb:Cu connections are present.

A Proposed Lead Corrosion Control Plan: A Review of Potential Health Impacts from the addition of phosphate Chemical Inhibitors in the Drinking Water Treatment Process, Marie McKeary, Researcher, McMaster Institute for Healthier Environments, McMaster University for Hamilton Public Health Services, 2015
Pag
e- 7
5 -
Annotated Bibliography of Key References
(continued)
Cartier, Clement, et. al., (2013). Impact of treatment on Pb release from full and partially
replaced harvested Lead Service Lines (LSLs). Water Research, 47(2):661-671, February 1.
Abstract
Release of lead from 80% partially replaced service lines was compared to full lead service lines
using harvested–stabilized lead pipes and field brass connectors. After more than a year of
stabilization, lead release was consistent with field samples. Over the relatively short duration
partial replacement of lead pipe by copper pipe (3 months), generated high lead release,
attributed to galvanic corrosion, resulting in a final outcome for lead release that was even worse
than for a full lead pipe. Increased lead release was especially evident at higher flow rates.
Orthophosphate reduced lead release from full lead pipes by 64%. For partially replaced samples
with copper, lead concentrations were unchanged by phosphate dosing at moderate flow (103 ±
265 vs 169 ± 349 μg/L) and were increased to very high levels when sampled at high flow rates
(1001 ± 1808 vs 257 ± 224 μg/L). The increase lead release was in the form of particulate lead
(>90%). In comparison to the condition without treatment, increased sulfate treatment had little
impact on lead release from 100%-Pb rigs but reduced lead release from partially replaced lead
pipes with copper. Our results also raise questions concerning protocols based on short 30 min
stagnation (as those used in Canada) due to their incapacity to consider particulate lead release
generated mostly after longer stagnation.
Cartier, Clement, et. al., (2012). Impact of water treatment on the contribution of faucets to
dissolved and particulate lead release at the tap. Water Research, 46(16):5205-5216, October 15.
Abstract
A field study was performed in a building complex to investigate the extent and sources of lead
(Pb) release in tap water and brass material was found to be the main contributor in the very first
draw (250 mL). Based on these results, a pilot installation was built to study Pb leaching from
old and new faucets in the presence and absence of a connection to Cu piping. Four water quality
conditions were tested: i) no treatment; ii) addition of 0.8 mg P/L of orthophosphate; iii) pH
adjustment to 8.4; and iv) adjustment to a higher chloride to sulfate mass ratio (CSMR; ratio
from 0.3 to 2.9). Pb concentrations in samples taken from the faucets without treatment ranged
from 1 to 52 μg/L, with a mean of 11 μg/L. The addition of orthophosphate @ 0.8 mg P/L
(OrthoP) was the most effective treatment for all types of faucets tested. On average, OrthoP
reduced mean Pb leaching by 41%, and was especially effective for new double faucets (70%).
In the presence of orthophosphates, the relative proportion of particulate Pb (Pbpart) (>0.45 μm)
increased from 31% to 54%. However, OrthoP was not efficient to reduce Zn release. The higher
CSMR condition was associated with greater dezincification of yellow brass but not of red brass.
Corrosion control treatment influenced Pb concentration equilibrium, directly impacting
maximal exposure. Significantly higher Pb release (3 fold) was observed for 1 of the 8 faucets
connected to Cu exposed to high CSMR water, suggesting the presence of galvanic corrosion.

A Proposed Lead Corrosion Control Plan: A Review of Potential Health Impacts from the addition of phosphate Chemical Inhibitors in the Drinking Water Treatment Process, Marie McKeary, Researcher, McMaster Institute for Healthier Environments, McMaster University for Hamilton Public Health Services, 2015
Pag
e- 7
6 -
Annotated Bibliography of Key References
(continued)
Clark, Brandi, et. al., (2014). Profile Sampling To Characterize Particulate Lead Risks in
Potable Water. Environmental Science and Technology, 48 (12):6836–6843.
Abstract
Traditional lead (Pb) profiling, or collecting sequential liters of water that flow from a consumer
tap after a stagnation event, has recently received widespread use in understanding sources of Pb
in drinking water and risks to consumer health, but has limitations in quantifying particulate Pb
risks. A new profiling protocol was developed in which a series of traditional profiles are
collected from the same tap at escalating flow rates. The results revealed marked differences in
risks of Pb exposure from one consumer home to another as a function of flow rate, with homes
grouped into four risk categories with differing flushing requirements and public education to
protect consumers. On average, Pb concentrations detected in water at high flow without
stagnation were at least three to four times higher than in first draw samples collected at low
flow with stagnation, demonstrating a new “worst case” lead release scenario, contrary to the
original regulatory assumption that stagnant, first draw samples contain the highest lead
concentrations. Testing also revealed that in some cases water samples with visible particulates
had much higher Pb than samples without visible particulates, and tests of different sample
handling protocols confirmed that some EPA-allowed methods would not quantify as much as
99.9% of the Pb actually present (avg. 27% of Pb not quantified).
Comber, S. et.al., (2011). Phosphate treatment to reduce plumbosolvency of drinking water also
reduces discharges of copper into environmental surface waters, Water and Environment
Journal, 25:266-270.
Abstract
The majority of drinking water supply zones in the United Kingdom are currently dosed with
phosphate in order to meet the drinking water quality standards for lead. Consequent reductions
in other metals released from domestic plumbing might be expected. Lead, copper, zinc and
nickel concentrations in the tap water of supply zones and in effluents from related sewage
works were examined to assess reductions in the concentrations of these metals associated with
the dosing of orthophosphate. This paper provides an analysis of the impact of phosphate dosing
of drinking water on the metal concentrations in drinking water and sewage work effluents and
the potential impacts in relation to the Water Framework Directive. Phosphate treatment reduced
the average copper concentrations in drinking water by around 40% from 65 to 35 mg/L; the
reduction is proportional to the phosphate dose. A corresponding 30% decrease in wastewater
treatment work effluent concentrations is observed. No significant changes are evident in the
zinc and nickel concentrations.

A Proposed Lead Corrosion Control Plan: A Review of Potential Health Impacts from the addition of phosphate Chemical Inhibitors in the Drinking Water Treatment Process, Marie McKeary, Researcher, McMaster Institute for Healthier Environments, McMaster University for Hamilton Public Health Services, 2015
Pag
e- 7
7 -
Annotated Bibliography of Key References
(continued)
Del Toral, M. A., et. al., (2013). Detection and Evaluation of Elevated Lead Release from
Service Lines: A Field Study. Environmental Science and Technology, 47(16): 9300-9307.
Abstract
Comparative stagnation sampling conducted in 32 homes in Chicago, Illinois with lead service
lines demonstrated that the existing regulatory sampling protocol under the U.S. Lead and
Copper Rule systematically misses the high lead levels and potential human exposure. Lead
levels measured with sequential sampling were highest within the lead service lines, with
maximum values more than four times higher than Chicago’s regulatory compliance results
using a first-draw sampling protocol. There was significant variability in lead values from
different points within individual lead service lines and among different lead service line sites
across the city. Although other factors could also influence lead levels, the highest lead results
most often were associated with sites having known disturbances to the lead service lines. This
study underscores the importance and interdependence of sample site selection, sampling
protocol, and other factors in assessing lead levels in a public water system
Hayes, C. R. & O. D. Hydes (2012). UK experience in the monitoring and control of lead in
drinking water. Journal of Water and Health, 10(3):337-348.
Abstract
At the zonal scale (e.g. a city or town), random daytime (RDT) sampling succeeded in
demonstrating both the need for corrective action and the benefits of optimised orthophosphate
dosing for plumbosolvency control, despite initial concerns about sampling reproducibility.
Stagnation sampling techniques were found to be less successful. Optimised treatment measures
to minimise lead in drinking water, comprising orthophosphate at an optimum dose and at an
appropriate pH, have succeeded in raising compliance with the future European Union (EU) lead
standard of 10 μg/L from 80.4% in 1989–94 to 99.0% in 2010 across England and Wales, with
compliance greater than 99.5% in some regions. There may be scope to achieve 99.8%
compliance with 10 μg/L by further optimisation coupled to selective lead pipe removal, without
widespread lead pipe removal. It is unlikely that optimised corrosion control, that includes the
dosing of orthophosphate, will be capable of achieving a standard much lower than 10 μg/L for
lead in drinking water. The experience gained in the UK provides an important reference for any
other country or region that is considering its options for minimising lead in their drinking water
supplies.

A Proposed Lead Corrosion Control Plan: A Review of Potential Health Impacts from the addition of phosphate Chemical Inhibitors in the Drinking Water Treatment Process, Marie McKeary, Researcher, McMaster Institute for Healthier Environments, McMaster University for Hamilton Public Health Services, 2015
Pag
e- 7
8 -
Annotated Bibliography of Key References
(continued)
Hayes, C. R. & N. D. Skubala (2009). Is there still a problem with lead in drinking water
in the European Union? Journal of Water and Health, 7(4).
Abstract
The presence of lead in drinking water poses a range of risks to human health, including the
retardation of some aspects of child development, the inducement of abortion, and other clinical
disorders. The extent of these risks has not been quantified at the European Union (EU) scale. A
number of sampling methods are in use across the EU, some of which are inadequate for
determining the concentrations of lead in drinking water at consumers’ taps. In consequence,
non-compliance with the EU standards for lead in drinking water has been under-estimated.
Emerging data indicates significant non-compliance with these standards in some countries,
particularly with the 10 mg l21 standard that will become a legal requirement in 2013; the
current interim standard of 25mg l21 is also exceeded in some locations. An initial estimate is
that 25% of domestic dwellings in the EU have a lead pipe, either as a connection to the water
main, or as part of the internal plumbing, or both, potentially putting 120 million people at risk
from lead in drinking water within the EU. These issues are relevant to the implementation of the
Protocol on Water and Health and to drinking water safety planning.
Hayes, C. R. et.al., (2014). Computational modelling techniques in the optimization of corrosion
control for reducing lead in Canadian drinking water. Water Quality Research Journal of
Canada, 49(1).
Abstract
Compliance modelling has been used to good effect in the optimization of plumbosolvency
control in the UK and was evaluated in the Canadian and US contexts via three case studies. In
relation to regulatory compliance, supplementary orthophosphate dosing could be justified in one
water supply system but not in one other. Compliance modelling indicated that Health Canada’s
Tier 1 protocol is much less stringent than its Tier 2 protocol and that optimization based on 6þ
hour stagnation samples vs 15 μg/l is likely to be more stringent than that based on 30 min
stagnation samples vs 10 μg/l. The modelling of sequential sampling for an individual home
indicated that sample results could be markedly affected by the length of the lead service line, by
the length of the copper premise pipe and by pipe diameters. The results for sequential sampling
were also dependent on flow characteristics (plug vs laminar). For either regulatory compliance
assessment or for the optimization of plumbosolvency control measures, routine sequential
sampling from the same houses at a normalized flow will minimize these variable effects.

A Proposed Lead Corrosion Control Plan: A Review of Potential Health Impacts from the addition of phosphate Chemical Inhibitors in the Drinking Water Treatment Process, Marie McKeary, Researcher, McMaster Institute for Healthier Environments, McMaster University for Hamilton Public Health Services, 2015
Pag
e- 7
9 -
Annotated Bibliography of Key References
(continued)
Hsieh, Ming-Kai, et. al., (2010). Alternative Makeup Water for Cooling Tower Systems. Water
Environment Research, 82(12):2346-2356(11), December.
Abstract
Secondary treated municipal wastewater is a promising alternative to fresh water as power plant
cooling water system makeup water, especially in arid regions. Laboratory and field testing was
conducted in this study to evaluate the corrosiveness of secondary treated municipal wastewater
for various metals and metal alloys in cooling systems. Different corrosion control strategies
were evaluated based on varied chemical treatment. Orthophosphate, which is abundant in
secondary treated municipal wastewater, contributed to more than 80% precipitative removal of
phosphorous-based corrosion inhibitors. Tolyltriazole worked effectively to reduce corrosion of
copper (greater than 95% inhibition effectiveness). The corrosion rate of mild steel in the
presence of free chlorine 1 mg/L (as Cl2) was approximately 50% higher than in the presence of
monochloramine 1 mg/L (as Cl2), indicating that monochloramine is a less corrosive biocide than
free chlorine. The scaling layers observed on the metal alloys contributed to corrosion inhibition,
which could be seen by comparing the mild steel 21-day average corrosion rate with the last 5-
day average corrosion rate, the latter being approximately 50% lower than the former.
Maas, R. P. et. al., (2005). Reducing Lead Exposure from Drinking Water: Recent History and
Current Status. Special Report On Lead Poisoning in Children. Public Health Reports, 120,
May-June.
Abstract
This article discusses the issue of lead contamination of drinking water, noting the various
regulatory-driven measures that have been adopted in the U.S. since 1986 to address this public
health issue. The article summarizes the literature on the dynamics of tap water lead
contamination and discusses this widespread source of lead exposure in the context of the latest
research evidence.

A Proposed Lead Corrosion Control Plan: A Review of Potential Health Impacts from the addition of phosphate Chemical Inhibitors in the Drinking Water Treatment Process, Marie McKeary, Researcher, McMaster Institute for Healthier Environments, McMaster University for Hamilton Public Health Services, 2015
Pag
e- 8
0 -
Annotated Bibliography of Key References
(continued)
Pfadenhauer, L.M. et.al., (2014). A protocol for a systematic review of the effectiveness of
interventions to reduce exposure to lead through consumer products and drinking water.
Systematic Reviews, 3(36).
Abstract
Background: The toxic heavy metal lead continues to be a leading environmental risk factor,
with the number of attributable deaths having doubled between 1990 and 2010. Although major
sources of lead exposure, in particular lead in petrol, have been significantly reduced in recent
decades, lead is still used in a wide range of processes and objects, with developing countries
disproportionally affected. The objective of this systematic review is to assess the
effectiveness of regulatory, environmental and educational interventions for reducing blood lead
levels and associated health outcomes in children, pregnant women and the general population.
Methods/design: The databases MEDLINE, Embase and the Global Health Library (GHL) will
be searched using a sensitive search strategy. Studies in English, German, French, Spanish,
Italian or Afrikaans will be screened according to predefined inclusion and exclusion criteria. We
will consider randomized and non-randomized studies accepted by the Cochrane Effective
Practice and Organization of Care (EPOC) Group, as well as additional non-randomized studies.
Screening of titles and abstracts will be performed by one author. Full texts of potentially
relevant studies will be independently assessed for eligibility by two authors. A single author
will extract data, with a second reviewer checking the extraction form. Risk of bias will be
assessed by two researchers using the Graphical Appraisal Tool for Epidemiological studies, as
modified by the Centre for Public Health at the UK National Institute for Health and Care
Excellence. Any inconsistencies in the assessment of eligibility, data extraction or quality
appraisal will be resolved through discussion. Where two or more studies report the primary
outcome blood lead levels within the same population group, intervention category and source of
lead exposure, data will be pooled using random effects meta-analysis. In parallel, harvest plots
as a graphical method of evidence synthesis will be used to present findings for blood lead levels
and secondary outcomes.
Discussion: This systematic review will fill an important evidence gap with respect to the
effectiveness of interventions to reduce lead in consumer products and drinking water in the
context of new WHO guidelines for the prevention and management of lead poisoning. It will
also contribute to setting a future research agenda.

A Proposed Lead Corrosion Control Plan: A Review of Potential Health Impacts from the addition of phosphate Chemical Inhibitors in the Drinking Water Treatment Process, Marie McKeary, Researcher, McMaster Institute for Healthier Environments, McMaster University for Hamilton Public Health Services, 2015
Pag
e- 8
1 -
Annotated Bibliography of Key References
(continued)
Tam, Y. S. and P. Elefsiniotis. (2009). Corrosion control in water supply systems: Effect of
pH, alkalinity, and orthophosphate on lead and copper leaching from brass plumbing. Journal of
Environmental Science and Health, Part A: Toxic/Hazardous Substances and Environmental
Engineering . 44(12):1251-1260.
Abstract
This study explored the potential of lead and copper leaching from brass plumbing in the
Auckland region of New Zealand. A five-month field investigation, at six representative
locations, indicated that Auckland's water can be characterized as soft and potentially corrosive,
having low alkalinity and hardness levels and a moderately alkaline pH. More than 90% of the
unflushed samples contained lead above the maximum acceptable value (MAV) of 10 μg/L (New
Zealand Standards). In contrast, the copper level of unflushed samples remained consistently
below the corresponding MAV of 2 mg/L. Flushing however reduced sharply metal
concentrations, with lead values well below the MAV limit. Generally, metal leaching patterns
showed a limited degree of correlation with the variations in temperature, dissolved oxygen and
free chlorine residual at all sampling locations. Furthermore, a series of bench-scale experiments
was conducted to evaluate the effectiveness of pH and alkalinity adjustment, as well as
orthophosphate addition as corrosion control tools regarding lead and copper dissolution. Results
demonstrated that lead and copper leaching was predominant during the first 24 hr of stagnation,
but reached an equilibrium state afterwards. Since the soluble fraction of both metals was small
(12% for lead, 29% for copper), it is apparent that the non-soluble compounds play a
predominant role in the dissolution process. The degree of leaching however was largely affected
by the variations in pH and alkalinity. At pH around neutrality, an increase in alkalinity
promoted metal dissolution, while at pH 9.0 the effect of alkalinity on leaching was marginal.
Lastly, addition of orthophosphate as a corrosion inhibitor was more effective at pH 7.5 or
higher, resulting in approximately 70% reduction in both lead and copper concentrations.
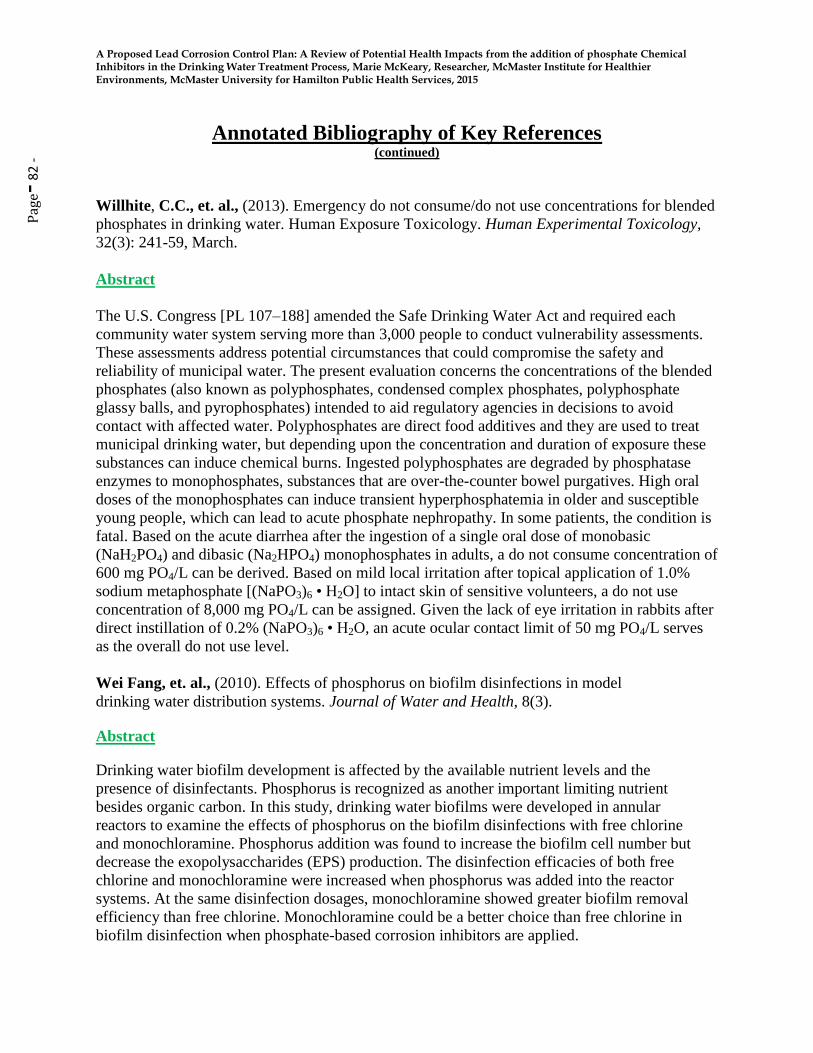
A Proposed Lead Corrosion Control Plan: A Review of Potential Health Impacts from the addition of phosphate Chemical Inhibitors in the Drinking Water Treatment Process, Marie McKeary, Researcher, McMaster Institute for Healthier Environments, McMaster University for Hamilton Public Health Services, 2015
Pag
e- 8
2 -
Annotated Bibliography of Key References (continued)
Willhite, C.C., et. al., (2013). Emergency do not consume/do not use concentrations for blended
phosphates in drinking water. Human Exposure Toxicology. Human Experimental Toxicology,
32(3): 241-59, March.
Abstract
The U.S. Congress [PL 107–188] amended the Safe Drinking Water Act and required each
community water system serving more than 3,000 people to conduct vulnerability assessments.
These assessments address potential circumstances that could compromise the safety and
reliability of municipal water. The present evaluation concerns the concentrations of the blended
phosphates (also known as polyphosphates, condensed complex phosphates, polyphosphate
glassy balls, and pyrophosphates) intended to aid regulatory agencies in decisions to avoid
contact with affected water. Polyphosphates are direct food additives and they are used to treat
municipal drinking water, but depending upon the concentration and duration of exposure these
substances can induce chemical burns. Ingested polyphosphates are degraded by phosphatase
enzymes to monophosphates, substances that are over-the-counter bowel purgatives. High oral
doses of the monophosphates can induce transient hyperphosphatemia in older and susceptible
young people, which can lead to acute phosphate nephropathy. In some patients, the condition is
fatal. Based on the acute diarrhea after the ingestion of a single oral dose of monobasic
(NaH2PO4) and dibasic (Na2HPO4) monophosphates in adults, a do not consume concentration of
600 mg PO4/L can be derived. Based on mild local irritation after topical application of 1.0%
sodium metaphosphate [(NaPO3)6 • H2O] to intact skin of sensitive volunteers, a do not use
concentration of 8,000 mg PO4/L can be assigned. Given the lack of eye irritation in rabbits after
direct instillation of 0.2% (NaPO3)6 • H2O, an acute ocular contact limit of 50 mg PO4/L serves
as the overall do not use level.
Wei Fang, et. al., (2010). Effects of phosphorus on biofilm disinfections in model
drinking water distribution systems. Journal of Water and Health, 8(3).
Abstract
Drinking water biofilm development is affected by the available nutrient levels and the
presence of disinfectants. Phosphorus is recognized as another important limiting nutrient
besides organic carbon. In this study, drinking water biofilms were developed in annular
reactors to examine the effects of phosphorus on the biofilm disinfections with free chlorine
and monochloramine. Phosphorus addition was found to increase the biofilm cell number but
decrease the exopolysaccharides (EPS) production. The disinfection efficacies of both free
chlorine and monochloramine were increased when phosphorus was added into the reactor
systems. At the same disinfection dosages, monochloramine showed greater biofilm removal
efficiency than free chlorine. Monochloramine could be a better choice than free chlorine in
biofilm disinfection when phosphate-based corrosion inhibitors are applied.

A Proposed Lead Corrosion Control Plan: A Review of Potential Health Impacts from the addition of phosphate Chemical Inhibitors in the Drinking Water Treatment Process, Marie McKeary, Researcher, McMaster Institute for Healthier Environments, McMaster University for Hamilton Public Health Services, 2015
Pag
e- 8
3 -
Health Impacts on Children from Lead Exposure
Edwards M, et.al., (2007). Elevated blood lead in Washington D.C. children from lead
contaminated drinking water: 2001-2004. Environ. Sci. Technol. 43(5):1618-1623.
Edwards M. (2014). Fetal death and reduced birth rates associated with exposure to lead-
contaminated drinking water. Environmental Science and Technology. 48:739-446.
Eisenberg, K.W. et.al., (2011). Blood Lead Levels of Refugee Children Resettled in
Massachusetts, 2000 to 2007. American Journal of Public Health. 101(1): 485-454.
Klitzman, S., et. al., (2002). Lead poisoning among pregnant women in New York City: Risk
factors and screening practices. Journal of Urban Health. 79 (2): 225-237.
Wu, S. (2008). Immigration and Risk of Childhood Lead Poisoning: Findings From a Case-
Control Study in New York City Children. American Journal of Public Health. 98 (1): 92-97.
WHO. (2010). Childhood Lead Poisoning. World Health Organization. Retrieved from:
http://www.who.int/ceh/publications/leadguidance.pdf.
Lead, Drinking Water and Health
Hayes, C. & E. J. Hoskstra. (2010). Technical Digest on Lead in Drinking Water. Joint Research
Centre, Institute for Health and Consumer Protection, European Commission. EUR 24265 EN
2010
NTP. (2012). NTP Monograph. Health Effects of Low Levels of Lead. National Toxicology
Program. US Department of Health and Human Services. June 13, 2012. Retrieved from:
http://ntp.niehs.nih.gov/pubhealth/hat/noms/lead/index.html
Pfadenhauer, L.M. et. al., (2014). A protocol for the systematic review of the effectiveness of
interventions to reduce exposure to lead through consumer products and drinking water.
Systematic Reviews. 3:36. Retrieved from: www.systematicreviewsjournal.com/content/3/1/36

A Proposed Lead Corrosion Control Plan: A Review of Potential Health Impacts from the addition of phosphate Chemical Inhibitors in the Drinking Water Treatment Process, Marie McKeary, Researcher, McMaster Institute for Healthier Environments, McMaster University for Hamilton Public Health Services, 2015
Pag
e- 8
4 -
Lead, Drinking Water and Health (Continued)
Triantafyllidou, S. & M. Edwards. (2012). Lead (Pb) in tap water and in blood: Implications for
lead exposure in the United States. Critical Reviews in Environmental Science and Technology.
42(13):1297-1352.
Canadian Studies on Blood Lead
Lavallois, P. et. al., (2014). The impact of drinking water, indoor dust and paint on blood lead
levels of children aged 1-5 years in Montreal (Quebec Canada). Journal of Exposure Science and
Environmental Epidemiology. 24:185-191.
Richardson, E. et. al., (2011). North Hamilton Child Blood Lead Study. Public Health Report.
Hamilton Public Health Services. September.
Legislation
Ontario Safe Drinking Water Act (2002). S.O. 2002, c. 32. Retrieved from:
http://www.ene.gov.on.ca/environment/en/legislation/safe_drinking_water_act/index.htm
U.S. E.P.A. (2000). Federal Register: January 12, 2000. 40 CFR Parts 9, 141, and 142. National
Primary Drinking Water Regulations for Lead and Copper; Final Rule.
U.S. E.P.A. S.A.B. (2011). Drinking Water Committee Augmented for the Review of the
Effectiveness of Partial Lead Service Line Replacements. US Environmental Protection Agency.
Science Advisory Board. Retrieved from: www.epa/gov/sab.
U.S. E.P.A. (2013). Integrated Science Assessment for Lead. National Center for Environmental
Assessment-RTP Division Office of Research and Development U.S. Environmental Protection
Agency, Research Triangle Park, NC. Retrieved from:
http://cfpub.epa.gov/ncea/isa/recordisplay.cfm?deid=255721#Download
World Health Organization (WHO). (2011). Lead in Drinking Water – Background Document
for Development of WHO Guidelines for Drinking water Quality. Geneva: World Health
Organization.