Embed Size (px)
Citation preview

UNIVERSITY OF THE PHILIPPINESCENTER FOR INTEGRATIVE AND DEVELOPMENT STUDIES
“A Proposed Approach to Federalization:
The Natural Region Framework”
Dr. Edna E.A. Co
Dr. Jose M. Regunay | Primer Pagunuran
Michael Eric Castillo | Rainier Tolentino
Alfred Marx Garcia | Ruben Jeffrey Asuncion

UNIVERSITY OF THE PHILIPPINESCENTER FOR INTEGRATIVE AND DEVELOPMENT STUDIES
Outline of the presentation
Premises
Questions
Realities
Federalization and Decentralization
Observations and Lessons from Other Countries
Proposals
Conclusions

UNIVERSITY OF THE PHILIPPINESCENTER FOR INTEGRATIVE AND DEVELOPMENT STUDIES
PREMISES: Poverty persists
Poverty incidence among Filipinos in
2015 was estimated at 21.6 percent.
The poverty incidence among
Filipino families based on 2015
FIES was estimated at 16.5
percent in 2015.

UNIVERSITY OF THE PHILIPPINESCENTER FOR INTEGRATIVE AND DEVELOPMENT STUDIES
PREMISES: Poverty persists
Educational
Attainment of Heads
of Poor Households

UNIVERSITY OF THE PHILIPPINESCENTER FOR INTEGRATIVE AND DEVELOPMENT STUDIES
PREMISES FOR THE SHIFT: Inequality and underdevelopment
are pronounced.
Income growth of the richest Filipinos—top 10 percent of the
income bracket—is 11.35 times more than what the poorest, or the
bottom 10 percent

UNIVERSITY OF THE PHILIPPINESCENTER FOR INTEGRATIVE AND DEVELOPMENT STUDIES
PREMISES FOR THE SHIFT
Spread of development across region is uneven, as
demonstrated by contribution to National Gross
Domestic Product

UNIVERSITY OF THE PHILIPPINESCENTER FOR INTEGRATIVE AND DEVELOPMENT STUDIES
PREMISES FOR THE SHIFT

UNIVERSITY OF THE PHILIPPINESCENTER FOR INTEGRATIVE AND DEVELOPMENT STUDIES
PREMISES FOR THE SHIFT

UNIVERSITY OF THE PHILIPPINESCENTER FOR INTEGRATIVE AND DEVELOPMENT STUDIES
QUESTIONS
How do we address poverty, inequality and
underdevelopment?
Is Federalism the answer?

UNIVERSITY OF THE PHILIPPINESCENTER FOR INTEGRATIVE AND DEVELOPMENT STUDIES
III. REALITIES
Philippines has a decentralized set-up for 25 years since 1991 (LGC).
But, Local Government Code only achieves patches of development
(islands of good governance) and poverty and inequality across income
class and regions were not reduced
System of accountability remains weak
LGU’s were not fully functional due to partial implementation of the LGC
E.g. Inter-LGU cooperation on development limited to “sisterhood”
arrangement

UNIVERSITY OF THE PHILIPPINESCENTER FOR INTEGRATIVE AND DEVELOPMENT STUDIES
III. REALITIES
Income generation potential of the LGUs not maximized due to national
government dominance in the ownership of Natural Resources
Local capacities and autonomy are limited particularly in areas of local finance
and taxing power
Decentralization leads to empowerment of some LGUs and dependency of
many others to National government
IRA formula is skewed and tends to engender culture of dependency
Local policies are still very much determined by the national government (E.g.
Bottom-Up Budgeting or BUB)

UNIVERSITY OF THE PHILIPPINESCENTER FOR INTEGRATIVE AND DEVELOPMENT STUDIES
Observations
Decentralization does not automatically translate to development
Decentralization has its own weakness and misgivings
Decentralization is not complete and fully functional enough to
lead to empowerment and autonomy

UNIVERSITY OF THE PHILIPPINESCENTER FOR INTEGRATIVE AND DEVELOPMENT STUDIES
Some typologies of federalism
1. Unilateral Federalism: Federal government, by and large,
directs provincial policy, usually through conditional funding.
2. Collaborative Federalism: Here the federal and provincial
governments work collaboratively to attain policy goals, and
there is no coercion on part of the federal government.
3. Cooperative Federalism: Regional governments delivers
services while Federal Government provides the regulatory
framework within which services shall be provided.

UNIVERSITY OF THE PHILIPPINESCENTER FOR INTEGRATIVE AND DEVELOPMENT STUDIES
FEDERALISM: Other countries
Reason for the shift
Germany
Strong leaders that ruled Germany led to wars, splitting the land into many different
countries was designed to prevent autocratic rule (Hitler)
Switzerland
Federalism was seen as a way to end over centralization, and as means to equitably share
powers and resources
Spain
People demanded for autonomous territories
Spain observes a flexible and open framework for decentralization.

UNIVERSITY OF THE PHILIPPINESCENTER FOR INTEGRATIVE AND DEVELOPMENT STUDIES
FEDERALISM: Other countries
Reason for the shift
Argentina
Federalism was seen as a system that could facilitate balanced contribution of
taxes
Australia
The states did not come together because of conflict. They decided to
federalize because of the basic need to protect the interests of each state.

UNIVERSITY OF THE PHILIPPINESCENTER FOR INTEGRATIVE AND DEVELOPMENT STUDIES
Observations and lessons from other countries that
adopt federalism
Fiscal Arrangements
Germany
There are special taxes levied by each level of the federation, corresponding respective
budgets for federal, state, and local.
There are common taxes like income and value-added taxes which are allocated to the
federal, state, and local levels.
Employs equalization payments which allow every Land to pay for its administration and
government services and to reduce differences in financial endowments of the Länder
Horizontal and vertical transfer payments between the states (lander); and between the
states and the Bund (Federal).

UNIVERSITY OF THE PHILIPPINESCENTER FOR INTEGRATIVE AND DEVELOPMENT STUDIES
Observations and lessons from other countries that
adopt federalism
Fiscal Arrangements:
India
There are taxes which the state collects and uses for itself
There are taxes that the center collects and uses for itself.
There are taxes which the center collects and shares to the state.
Formula decided by the Finance Commission

UNIVERSITY OF THE PHILIPPINESCENTER FOR INTEGRATIVE AND DEVELOPMENT STUDIES
Observations and lessons from other countries that adopt
federalism
Fiscal Arrangements:
Spain
Autonomous communities derive their resources from the following:
taxes wholly or partially assigned to them by statute, charges on State taxes,
and other shares in state taxes;
transfers from an inter-territorial clearing fund and other allocations to be
charged to the General State Budgets;
revenues accruing from their property and private law income; and yield from
credit operations.

UNIVERSITY OF THE PHILIPPINESCENTER FOR INTEGRATIVE AND DEVELOPMENT STUDIES
Observations and lessons from other countries that adopt
federalism
Fiscal Arrangements:
Spain
In Basque Country and Navarra, all taxes are collected by autonomous
governments.
Autonomous communities are prohibited from raising taxes that could hinder free
movement of goods and services.
Budget allocation to autonomous communities is made in proportion to the
volume of state services and state activities for which they have assumed
responsibility; to ensure basic public services available throughout the country.

UNIVERSITY OF THE PHILIPPINESCENTER FOR INTEGRATIVE AND DEVELOPMENT STUDIES
Observations and lessons from other countries that
adopt federalism
Fiscal Arrangements:
Argentina
Under the Federal Government are three types of taxes: customs duties, indirect
internal taxes, and direct taxes (under the exceptional power of the government).
Provinces deal with indirect internal taxes and direct taxes.
Follows objective sharing criteria for distribution. Equity and solidarity serve as
the system framework; equal opportunities are given priority nationwide.
Under Co-Participacion Federal, there are “[n]o transfer of jurisdictions, services
and functions without the corresponding reallocations of funds.”

UNIVERSITY OF THE PHILIPPINESCENTER FOR INTEGRATIVE AND DEVELOPMENT STUDIES
Observations and lessons from other countries that
adopt federalism
Division and Assignment of Powers
Argentina
Powers and authorities are at the various levels of government assigned by
enumeration
Switzerland
Lower House backs the government, and government depends on the Lower
House on legislative support
Lower House has oversight power over government, making it stronger than the
Upper House
UNIVERSITY OF THE PHILIPPINESCENTER FOR INTEGRATIVE AND DEVELOPMENT STUDIES
Observations and lessons from other countries that
adopt federalism
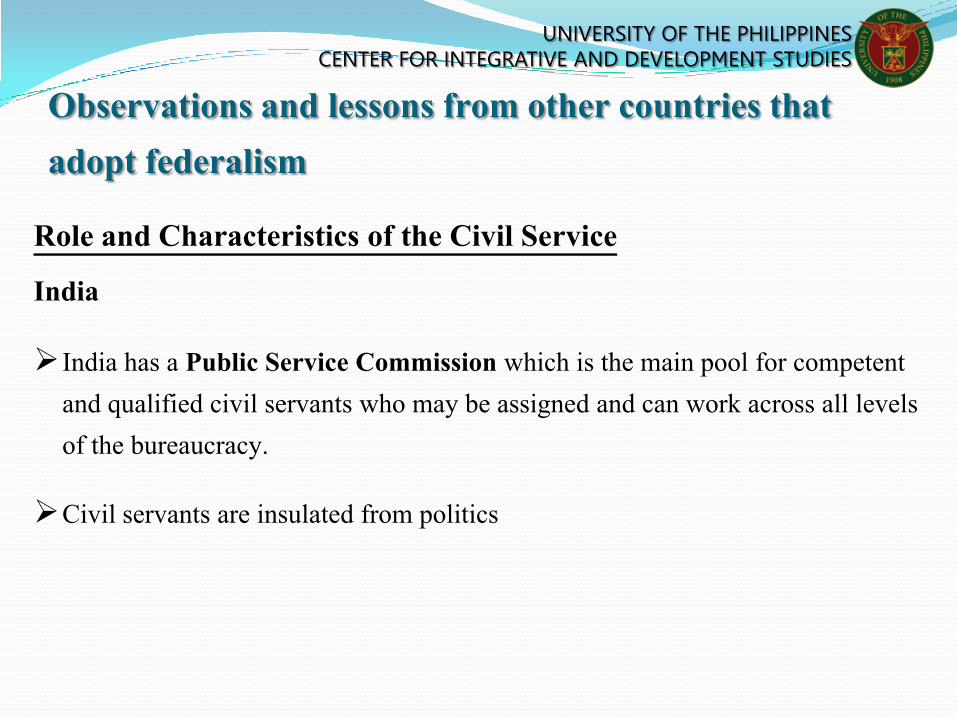
Role and Characteristics of the Civil Service
India
India has a Public Service Commission which is the main pool for competent
and qualified civil servants who may be assigned and can work across all levels
of the bureaucracy.
Civil servants are insulated from politics
UNIVERSITY OF THE PHILIPPINESCENTER FOR INTEGRATIVE AND DEVELOPMENT STUDIES
Observations and lessons from other countries that
adopt federalism
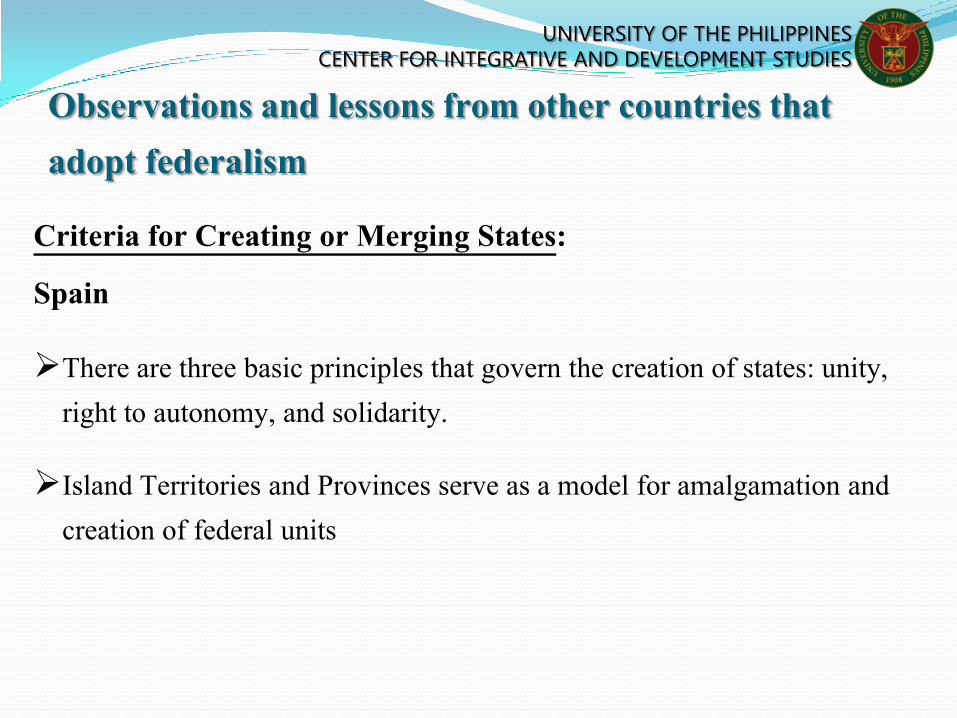
Criteria for Creating or Merging States:
Spain
There are three basic principles that govern the creation of states: unity,
right to autonomy, and solidarity.
Island Territories and Provinces serve as a model for amalgamation and
creation of federal units

UNIVERSITY OF THE PHILIPPINESCENTER FOR INTEGRATIVE AND DEVELOPMENT STUDIES
III. PROPOSALS
Two main groups in the Philippines propose a federal set up
characterized by:
Movement for Federal
Philippines
Corporatist Framework for LGU
Competitive
Grassroots Leadership
Kilos Pederal sa Pagbabago
Sharing of powers
Central Federal Government and Five
States
Basis: Economic viability

UNIVERSITY OF THE PHILIPPINESCENTER FOR INTEGRATIVE AND DEVELOPMENT STUDIES
IV. UP CIDS PROPOSAL: The Natural Region
(NR) Approach
A geographic unit delineated based on bio-physical criteria (e.g., land configuration, climate, vegetation).
Interchangeably referred to as “ecological region” or eco-region
Natural Region (NR)

UNIVERSITY OF THE PHILIPPINESCENTER FOR INTEGRATIVE AND DEVELOPMENT STUDIES
IV. PROPOSALS: Why NR?
Recognizes the country’s archipelagic configuration including the
spatial distribution of the diverse resource endowments and their
linkages with human community and well-being.
Facilitates delineation of regional boundaries; the legitimacy of
territorial delineation is less contentious.
Provides framework for resolving resource use conflicts and the
sustainable management of resources.

UNIVERSITY OF THE PHILIPPINESCENTER FOR INTEGRATIVE AND DEVELOPMENT STUDIES
IV. PROPOSALS: Why NR?
Provides the spatial framework to facilitate
amalgamation of LGU territories to resolve social and
economic problems and conflicts that cut across LGU
boundaries.
Facilitates urban-rural linkages and the hub and spokes
framework

UNIVERSITY OF THE PHILIPPINESCENTER FOR INTEGRATIVE AND DEVELOPMENT STUDIES
DELINEATING NATURAL REGIONS
Biogeographic Regions
Key Biodiversity Areas (KBAs)
EMBC

UNIVERSITY OF THE PHILIPPINESCENTER FOR INTEGRATIVE AND DEVELOPMENT STUDIES
DELINEATING NATURAL REGIONS
Major River Basins Water Resource Regions

UNIVERSITY OF THE PHILIPPINESCENTER FOR INTEGRATIVE AND DEVELOPMENT STUDIES
THE NATURAL REGIONS
Regions Area (ha) %
Northeast Luzon 4,013,787.40 13.50%
Northwest Luzon 1,118,631.36 3.76%
Central Luzon 2,726,036.96 9.17%
NCR 58,602.08 0.20%
Southern Tagalog 2,716,418.54 9.13%
Bicol 1,797,928.37 6.05%
Palawan 1,462,026.14 4.92%
East Visayas 2,496,961.37 8.40%
West Visayas 3,205,069.99 10.78%
East Mindanao 3,757,584.38 12.64%
Central Mindanao 4,328,830.50 14.56%
West Mindanao 2,056,006.75 6.91%
Total 29,737,883.84 100%

UNIVERSITY OF THE PHILIPPINESCENTER FOR INTEGRATIVE AND DEVELOPMENT STUDIES
Socio-economic Profile of Proposed Natural Regions
Population
Poverty
Literacy
Internal Revenue Allotment (IRA)
Revenue

UNIVERSITY OF THE PHILIPPINESCENTER FOR INTEGRATIVE AND DEVELOPMENT STUDIES
Natural RegionsPopulation
EstimatePopulation Rank
as of 2015
Source : Philippine Statistics Authority, Figures Recomputed by CIDS
1. NATIONAL CAPITAL REGION (NCR) 12,877,253 4th
2. NORTHWESTERN LUZON 2,310,562 11th
3. NORTHEASTERN LUZON 4,302,975 10th
4. CENTRAL LUZON 14,913,010 2nd
5. SOUTHERN TAGALOG 16,072,425 Biggest Population
6. BICOL 5,857,988 8th
7. PALAWAN 1,104,585 Smallest Population
8. WEST VISAYAS 13,912,502 3nd
9. EAST VISAYAS 5,753,710 9th
10. EAST MINDANAO 7,490,027 6th
11. CENTRAL MINDANAO 10,851,854 5th
12. West MINDANAO 5,793,534 7th

UNIVERSITY OF THE PHILIPPINESCENTER FOR INTEGRATIVE AND DEVELOPMENT STUDIES
Region/ProvinceIncome
Gap
Poverty
Gap
Severity of
PovertyNotes
NORTHWESTERN LUZON25.9 5.5 2.2
NORTHEASTERN LUZON27.8 7.1 2.8
CENTRAL LUZON24.4 4.0 1.5
NCR21.1 0.9 0.3
SOUTHERN TAGALOG25.2 4.2 1.7
BICOL26.7 8.6 3.3
Highest in Poverty Gap
PALAWAN 25.2 4.4 1.4
EAST VISAYAS30.3 11.0 4.8
WEST VISAYAS27.9 8.3 3.4
EAST MINDANAO24.1 7.3 2.9
CENTRAL MINDANAO33.6 15.0 7.0
Highest in Income Gap and Severity of Poverty
WEST MINDANAO24.7 8.1 3.0

UNIVERSITY OF THE PHILIPPINESCENTER FOR INTEGRATIVE AND DEVELOPMENT STUDIES
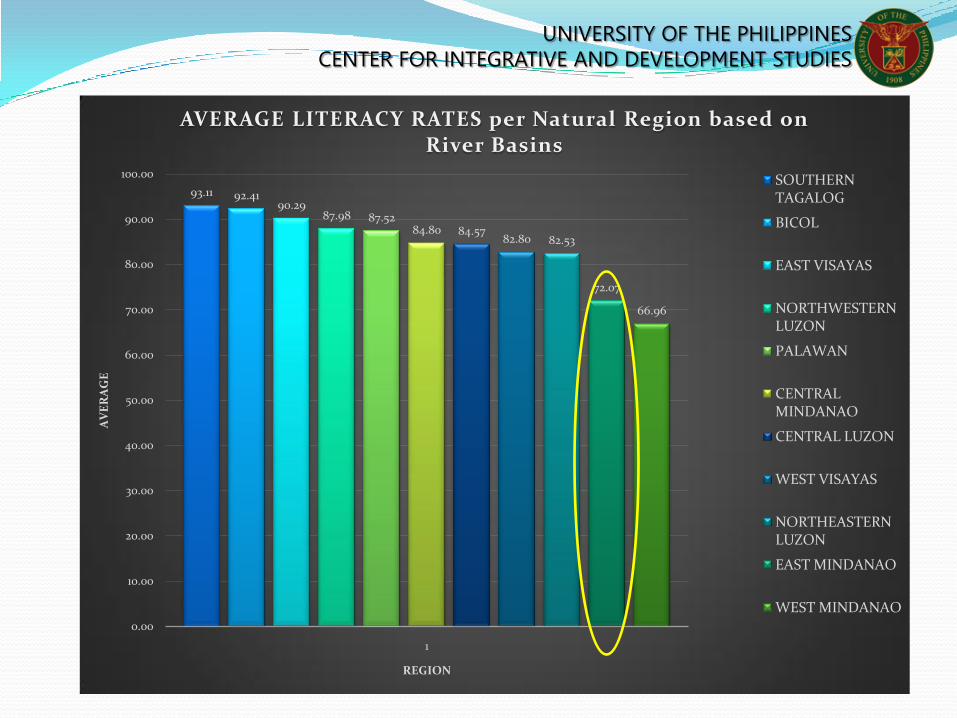
Natural Regions Average Percent
Literacy
Notes
1. NATIONAL CAPITAL REGION (NCR) NO DATA
2. NORTHWESTERN LUZON 87.98 No data for Ifugao
3. NORTHEASTERN LUZON 82.53
4. CENTRAL LUZON 82.38 No data for Tarlac
5. SOUTHERN TAGALOG 93.11
6. BICOL 92.41
7. PALAWAN 87.52
8. WEST VISAYAS 82.80 No Data for West Visayas
9. EAST VISAYAS 90.29
10. EAST MINDANAO 72.07
No data for Davao Occidental and Dinagat
Islands
11. CENTRAL MINDANAO 84.80
12. WEST MINDANAO 66.96 Lowest ; No data for Zamboanga Sibugay
UNIVERSITY OF THE PHILIPPINESCENTER FOR INTEGRATIVE AND DEVELOPMENT STUDIES
93.11 92.4190.29
87.98 87.5284.80 84.57
82.80 82.53
72.07
66.96
0.00
10.00
20.00
30.00
40.00
50.00
60.00
70.00
80.00
90.00
100.00
1
AV
ER
AG
E
REGION
AVERAGE LITERACY RATES per Natural Region based on River Basins
SOUTHERN TAGALOG
BICOL
EAST VISAYAS
NORTHWESTERN LUZON
PALAWAN
CENTRAL MINDANAO
CENTRAL LUZON
WEST VISAYAS
NORTHEASTERN LUZON
EAST MINDANAO
WEST MINDANAO

UNIVERSITY OF THE PHILIPPINESCENTER FOR INTEGRATIVE AND DEVELOPMENT STUDIES
48.3
44.3 43.9
41.2
31.8
25.9 25.823.6
20.819.3
11.7
7.2
0.0
10.0
20.0
30.0
40.0
50.0
60.0
1
IRA
(IN
BIL
LIO
N P
ES
OS
)
REGION
INTERNAL REVENUE ALLOTMENT per Natural Region Based on River Basins
WEST VISAYAS SOUTHERN TAGALOG CENTRAL LUZON CENTRAL MINDANAO
EAST MINDANAO NORTHEASTERN LUZON EAST VISAYAS WEST MINDANAO
BICOL NCR NORTHWESTERN LUZON PALAWAN

UNIVERSITY OF THE PHILIPPINESCENTER FOR INTEGRATIVE AND DEVELOPMENT STUDIES
Natural Regions 2014 (Full Year) Percent
share
2015 as of Third Qtr Percent
share
Notes
Amount (in billions)
TOTAL ESTIMATED REVENUE ₱1,335.17 ₱1,075.04
1. NATIONAL CAPITAL REGION
(NCR)
₱1,152.25 86.3% ₱920.01 85.58%
2. NORTHWESTERN LUZON ₱4.54 0.34% ₱3.78 0.35%
3. NORTHEASTERN LUZON ₱7.47 0.56% ₱6.39 0.59%
4. CENTRAL LUZON ₱37.21 2.79% ₱29.67 2.76%
5. SOUTHERN TAGALOG ₱43.83 3.28% ₱37.28 3.47%
6. BICOL ₱6.96 0.52% ₱5.73 0.53%
7 PALAWAN ₱1.81 0.14% ₱1.58 0.15%
8. WEST VISAYAS ₱36.59 2.74% ₱32.68 3.04%
9. EAST VISAYAS ₱6.81 0.51% ₱6.22 0.58%
10. EAST MINDANAO ₱16.23 1.22% ₱13.64 1.27%
11. CENTRAL MINDANAO ₱16.04 1.20% ₱13.38 1.24%
12. WEST MINDANAO ₱5.68 0.43% ₱4.68 0.44%

UNIVERSITY OF THE PHILIPPINESCENTER FOR INTEGRATIVE AND DEVELOPMENT STUDIES
920.01
37.28 32.68 29.6713.64 13.38 6.39 6.22 5.73 4.68 3.78 1.58
0.00
100.00
200.00
300.00
400.00
500.00
600.00
700.00
800.00
900.00
1000.00
1
AM
OU
NT
(IN
BIL
LIO
NS
)
REGION
REVENUE COLLECTIONS per Natural Region based on River Basins
(as of Third Quarter 2015)
NCR
SOUTHERN TAGALOG
WEST VISAYAS
CENTRAL LUZON
EAST MINDANAO
CENTRAL MINDANAO
NORTHEASTERN LUZON
EAST VISAYAS
BICOL
WEST MINDANAO
NORTHWESTERN LUZON
PALAWAN

UNIVERSITY OF THE PHILIPPINESCENTER FOR INTEGRATIVE AND DEVELOPMENT STUDIES
Pilot Case: Eastern Mindanao
10 Provinces 12 Cities
Agusan del Norte Butuan
Cabadbaran
Agusan del Sur Bayugan
Dinagat Island
Surigao del Norte Surigao
Surigao del Sur Tandag
Bislig
Compostela Valley
Davao del Norte Panabo
Samal
Tagum
Davao del Sur Davao City
Digos
Davao Occidental
Davao Oriental Mati
Eastern Mindanao
10 Provinces
12 Cities
110 Municipalities
2,473 Barangays

UNIVERSITY OF THE PHILIPPINESCENTER FOR INTEGRATIVE AND DEVELOPMENT STUDIES
Pilot Case: Eastern Mindanao
Land Area:
3,757,584.38 ha
12.6% of entire
country
Ranks 3rd
Forest Area:
468,209.37 ha
10.4% of entire
country
Ranks 4th
Resource EndowmentsLand Area Forested Areas

UNIVERSITY OF THE PHILIPPINESCENTER FOR INTEGRATIVE AND DEVELOPMENT STUDIES
Pilot Case: Eastern Mindanao
Area: 468,209.37 ha
10.4% of entire
country
Ranks 4th
Area: 526,312.33 ha
7.3% of entire
country
Ranks 6th
Important Watersheds Protected Areas
Resource Endowments
UNIVERSITY OF THE PHILIPPINESCENTER FOR INTEGRATIVE AND DEVELOPMENT STUDIES
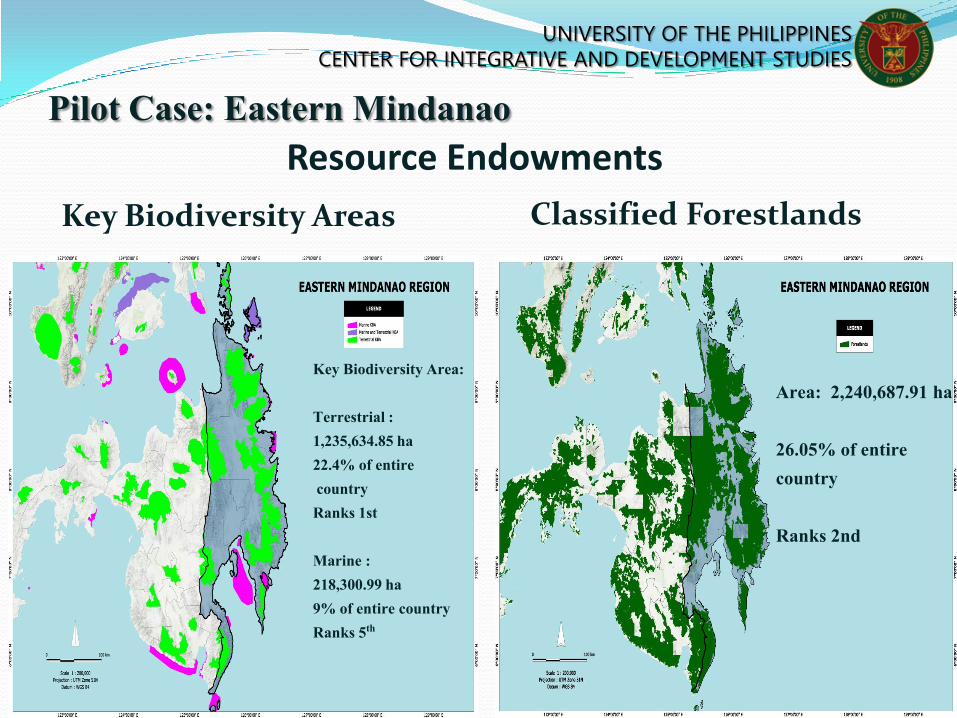
Pilot Case: Eastern Mindanao
Resource Endowments
Key Biodiversity Area:
Terrestrial :
1,235,634.85 ha
22.4% of entire
country
Ranks 1st
Marine :
218,300.99 ha
9% of entire country
Ranks 5th
Area: 2,240,687.91 ha
26.05% of entire
country
Ranks 2nd
Key Biodiversity Areas Classified Forestlands

UNIVERSITY OF THE PHILIPPINESCENTER FOR INTEGRATIVE AND DEVELOPMENT STUDIES
THE NATURAL REGIONS
Resource Endowments
128,962.90 ha
26.3% of entire
country
Ranks 1st
1, 467, 459 ha
11.8% of entire
Eastern Mindanao
Region
Ranks 3rd
Mining Areas Agricultural Areas

UNIVERSITY OF THE PHILIPPINESCENTER FOR INTEGRATIVE AND DEVELOPMENT STUDIES
THE NATURAL REGIONS
Disaster Vulnerabilities
Flood Susceptible
Area:
704,669.50 ha
15.8% of entire
country
Ranks 1st
Landslide Susceptible
Area: 3,133,032.63
ha
13.3% of entire
country
Ranks 3rd
Flood Susceptibility Landslide Susceptibility

UNIVERSITY OF THE PHILIPPINESCENTER FOR INTEGRATIVE AND DEVELOPMENT STUDIES
RegionsLow Landslide
Susceptibility
Moderate
Landslide
Susceptibility
High Landslide
Susceptibility
Very High
Landslide
Susceptibility
Debris Flow Total
Northeast Luzon 568,359.13 803,104.43 2,099,242.54 165,688.52 1,131.83 3,637,526.45
Northwest Luzon 91,065.43 56,693.40 576,356.32 167,998.33 1,192.61 893,306.08
Central Luzon 97,736.57 31,474.00 301,624.89 98,936.37 3,255.83 533,027.67
Southern Tagalog 776,890.82 638,296.50 946,686.83 2,186.93 3,666.96 2,367,728.04
Bicol 502,185.78 566,914.72 490,446.20 34,738.03 2,655.37 1,596,940.09
Palawan 443,675.20 461,315.35 399,426.41 422.39 1,304,839.36
East Visayas 408,588.95 867,572.66 787,243.81 21,588.15 5,345.09 2,090,338.66
West Visayas 880,881.55 825,360.15 916,471.69 75,605.16 614.58 2,698,933.13
East Mindanao 738,875.10 913,728.01 1,442,133.58 32,380.64 5,915.29 3,133,032.63
Central Mindanao 767,297.52 1,195,527.07 1,534,779.70 106,361.89 3,108.64 3,607,074.83
West Mindanao 396,656.94 522,024.49 731,439.35 65,938.07 264.79 1,716,323.64
Total 5,672,213.01 6,882,010.79 10,225,851.32 771,844.48 27,150.98 23,579,070.58
Landslide Vulnerability

UNIVERSITY OF THE PHILIPPINESCENTER FOR INTEGRATIVE AND DEVELOPMENT STUDIES
RegionLow Flooding
Susceptibility
Moderate Flooding
Susceptibility
High Flooding
Susceptibility
Very High Flooding
SusceptibilityTotal
Northeast Luzon 116,865.75 161,811.03 27,903.33 118,680.04 425,260.15
Northwest Luzon 110,324.58 60,747.32 74,746.43 37,867.15 283,685.49
Central Luzon 71,486.05 96,556.21 94,969.33 27,211.73 45,861.20
Southern Tagalog 103,316.85 101,556.12 156,812.01 14,604.59 376,289.58
Bicol 95,445.32 80,212.86 83,031.31 2.80 258,692.30
Palawan 25,536.60 38,299.46 124,359.97 188,196.03
East Visayas 110,630.48 123,080.84 207,408.36 56,760.29 497,879.96
West Visayas 160,898.52 158,661.40 188,046.47 98,502.49 606,108.89
East Mindanao 203,345.01 170,918.15 193,719.56 136,686.78 704,669.50
Central Mindanao 25,129.34 269,797.42 272,815.77 151,264.07 719,006.60
West Mindanao 40,184.20 62,630.95 144,422.63 117,961.84 365,199.63
Total 1,063,162.70 1,324,271.77 1,568,235.18 759,541.78 4,470,849.33
Flooding Vulnerability

UNIVERSITY OF THE PHILIPPINESCENTER FOR INTEGRATIVE AND DEVELOPMENT STUDIES
Pilot Case: Eastern Mindanao
Climate Change Vulnerability & Adaptive Capacity

UNIVERSITY OF THE PHILIPPINESCENTER FOR INTEGRATIVE AND DEVELOPMENT STUDIES
East Mindanao: Resource Endowments
Resource Endowment Percent of Total Rank
Total land area 12.60% 3rd
Forest area 16.10% 2nd
Critical watershed area 10.40% 4th
Protected area 7.30% 6th
Terrestrial KBA 22.40% 1st
Marine KBA 9% 5th
MPSA area 26.30% 1st
CADT area (ha) 26.50% 1st

UNIVERSITY OF THE PHILIPPINESCENTER FOR INTEGRATIVE AND DEVELOPMENT STUDIES
Road Network Airports
Seaports Bus Terminals
Intra/Inter-Regional Transportation Hubs and Circulation Network

UNIVERSITY OF THE PHILIPPINESCENTER FOR INTEGRATIVE AND DEVELOPMENT STUDIES
Pilot Case: East Mindanao Socio-Economic-Political Variables
Infrastructure: Road Network
0
200
400
600
800
1000
TOTAL PAVED TOTAL UNPAVED
Kil
om
eter
s (k
m)
National Roads Inventory (2008)**
Caraga
Region XI
59%
41%
Percent of Roads Paved (Eastern
Mindanao, 2008)**
PAVED
UNPAVED
PROVINCIAL BUS NETWORK (Eastern
Mindanao)
No. of Units in Operation
(2015)*
774
*Source: LTFRB Provincial Bus
Franchises, March 2015
** Source: Minda.gov.ph

UNIVERSITY OF THE PHILIPPINESCENTER FOR INTEGRATIVE AND DEVELOPMENT STUDIES
Socio-Economic-Political Variables
Infrastructure: Airports
Mati Airport
Bislig Airport
Barobo Airport
Tandag Airport
Davao International
Airport
Butuan Airport
Surigao Airport
Sayak AirportTYPE* No.
International 1
Domestic 4
Community 3
*Source: CAAP, August 2016

UNIVERSITY OF THE PHILIPPINESCENTER FOR INTEGRATIVE AND DEVELOPMENT STUDIES
Socio-Economic-Political Variables
Infrastructure: Seaports
*Source: minda.gov.ph
SEAPORT (Caraga)* No.
RORO 9
Non-RORO 6
SEAPORT (Region XI)* No.
RORO 4
Non-RORO 5

UNIVERSITY OF THE PHILIPPINESCENTER FOR INTEGRATIVE AND DEVELOPMENT STUDIES
3731
805
153
Education: Number of Schools (East Mindanao, SY 2013-2014)
Primary
Secondary
Tertiary
63.4% of tertiary institutions are located in the Region XI
Source: data.gov.phSource: Department Education - Basic Education Information System (BEIS)Source: Philippine Statistical Authority (PSA) - 2008 Functional Literacy, Education and Mass Media Survey Processed by: Mindanao Development Authority
Socio-Economic-Political Variables

UNIVERSITY OF THE PHILIPPINESCENTER FOR INTEGRATIVE AND DEVELOPMENT STUDIES
Socio-Economic-Political Variables
Employment: Labor Force
Total Labor Force*
YEAR CARAGA** REGION XI***
2010 1,051 1,835
2011 1,087 2,019
2012 1,107 1,950
2013 1,167 2,019
* Scale not indicated on http://minda.gov.ph/socio-economic-trend **Source of Raw Data: Philippine Statistical Authority*** Source of Raw Data: National Statistics Office
Labor force in CARAGA and Region XI grow by an average of 1.02 and 1.03, respectively.
There is an average variance of 1077.75 in labor force between the 2 regions in favor of Region XI.
UNIVERSITY OF THE PHILIPPINESCENTER FOR INTEGRATIVE AND DEVELOPMENT STUDIES
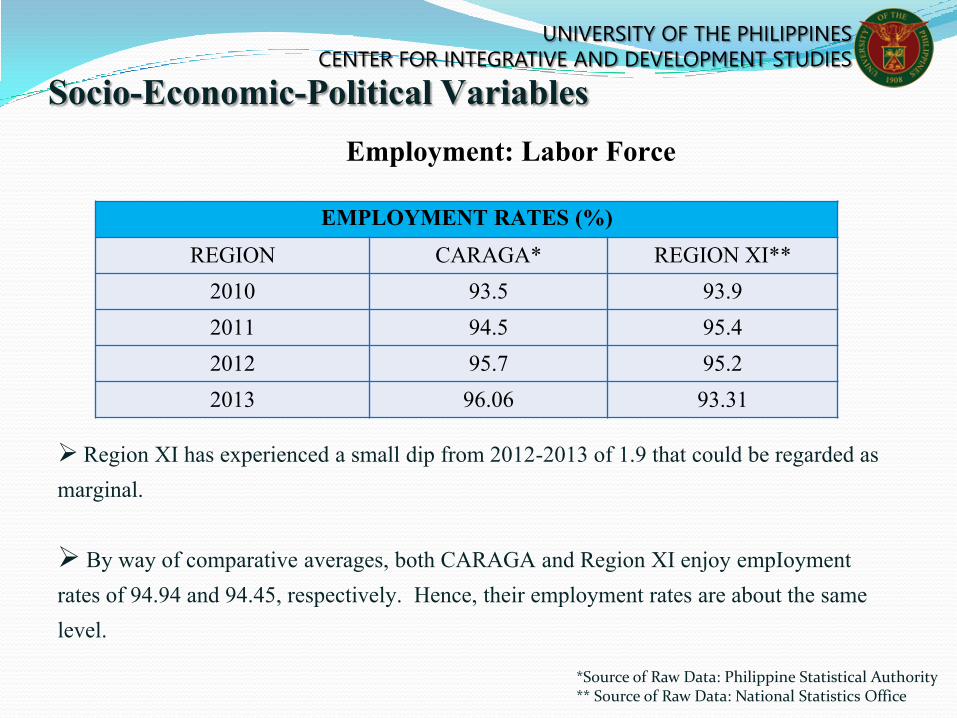
Socio-Economic-Political Variables
Employment: Labor Force
*Source of Raw Data: Philippine Statistical Authority** Source of Raw Data: National Statistics Office
EMPLOYMENT RATES (%)
REGION CARAGA* REGION XI**
2010 93.5 93.9
2011 94.5 95.4
2012 95.7 95.2
2013 96.06 93.31
Region XI has experienced a small dip from 2012-2013 of 1.9 that could be regarded as
marginal.
By way of comparative averages, both CARAGA and Region XI enjoy empIoyment
rates of 94.94 and 94.45, respectively. Hence, their employment rates are about the same
level.

UNIVERSITY OF THE PHILIPPINESCENTER FOR INTEGRATIVE AND DEVELOPMENT STUDIES
48%
38%
14%
Employment by Industry (East Mindanao, 2012)
Services
Agriculture
Industry
Source: Philippine Statistical Authority
Socio-Economic-Political Variables
62% of the workforce are into non-agricultural economic activities

UNIVERSITY OF THE PHILIPPINESCENTER FOR INTEGRATIVE AND DEVELOPMENT STUDIES
Socio-Economic-Political Variables
Banking and Financial Institutions
NUMBER OF FINANCIAL INSTITUTIONS*
BANKS NON-BANKS
YEAR CARAGA
REGION
XI CARAGA
REGION
XI
2007 115 253 18,796 572
2008 117 266 20,415 607
*Source of Raw Data: Bangko Sentral Ng Pilipinas
Data indicate more banks can be found in Region XI.
However, data also indicate more non-banks can be found in CARAGA.

UNIVERSITY OF THE PHILIPPINESCENTER FOR INTEGRATIVE AND DEVELOPMENT STUDIES
Socio-Economic-Political Variables
Banking and Financial Institutions
*Source of Raw Data: Bangko Sentral Ng Pilipinas
TOTAL DEPOSITS and LIABILITIES*
(in Million Pesos)
YEAR CARAGA REGION XI
2005 13,665 57,292
2006 16,496 66,503
2007 18,798 71,216
2008 20,415 78,684
It can be drawn from this data that the bulk
of deposits and liabilities are found in Region
XI, there is a difference of about Php 68,000 (in
Million Pesos)
NET LOAN PORTFOLIO
(In Million Pesos)
YEAR CARAGA REGION XI
2005 13,665 16,305
2006 16,496 18,230
2007 18,796 16,523
2008 20,415 19,981

UNIVERSITY OF THE PHILIPPINESCENTER FOR INTEGRATIVE AND DEVELOPMENT STUDIES
REGION
HOUSEHOLDS WITH
SANITARY TOILETS
HOUSEHOLDS WITH
ACCESS TO SAFE
WATER
DISTRIBUTION OF
BARANGAY
HEALTH STATIONS
(BHS)
RATIO OF GOV'T
DOCTORS AND
NURSES TO
POPULATION
Number Rate Number Rate Doctors Nurses
CARAGA 370,385 84.45 399,393 91.1 649 1:31,963 1:15,278
REGION XI 752,245 81.45 884,890 95.8 982 1:58,033 1:23,034
Note: Standard Population Ratio for Doctor= 1:20,000/ Nurse=1:15,000
Source: DOH Central Office, Mindanao Health Development Office and DOH- Regional Field
Offices * blank entry means no data available 0=means no case
Socio-Economic-Political Variables
Vital and Health Statistic (East Mindanao, 2011)

UNIVERSITY OF THE PHILIPPINESCENTER FOR INTEGRATIVE AND DEVELOPMENT STUDIES
Hub and Spokes Framework
Regional Center
Inter-mediate City
Inter-mediate City
Inter-mediate City
Inter-mediate City
Inter-mediate City
Rural Servic
e Center
Rural Service Center
Rural Service Center
Rural Service Center
Rural
Service
Center
Rural Service Center
Rural Service Center

UNIVERSITY OF THE PHILIPPINESCENTER FOR INTEGRATIVE AND DEVELOPMENT STUDIES
Hub and Spokes Framework
Davao City
DigosCity
ButuanCity
TagumCity
MatiCity
Surigao
City
Bislig
Hinatuan
Dinagat
Island
Davao
del Sur Municipalities
Agusan
Municipalities
Davao
Oriental
Municipalities
Surigao
Municipalities
Compostela
Municipalities

UNIVERSITY OF THE PHILIPPINESCENTER FOR INTEGRATIVE AND DEVELOPMENT STUDIES
Hub and Spokes Framework
.
Davao City
SurigaoCity
ButuanCity
Mati City
TagumCity
DigosCity
Bislig
Hinatuan
SurigaoMunicipalities
DinagatIsland
CompostelaMunicipalities
Davao Oriental Municipalities
AgusanMunicipalities
Davao del Sur Municipalities

UNIVERSITY OF THE PHILIPPINESCENTER FOR INTEGRATIVE AND DEVELOPMENT STUDIES
Conclusions
The UP-CIDS proposal is aimed at contributing to the articulation of a vision of
the future organization of the Philippine archipelagic state under a federalization
arrangement/set up.
UP-CIDS believes that a clear picture and understanding of the envisioned state
organization and its spatial structure are critical to the success of any initiative of
transforming the Philippines and the federalization process.
As shown in the East Mindanao pilot case, the delineation of territories of the
future federalized units can be framed within the natural region (NR) approach
that recognizes the intrinsic biophysical features and their spatial distribution
across the regional landscape.

UNIVERSITY OF THE PHILIPPINESCENTER FOR INTEGRATIVE AND DEVELOPMENT STUDIES
Conclusions
The natural regions approach offers a scientific option and informed strategy on
the matter of federal state formation: incorporate the biogeographic factors with
the other development sectors and provides the better basis for development
planning, programming, and governance.
Provides the basis for operationalizing the “hub and spokes” integrative and
developmental strategy.
UNIVERSITY OF THE PHILIPPINESCENTER FOR INTEGRATIVE AND DEVELOPMENT STUDIES
Conclusions
With gradual approach to federalization, the hub and
spokes stratagem will reach a point or degree of
decentralization when natural regions will have adequate
resources to finance local development projects and to
motivate greater local revenue mobilization.

UNIVERSITY OF THE PHILIPPINESCENTER FOR INTEGRATIVE AND DEVELOPMENT STUDIES
Conclusions
UP-CIDS scopes political and structural reform with
caution, pragmatism, adherence to democracy and social
justice.
We envision that growth and development provide access
across population groups, that development across territories
is equal or at least a levelled-playing field, where resources
are utilized in a sustainable way.

UNIVERSITY OF THE PHILIPPINESCENTER FOR INTEGRATIVE AND DEVELOPMENT STUDIES
Conclusions
We opt for an incremental and studied approach to power and
responsibility sharing in orders of government, we therefore argue
that FEDERALIZATION rather than FEDERALISM be the initiative
Analyses, discussions, and deliberations should also focus on the
process of state transformation, beginning from where we are, not just
the anticipated form of transformation

UNIVERSITY OF THE PHILIPPINESCENTER FOR INTEGRATIVE AND DEVELOPMENT STUDIES
Thank You!!!

UNIVERSITY OF THE PHILIPPINESCENTER FOR INTEGRATIVE AND DEVELOPMENT STUDIES
“A Proposed Approach to Federalization:
The Natural Region Framework”
Dr. Edna E.A. Co
Dr. Jose M. Regunay | Primer Pagunuran
Michael Eric Castillo | Rainier Tolentino
Alfred Marx Garcia | Ruben Jeffrey Asuncion