Embed Size (px)
Citation preview

A project report on a study of Investors Perception towards
Investment in Equity Market with special reference
ShareKhan Limited, Mangalore
Submitted by
Karen Sylvia Pais
Reg no: 111290715
Under the valuable guidance of
Ms. Sumathi
Faculty of MBA department
In partial fulfillment of the requirements
For The award of the degree of
Master’s in Business Administration (MBA)
SHRI DHARMASTHALA MANJUNATHESHWARA POST GRADUATE CENTRE FOR MANAGEMENT STUDIES AND RESEARCH
MANGALORE – 575003
2012-2013
73
DECLARATION
I hereby declare that this project report titled a study on investors’ perception towards investment
in equity market, SHAREKHAN LIMITED, MANGALORE in partial fulfillment of the Masters
in Business Administration (MBA), Mangalore University, is my original work and has not been
submitted for the award of any other degree, diploma, fellowship or any other similar title or
prizes.
Place: Mangalore Karen Sylvia Pais
Date:
ACKNOWLEDGEMENT
73

As I present this project report, I take this opportunity to express my gratitude to all those who
extended their co-operation to me in bringing out this work to a successful culmination.
I owe my sincere thanks to Dr. Devaraj K, Director; SDM PG CENTRE FOR
MANAGEMENT studies AND RESEARCH for the encouragement received from him and all
the staff members of the department.
I would like to express my heart full gratitude to my project guide Ms. Sumathi for providing the
valuable guidance and insight during the course of the project
I owe a deep gratitude to Mr. Adarsh kumar A, Branch In Charge of ShareKhan Limited for
giving the opportunity to do my project and all the staff members for their co-operation and
support.
Place: Mangalore Karen Sylvia Pais
Date:
CONTENTS
73

CHAPTER
NO.
TITLE PAGE
NO.
1 INTRODUCTION 5-8
2 INDUSTRY PROFILE 9-12
3 COMPANY PROFILE 22-23
4 INVESTORS PERCEPTION TOWARDS INVESTMENT IN
EQUITY MARKET39-47
5 DATA ANAYLSIS AND INTERPRETATION 48-68
6 FINDINGS AND SUGGESSTIONS 69-72
7 CONCLUSION 73
BIBLIOGRAPHY
INTRODUCTION
73

This project report entitled ‘Investors Perception towards investment in equity market focuses on
the investors’ perception towards investment in various sectors regarding equity market, their
preference of investment in equity market, and scope for potential growth of equity market.
Methodology of the Study
This study is one of the best instruments to identify the investing pattern of investors to invest in
various sectors and to study different sectors of Capital market. The study is careful inquiry or
examination to discover new information and relationship and to expand and to vary existing
knowledge. It always starts with question or any problem and finds answer of problem by using
scientific method. It gives complete knowledge about any problem or question.
Objectives of the Study
Every study is conducted within for some specific purpose or to solve some problem. When any
study is conducted it has some primary objective that helps to solve the main problem whereas a
secondary objective helps to solve peripheral problems. The primary and secondary objectives of
this project are:
Primary Objective
The primary objective of carrying out this research is:-
“Investors Perception towards Investment in Equity Market”
Secondary Objective
To find out the most preferred investment option in the Equity Market.
To find out how investors are motivated for investing in Equity Market.
To study the general investment criteria of people.
To know the people’s time horizon for investing in Equity Market and to know the rate of
return expected by them.
To study the interest of people for further investment in Equity Market.
To assess the satisfaction level of investors in Equity Market.
73

To classify the different sectors on the basis of investors’ behavior regarding investing in
Equity Market.
To identify the factors which influence the investors while investing in various selected
sectors
Project Design
Project Design is the plan structure and strategy if investigation conceived so as obtain to
question and to control variance. A project design is the master plan or model for acquiring the
information needs for solving the problem. It decides the source of information and methods for
gathering the data. A questionnaire and other forms are tested to use collection of data.
The project design has broadly three categories. They are:-
Exploratory Study
Descriptive Study
Causal Study
Descriptive Study
In this report, Descriptive Study Design is used for conducting survey on “Investors
perception for investing in Equity Market”.
Descriptive Study, also known as statistical study describes data and characteristics about the
population or phenomenon being studied. Descriptive study answer the question who, what,
where, when and how. This study is complex and determines high degree scientific skill to study
the problem. The description is used for frequencies, averages and other statistical calculations.
Often the best approach, prior to writing descriptive study, is to conduct a survey investigation.
Qualitative study often has the aim of description and studies may follow-up with examinations
of why the observations exist and what the implications of the findings are about.
In short Descriptive Study deals with everything that can be counted and studied.
73
Data Collection Method
Data collection usually takes place early on in an improvement project and is often formalized
through a data collection plan which often contains the following data collection methods.
The source of data collection method is as follows:-
Primary Data
Secondary Data
Primary Data
Primary Data means data collected directly from first-hand experience. Means data collected for
the first time by any person for any study. There are many methods of collection primary data
and the main methods include:-
Questionnaire Method
Interview Method
Focus Group Method
Observation Method
Case-studies Method
Diaries Method
The Questionnaire Method is used for the purpose of collecting the Primary Data.
Secondary Data
Secondary Data means data which are collected by any one for a particular study purposes and
which are used by others for different purpose.
Secondary Data for the study is collected through company brochures, websites, books and
magazines.
Sampling Plan
Sampling is the process to analyze the whole population by analyzing a part of it. The
effectiveness of the report depends on the sample size selected from the population. Here, target
73

population is decided who are the actual and potential investors, each sample has the chance to
be selected on an equal basis and this study has been conducted through surveying the whole of
the equity market. A sample of 100m investors is taken for the purpose of study.
Benefits of the Study
The study carried out under the title of “Investors Perception towards Investing in Equity
Market” will be benefited as under:-
To know in which sector investors are investing more.
The study will be helpful in knowing that what factors consider most important while
selecting the Sectors and company under the sectors.
The study will be helpful in knowing that how the investors are trade in Equity Market.
The study will be helpful in knowing responses regarding problems faced by the
investors while investing in Equity Market.
The study will be helpful in knowing that what are the motivational factors that
encouraging to the investors for investing in Equity Market.
Limitations of Study
As no human being is perfect, it is not possible for anyone to make the best or perfect report.
Each person has some level of knowledge and is affected by some uncontrollable factors within
which he/she has to work. So, it might possible that there can be some limitations in this report
that may be due to my knowledge level or some other factors.
According to me the limitations are:-
Respondents might have felt hesitation in providing information related to their age,
income etc. so, there can be some data that might questionable because of unwillingness
of respondents to give right information.
Sample selected may not represent whole population, as sample size selected is very
small in proportion to population due to time and cost constraints.
The response given by some of the respondents may be biased.
73
INDUSTRY PROFILE
The Indian retail brokerage industry consists of primarily act as agents for the buying and selling
of securities on a commission or transaction fee or brokerage basis. An agent charges a fee or
commission for executing buys and sells orders submitted by an investor. A stockbroker may or
may not be also an investment advisor. A stock broker is regulated professional broker who buys
and sells shares of other securities through market makers or Agency Only Firms on behalf of
investor.
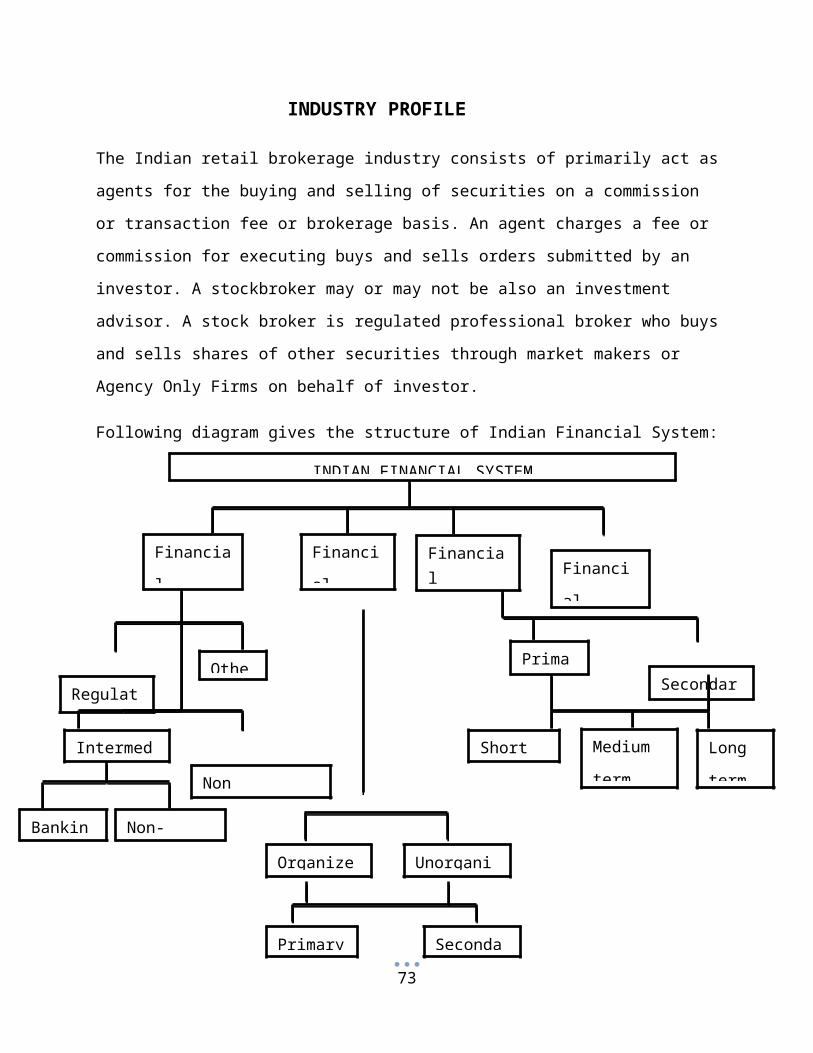
Following diagram gives the structure of Indian Financial System:
Fig no: 2.1
73
INDIAN FINANCIAL SYSTEM
Financial
Institutions
Financial
Markets
Financial Instruments
Financial
Services
Regulatory Others
Intermediary Non Intermediary
Banking Non-BankingOrganized Unorganized
Primary Secondary
Capital Market Money Market
Primary Secondary
Short term Medium
term
Long
term

Financial Market:
Financial Markets are helpful to provide liquidity in the system and for smooth functioning of
the system. These markets are the centers which provide facilities for buying and selling of
financial claims and services. The financial markets match the demands of investment with the
supply of capital from various sources.
According to the functional basis financial markets are classified into two types:
They are:
Money Market (short term)
Capital Market (long term)
According to institutional basis again classified into two types they are:
Organized Financial Market
Non-Organized Financial Market
The organized market comprises of official market represented by recognized institutions, bank
and government (SEBI) registered/controlled activities and intermediaries. The unorganized
market is composed of indigenous bankers, money lenders, and individual professional and non-
professionals.
Money Market:
Money Market is the place where we can raise short term capital. It is classified into:
Inter-bank call money market
Bill market
Bank loan market
E.g. Treasury Bills, Commercial Papers, Certificate of Deposits etc.
73
Capital Market:
Capital Market is the place where we can raise long term capital. It is classified into two types
they are:
Primary Market
Secondary Market
Example: Shares, Debentures, Loans.
Primary Market
Primary Market is generally referred to the market of New Issues of Market for mobilization of
resources by the companies and government undertakings, for new project and also for
expansion, modernization, addition, and diversification and up gradation. Primary market is also
referred to as new issue market. Primary market operations include new issues of shares by new
and existing companies, further and right issues to existing shareholders, public offers, and issue
of debt instruments such as debentures, bonds etc. The primary market is regulated by the
Securities and Exchange Board of India (SEBI a government regulated authority).
Function:
The main services of the primary market are origination, underwriting and distribution.
Origination deals with the origin of the new issue. Underwriting contract make the shares
predictable and remove the element uncertainty in the subscription. Distribution refers to the sale
of securities to the investors.
The following are the market intermediaries associated with the market:
Merchant banker/book building lead manager
Registrar and transfer agent
Underwriter/broker to the issue
Adviser to the issue
Banker to the issue
Depository
Depository participant
73
Investors Protection in the Primary Market
To ensure healthy growth of primary market, the investing public should be protected. The term
investor protection has a wider meaning in the market. The principal ingredients of investor’s
protection are:
Provision of all the relevant information
Provision of accurate information
Transparent allotment procedures without any bias
Secondary Market
The primary market deals with the new issue of securities. Outstanding securities are trading in
the secondary market, which is commonly known as stock market or stock exchange. The
secondary market is a market where scrip’s are traded. It is a market place which provides
liquidity to the scrip’s issued in the primary market. Thus, growth of secondary market depends
on the primary market. Trading activities in the secondary market are done through the
recognized stock exchanges which are 23 in number including Over the Counter Exchange of
India (OTCE), National Stock Exchange of India, and Interconnected Stock Exchange of India.
Secondary market operations involve buying and selling of securities on the stock exchange
through its members. The companies hitting the primary market are mandatory to list their shares
on or more stock exchanges in India. Listing of scrip’s provides liquidity and offers an
opportunity to the investors to buy or sell the scrip’s.
The following are the intermediaries in the market:
Broker/member of stock exchange-buyer’s broker and seller’s broker
Portfolio manager
Investment advisor
Share transfer agent
Depository
Depository participants
Stock Markets in India
73

Stock exchanges are the perfect type of market securities whether of government and semi-
government bodies or public bodies as also for shares and debentures issued by the joint stock
companies. In the stock market, purchases and sale of shares are affected in conditions of free
competition. Government securities are traded outside the trading ring in the form of over the
counter sales or purchase. The bargains that are struck in the trading ring by the members of the
stock exchanges are the fairest prices determined by the basic laws of supply and demand.
Definition of Stock Exchange
Stock exchange means anybody or individuals whether incorporated or not constituted for the
purpose of assisting, regulating or controlling the business of buying, selling or dealing in
securities. The securities include:
Shares of public company
Government securities
Bonds
History of Stock Exchanges
The only stock exchanges operating in the 19th century were those of Mumbai setup in 1875 and
Ahmadabad in 1973. During the war boom, a number of stock exchanges were organized. Soon
after it became a central subject, central legislation was proposed and a committee headed by
A.D. Gorwala went into the bill for securities regulation. On the basis of the committee’s
recommendations and public discussion, the securities contract (regulation) act became law in
1956.
Functions of Stock Exchanges
Stock exchanges provide liquidity to the listed companies; they help in trading and raise funds
from the market. Over the 120yrs during which the stock exchanges have existed in this country
and through their medium, the central and the state government had raised cores of rupees by
floating public loans. Municipal corporations, trust and local bodies have obtained from the
public their financial requirements, and industry, trade and commerce the backbone of the
country’s economy have secured capital of cores of rupees through the issue of stocks, shares,
debentures for financing their day to day activities, organizing new ventures and completing
73
projects of expansion, diversification and modernization. By obtaining listing and trading
facilities, public investment increased and companies were able to raise more funds. The quoted
companies with wide public interest have enjoyed some benefits and assets valuation has become
easier for tax and other purposes.
BOMBAY STOCK EXCHANGE (BSE)
The Bombay Stock Exchange Limited is the oldest stock exchange not only in the country, but
also in Asia with a rich heritage of over 133 years of existence. In the early days BSE was
established as “The Native Share and Stock Brokers Association.”
It was established in the year 1857 and became the first stock exchange in the country to be
recognized by the government. In 1956, BSE obtained a permanent recognition from the
government of India under the securities contract (Regulation) Act 1956.
Today, BSE is the world No1 exchange in terms of number of listed companies and the world’s
fifth in handling the transactions through its electronic trading system.
The companies listed on BSE command a total market capitalization of USD Trillion 1.06 as of
July 2011. BSE reaches to over 400 cities and town nation-wide and has around 4937 listed
companies; with over 7745 script’s being traded as on 31st July 2011.
The BSE Index, SENSEX, is India’s first and most popular stock market benchmark index. The
BSE SENSEX (Sensitiveindex), also called the “BSE 30”, is a widely used market index in India
and Asia. Sensex is tracked worldwide. It constitutes 30 stocks representing 12major sectors. The
SENSEX is constructed on a ‘free-float’ methodology, and is sensitive to market moments and
market realities. Apart from the SENSEX, BSE offers 23 indices, including 13 sectorial indices.
BSE provides an efficient and transparent market for trading in equity, debt instruments and
derivatives.
BSE is the first exchange in India and the second in the world to obtain an ISO 9001:2000
certifications. It is also the first exchange in the country and second in the world to receive
Information Security Management System Standard BS 7799-2-2002 certification for its BSE
On-Line Trading System (BOLT). BSE continues to innovate. In 2006, it became the first
73
national stock exchange to launch its website in Gujarati and Hindi and now Marathi to reach out
to a larger number of investors.
BSE On-Line Trading (BOLT)
BSE On-Line Trading (BOLT) facilities on-line screen based trading in securities. BOLT is
currently operating in 25000 Trader workstations located across over 359 cities in India.
BSE Vision
The vision of Bombay Stock Exchange:
“To emerge as the premier Indian Stock Exchange by establishing global benchmarks".
BSE Profile
MD & CEO : Mr. Madhu Kannan
Address : Phiroze Jeejeebhoy Towers, Dalal Street Mumbai-400001, India
Telephone : 91-22-227212334
Website : www.bseindia.com
Trading Hours : Monday-Friday, 9:15am to 3:30pm
Securities : Stocks, Derivatives and Debt
Trading System : Electronic
Indices of BSE
SENSEX
BSE 100 (This covers Banking Sector)
BSE 200 (This covers Capital Goods)
BSE 500 (This covers Consumer Goods)
BSE mid-cap index
BSE small-cap index
73
BSE mid-cap index covers the FMCG sector and BSE small-cap index covers the IT, Metal, Oil
& Gas, Power Industry, PSU’s etc. BSE disseminates information on the Price Earnings Ratio,
the Price to Book Value Ratio and the Dividend Yield Percentage on day to day basis of all its
major indices.
The values of all BSE indices are updated every 15 seconds during market hours and displayed
through the BOLT system, BSE website and news wire agencies. All BSE Indices are reviewed
periodically by the BSE Index Committee. This committee which comprises eminent
independent finance professionals frames the broad policy guidelines for the development and
maintenance of all BSE Indices. The BSE Index cell carries out the day to day maintenance of all
indices and conducts research on development of new indices.
Awards Achieved by BSE
The World Council of Corporate Governance has awarded a Golden Peacock Global CSR
Award for BSE’s initiatives in Corporate Social Responsibility (CSR).
ICIA Award for excellence in financial reporting for the year 2006-2007.
BSE has won the Asia-Pacific award HRM awards for its efforts in employer branding
through talent management at work, health management at work and excellence in HR
through technology.
NATIONAL STOCK EXCHANGE (NSE)
HISTORY OF NSE
Capital Market reforms in India and the launch of Securities and Exchange Board of India
(SEBI) accelerated the incorporation of the second Indian Stock Exchange called National Stock
Exchange (NSE) in 1992. After few years of operations, the NSE has become the largest stock
exchange in India. Three segments of the NSE trading platform were established one after
another. The Wholesale Debt Market (WDM) commenced operation in June 1994. Finally, the
Futures and Options segment began in operating 2000. Today the NSE takes 14 th position in the
top 40 futures exchanges in the world.
In 1996, the National Stock Exchange of India launched S&P CNX Nifty and CNX Junior
Indices that make up 100 most liquid stocks in India. CNX Nifty is a diversified index of 50
73

stocks from 25 different economy sectors. The indices are owned and managed by India Index
Services and Products Limited (IISL) that has a consulting and licensing agreement with
Standard and Poor’s.
In 1998, The National Stock Exchange of India launched its website and was the first exchange
in India that started trading stock on the internet in 2000. The NSE has also proved its leadership
in the Indian Financial Market by gaining many awards such as ‘Best IT Usage Award’ by
Computer Society in India (in 1996 and 1997) and CHIP Web Award by CHIP magazine (1999).
The National Stock Exchange of India Limited is the Mumbai-based stock exchange. It is the
largest stock exchange in India in terms of daily turnover and number of trades, for both equities
and derivatives trading.
NSE has a capitalization of around ` 47, 01,923 core and is expected to become biggest stock
exchange in India in terms of market capitalization. Though a number of other exchanges exist,
NSE and Bombay Stock Exchange are the two most significant stock exchanges in India and
between them are responsible for the vast majority of share transactions.
NSE is mutually owned by a set of leading financial institutions, banks, insurance companies and
other financial intermediaries in India but its ownership and management operate as separate
entities.
There are at least 2 foreign investor NYSE Euro next and Goldman Sachs who have taken a
stake in the NSE. As of 2010, the NSE VSAT terminals, 2799 total, cover more than 1500 cities
across India. In October 2011, the equity market capitalization of the companies listed on NSE
was US$ 1.46 trillion, making it the second largest stock exchange in South Asia. NSE is the
third largest Stock Exchange in the world in terms of number of trades in equities. It is the
second fastest growing stock exchange in the world with a recorded growth of 16.6%.
ORIGINS
The National Stock Exchange of India was promoted by leading financial institutions at the
behest of the Government of India, and was incorporated in November 1992 as a tax paying
company. In April 1993, it was recognized as a Stock Exchange under the Securities Contracts
(Regulation) Act, 1956. NSE commenced operations in the Wholesale Debt Market (WDM)
73
segment in June 1994. The Capital Market (Equities) segment of NSE commenced operations in
November 1994, while operations in the Derivatives segment commenced in June 2000.
MARKETS
Currently, NSE has the following major segments of the capital market:
Equity
Futures and Options
Retail Debt Market
Wholesale Debt Market
Currency Futures
NSE has become the first Stock Exchange to get approval for the interest rate futures as
recommended by SEBI-RBI committee, on 31August 2009, a futures contract based on 7% 10
year GOI Bond (NOTIONAL) was launched with quarterly maturities.
HOURS
NSE’s normal trading sessions are conducted from 9:00 am India Time to 3:30 pm India Time on
all days of the week except Saturdays, Sundays and Official Holidays declared by the Exchange
(or by the Government of India) in advance. The exchange in association with BSE (Bombay
Stock Exchange Ltd) thinking to revise its timings from 9:00 am India Time till 5:00 pm India
Time. However, on Dec 17, 2009, after strong protest from brokers, the Exchange decided to
postpone the change in trading hours till Jan 04, 2010. NSE new market timing from Jan 04,
2010 is 9:00 am till 3:30 pm India Time.
NSE GROUP
National Securities Cleaning Corporation Ltd (NSCCL)
National Securities Depository Ltd (NSDL)
India Index Service & Products Ltd (IISL)
NSE.IT Ltd
DotEx International Limited
73
Indices of NSE
NSE also set up as index services firm known as India Index Services & Products Limited (IISL)
and has launched several stock indices, including:
S&P CNX Nifty (Standard & Poor’s CRISIL NSE Index)
CNX Nifty Junior
CNX 100 (= S&P CNX Nifty + CNX Nifty Junior)
S&P CNX 500 (= CNX 100 + 400 major players across 72 industries)
CNX Midcap (introduced on 18 July 2005 replacing CNX Midcap 200)
MISSION OF NSE
NSE’s mission is setting the agenda for change in the securities markets in India. The NSE was
set up with the main objectives of:
Establishing a nation-wide trading facility for equities, debt instruments and hybrids.
Ensuring equal access to investors all over the country through an appropriate
communication network.
Providing a fair, efficient and transparent securities market to investors using electronic
trading system.
Enabling shorter settlement cycles and book entry settlements system
Meeting the current international standards of securities markets.
The standard set by NSE in terms of market practices and technologies have become industry
benchmarks and are being emulated by other market participants. NSE is more than a mere
market facilitator. It’s that force which is guiding the industry towards new horizons and greater
opportunities.
NSE has several advantages over the traditional trading exchanges. They are as follows:
NSE brings an integrated stock market trading network across the nation.
Investors can trade at the same price from anywhere in the country since inter-market
operations are streamlined coupled with the countrywide access to the securities.
73
Delays in communication, late payments and the malpractices prevailing in the traditional
trading mechanism can be done away with greater operational efficiency and
informational transparency in the stock market operations, with the support of total
computerized network.
Unless stock markets provide professionalized service, small investors and foreign investors will
not be interested in capital market operations. Capital market being one of the major sources of
long-term finance for industrial projects, India cannot afford to damage the capital market path.
In this regard NSE gains vital importance in the Indian capital market system.
Why people trust NSE?
Unbiased
The National Stock Exchange of India (NSEIL) has been trusted by the securities markets for its
unbiased independence and professionalism. The function of forecasting has become more
meaningful as the information comes from a source, which is not only reliable but has no vested
interest of its own in the market movements.
Market Representation
NSE-MIBID/MIBOR is based on rates polled by NSE from a representative panel of 31
banks/institutions/primary dealers.
Transparent
The reference rate is released to all the market participants simultaneously through various
media, making it transparent with the aspiration of the market. Ensuring transparency helps the
market participants to judge the market mood and the probable rate one is likely to encounter in
the market. This information is useful not only to the banks but also to the issuers and investors.
Reliable
The high level of co-relation between actual deals and the reference rate gives an indication of its
reliability. The “Bootstrapping” is scientific and the values are generated through a system that
has been extensively tested. The technique involves generating multiple data sets based on the
73
rates polled with a dynamically determined number of identification of outliers, trimming the
data set of its extreme values and computation of the mean and its standard deviation.
Elimination of Noise
The trimming procedure is vulnerable to market manipulation of the rates due to the amount of
sampling noise. Excessive trimming may lead to loss of information whereas no trimming may
lead to excessive influence of the extreme values. To derive a true representative benchmark for
the market NSE ensures that trimming at any point does not exclude more than 20% of the
observation for the bid and for the ask rates.
Consistency
The Exchange ensures that every day the NSE-MIBID/MIBOR along with the respective
standard deviations are disseminated to the market at 0955 (IST) for overnight rate and at 1215
(IST) for 14day, 1month and 3 month rates.
Usage
The NSE-MIBID/MIBOR rate is used as a bench mark rate for majority of deals struck for the
interest Rate Swaps, Forward Rate Agreements, Floating Rate Debentures and Term Deposits.
73
COMPANY PROFILE
ShareKhan Ltd is one of the leading retail stock broking house of SSKI Group which is running
successfully since 1922 in the country. It is the retail broking arm of the Mumbai-based SSKI
Group, which has over eight decades of experience in the stock broking business. Sharekhan
offers its customers a wide range of equity related services including trade execution on BSE,
NSE, and Derivatives, depository services, online trading, investment advice etc. the firms online
trading and investment site – www.sharekhan.com - was launched on Feb 8, 2000. The site gives
access to superior content and transaction facility to retail customers across the country. Known
for its jargon-free, investor friendly language and high quality research, the site has a registered
base of over one lakh customers. The content rich and research oriented portal has stood out
among its contemporaries because of its steadfast dedication to offering customers best – of –
breed technology and superior market information. The objective has been to let customers make
informed decisions and to simplify the process of investing in stocks.
On April 17, 2002 Sharekhan launched speed trade, a net-based executable application that
emulates the broker terminals along with host of other information relevant to the day traders.
This was for the first time that a net-based trading station of this caliber was offered to the trader.
In the last six months speed trade has become a de facto standard for the Day Trading
community over the net.
Sharekhan’s ground network includes over 750 centers in 280 cities in India which provide a
host of trading related services.
Sharekhan has always believed in investing in technology to build its business. The company has
used some of the best-known names in the IT industry, like Sun Microsystems, Oracle,
Microsoft, Cambridge Technologies, Nexgenix, Vignette, VeriSignFinancial Technologies India
Ltd, Spider Software Pvt Ltd. to build its trading engine and content. The Morakhiya family
holds a majority stake in company. HSBC, Intel and Carlyle are the other investors. With a
legacy of more than 80 years in the stock markets, the SSKI is one of the leading players in
institutional broking and corporate finance activities. SSKI holds a sizeable portion of the market
in each of these segments. SSKI’s institutional broking arm accounts for 7% of the market for
Foreign Institutional portfolio investment and 5% Domestic Institutional portfolio investment in
73
the country and it has 60 institutional clients spread over India, Far East, UK and US. Foreign
Institutional Investors generate about 65% of the organization’s revenue, with a daily turnover of
over US$ 2 million. The Corporate Finance section has a list of very prestigious clients and has
many ‘firsts’ to its credit, in terms of the size of deal, sector tapped etc. the group has placed over
US$ 1 billion in private equity deals. Some of the clients include BPL Cellular Holding, Gujarat
Pipavav, Essar, Hutchison, Planet Asia and Shopper’s Stop.
Achievements of ShareKhan
A Rated among the top 20 wired companies along with Reliance, HUJI, Infosys, etc. by
‘Business Today’, January 2004 edition.
Awarded ‘Top Domestic Brokerage House’ four times by Euro money and Asia money.
Pioneers of online trading in India amongst the top 3 online trading websites from India.
Most preferred financial destination amongst online broking customers.
Winners of “Best Financial Website” award.
India’s most preferred brokers within 5years. “Awaaz customers Award 2005”.
Future Plans:
2, 00,000 plus retail customers being serviced through centralized call centers/web
solutions.
Branches/Semi branches servicing affluent/aggressive traders through high skill financial
advisor.
250 independent investment managers/franchisee servicing 50,000 highly valued clients.
New initiatives Portfolio management Services and commodities trading.
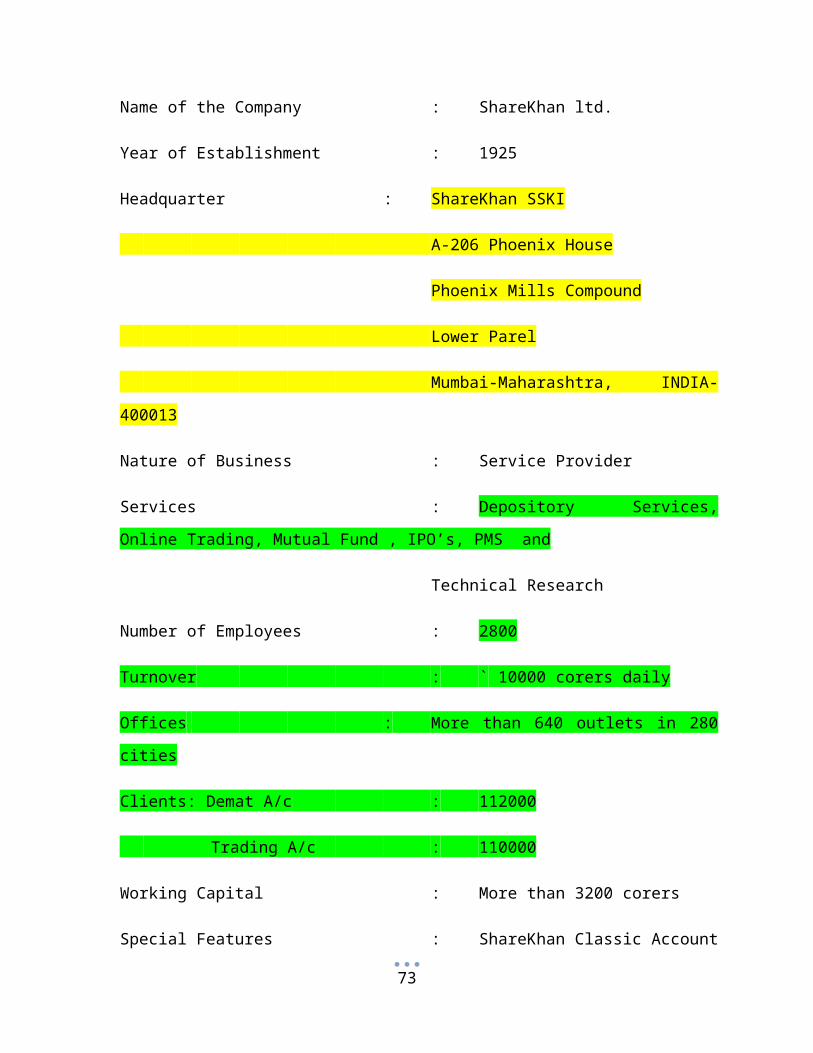
PROFILE OF THE COMPANY
Name of the Company : ShareKhan ltd.
Year of Establishment : 1925
Headquarter : ShareKhan SSKI
A-206 Phoenix House
73

Phoenix Mills Compound
Lower Parel
Mumbai-Maharashtra, INDIA- 400013
Nature of Business : Service Provider
Services : Depository Services, Online Trading,
Mutual Fund , IPO’s, PMS and
Technical Research
Number of Employees : 2800
Turnover : ` 10000 corers daily
Offices : More than 640 outlets in 280 cities
Clients: Demat A/c : 112000
Trading A/c : 110000
Working Capital : More than 3200 corers
Special Features : ShareKhan Classic Account
ShareKhan Trade Tiger Account
Dial-n-Trade
Website : www.sharekhan.com
Slogan : You’re Guide to The Financial Jungle
Vision
To be the best retail broking Brand in the retail business of stock market
73
Mission
“To educate and empower the individual investor to make better investment decisions through
quality advice and superior service.”
The ShareKhan provides its Customers First Step program, built specifically for all investors, so
treatment is-
“Your Guide To The Financial Jungle” means “Our commitment to being your guide
throughout your investing lifecycle” the institutional broking arm of SSKI was also awarded
‘India’s best broking house for 2004 by Asia Money brokers poll recently and it has also won the
prestigious Awaaz Consumer Vote Awards 2005 for the Most Preferred Stock Broking Brand in
India, in the investment Advisors category.
They have 650 share shops across 280 cities in India to get a host of trading related services- our
friendly customer service staff will also help with any account related queries.
ShareKhan won the award by the vote of consumers around the country, as part of India’s largest
consumer study cover 7000 respondents- 21 products and services across 21 major cities. The
study, initiated by Awaaz- India’s first dedicated Consumers Channel and member of the
worldwide CNBC Network and AC Nielsen- ORG Marg, was aimed at understanding the brand
preferences of the consumers and to decipher what are the most important loyalty criteria for the
consumer in each vertical.
The reasons behind the preferences for brands were unveiled by examining the following:
Tangible features of product/service.
Softer, intangible features like imagery, equity driving preference.
Tactical measures such as promotional/pricing schemes.
ShareKhan is infact-
Among the top 3 branded retail service providers.
No 1 player in online business.
73
Largest network of branded broking outlets in the country serving more than 7,00,000
clients.
Brand Name
The company as a whole in its offline business has named itself as SSKI Securities Private
Limited- Shripal Sevantilal Kantilal Ishwarlal Private Limited. The company has preferred to
name themselves under a blanket family name. But, in its online division started since 1997, the
company preferred to name itself as “SHAREKHAN” itself suggests the business in which the
company is dealing so that the customer could easily identify the product or service category.
Role of ShareKhan
Interface between the stock exchange and the investor
Assistance to investors in precise allocation of funds.
Building awareness amongst general public about stock market.
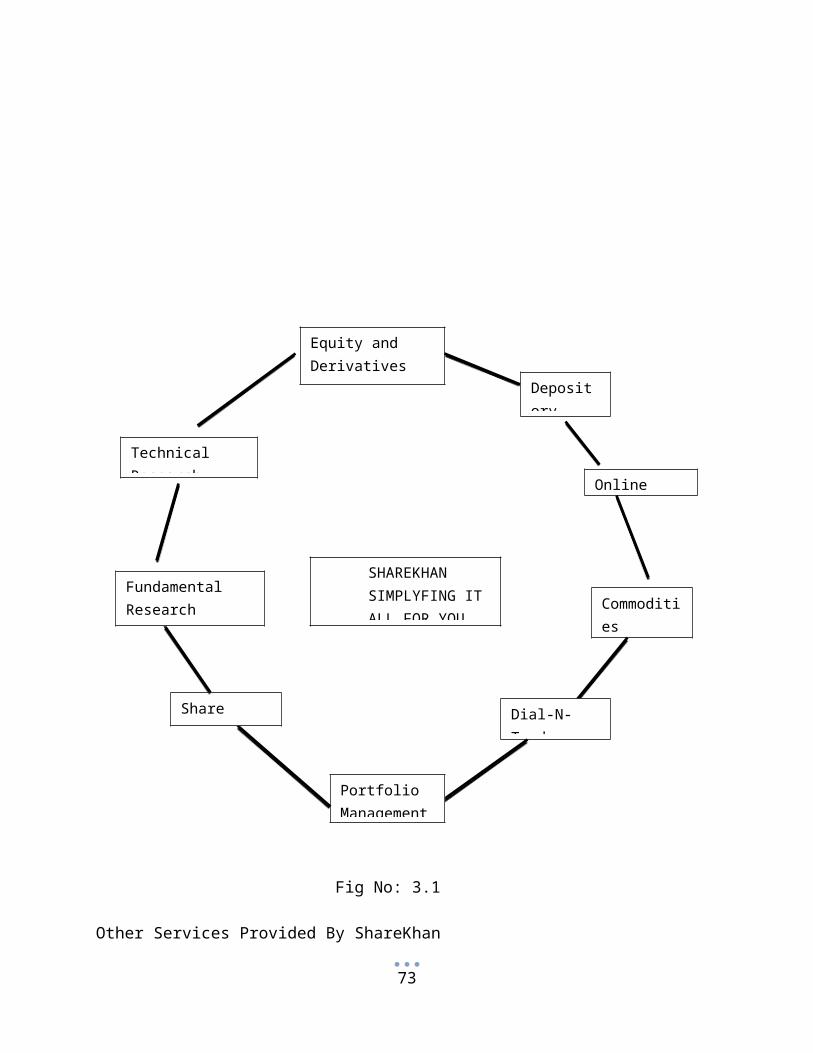
Core Services of ShareKhan
As a ShareKhan customer you can decide the channel through which you want to receive
different Services.
73
Fig No: 3.1
Other Services Provided By ShareKhan
Online Services
Offline Services
Derivatives Services: Demat & Remat Transactions
Derivatives Trading (Futures and Options)
Commodities Trading
IPOs and Mutual Funds Distribution
Fundamental Research
Technical Research
Portfolio Management
73
Equity and Derivatives Trading
Depository Services
Online Services
Commodities Trading
Dial-N-Trade
Portfolio Management
Share shops
Fundamental Research
Technical Research
SHAREKHAN SIMPLYFING IT ALL FOR YOU

Free access to investment advice from Share Khan’s Research team
ShareKhan Value Line (a monthly publication with reviews of recommendation,
stocks to watch out for etc.)
Daily research reports and market review (High Noon & Eagle Eye)
Pre-market Report (Morning Cuppa)
Daily trading calls based on Technical Analysis
Cool trading products (Daring Derivatives and Market Strategy)
Personalized Advice
Live Market Information
Internet-based Online Trading: Speed Trade
Online Services
Online BSE and NSE executions (through BOLT & NEAT terminals)
Mutual Funds
Commodity Futures
PMS (Portfolio Management Services)
Demat Services
Share Shops
Offline Services
Trading with the help of Dealer
Trading without credit
By calling to the share shops
Credit facility (only in Delivery-based)
Special website for Offline Clients: www.mysharekhan.com
Physical contract notes
The company provided mainly two types of services to their customers for the Demat Accounts.
73
Online Account
In the Online account, the company simply provides the terminal to the customers or clients and
the clients can do trading himself/herself when he/she wants. The charges of offline account is
Rs.750/-, which is varies from company to company. Online accounts are most popular than the
offline accounts. In online accounts, the company provides 3 types of facilities to their clients as
per the requirements:
Classic Accounts
Trade Tiger Accounts
Dial- n – Trade
Classical Accounts:
In this account, it is very simple to do trading. Here customer has first to open Demat account
with ShareKhan and after opening an account he can get login ID and password. With the help of
login ID and password, the client can login to the ShareKhan.com and in the classic a/c whatever
company’s information the clients wants, he has to type the company’s name or code and he will
get all the necessary information about that company and he can buy or sell the that company’s
stock or shares. But, here in the classical account the client can access only one scrip at a time.
Features of Classical Account
Classical account enables you to buy and sell shares through our website. You get features like:
Online trading account for investing in Equities and Derivatives via ShareKhan.com
Integration of : Online trading + Bank + Demat account
Instant cash transfer facility against purchase and sale of shares
Make IPO bookings
You get Instant order and trade confirmations by e-mail
Streaming quotes
Personalized Market Scan with your own customized stock triker
Single screen interface for cash and derivatives
Portfolio tracker
73
Trade Tiger Account
Earlier it was known as Speed Trade and now it is known Trade Tiger. This account is same as
fast trade account. But, difference between these two accounts is that in the Trade Tiger Account
the client can access unlimited scrips at a time and buy and sell the share from whenever they
want. This account also provides the charts and graphs, so that the clients can easily understand
about the stock of the company. This is only for big clients and dealer kind of customers. This
account is mainly for active traders who trade frequently during the trading session.
Features of Trade Tiger Account:
A single platform for multiple exchange BSE and NSE, MCX, NCDEX, Mutual Funds,
IPOs
Multiple Market Watch available on Single Screen
Multiple Charts with Tick by Tick Intraday and End of Day Charting powered with
various studies
Graph studies include Average, Brand – Bollinger, Know Sure Thing, MACD, RSI etc.
Apply studies such as Vertical, Horizontal, Trend, Retracement and free lines
User can save his own defined screen as well as graph template that is, saving the layout
for future use.
User – defined alert settings on an input Stock Price trigger.
Dial-n-Trade
Features:
Two dedicated numbers for placing orders with cell phone or landline. Toll free
number: 1-800-22-7050.
Simple and Secure interactive voice response based system for authentication.
No waiting time. Enter the PIN to be transferred to telebrokers
Offline Account
This is simple way to do trading. In the offline account, the client can place the order by
telephone or through personal visit in office. The client who is very busy in their jobs orbusiness,
73
they can directly place order by the telephone or the client who are not much busy; they can
come to the office of ShareKhan.
ShareKhan also provide the Dial-n-Trade service to their customers. So that customers can
directly place the order by the telephone.
Demat Account Opening and Brokerage Charges
Table No. 3.1: Fee structure for General Individual
Charges Classical Account Trade Tiger Account
Account Opening Charges ` 750/- ` 1000/-
Brokerage
Intra-day: 0.10%
Delivery : 0.50%
Intra-day : 0.10%
Delivery : 0.50%
Annual Maintenance Charges
` NIL first year
` 400/= p.a. from second year
onwards
For Intra-day Trades
This is subject to a minimum brokerage of 5 paisa per share. This means that if the share
price you trade in `50/- or less, a minimum brokerage of 5 paisa per share will be
charged.
For Delivery Based Trades
This is subject to a minimum brokerage of 10 paisa per share. Minimum brokerage of 10
paisa per share will be applicable when the share price is ` 20/- or less.
Share Mobile
ShareKhan launches Share Mobile, an exclusive live streaming quotes and trading facility
for its online trading customers.
A person can carry stock market terminal with him anywhere anytime.
73
ShareKhan brings a freedom of being mobile where it is so easy with share mobile to
track favorite stocks price movement tick-by-tick
How Share Mobile empowers
Live tick by tick stock price
Latest news headlines
Track My Trade Portfolio investment
Live Research Fundamental and Trading Calls
ShareKhan Depository Services
ShareKhan Depository Services offers dematerialization services to individual and corporate
investors. ShareKhan as a team of professionals and the latest technological expertise dedicated
exclusively to Demat department, apart from a national network of franchisee, making the
services quick, convenient and efficient.
Trading in Commodity Futures
It provides with facility to trade in commodities (Bullion: Gold, silver and agricultural
commodities) through a wholly owned subsidiary of its Parent SSKI. ShareKhan is a member of
two Commodity Exchange and offers trading facility at both these exchanges:
o Multi Commodity Exchange of India (MCX)
o National Commodity and Derivative Exchange, Mumbai (NCDEX)
Software (Technology) used in ShareKhan
ShareKhan is using different technology for the running of their daily transactions. Mainly for
the trading, the companies using three software are:
ODIN (VSAT Based)
Trade Tiger (WEB Based)
Classic/Fast Trade (WEB Based)
73
And also NEAT System used for making transaction in NSE listed company and same way
BOLT System used for making transaction BSE listed company. For the client information or
customer service, the company using 2 software:
CIS – Client Information System
BOC – Back Office.
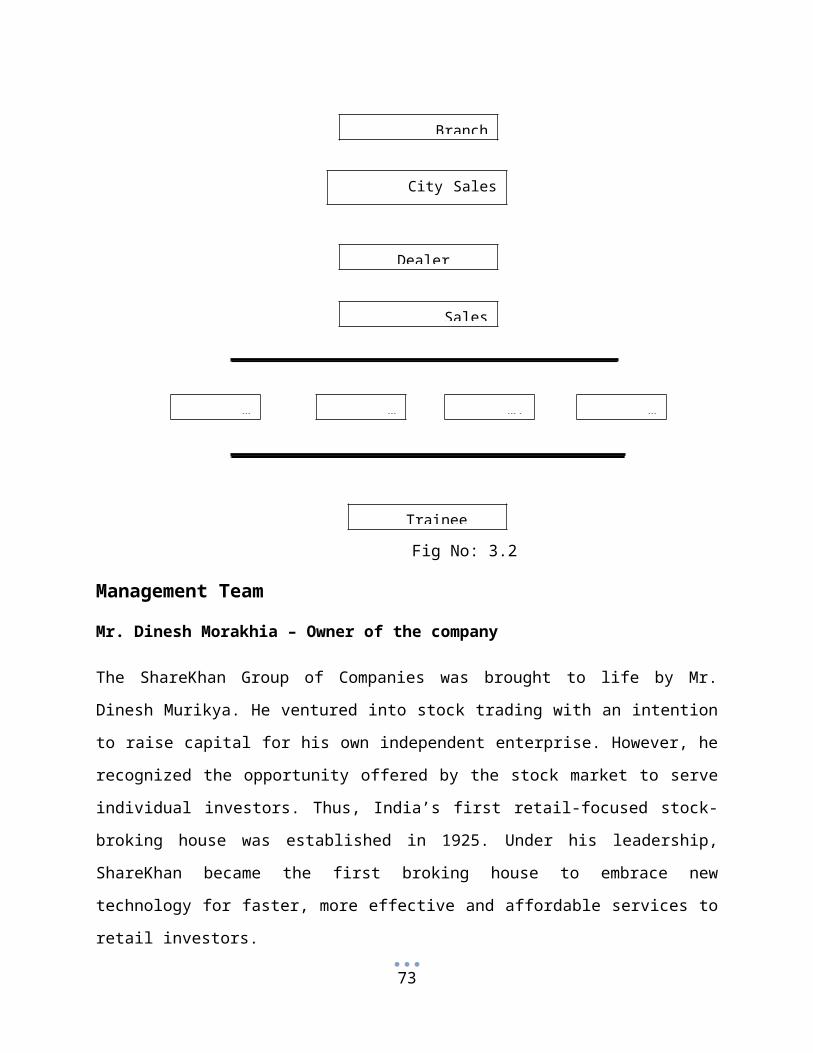
Hierarchy of ShareKhan
Fig No: 3.2
73
C.E.O
Branch Head
Cluster Head
Regional Head
Country Head
City Sales Manager
Dealer
Sales Executive
….1…… ….2…… ….3…… ….4……
Trainee
Management Team
Mr. Dinesh Morakhia – Owner of the company
The ShareKhan Group of Companies was brought to life by Mr. Dinesh Murikya. He ventured
into stock trading with an intention to raise capital for his own independent enterprise. However,
he recognized the opportunity offered by the stock market to serve individual investors. Thus,
India’s first retail-focused stock-broking house was established in 1925. Under his leadership,
ShareKhan became the first broking house to embrace new technology for faster, more effective
and affordable services to retail investors.
Mr. Tarun Shah – Chief Executive Officer
A science graduate from St. Xavier’s College, Mumbai and Mr. Tarun Shah started his
professional life in sales and marketing in a chemicals company. His hands on approach and
rigorous experience in sales led him to higher challenges that the capital markets provided.
In 1987, he joined SSKI, a brokerage firm with over five decades of legendary service to its
credit. The capital markets at that time was undergoing a sea change in its character and SSKI
under the vision and guidance of Shripal Morakhia and the commitment and hardwork of Mr.
Shah was able to change and adopt the new business practices to achieve significant growth in a
competitive environment.
Accepting new challenges is a way of life for Mr. Tarun Shah. To ensure that SSKI’s foray into
retail stock broking through ShareKhan meets with the same success every other SSKI venture
has, Mr. Tarun Shah moved in to spearhead this new effort as CEO of the ShareKhan.
Mr. Shankar Vailaya – Director (operations) of the company
A graduate in commerce from the University of Mangalore and an Associate of The Member of
the Institute of Chartered Accountants of India, Mr. Shankar Vailaya heads the operations,
finance and legal functions. He is responsible for settlements, depository operations, risk and
compliance and regulatory and other commitments and Treasury.
73
Shankar has managed broking operations through the most turbulent times of the post securities
scam period in 1922 and has managed to steer clear of a flurry of bad papers in the market during
1994-95.
Mr. Jaideep Arora – Director (Products & Technology) of the company
Jaideep Arora completed his B.Tech from IIT (Kanpur) and his PGDM from IIM Kolkata.
Jaideep worked with ICICI for 8 years where his work spanned a gamut of functions, which
included project finance, equity sales and brokerage, investments etc. during his tenure there he
set up and headed the ‘Institutional Equity Brokerage Desk’ at ICICI Securities and Finance Co.
Ltd.
Jaideep joined ShareKhan in June 2000 as Head of Product Development. A year later he took
over the reins of the business at ShareKhan. At present Jaideep’s responsibilities include
spearheading ShareKhan’s online foray and overall customer acquisition effort.
Pathik Gandotra : Head of Research
Rishi Kohli : Vice President of Equity Derivatives
Nikhil Vora : Vice President of Research
Reason to Choose ShareKhan Limited
Experience
SSKI has more than eight decades of trust and credibility in the Indian stock market. In the Asia
Money broker’s poll held recently, SSKI won the ‘India’s Best Broking House for 2004’ award.
Ever since it launched ShareKhan as its retail broking division in February 2000, it has been
providing institutional level research and broking services to individual investors.
Technology
With its online trading account one can buy and sell shares in an instant from any PC with an
internet connection. One can get access to its powerful online trading tools that will help him
take complete control over his investment in shares.
73
Accessibility
ShareKhan provides ADVICE, EDUCATION, TOOLS and EXECUTION services for investors.
These services are accessible through its centers across the country over the internet (through the
website www.sharekhan.com) as well as over Voice tool.
Knowledge
In a business where the right time can translate into direct profits, one can get access to a wide
range of information on ShareKhan Limited’s content-rich portal. One can also get a useful set of
knowledge-based tools that will empower him to take informed decisions.
Convenience
One can call its Dial-N-Trade number to get investment advice and execute his transactions.
ShareKhan ltd. has a dedicated call-center to provide this service via a Toll Free Number 1800-
22-7500 & 1800-22-7050 from anywhere in India.
Customer Service
ShareKhan Limited’s customer service team will assist one for any help that one may require
relating to transactions, billing, demat and other queries. Its customer service can be contacted
via a toll-free number, email or live chat on www.sharekhan.com.
Investment Advice
ShareKhan has dedicated research teams of more than 30 people for fundamental and technical
researches. Its analysts constantly track the pulse of the market and provide timely investment
advice to its clients in the form of daily research emails, online chat, printed reports and SMS on
their mobile phone.
73

SWOT ANALYSIS OF SHAREKHAN
Strengths
Online Trading Facility
It is pioneer in online trading with turnover Rs.400 corers and more than 800 peoples
working in the organization.
Largest Chain of Retail Share Shops in India
88years of Experience in securities market
Dedicated and responsive workforce/staff
Value added service for HNI client
Research center
ShareKhan has dedicated research teams for fundamental and technical research. Which
constantly track the pulse of the market and provide timely investment advice free of cost
to its clients which has a strike rate of 70-80%
Membership of NSE & BSE
Trading option like Future & Option and Commodities
Volume based differentiated products
Weakness
Localized presence due to insufficient investments for country wide expansion.
Lack of awareness among customers because of non-aggressive promotional strategies
(print media, newspaper etc.)
Lesser emphasis on customer retention
Focuses more on HNIs than retail investors which results in meager market-share as
compared to close competitors.
Problems due to network crash
Unawareness among Investors
73
Opportunity
With the booming capital market it can successfully launch new services and raise its
client’s base
It can easily tap the retail investors with small saving through promotional channels like
print media, electronic media etc.
As interest on fixed deposits with post office and banks are all time low, more and more
small investors are entering into stock market.
Abolition of long term capital gain tax on shares and reduction in short term capital gain
is making stock market as hot destination for investment among small investors.
Increasing usage of internet through broadband connectivity may boost a whole new
breed of investors for trading in securities.
Threats
Aggressive promotional strategies by close competitors may hamper ShareKhan’s
acceptance by new clients.
Lack of sufficient branch-offices for speedy delivery of services.
Other players are providing margin funds to investors on easy terms where as there is no
such facility in ShareKhan.
More and more players are venturing into this domain which can further reduce the
earnings of ShareKhan.
73

INVESTORS PERCEPTION TOWARDS INVESTMEMT IN EQUITY MARKET
The money you earn is partly spent and the rest saved for meeting future expenses. Instead of
keeping the savings idle you may like to use savings in order to get return on it in the future. This
is called Investment.
One needs to invest to:
Earn return on your idle resources
Generate a specified sum of money for a specific goal in life
Make a provision for an uncertain future
One of the important reasons why one needs to invest wisely is to meet the cost of Inflation.
Inflation is the rate at which the cost of living increases. The cost of living is simply what it costs
to buy the goods and services you need to live.
Investor
An investor is any party that makes an investment
An individual who commits money to investment products with the expectation of
financial return.
The term has taken on a specific meaning in finance to describe the particular types of
people and companies that regularly purchase equity or debt securities for financial gain
in exchange for funding an expanding company.
Investors Behavior
Generally, Investors Behavior regarding the any investment is primary concern with to minimize
risk while maximizing return, as opposed to a speculator, who is willing to accept a higher level
of risk in the hopes of collecting higher than average profits.
While, some people are also believes in “High Risk, High Return” many investors purchase a
particular stock with the intention of making a big profit over a short period of time. However,
this action is not investing, but a pure gambling.
73
The stock market is characterized by the trade-off between risk and return. The higher the risk
the investor is willing and able to take, the higher the potential rewards from the investment.
Therefore, if a particular investment offers high returns, it is an indication that it will come with
a high risk burden.
Some people are also believes in that there is no safe investment that will provide with high
returns over a short period of time. Therefore, one should direct their resources toward long-term
investment that are more likely to reward with high returns.
Investors Behavior regarding the financial investment is closely related with the “Behavioral
Economics” and Behavioral Economics” are closely related fields making up a separate branch
of economic and financial analysis using social, cognitive and emotional factors in understanding
the economic decisions of investment, and their effects on market prices, returns and the
allocation of resources.
Information of Equity Market and various sectors
What is Equity Market?
A market where in investors buys and sells securities providing ownership of a company’s
shares.
The market in which shares are issued and traded, are either through exchanges or over the
counter markets. Also known as the stock market, it is one of the most vital arrears of a market
economy because it gives companies access to capital and investors a slice of ownership in a
company with the potential to realize gains based on its future performance.
Equity market, or stock market, is a system through which company shares are traded. The
equity market offers investors an opportunity to participate in a company’s success through an
increase in its stock price. With enhanced opportunity, however, the equity market usually
carries greater risk than debt markets.
73
Indian Equity Market
The Indian Equity Market is more popularly known as the Indian Stock Market. The Indian
equity market has become the third biggest after China and Hong Kong in the Asian region.
According to the largest report by ADB, it has a market capitalization of nearly $600 billion. As
of March 2009, the market capitalization was around $598.3 billion (` 30.13 lakh core) which is
one-tenth of the combined valuation of the Asia region. The market was slow since early 2007
and continued till the first quarter of 2009.
The Indian Equity Market depends on three factors-
Funding into equity from all over the world
Corporate houses performance
Monsoons
The equity market is also affected through trade integration policy. The country has advanced
both in foreign institutional investment (FII) and trade integration since 1995. This is a very
attractive field for making profit for medium and long term investors, short-term swing and
position traders and very intra-day traders.
The Indian market has 22 stock exchanges. The larger companies are enlisted with BSE and
NSE. The smaller and medium companies are listed with OTCEI (Over the Counter Exchange of
India). The functions of the Equity Market in India are supervised by SEBI (Securities Exchange
Board of India).
The Indian Equity Market was not well organized or developed before independence. After
independence, new issues were supervised. The timing, floatation costs, pricing, interest rates
were strictly controlled by the Controller of Capital Issue (CII).
Introduction of Sectors
Meaning of Sector
There are many companies or scrip that manufacturer the same products and provide services are
specified under the particular name that called Industry or Sector.
73
There are many other different kinds of industries, and often organized into different classes or
variety of industrial classification it’s sector.
In this Report, I have studied on Five Sectors which are:
Oil and Gas Sector
The oil and gas industry in recent years has been characterized by rising consumption of oil
products, declining crude production and low reverse accretion. India remains one of the least-
explored countries in the world, with a well density among the lowest in the world. India is the
fourth largest oil consumption zone in Asia, even though on a per capita basis the consumption is
a mere 0.1 tones, the lowest in the region- this makes the prospects of the Indian Oil industry
even more exciting.
The oil and gas industry has been instrumental in fuelling the rapid growth of the Indian
economy. The petroleum and natural gas sector which includes transportation, refining and
marketing of petroleum products and gas industry constitutes over 15 percent of the GDP.
India’s domestic demand for oil and gas is on the rise. As per the Ministry of Petroleum, demand
for oil and gas is likely to increase which is 186.54 million tons in 2008-09. India is emerging as
the global hub for oil refining with capital costs lower by 25 to 50 percent over other Asian
countries. Already, the fifth largest country in the world in terms of refining capacity, with share
of 3 percent of the global capacity by 45percent or 65.3 to 242 million tons per annum over the
next five years.
Banking Sector
Banking in India originated in the last decades of the 18th century. The oldest bank in existence
in India is the State Bank of India; a government owned bank that traces its origins back to
June18 and that is the largest commercial bank in the country. Central banking is the
responsibility of the Reserve Bank of India, which in 1935 formally took over these
responsibilities from the Imperial Bank of India.
The banking sector will navigate through all the aspects of the Banking System in India. It will
discuss upon the matters with the birth of the banking concept in the country to new players
73

adding their names in the industry in coming few years. The banker of all banks, Reserve Bank
of India (RBI), the Indian Banks Association (IBA) and top 20 banks like IDBI, HSBC, ICICI,
etc.
With the Indian economy moving on to a high growth trajectory, consumption levels soaring and
investment riding high, the Indian banking sector is at a watershed. Further, as Indian companies
globalize and people of Indian origin increase their investment in India, several Indian banks are
pursuing global strategies.
In the Third Quarter Review of Monetary Policy for 2009-10, the RBI observed that the Indian
economy showed a degree of resilience as it recorded a better than expected growth of 7.9
percent during the second quarter of 2009-10
The industry has been growing faster than the real economy, resulting in the ratio of assets of
commercial banks to GDP increasing to 92.5percent during exceptionally well in the financial
sector with the price to book value being second only to China, according to a report by (BCG)
Boston Consultancy Group.
IT Sector
Over the past decade, the Information Technology (IT) industry has become one of the fastest
growing industries in India. The key segments that have contributed significantly (96 percent of
total) to the industry’s exports include – Software and services (IT services) and IT – enabled
services (IT’s) i.e. business services. Over a period of time, India has established itself as a
preferred global sourcing base in these segments and they are expected to continue to fuel
growth in the future.
At present, India is emerging as one of the popular Software outsourcing locations to offer cost
effective software solutions. The contribution of India in Software Outsourcing is remarkable.
One just cannot reject the reality that currently India is described as the most prospering name in
software outsourcing. Now there are several grounds for this flourishing popularity of the
offshore IT outsourcing services of India. The prime reason for choosing India, as an offshore
development partner in software outsourcing business is the availability of enormous pool of
educated manpower combined with world-class quality offerings.
73

India’s IT growth in the world is primarily dominated by IT software and services such as
Custom Application Development and Maintenance (CADM), System Integration, IT
Consulting, Application Management, Software testing, and web services. India’s domestic
market has also become a force to reckon with, as the existing IT infrastructure evolves both in
terms of technology and depth of penetration
Infrastructure Sector
Infrastructure is the basic physical and organizational structures needed for the operation of a
society or enterprise, or the services and facilities necessary for an economy to function. The
term typically refers to the technical structures that support a society, such as roads, water
supply, sewers, power grids, and telecommunication.
India’s Infrastructure has been expanding at an accelerated pace to support the economic growth
rate of over 9 percent. The six core-infrastructure industries, which account for a combined
weight of 26.68 percent in the index of industrial production (IIP), registered a growth of 8.6
percent in 2006-07 as against 6.2 percent during 2005-06. The growth has continued space
during the current fiscal, with the six core-infrastructure industries growing at the rate of 6.9
percent during April-September 2007. Significantly, electricity recorded a growth rate of 7.6
percent compared to 6.7 percent in the same period last year.
Infrastructure investment in India is set to grow dramatically accelerated by 5.3 percent in 2008-
09. India has become a major outbound investor and people are engaging with Indians to seek
investment into their countries, said the Minister for Road Transport and Highways, Mr. Kamal
Nath. According to investment banking company Goldman Sachs, India’s infrastructure sector
will require US$ 1.7 trillion investment in the next 10 years. It also added that such investment
would come more from the domestic market than overseas.
Automobile Sector
Automobile industry is one of the fastest growing industries of the world. With more than 2
million new automobiles rolling out each year, on roads of India, the industry is set to grow
further.
73
Automobile industry made its silent entry in India in the nineteenth century. Since the launch of
the first car in 1897, India automobile industry has come a long way. Today India is the largest
three wheeler market in the world and is expected to take over China as the second largest
automobile market, in the coming years.
Some facts on Automobile industry in India:
India has fourth largest car market in the world.
India has the largest three wheeler market in the world.
India is the second largest producer of two wheelers in the world
India ranks fifth in the production of commercial vehicles
The growth of the Indian middle class along with the growth of the economy over the past few
years has attracted global auto majors to the Indian market. Moreover, India provides trained
manpower at competitive costs making India a favored global manufacturing hub. The
attractiveness of the Indian markets on one hand and the stagnation of the auto sector in markets
such as Europe, US and Japan on the other have resulted in shifting of new capacities and flow
of capital to the Indian automobile industry.
Global auto majors such as Japanese auto majors Suzuki, Honda and Korean car giant Hyundai
are increasingly banking on their Indian operations to add weight to their businesses, even as
numbers stay uncertain in developed markets due to economic recession and slowdown.
According to figures released by the Society of Indian Automobile Manufactures (SIAM),
domestic passenger car sales have increased 32.28 percent to reach 145,905 units in January
2010, against 768,698 units in the January 2010 from 110,300 units in the same month last year.
Across all categories, total sale of vehicles increased 44.94 percent to 1,114,157 units in January
2010, against 768,698 units in the January 2009. The Indian auto industry is likely to see a
growth of 10-12 percent in sales in 2010, according to a report by the global rating firm.
Indian has become second largest maker of small cars, overtaking Brazil. Small cars for 80
percent of the domestic market (up from 75 percent last year) and exports are growing at top
speed. According to SIAM, small car exports rise 53 percent between April and September 2009
73

to 197,249 units against 129,090 units a year ago. In order to make India a power to reckon with
automotive sector the government launched the Automotive Mission Plan (APM) 2006-2016.
The vision of the APM is “To emerge as the destination of choice in the world for design and
manufacture of automobiles and auto components with output reaching a level of US$ 145billion
accounting for more than 10 percent of the GDP and providing additional employment to
25million people by 2016.” As per the AMP, it is estimated that the total turnover of the
automotive industry in India would be in the order of US$ 122 billion – US$ 159 billion in 2016.
Further, by 2016, the automotive sector would double its contribution to the country’s GDP from
current levels of five percent to 10-12 percent.
List of Companies under these Five Sectors
Oil and Gas Sector
Indian Oil Corporation
ONGC (Oil and Natural Gas Corporation India)
Essar Oil Limited
Gas Authority of India Limited
Oil India Limited
India LPG
Oil Gas India
Banking Sector
State Bank of India
ICICI Bank
Axis Bank
HDFC (Housing Development Financial Corporation)
HSBC
IDBI Bank
Union Bank of India
Central Bank of India
IT Sector
Infosys
TCS Limited
73
Wipro
HCL
Infrastructure Sector
DLF
Reliance Infrastructure
HCC Infrastructure
IRB Infrastructure
Automobile Sector
Hero Honda
Bajaj Auto
Tata Motors
Maruti Suzuki
TVS Motors
Mahindra Motors
.
DATA ANALYSIS AND INTERPRETATION
Table No: 5.1
Gender wise classification of respondents
73
Variable No of Respondents Percent
Male 75 75
Female 25 25
Total 100 100
Fig No: 5.1
Interpretation
From the above table and chart, it is clear that 75 percent of respondents are male and 25
percent are female.
Table No: 5.2
Age wise classification
Variable No of Respondents Percentage
Before 20 years None None
73
21-30 years 10 10
31-40 years 15 15
41-50 years 20 20
51-60 years 34 34
60 & Above 21 21
Total 100 100
Fig No: 5.2
Interpretation
10 percent of respondents are from 21-30 years.
15 percent of respondents are from 31-40 years.
20 percent of respondents are from 41- 50 years.
34 percent of respondents are from 51-60 years.
21 percent of respondents are from 60 & above.
Table No: 5.3
Table showing the occupation of respondents
Variable No of Respondents Percentage
73
Business 30 30
Service 25 25
Student None None
Employee 45 45
Total 100 100
Fig No: 5.3
Interpretation
30 percent of respondents are into business whereas 25 percent are into service and 45
percent are employed.
Table No: 5.4
Yearly income of the respondents
Variable No of Respondents Percentage
Less than `100000 None None
73
`100000-`200000 10 20
`200000-`300000 30 30
`300000-`400000 20 20
`400000-`500000 35 35
Above `500000 5 5
Total 100 100
Fig No: 5.4
Interpretation
10 percent of the respondents belongs to ` 100000- ` 200000 whereas, 30 percent of
respondents belongs to ` 200000 - ` 300000.
20 percent of the respondents belongs to ` 300000 - ` 400000 whereas, 35 percent of
respondents belongs to ` 400000 - ` 500000 and 5 percent of respondents belong to
above ` 500000.
Table No: 5.5
Respondents investing in equity market
73

Variable No of Respondents Percentage
Yes 75 75
No 25 25
Total 100 100
Fig No: 5.5
Interpretation
75 percent of investors are investing in equity market whereas,
25 percent of investors are not investing in equity market.
Table No: 5.6
Investments which provides the best returns
Variable No of Respondents Percentage
Equity Shares 63 63
IPO 8 8
73
Bonds 10 10
Mutual Fund 7 7
Fixed Deposits 2 2
Total 100 100
Fig No: 5.6
Interpretation
It is cleared that 63 percent of investors opted equity market as the best returns compared to
other investment options. 8 percent of investors have opted IPO as best returns whereas, 10
percent of investors have opted Bonds as best returns, 7 percent of investors have opted Mutual
Funds as best returns and 2 percent of investors have opted fixed deposits as best returns.
Table No: 5.7
Factors that motivates to invest in equity market
Variable No of Respondents Percentage
Return 45 45
Liquidity 30 30
73
Safety 5 5
Capital Appreciation 15 15
Others 5 5
Total 100 100
Fig No: 5.7
Interpretation
45 percent of investors are motivated by return to invest in equity market.
30 percent of investors are motivated by liquidity to invest in equity market.
5 percent of investors are motivated by safety to invest in equity market.
15 percent of investors are motivated by capital appreciation to invest in equity market
While 5 percent of investors are motivated by other factors like – investment, profit etc.
to invest in equity market.
Table No: 5.8
Percentage of the respondent’s income to invest in equity market
Variable No of Respondents Percentage
Less than 5 % 23 23
73
5% - 10% 45 45
10% - 15% 17 17
15% - 20% 7 7
20% - 25% 5 5
More than 25% 3 3
Total 100 100
Fig No: 5.8
Interpretation
23 percent of the investors are investing less than 5 percent of their income in equity
market.
45 percent of investors are investing 5 percent to 10 percent of their income in equity
market.
17 percent of investors are investing 10 percent to 15 percent of their income in equity
market.
7 percent of investors are investing 15 percent to 20 percent of their income in equity
market.
73

5 percent of investors are investing 20 percent to 25 percent of their income in equity
market.
3 percent of investors are investing more than 25 percent of their income in equity
market.
Table No: 5.9
Trading in equity
Variable No of Respondents Percentage
Intraday 15 15
Delivery 25 25
Speculation 30 30
Arbitrage 17 17
Hedging 12 12
Total 100 100
Fig No: 5.9
Interpretation
73

According to this chart:
15 percent of the investors are doing intraday trading in equity market. Intraday trading is
trading for that one day only. Means any securities that are purchase and sell within the
day.
25 percent of the investors are investing in equity market as a delivery base trading.
Delivery based trading is normally considered as a safer approach for trading in shares
when compared to day trading. Delivery based trading involves buying shares on a
market day and selling them after receiving the delivery of those shares in demat account.
30 percent of the investors are trading in equity market as a speculator. Speculators are
those classes of investors who willingly take higher than average risk in return for a
higher than average profit potential in future. A speculators aim primarily at quick profit
from a short term acquisition of assets.
17 percent of investors are arbitrage in equity market. Arbitrage means that purchases
securities in one market for immediate resale in another in the hope of profiting from the
price differential.
12 percent of investors are trading in equity market as hedgers. Hedging means reducing
or controlling risk. Hedgers wish to eliminate or reduce the price risk to which they are
already exposed.
Table No: 5.10
The time horizon for investing in equity market
Variable No of Respondents Percentage
Less than 1 month 14 14
1 – 3 months 28 28
3 – 6 months 15 15
6 – 12 months 18 18
More than 12 months 25 25
Total 100 100
73
Fig No: 5.10
Interpretation
14 percent of investors invest in equity market for less than 1 month.
28 percent of investors invest in equity market for the period of 1 month to 3 months.
15 percent of investors’ time horizon for in equity market is 3 to 6 months.
18 percent of investors’ time horizon for in equity market is 6 to 12 months.
25 percent of investors’ invest in equity market for more than 12 months.
Table No: 5.11
The rate of return expected by the respondents
Variable No of Respondents Percentage
5% - 10% 12 12
10% - 15% 18 18
15% - 20% 32 32
20% - 25% 26 26
25% - 30% 8 8
Total 100 100
73

Fig No: 5.11
Interpretation
12 percent of investors expect 5% - 10% return from equity market.
18 percent of investors expect 10% – 15% return from equity market.
32 percent of investors expect 15% - 20% return from equity market.
26 percent of investors expect 20% - 25% return from equity market.
8 percent of investors expect 25% - 30% return from equity market.
Table No: 5.12
Investors’ satisfaction with the current performance of the equity market in terms of expected return.
Variable No of Respondents Percentage
Fully Satisfied 17 17
Satisfied 42 42
Neutral 28 28
Unsatisfied 10 10
Fully unsatisfied 3 3
Total 100 100
73
Fig No: 5.12
Interpretation
17 percent of investors are fully satisfied from the current performance of equity market.
42 investors are satisfied from equity market.
28 percent of investors are neutral with current performance of equity market.
10 percent of investors are unsatisfied from equity market.
While 5 percent of investors are fully unsatisfied from the equity market.
Table No: 5.13
The respondents who are influenced to enter the equity market
Variable No of Respondents Percentage
Friends 30 30
Relatives 12 12
Advisers 26 26
Media 17 17
Research report 26 26
Magazines 5 5
Total 100 100
73
Fig No: 5.13
Interpretation
Friends motivate 30 percent of the investors to enter into the equity market.
Relatives motivate 12 percent of the investors to enter into the equity market.
26 percent of investors enter in equity market by the advice of financial advisor.
Media motivate 17 percent of the investors to enter into the equity market.
Research report 10 percent of the investors to enter into the equity market.
5 percent of investors are motivated by reading magazines to enter into the equity market.
Table No: 5.14
Factor considered being the most important while selecting the sector.
Variable No of Respondent Percentage
Market Trend 36 36
Profitability 28 28
Economic Condition 14 14
73
Industry Condition 16 16
Government Policy 6 6
Total 100 100
Fig No: 5.14
Interpretation
36 percent of the investors have considered market trend as most important factor while
selecting the sector.
28 percent of the investors have considered profitability as most important factor while
selecting the sector.
14 percent of the investors have considered economic condition as most important while
selecting the sector.
16 percent of the investors have considered industry condition as most important while
selecting the sector.
6 percent of the investors have considered government policy as most important while
selecting the sector.
73

Table No: 5.15
Preferences of the sectors
Variables No of Respondents
1 2 3 4 5
Total
Oil and Gas Sector 58 20 12 6 4 100
Banking Sector 10 14 60 5 11 100
IT Sector 25 4017 10 8 100
Infrastructure Sector 15 10 8 18 49 100
Automobile Sector 6 17 2145 11 100
On the basis of the above table investors have given 1st to 5th rank for the following sectors
Table No: 5.16
Variable No of Respondents Rank
Oil and Gas 58 1st
IT Sector 40 2nd
Banking Sector 60 3rd
Automobile 45 4th
Infrastructure 49 5th
Interpretation
Oil and Gas Sector
73
58 investors gave first rank, 20 investors gave second rank, 12 investors gave third rank,
6 investors gave fourth rank and 4 investors gave fifth rank to this sector.
Here, overall 58 investors have selected oil and gas sector as first rank in comparison
with first rank of all sectors.
IT Sector
25 investors gave first rank, 40 investors gave second rank, 17 investors gave third rank,
10 investors gave fourth rankand 8 investors gave fifth rank to this sector.
Here, overall 40 investors have selected IT sector as second rank in comparison with
second rank of all sectors.
Banking Sector
10 investors gave first rank, 14 investors gave second rank, 60 investors gave third rank,
5 investors gave fourth rank and 11 investors gave fifth rank.
Here, overall 60 investors have selected banking sector as third rank in comparison with
third rank of all sectors.
Automobile Sector
6 investors gave first rank, 17 investors gave second rank, 21 investors gave third rank,
45 investors gave fourth rank and 11 investors gave fifth rank.
Here, overall 45 investors have selected automobile sector as fourth rank in comparison
with fourth rank of all sectors.
Infrastructure Sector
15 investors gave first rank, 10 investors gave second rank, 8 investors gave third rank,
18 investors gave fourth rank and 49 investors gave fifth rank.
Here, allover 49 investors have selected infrastructure sector as fifth rank in comparison
with fifth rank of all sectors.
73

Table No: 5.17
Preferences based on the factors for selecting a company
Variable No of Respondents
1 2 3 4 5 6
Total
EPS 10 44 8 16 20 2 100
Dividend 6 20 46 7 9 12 100
Brokers Advice 10 23 11 3 44 9 100
Market capitalization 9 16 10 50 8 7 100
Performance of Company 5 10 8 6 9 62 100
PE Ratio 54 13 4 10 2 17 100
Table No: 5.18
Variable No of Respondents Rank
PE Ratio 54 1st
EPS 44 2nd
Dividend 46 3rd
Market Capitalization 50 4th
Brokers Advice 44 5th
Performance of Company 62 6th
73

Interpretation
PE Ratio
54 investors gave first rank, 13 investors gave second rank, 4 investors gave third rank,
10 investors gave fourth rank, 2 investors gave fifth rank and 17 investors gave sixth
rank.
Here, overall 54 investors have selected PE Ratio as first rank in comparison with first
rank of all the factors.
EPS
10 investors gave first rank, 44 investors gave second rank, 8 investors gave third rank,
16 investors gave fourth rank, 20 investors gave fifth rank and 2 investors gave sixth
rank.
Here, overall 44 investors have selected EPS as second rank in comparison with second
rank of all the factors.
Dividend
6 investors gave first rank, 20 investors gave second rank, 46 investors gave third rank, 7
investors gave fourth rank, 9 investors gave fifth rank and 12 investors gave sixth rank.
Here, overall 46 investors have selected dividend as third rank in comparison with third
rank of all the factors.
Market Capitalization
9 investors gave first rank, 16 investors gave second rank, 10 investors gave third rank,
50 investors gave fourth rank, 8 investors gave fifth rank and 7 investors gave sixth rank.
Here, overall 50 investors have selected market capitalization as fourth rank in
comparison with fourth rank of all the sectors.
Broker’s Advice
73
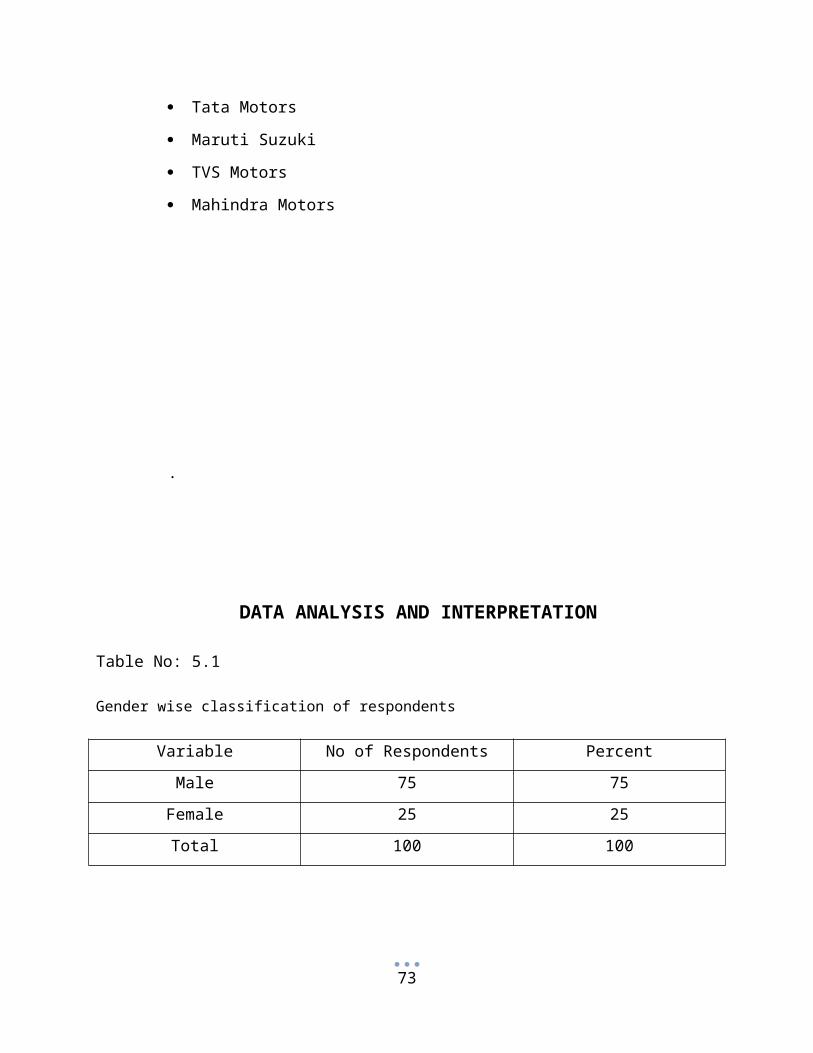
10 investors gave first rank, 23 investors gave second rank whereas 11 investors gave
third rank, 3 investors gave fourth rank, 44 investors gave fifth rank and 9 investors gave
sixth rank.
Here, overall 44 investors have selected broker’s advice as fifth rank in comparison with
fifth rank of all the sectors.
Performance of Company
5 investors gave first rank, 10 investors gave second rank, 8 investors gave third rank, 6
investors gave fourth rank, 9 investors gave fifth rank and 62 investors gave sixth rank.
Here, overall 62 investors have selected performance of company as sixth rank in
comparison with sixth rank of all the sectors.
FINNDINGS AND SUGGESSTIONS
FINDINGS
73

75 percent of respondents are investing in Equity Market, while 25 percent of investors
are not investing in Equity Market as per sample size of 100.
63 percent of investors believe that Equity Market is better investment option and will
provide the best returns in compare to other investment.
45 percent of investors who are dealing in equity market they are motivated by Return
factor and 30 percent of investors are motivated by Liquidity and some investor also
consider Capital Appreciation and Safety factor while investing in equity market in
various sectors.
45 percent of the investors are ready or interested to invest their 5%-10% of income in
equity market. It means many investors trust on the growth of equity market as they are
ready to spend major proportion of their income.
Very few investors want to deal in Hedging trading which shows that they consider safety
factors while investing. 30 percent of investors are trading in equity market as Speculator,
means 30 percent of investors who willingly take higher-than-average risk in return for a
higher-than-average profit potential.
28 percent of investors invest in equity market for the period of 1 to 3 months and the
same proportion of investors are investing for long period more than a year.
32 percent of investors expect 15%-20% return from equity market and 26 percent of
investors expect 20%-25% return from equity market. Here, investors are more expects
from equity market.
42 percent of investors are satisfied with current performance of the equity market in
terms of expected return, while 28 percent of investors are Neutral about equity market.
Most of the investors are motivated by their friends to enter in the equity market and
some investors are motivated by Advisers, Media, Research Report and other factors like
and self-study of current scenario of equity market.
36 percent of the investors have considered Market Trend and 28 percent of the investors
have considered Profitability as a most important factor while selecting the Sector. There
are also other factors like- Government Policy, Industry Policy and Economic Condition
are important factor while selecting the sector.
14 investors selected Oil and Gas sector as a First Rank (in comparison with First Rank
of all sectors)
73
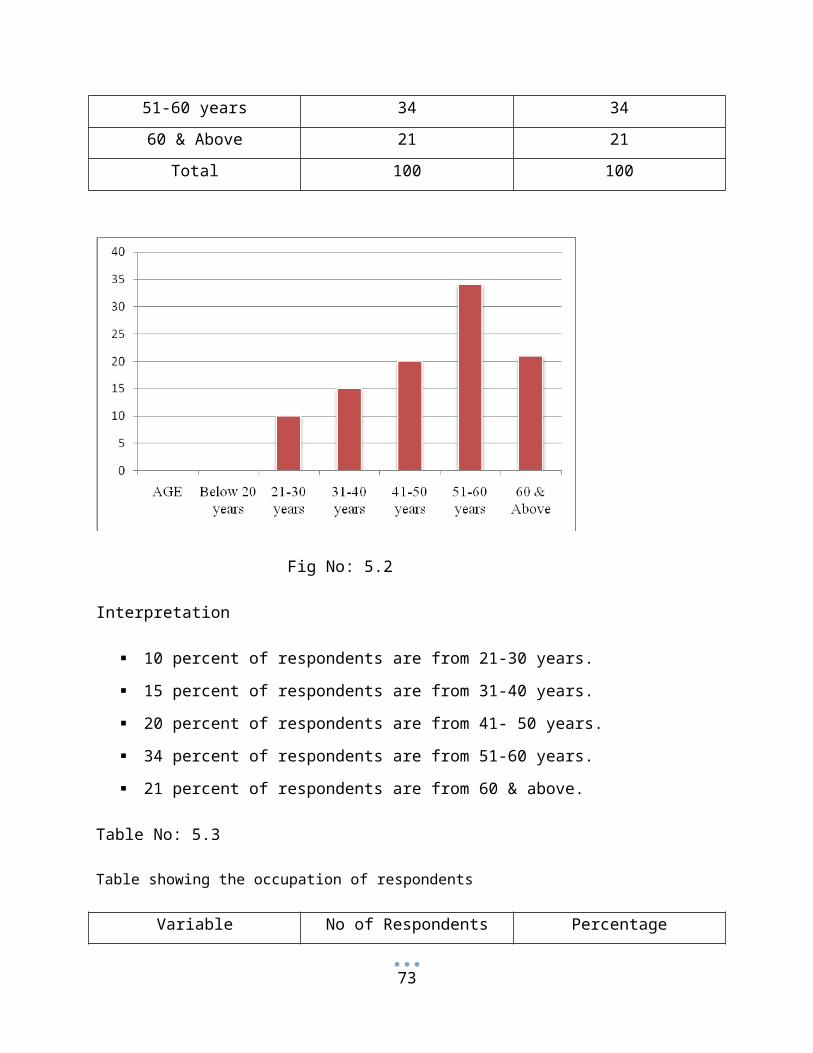
20 investors have selected IT sector as Second Rank
53 investors have selected Banking sector as Third Rank
8 investors have selected Automobile sector as Fourth Rank
5 investors have selected Infrastructure sector as Fifth Rank
It is also found that 26 investors have selected Price Earnings Ratio as First Rank in
comparison of selecting the company of their choice.
19 investors have considered Earnings per Share as Second Rank
17 investors have selected Dividend as Third Rank
16 investors have selected Performance of Company as Fourth Rank
15 investors have selected Brokers Advice as Fifth Rank
6 investors have considered Market Capitalization as Sixth Rank
SUGGESTIONS
For Investors
73
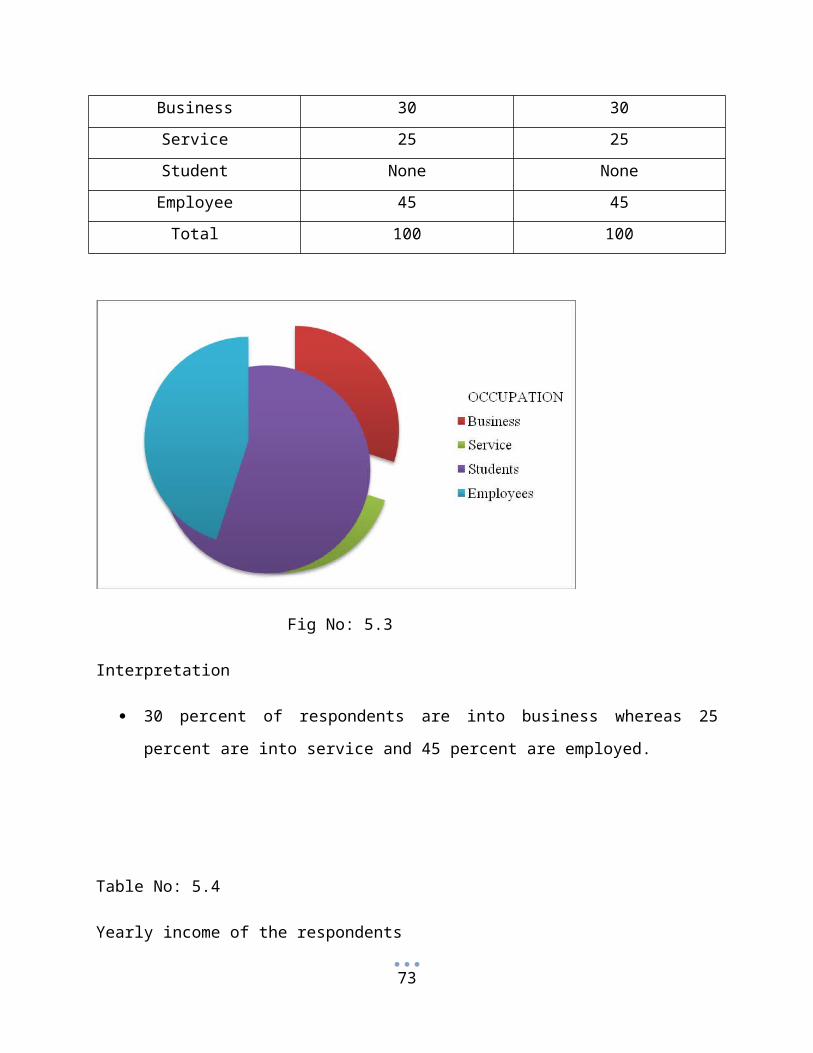
The investors should prefer investment for long term investment strategy that provides
moderate return with liquidity.
Investors should not invest in only equity market but also invest in other Safe Securities
like- Fixed Deposits, Government Securities, Bonds Mutual Funds and Insurance etc.
which also provides moderate returns.
For example: One should prefer
Equity – 50 percent
Other Securities – 50 percent
So, one can get moderate return with liquidity.
Investors should invest money at lower price and sell the stock at higher price.
Investors should select company on the basis of PE ratio, EPS, Current Growth of
Company and Market Capitalization and many more. So, investors can get higher return
on their investment.
They should always invest extra money in stock market and should not invest by taking
loan from banks or other resources.
For Company
75 percent are investing in equity market, so more focus should be on 25 percent of
investors who are not investing in equity market.
Broking firms or companies should promote equity investment aggressively for long term
investment purpose.
Majority of investors are investing in secondary market (equity market) and very few
investors are investing in primary market. So, here broking firm should promote to their
client for investing in primary market.
Company should have to concentrate on those people who are not investing in equity
market because of high risk than covert them in investing other security like- Mutual
Fund, Bonds and Insurance etc. which also provides moderate return.
The Stock Broking firm should also provide better services to the investor to increase the
satisfaction level of the investors.
Company should focus on students also because equity market has risk and younger
generation likes to take risk.
73
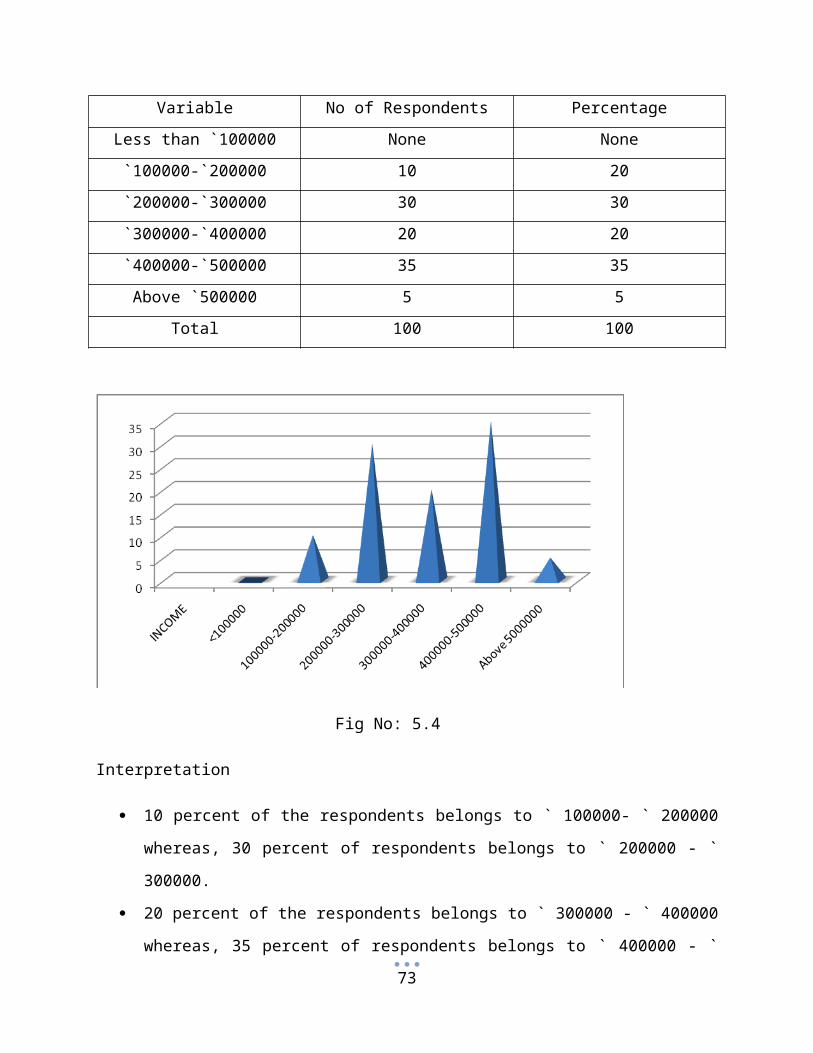
Majority investors are investing in Oil and Gas sector and IT sector. So, Company should
also suggest to investors for investing other sector which is also profitable.
CONCLUSION
From the survey it is found that majority are investing in equity market only due to high return
and hedge the risk by investing their major proportion of income in equity market. Here, most of
73
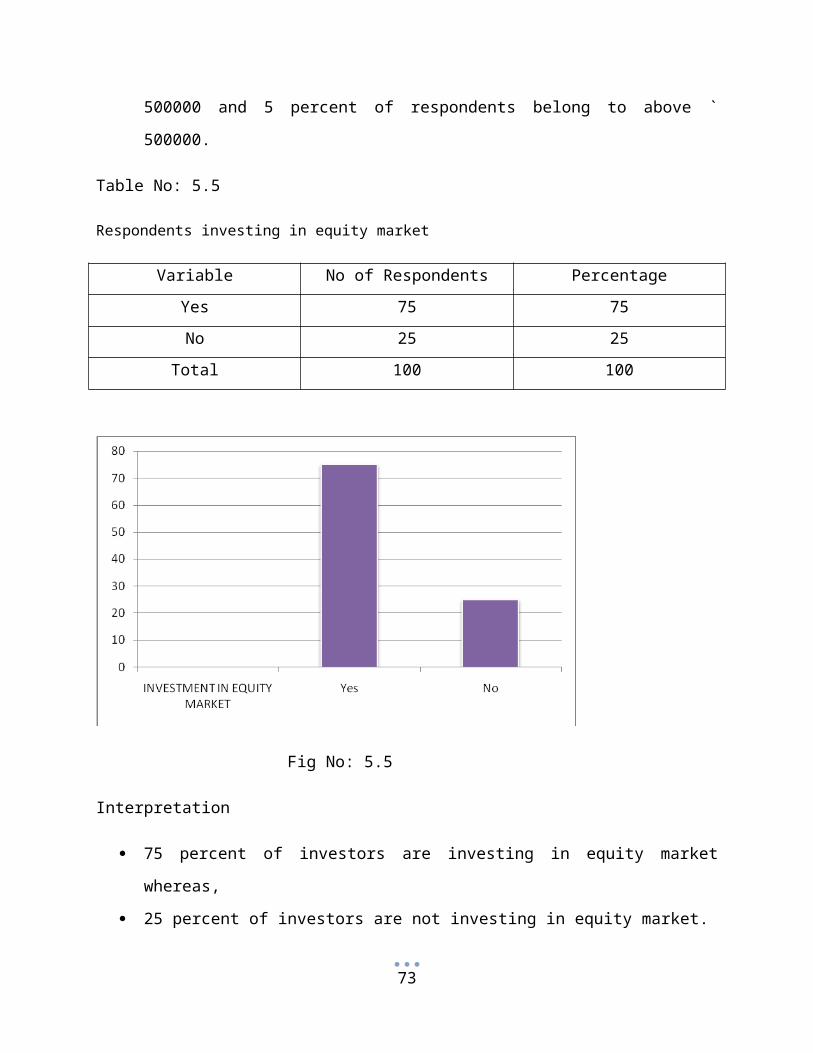
the people trade in equity market as a speculation and they invests for one to three months.
Generally, the investors who invest for long period, that is, for more than a year are surely
beneficial in equity market. Most of the investors are motivated by their friends and Medias
advise to enter into equity market and are expecting something more from the equity
market.Majority of the investors prefer the Oil and Gas sector for their investment as on the basis
of market trend, profitability, industry condition and economic condition while selecting the
sector and investors have also considered Price Earnings Ratio, Earning per Share and Dividend
as the most important factors while selecting a company under these selected sectors. Hence it is
found that even though most of the investors are satisfied with equity market, there are few who
are not satisfied with equity market yet.
Bibliography
Books:
73

Gordon & Natrajan, “Financial Markets and Services” second revised edition reprint,
Himalaya Publishing House, 2005.
Investment Management- V.A. AVADHANI
Websites:
www.sharekhan.com
www.nseindia.com
www.bseindia.com/markets/equity.aspx
Newspaper:
Economic Times
Other:
Sharekhan’s brochure
NCFM-capital market dealers module
QUESTIONNAIRE ON INVESTORS’ PERCEPTION
TOWARDS INVESTMENT IN EQUITY MARKET
73
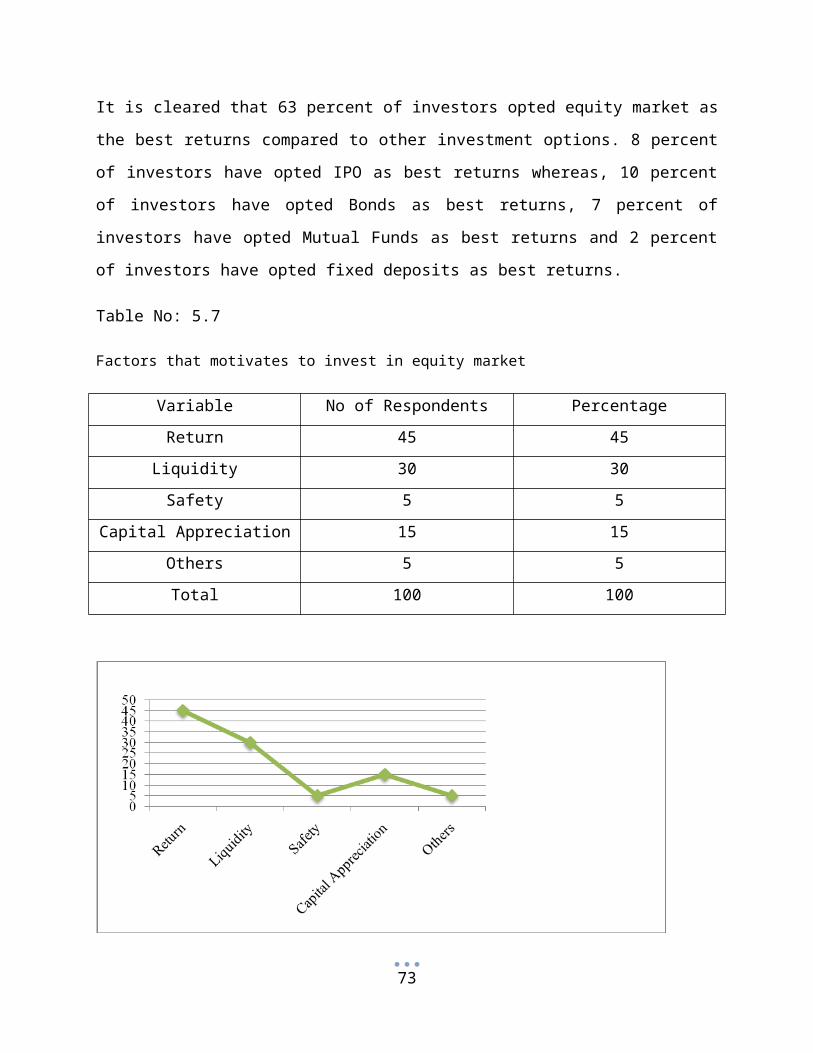
I am Karen Sylvia Pais final year MBA student of SDM College of post-graduate center and
research studies. I am conducting a project on investors’ perception towards investment in equity
market. This project is taken as a partial requirement for the completion of my MBA degree
under Mangalore University.
I seek your kind assistance in completing the questionnaire by taking your valuable time. This
information is purely for an academic purpose and will be treated as highly confidential.
1. Name:
2. Gender:
Male Female
3. Age:
Below 20 years 21 to 30 years 31 to 40 years
41 to 50 years 51 to 60 years Above 60 years
4. Occupation:
Business Student Service Employee
5. Income (yearly)
Less than ` 100000 ` 100000 to ` 200000
` 200000 to ` 300000 ` 300000 to ` 400000
` 400000 to ` 500000 Above ` 500000
6. Do you invest in Equity Market?
Yes No
7. If you want to invest, which investment option would you feel provides the best returns?
Equity Shares IPO Mutual Fund
Bonds’ Fixed Deposits
8. Which factors motivates you to invest in Equity Market?
Return Liquidity Safety
73

Capital Appreciation If any other please specify…………………….
9. What percentage of your income would you invest in Equity Market?
Less than 5% 5% - 10% 10% - 15%
15% - 20% 20% - 25% More than 25%
10. How do you trade in Equity Market?
Intraday Delivery Speculation
Arbitragers Hedging
11. What is the time horizon for investing in Equity Market?
Less than 1 month 1 – 3 months 3 – 6 months
6 – 12 months More than 12 months
12. What is the rate of return expected by you from Equity Market in a year?
5% - 10% 10% - 15% 15% - 20%
20% - 25% 25% - 30% 30% above
13. Are you satisfied with the current performance of the Equity Market in terms of expected
return?
Fully Satisfied Satisfied Neutral
Unsatisfied Fully Unsatisfied
14. Who influenced you to enter into Equity Market?
Friends Relative Advisers
Media Research Report Magazines
15. Which factor do you consider is most important while selecting the sectors?
Market Trend Profitability Economic Condition
Industry Condition Government Policy
16. Rank the following sectors based on your preference for investment?
Oil and Gas sector Infrastructure sector Banking sector
Automobile sector IT sector
17. Rank the most important factor selecting a company of your choice?
Earnings per Share Dividend Brokers
Market Capitalization Performance of Company PE Ratio
18. If any suggestion from your side, then please specify……………………………………
73

73