Embed Size (px)
Citation preview

7/31/2019 A project on SCM
http://slidepdf.com/reader/full/a-project-on-scm 1/12
Date : 21 November 2011
Tracom rESEarcH
Log on to www.tracom.co.in for further details. For Private Circulation Only
rBI tiues hwish ste t btte stub-bl high iai
India’s ination continues to remain stubborn despite a good
monsoon this year and strong outlook of the Kharif harvest. This
has prompted the Reserve Bank of India (RBI) to push up the
pace of monetary policy tightening. The apex bank in its maiden
mid-quarterly policy review on September 16, 2010 started the
rate hike binge and continued the hawkish stance. The RBI so far
has raised the Cash Reserve Ratio (CRR) by 100 basis points, and
raised the repo rate by 350 basis points in 12 hikes. The effectual
tightening has been of 500 basis points as liquidity in the system
transited from surplus to decit. With the recent hike, repo rate, at
which banks borrow money from RBI, now stands at 8.50% while
reverse repo rate at which, banks park surplus money with RBI is
at 7.50%.
On the interest rate policy, as pointed out in the second quarter
review of November 2010, the RBI had oated a discussion paper
on deregulation of savings bank deposit interest rate for sugges-
tions. The paper spelt out both the pros and cons of deregulating
the savings bank deposit interest rate. After examining the sug-
gestions, RBI deregulated the savings bank deposit interest rate,
where banks are now free to determine their savings bank deposit
interest rate depending on following two conditions. First, each
bank will have to offer a uniform interest rate on savings bank
deposits up to Rs 1 lakh irrespective of the amount in the account
within this limit. Second, for savings bank deposits over Rs 1 lakh,
a bank may provide differential rates of interest, if it so chooses.
However, the banks are not supposed to do any discrimination
from customer to customer on interest rates for similar amount
of deposit.
The mid-quarterly review may not have many surprises as one
expected the RBI to continue with its already public concerns on
ination. In what pursues, let us review the macroeconomic back-
ground with which RBI went into the mid-policy review, major
takeaways from the policy release of the central bank and how theRBI may tackle the emerging ination scenario going forward.
EconomIc analySIS
Pi Bp
The mid-quarterly review of the RBI was set in the backdrop of
slacking GDP growth, decelerating industrial output and stub-
bornly high ination. Domestic economy’s GDP decelerated to
7.7% in April-June quarter of 2011-12 from 8.8% a year ago, and
7.8% in Q4 of 2010-11. From the supply side, the deceleration in
growth in rst quarter was mainly on the back of slower growth in
mining, manufacturing, construction and community, social and
personal services.
On the same time the Industrial growth, as measured by the index
of industrial production (IIP), decelerated to 5.6% during April-
August 2011 from 8.7% in the corresponding period of the pre-
vious year. This was mainly on account of slowdown in capitalgoods, intermediate goods and consumer durables. Growth of
eight core infrastructure industries during April-August 2011 also
slowed down to 5.3% from 6.1% in the corresponding period of
last year. Manufacturing sector growth decelerated signicantly to
6.0% during April-August 2011 from 9.2% during the correspond-
ing period of last year. The lower growth in manufacturing was
on account of negative growth in 14 out of 22 industry groups. As
per use-based classication, moderation in growth was evident in
all categories except basic goods and consumer non-durables. The
persistent volatilities in industrial growth remained a discourag-
ing factor particularly in the rising ination and interest rate sce-
nario. Although services sector so far has retained the growth mo-
mentum, but its sustainability in the long-run will largely depend
on the developments in the global economy.
Domestically, inationary pressures still persisted and Wholesale
Price Index (WPI) y-o-y ination was at 9.7% (provisional) for the
month of September 2011. Ination remained at above 9% over
consecutive months in the rst half of the year, and price pres -
sures persisted across the range of commodities covered in the
WPI. Though in primary food articles, ination moderated from
the levels of over 20% witnessed in the rst quarter of 2010-11, it
still remains high with the average ination during 2011-12 so far
(up to September) at 8.9%. A breakdown of food articles ination
species that the price pressures have been moderated for cereals
whereas increases have been noteworthy in the case of protein-
Special repot
key policy rates
0
1
2
3
4
5
6
7
8
9
2 1 / 4 / 2 0 0 9
1 3 / 2 / 2 0 1 0
2 7 / 2 / 2 0 1 0
1 9 / 3 / 2 0 1 0
2 0 / 4 / 2 0 1 0
2 4 / 4 / 2 0 1 0
0 7 - 0 2 - 2 0 1 0
2 7 / 7 / 2 0 1 0
1 6 / 9 / 2 0 1 0
1 1 - 0 2 - 2 0 1 0
2 5 / 1 / 2 0 1 1
1 7 / 3 / 2 0 1 1
0 5 - 0 3 - 2 0 1 1
1 6 / 6 / 2 0 1 1
2 6 / 7 / 2 0 1 1
1 6 / 9 / 2 0 1 1
2 5 / 1 0 / 2 0 1 1
Reverse
Repo Rate
Repo Rate
CRR
GdP at factor cost
0
2
4
6
8
10
12
Q1 2010-11 Q2 2010-11 Q3 2010-11 Q4 2010-11 Q1 2011-12
agriculture, forestry & fishing mining & quarryinelectricity, gas & water supply constructionGDP at factor cost manufacturing

7/31/2019 A project on SCM
http://slidepdf.com/reader/full/a-project-on-scm 2/12
Date : 21 November 2011
Tracom rESEarcH
Log on to www.tracom.co.in for further details. For Private Circulation Only
rich items. Demand has been growing in these items in recent
years with rising income and changes in dietary pattern in favour
of protein rich items. The recent food ination numbers breached
the psychological barrier and surged to a nine month high level at
12.21% for the week ended October 22. Whereas, ination in non-food manufactured products remained at above 7% over eight
successive months.
Increase in governed prices of fuel products effected in June 2011
led to rming up of fuel ination. Since then, prices of freely priced
mineral oil products have raised partly on account of the recent
depreciation of the rupee. Notwithstanding recent increases, the
pass-through of global ination to domestic ination remains
incomplete. The rupee depreciated by about 11% against the US
dollar in 2011-12 so far. India’s imports account for about 22% of
GDP, and depreciation of the rupee raises the risk of imported
ination.
Though export growth outpaced import, the current account de-
cit (CAD) surged in the rst quarter of 2011-12 in absolute terms,
reecting sharp increase in imports of oil, gold, silver, machin -
ery and electronics. India’s export growth has shown unexpected
enthusiasm in recent months, despite the slowdown in advanced
economies and rising global uncertainty. However, there was a
sharp rise in imports as well, which led to the widening of trade
decit. The high growth in imports came from an increase in oil
imports and non-oil imports.
Further, economic activity in advanced economies destabilized
further in third quarter of 2011. Increasing concerns over medium-
term sovereign debt dynamics in the euro area and, in particu-
lar, considerable potential losses to banks holding this debt have
impacted global nancial markets extremely. The unfavorable
feedback loops among sluggish growth, weak sovereign balance
sheets, large exposures of banks to sovereign debt and political
compulsions coming in the way of a probable solution have cre -
ated a crisis of condence, which is a potential threat to regional
and global nancial stability.
Pi review
The monetary policy statement released by the RBI had ination-
ary concerns spilled all over, be it the global or domestic one. The
RBI stated that the risk to the growth projection was on the down-
side mainly on account of slowing down of the global economy
activity and softening domestic demand. Slower global growth
will have an adverse impact on domestic growth, particularly on
industrial production, given the rising inter-linkages of the Indian
economy with the global economy. Based on these reections, the
baseline projection of GDP growth for 2011-12 is revised down-
wards to 7.6%. Upside risk to ination is likely to persist in near-
term before moderating as falling global commodity prices pro-
vide limited comfort.
Further the RBI also stated that ination lane will be formed by
both demand and supply factors, which will depend on the fol -
lowing:
1. The extent of moderation in aggregate demand. Some signs of
demand are evident, though the impact is being felt more on
the investment side.
2. The behavior of crude prices will be a vital factor in determin-
ing the outlook of domestic ination in near term. Despite the
lethargic growth prospects of the global economy, crude prices
have moderated only slightly. Further the exchange rate will
also have some impact on the performance of domestic oil
prices.
3. The ination outlook will also depend on the supply response
in respect of those commodities where there are structural dif-
ferences, mainly protein items.
4. Above all there is still an element of suppressed ination asdomestic prices of controlled petroleum products do not re-
ect the full pass-through of global commodity prices. The re-
cent decline in crude prices has been counterbalanced by the
depreciation of the rupee. In addition, there are other items
such as coal whose current prices do not reect the underlying
market conditions. Since coal is an input for electricity, coal
prices, as and when raised, will also have implications for elec-
tricity tariffs.
The apex bank indicated that though the ination has remained per-
sistently high over the past two years, it is important to note that
during the 2000s, it averaged around 5.5%, both in terms of WPI and
CPI, down from its earlier trend rate of about 7.5%. While the RBI
accepted that ination peaked, it nonetheless added that it would
continue to moderate from the high levels for months to come.
moveent of foo inflation & fuel
0
2
46
8
10
12
14
16
18
O c t - 1 0
N o v - 1 0
D e c - 1 0
J a n - 1 1
F e b - 1 1
M a r - 1 1
A p r - 1 1
M a y - 1 1
J u n - 1 1
J u l - 1 1
A u g - 1 1
S e p - 1 1
O c t - 1 1
FoodInflation
Fuel
Inflation an IIP growth
0
2
4
6
8
10
12
O c t - 1 0
N o v - 1 0
D e c - 1 0
J a n - 1 1
F e b - 1 1
M a r - 1 1
A p r - 1 1
M a y - 1 1
J u n - 1 1
J u l - 1 1
A u g - 1 1
S e p - 1 1
HeadlineInflation
IIP

7/31/2019 A project on SCM
http://slidepdf.com/reader/full/a-project-on-scm 3/12
Date : 21 November 2011
Tracom rESEarcH
Log on to www.tracom.co.in for further details. For Private Circulation Only
The central bank also put its concern on global outlook that a ma-
jor downside risk to growth originates from the global macroeco-
nomic environment. Finally the RBI stated that the ination rate
will begin falling in December 2011 and it continued to decline
to 7% by March 2012. Notwithstanding current rates of inationpersisting till November, the probability of a rate hike in the De-
cember mid-quarter review is comparatively low. Ahead of that, if
the ination trajectory conforms to projections, further rate hikes
may not be warranted. However, as always, actions will depend
on evolving macroeconomic conditions, which means monetary
policy stance is not yet complete.
Gig fw
Iai: Food prices in India have remained high for several
months mainly on the back of growing demand for high-protein
diets and increase in prices of vegetables, milk, and pulses haverestricted the overall ination from easing. Milk-based products
seem to be hardest hit, with the price of milk rising 12-18% over
the last 12 months and on the other hand prices of other food
items have reached their peak. The persistent high food ination
number reinforces expectations that price pressures won’t ease
anytime soon, even as the apex bank projects headline ination
to start easing from December to 7% by March. Headline ination
hovered over 9% for 10 consecutive months through September.
Steamy food prices could trouble the projections and build pres-
sure on the Reserve Bank to revisit the pause in rate increases that
it has indicated it would likely adopt for now.
Further on the agriculture side, rainfall during the south-west
monsoon reported to be 1% above normal, which in one way could
help food ination to come down, though it may not translate into
lower prices at least in the near term. The rst advance estimates
for the 2011-12 Kharif season point to record production of rice,
oilseeds and cotton while, the output of pulses may decline due
to a reduction in acreage. Though agriculture prediction remain
encouraging, overall growth in 2011-12 is likely to moderate to
below trend.
Isial Gwh: The hold up in industrial growth is in fact
becoming wide-ranging and gaining impetus as evident from thelatest trends. Rising interest rates have taken a denite toll on in-
dustrial investment as well as consumer demand particularly for
consumer durables. The rate hike announced in the month of Oc-
tober 2011 may further reect on the industrial production costs
and may hurt the growth prospects. The continued fall in output
as well as sales of major automobiles in the month of October 2011
as per the latest data released by the Society of Indian Automobile
Manufacturers (SIAM) hints the further slowdown in industrial
output in October 2011. The slowdown observed in general in the
industrial sector and manufacturing sector in particular is spread-
ing to automobile sector also. The drop in domestic sales may fur-ther add to the slowdown in production in the coming months.
Thus, industrial output may become stagnant or post a negligible
growth in the next two months particularly due to rising base.
Services sector also started viewing a slowdown in activity al-
though in selected segments. On the whole, all the lead indica-
tors of services sector like commercial vehicles production, cell
phone connections, air cargo, and passengers handled at domestic
and international terminals too have witnessed retarding growth.
Thus, services sector is also coming under the clutch of slowdownthough the extent and strength of slowdown is not yet apparent.
Cei Gwh: Despite the steady rise in interest rates, the credit
growth remained high and deposits growth has not picked up the
pace to the extent of expectations. The recent policy rate hike by
the Reserve Bank of India has so far not been passed on by the
banks through rising rates of loans and deposits. However, there
is a steady rise in market borrowing rates both in short and long-
term, signifying that the banks may raise lending and deposit
rates soon.
Exeal Sec: Trade decit rose to record high of $19.6 billion
in the month of October 2011 on the back of sharp fall in exports
to a 10-month low. Total investment inows, continued to fall
sharply by about 40% on m-o-m and about 95% on y-o-y basis to
$616 million in September 2011 due to continued net outows of
portfolio investments and slowdown in direct investments during
the month. Similar movements may continue due to the uncer-
tain global economic concerns. Thus, the external sector outlook
emerges to be rather gloomy in the coming months.
Glbal Ecm: Uncertainties over scal weakening are further
burdened by the stagnant unemployment situation and signal to-
wards a grim outlook of the US economy. Though the economy
would jumble along at about 2.5% to 3% annual growth, which is
not enough to meaningfully lower the unemployment rate. More-
over concerns over the European debt crisis are threatening larger
as the bond yields are rising steadily and many more countries are
coming under the strap of debt crisis. Further, the crisis has been
leading to political turbulence in the region particularly in Greece
and Italy. The yields of gilts have also gone up considerably in
France and Germany. On the other hand, the emerging economies
the growth drivers throughout the nancial crisis are also seeing
a slowdown stressed by strong inationary pressures. As a con-
sequence, the recovery in global economy may observe a further
slowdown and the possibility for a double dip recession now ap -
pears to be rising. On the whole, global growth prospects appear
to be weakening, even though recovery has not delayed.
Ecnmic outlk fr 2011-12
37.1
10
36.7
2.7
34
6.5 6.8
Agr icul tu re In du stry S ervices Investmentrate
CAD (% ofGDP)
Savingsrate (% of
GDP)
Inflation(March
2012)
Fiscaldeficit
Projected rates (2011-12)

7/31/2019 A project on SCM
http://slidepdf.com/reader/full/a-project-on-scm 4/12
Date : 21 November 2011
Tracom rESEarcH
Log on to www.tracom.co.in for further details. For Private Circulation Only
Stee authit of Ii - H
Ivestet veview
• SAIL, one of the ve Maharatna is the leading steel-making
company of the country having a huge marketing network.
• Its average product price during the last quarter was around
16% higher at Rs 36,230 a tonne from the previous quarter.
• The company plans to invest Rs 35000 crore to build a factory
at a shuttered fertilizer plant in Jharkhand.
• The company in principle has received approvals for Rs 60,000
crore approximately for moderanisation and expansion.
Busiess oveview
Steel Authority of India Limited (SAIL), a fully integrated iron andsteel maker is a Maharatna and the leading steel-making company
of the country. It was formed in 1973, as a holding company,
for Hindustan Steel Limited, Bokaro Steel Limited, Salem Steel
Limited, BCCL and NMDC. Later in 1978, SAIL became an
operating company and Steel making subsidiaries were dissolved
and merged BCCL and NMDC were spun off as independent
companies. SAIL has triggered the secondary and tertiary waves
of economic growth by continuously providing the inputs for the
consuming industry.
SAIL manufactures and sells a broad range of steel products,
including hot and cold rolled sheets and coils, galvanised sheets,electrical sheets, structural’s, railway products, plates, bars and
rods, stainless steel and other alloy steels. SAIL produces iron
and steel at ve integrated plants and three special steel plants,
located principally in the eastern and central regions of India and
situated close to domestic sources of raw materials, including
the Company’s iron ore, limestone and dolomite mines. SAIL’s
product quality is established in the international market-Exports
to around 20 countries including EU, Middle East, SE Asian &
Neighbouring countries.
The company is having huge marketing network spread all over
India with 37 Branches, 67 Warehouses, 26 Customer Contact
Ofces and over 2500 Dealers covering all districts of India. SAIL
has its own R&D centre & Management Training Institute at
Ranchi with state of art facilities.
Fii Heth
For the quarter ended September 30, 2011 SAIL has reported net
sales of Rs 10979.62 crore, marginally higher by 2.16% compared
to Rs 10747.44 crore in the same period last year. Other income
for the quarter was up by huge 30.61% to Rs 490.28 crore from Rs
375.38 crore Y-o-Y.
Net prot of the company declined sharply by 54.62% to Rs 494.64
crore in the quarter compared to Rs 1090.01 crore mainly because offoreign exchange loss of Rs 508.72 crore against a gain of Rs 152.52
crore in the corresponding previous quarter. Raw material costs
rose 15 percent to Rs 5610 crore in the quarter, while employee
expenses rose 16 percent to Rs 1980 crore. SAIL had gross debt
Stock Data 21/11/2011
Current Mkt Price (Rs) 88.35
52 Week High 197.05
52 Week Low 88.40
Mkt Cap (Rs. in Cr.) 38701.85
Return in last one Month (%) -16.73
Share Holding
Performance in last one year
comPany rESEarcH
Y-o-Y Performance
(Rs. in Cr..)
Particulars Mar 2011 Mar 2010 Change(%)
Net Sales 43251.65 41230.27 4.90
Other Income 1589.84 2035.81 -21.91
Total Expenditure 35686.43 31394.80 13.67
Operating Prot 9155.06 11871.28 -22.88
Interest 474.95 402.01 18.14
Prots After Tax 4904.74 6754.37 -27.38
Reserve & Surplus 0.00 0.00 12.86
Reported EPS(Rs) 11.87 16.35 -27.38
Core EBITDA Margin (%) 15.84 22.01 -28.02
7/31/2019 A project on SCM
http://slidepdf.com/reader/full/a-project-on-scm 5/12
Date : 21 November 2011
Tracom rESEarcH
Log on to www.tracom.co.in for further details. For Private Circulation Only
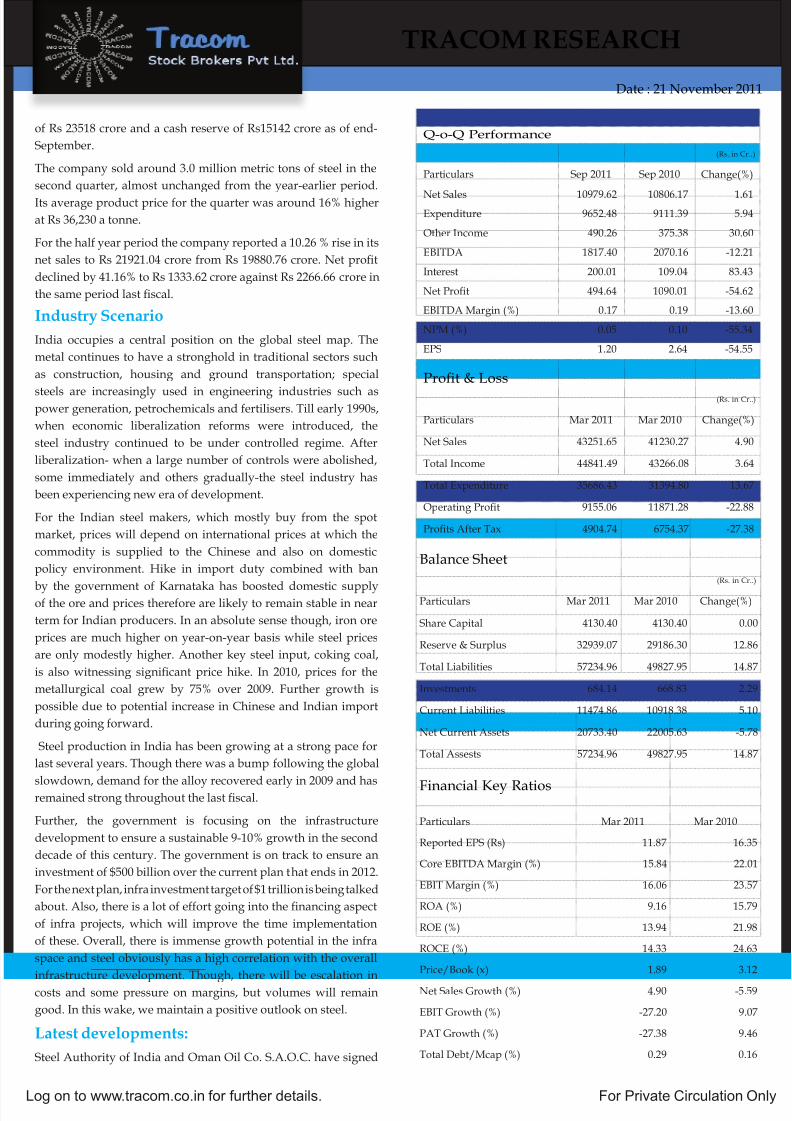
of Rs 23518 crore and a cash reserve of Rs15142 crore as of end-
September.
The company sold around 3.0 million metric tons of steel in the
second quarter, almost unchanged from the year-earlier period.
Its average product price for the quarter was around 16% higher
at Rs 36,230 a tonne.
For the half year period the company reported a 10.26 % rise in its
net sales to Rs 21921.04 crore from Rs 19880.76 crore. Net prot
declined by 41.16% to Rs 1333.62 crore against Rs 2266.66 crore in
the same period last scal.
Iust Sei
India occupies a central position on the global steel map. The
metal continues to have a stronghold in traditional sectors such
as construction, housing and ground transportation; special
steels are increasingly used in engineering industries such aspower generation, petrochemicals and fertilisers. Till early 1990s,
when economic liberalization reforms were introduced, the
steel industry continued to be under controlled regime. After
liberalization- when a large number of controls were abolished,
some immediately and others gradually-the steel industry has
been experiencing new era of development.
For the Indian steel makers, which mostly buy from the spot
market, prices will depend on international prices at which the
commodity is supplied to the Chinese and also on domestic
policy environment. Hike in import duty combined with ban
by the government of Karnataka has boosted domestic supplyof the ore and prices therefore are likely to remain stable in near
term for Indian producers. In an absolute sense though, iron ore
prices are much higher on year-on-year basis while steel prices
are only modestly higher. Another key steel input, coking coal,
is also witnessing signicant price hike. In 2010, prices for the
metallurgical coal grew by 75% over 2009. Further growth is
possible due to potential increase in Chinese and Indian import
during going forward.
Steel production in India has been growing at a strong pace for
last several years. Though there was a bump following the global
slowdown, demand for the alloy recovered early in 2009 and hasremained strong throughout the last scal.
Further, the government is focusing on the infrastructure
development to ensure a sustainable 9-10% growth in the second
decade of this century. The government is on track to ensure an
investment of $500 billion over the current plan that ends in 2012.
For the next plan, infra investment target of $1 trillion is being talked
about. Also, there is a lot of effort going into the nancing aspect
of infra projects, which will improve the time implementation
of these. Overall, there is immense growth potential in the infra
space and steel obviously has a high correlation with the overall
infrastructure development. Though, there will be escalation incosts and some pressure on margins, but volumes will remain
good. In this wake, we maintain a positive outlook on steel.
Laes evelpmes:
Steel Authority of India and Oman Oil Co. S.A.O.C. have signed
Prot & Loss
(Rs. in Cr..)
Particulars Mar 2011 Mar 2010 Change(%)
Net Sales 43251.65 41230.27 4.90
Total Income 44841.49 43266.08 3.64
Total Expenditure 35686.43 31394.80 13.67
Operating Prot 9155.06 11871.28 -22.88
Prots After Tax 4904.74 6754.37 -27.38
Balance Sheet
(Rs. in Cr..)
Particulars Mar 2011 Mar 2010 Change(%)
Share Capital 4130.40 4130.40 0.00
Reserve & Surplus 32939.07 29186.30 12.86
Total Liabilities 57234.96 49827.95 14.87
Investments 684.14 668.83 2.29
Current Liabilities 11474.86 10918.38 5.10
Net Current Assets 20733.40 22005.63 -5.78
Total Assests 57234.96 49827.95 14.87
Financial Key Ratios
Particulars Mar 2011 Mar 2010
Reported EPS (Rs) 11.87 16.35
Core EBITDA Margin (%) 15.84 22.01
EBIT Margin (%) 16.06 23.57
ROA (%) 9.16 15.79
ROE (%) 13.94 21.98
ROCE (%) 14.33 24.63
Price/Book (x) 1.89 3.12
Net Sales Growth (%) 4.90 -5.59
EBIT Growth (%) -27.20 9.07
PAT Growth (%) -27.38 9.46
Total Debt/Mcap (%) 0.29 0.16
Q-o-Q Performance
(Rs. in Cr..)
Particulars Sep 2011 Sep 2010 Change(%)
Net Sales 10979.62 10806.17 1.61Expenditure 9652.48 9111.39 5.94
Other Income 490.26 375.38 30.60
EBITDA 1817.40 2070.16 -12.21
Interest 200.01 109.04 83.43
Net Prot 494.64 1090.01 -54.62
EBITDA Margin (%) 0.17 0.19 -13.60
NPM (%) 0.05 0.10 -55.34
EPS 1.20 2.64 -54.55

7/31/2019 A project on SCM
http://slidepdf.com/reader/full/a-project-on-scm 6/12
Date : 21 November 2011
Tracom rESEarcH
Log on to www.tracom.co.in for further details. For Private Circulation Only
an initial pact to jointly set up a steel plant in Oman with an estimated investment of $3 billion. The two state-run companies aim to set up
the plant with a capacity of 3 million metric tons a year once a feasibility study on the project was completed.
Steel Authority in August said it plans to invest Rs 35000 crore to build a factory at a shuttered fertilizer plant in the eastern state of
Jharkhand, sidestepping land- acquisition hurdles.
Ivestet rtie
• SAIL reported a worse-than-expected 55 percent drop in second-quarter prot largely due to higher coking coal prices and because of
incurring foreign-exchange losses. Coking coal, a key raw material used to make steel, surged 40 percent during the period, comparedwith a 14 percent increase in the price of steel hot-rolled coils. The company imports about 70 percent of the coking-coal it needs, many
other Indian companies too have been hit by a sharp depreciation in the Indian rupee’s value against the dollar in the past few months.
Out of its planned a capital expenditure of Rs 12,600 crore the company has already spent Rs 4,500 crore. The rest will be spent in
the second half. The company’s debt-equity ratio is in stable state and raising of debt or equity will not be an issue for the upcoming
projects.
• Going further Steel Authority of India’s protability might see a further dent in the near-term due to an impending wage revision
for employees. Wage revision for over one lakh employees, excluding ofcers, is due for January 2012 and the employee unions are
demanding a higher increase. SAIL’s employee costs for the nancial year 2012 are estimated at Rs 8,000 crore. Based on the current
revenue, employee wages account for about 20 per cent of SAIL’s turnover. There is a possibility that the wage costs might increase by
Rs 1,000 crore annually and the incremental rise in wage costs would further dent the margins. Its operating prot margins, has been
already impacted by the rising input costs such as coking coal which stood at 12 per cent in the July-September quarter. However, the
management is condent that wage costs would come down with the increase in production over next couple of years. It is of the view
that the output is increasing with the same number of employee.
• SAIL is in the process of implementing its modernization and expansion plan and the company in principle has received approvals for
Rs 60,000 crore approximately for moderanisation and expansion. Rs 10,000 crore approximately for augmentation of raw materials
from existing mines and development of new mines. SAIL’s modernisation plan would increase its capacity from 14 million tonnes per
annum (mtpa) to 24 mtpa by 2014. The company plans to start couple of allied units such as cold roll mill in Bokaro and steel wire rod
mill in the next quarter. Next year when two of the three blast furnaces in Rourkela and Bokaro will be red then the company is likely
to see quantum jump in output which will increase company’s output by about 6 million tonnes in the next scal. IISCO unit in Burnpur
too is expected to be commissioned in the rst half of next year.
• SAIL, along with 6 leading Steel and Iron Ore Manufacturers of India, under a consortium agreement, has submitted the bid document with
Ministry of Mines, Government of Afganistan in September 2011 for exploration concession for Hijigak Iron Ore Deposit, Afghanistan,
as consortium leader. The Afghanistan’s mining ministry has shortlisted the number of foreign investors interested to explore its iron
ore rich Hajigak mine, and it has been reported that the mine will go to an Indian rm. Apart from SAIL, mineral giant NMDC and Ispat
Alloys too are in the fray. The SAIL consortium had bid for all the four Hajigak mining blocks and the local government has reportedly
implied giving preference to companies that could set up a steel plant to improve the value of the Hajigak iron ore project. The iron ore
rich Hajigak mine, located in Bamyan Province, contains the best known and largest iron oxide deposit in Afghanistan. The deposit itself
extends over 32 kilometers. It covers 16 separate zones, up to 5 kilometers in length, 380 meters wide and extending 550 meters down.
• At CMP of Rs 88, the stock is trading at an EV/EBITDA of 4.90x and a P/E multiple of 9.75x with an estimated P/E of 13.5x FY12. We
would recommend a HOLD in the stock with a price target of Rs 106. Steel Authority of India, the nation’s largest producer after Tata
Steel has shown a good improvement in its product mix. Though, its last quarter numbers were impacted by the rise in coking coal prices
and forex loss but the company expects steel demand in India to pick up in the coming months, driven by projects in sectors such as
railways, roads and power. It has plans to spend as much as $12 billion developing plants overseas as demand for the alloy recovers. It
is in talks to build factories in Indonesia, Mongolia and Oman, as well as South Africa. The company has recently signed a pact to jointlyset up a plant in Oman. The country consumes around 4 million tonnes of steel in a year. However, its steel making capacity is under
1 million tonne only hence it offers a good opportunity for SAIL. Going forward, though the export demand is not looking to improve
but the rush to achieve targets on various projects in the terminal year of the 12th Five Year Plan would trigger demand for steel in the
remaining period of current scal.
* EPS & P/E latest (Rs in crore)Pee gp cmpais:
Company Year End Net Sales PBDIT PAT PATM% EPS* P/E*
SAIL 201103 43251.65 7565.22 4904.74 11.34 11.87 9.75
Jindal Steel & Power 201103 9573.63 3646.96 2064.12 21.56 22.09 24.84
Tata Steel 201103 29396.35 11173.09 6865.69 23.36 71.58 5.43
JSW Steel 201103 23163.24 4573.53 2010.67 8.68 88.87 7.10

7/31/2019 A project on SCM
http://slidepdf.com/reader/full/a-project-on-scm 7/12
Date : 21 November 2011
Tracom rESEarcH
Log on to www.tracom.co.in for further details. For Private Circulation Only
oveview
Indian steel industry plays a signicant role in the country’s
economic growth. With the governments proactive incentive plans
to boost economic growth by injecting funds in various industries
is likely to boost the steel demand in future. In 1991, a substantial
number of economic reforms were introduced by the Indian
government which boosted the development process of a number
of industries - the steel industry in India in particular - which has
subsequently developed quite rapidly. The Indian Steel sector has
been experiencing a new era of development since liberalization,
when a large number of controls were abolished - some immediately
and others gradually. As a result, the domestic steel industry
has since then, become market oriented and integrated with the
global steel industry. The steel industry plays a very crucial role in
development of Indian economy and it is considered as backbone
of sectors like, Auto Industry, Infrastructure etc while it is also
used as one of the critical raw material for many manufacturing
industries. The Indian government initiated a series of policy
reforms which changed the dimensions and dynamics of the
Indian steel Industry. Due to the favorable government policies
and robust economic growth, Indian steel industry is presently
experiencing healthy growth. The prospects of the domestic
demand and consumption appear to be excellent driven by the
high investment rate, growth in manufacturing industry andexpansion in physical infrastructure creation.
Currently, both in terms of capacity and production, India has
the fourth-largest steel sector in the world after China, Japan
and USA. The production of nished carbon steel in India has
increased signicantly over the last decade. During 1991-1992 the
total production of nished carbon steel was 14.33 million tonnes,
which doubled to 30.63 in 2001-2002 and in the last nancial year
that is 2010-11 the total production of steel was around two and
a half times at 75.741. In the, current calendar year, India’s steel
production in the rst half of 2011 stood at 35.636 million tonne.
The demand for the steel in the Indian economy is expected to
increase in the medium to long term, as the government is focusing
SECtor outLook : StEEL InduStry
on creating new infrastructure while the growth in automobile,
construction and consumer goods sectors of economy too are
giving the demand for steel an additional push. As per the steelministry’s data, the apparent consumption of steel of nished steel
stood at 65.610 million tonnes, from 27.350 million tonne in 2001-
02. And this consumption is almost three times from 14.84 million
tonnes in 1991-1992. In the last ve year India’s compounded
average growth rate of steel consumption is above 9%, and this
growth in consumption rate is expected to increase in coming
years.
Gwh dives:
Steel industry is very important sector of the India’s economy,
as per the government estimates, the iron and steel industrycontributes around 2% of the India’s Gross Domestic Products and
its weight in Index of Industrial production (IIP) is around 6.2%.
The steel industry’s growth is closely linked to national economic
growth. The main drivers for the steel industry are Construction,
Infrastructure, Consumer Durable goods, and Automobile and
Auto components Industry and government policy.
• Ifasce:
India’s Gross Domestic Product (GDP) is growing with the 8 to 9%
and it is also expected to sustain similar pace of GDP growth in the
years to come which is the driver of growth of India steel industry.To maintain this pace of GDP growth Indian government has
planned massive investment in the development of infrastructure,
government is planning to invest around $1 trillion in coming ve
years for infrastructure development. This $1 trillion investment
which will be used in development of infrastructure such as
power, railways, roads, ports and airports, is expected to generate
sustainable demand for the steel and consumption for steel, which
is presently around 10%.
• Ambile a A cmpes Is:
Apart from infrastructure, Automobile and Auto components
Industry also plays a crucial role in the growth of steel sector as
it has strong and direct linkages with this sector. With the rapid
upsurge in investments in Automobile and Auto components
Industry, the demand for steel is also expected rise further in
coming years. India is one of the fastest growing automobile
markets and it is the hub for small and fuel efcient passenger cars.
Indian auto industry was one the rarest industry which swiftly
recovered from the nancial meltdown of 2008 and registered
robust growth. From the negative growth in nancial year of 2007-
08, the Indian auto sector saw strong growth of 26% in 2009-10
and almost 27.5% in last scal year. This fast recovery in the sector
was due to growing demand in domestic market and exports. The
Automobile and Auto components Industry has emerged as the
prime driver for alloy steel.
0
10
20
30
40
50
60
70
80
2 0 0 1 - 2 0 0 2
2 0 0 2 - 2 0 0 3
2 0 0 3 - 2 0 0 4
2 0 0 4 - 2 0 0 5
2 0 0 5 - 0 6
2 0 0 6 - 2 0 0 7
2 0 0 7 - 2 0 0 8
2 0 0 8 - 2 0 0 9
2 0 0 9 - 2 0 1 0
2 0 1 0 - 2 0 1 1
Pci f ishe cab seel(i ii tes)

7/31/2019 A project on SCM
http://slidepdf.com/reader/full/a-project-on-scm 8/12
Date : 21 November 2011
Tracom rESEarcH
Log on to www.tracom.co.in for further details. For Private Circulation Only
• othe Sets
Other sectors such as Construction, Consumer Durables and Oil
and Gas industry are also contributing to the growth of Indian
steel Industry. In the recent time construction sector has registereda healthy growth, especially construction work in metropolitan
cities like Delhi, Mumbai etc. has increased the demand for the
steel in the sector. Construction sector is expected to maintain its
current pace of growth and is estimated to grow by around 12
to 14% as the housing demand is expected to increase not only
in metros but also in tier I, II and tier III cities. The consumer
durables sector has maintained its double digit growth rate
from last few years, and it is expected to maintain this pace of
growth in the coming years as well thanks to the burgeoning
middle class population, increasing income levels and changing
lifestyles. It is expected to grow by almost 13 to 14% in comingyears. The domestic appliances markets which includes spin
driers of washing machine, almirahs, thermo ware, water lters,
dishwashers, microwave ovens, catering equipments, cutlery,
furniture etc has created almost a new market for the steel sector.
This growth is consumer durables will help in sustaining the pace
of steel consumption.
• Gveme Plic:
Since the start of economic liberalization in 1991, the steel
industry has undergone signicant change. The rapid growth in
the steel industry and changed market dynamic due to economicliberalization made government to change its policy on the steel
sector, and in 2005 it introduced the National Steel Policy with
the aim to provide a roadmap of growth and development for the
Indian steel industry. The National Steel Policy 2005 seeks to remove
policy bottlenecks which affect the availability of production
inputs, increase in investment, and creating infrastructure such as
road, railways and ports. The NSP 2005 seeks to increase India’s
production of steel to 100 Million Tonnes by 2019-20, with the
compounded annual growth of 7.3 % per annum.
cheges fe b Ii Stee Set
The steel industry plays a signicant role in the economic growth
of any country, and despite the recent slowdown in the domestic
market, the future of the Indian steel industry seems bright.
However, shortages of domestic iron ore supply and increasing
raw material prices are posing a challenge to Indian steelmakers as
they import a majority of essential ingredients for steel production.
The Indian steel industry was already under raw material supply
pressure, however, and the ban for mining in Karnataka state by
the Supreme Court has further ratied the shortage of iron ore
supply for the industry.
• La acqisii:
Land acquisition is a common hurdle steel producers face in
India. Oftentimes companies must gain approval from hundreds
of land owners to build a new mill. Complicating matters even
further is a complex permitting process that varies by state.
Foreign investors have tried to capitalize on the nation’s growing
steel market. South Korea’s Posco, the world’s third-largest steel
maker, plans to build a $12 billion plant in India’s eastern state of
Orissa. But the project has met resistance from local land owners,
many of whom are farmers. Unlike China, India is a democratic
nation where land acquisition requires more than a nod from a
centralized authority.
• Availabili f aw maeials:
The other major challenge for steel producers in India is access
to iron ore. Despite the abundance of iron ore availability, it
judicious allocation remains a challenge. Indian government must
adopt policies that encourage iron ore mining for domestic use.
The government has already taken some steps by imposing a 20%
duty on iron ore exports. India’s steel industry also lacks access
to coking coal, which is used to produce iron. Coking coal prices
uctuate and supplies are controlled by major mining operations
outside of India.
• ueevelpe Ifasces:
The India steel sector is facing difculties on various fronts like the
underdeveloped infrastructures, environmental & forest clearances
and availability of coal and fuel and increasing cost of dry fuel.
Most of the mining elds are located in Eastern Indian states such
as Orissa, Jharkhand, and Chhattisgarh, were the infrastructures
are under developed. Underdeveloped infrastructures such as
roads and railways and lack in availability of power and water
have been major bottlenecks for the sector’s growth.
• Evime Cleaace:
The environment clearance has been another major concern for
the steel sector. In order to set up steel plants thousands of acres
of lands are required, and getting land has been one of the major
hurdles. Most of people in rural area are dependent on land
and forest for their livelihood, and acquisition of land without
ensuring adequate compensation rehabilitation and employment,
has created unrest protest from farms for land acquisition. The
government needs to work on the issue seriously for the growth
of the steel sector.
Seel Pci:
As per the world steel association, the total output for Jan-June
2011 was around 35.636 million tonnes of steel. During 2010 India
had produced around 68.3 million tonnes and in 2009 it had
produced around 63.5 million tonnes. This indicates that, the steel
production in recent years has been increasing with the increase
in pace of economic growth. India is expected to become thesecond largest producer of steel in coming few years. The India
government is targeting to expand its production capacity to 120
million tonnes by 2012 from the current level. Currently, India is
the fourth largest producers of steel in the rst six month of 2011,

7/31/2019 A project on SCM
http://slidepdf.com/reader/full/a-project-on-scm 9/12
Date : 21 November 2011
Tracom rESEarcH
Log on to www.tracom.co.in for further details. For Private Circulation Only
after China, Japan and USA. This brisk growth in production of
steel in recent past has been a result of higher production of value-
added products, production capacity expansion, upgradation
of production process, achieving cost effective production in an
environment friendly manner.
The production of nished carbon steel in India has been 75.74
million tonnes (provisional) in last scal year as compared to 42.63
million tonnes in 2005-06. In the production of steel, the secondary
sector had largest share followed by the primary producers. This
increase in the share of secondary sector is because of ample
supplies of semis. Intermediate solid steel products obtained
by hot rolling/forging of ingots (in conventional process) or by
continuous casting of liquid steel are known as semis. These semis
are intended for further rolling/forging to produce nished steel
products. Along with the nished carbon steel, the production ofDRI (Direct Reduced Iron) had increased by around ve times
from 5.4 million tonne in 2001-02 to 26.7 million tonnes in 2010-11.
In 2009-10, India was the second largest producer of DRI after the
Venezuela. However, the pig iron saw a decline in production.
The total production of pig iron was 5.585 million tonnes in 2010-
11 as compared to 5.976 million tonnes in 2009-10.
ne: Pci f Fiishe Cab Seel a drI i Milli
Tes
rece e i Seel Pci:
In recent times, the steel production has been steadily increasing
with the demand from various sectors. On monthly basis, the
production of steel is growth on an average of 8 to 9% from last
12 months. As per the IIP data, the Annual Averages of Steel
Production has increased from 3626.1 thousand tonnes in 2004-5
to 5501.1 thousand tonnes in 2010-11.
If we consider the recent trend then the world crude steel
production was near about 759 Mn tonnes, up by 8% YoY, during
Apr-Sep 2011, while supply corrected by around 50 Mn tonneson an annualized basis in Sep 2011 from its peak. On the same
time the capacity utilization has fallen below 80%. The situation is
likely to worsen further as the European and US steel producers
have announced moderation/shutdowns in the light of weaker
demand. However there was one silver lining that steel prices in
Asia were stable during 2QFY12 but the rupee depreciated against
US dollar by 9.4% in the quarter putting pressure on the domestic
steel companies despite cushioning the drop in realisation in
rupee term. Steel consuming sectors like auto, shipbuilding and
consumer goods growth showed moderation. In spite of this
apparent steel consumption has grew by around 6 Mn tonnes per
month during Apr-Sep 2011.
Global and Chinese crude steel production slowed in October to
the lowest level in 10 months, as a gloomier economic outlook
forced many steelmakers to cut production to tackle weakening
demand and falling prices.
Csmpi:
Historically the Construction, Infrastructure and Automobile &Auto components Industry markets have remained the largest
consumers of steel absorbing more than half of the total steel
production (Products). Industries such as, automotives and
manufactures of consumer durables directly depends on the steel
industry for basic raw martial. Other industries such as appliances,
agricultural implements, converters, containers, energy, electrical
equipment and industrial machinery are major consumer
(demander) of steel. The consumption of steel is viewed as the
key indicator of economic development. Due to rapid economic
development of India, the consumption of steel also has gone up
in recent past. The main demand for the steel is coming from thetraditional sectors such as construction, housing, auto and related
sectors and consumer durables and from nontraditional sectors
such as engineering industries, power generation, petrochemicals
and fertilizers.
However, presently, sectors like infrastructure, automobile
and consumer durables are leading consumers of the steel. The
increase in disposable income, pushed demand for housing,
automobile and consumer durable goods in rural India, which is
at present creating additional demand for steel in these sectors.
ne: Appae Csmpi f ishe seel
During last ve years the apparent consumption of steel
(production + imports–exports +/- variation is stocks) of nished
0
10
20
30
40
50
60
70
2005-06 (P) 2006-2007 2007-2008 2008-2009 2009-2010 2010-2011
APPARENT CONSUMPTION OF THE FINISHED STEEL (CARBON)
Gorwth in APPARENT CONSUMPTION OF THE FINISHED STEEL (CARBON)
0
10
20
30
40
50
60
70
2 0 0 1 - 2 0 0 2
2 0 0 2 - 2 0 0 3
2 0 0 3 - 2 0 0 4
2 0 0 4 - 2 0 0 5
2 0 0 5 - 0 6 ( P )
2 0 0 6 - 2 0 0 7
2 0 0 7 - 2 0 0 8
2 0 0 8 - 2 0 0 9
2 0 0 9 - 2 0 1 0
2 0 1 0 - 2 0 1 1
APPARENT CONSUMPTION OF THE FINISHED STEEL (CARBON)
Gorwth in APPARENT CONSUMPTION OF THE FINISHED STEEL (CARBON)

7/31/2019 A project on SCM
http://slidepdf.com/reader/full/a-project-on-scm 10/12
Date : 21 November 2011
Tracom rESEarcH
Log on to www.tracom.co.in for further details. For Private Circulation Only
steel has increased from 38.11 million tonnes in 2005-06 to 65.61
million tonnes (Provisional) in 2010-11. The consumption of
steel in India saw the highest growth in 2006-07 it grew by 30%,
however, during the nancial crisis, the growth in consumption
of steel reduced to less than 0.5% in 2008-09. As the economy
recovered from the global nancial crisis, the consumption of
steel was higher than the GDP growth, it grew by 13.34% in 2009-
10 and 10.6% in 2010-11, while, country’s GDP growth rate was
8% and 8.5% respectively. As per the Ministry of Steel, the per
capita consumption of steel has increased 19.5% in last four years.
It increased to 55 kg in 2010-11 from 46 kg in 2006-07.
During April to June 2011, the apparent consumption of nished
steel registered moderation, it fell by the 1.5 to 17321 thousand
tonnes in the rst quarter of 2011-12 from 17512 thousand tonnes
in the same period of last scal year.
tae:
The exports of steel and iron were stated in 1964 however the
trade saw real growth of the opening up of the economic in 1991.
In last 20 years dynamics and fundamentals have been changed
with the rapid expansion of the economy. In last ten years the
pendulum has shifted to import from exports. India was the net
exporter of steel till 2006-07, however, after that the import of steel
is dominating the external trade of steel. .
ne: Exp a Imp f seel
During 2001-02, India’s total export of steel was around 3000
thousand tonnes, which reached to its highest level in 5922
thousand tonnes in 2003-04. However, after that the exports of
steel have been declining. In 2010-11 it stood at 3811 thousand
tones, which is less than previous year due to moderation in
exports of Pig iron and semis. India’s export of steel is mainly
dominated by nished or carbon steel during 2010-11. India
exported around 3461 thousand tonnes which is higher than the
3251 thousand tonnes in 2009-10. The moderation in India’s steel
exports in recent past is mainly due to imposing anti dumping
duties imposed by the advanced nations, which led Indian steel tolose its market share.
On the same time, imports of steel has increased almost 6 times,
during 2001-02 imports were just 1375 thousand tonnes which
surged to its all time high levels of 7382 thousand tonnes in 2009-
10. However, it fell to 6798 thousand tonnes in 2010-11. The import
of steel is also dominated by the nished steel. During 2010-11
India imported around 6798 thousand tonnes of nished steel.
During the rst quarter of current nancial year, India remainedas the net importer of steel. However, in the April to June 2011 the
exports have increased signicantly compared to the same period
of last nancial year. The exports of nished steel surged to 1074
thousand tonnes in the rst quarter of 2011-12 as against 625 in the
April to June 2010-11. It increased by almost 71.8% in April to June
2011-12. Import of nished steel had decline 52% in the April to
June 2011-12. The imports of nished steel stood at 1326 thousand
tonnes compared to 2760 thousand tonnes in the corresponding
period of last scal.
ol:
Since economic liberalization, the Indian steel industry has come
a long way from negligible global presence in production and
consumption. Currently, demand for steel in economy is growing
by almost 10% and it is expected to increase by 12% in near future
and to meet this demand for steel India needs to increase its
production of steel by 10% to 15%. By the end of 2011-12, country’s
steel manufacturing capacity is expected to reach around 90
million tonnes, and in the next nancial year that is 2012-13 it is
expected to reach around 110 million tonnes as the Browneld
capacity addition projects of public and private sector projects get
approved. India’s steel production capacity is expected to reachover 150 million tonnes by 2020.
India’s steel production capacity is going to increase manifold
in the coming years. The current abysmally low per capita
consumption of steel of 48 kg, compared to the world average of
190 kg, strengthens the argument that the domestic steel industry
has a huge growth potential. The Parliamentary Standing
Committee (PSC) on Coal & Steel on Demand for Grants (2007-08)
of the Ministry of Steel in its 25th report had noted that to achieve
this objective, it is necessary to create required infrastructure for
steel industry as well as increase per capita consumption of steel.
It observed that the biggest challenge in achieving the desired
level of consumption is removing the wide disparity between
urban and rural areas. The pace of steel expansion in India could
be cause for alarm in some parts of the world, particularly the
United States where cheap imports from China have been a
source of contention for the industry. But currently India’s output
is supplying mostly domestic needs, and the country’s political
climate is much different than it is in China. Indian crude steel
production is expected to grow at a CAGR of around 10% during
2010-2013. The government’s proactive incentive plans to boost
economic growth by injecting funds in various industries, such
as construction, infrastructure, automobile, and power will drive
the steel industry in future. The Indian steel industry will have
multifold growth in the coming years, with iron ore requirements
soaring to much higher levels.
0
1000
2000
300040005000600070008000
2 0 0 1 -
2 0 0 2
2 0 0 2 - 2 0 0 3
2 0 0 3 - 2 0 0 4
2 0 0 4 - 2 0 0 5
2 0 0 5 - 2 0 0 6
2 0 0 6 - 2 0 0 7
2 0 0 7 - 2 0 0 8
2 0 0 8 - 2 0 0 9
2 0 0 9 - 2 0 1 0
2 0 1 0 -
2 0 1 1
IMPORT OF IRON AND STEEL (In '000 tonnes)
EXPORT OF IRON AND STEEL (In '000 Tonnes)

7/31/2019 A project on SCM
http://slidepdf.com/reader/full/a-project-on-scm 11/12
Date : 21 November 2011
Tracom rESEarcH
Log on to www.tracom.co.in for further details. For Private Circulation Only
Tt Stee
Tata Steel is the world’s 10th largest steel manufacturer. It
operates in more than 20 countries and has a commercial presence
in over 50 countries. The company produces crude steel and basic
steel products, and makes steel for building and construction
applications through Tata BlueScope Steel, its joint venture with
Australia’s BlueScope Steel. Tata Steel’s Q2 sales stood at Rs 8,212
crores ($1.68 billion) up 15.5% from the Rs 7,107 crores ($1.45
billion) of Q2 FY’11 and up 4.5% from the Rs 7,860 crores ($1.61
billion) of Q1 FY’12. Q2 sales from European operations were Rs
21,160 crores ($4.32 billion), up by 19.0% from Rs 17,787 crores
($3.63 billion) of Q2 FY’11 and 3.0% up from the Rs 20,535 crores
($4.19 billion) of Q1 FY’12. For the half year company’s sales were
up by 17.7% to Rs 16,072 crores ($3.28 billion) from the Rs 13,658
crores ($2.79 billion) in H1 FY’11. The Group’s steel deliveries in
H1 FY’12 rose by 1.8% to 12.17 million tonnes compared to 11.96
million tonnes in H1 FY’11. Steel deliveries increased by 0.8%
to 6.11 million tonnes in Q2 FY’12 from the 6.06 million tonnes
recorded in Q2 FY’11. Tata Steel’s consolidated net prot fell
89.26% to Rs. 212.43 crore on 11.73% rise in total income to Rs.
32918.33 crore in Q2 September 2011 over Q2 September 2010. The
company’s performance was adversely impacted by higher global
raw materials costs and lower average selling prices at Tata Steel
Europe. Deliveries from Tata Steel India and NatSteel Holdings
grew, whereas Tata Steel Thailand’s operations were affected by
adverse weather conditions. Despite the slump in the European
operation, both turnover and sales of the company were up and
delivery volumes between July and September 2011 matched those
of the previous period. The actions taken after 2008 to weather
the nancial crisis have strengthened the European operations’
ability to cope with market disturbances. But the company’s Long
Products business had lost money and the marketplace for its steel
products continues to deteriorate further. Europe still remains the
concern and the management expects EBITDA to be weaker in 3Q
vs 2Q. However, its India’s combination of raw material security,
operating efciencies, high value products, and branding helps it
earn EBITDA margins of 34-39%. The scrip is currently trading
at Rs 381 and EV/ EBIDTA of 5.20 and P/E of 5.43, we would
recommend a ‘Hold’ in the stock despite so many issues and its
exposure to the European markets due to its greater integration
and relatively higher margins.
JSW Stee
JSW Steel is the largest private sector steel manufacturer in terms
of installed capacity. It is India’s No. 3 steelmaker in which Japan’s
JFE Holdings owns about 15 percent. JFE is eyeing a larger chunk
of JSW Steel hoping to take advantage of a steep fall in the share
price and recently eased takeover norms. JSW Steel is one of
the lowest cost steel producers in the world. It has established
a strong presence in the global value-added steel segment with
the acquisition of steel mill in US and a service center in UK. JSW
Steel is actively looking to acquire steel companies in India with
capacity for value-added products, as it looks to boost margins and
expand its offerings. Late last year, JSW had bought a controlling
stake in rival Ispat for $476 million, expanding its operations and
taking its total steelmaking capacity up to 14.3 million tonnes. Butthat acquisition has hurt the company in the September quarter,
During Q1FY12 JSW Ispat made a provision of Rs 12.5 bn towards
towards diminution in value of investments, doubtful overdue
advances and debtors and long pending material in transit which
in turn has taken its toll on the prot numbers of the company for
the second quarter. JSW Steel has been struggling on various other
fronts too in recent months after it featured in a report on illegal
mining by Karnataka’s anti-corruption watchdog. It had to cut
production at its Vijayanagar plant to 30% of capacity in September
after the Supreme Court limited iron ore sales in Karnataka to
online auctions; production revived to 50-60% a month later.
There is e-auction going on in Karnataka and JSW Steel is likely
to secure the majority of the iron ore from e-auctions as the iron
ore being auctioned is majorly of lower grade. However, iron ore
situation in Karnataka is likely to improve going forward, even if
the supply issue is resolved it will take off much pressure from the
margins of the company. During Q2FY12 JSW Steel’s standalone
net sales increased 32.1% YoY to Rs 7630 crore on account of sales
volume growth and higher steel realisations. During the quarter,
there were mark-to-market foreign exchange losses of Rs 1000
crore. JSW Steel has entered into an equal joint venture (JV) with
Japan’s Marubeni-Itochu Steel Inc. to set up a steel processing
facility in north India. JSW Steel currently has only one service
centre at Vijayanagar in Karnataka and has been steadily moving
into the higher-margin auto grade steel for some years now. The
joint venture will give it access to both the technical expertise and
the experience that Marubeni-Itochu has in high-end and specialty
steels. The stock is currently trading at Rs 568 and an EV/EBIDTA
of 4.38 and P/E of 7.10x, we will consider a ‘HOLD’ in the stock
and buying at dips considering slowdown in global demand and
various challenges ahead.
STock rEcommEndaTIon

7/31/2019 A project on SCM
http://slidepdf.com/reader/full/a-project-on-scm 12/12
Date : 21 November 2011
Tracom rESEarcH
Disclaimer : This document has been prepared by Tracom Stock Brokers Pvt. Ltd. and Accord Fintech Pvt. Ltd. and
is being distributed in India by Tracom Stock Brokers Pvt. Ltd., a registered broker dealer. This information in the
document has been complied by the research department. Due care has been taken in preparing the above document.
However, this document is not, and should not be construed, as an offer to sell or solicitation to buy any securities.
Any act of buying, selling or otherwise dealing in any securities referred to in this document shall be at investor’s sole
risk and responsibility. This document may not be reproduced, distributed or published , in whole or in part, without prior
permission from the company. © Copyright - 2009 - Accord Fintech Pvt. Ltd. and Tracom Stock Brokers Pvt. Ltd.
401, Hemkoot, Behind LIC Building, Ashram Road, Ahmedabad - 380 009 Gujarat - India
Phone:+ 91 79 26580774, 30076500, Fax:+91 79 26580563
Trading Section Nos : 079-26580774 / 079-30076500, Demat Section No : 079 - 26581964 / 079-30425500
Email ids : [email protected] DP : [email protected]
Investor Greivance : [email protected]
Compliance Ofcer’s :
NSE (Cash & F&O) : Name : Mr Vijay S Shah
Contact No : 079-26580774
Email : [email protected]
BSE (Cash & F&O) :
Name : Mr. Anuj V Shah
Contact No: 079-26580774
Email : [email protected]
NSDL :Name : Mr Harish Panchal
Contact No : 079-30425500
Email : [email protected]
Tracom Stock Brokers Pvt. Ltd.
Parthiv Shah
Director,Business Development & Sales
(M) 9727751649