Embed Size (px)
Citation preview
United States Department of CommerceUnited States Census Bureau Foreign Trade Division
A Profile of U.S. Exporting Companies,
1997-1998
1
A Profile of U.S. Exporting Companies, 1997-1998
For more information please contact:Christopher J. Deaver (301) 457-3629Kathleen J. Puzzila (301) 457-3251
Background
This is the fourth in a continuing series of profiles of U.S. exporters. The first report, A Profile of UnitedStates Exporters: Initial Findings from the Exporter Data Base, was released by the International TradeAdministration in September 1993. That report was based on Census Bureau data compiled both from the1987 Economic Census and from documents filed for export clearances during 1987 and used a differentmethodology than the succeeding reports. This report, and the previously released reports covering 1992and 1996/1997, are based on economic census and survey data currently on file at the Census Bureau,administrative records from other government agencies, and documents filed for export clearances. This1997/1998 report classifies companies according to the North American Industry Classification System(NAICS) instead of the Standard Industrial Classification (SIC) system that was used in the earlier reports.
These profiles were developed to provide users, both governmental and nongovernmental, with informationabout the exporting community including employment size, type of company, and major foreign markets. These data are presented in Tables 1 through 7, where the export data for 1998 are designated part “a,” the1997 data shown in part “b,” and tables comparing two years designated part “c.” The 1997 figures in thisreport represent revisions to data previously released. These revisions are based on the ability to matchadditional records, as well as a shift from SIC-based company classifications to NAICS-basedclassifications.
This profile was compiled by the Foreign Trade Division of the Census Bureau. The International TradeAdministration is a partial sponsor of the work, providing both financial assistance and advice on data userneeds.
For definitions of variables and terms such as company type, employment, low-value estimates, and relatedparty trade, see the Glossary of Terms.
Methodology
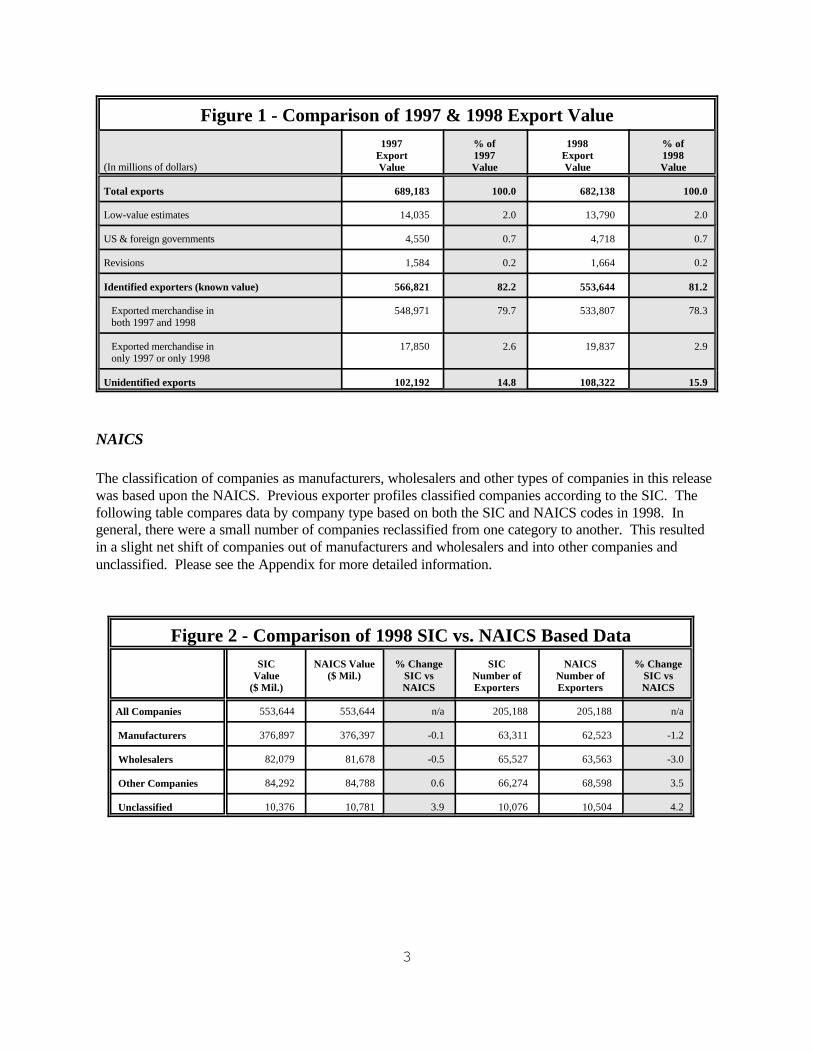
This profile was compiled by using the individual company identifier or company name reported on theexport document to link to the Census Bureau’s centralized company information database. Approximately82 percent of the total export value for 1997 and 81 percent for 1998 were linked to specific companies inthis way (see Figure 1). All percentages stated in this report, unless otherwise specified, were calculatedbased solely upon the 1997 and 1998 export values that could be linked to specific exporters--the “knownvalue.”
2
Roughly 3 percent of the total export value for each year was accounted for by the estimated value oftransactions less than $2,501, exports by U.S. and foreign governments, and revisions. These revisionsincluded Canadian revisions, timing adjustments, and end-of-year revisions. The estimates, adjustments,and revisions were excluded from the matching process. For some transactions, accounting forapproximately 15 percent of value for 1997 and 1998, the company identifier was either not reported orcould not be matched to a specific company.
During the process of identifying individual companies, it was not possible to investigate every unmatchedcase. Priority was given to identifying unmatched companies accounting for high values of trade. As aresult, the information on small exporters is most likely understated. Users should not assume that theseunidentified exporters reflect the same distribution of company types and sizes as the identified (known)exporters. Comparisons between the number of companies exporting in given categories may be somewhatmisleading due to these differences in the percent of value we were able to match to specific companies.
Quality assurance procedures were applied to all phases of collection, processing, and tabulation tominimize errors. However, the data were still subject to error from miscoding, estimation for missing ormisreported data, and difficulties in identifying every unit that should be included in this report.
The tables in this report include detailed breakdowns based upon the number of employees of the exportingcompany. In presenting these results, companies are classified as small (less than 100 employees), medium(100 to 499 employees), and large (500 or more employees). Table 3 also provides information on exportsto related parties, such as parent or subsidiary firms. Two parties are considered related if either partyowns, directly or indirectly, 10 percent or more of the other party.
General Findings
The identified U.S. exporting community consisted of 213,664 companies that exported $567 billion inmerchandise in 1997 and 205,188 companies that exported $554 billion in merchandise in 1998 (see Table1). Over 96 percent of this value was attributable to the 132,452 companies that exported merchandise inboth years. Less then 4 percent of it was from companies that only exported in one of the two years. Overall, export value dropped slightly more than 1 percent from $689 billion in 1997 to $682 billion in 1998.
3
Figure 1 - Comparison of 1997 & 1998 Export Value
(In millions of dollars)
1997ExportValue
% of1997Value
1998ExportValue
% of1998Value
Total exports 689,183 100.0 682,138 100.0
Low-value estimates 14,035 2.0 13,790 2.0
US & foreign governments 4,550 0.7 4,718 0.7
Revisions 1,584 0.2 1,664 0.2
Identified exporters (known value) 566,821 82.2 553,644 81.2
Exported merchandise in both 1997 and 1998
548,971 79.7 533,807 78.3
Exported merchandise in only 1997 or only 1998
17,850 2.6 19,837 2.9
Unidentified exports 102,192 14.8 108,322 15.9
NAICS
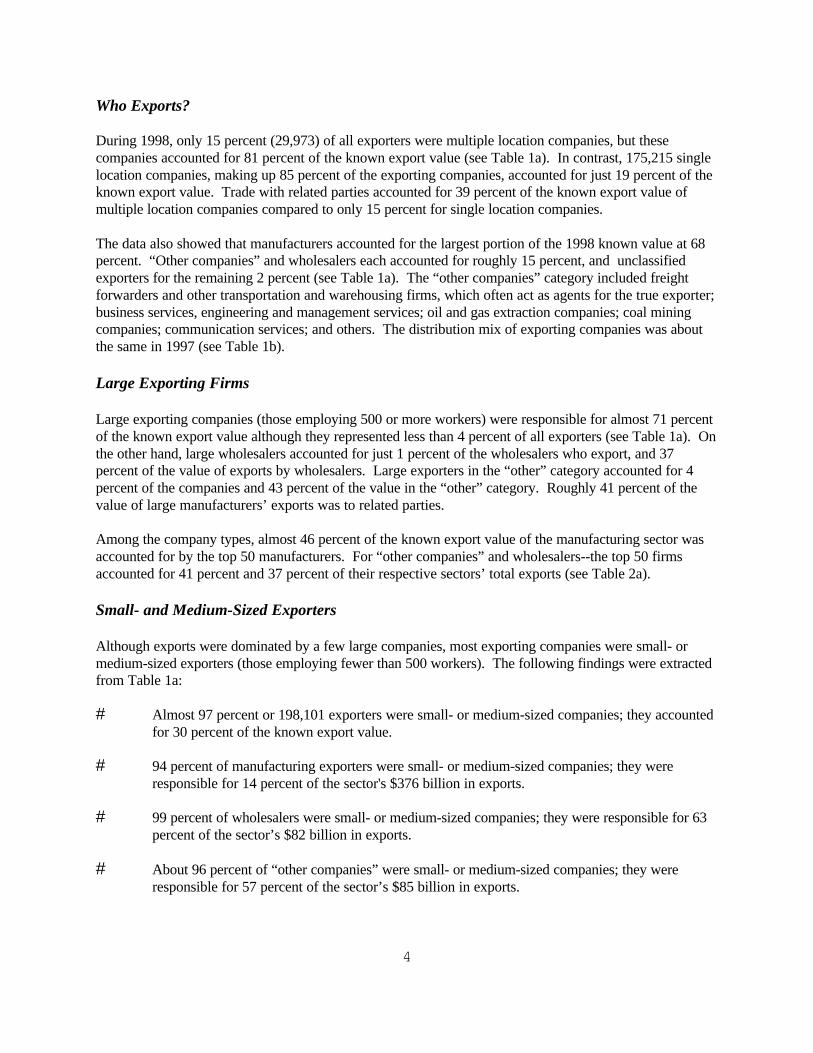
The classification of companies as manufacturers, wholesalers and other types of companies in this releasewas based upon the NAICS. Previous exporter profiles classified companies according to the SIC. Thefollowing table compares data by company type based on both the SIC and NAICS codes in 1998. Ingeneral, there were a small number of companies reclassified from one category to another. This resultedin a slight net shift of companies out of manufacturers and wholesalers and into other companies andunclassified. Please see the Appendix for more detailed information.
Figure 2 - Comparison of 1998 SIC vs. NAICS Based DataSIC
Value($ Mil.)
NAICS Value($ Mil.)
% ChangeSIC vsNAICS
SICNumber ofExporters
NAICSNumber ofExporters
% ChangeSIC vsNAICS
All Companies 553,644 553,644 n/a 205,188 205,188 n/a
Manufacturers 376,897 376,397 -0.1 63,311 62,523 -1.2
Wholesalers 82,079 81,678 -0.5 65,527 63,563 -3.0
Other Companies 84,292 84,788 0.6 66,274 68,598 3.5
Unclassified 10,376 10,781 3.9 10,076 10,504 4.2
4
Who Exports?
During 1998, only 15 percent (29,973) of all exporters were multiple location companies, but thesecompanies accounted for 81 percent of the known export value (see Table 1a). In contrast, 175,215 singlelocation companies, making up 85 percent of the exporting companies, accounted for just 19 percent of theknown export value. Trade with related parties accounted for 39 percent of the known export value ofmultiple location companies compared to only 15 percent for single location companies.
The data also showed that manufacturers accounted for the largest portion of the 1998 known value at 68percent. “Other companies” and wholesalers each accounted for roughly 15 percent, and unclassifiedexporters for the remaining 2 percent (see Table 1a). The “other companies” category included freightforwarders and other transportation and warehousing firms, which often act as agents for the true exporter;business services, engineering and management services; oil and gas extraction companies; coal miningcompanies; communication services; and others. The distribution mix of exporting companies was aboutthe same in 1997 (see Table 1b).
Large Exporting Firms
Large exporting companies (those employing 500 or more workers) were responsible for almost 71 percentof the known export value although they represented less than 4 percent of all exporters (see Table 1a). Onthe other hand, large wholesalers accounted for just 1 percent of the wholesalers who export, and 37percent of the value of exports by wholesalers. Large exporters in the “other” category accounted for 4percent of the companies and 43 percent of the value in the “other” category. Roughly 41 percent of thevalue of large manufacturers’ exports was to related parties.
Among the company types, almost 46 percent of the known export value of the manufacturing sector wasaccounted for by the top 50 manufacturers. For “other companies” and wholesalers--the top 50 firmsaccounted for 41 percent and 37 percent of their respective sectors’ total exports (see Table 2a).
Small- and Medium-Sized Exporters
Although exports were dominated by a few large companies, most exporting companies were small- ormedium-sized exporters (those employing fewer than 500 workers). The following findings were extractedfrom Table 1a:
# Almost 97 percent or 198,101 exporters were small- or medium-sized companies; they accountedfor 30 percent of the known export value.
# 94 percent of manufacturing exporters were small- or medium-sized companies; they wereresponsible for 14 percent of the sector's $376 billion in exports.
# 99 percent of wholesalers were small- or medium-sized companies; they were responsible for 63percent of the sector’s $82 billion in exports.
# About 96 percent of “other companies” were small- or medium-sized companies; they were
responsible for 57 percent of the sector’s $85 billion in exports.
5
Where are the Major Export Markets?
Most exporting companies (62 percent) traded with only one foreign country. A small percentage ofcompanies, less than ½ of 1 percent, shipped to 50 or more countries; these companies accounted for halfof the known export value (see Table 4a).
About 89 percent of all companies exported to at least one of the top 25 U.S. trading partners in 1998 (seeTable 5a). The greatest number of companies (96,741) shipped to Canada, followed by the UnitedKingdom (34,466), Mexico (29,875), and Japan (26,752). Mexico, while ranking third in the number ofidentified exporters, ranked second in total export value at $79 billion.
Exports by State
The Census Bureau releases data on exports by state on two bases: the state of the exporter location (EL)and the state of the origin of movement (OM). The EL series is based on the ZIP Code from the address ofthe exporter of record on the export document. The OM series is based on where the goods began theirmovement to the port of exit as reported on the export document. Neither of these series is based on theactual production origin of the goods. Be sure to read the Glossary of Terms for important information onthe limitations of both series.
Tables 6 and 7 show the number of companies exporting from each state during 1997 and 1998 based uponeach state definition. Please note that the same company can be shown as exporting from multiple states.
Comparison of 1997 and the 1998 Results
The relative proportions of exports accounted for by manufacturers, wholesalers, and “other companies”based upon both number of exporters and value of exports remained consistent from 1997 to 1998. Beloware a number of noteworthy year-to-year changes (see Tables 1c and 5c):
# Almost 89 percent of the decline in the number of exporting companies from 1997 to 1998 wasaccounted for by single location companies.
# The number of small- and medium-sized companies decreased by 4 percent from 206,321 in 1997to 198,101 in 1998, while the number of large companies decreased by about 3 percent from7,343 to 7,087.
# The number of “other companies” increased by 2 percent from 67,172 in 1997 to 68,598 in 1998.
# Of the top 25 U.S. trading partners, China and Mexico showed the largest increase in the numberof exporting companies at 10 percent and 6 percent, respectively. The Republic of Korea showedthe largest decline at 25 percent, followed by Malaysia’s decrease of 18 percent.
6
TABLE OF CONTENTS
Table 1a. 1998 Exports by Company Type and Employment Size
Table 1b. 1997 Exports by Company Type and Employment Size
Table 1c. Percent Change Between the 1997 and 1998 Results
Table 2a. Top Companies’ Share of the 1998 Export Market by Company Type
Table 2b. Top Companies’ Share of the 1997 Export Market by Company Type
Table 3a. 1998 Exports to Related Parties by Company Type and Employment Size
Table 3b. 1997 Exports to Related Parties by Company Type and Employment Size
Table 4a. 1998 Exports by Company Type and Employment Size to Number of Partner Countries
Table 4b. 1997 Exports by Company Type and Employment Size to Number of Partner Countries
Table 5a. 1998 Exports by Company Employment Size to World Areas and Selected Countries
Table 5b. 1997 Exports by Company Employment Size to World Areas and Selected Countries
Table 5c. Percent Change Between 1997 and 1998 Exports to World Areas and Selected Countries
Table 6a. 1998 Exports by State of the Exporter Location, Number of Exporting Companies,Value, and Percent Change Between the 1997 and 1998 Results
Table 6b. 1997 Exports by State of the Exporter Location, Number of Exporting Companies andValue
Table 7a. 1998 Exports by State of the Origin of Movement, Number of Exporting Companies,Value, and Percent Change Between the 1997 and 1998 Results
Table 7b. 1997 Exports by State of the Origin of Movement, Number of Exporting Companiesand Value
Technical Notes
Glossary of Terms
Appendix
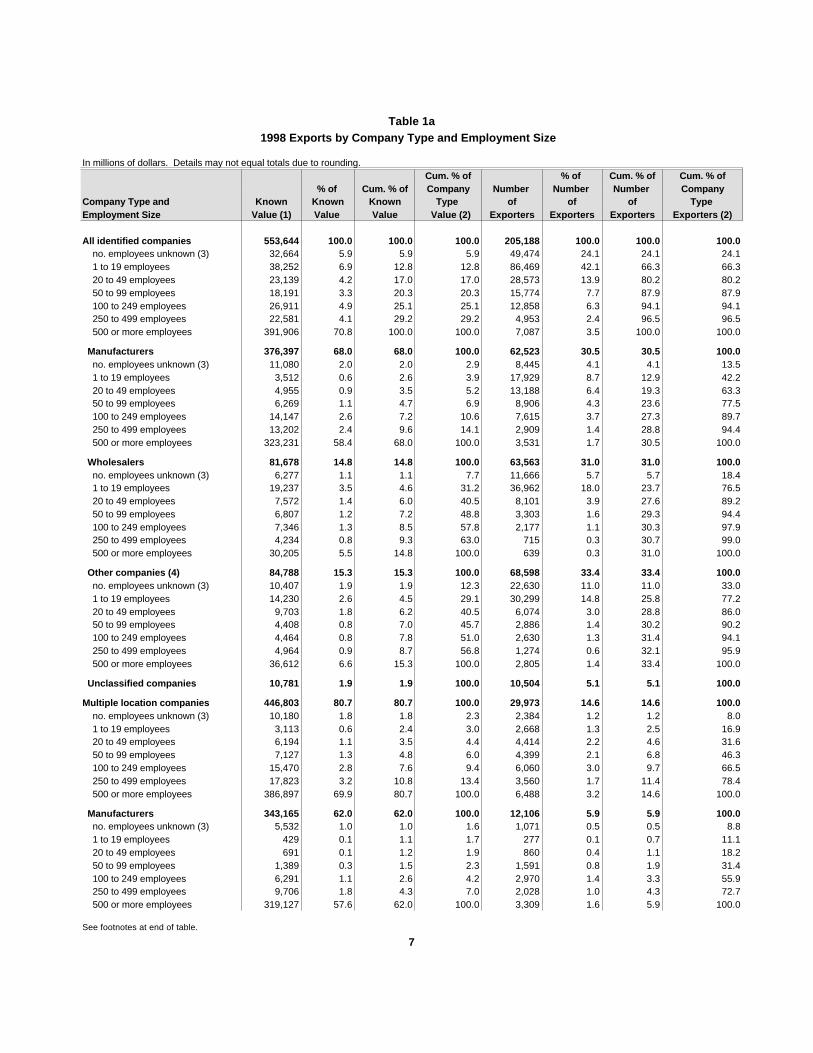
Table 1a
1998 Exports by Company Type and Employment Size
In millions of dollars. Details may not equal totals due to rounding. Cum. % of % of Cum. % of Cum. % of
% of Cum. % of Company Number Number Number Company Company Type and Known Known Known Type of of of Type Employment Size Value (1) Value Value Value (2) Exporters Exporters Exporters Exporters (2)
All identified companies 553,644 100.0 100.0 100.0 205,188 100.0 100.0 100.0 no. employees unknown (3) 32,664 5.9 5.9 5.9 49,474 24.1 24.1 24.1 1 to 19 employees 38,252 6.9 12.8 12.8 86,469 42.1 66.3 66.3 20 to 49 employees 23,139 4.2 17.0 17.0 28,573 13.9 80.2 80.2 50 to 99 employees 18,191 3.3 20.3 20.3 15,774 7.7 87.9 87.9 100 to 249 employees 26,911 4.9 25.1 25.1 12,858 6.3 94.1 94.1 250 to 499 employees 22,581 4.1 29.2 29.2 4,953 2.4 96.5 96.5 500 or more employees 391,906 70.8 100.0 100.0 7,087 3.5 100.0 100.0
Manufacturers 376,397 68.0 68.0 100.0 62,523 30.5 30.5 100.0 no. employees unknown (3) 11,080 2.0 2.0 2.9 8,445 4.1 4.1 13.5 1 to 19 employees 3,512 0.6 2.6 3.9 17,929 8.7 12.9 42.2 20 to 49 employees 4,955 0.9 3.5 5.2 13,188 6.4 19.3 63.3 50 to 99 employees 6,269 1.1 4.7 6.9 8,906 4.3 23.6 77.5 100 to 249 employees 14,147 2.6 7.2 10.6 7,615 3.7 27.3 89.7 250 to 499 employees 13,202 2.4 9.6 14.1 2,909 1.4 28.8 94.4 500 or more employees 323,231 58.4 68.0 100.0 3,531 1.7 30.5 100.0
Wholesalers 81,678 14.8 14.8 100.0 63,563 31.0 31.0 100.0 no. employees unknown (3) 6,277 1.1 1.1 7.7 11,666 5.7 5.7 18.4 1 to 19 employees 19,237 3.5 4.6 31.2 36,962 18.0 23.7 76.5 20 to 49 employees 7,572 1.4 6.0 40.5 8,101 3.9 27.6 89.2 50 to 99 employees 6,807 1.2 7.2 48.8 3,303 1.6 29.3 94.4 100 to 249 employees 7,346 1.3 8.5 57.8 2,177 1.1 30.3 97.9 250 to 499 employees 4,234 0.8 9.3 63.0 715 0.3 30.7 99.0 500 or more employees 30,205 5.5 14.8 100.0 639 0.3 31.0 100.0 Other companies (4) 84,788 15.3 15.3 100.0 68,598 33.4 33.4 100.0 no. employees unknown (3) 10,407 1.9 1.9 12.3 22,630 11.0 11.0 33.0 1 to 19 employees 14,230 2.6 4.5 29.1 30,299 14.8 25.8 77.2 20 to 49 employees 9,703 1.8 6.2 40.5 6,074 3.0 28.8 86.0 50 to 99 employees 4,408 0.8 7.0 45.7 2,886 1.4 30.2 90.2 100 to 249 employees 4,464 0.8 7.8 51.0 2,630 1.3 31.4 94.1 250 to 499 employees 4,964 0.9 8.7 56.8 1,274 0.6 32.1 95.9 500 or more employees 36,612 6.6 15.3 100.0 2,805 1.4 33.4 100.0 Unclassified companies 10,781 1.9 1.9 100.0 10,504 5.1 5.1 100.0 Multiple location companies 446,803 80.7 80.7 100.0 29,973 14.6 14.6 100.0 no. employees unknown (3) 10,180 1.8 1.8 2.3 2,384 1.2 1.2 8.0 1 to 19 employees 3,113 0.6 2.4 3.0 2,668 1.3 2.5 16.9 20 to 49 employees 6,194 1.1 3.5 4.4 4,414 2.2 4.6 31.6 50 to 99 employees 7,127 1.3 4.8 6.0 4,399 2.1 6.8 46.3 100 to 249 employees 15,470 2.8 7.6 9.4 6,060 3.0 9.7 66.5 250 to 499 employees 17,823 3.2 10.8 13.4 3,560 1.7 11.4 78.4 500 or more employees 386,897 69.9 80.7 100.0 6,488 3.2 14.6 100.0
Manufacturers 343,165 62.0 62.0 100.0 12,106 5.9 5.9 100.0 no. employees unknown (3) 5,532 1.0 1.0 1.6 1,071 0.5 0.5 8.8 1 to 19 employees 429 0.1 1.1 1.7 277 0.1 0.7 11.1 20 to 49 employees 691 0.1 1.2 1.9 860 0.4 1.1 18.2 50 to 99 employees 1,389 0.3 1.5 2.3 1,591 0.8 1.9 31.4 100 to 249 employees 6,291 1.1 2.6 4.2 2,970 1.4 3.3 55.9 250 to 499 employees 9,706 1.8 4.3 7.0 2,028 1.0 4.3 72.7 500 or more employees 319,127 57.6 62.0 100.0 3,309 1.6 5.9 100.0
See footnotes at end of table.
7
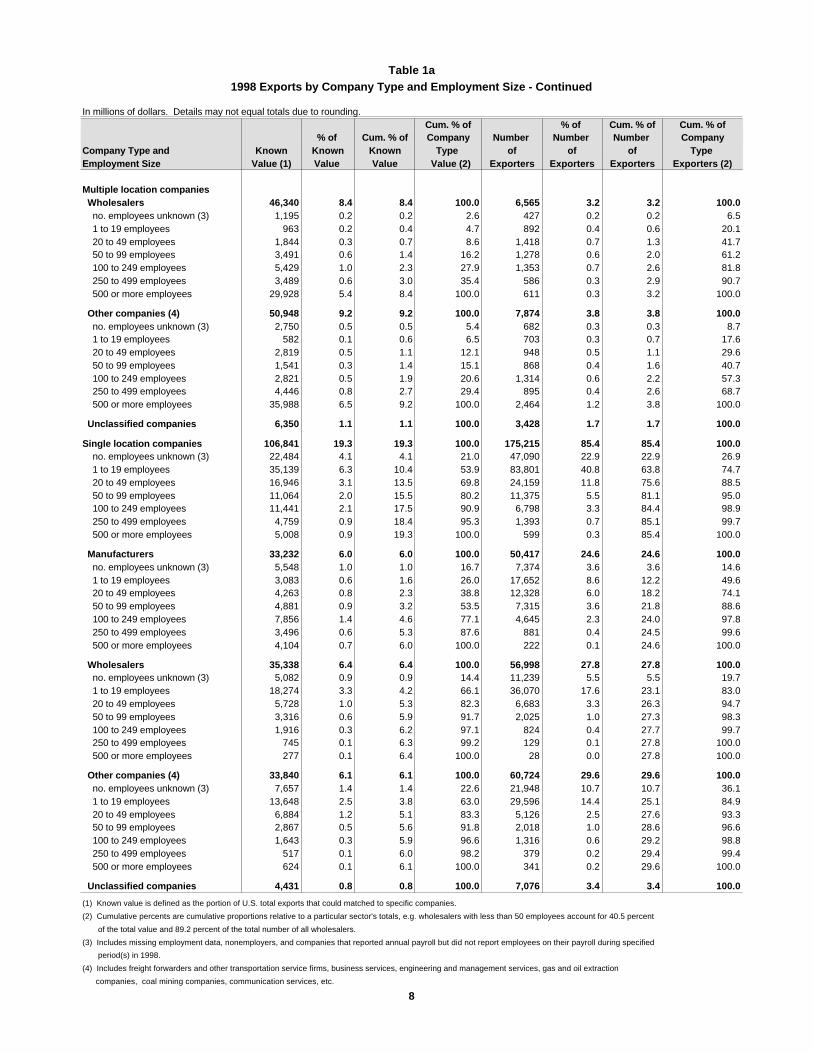
Table 1a1998 Exports by Company Type and Employment Size - Continued
In millions of dollars. Details may not equal totals due to rounding. Cum. % of % of Cum. % of Cum. % of
% of Cum. % of Company Number Number Number Company Company Type and Known Known Known Type of of of Type Employment Size Value (1) Value Value Value (2) Exporters Exporters Exporters Exporters (2)
Multiple location companies Wholesalers 46,340 8.4 8.4 100.0 6,565 3.2 3.2 100.0 no. employees unknown (3) 1,195 0.2 0.2 2.6 427 0.2 0.2 6.5 1 to 19 employees 963 0.2 0.4 4.7 892 0.4 0.6 20.1 20 to 49 employees 1,844 0.3 0.7 8.6 1,418 0.7 1.3 41.7 50 to 99 employees 3,491 0.6 1.4 16.2 1,278 0.6 2.0 61.2 100 to 249 employees 5,429 1.0 2.3 27.9 1,353 0.7 2.6 81.8 250 to 499 employees 3,489 0.6 3.0 35.4 586 0.3 2.9 90.7 500 or more employees 29,928 5.4 8.4 100.0 611 0.3 3.2 100.0 Other companies (4) 50,948 9.2 9.2 100.0 7,874 3.8 3.8 100.0 no. employees unknown (3) 2,750 0.5 0.5 5.4 682 0.3 0.3 8.7 1 to 19 employees 582 0.1 0.6 6.5 703 0.3 0.7 17.6 20 to 49 employees 2,819 0.5 1.1 12.1 948 0.5 1.1 29.6 50 to 99 employees 1,541 0.3 1.4 15.1 868 0.4 1.6 40.7 100 to 249 employees 2,821 0.5 1.9 20.6 1,314 0.6 2.2 57.3 250 to 499 employees 4,446 0.8 2.7 29.4 895 0.4 2.6 68.7 500 or more employees 35,988 6.5 9.2 100.0 2,464 1.2 3.8 100.0 Unclassified companies 6,350 1.1 1.1 100.0 3,428 1.7 1.7 100.0 Single location companies 106,841 19.3 19.3 100.0 175,215 85.4 85.4 100.0 no. employees unknown (3) 22,484 4.1 4.1 21.0 47,090 22.9 22.9 26.9 1 to 19 employees 35,139 6.3 10.4 53.9 83,801 40.8 63.8 74.7 20 to 49 employees 16,946 3.1 13.5 69.8 24,159 11.8 75.6 88.5 50 to 99 employees 11,064 2.0 15.5 80.2 11,375 5.5 81.1 95.0 100 to 249 employees 11,441 2.1 17.5 90.9 6,798 3.3 84.4 98.9 250 to 499 employees 4,759 0.9 18.4 95.3 1,393 0.7 85.1 99.7 500 or more employees 5,008 0.9 19.3 100.0 599 0.3 85.4 100.0 Manufacturers 33,232 6.0 6.0 100.0 50,417 24.6 24.6 100.0 no. employees unknown (3) 5,548 1.0 1.0 16.7 7,374 3.6 3.6 14.6 1 to 19 employees 3,083 0.6 1.6 26.0 17,652 8.6 12.2 49.6 20 to 49 employees 4,263 0.8 2.3 38.8 12,328 6.0 18.2 74.1 50 to 99 employees 4,881 0.9 3.2 53.5 7,315 3.6 21.8 88.6 100 to 249 employees 7,856 1.4 4.6 77.1 4,645 2.3 24.0 97.8 250 to 499 employees 3,496 0.6 5.3 87.6 881 0.4 24.5 99.6 500 or more employees 4,104 0.7 6.0 100.0 222 0.1 24.6 100.0 Wholesalers 35,338 6.4 6.4 100.0 56,998 27.8 27.8 100.0 no. employees unknown (3) 5,082 0.9 0.9 14.4 11,239 5.5 5.5 19.7 1 to 19 employees 18,274 3.3 4.2 66.1 36,070 17.6 23.1 83.0 20 to 49 employees 5,728 1.0 5.3 82.3 6,683 3.3 26.3 94.7 50 to 99 employees 3,316 0.6 5.9 91.7 2,025 1.0 27.3 98.3 100 to 249 employees 1,916 0.3 6.2 97.1 824 0.4 27.7 99.7 250 to 499 employees 745 0.1 6.3 99.2 129 0.1 27.8 100.0 500 or more employees 277 0.1 6.4 100.0 28 0.0 27.8 100.0 Other companies (4) 33,840 6.1 6.1 100.0 60,724 29.6 29.6 100.0 no. employees unknown (3) 7,657 1.4 1.4 22.6 21,948 10.7 10.7 36.1 1 to 19 employees 13,648 2.5 3.8 63.0 29,596 14.4 25.1 84.9 20 to 49 employees 6,884 1.2 5.1 83.3 5,126 2.5 27.6 93.3 50 to 99 employees 2,867 0.5 5.6 91.8 2,018 1.0 28.6 96.6 100 to 249 employees 1,643 0.3 5.9 96.6 1,316 0.6 29.2 98.8 250 to 499 employees 517 0.1 6.0 98.2 379 0.2 29.4 99.4 500 or more employees 624 0.1 6.1 100.0 341 0.2 29.6 100.0 Unclassified companies 4,431 0.8 0.8 100.0 7,076 3.4 3.4 100.0
(1) Known value is defined as the portion of U.S. total exports that could matched to specific companies.
(2) Cumulative percents are cumulative proportions relative to a particular sector's totals, e.g. wholesalers with less than 50 employees account for 40.5 percent
of the total value and 89.2 percent of the total number of all wholesalers.
(3) Includes missing employment data, nonemployers, and companies that reported annual payroll but did not report employees on their payroll during specified
period(s) in 1998.
(4) Includes freight forwarders and other transportation service firms, business services, engineering and management services, gas and oil extraction
companies, coal mining companies, communication services, etc.
8

Table 1b1997 Exports by Company Type and Employment Size
In millions of dollars. Details may not equal totals due to rounding.Cum. % of % of Cum. % of Cum. % of
% of Cum. % of Company Number Number Number Company Company Type and Known Known Known Type of of of TypeEmployment Size Value (1) Value Value Value (2) Exporters Exporters Exporters Exporters (2)
All identified companies 566,821 100.0 100.0 100.0 213,664 100.0 100.0 100.0 no. employees unknown (3) 37,577 6.6 6.6 6.6 43,836 20.5 20.5 20.5 1 to 19 employees 42,488 7.5 14.1 14.1 94,970 44.4 65.0 65.0 20 to 49 employees 24,609 4.3 18.5 18.5 30,869 14.4 79.4 79.4 50 to 99 employees 18,173 3.2 21.7 21.7 17,081 8.0 87.4 87.4 100 to 249 employees 27,533 4.9 26.5 26.5 14,105 6.6 94.0 94.0 250 to 499 employees 24,014 4.2 30.8 30.8 5,460 2.6 96.6 96.6 500 or more employees 392,428 69.2 100.0 100.0 7,343 3.4 100.0 100.0
Manufacturers 385,240 68.0 68.0 100.0 63,756 29.8 29.8 100.0 no. employees unknown (3) 8,113 1.4 1.4 2.1 6,932 3.2 3.2 10.9 1 to 19 employees 3,739 0.7 2.1 3.1 19,279 9.0 12.3 41.1 20 to 49 employees 5,712 1.0 3.1 4.6 13,964 6.5 18.8 63.0 50 to 99 employees 6,600 1.2 4.3 6.3 9,176 4.3 23.1 77.4 100 to 249 employees 14,493 2.6 6.8 10.0 7,915 3.7 26.8 89.8 250 to 499 employees 13,938 2.5 9.3 13.7 2,936 1.4 28.2 94.4 500 or more employees 332,645 58.7 68.0 100.0 3,554 1.7 29.8 100.0
Wholesalers 70,947 12.5 12.5 100.0 66,024 30.9 30.9 100.0 no. employees unknown (3) 5,043 0.9 0.9 7.1 10,681 5.0 5.0 16.2 1 to 19 employees 22,347 3.9 4.8 38.6 39,706 18.6 23.6 76.3 20 to 49 employees 9,338 1.6 6.5 51.8 8,729 4.1 27.7 89.5 50 to 99 employees 6,181 1.1 7.6 60.5 3,521 1.6 29.3 94.9 100 to 249 employees 7,145 1.3 8.8 70.6 2,215 1.0 30.4 98.2 250 to 499 employees 4,016 0.7 9.5 76.2 660 0.3 30.7 99.2 500 or more employees 16,876 3.0 12.5 100.0 512 0.2 30.9 100.0
Other companies (4) 80,275 14.2 14.2 100.0 67,172 31.4 31.4 100.0 no. employees unknown (3) 8,347 1.5 1.5 10.4 16,819 7.9 7.9 25.0 1 to 19 employees 14,632 2.6 4.1 28.6 33,731 15.8 23.7 75.3 20 to 49 employees 8,284 1.5 5.5 38.9 6,590 3.1 26.7 85.1 50 to 99 employees 4,145 0.7 6.2 44.1 3,114 1.5 28.2 89.7 100 to 249 employees 3,825 0.7 6.9 48.9 2,709 1.3 29.5 93.7 250 to 499 employees 4,430 0.8 7.7 54.4 1,359 0.6 30.1 95.8 500 or more employees 36,613 6.5 14.2 100.0 2,850 1.3 31.4 100.0
Unclassified companies 30,359 5.4 5.4 100.0 16,712 7.8 7.8 100.0
Multiple location companies 453,244 80.0 80.0 100.0 30,940 14.5 14.5 100.0 no. employees unknown (3) 15,591 2.8 2.8 3.4 2,104 1.0 1.0 6.8 1 to 19 employees 2,553 0.5 3.2 4.0 2,853 1.3 2.3 16.0 20 to 49 employees 6,253 1.1 4.3 5.4 4,497 2.1 4.4 30.6 50 to 99 employees 8,145 1.4 5.7 7.2 4,686 2.2 6.6 45.7 100 to 249 employees 16,099 2.8 8.6 10.7 6,426 3.0 9.6 66.5 250 to 499 employees 18,171 3.2 11.8 14.7 3,804 1.8 11.4 78.8 500 or more employees 386,432 68.2 80.0 100.0 6,570 3.1 14.5 100.0
Manufacturers 350,512 61.8 61.8 100.0 11,364 5.3 5.3 100.0 no. employees unknown (3) 3,853 0.7 0.7 1.1 818 0.4 0.4 7.2 1 to 19 employees 277 0.0 0.7 1.2 261 0.1 0.5 9.5 20 to 49 employees 710 0.1 0.9 1.4 779 0.4 0.9 16.3 50 to 99 employees 1,345 0.2 1.1 1.8 1,444 0.7 1.5 29.1 100 to 249 employees 6,287 1.1 2.2 3.6 2,819 1.3 2.9 53.9 250 to 499 employees 9,754 1.7 3.9 6.3 1,970 0.9 3.8 71.2 500 or more employees 328,286 57.9 61.8 100.0 3,273 1.5 5.3 100.0
See footnotes at end of table.
9
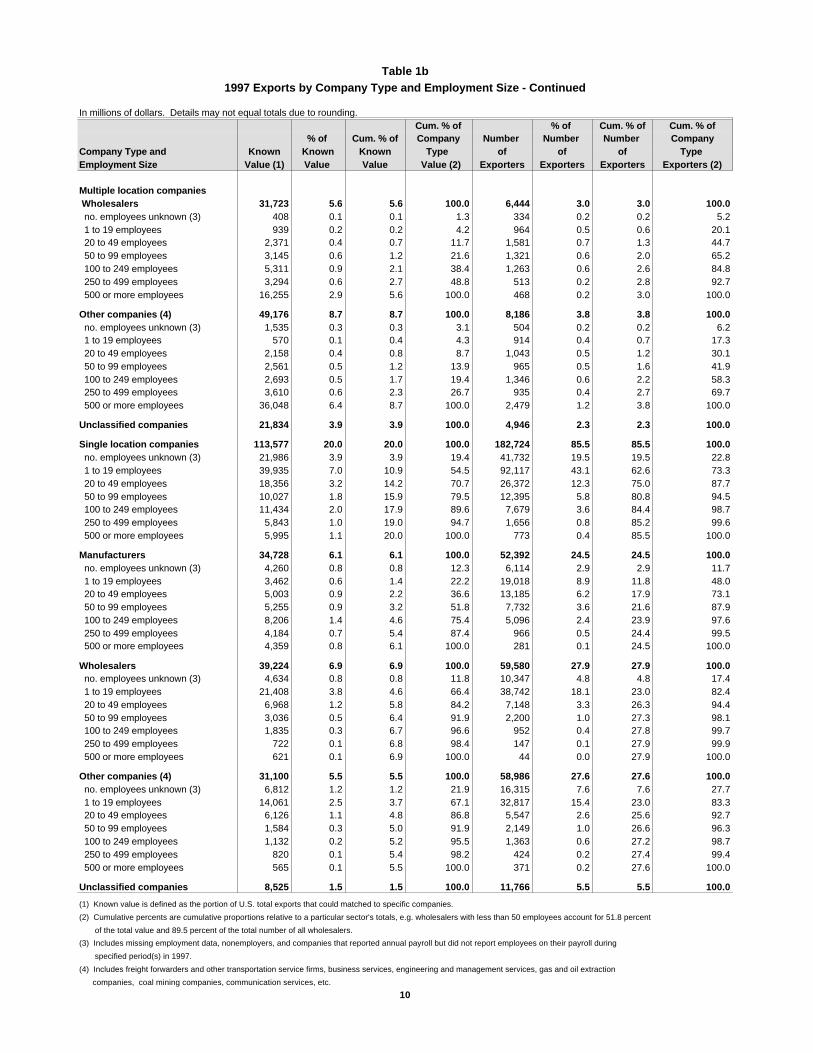
Table 1b1997 Exports by Company Type and Employment Size - Continued
In millions of dollars. Details may not equal totals due to rounding. Cum. % of % of Cum. % of Cum. % of
% of Cum. % of Company Number Number Number Company Company Type and Known Known Known Type of of of Type Employment Size Value (1) Value Value Value (2) Exporters Exporters Exporters Exporters (2)
Multiple location companies Wholesalers 31,723 5.6 5.6 100.0 6,444 3.0 3.0 100.0 no. employees unknown (3) 408 0.1 0.1 1.3 334 0.2 0.2 5.2 1 to 19 employees 939 0.2 0.2 4.2 964 0.5 0.6 20.1 20 to 49 employees 2,371 0.4 0.7 11.7 1,581 0.7 1.3 44.7 50 to 99 employees 3,145 0.6 1.2 21.6 1,321 0.6 2.0 65.2 100 to 249 employees 5,311 0.9 2.1 38.4 1,263 0.6 2.6 84.8 250 to 499 employees 3,294 0.6 2.7 48.8 513 0.2 2.8 92.7 500 or more employees 16,255 2.9 5.6 100.0 468 0.2 3.0 100.0
Other companies (4) 49,176 8.7 8.7 100.0 8,186 3.8 3.8 100.0 no. employees unknown (3) 1,535 0.3 0.3 3.1 504 0.2 0.2 6.2 1 to 19 employees 570 0.1 0.4 4.3 914 0.4 0.7 17.3 20 to 49 employees 2,158 0.4 0.8 8.7 1,043 0.5 1.2 30.1 50 to 99 employees 2,561 0.5 1.2 13.9 965 0.5 1.6 41.9 100 to 249 employees 2,693 0.5 1.7 19.4 1,346 0.6 2.2 58.3 250 to 499 employees 3,610 0.6 2.3 26.7 935 0.4 2.7 69.7 500 or more employees 36,048 6.4 8.7 100.0 2,479 1.2 3.8 100.0
Unclassified companies 21,834 3.9 3.9 100.0 4,946 2.3 2.3 100.0
Single location companies 113,577 20.0 20.0 100.0 182,724 85.5 85.5 100.0 no. employees unknown (3) 21,986 3.9 3.9 19.4 41,732 19.5 19.5 22.8 1 to 19 employees 39,935 7.0 10.9 54.5 92,117 43.1 62.6 73.3 20 to 49 employees 18,356 3.2 14.2 70.7 26,372 12.3 75.0 87.7 50 to 99 employees 10,027 1.8 15.9 79.5 12,395 5.8 80.8 94.5 100 to 249 employees 11,434 2.0 17.9 89.6 7,679 3.6 84.4 98.7 250 to 499 employees 5,843 1.0 19.0 94.7 1,656 0.8 85.2 99.6 500 or more employees 5,995 1.1 20.0 100.0 773 0.4 85.5 100.0
Manufacturers 34,728 6.1 6.1 100.0 52,392 24.5 24.5 100.0 no. employees unknown (3) 4,260 0.8 0.8 12.3 6,114 2.9 2.9 11.7 1 to 19 employees 3,462 0.6 1.4 22.2 19,018 8.9 11.8 48.0 20 to 49 employees 5,003 0.9 2.2 36.6 13,185 6.2 17.9 73.1 50 to 99 employees 5,255 0.9 3.2 51.8 7,732 3.6 21.6 87.9 100 to 249 employees 8,206 1.4 4.6 75.4 5,096 2.4 23.9 97.6 250 to 499 employees 4,184 0.7 5.4 87.4 966 0.5 24.4 99.5 500 or more employees 4,359 0.8 6.1 100.0 281 0.1 24.5 100.0
Wholesalers 39,224 6.9 6.9 100.0 59,580 27.9 27.9 100.0 no. employees unknown (3) 4,634 0.8 0.8 11.8 10,347 4.8 4.8 17.4 1 to 19 employees 21,408 3.8 4.6 66.4 38,742 18.1 23.0 82.4 20 to 49 employees 6,968 1.2 5.8 84.2 7,148 3.3 26.3 94.4 50 to 99 employees 3,036 0.5 6.4 91.9 2,200 1.0 27.3 98.1 100 to 249 employees 1,835 0.3 6.7 96.6 952 0.4 27.8 99.7 250 to 499 employees 722 0.1 6.8 98.4 147 0.1 27.9 99.9 500 or more employees 621 0.1 6.9 100.0 44 0.0 27.9 100.0
Other companies (4) 31,100 5.5 5.5 100.0 58,986 27.6 27.6 100.0 no. employees unknown (3) 6,812 1.2 1.2 21.9 16,315 7.6 7.6 27.7 1 to 19 employees 14,061 2.5 3.7 67.1 32,817 15.4 23.0 83.3 20 to 49 employees 6,126 1.1 4.8 86.8 5,547 2.6 25.6 92.7 50 to 99 employees 1,584 0.3 5.0 91.9 2,149 1.0 26.6 96.3 100 to 249 employees 1,132 0.2 5.2 95.5 1,363 0.6 27.2 98.7 250 to 499 employees 820 0.1 5.4 98.2 424 0.2 27.4 99.4 500 or more employees 565 0.1 5.5 100.0 371 0.2 27.6 100.0
Unclassified companies 8,525 1.5 1.5 100.0 11,766 5.5 5.5 100.0
(1) Known value is defined as the portion of U.S. total exports that could matched to specific companies.
(2) Cumulative percents are cumulative proportions relative to a particular sector's totals, e.g. wholesalers with less than 50 employees account for 51.8 percent
of the total value and 89.5 percent of the total number of all wholesalers.
(3) Includes missing employment data, nonemployers, and companies that reported annual payroll but did not report employees on their payroll during
specified period(s) in 1997.
(4) Includes freight forwarders and other transportation service firms, business services, engineering and management services, gas and oil extraction
companies, coal mining companies, communication services, etc.
10
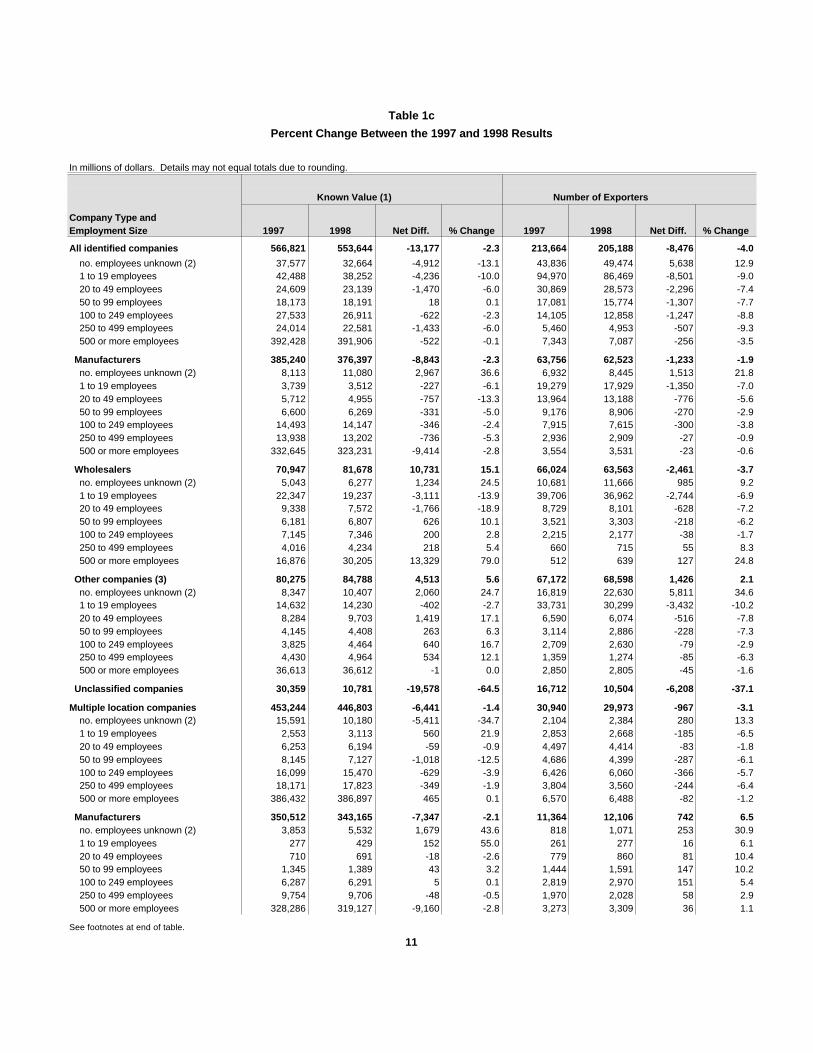
Table 1c
Percent Change Between the 1997 and 1998 Results
In millions of dollars. Details may not equal totals due to rounding.
Known Value (1) Number of Exporters
Company Type andEmployment Size 1997 1998 Net Diff. % Change 1997 1998 Net Diff. % Change
All identified companies 566,821 553,644 -13,177 -2.3 213,664 205,188 -8,476 -4.0
no. employees unknown (2) 37,577 32,664 -4,912 -13.1 43,836 49,474 5,638 12.9 1 to 19 employees 42,488 38,252 -4,236 -10.0 94,970 86,469 -8,501 -9.0 20 to 49 employees 24,609 23,139 -1,470 -6.0 30,869 28,573 -2,296 -7.4 50 to 99 employees 18,173 18,191 18 0.1 17,081 15,774 -1,307 -7.7 100 to 249 employees 27,533 26,911 -622 -2.3 14,105 12,858 -1,247 -8.8 250 to 499 employees 24,014 22,581 -1,433 -6.0 5,460 4,953 -507 -9.3 500 or more employees 392,428 391,906 -522 -0.1 7,343 7,087 -256 -3.5
Manufacturers 385,240 376,397 -8,843 -2.3 63,756 62,523 -1,233 -1.9 no. employees unknown (2) 8,113 11,080 2,967 36.6 6,932 8,445 1,513 21.8 1 to 19 employees 3,739 3,512 -227 -6.1 19,279 17,929 -1,350 -7.0 20 to 49 employees 5,712 4,955 -757 -13.3 13,964 13,188 -776 -5.6 50 to 99 employees 6,600 6,269 -331 -5.0 9,176 8,906 -270 -2.9 100 to 249 employees 14,493 14,147 -346 -2.4 7,915 7,615 -300 -3.8 250 to 499 employees 13,938 13,202 -736 -5.3 2,936 2,909 -27 -0.9 500 or more employees 332,645 323,231 -9,414 -2.8 3,554 3,531 -23 -0.6
Wholesalers 70,947 81,678 10,731 15.1 66,024 63,563 -2,461 -3.7 no. employees unknown (2) 5,043 6,277 1,234 24.5 10,681 11,666 985 9.2 1 to 19 employees 22,347 19,237 -3,111 -13.9 39,706 36,962 -2,744 -6.9 20 to 49 employees 9,338 7,572 -1,766 -18.9 8,729 8,101 -628 -7.2 50 to 99 employees 6,181 6,807 626 10.1 3,521 3,303 -218 -6.2 100 to 249 employees 7,145 7,346 200 2.8 2,215 2,177 -38 -1.7 250 to 499 employees 4,016 4,234 218 5.4 660 715 55 8.3 500 or more employees 16,876 30,205 13,329 79.0 512 639 127 24.8
Other companies (3) 80,275 84,788 4,513 5.6 67,172 68,598 1,426 2.1 no. employees unknown (2) 8,347 10,407 2,060 24.7 16,819 22,630 5,811 34.6 1 to 19 employees 14,632 14,230 -402 -2.7 33,731 30,299 -3,432 -10.2 20 to 49 employees 8,284 9,703 1,419 17.1 6,590 6,074 -516 -7.8 50 to 99 employees 4,145 4,408 263 6.3 3,114 2,886 -228 -7.3 100 to 249 employees 3,825 4,464 640 16.7 2,709 2,630 -79 -2.9 250 to 499 employees 4,430 4,964 534 12.1 1,359 1,274 -85 -6.3 500 or more employees 36,613 36,612 -1 0.0 2,850 2,805 -45 -1.6
Unclassified companies 30,359 10,781 -19,578 -64.5 16,712 10,504 -6,208 -37.1
Multiple location companies 453,244 446,803 -6,441 -1.4 30,940 29,973 -967 -3.1 no. employees unknown (2) 15,591 10,180 -5,411 -34.7 2,104 2,384 280 13.3 1 to 19 employees 2,553 3,113 560 21.9 2,853 2,668 -185 -6.5 20 to 49 employees 6,253 6,194 -59 -0.9 4,497 4,414 -83 -1.8 50 to 99 employees 8,145 7,127 -1,018 -12.5 4,686 4,399 -287 -6.1 100 to 249 employees 16,099 15,470 -629 -3.9 6,426 6,060 -366 -5.7 250 to 499 employees 18,171 17,823 -349 -1.9 3,804 3,560 -244 -6.4 500 or more employees 386,432 386,897 465 0.1 6,570 6,488 -82 -1.2
Manufacturers 350,512 343,165 -7,347 -2.1 11,364 12,106 742 6.5 no. employees unknown (2) 3,853 5,532 1,679 43.6 818 1,071 253 30.9 1 to 19 employees 277 429 152 55.0 261 277 16 6.1 20 to 49 employees 710 691 -18 -2.6 779 860 81 10.4 50 to 99 employees 1,345 1,389 43 3.2 1,444 1,591 147 10.2 100 to 249 employees 6,287 6,291 5 0.1 2,819 2,970 151 5.4 250 to 499 employees 9,754 9,706 -48 -0.5 1,970 2,028 58 2.9 500 or more employees 328,286 319,127 -9,160 -2.8 3,273 3,309 36 1.1
See footnotes at end of table.
11
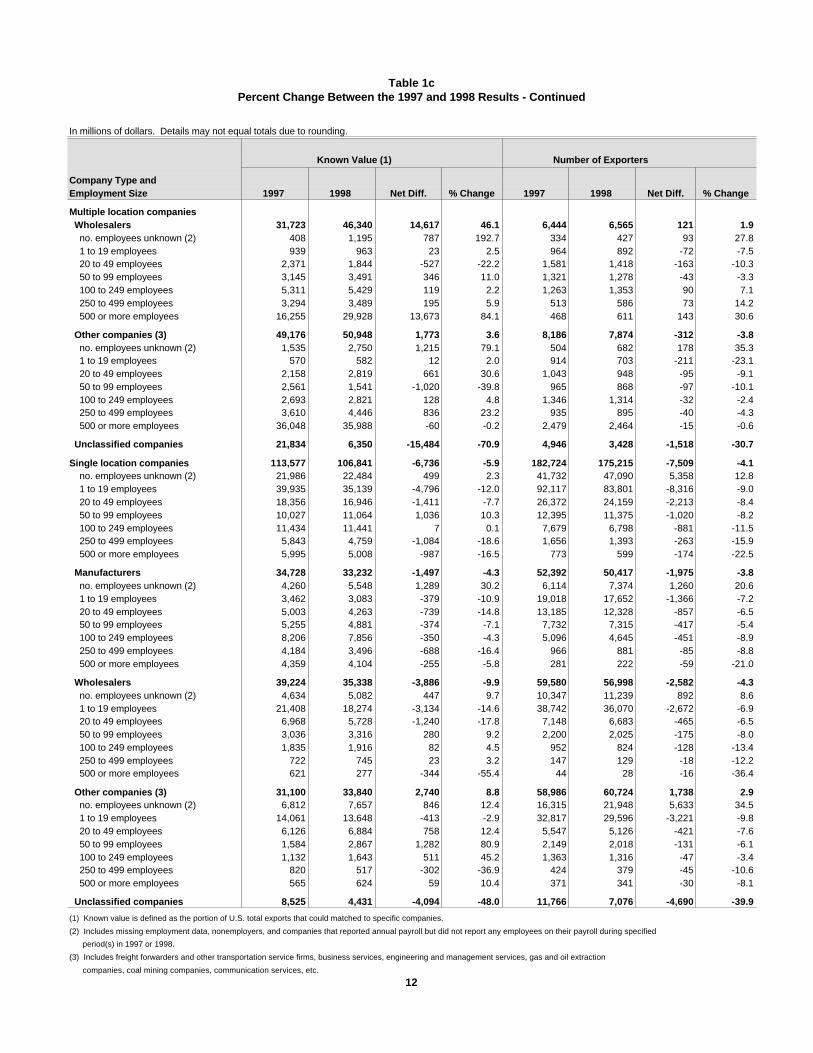
Table 1cPercent Change Between the 1997 and 1998 Results - Continued
In millions of dollars. Details may not equal totals due to rounding.
Known Value (1) Number of Exporters
Company Type andEmployment Size 1997 1998 Net Diff. % Change 1997 1998 Net Diff. % Change
Multiple location companies Wholesalers 31,723 46,340 14,617 46.1 6,444 6,565 121 1.9 no. employees unknown (2) 408 1,195 787 192.7 334 427 93 27.8 1 to 19 employees 939 963 23 2.5 964 892 -72 -7.5 20 to 49 employees 2,371 1,844 -527 -22.2 1,581 1,418 -163 -10.3 50 to 99 employees 3,145 3,491 346 11.0 1,321 1,278 -43 -3.3 100 to 249 employees 5,311 5,429 119 2.2 1,263 1,353 90 7.1 250 to 499 employees 3,294 3,489 195 5.9 513 586 73 14.2 500 or more employees 16,255 29,928 13,673 84.1 468 611 143 30.6 Other companies (3) 49,176 50,948 1,773 3.6 8,186 7,874 -312 -3.8 no. employees unknown (2) 1,535 2,750 1,215 79.1 504 682 178 35.3 1 to 19 employees 570 582 12 2.0 914 703 -211 -23.1 20 to 49 employees 2,158 2,819 661 30.6 1,043 948 -95 -9.1 50 to 99 employees 2,561 1,541 -1,020 -39.8 965 868 -97 -10.1 100 to 249 employees 2,693 2,821 128 4.8 1,346 1,314 -32 -2.4 250 to 499 employees 3,610 4,446 836 23.2 935 895 -40 -4.3 500 or more employees 36,048 35,988 -60 -0.2 2,479 2,464 -15 -0.6
Unclassified companies 21,834 6,350 -15,484 -70.9 4,946 3,428 -1,518 -30.7
Single location companies 113,577 106,841 -6,736 -5.9 182,724 175,215 -7,509 -4.1 no. employees unknown (2) 21,986 22,484 499 2.3 41,732 47,090 5,358 12.8 1 to 19 employees 39,935 35,139 -4,796 -12.0 92,117 83,801 -8,316 -9.0 20 to 49 employees 18,356 16,946 -1,411 -7.7 26,372 24,159 -2,213 -8.4 50 to 99 employees 10,027 11,064 1,036 10.3 12,395 11,375 -1,020 -8.2 100 to 249 employees 11,434 11,441 7 0.1 7,679 6,798 -881 -11.5 250 to 499 employees 5,843 4,759 -1,084 -18.6 1,656 1,393 -263 -15.9 500 or more employees 5,995 5,008 -987 -16.5 773 599 -174 -22.5
Manufacturers 34,728 33,232 -1,497 -4.3 52,392 50,417 -1,975 -3.8 no. employees unknown (2) 4,260 5,548 1,289 30.2 6,114 7,374 1,260 20.6 1 to 19 employees 3,462 3,083 -379 -10.9 19,018 17,652 -1,366 -7.2 20 to 49 employees 5,003 4,263 -739 -14.8 13,185 12,328 -857 -6.5 50 to 99 employees 5,255 4,881 -374 -7.1 7,732 7,315 -417 -5.4 100 to 249 employees 8,206 7,856 -350 -4.3 5,096 4,645 -451 -8.9 250 to 499 employees 4,184 3,496 -688 -16.4 966 881 -85 -8.8 500 or more employees 4,359 4,104 -255 -5.8 281 222 -59 -21.0
Wholesalers 39,224 35,338 -3,886 -9.9 59,580 56,998 -2,582 -4.3 no. employees unknown (2) 4,634 5,082 447 9.7 10,347 11,239 892 8.6 1 to 19 employees 21,408 18,274 -3,134 -14.6 38,742 36,070 -2,672 -6.9 20 to 49 employees 6,968 5,728 -1,240 -17.8 7,148 6,683 -465 -6.5 50 to 99 employees 3,036 3,316 280 9.2 2,200 2,025 -175 -8.0 100 to 249 employees 1,835 1,916 82 4.5 952 824 -128 -13.4 250 to 499 employees 722 745 23 3.2 147 129 -18 -12.2 500 or more employees 621 277 -344 -55.4 44 28 -16 -36.4
Other companies (3) 31,100 33,840 2,740 8.8 58,986 60,724 1,738 2.9 no. employees unknown (2) 6,812 7,657 846 12.4 16,315 21,948 5,633 34.5 1 to 19 employees 14,061 13,648 -413 -2.9 32,817 29,596 -3,221 -9.8 20 to 49 employees 6,126 6,884 758 12.4 5,547 5,126 -421 -7.6 50 to 99 employees 1,584 2,867 1,282 80.9 2,149 2,018 -131 -6.1 100 to 249 employees 1,132 1,643 511 45.2 1,363 1,316 -47 -3.4 250 to 499 employees 820 517 -302 -36.9 424 379 -45 -10.6 500 or more employees 565 624 59 10.4 371 341 -30 -8.1
Unclassified companies 8,525 4,431 -4,094 -48.0 11,766 7,076 -4,690 -39.9
(1) Known value is defined as the portion of U.S. total exports that could matched to specific companies.
(2) Includes missing employment data, nonemployers, and companies that reported annual payroll but did not report any employees on their payroll during specified
period(s) in 1997 or 1998.
(3) Includes freight forwarders and other transportation service firms, business services, engineering and management services, gas and oil extraction
companies, coal mining companies, communication services, etc.
12
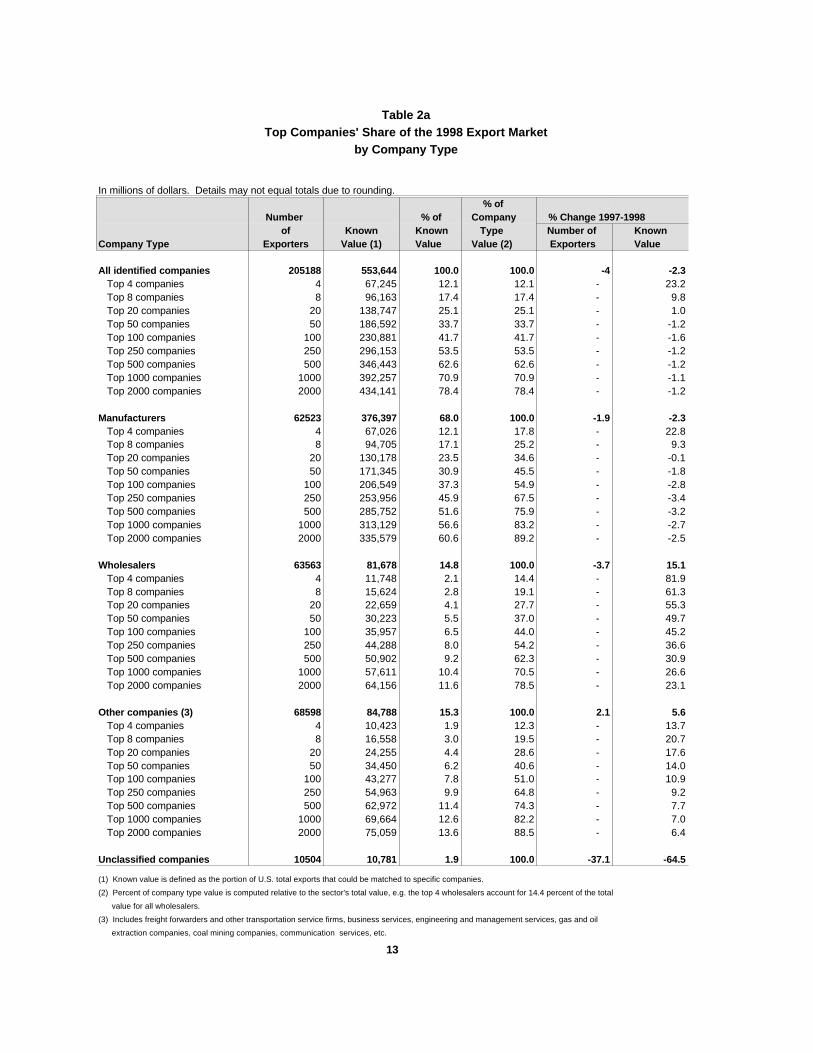
Table 2aTop Companies' Share of the 1998 Export Market
by Company Type
In millions of dollars. Details may not equal totals due to rounding. % of Number % of Company % Change 1997-1998 of Known Known Type Number of KnownCompany Type Exporters Value (1) Value Value (2) Exporters Value All identified companies 205188 553,644 100.0 100.0 -4 -2.3 Top 4 companies 4 67,245 12.1 12.1 - 23.2 Top 8 companies 8 96,163 17.4 17.4 - 9.8 Top 20 companies 20 138,747 25.1 25.1 - 1.0 Top 50 companies 50 186,592 33.7 33.7 - -1.2 Top 100 companies 100 230,881 41.7 41.7 - -1.6 Top 250 companies 250 296,153 53.5 53.5 - -1.2 Top 500 companies 500 346,443 62.6 62.6 - -1.2 Top 1000 companies 1000 392,257 70.9 70.9 - -1.1 Top 2000 companies 2000 434,141 78.4 78.4 - -1.2 Manufacturers 62523 376,397 68.0 100.0 -1.9 -2.3 Top 4 companies 4 67,026 12.1 17.8 - 22.8 Top 8 companies 8 94,705 17.1 25.2 - 9.3 Top 20 companies 20 130,178 23.5 34.6 - -0.1 Top 50 companies 50 171,345 30.9 45.5 - -1.8 Top 100 companies 100 206,549 37.3 54.9 - -2.8 Top 250 companies 250 253,956 45.9 67.5 - -3.4 Top 500 companies 500 285,752 51.6 75.9 - -3.2 Top 1000 companies 1000 313,129 56.6 83.2 - -2.7 Top 2000 companies 2000 335,579 60.6 89.2 - -2.5 Wholesalers 63563 81,678 14.8 100.0 -3.7 15.1 Top 4 companies 4 11,748 2.1 14.4 - 81.9 Top 8 companies 8 15,624 2.8 19.1 - 61.3 Top 20 companies 20 22,659 4.1 27.7 - 55.3 Top 50 companies 50 30,223 5.5 37.0 - 49.7 Top 100 companies 100 35,957 6.5 44.0 - 45.2 Top 250 companies 250 44,288 8.0 54.2 - 36.6 Top 500 companies 500 50,902 9.2 62.3 - 30.9 Top 1000 companies 1000 57,611 10.4 70.5 - 26.6 Top 2000 companies 2000 64,156 11.6 78.5 - 23.1 Other companies (3) 68598 84,788 15.3 100.0 2.1 5.6 Top 4 companies 4 10,423 1.9 12.3 - 13.7 Top 8 companies 8 16,558 3.0 19.5 - 20.7 Top 20 companies 20 24,255 4.4 28.6 - 17.6 Top 50 companies 50 34,450 6.2 40.6 - 14.0 Top 100 companies 100 43,277 7.8 51.0 - 10.9 Top 250 companies 250 54,963 9.9 64.8 - 9.2 Top 500 companies 500 62,972 11.4 74.3 - 7.7 Top 1000 companies 1000 69,664 12.6 82.2 - 7.0 Top 2000 companies 2000 75,059 13.6 88.5 - 6.4 Unclassified companies 10504 10,781 1.9 100.0 -37.1 -64.5 (1) Known value is defined as the portion of U.S. total exports that could be matched to specific companies.
(2) Percent of company type value is computed relative to the sector's total value, e.g. the top 4 wholesalers account for 14.4 percent of the total
value for all wholesalers.
(3) Includes freight forwarders and other transportation service firms, business services, engineering and management services, gas and oil
extraction companies, coal mining companies, communication services, etc.
13
Table 2bTop Companies' Share of the 1997 Export Market
by Company Type
In millions of dollars. Details may not equal totals due to rounding. % of Number % of Company of Known Known Type Company Type Exporters Value (1) Value Value (2) All identified companies 213,664 566,821 100.0 100.0 Top 4 companies 4 54,591 9.6 9.6 Top 8 companies 8 87,563 15.4 15.4 Top 20 companies 20 137,367 24.2 24.2 Top 50 companies 50 188,820 33.3 33.3 Top 100 companies 100 234,658 41.4 41.4 Top 250 companies 250 299,881 52.9 52.9 Top 500 companies 500 350,612 61.9 61.9 Top 1000 companies 1,000 396,721 70.0 70.0 Top 2000 companies 2,000 439,278 77.5 77.5 Manufacturers 63,756 385,240 68.0 100.0 Top 4 companies 4 54,591 9.6 14.2 Top 8 companies 8 86,648 15.3 22.5 Top 20 companies 20 130,286 23.0 33.8 Top 50 companies 50 174,509 30.8 45.3 Top 100 companies 100 212,535 37.5 55.2 Top 250 companies 250 262,896 46.4 68.2 Top 500 companies 500 295,149 52.1 76.6 Top 1000 companies 1,000 321,865 56.8 83.5 Top 2000 companies 2,000 344,283 60.7 89.4 Wholesalers 66,024 70,947 12.5 100.0 Top 4 companies 4 6,458 1.1 9.1 Top 8 companies 8 9,684 1.7 13.6 Top 20 companies 20 14,589 2.6 20.6 Top 50 companies 50 20,185 3.6 28.5 Top 100 companies 100 24,772 4.4 34.9 Top 250 companies 250 32,416 5.7 45.7 Top 500 companies 500 38,900 6.9 54.8 Top 1000 companies 1,000 45,509 8.0 64.1 Top 2000 companies 2,000 52,102 9.2 73.4 Other companies (3) 67,172 80,275 14.2 100.0 Top 4 companies 4 9,168 1.6 11.4 Top 8 companies 8 13,713 2.4 17.1 Top 20 companies 20 20,621 3.6 25.7 Top 50 companies 50 30,216 5.3 37.6 Top 100 companies 100 39,039 6.9 48.6 Top 250 companies 250 50,335 8.9 62.7 Top 500 companies 500 58,492 10.3 72.9 Top 1000 companies 1,000 65,132 11.5 81.1 Top 2000 companies 2,000 70,571 12.5 87.9 Unclassified companies 16,712 30,359 5.4 100.0 (1) Known value is defined as the portion of U.S. total exports that could be matched to specific companies.
(2) Percent of company type value is computed relative to the sector's total value, e.g. the top 4 wholesalers
account for 9.1 percent of the total value for all wholesalers.
(3) Includes freight forwarders and other transportation service firms, business services, engineering and
management services, gas and oil extraction companies, coal mining companies, communication
services, etc.
14
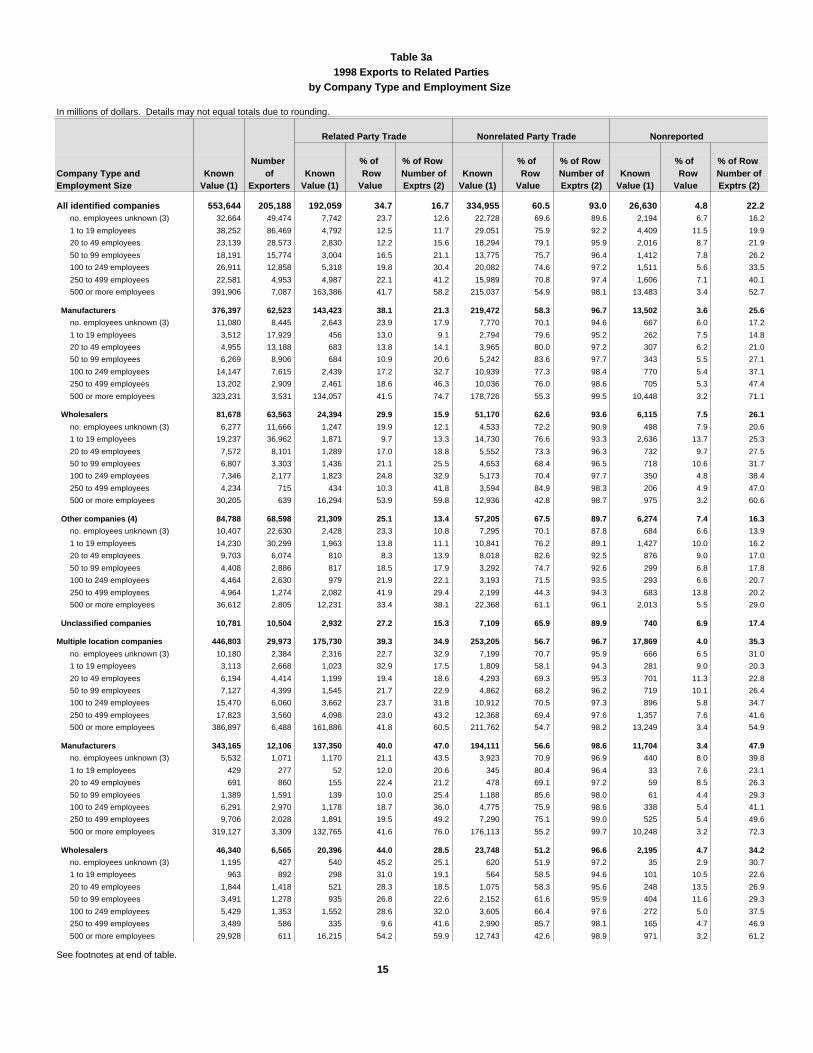
Table 3a1998 Exports to Related Parties
by Company Type and Employment Size
In millions of dollars. Details may not equal totals due to rounding. Related Party Trade Nonrelated Party Trade Nonreported Number % of % of Row % of % of Row % of % of Row Company Type and Known of Known Row Number of Known Row Number of Known Row Number ofEmployment Size Value (1) Exporters Value (1) Value Exptrs (2) Value (1) Value Exptrs (2) Value (1) Value Exptrs (2) All identified companies 553,644 205,188 192,059 34.7 16.7 334,955 60.5 93.0 26,630 4.8 22.2 no. employees unknown (3) 32,664 49,474 7,742 23.7 12.6 22,728 69.6 89.6 2,194 6.7 16.2
1 to 19 employees 38,252 86,469 4,792 12.5 11.7 29,051 75.9 92.2 4,409 11.5 19.9
20 to 49 employees 23,139 28,573 2,830 12.2 15.6 18,294 79.1 95.9 2,016 8.7 21.9
50 to 99 employees 18,191 15,774 3,004 16.5 21.1 13,775 75.7 96.4 1,412 7.8 26.2
100 to 249 employees 26,911 12,858 5,318 19.8 30.4 20,082 74.6 97.2 1,511 5.6 33.5
250 to 499 employees 22,581 4,953 4,987 22.1 41.2 15,989 70.8 97.4 1,606 7.1 40.1
500 or more employees 391,906 7,087 163,386 41.7 58.2 215,037 54.9 98.1 13,483 3.4 52.7
Manufacturers 376,397 62,523 143,423 38.1 21.3 219,472 58.3 96.7 13,502 3.6 25.6
no. employees unknown (3) 11,080 8,445 2,643 23.9 17.9 7,770 70.1 94.6 667 6.0 17.2
1 to 19 employees 3,512 17,929 456 13.0 9.1 2,794 79.6 95.2 262 7.5 14.8
20 to 49 employees 4,955 13,188 683 13.8 14.1 3,965 80.0 97.2 307 6.2 21.0
50 to 99 employees 6,269 8,906 684 10.9 20.6 5,242 83.6 97.7 343 5.5 27.1
100 to 249 employees 14,147 7,615 2,439 17.2 32.7 10,939 77.3 98.4 770 5.4 37.1
250 to 499 employees 13,202 2,909 2,461 18.6 46.3 10,036 76.0 98.6 705 5.3 47.4
500 or more employees 323,231 3,531 134,057 41.5 74.7 178,726 55.3 99.5 10,448 3.2 71.1
Wholesalers 81,678 63,563 24,394 29.9 15.9 51,170 62.6 93.6 6,115 7.5 26.1
no. employees unknown (3) 6,277 11,666 1,247 19.9 12.1 4,533 72.2 90.9 498 7.9 20.6
1 to 19 employees 19,237 36,962 1,871 9.7 13.3 14,730 76.6 93.3 2,636 13.7 25.3
20 to 49 employees 7,572 8,101 1,289 17.0 18.8 5,552 73.3 96.3 732 9.7 27.5
50 to 99 employees 6,807 3,303 1,436 21.1 25.5 4,653 68.4 96.5 718 10.6 31.7
100 to 249 employees 7,346 2,177 1,823 24.8 32.9 5,173 70.4 97.7 350 4.8 38.4
250 to 499 employees 4,234 715 434 10.3 41.8 3,594 84.9 98.3 206 4.9 47.0
500 or more employees 30,205 639 16,294 53.9 59.8 12,936 42.8 98.7 975 3.2 60.6
Other companies (4) 84,788 68,598 21,309 25.1 13.4 57,205 67.5 89.7 6,274 7.4 16.3
no. employees unknown (3) 10,407 22,630 2,428 23.3 10.8 7,295 70.1 87.8 684 6.6 13.9
1 to 19 employees 14,230 30,299 1,963 13.8 11.1 10,841 76.2 89.1 1,427 10.0 16.2
20 to 49 employees 9,703 6,074 810 8.3 13.9 8,018 82.6 92.5 876 9.0 17.0
50 to 99 employees 4,408 2,886 817 18.5 17.9 3,292 74.7 92.6 299 6.8 17.8
100 to 249 employees 4,464 2,630 979 21.9 22.1 3,193 71.5 93.5 293 6.6 20.7
250 to 499 employees 4,964 1,274 2,082 41.9 29.4 2,199 44.3 94.3 683 13.8 20.2
500 or more employees 36,612 2,805 12,231 33.4 38.1 22,368 61.1 96.1 2,013 5.5 29.0
Unclassified companies 10,781 10,504 2,932 27.2 15.3 7,109 65.9 89.9 740 6.9 17.4
Multiple location companies 446,803 29,973 175,730 39.3 34.9 253,205 56.7 96.7 17,869 4.0 35.3
no. employees unknown (3) 10,180 2,384 2,316 22.7 32.9 7,199 70.7 95.9 666 6.5 31.0
1 to 19 employees 3,113 2,668 1,023 32.9 17.5 1,809 58.1 94.3 281 9.0 20.3
20 to 49 employees 6,194 4,414 1,199 19.4 18.6 4,293 69.3 95.3 701 11.3 22.8
50 to 99 employees 7,127 4,399 1,545 21.7 22.9 4,862 68.2 96.2 719 10.1 26.4
100 to 249 employees 15,470 6,060 3,662 23.7 31.8 10,912 70.5 97.3 896 5.8 34.7
250 to 499 employees 17,823 3,560 4,098 23.0 43.2 12,368 69.4 97.6 1,357 7.6 41.6
500 or more employees 386,897 6,488 161,886 41.8 60.5 211,762 54.7 98.2 13,249 3.4 54.9
Manufacturers 343,165 12,106 137,350 40.0 47.0 194,111 56.6 98.6 11,704 3.4 47.9
no. employees unknown (3) 5,532 1,071 1,170 21.1 43.5 3,923 70.9 96.9 440 8.0 39.8
1 to 19 employees 429 277 52 12.0 20.6 345 80.4 96.4 33 7.6 23.1
20 to 49 employees 691 860 155 22.4 21.2 478 69.1 97.2 59 8.5 26.3
50 to 99 employees 1,389 1,591 139 10.0 25.4 1,188 85.6 98.0 61 4.4 29.3
100 to 249 employees 6,291 2,970 1,178 18.7 36.0 4,775 75.9 98.6 338 5.4 41.1
250 to 499 employees 9,706 2,028 1,891 19.5 49.2 7,290 75.1 99.0 525 5.4 49.6
500 or more employees 319,127 3,309 132,765 41.6 76.0 176,113 55.2 99.7 10,248 3.2 72.3
Wholesalers 46,340 6,565 20,396 44.0 28.5 23,748 51.2 96.6 2,195 4.7 34.2
no. employees unknown (3) 1,195 427 540 45.2 25.1 620 51.9 97.2 35 2.9 30.7
1 to 19 employees 963 892 298 31.0 19.1 564 58.5 94.6 101 10.5 22.6
20 to 49 employees 1,844 1,418 521 28.3 18.5 1,075 58.3 95.6 248 13.5 26.9
50 to 99 employees 3,491 1,278 935 26.8 22.6 2,152 61.6 95.9 404 11.6 29.3
100 to 249 employees 5,429 1,353 1,552 28.6 32.0 3,605 66.4 97.6 272 5.0 37.5
250 to 499 employees 3,489 586 335 9.6 41.6 2,990 85.7 98.1 165 4.7 46.9
500 or more employees 29,928 611 16,215 54.2 59.9 12,743 42.6 98.9 971 3.2 61.2
See footnotes at end of table.
15
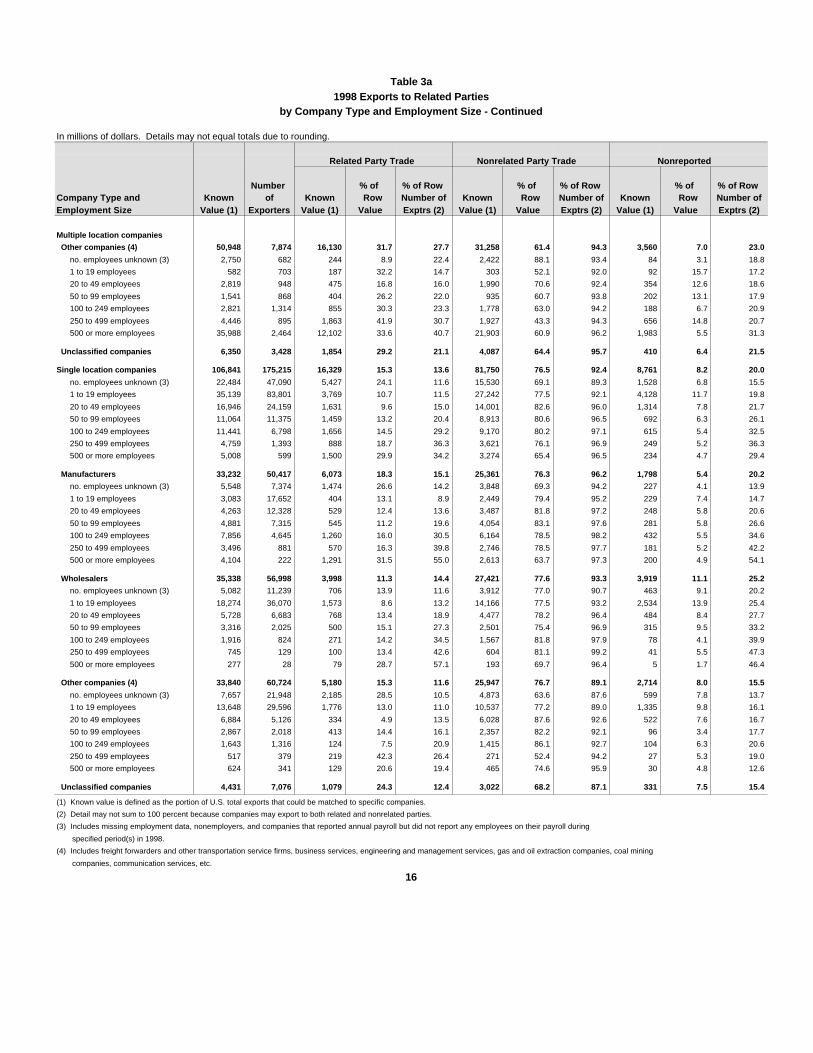
Table 3a1998 Exports to Related Parties
by Company Type and Employment Size - Continued
In millions of dollars. Details may not equal totals due to rounding. Related Party Trade Nonrelated Party Trade Nonreported Number % of % of Row % of % of Row % of % of Row Company Type and Known of Known Row Number of Known Row Number of Known Row Number ofEmployment Size Value (1) Exporters Value (1) Value Exptrs (2) Value (1) Value Exptrs (2) Value (1) Value Exptrs (2)
Multiple location companies
Other companies (4) 50,948 7,874 16,130 31.7 27.7 31,258 61.4 94.3 3,560 7.0 23.0
no. employees unknown (3) 2,750 682 244 8.9 22.4 2,422 88.1 93.4 84 3.1 18.8
1 to 19 employees 582 703 187 32.2 14.7 303 52.1 92.0 92 15.7 17.2
20 to 49 employees 2,819 948 475 16.8 16.0 1,990 70.6 92.4 354 12.6 18.6
50 to 99 employees 1,541 868 404 26.2 22.0 935 60.7 93.8 202 13.1 17.9
100 to 249 employees 2,821 1,314 855 30.3 23.3 1,778 63.0 94.2 188 6.7 20.9
250 to 499 employees 4,446 895 1,863 41.9 30.7 1,927 43.3 94.3 656 14.8 20.7
500 or more employees 35,988 2,464 12,102 33.6 40.7 21,903 60.9 96.2 1,983 5.5 31.3
Unclassified companies 6,350 3,428 1,854 29.2 21.1 4,087 64.4 95.7 410 6.4 21.5
Single location companies 106,841 175,215 16,329 15.3 13.6 81,750 76.5 92.4 8,761 8.2 20.0
no. employees unknown (3) 22,484 47,090 5,427 24.1 11.6 15,530 69.1 89.3 1,528 6.8 15.5
1 to 19 employees 35,139 83,801 3,769 10.7 11.5 27,242 77.5 92.1 4,128 11.7 19.8
20 to 49 employees 16,946 24,159 1,631 9.6 15.0 14,001 82.6 96.0 1,314 7.8 21.7
50 to 99 employees 11,064 11,375 1,459 13.2 20.4 8,913 80.6 96.5 692 6.3 26.1
100 to 249 employees 11,441 6,798 1,656 14.5 29.2 9,170 80.2 97.1 615 5.4 32.5
250 to 499 employees 4,759 1,393 888 18.7 36.3 3,621 76.1 96.9 249 5.2 36.3
500 or more employees 5,008 599 1,500 29.9 34.2 3,274 65.4 96.5 234 4.7 29.4
Manufacturers 33,232 50,417 6,073 18.3 15.1 25,361 76.3 96.2 1,798 5.4 20.2
no. employees unknown (3) 5,548 7,374 1,474 26.6 14.2 3,848 69.3 94.2 227 4.1 13.9
1 to 19 employees 3,083 17,652 404 13.1 8.9 2,449 79.4 95.2 229 7.4 14.7
20 to 49 employees 4,263 12,328 529 12.4 13.6 3,487 81.8 97.2 248 5.8 20.6
50 to 99 employees 4,881 7,315 545 11.2 19.6 4,054 83.1 97.6 281 5.8 26.6
100 to 249 employees 7,856 4,645 1,260 16.0 30.5 6,164 78.5 98.2 432 5.5 34.6
250 to 499 employees 3,496 881 570 16.3 39.8 2,746 78.5 97.7 181 5.2 42.2
500 or more employees 4,104 222 1,291 31.5 55.0 2,613 63.7 97.3 200 4.9 54.1
Wholesalers 35,338 56,998 3,998 11.3 14.4 27,421 77.6 93.3 3,919 11.1 25.2
no. employees unknown (3) 5,082 11,239 706 13.9 11.6 3,912 77.0 90.7 463 9.1 20.2
1 to 19 employees 18,274 36,070 1,573 8.6 13.2 14,166 77.5 93.2 2,534 13.9 25.4
20 to 49 employees 5,728 6,683 768 13.4 18.9 4,477 78.2 96.4 484 8.4 27.7
50 to 99 employees 3,316 2,025 500 15.1 27.3 2,501 75.4 96.9 315 9.5 33.2
100 to 249 employees 1,916 824 271 14.2 34.5 1,567 81.8 97.9 78 4.1 39.9
250 to 499 employees 745 129 100 13.4 42.6 604 81.1 99.2 41 5.5 47.3
500 or more employees 277 28 79 28.7 57.1 193 69.7 96.4 5 1.7 46.4
Other companies (4) 33,840 60,724 5,180 15.3 11.6 25,947 76.7 89.1 2,714 8.0 15.5
no. employees unknown (3) 7,657 21,948 2,185 28.5 10.5 4,873 63.6 87.6 599 7.8 13.7
1 to 19 employees 13,648 29,596 1,776 13.0 11.0 10,537 77.2 89.0 1,335 9.8 16.1
20 to 49 employees 6,884 5,126 334 4.9 13.5 6,028 87.6 92.6 522 7.6 16.7
50 to 99 employees 2,867 2,018 413 14.4 16.1 2,357 82.2 92.1 96 3.4 17.7
100 to 249 employees 1,643 1,316 124 7.5 20.9 1,415 86.1 92.7 104 6.3 20.6
250 to 499 employees 517 379 219 42.3 26.4 271 52.4 94.2 27 5.3 19.0
500 or more employees 624 341 129 20.6 19.4 465 74.6 95.9 30 4.8 12.6
Unclassified companies 4,431 7,076 1,079 24.3 12.4 3,022 68.2 87.1 331 7.5 15.4
(1) Known value is defined as the portion of U.S. total exports that could be matched to specific companies.
(2) Detail may not sum to 100 percent because companies may export to both related and nonrelated parties.
(3) Includes missing employment data, nonemployers, and companies that reported annual payroll but did not report any employees on their payroll during
specified period(s) in 1998.
(4) Includes freight forwarders and other transportation service firms, business services, engineering and management services, gas and oil extraction companies, coal mining
companies, communication services, etc.
16
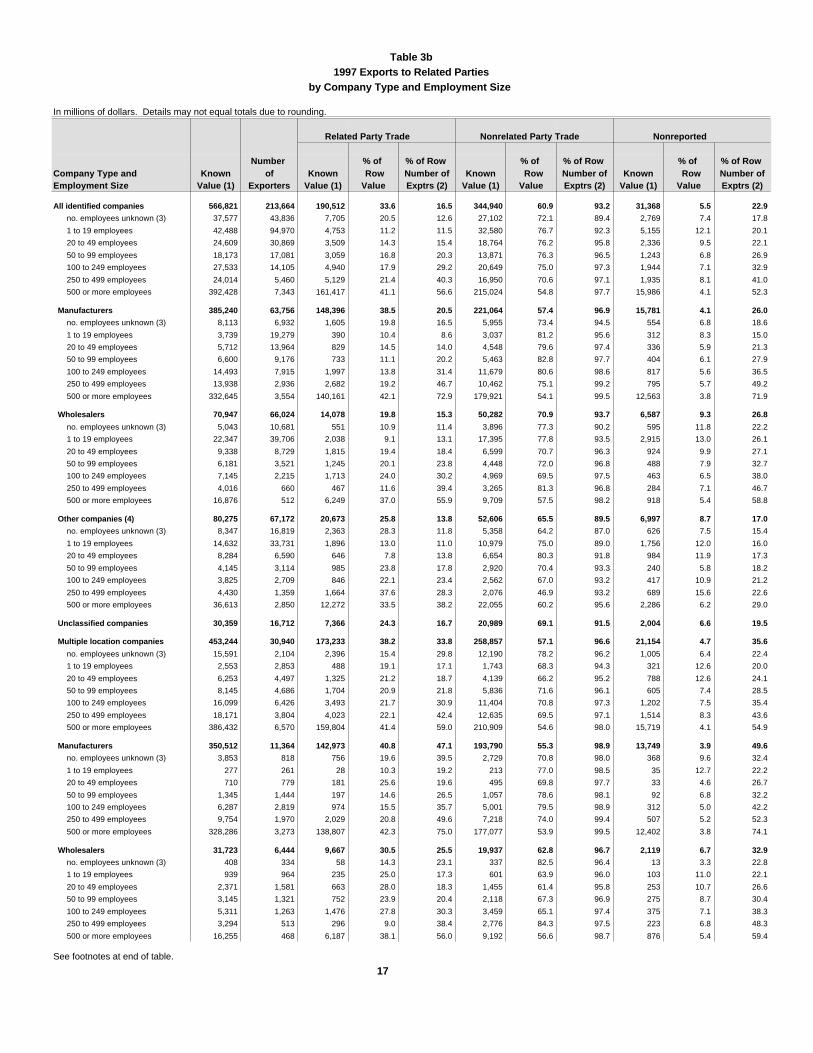
Table 3b1997 Exports to Related Parties
by Company Type and Employment Size
In millions of dollars. Details may not equal totals due to rounding. Related Party Trade Nonrelated Party Trade Nonreported Number % of % of Row % of % of Row % of % of Row Company Type and Known of Known Row Number of Known Row Number of Known Row Number ofEmployment Size Value (1) Exporters Value (1) Value Exptrs (2) Value (1) Value Exptrs (2) Value (1) Value Exptrs (2) All identified companies 566,821 213,664 190,512 33.6 16.5 344,940 60.9 93.2 31,368 5.5 22.9
no. employees unknown (3) 37,577 43,836 7,705 20.5 12.6 27,102 72.1 89.4 2,769 7.4 17.8
1 to 19 employees 42,488 94,970 4,753 11.2 11.5 32,580 76.7 92.3 5,155 12.1 20.1
20 to 49 employees 24,609 30,869 3,509 14.3 15.4 18,764 76.2 95.8 2,336 9.5 22.1
50 to 99 employees 18,173 17,081 3,059 16.8 20.3 13,871 76.3 96.5 1,243 6.8 26.9
100 to 249 employees 27,533 14,105 4,940 17.9 29.2 20,649 75.0 97.3 1,944 7.1 32.9
250 to 499 employees 24,014 5,460 5,129 21.4 40.3 16,950 70.6 97.1 1,935 8.1 41.0
500 or more employees 392,428 7,343 161,417 41.1 56.6 215,024 54.8 97.7 15,986 4.1 52.3
Manufacturers 385,240 63,756 148,396 38.5 20.5 221,064 57.4 96.9 15,781 4.1 26.0
no. employees unknown (3) 8,113 6,932 1,605 19.8 16.5 5,955 73.4 94.5 554 6.8 18.6
1 to 19 employees 3,739 19,279 390 10.4 8.6 3,037 81.2 95.6 312 8.3 15.0
20 to 49 employees 5,712 13,964 829 14.5 14.0 4,548 79.6 97.4 336 5.9 21.3
50 to 99 employees 6,600 9,176 733 11.1 20.2 5,463 82.8 97.7 404 6.1 27.9
100 to 249 employees 14,493 7,915 1,997 13.8 31.4 11,679 80.6 98.6 817 5.6 36.5
250 to 499 employees 13,938 2,936 2,682 19.2 46.7 10,462 75.1 99.2 795 5.7 49.2
500 or more employees 332,645 3,554 140,161 42.1 72.9 179,921 54.1 99.5 12,563 3.8 71.9
Wholesalers 70,947 66,024 14,078 19.8 15.3 50,282 70.9 93.7 6,587 9.3 26.8
no. employees unknown (3) 5,043 10,681 551 10.9 11.4 3,896 77.3 90.2 595 11.8 22.2
1 to 19 employees 22,347 39,706 2,038 9.1 13.1 17,395 77.8 93.5 2,915 13.0 26.1
20 to 49 employees 9,338 8,729 1,815 19.4 18.4 6,599 70.7 96.3 924 9.9 27.1
50 to 99 employees 6,181 3,521 1,245 20.1 23.8 4,448 72.0 96.8 488 7.9 32.7
100 to 249 employees 7,145 2,215 1,713 24.0 30.2 4,969 69.5 97.5 463 6.5 38.0
250 to 499 employees 4,016 660 467 11.6 39.4 3,265 81.3 96.8 284 7.1 46.7
500 or more employees 16,876 512 6,249 37.0 55.9 9,709 57.5 98.2 918 5.4 58.8
Other companies (4) 80,275 67,172 20,673 25.8 13.8 52,606 65.5 89.5 6,997 8.7 17.0
no. employees unknown (3) 8,347 16,819 2,363 28.3 11.8 5,358 64.2 87.0 626 7.5 15.4
1 to 19 employees 14,632 33,731 1,896 13.0 11.0 10,979 75.0 89.0 1,756 12.0 16.0
20 to 49 employees 8,284 6,590 646 7.8 13.8 6,654 80.3 91.8 984 11.9 17.3
50 to 99 employees 4,145 3,114 985 23.8 17.8 2,920 70.4 93.3 240 5.8 18.2
100 to 249 employees 3,825 2,709 846 22.1 23.4 2,562 67.0 93.2 417 10.9 21.2
250 to 499 employees 4,430 1,359 1,664 37.6 28.3 2,076 46.9 93.2 689 15.6 22.6
500 or more employees 36,613 2,850 12,272 33.5 38.2 22,055 60.2 95.6 2,286 6.2 29.0
Unclassified companies 30,359 16,712 7,366 24.3 16.7 20,989 69.1 91.5 2,004 6.6 19.5
Multiple location companies 453,244 30,940 173,233 38.2 33.8 258,857 57.1 96.6 21,154 4.7 35.6
no. employees unknown (3) 15,591 2,104 2,396 15.4 29.8 12,190 78.2 96.2 1,005 6.4 22.4
1 to 19 employees 2,553 2,853 488 19.1 17.1 1,743 68.3 94.3 321 12.6 20.0
20 to 49 employees 6,253 4,497 1,325 21.2 18.7 4,139 66.2 95.2 788 12.6 24.1
50 to 99 employees 8,145 4,686 1,704 20.9 21.8 5,836 71.6 96.1 605 7.4 28.5
100 to 249 employees 16,099 6,426 3,493 21.7 30.9 11,404 70.8 97.3 1,202 7.5 35.4
250 to 499 employees 18,171 3,804 4,023 22.1 42.4 12,635 69.5 97.1 1,514 8.3 43.6
500 or more employees 386,432 6,570 159,804 41.4 59.0 210,909 54.6 98.0 15,719 4.1 54.9
Manufacturers 350,512 11,364 142,973 40.8 47.1 193,790 55.3 98.9 13,749 3.9 49.6
no. employees unknown (3) 3,853 818 756 19.6 39.5 2,729 70.8 98.0 368 9.6 32.4
1 to 19 employees 277 261 28 10.3 19.2 213 77.0 98.5 35 12.7 22.2
20 to 49 employees 710 779 181 25.6 19.6 495 69.8 97.7 33 4.6 26.7
50 to 99 employees 1,345 1,444 197 14.6 26.5 1,057 78.6 98.1 92 6.8 32.2
100 to 249 employees 6,287 2,819 974 15.5 35.7 5,001 79.5 98.9 312 5.0 42.2
250 to 499 employees 9,754 1,970 2,029 20.8 49.6 7,218 74.0 99.4 507 5.2 52.3
500 or more employees 328,286 3,273 138,807 42.3 75.0 177,077 53.9 99.5 12,402 3.8 74.1
Wholesalers 31,723 6,444 9,667 30.5 25.5 19,937 62.8 96.7 2,119 6.7 32.9
no. employees unknown (3) 408 334 58 14.3 23.1 337 82.5 96.4 13 3.3 22.8
1 to 19 employees 939 964 235 25.0 17.3 601 63.9 96.0 103 11.0 22.1
20 to 49 employees 2,371 1,581 663 28.0 18.3 1,455 61.4 95.8 253 10.7 26.6
50 to 99 employees 3,145 1,321 752 23.9 20.4 2,118 67.3 96.9 275 8.7 30.4
100 to 249 employees 5,311 1,263 1,476 27.8 30.3 3,459 65.1 97.4 375 7.1 38.3
250 to 499 employees 3,294 513 296 9.0 38.4 2,776 84.3 97.5 223 6.8 48.3
500 or more employees 16,255 468 6,187 38.1 56.0 9,192 56.6 98.7 876 5.4 59.4
See footnotes at end of table.
17
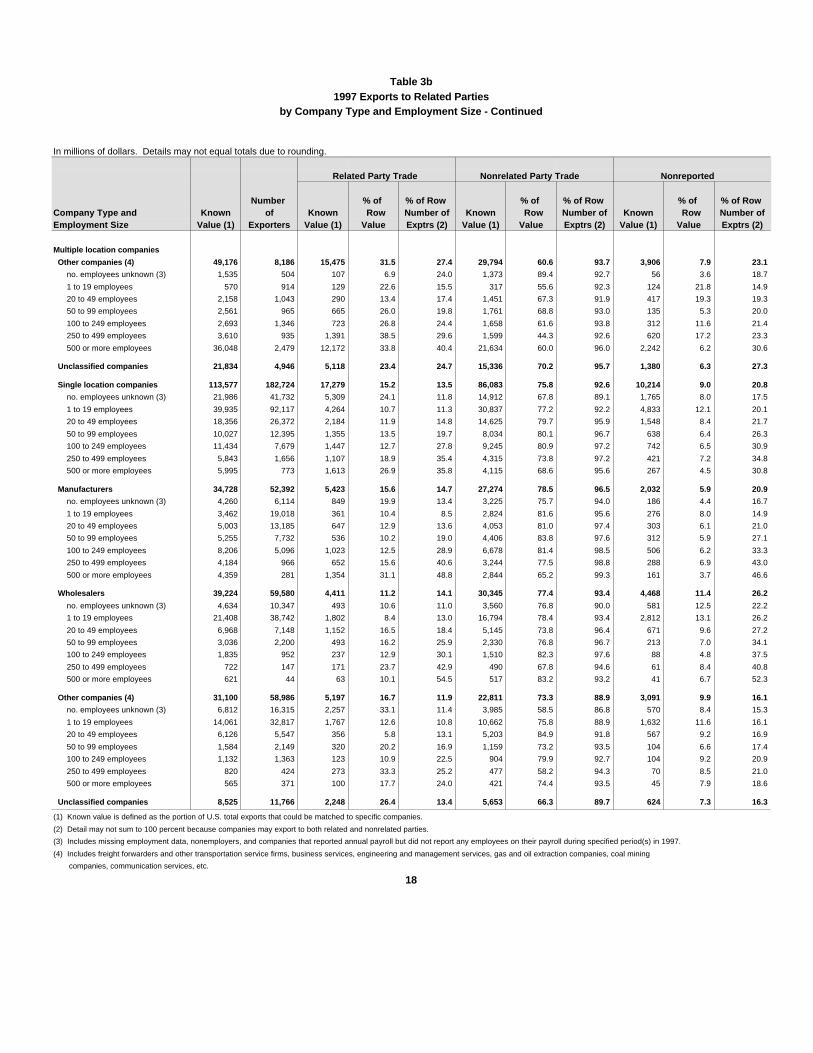
Table 3b1997 Exports to Related Parties
by Company Type and Employment Size - Continued
In millions of dollars. Details may not equal totals due to rounding. Related Party Trade Nonrelated Party Trade Nonreported Number % of % of Row % of % of Row % of % of Row Company Type and Known of Known Row Number of Known Row Number of Known Row Number ofEmployment Size Value (1) Exporters Value (1) Value Exptrs (2) Value (1) Value Exptrs (2) Value (1) Value Exptrs (2)
Multiple location companies
Other companies (4) 49,176 8,186 15,475 31.5 27.4 29,794 60.6 93.7 3,906 7.9 23.1
no. employees unknown (3) 1,535 504 107 6.9 24.0 1,373 89.4 92.7 56 3.6 18.7
1 to 19 employees 570 914 129 22.6 15.5 317 55.6 92.3 124 21.8 14.9
20 to 49 employees 2,158 1,043 290 13.4 17.4 1,451 67.3 91.9 417 19.3 19.3
50 to 99 employees 2,561 965 665 26.0 19.8 1,761 68.8 93.0 135 5.3 20.0
100 to 249 employees 2,693 1,346 723 26.8 24.4 1,658 61.6 93.8 312 11.6 21.4
250 to 499 employees 3,610 935 1,391 38.5 29.6 1,599 44.3 92.6 620 17.2 23.3
500 or more employees 36,048 2,479 12,172 33.8 40.4 21,634 60.0 96.0 2,242 6.2 30.6
Unclassified companies 21,834 4,946 5,118 23.4 24.7 15,336 70.2 95.7 1,380 6.3 27.3
Single location companies 113,577 182,724 17,279 15.2 13.5 86,083 75.8 92.6 10,214 9.0 20.8
no. employees unknown (3) 21,986 41,732 5,309 24.1 11.8 14,912 67.8 89.1 1,765 8.0 17.5
1 to 19 employees 39,935 92,117 4,264 10.7 11.3 30,837 77.2 92.2 4,833 12.1 20.1
20 to 49 employees 18,356 26,372 2,184 11.9 14.8 14,625 79.7 95.9 1,548 8.4 21.7
50 to 99 employees 10,027 12,395 1,355 13.5 19.7 8,034 80.1 96.7 638 6.4 26.3
100 to 249 employees 11,434 7,679 1,447 12.7 27.8 9,245 80.9 97.2 742 6.5 30.9
250 to 499 employees 5,843 1,656 1,107 18.9 35.4 4,315 73.8 97.2 421 7.2 34.8
500 or more employees 5,995 773 1,613 26.9 35.8 4,115 68.6 95.6 267 4.5 30.8
Manufacturers 34,728 52,392 5,423 15.6 14.7 27,274 78.5 96.5 2,032 5.9 20.9
no. employees unknown (3) 4,260 6,114 849 19.9 13.4 3,225 75.7 94.0 186 4.4 16.7
1 to 19 employees 3,462 19,018 361 10.4 8.5 2,824 81.6 95.6 276 8.0 14.9
20 to 49 employees 5,003 13,185 647 12.9 13.6 4,053 81.0 97.4 303 6.1 21.0
50 to 99 employees 5,255 7,732 536 10.2 19.0 4,406 83.8 97.6 312 5.9 27.1
100 to 249 employees 8,206 5,096 1,023 12.5 28.9 6,678 81.4 98.5 506 6.2 33.3
250 to 499 employees 4,184 966 652 15.6 40.6 3,244 77.5 98.8 288 6.9 43.0
500 or more employees 4,359 281 1,354 31.1 48.8 2,844 65.2 99.3 161 3.7 46.6
Wholesalers 39,224 59,580 4,411 11.2 14.1 30,345 77.4 93.4 4,468 11.4 26.2
no. employees unknown (3) 4,634 10,347 493 10.6 11.0 3,560 76.8 90.0 581 12.5 22.2
1 to 19 employees 21,408 38,742 1,802 8.4 13.0 16,794 78.4 93.4 2,812 13.1 26.2
20 to 49 employees 6,968 7,148 1,152 16.5 18.4 5,145 73.8 96.4 671 9.6 27.2
50 to 99 employees 3,036 2,200 493 16.2 25.9 2,330 76.8 96.7 213 7.0 34.1
100 to 249 employees 1,835 952 237 12.9 30.1 1,510 82.3 97.6 88 4.8 37.5
250 to 499 employees 722 147 171 23.7 42.9 490 67.8 94.6 61 8.4 40.8
500 or more employees 621 44 63 10.1 54.5 517 83.2 93.2 41 6.7 52.3
Other companies (4) 31,100 58,986 5,197 16.7 11.9 22,811 73.3 88.9 3,091 9.9 16.1
no. employees unknown (3) 6,812 16,315 2,257 33.1 11.4 3,985 58.5 86.8 570 8.4 15.3
1 to 19 employees 14,061 32,817 1,767 12.6 10.8 10,662 75.8 88.9 1,632 11.6 16.1
20 to 49 employees 6,126 5,547 356 5.8 13.1 5,203 84.9 91.8 567 9.2 16.9
50 to 99 employees 1,584 2,149 320 20.2 16.9 1,159 73.2 93.5 104 6.6 17.4
100 to 249 employees 1,132 1,363 123 10.9 22.5 904 79.9 92.7 104 9.2 20.9
250 to 499 employees 820 424 273 33.3 25.2 477 58.2 94.3 70 8.5 21.0
500 or more employees 565 371 100 17.7 24.0 421 74.4 93.5 45 7.9 18.6
Unclassified companies 8,525 11,766 2,248 26.4 13.4 5,653 66.3 89.7 624 7.3 16.3
(1) Known value is defined as the portion of U.S. total exports that could be matched to specific companies.
(2) Detail may not sum to 100 percent because companies may export to both related and nonrelated parties.
(3) Includes missing employment data, nonemployers, and companies that reported annual payroll but did not report any employees on their payroll during specified period(s) in 1997.
(4) Includes freight forwarders and other transportation service firms, business services, engineering and management services, gas and oil extraction companies, coal mining
companies, communication services, etc.
18
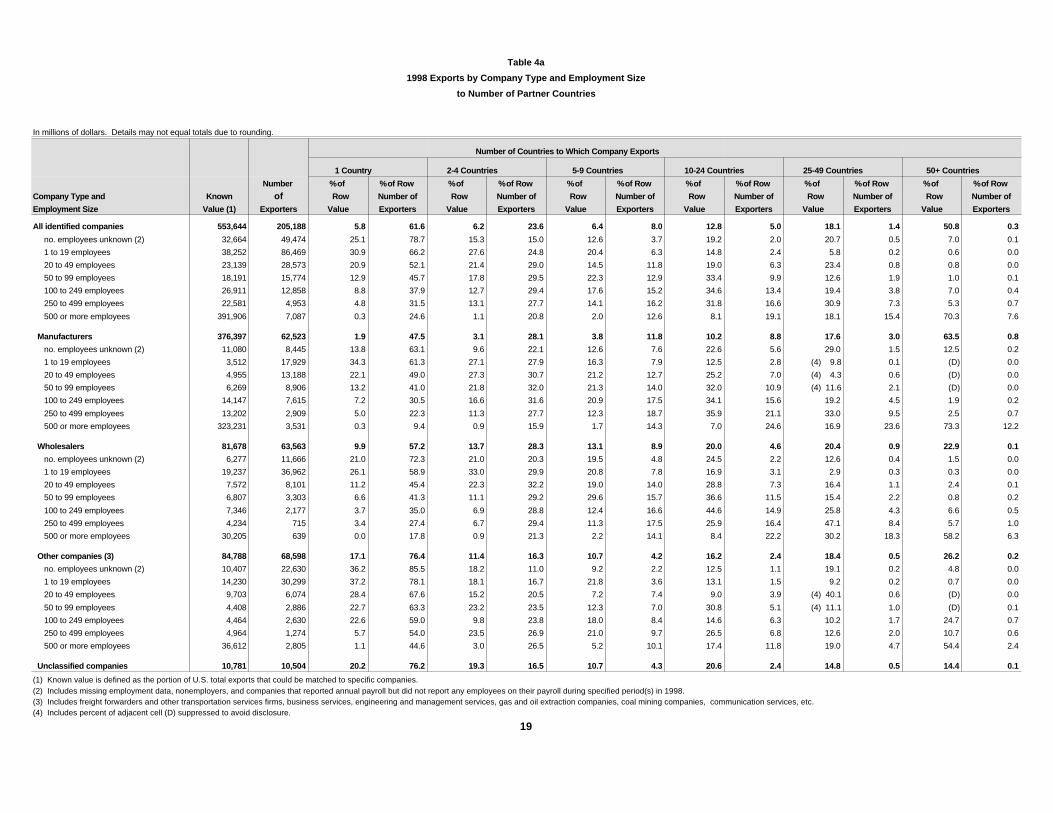
Table 4a
1998 Exports by Company Type and Employment Size
to Number of Partner Countries
In millions of dollars. Details may not equal totals due to rounding.
Number of Countries to Which Company Exports
1 Country 2-4 Countries 5-9 Countries 10-24 Countries 25-49 Countries 50+ Countries
Number % of % of Row % of % of Row % of % of Row % of % of Row % of % of Row % of % of Row
Company Type and Known of Row Number of Row Number of Row Number of Row Number of Row Number of Row Number of
Employment Size Value (1) Exporters Value Exporters Value Exporters Value Exporters Value Exporters Value Exporters Value Exporters
All identified companies 553,644 205,188 5.8 61.6 6.2 23.6 6.4 8.0 12.8 5.0 18.1 1.4 50.8 0.3
no. employees unknown (2) 32,664 49,474 25.1 78.7 15.3 15.0 12.6 3.7 19.2 2.0 20.7 0.5 7.0 0.1
1 to 19 employees 38,252 86,469 30.9 66.2 27.6 24.8 20.4 6.3 14.8 2.4 5.8 0.2 0.6 0.0
20 to 49 employees 23,139 28,573 20.9 52.1 21.4 29.0 14.5 11.8 19.0 6.3 23.4 0.8 0.8 0.0
50 to 99 employees 18,191 15,774 12.9 45.7 17.8 29.5 22.3 12.9 33.4 9.9 12.6 1.9 1.0 0.1
100 to 249 employees 26,911 12,858 8.8 37.9 12.7 29.4 17.6 15.2 34.6 13.4 19.4 3.8 7.0 0.4
250 to 499 employees 22,581 4,953 4.8 31.5 13.1 27.7 14.1 16.2 31.8 16.6 30.9 7.3 5.3 0.7
500 or more employees 391,906 7,087 0.3 24.6 1.1 20.8 2.0 12.6 8.1 19.1 18.1 15.4 70.3 7.6
Manufacturers 376,397 62,523 1.9 47.5 3.1 28.1 3.8 11.8 10.2 8.8 17.6 3.0 63.5 0.8
no. employees unknown (2) 11,080 8,445 13.8 63.1 9.6 22.1 12.6 7.6 22.6 5.6 29.0 1.5 12.5 0.2
1 to 19 employees 3,512 17,929 34.3 61.3 27.1 27.9 16.3 7.9 12.5 2.8 (4) 9.8 0.1 (D) 0.0
20 to 49 employees 4,955 13,188 22.1 49.0 27.3 30.7 21.2 12.7 25.2 7.0 (4) 4.3 0.6 (D) 0.0
50 to 99 employees 6,269 8,906 13.2 41.0 21.8 32.0 21.3 14.0 32.0 10.9 (4) 11.6 2.1 (D) 0.0
100 to 249 employees 14,147 7,615 7.2 30.5 16.6 31.6 20.9 17.5 34.1 15.6 19.2 4.5 1.9 0.2
250 to 499 employees 13,202 2,909 5.0 22.3 11.3 27.7 12.3 18.7 35.9 21.1 33.0 9.5 2.5 0.7
500 or more employees 323,231 3,531 0.3 9.4 0.9 15.9 1.7 14.3 7.0 24.6 16.9 23.6 73.3 12.2
Wholesalers 81,678 63,563 9.9 57.2 13.7 28.3 13.1 8.9 20.0 4.6 20.4 0.9 22.9 0.1
no. employees unknown (2) 6,277 11,666 21.0 72.3 21.0 20.3 19.5 4.8 24.5 2.2 12.6 0.4 1.5 0.0
1 to 19 employees 19,237 36,962 26.1 58.9 33.0 29.9 20.8 7.8 16.9 3.1 2.9 0.3 0.3 0.0
20 to 49 employees 7,572 8,101 11.2 45.4 22.3 32.2 19.0 14.0 28.8 7.3 16.4 1.1 2.4 0.1
50 to 99 employees 6,807 3,303 6.6 41.3 11.1 29.2 29.6 15.7 36.6 11.5 15.4 2.2 0.8 0.2
100 to 249 employees 7,346 2,177 3.7 35.0 6.9 28.8 12.4 16.6 44.6 14.9 25.8 4.3 6.6 0.5
250 to 499 employees 4,234 715 3.4 27.4 6.7 29.4 11.3 17.5 25.9 16.4 47.1 8.4 5.7 1.0
500 or more employees 30,205 639 0.0 17.8 0.9 21.3 2.2 14.1 8.4 22.2 30.2 18.3 58.2 6.3
Other companies (3) 84,788 68,598 17.1 76.4 11.4 16.3 10.7 4.2 16.2 2.4 18.4 0.5 26.2 0.2
no. employees unknown (2) 10,407 22,630 36.2 85.5 18.2 11.0 9.2 2.2 12.5 1.1 19.1 0.2 4.8 0.0
1 to 19 employees 14,230 30,299 37.2 78.1 18.1 16.7 21.8 3.6 13.1 1.5 9.2 0.2 0.7 0.0
20 to 49 employees 9,703 6,074 28.4 67.6 15.2 20.5 7.2 7.4 9.0 3.9 (4) 40.1 0.6 (D) 0.0
50 to 99 employees 4,408 2,886 22.7 63.3 23.2 23.5 12.3 7.0 30.8 5.1 (4) 11.1 1.0 (D) 0.1
100 to 249 employees 4,464 2,630 22.6 59.0 9.8 23.8 18.0 8.4 14.6 6.3 10.2 1.7 24.7 0.7
250 to 499 employees 4,964 1,274 5.7 54.0 23.5 26.9 21.0 9.7 26.5 6.8 12.6 2.0 10.7 0.6
500 or more employees 36,612 2,805 1.1 44.6 3.0 26.5 5.2 10.1 17.4 11.8 19.0 4.7 54.4 2.4
Unclassified companies 10,781 10,504 20.2 76.2 19.3 16.5 10.7 4.3 20.6 2.4 14.8 0.5 14.4 0.1 (1) Known value is defined as the portion of U.S. total exports that could be matched to specific companies. (2) Includes missing employment data, nonemployers, and companies that reported annual payroll but did not report any employees on their payroll during specified period(s) in 1998. (3) Includes freight forwarders and other transportation services firms, business services, engineering and management services, gas and oil extraction companies, coal mining companies, communication services, etc.
(4) Includes percent of adjacent cell (D) suppressed to avoid disclosure.
19
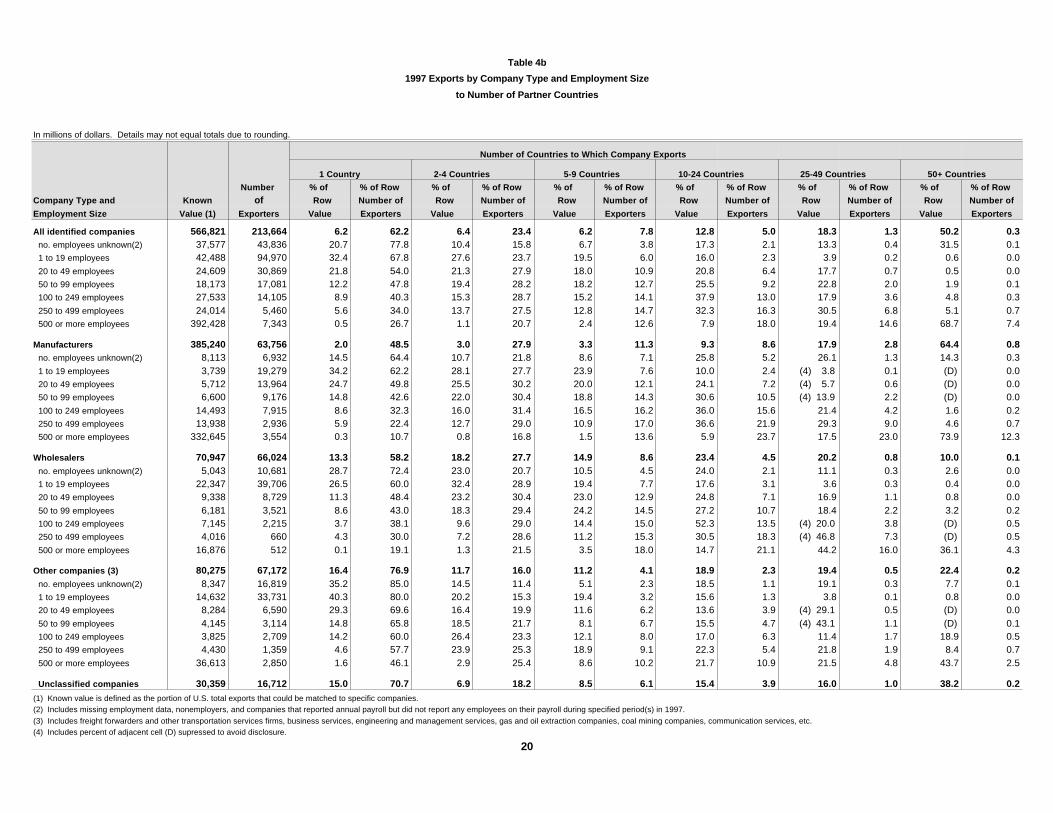
Table 4b
1997 Exports by Company Type and Employment Size
to Number of Partner Countries
In millions of dollars. Details may not equal totals due to rounding.
Number of Countries to Which Company Exports
1 Country 2-4 Countries 5-9 Countries 10-24 Countries 25-49 Countries 50+ Countries
Number % of % of Row % of % of Row % of % of Row % of % of Row % of % of Row % of % of Row
Company Type and Known of Row Number of Row Number of Row Number of Row Number of Row Number of Row Number of
Employment Size Value (1) Exporters Value Exporters Value Exporters Value Exporters Value Exporters Value Exporters Value Exporters
All identified companies 566,821 213,664 6.2 62.2 6.4 23.4 6.2 7.8 12.8 5.0 18.3 1.3 50.2 0.3 no. employees unknown(2) 37,577 43,836 20.7 77.8 10.4 15.8 6.7 3.8 17.3 2.1 13.3 0.4 31.5 0.1 1 to 19 employees 42,488 94,970 32.4 67.8 27.6 23.7 19.5 6.0 16.0 2.3 3.9 0.2 0.6 0.0 20 to 49 employees 24,609 30,869 21.8 54.0 21.3 27.9 18.0 10.9 20.8 6.4 17.7 0.7 0.5 0.0 50 to 99 employees 18,173 17,081 12.2 47.8 19.4 28.2 18.2 12.7 25.5 9.2 22.8 2.0 1.9 0.1 100 to 249 employees 27,533 14,105 8.9 40.3 15.3 28.7 15.2 14.1 37.9 13.0 17.9 3.6 4.8 0.3 250 to 499 employees 24,014 5,460 5.6 34.0 13.7 27.5 12.8 14.7 32.3 16.3 30.5 6.8 5.1 0.7 500 or more employees 392,428 7,343 0.5 26.7 1.1 20.7 2.4 12.6 7.9 18.0 19.4 14.6 68.7 7.4
Manufacturers 385,240 63,756 2.0 48.5 3.0 27.9 3.3 11.3 9.3 8.6 17.9 2.8 64.4 0.8 no. employees unknown(2) 8,113 6,932 14.5 64.4 10.7 21.8 8.6 7.1 25.8 5.2 26.1 1.3 14.3 0.3 1 to 19 employees 3,739 19,279 34.2 62.2 28.1 27.7 23.9 7.6 10.0 2.4 (4) 3.8 0.1 (D) 0.0 20 to 49 employees 5,712 13,964 24.7 49.8 25.5 30.2 20.0 12.1 24.1 7.2 (4) 5.7 0.6 (D) 0.0 50 to 99 employees 6,600 9,176 14.8 42.6 22.0 30.4 18.8 14.3 30.6 10.5 (4) 13.9 2.2 (D) 0.0 100 to 249 employees 14,493 7,915 8.6 32.3 16.0 31.4 16.5 16.2 36.0 15.6 21.4 4.2 1.6 0.2 250 to 499 employees 13,938 2,936 5.9 22.4 12.7 29.0 10.9 17.0 36.6 21.9 29.3 9.0 4.6 0.7 500 or more employees 332,645 3,554 0.3 10.7 0.8 16.8 1.5 13.6 5.9 23.7 17.5 23.0 73.9 12.3
Wholesalers 70,947 66,024 13.3 58.2 18.2 27.7 14.9 8.6 23.4 4.5 20.2 0.8 10.0 0.1 no. employees unknown(2) 5,043 10,681 28.7 72.4 23.0 20.7 10.5 4.5 24.0 2.1 11.1 0.3 2.6 0.0 1 to 19 employees 22,347 39,706 26.5 60.0 32.4 28.9 19.4 7.7 17.6 3.1 3.6 0.3 0.4 0.0 20 to 49 employees 9,338 8,729 11.3 48.4 23.2 30.4 23.0 12.9 24.8 7.1 16.9 1.1 0.8 0.0 50 to 99 employees 6,181 3,521 8.6 43.0 18.3 29.4 24.2 14.5 27.2 10.7 18.4 2.2 3.2 0.2 100 to 249 employees 7,145 2,215 3.7 38.1 9.6 29.0 14.4 15.0 52.3 13.5 (4) 20.0 3.8 (D) 0.5 250 to 499 employees 4,016 660 4.3 30.0 7.2 28.6 11.2 15.3 30.5 18.3 (4) 46.8 7.3 (D) 0.5 500 or more employees 16,876 512 0.1 19.1 1.3 21.5 3.5 18.0 14.7 21.1 44.2 16.0 36.1 4.3
Other companies (3) 80,275 67,172 16.4 76.9 11.7 16.0 11.2 4.1 18.9 2.3 19.4 0.5 22.4 0.2 no. employees unknown(2) 8,347 16,819 35.2 85.0 14.5 11.4 5.1 2.3 18.5 1.1 19.1 0.3 7.7 0.1 1 to 19 employees 14,632 33,731 40.3 80.0 20.2 15.3 19.4 3.2 15.6 1.3 3.8 0.1 0.8 0.0 20 to 49 employees 8,284 6,590 29.3 69.6 16.4 19.9 11.6 6.2 13.6 3.9 (4) 29.1 0.5 (D) 0.0 50 to 99 employees 4,145 3,114 14.8 65.8 18.5 21.7 8.1 6.7 15.5 4.7 (4) 43.1 1.1 (D) 0.1 100 to 249 employees 3,825 2,709 14.2 60.0 26.4 23.3 12.1 8.0 17.0 6.3 11.4 1.7 18.9 0.5 250 to 499 employees 4,430 1,359 4.6 57.7 23.9 25.3 18.9 9.1 22.3 5.4 21.8 1.9 8.4 0.7 500 or more employees 36,613 2,850 1.6 46.1 2.9 25.4 8.6 10.2 21.7 10.9 21.5 4.8 43.7 2.5
Unclassified companies 30,359 16,712 15.0 70.7 6.9 18.2 8.5 6.1 15.4 3.9 16.0 1.0 38.2 0.2 (1) Known value is defined as the portion of U.S. total exports that could be matched to specific companies. (2) Includes missing employment data, nonemployers, and companies that reported annual payroll but did not report any employees on their payroll during specified period(s) in 1997. (3) Includes freight forwarders and other transportation services firms, business services, engineering and management services, gas and oil extraction companies, coal mining companies, communication services, etc.
(4) Includes percent of adjacent cell (D) supressed to avoid disclosure.
20
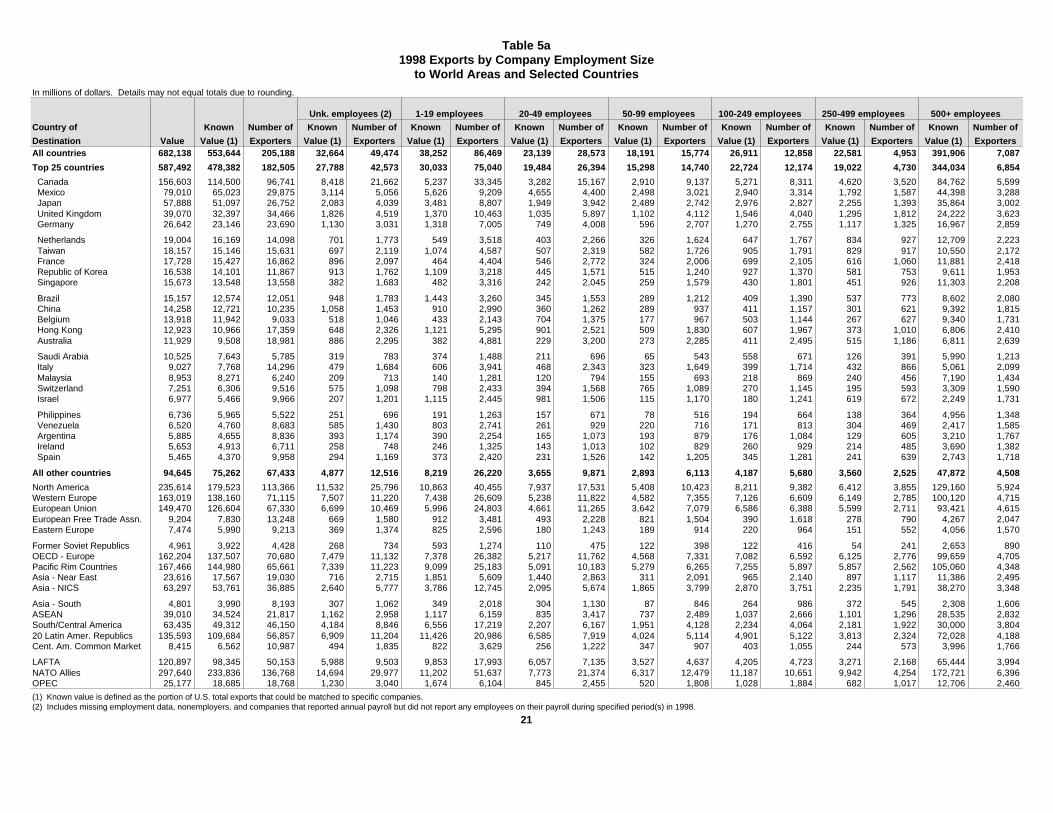
Table 5a1998 Exports by Company Employment Size
to World Areas and Selected CountriesIn millions of dollars. Details may not equal totals due to rounding.
Unk. employees (2) 1-19 employees 20-49 employees 50-99 employees 100-249 employees 250-499 employees 500+ employees
Country of Known Number of Known Number of Known Number of Known Number of Known Number of Known Number of Known Number of Known Number of
Destination Value Value (1) Exporters Value (1) Exporters Value (1) Exporters Value (1) Exporters Value (1) Exporters Value (1) Exporters Value (1) Exporters Value (1) ExportersAll countries 682,138 553,644 205,188 32,664 49,474 38,252 86,469 23,139 28,573 18,191 15,774 26,911 12,858 22,581 4,953 391,906 7,087 Top 25 countries 587,492 478,382 182,505 27,788 42,573 30,033 75,040 19,484 26,394 15,298 14,740 22,724 12,174 19,022 4,730 344,034 6,854
Canada 156,603 114,500 96,741 8,418 21,662 5,237 33,345 3,282 15,167 2,910 9,137 5,271 8,311 4,620 3,520 84,762 5,599 Mexico 79,010 65,023 29,875 3,114 5,056 5,626 9,209 4,655 4,400 2,498 3,021 2,940 3,314 1,792 1,587 44,398 3,288 Japan 57,888 51,097 26,752 2,083 4,039 3,481 8,807 1,949 3,942 2,489 2,742 2,976 2,827 2,255 1,393 35,864 3,002 United Kingdom 39,070 32,397 34,466 1,826 4,519 1,370 10,463 1,035 5,897 1,102 4,112 1,546 4,040 1,295 1,812 24,222 3,623 Germany 26,642 23,146 23,690 1,130 3,031 1,318 7,005 749 4,008 596 2,707 1,270 2,755 1,117 1,325 16,967 2,859
Netherlands 19,004 16,169 14,098 701 1,773 549 3,518 403 2,266 326 1,624 647 1,767 834 927 12,709 2,223 Taiwan 18,157 15,146 15,631 697 2,119 1,074 4,587 507 2,319 582 1,726 905 1,791 829 917 10,550 2,172 France 17,728 15,427 16,862 896 2,097 464 4,404 546 2,772 324 2,006 699 2,105 616 1,060 11,881 2,418 Republic of Korea 16,538 14,101 11,867 913 1,762 1,109 3,218 445 1,571 515 1,240 927 1,370 581 753 9,611 1,953 Singapore 15,673 13,548 13,558 382 1,683 482 3,316 242 2,045 259 1,579 430 1,801 451 926 11,303 2,208
Brazil 15,157 12,574 12,051 948 1,783 1,443 3,260 345 1,553 289 1,212 409 1,390 537 773 8,602 2,080 China 14,258 12,721 10,235 1,058 1,453 910 2,990 360 1,262 289 937 411 1,157 301 621 9,392 1,815 Belgium 13,918 11,942 9,033 518 1,046 433 2,143 704 1,375 177 967 503 1,144 267 627 9,340 1,731 Hong Kong 12,923 10,966 17,359 648 2,326 1,121 5,295 901 2,521 509 1,830 607 1,967 373 1,010 6,806 2,410 Australia 11,929 9,508 18,981 886 2,295 382 4,881 229 3,200 273 2,285 411 2,495 515 1,186 6,811 2,639
Saudi Arabia 10,525 7,643 5,785 319 783 374 1,488 211 696 65 543 558 671 126 391 5,990 1,213 Italy 9,027 7,768 14,296 479 1,684 606 3,941 468 2,343 323 1,649 399 1,714 432 866 5,061 2,099 Malaysia 8,953 8,271 6,240 209 713 140 1,281 120 794 155 693 218 869 240 456 7,190 1,434 Switzerland 7,251 6,306 9,516 575 1,098 798 2,433 394 1,568 765 1,089 270 1,145 195 593 3,309 1,590 Israel 6,977 5,466 9,966 207 1,201 1,115 2,445 981 1,506 115 1,170 180 1,241 619 672 2,249 1,731
Philippines 6,736 5,965 5,522 251 696 191 1,263 157 671 78 516 194 664 138 364 4,956 1,348 Venezuela 6,520 4,760 8,683 585 1,430 803 2,741 261 929 220 716 171 813 304 469 2,417 1,585 Argentina 5,885 4,655 8,836 393 1,174 390 2,254 165 1,073 193 879 176 1,084 129 605 3,210 1,767 Ireland 5,653 4,913 6,711 258 748 246 1,325 143 1,013 102 829 260 929 214 485 3,690 1,382 Spain 5,465 4,370 9,958 294 1,169 373 2,420 231 1,526 142 1,205 345 1,281 241 639 2,743 1,718
All other countries 94,645 75,262 67,433 4,877 12,516 8,219 26,220 3,655 9,871 2,893 6,113 4,187 5,680 3,560 2,525 47,872 4,508
North America 235,614 179,523 113,366 11,532 25,796 10,863 40,455 7,937 17,531 5,408 10,423 8,211 9,382 6,412 3,855 129,160 5,924Western Europe 163,019 138,160 71,115 7,507 11,220 7,438 26,609 5,238 11,822 4,582 7,355 7,126 6,609 6,149 2,785 100,120 4,715European Union 149,470 126,604 67,330 6,699 10,469 5,996 24,803 4,661 11,265 3,642 7,079 6,586 6,388 5,599 2,711 93,421 4,615European Free Trade Assn. 9,204 7,830 13,248 669 1,580 912 3,481 493 2,228 821 1,504 390 1,618 278 790 4,267 2,047Eastern Europe 7,474 5,990 9,213 369 1,374 825 2,596 180 1,243 189 914 220 964 151 552 4,056 1,570
Former Soviet Republics 4,961 3,922 4,428 268 734 593 1,274 110 475 122 398 122 416 54 241 2,653 890OECD - Europe 162,204 137,507 70,680 7,479 11,132 7,378 26,382 5,217 11,762 4,568 7,331 7,082 6,592 6,125 2,776 99,659 4,705Pacific Rim Countries 167,466 144,980 65,661 7,339 11,223 9,099 25,183 5,091 10,183 5,279 6,265 7,255 5,897 5,857 2,562 105,060 4,348Asia - Near East 23,616 17,567 19,030 716 2,715 1,851 5,609 1,440 2,863 311 2,091 965 2,140 897 1,117 11,386 2,495Asia - NICS 63,297 53,761 36,885 2,640 5,777 3,786 12,745 2,095 5,674 1,865 3,799 2,870 3,751 2,235 1,791 38,270 3,348
Asia - South 4,801 3,990 8,193 307 1,062 349 2,018 304 1,130 87 846 264 986 372 545 2,308 1,606ASEAN 39,010 34,524 21,817 1,162 2,958 1,117 6,159 835 3,417 737 2,489 1,037 2,666 1,101 1,296 28,535 2,832South/Central America 63,435 49,312 46,150 4,184 8,846 6,556 17,219 2,207 6,167 1,951 4,128 2,234 4,064 2,181 1,922 30,000 3,80420 Latin Amer. Republics 135,593 109,684 56,857 6,909 11,204 11,426 20,986 6,585 7,919 4,024 5,114 4,901 5,122 3,813 2,324 72,028 4,188Cent. Am. Common Market 8,415 6,562 10,987 494 1,835 822 3,629 256 1,222 347 907 403 1,055 244 573 3,996 1,766
LAFTA 120,897 98,345 50,153 5,988 9,503 9,853 17,993 6,057 7,135 3,527 4,637 4,205 4,723 3,271 2,168 65,444 3,994NATO Allies 297,640 233,836 136,768 14,694 29,977 11,202 51,637 7,773 21,374 6,317 12,479 11,187 10,651 9,942 4,254 172,721 6,396OPEC 25,177 18,685 18,768 1,230 3,040 1,674 6,104 845 2,455 520 1,808 1,028 1,884 682 1,017 12,706 2,460 (1) Known value is defined as the portion of U.S. total exports that could be matched to specific companies.(2) Includes missing employment data, nonemployers, and companies that reported annual payroll but did not report any employees on their payroll during specified period(s) in 1998.
21
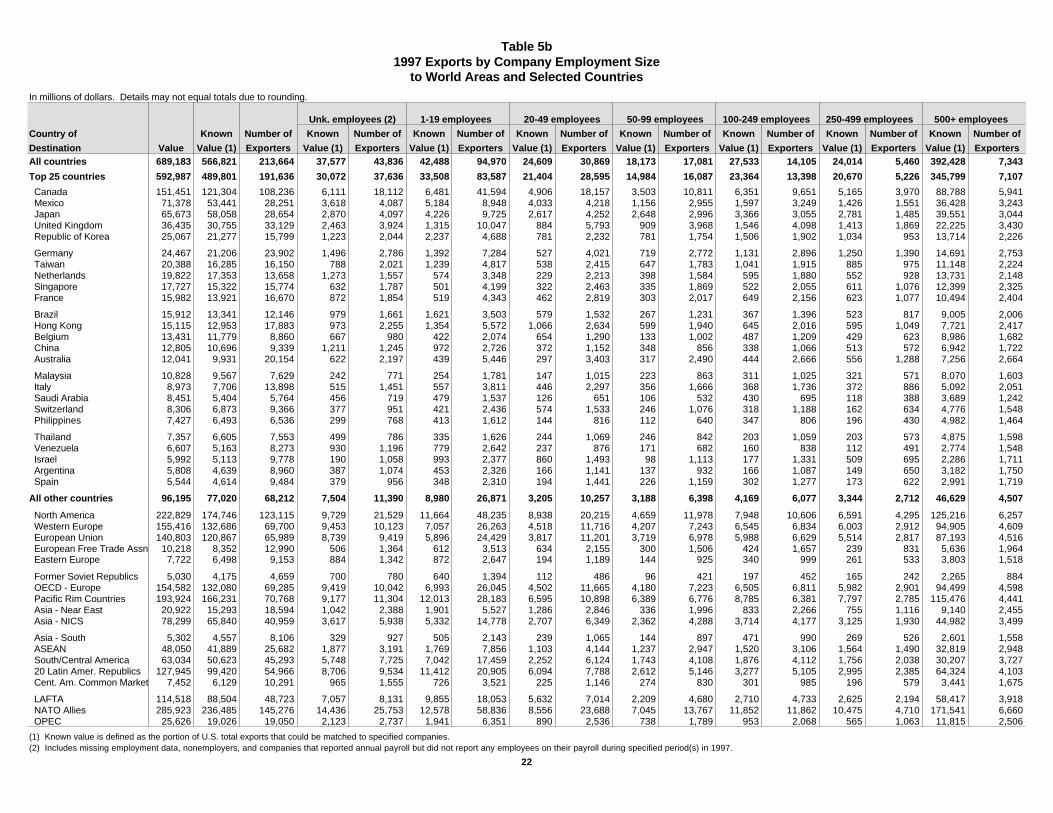
Table 5b1997 Exports by Company Employment Size
to World Areas and Selected Countries
In millions of dollars. Details may not equal totals due to rounding.
Unk. employees (2) 1-19 employees 20-49 employees 50-99 employees 100-249 employees 250-499 employees 500+ employees
Country of Known Number of Known Number of Known Number of Known Number of Known Number of Known Number of Known Number of Known Number of
Destination Value Value (1) Exporters Value (1) Exporters Value (1) Exporters Value (1) Exporters Value (1) Exporters Value (1) Exporters Value (1) Exporters Value (1) Exporters All countries 689,183 566,821 213,664 37,577 43,836 42,488 94,970 24,609 30,869 18,173 17,081 27,533 14,105 24,014 5,460 392,428 7,343
Top 25 countries 592,987 489,801 191,636 30,072 37,636 33,508 83,587 21,404 28,595 14,984 16,087 23,364 13,398 20,670 5,226 345,799 7,107
Canada 151,451 121,304 108,236 6,111 18,112 6,481 41,594 4,906 18,157 3,503 10,811 6,351 9,651 5,165 3,970 88,788 5,941 Mexico 71,378 53,441 28,251 3,618 4,087 5,184 8,948 4,033 4,218 1,156 2,955 1,597 3,249 1,426 1,551 36,428 3,243 Japan 65,673 58,058 28,654 2,870 4,097 4,226 9,725 2,617 4,252 2,648 2,996 3,366 3,055 2,781 1,485 39,551 3,044 United Kingdom 36,435 30,755 33,129 2,463 3,924 1,315 10,047 884 5,793 909 3,968 1,546 4,098 1,413 1,869 22,225 3,430 Republic of Korea 25,067 21,277 15,799 1,223 2,044 2,237 4,688 781 2,232 781 1,754 1,506 1,902 1,034 953 13,714 2,226
Germany 24,467 21,206 23,902 1,496 2,786 1,392 7,284 527 4,021 719 2,772 1,131 2,896 1,250 1,390 14,691 2,753 Taiwan 20,388 16,285 16,150 788 2,021 1,239 4,817 538 2,415 647 1,783 1,041 1,915 885 975 11,148 2,224 Netherlands 19,822 17,353 13,658 1,273 1,557 574 3,348 229 2,213 398 1,584 595 1,880 552 928 13,731 2,148 Singapore 17,727 15,322 15,774 632 1,787 501 4,199 322 2,463 335 1,869 522 2,055 611 1,076 12,399 2,325 France 15,982 13,921 16,670 872 1,854 519 4,343 462 2,819 303 2,017 649 2,156 623 1,077 10,494 2,404
Brazil 15,912 13,341 12,146 979 1,661 1,621 3,503 579 1,532 267 1,231 367 1,396 523 817 9,005 2,006 Hong Kong 15,115 12,953 17,883 973 2,255 1,354 5,572 1,066 2,634 599 1,940 645 2,016 595 1,049 7,721 2,417 Belgium 13,431 11,779 8,860 667 980 422 2,074 654 1,290 133 1,002 487 1,209 429 623 8,986 1,682 China 12,805 10,696 9,339 1,211 1,245 972 2,726 372 1,152 348 856 338 1,066 513 572 6,942 1,722 Australia 12,041 9,931 20,154 622 2,197 439 5,446 297 3,403 317 2,490 444 2,666 556 1,288 7,256 2,664
Malaysia 10,828 9,567 7,629 242 771 254 1,781 147 1,015 223 863 311 1,025 321 571 8,070 1,603 Italy 8,973 7,706 13,898 515 1,451 557 3,811 446 2,297 356 1,666 368 1,736 372 886 5,092 2,051 Saudi Arabia 8,451 5,404 5,764 456 719 479 1,537 126 651 106 532 430 695 118 388 3,689 1,242 Switzerland 8,306 6,873 9,366 377 951 421 2,436 574 1,533 246 1,076 318 1,188 162 634 4,776 1,548 Philippines 7,427 6,493 6,536 299 768 413 1,612 144 816 112 640 347 806 196 430 4,982 1,464
Thailand 7,357 6,605 7,553 499 786 335 1,626 244 1,069 246 842 203 1,059 203 573 4,875 1,598 Venezuela 6,607 5,163 8,273 930 1,196 779 2,642 237 876 171 682 160 838 112 491 2,774 1,548 Israel 5,992 5,113 9,778 190 1,058 993 2,377 860 1,493 98 1,113 177 1,331 509 695 2,286 1,711 Argentina 5,808 4,639 8,960 387 1,074 453 2,326 166 1,141 137 932 166 1,087 149 650 3,182 1,750 Spain 5,544 4,614 9,484 379 956 348 2,310 194 1,441 226 1,159 302 1,277 173 622 2,991 1,719
All other countries 96,195 77,020 68,212 7,504 11,390 8,980 26,871 3,205 10,257 3,188 6,398 4,169 6,077 3,344 2,712 46,629 4,507
North America 222,829 174,746 123,115 9,729 21,529 11,664 48,235 8,938 20,215 4,659 11,978 7,948 10,606 6,591 4,295 125,216 6,257 Western Europe 155,416 132,686 69,700 9,453 10,123 7,057 26,263 4,518 11,716 4,207 7,243 6,545 6,834 6,003 2,912 94,905 4,609 European Union 140,803 120,867 65,989 8,739 9,419 5,896 24,429 3,817 11,201 3,719 6,978 5,988 6,629 5,514 2,817 87,193 4,516 European Free Trade Assn. 10,218 8,352 12,990 506 1,364 612 3,513 634 2,155 300 1,506 424 1,657 239 831 5,636 1,964 Eastern Europe 7,722 6,498 9,153 884 1,342 872 2,647 194 1,189 144 925 340 999 261 533 3,803 1,518
Former Soviet Republics 5,030 4,175 4,659 700 780 640 1,394 112 486 96 421 197 452 165 242 2,265 884 OECD - Europe 154,582 132,080 69,285 9,419 10,042 6,993 26,045 4,502 11,665 4,180 7,223 6,505 6,811 5,982 2,901 94,499 4,598 Pacific Rim Countries 193,924 166,231 70,768 9,177 11,304 12,013 28,183 6,595 10,898 6,389 6,776 8,785 6,381 7,797 2,785 115,476 4,441 Asia - Near East 20,922 15,293 18,594 1,042 2,388 1,901 5,527 1,286 2,846 336 1,996 833 2,266 755 1,116 9,140 2,455 Asia - NICS 78,299 65,840 40,959 3,617 5,938 5,332 14,778 2,707 6,349 2,362 4,288 3,714 4,177 3,125 1,930 44,982 3,499
Asia - South 5,302 4,557 8,106 329 927 505 2,143 239 1,065 144 897 471 990 269 526 2,601 1,558 ASEAN 48,050 41,889 25,682 1,877 3,191 1,769 7,856 1,103 4,144 1,237 2,947 1,520 3,106 1,564 1,490 32,819 2,948 South/Central America 63,034 50,623 45,293 5,748 7,725 7,042 17,459 2,252 6,124 1,743 4,108 1,876 4,112 1,756 2,038 30,207 3,727 20 Latin Amer. Republics 127,945 99,420 54,966 8,706 9,534 11,412 20,905 6,094 7,788 2,612 5,146 3,277 5,105 2,995 2,385 64,324 4,103 Cent. Am. Common Market 7,452 6,129 10,291 965 1,555 726 3,521 225 1,146 274 830 301 985 196 579 3,441 1,675
LAFTA 114,518 88,504 48,723 7,057 8,131 9,855 18,053 5,632 7,014 2,209 4,680 2,710 4,733 2,625 2,194 58,417 3,918 NATO Allies 285,923 236,485 145,276 14,436 25,753 12,578 58,836 8,556 23,688 7,045 13,767 11,852 11,862 10,475 4,710 171,541 6,660 OPEC 25,626 19,026 19,050 2,123 2,737 1,941 6,351 890 2,536 738 1,789 953 2,068 565 1,063 11,815 2,506 (1) Known value is defined as the portion of U.S. total exports that could be matched to specified companies.(2) Includes missing employment data, nonemployers, and companies that reported annual payroll but did not report any employees on their payroll during specified period(s) in 1997.
22
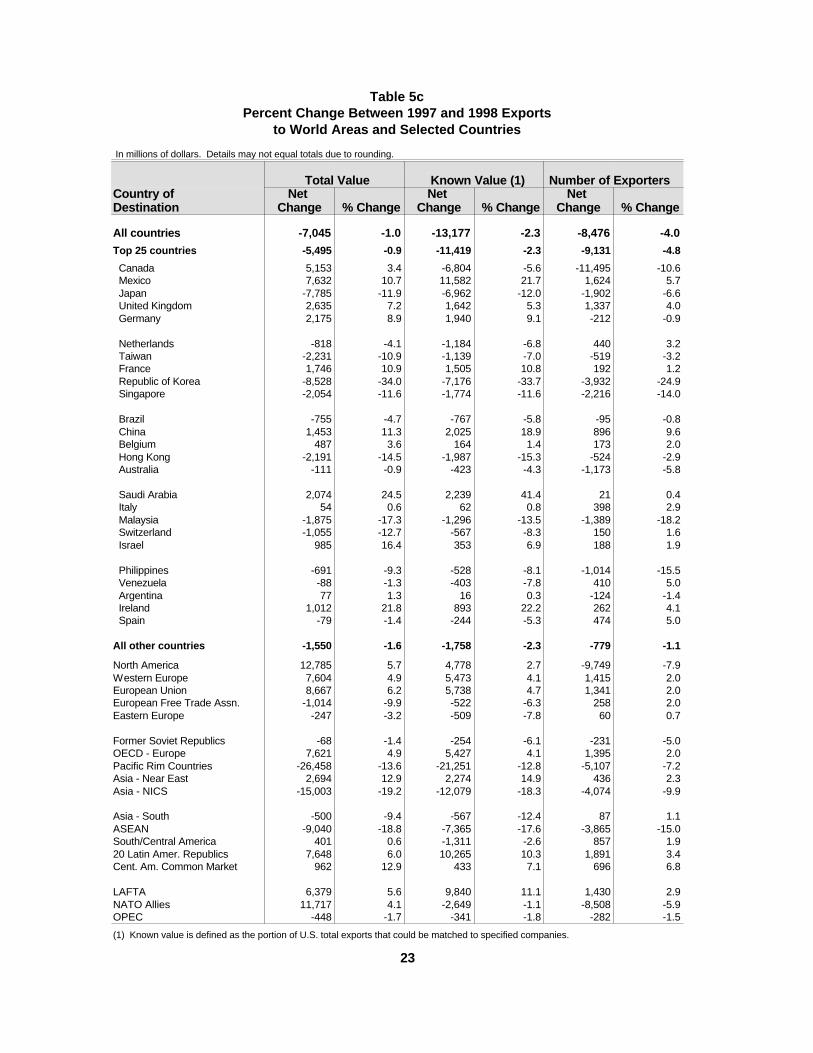
Table 5cPercent Change Between 1997 and 1998 Exports
to World Areas and Selected Countries
In millions of dollars. In millions of dollars. Details may not equal totals due to rounding.
Total Value Known Value (1) Number of Exporters Country of Net Net Net Destination Change % Change Change % Change Change % Change
All countries -7,045 -1.0 -13,177 -2.3 -8,476 -4.0
Top 25 countries -5,495 -0.9 -11,419 -2.3 -9,131 -4.8
Canada 5,153 3.4 -6,804 -5.6 -11,495 -10.6 Mexico 7,632 10.7 11,582 21.7 1,624 5.7 Japan -7,785 -11.9 -6,962 -12.0 -1,902 -6.6 United Kingdom 2,635 7.2 1,642 5.3 1,337 4.0 Germany 2,175 8.9 1,940 9.1 -212 -0.9
Netherlands -818 -4.1 -1,184 -6.8 440 3.2 Taiwan -2,231 -10.9 -1,139 -7.0 -519 -3.2 France 1,746 10.9 1,505 10.8 192 1.2 Republic of Korea -8,528 -34.0 -7,176 -33.7 -3,932 -24.9
Singapore -2,054 -11.6 -1,774 -11.6 -2,216 -14.0
Brazil -755 -4.7 -767 -5.8 -95 -0.8 China 1,453 11.3 2,025 18.9 896 9.6 Belgium 487 3.6 164 1.4 173 2.0 Hong Kong -2,191 -14.5 -1,987 -15.3 -524 -2.9 Australia -111 -0.9 -423 -4.3 -1,173 -5.8
Saudi Arabia 2,074 24.5 2,239 41.4 21 0.4 Italy 54 0.6 62 0.8 398 2.9 Malaysia -1,875 -17.3 -1,296 -13.5 -1,389 -18.2 Switzerland -1,055 -12.7 -567 -8.3 150 1.6 Israel 985 16.4 353 6.9 188 1.9
Philippines -691 -9.3 -528 -8.1 -1,014 -15.5 Venezuela -88 -1.3 -403 -7.8 410 5.0 Argentina 77 1.3 16 0.3 -124 -1.4
Ireland 1,012 21.8 893 22.2 262 4.1 Spain -79 -1.4 -244 -5.3 474 5.0
All other countries -1,550 -1.6 -1,758 -2.3 -779 -1.1
North America 12,785 5.7 4,778 2.7 -9,749 -7.9 Western Europe 7,604 4.9 5,473 4.1 1,415 2.0 European Union 8,667 6.2 5,738 4.7 1,341 2.0 European Free Trade Assn. -1,014 -9.9 -522 -6.3 258 2.0 Eastern Europe -247 -3.2 -509 -7.8 60 0.7
Former Soviet Republics -68 -1.4 -254 -6.1 -231 -5.0 OECD - Europe 7,621 4.9 5,427 4.1 1,395 2.0 Pacific Rim Countries -26,458 -13.6 -21,251 -12.8 -5,107 -7.2 Asia - Near East 2,694 12.9 2,274 14.9 436 2.3 Asia - NICS -15,003 -19.2 -12,079 -18.3 -4,074 -9.9
Asia - South -500 -9.4 -567 -12.4 87 1.1 ASEAN -9,040 -18.8 -7,365 -17.6 -3,865 -15.0 South/Central America 401 0.6 -1,311 -2.6 857 1.9 20 Latin Amer. Republics 7,648 6.0 10,265 10.3 1,891 3.4 Cent. Am. Common Market 962 12.9 433 7.1 696 6.8
LAFTA 6,379 5.6 9,840 11.1 1,430 2.9 NATO Allies 11,717 4.1 -2,649 -1.1 -8,508 -5.9 OPEC -448 -1.7 -341 -1.8 -282 -1.5 (1) Known value is defined as the value of exports by known exporters i.e. the(1) Known value is defined as the portion of U.S. total exports that could be matched to specified companies.
23
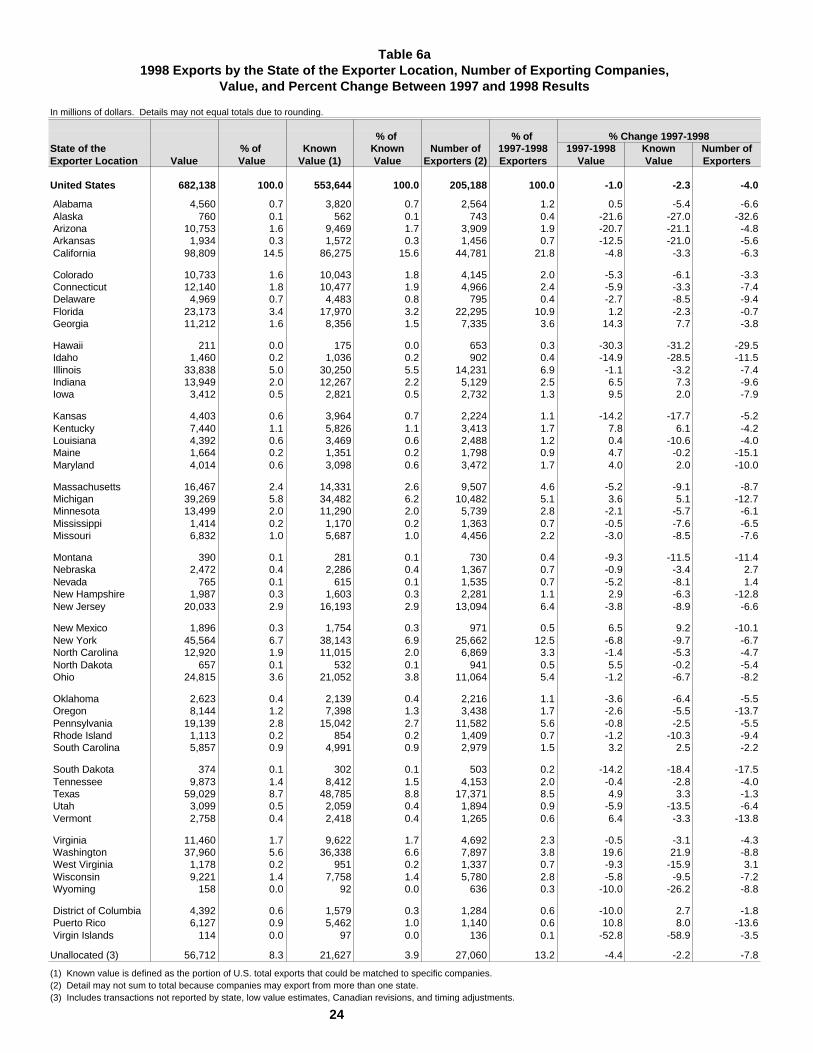
Table 6a1998 Exports by the State of the Exporter Location, Number of Exporting Companies,
Value, and Percent Change Between 1997 and 1998 Results
In millions of dollars.In millions of dollars. Details may not equal totals due to rounding. % of % of % Change 1997-1998 State of the % of Known Known Number of 1997-1998 1997-1998 Known Number of Exporter Location Value Value Value (1) Value Exporters (2) Exporters Value Value Exporters United States 682,138 100.0 553,644 100.0 205,188 100.0 -1.0 -2.3 -4.0 Alabama 4,560 0.7 3,820 0.7 2,564 1.2 0.5 -5.4 -6.6 Alaska 760 0.1 562 0.1 743 0.4 -21.6 -27.0 -32.6 Arizona 10,753 1.6 9,469 1.7 3,909 1.9 -20.7 -21.1 -4.8 Arkansas 1,934 0.3 1,572 0.3 1,456 0.7 -12.5 -21.0 -5.6 California 98,809 14.5 86,275 15.6 44,781 21.8 -4.8 -3.3 -6.3 Colorado 10,733 1.6 10,043 1.8 4,145 2.0 -5.3 -6.1 -3.3 Connecticut 12,140 1.8 10,477 1.9 4,966 2.4 -5.9 -3.3 -7.4 Delaware 4,969 0.7 4,483 0.8 795 0.4 -2.7 -8.5 -9.4 Florida 23,173 3.4 17,970 3.2 22,295 10.9 1.2 -2.3 -0.7 Georgia 11,212 1.6 8,356 1.5 7,335 3.6 14.3 7.7 -3.8 Hawaii 211 0.0 175 0.0 653 0.3 -30.3 -31.2 -29.5 Idaho 1,460 0.2 1,036 0.2 902 0.4 -14.9 -28.5 -11.5 Illinois 33,838 5.0 30,250 5.5 14,231 6.9 -1.1 -3.2 -7.4 Indiana 13,949 2.0 12,267 2.2 5,129 2.5 6.5 7.3 -9.6 Iowa 3,412 0.5 2,821 0.5 2,732 1.3 9.5 2.0 -7.9 Kansas 4,403 0.6 3,964 0.7 2,224 1.1 -14.2 -17.7 -5.2 Kentucky 7,440 1.1 5,826 1.1 3,413 1.7 7.8 6.1 -4.2 Louisiana 4,392 0.6 3,469 0.6 2,488 1.2 0.4 -10.6 -4.0 Maine 1,664 0.2 1,351 0.2 1,798 0.9 4.7 -0.2 -15.1 Maryland 4,014 0.6 3,098 0.6 3,472 1.7 4.0 2.0 -10.0 Massachusetts 16,467 2.4 14,331 2.6 9,507 4.6 -5.2 -9.1 -8.7 Michigan 39,269 5.8 34,482 6.2 10,482 5.1 3.6 5.1 -12.7 Minnesota 13,499 2.0 11,290 2.0 5,739 2.8 -2.1 -5.7 -6.1 Mississippi 1,414 0.2 1,170 0.2 1,363 0.7 -0.5 -7.6 -6.5 Missouri 6,832 1.0 5,687 1.0 4,456 2.2 -3.0 -8.5 -7.6 Montana 390 0.1 281 0.1 730 0.4 -9.3 -11.5 -11.4 Nebraska 2,472 0.4 2,286 0.4 1,367 0.7 -0.9 -3.4 2.7 Nevada 765 0.1 615 0.1 1,535 0.7 -5.2 -8.1 1.4 New Hampshire 1,987 0.3 1,603 0.3 2,281 1.1 2.9 -6.3 -12.8 New Jersey 20,033 2.9 16,193 2.9 13,094 6.4 -3.8 -8.9 -6.6 New Mexico 1,896 0.3 1,754 0.3 971 0.5 6.5 9.2 -10.1 New York 45,564 6.7 38,143 6.9 25,662 12.5 -6.8 -9.7 -6.7 North Carolina 12,920 1.9 11,015 2.0 6,869 3.3 -1.4 -5.3 -4.7 North Dakota 657 0.1 532 0.1 941 0.5 5.5 -0.2 -5.4 Ohio 24,815 3.6 21,052 3.8 11,064 5.4 -1.2 -6.7 -8.2 Oklahoma 2,623 0.4 2,139 0.4 2,216 1.1 -3.6 -6.4 -5.5 Oregon 8,144 1.2 7,398 1.3 3,438 1.7 -2.6 -5.5 -13.7 Pennsylvania 19,139 2.8 15,042 2.7 11,582 5.6 -0.8 -2.5 -5.5 Rhode Island 1,113 0.2 854 0.2 1,409 0.7 -1.2 -10.3 -9.4 South Carolina 5,857 0.9 4,991 0.9 2,979 1.5 3.2 2.5 -2.2 South Dakota 374 0.1 302 0.1 503 0.2 -14.2 -18.4 -17.5 Tennessee 9,873 1.4 8,412 1.5 4,153 2.0 -0.4 -2.8 -4.0 Texas 59,029 8.7 48,785 8.8 17,371 8.5 4.9 3.3 -1.3 Utah 3,099 0.5 2,059 0.4 1,894 0.9 -5.9 -13.5 -6.4 Vermont 2,758 0.4 2,418 0.4 1,265 0.6 6.4 -3.3 -13.8 Virginia 11,460 1.7 9,622 1.7 4,692 2.3 -0.5 -3.1 -4.3 Washington 37,960 5.6 36,338 6.6 7,897 3.8 19.6 21.9 -8.8 West Virginia 1,178 0.2 951 0.2 1,337 0.7 -9.3 -15.9 3.1 Wisconsin 9,221 1.4 7,758 1.4 5,780 2.8 -5.8 -9.5 -7.2 Wyoming 158 0.0 92 0.0 636 0.3 -10.0 -26.2 -8.8 District of Columbia 4,392 0.6 1,579 0.3 1,284 0.6 -10.0 2.7 -1.8 Puerto Rico 6,127 0.9 5,462 1.0 1,140 0.6 10.8 8.0 -13.6 Virgin Islands 114 0.0 97 0.0 136 0.1 -52.8 -58.9 -3.5 Unallocated (3) 56,712 8.3 21,627 3.9 27,060 13.2 -4.4 -2.2 -7.8 (1) Known value is defined as the value of exports by known exporters i.e. the(1) Known value is defined as the portion of U.S. total exports that could be matched to specific companies. (2) Detail may not sum to total because companies may export from more than one state.(2) Detail may not sum to total because companies may export from more than one state. (3) Includes transactions not reported by state low value estimates Canadian(3) Includes transactions not reported by state, low value estimates, Canadian revisions, and timing adjustments.
24
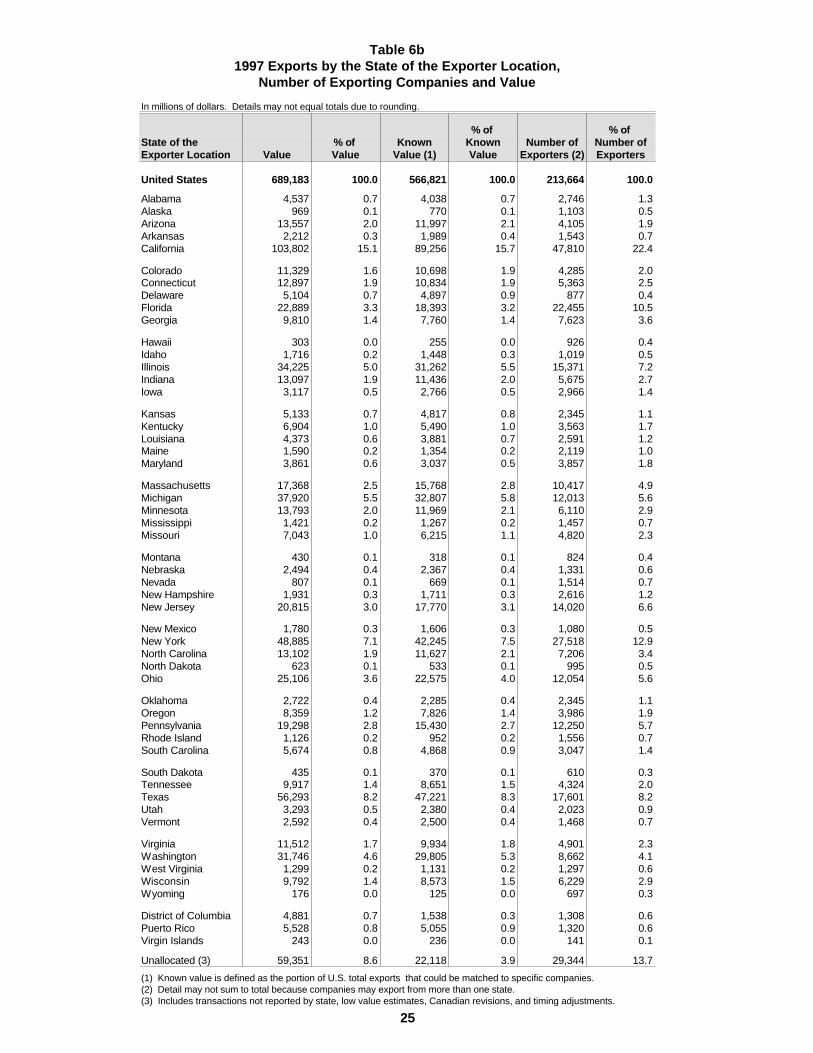
Table 6b1997 Exports by the State of the Exporter Location,
Number of Exporting Companies and Value
In millions of dollars.In millions of dollars. Details may not equal totals due to rounding. % of % of State of the % of Known Known Number of Number of Exporter Location Value Value Value (1) Value Exporters (2) Exporters United States 689,183 100.0 566,821 100.0 213,664 100.0 Alabama 4,537 0.7 4,038 0.7 2,746 1.3 Alaska 969 0.1 770 0.1 1,103 0.5 Arizona 13,557 2.0 11,997 2.1 4,105 1.9 Arkansas 2,212 0.3 1,989 0.4 1,543 0.7 California 103,802 15.1 89,256 15.7 47,810 22.4 Colorado 11,329 1.6 10,698 1.9 4,285 2.0 Connecticut 12,897 1.9 10,834 1.9 5,363 2.5 Delaware 5,104 0.7 4,897 0.9 877 0.4 Florida 22,889 3.3 18,393 3.2 22,455 10.5 Georgia 9,810 1.4 7,760 1.4 7,623 3.6 Hawaii 303 0.0 255 0.0 926 0.4 Idaho 1,716 0.2 1,448 0.3 1,019 0.5 Illinois 34,225 5.0 31,262 5.5 15,371 7.2 Indiana 13,097 1.9 11,436 2.0 5,675 2.7 Iowa 3,117 0.5 2,766 0.5 2,966 1.4 Kansas 5,133 0.7 4,817 0.8 2,345 1.1 Kentucky 6,904 1.0 5,490 1.0 3,563 1.7 Louisiana 4,373 0.6 3,881 0.7 2,591 1.2 Maine 1,590 0.2 1,354 0.2 2,119 1.0 Maryland 3,861 0.6 3,037 0.5 3,857 1.8 Massachusetts 17,368 2.5 15,768 2.8 10,417 4.9 Michigan 37,920 5.5 32,807 5.8 12,013 5.6 Minnesota 13,793 2.0 11,969 2.1 6,110 2.9 Mississippi 1,421 0.2 1,267 0.2 1,457 0.7 Missouri 7,043 1.0 6,215 1.1 4,820 2.3 Montana 430 0.1 318 0.1 824 0.4 Nebraska 2,494 0.4 2,367 0.4 1,331 0.6 Nevada 807 0.1 669 0.1 1,514 0.7 New Hampshire 1,931 0.3 1,711 0.3 2,616 1.2 New Jersey 20,815 3.0 17,770 3.1 14,020 6.6 New Mexico 1,780 0.3 1,606 0.3 1,080 0.5 New York 48,885 7.1 42,245 7.5 27,518 12.9 North Carolina 13,102 1.9 11,627 2.1 7,206 3.4 North Dakota 623 0.1 533 0.1 995 0.5 Ohio 25,106 3.6 22,575 4.0 12,054 5.6 Oklahoma 2,722 0.4 2,285 0.4 2,345 1.1 Oregon 8,359 1.2 7,826 1.4 3,986 1.9 Pennsylvania 19,298 2.8 15,430 2.7 12,250 5.7 Rhode Island 1,126 0.2 952 0.2 1,556 0.7 South Carolina 5,674 0.8 4,868 0.9 3,047 1.4 South Dakota 435 0.1 370 0.1 610 0.3 Tennessee 9,917 1.4 8,651 1.5 4,324 2.0 Texas 56,293 8.2 47,221 8.3 17,601 8.2 Utah 3,293 0.5 2,380 0.4 2,023 0.9 Vermont 2,592 0.4 2,500 0.4 1,468 0.7 Virginia 11,512 1.7 9,934 1.8 4,901 2.3 Washington 31,746 4.6 29,805 5.3 8,662 4.1 West Virginia 1,299 0.2 1,131 0.2 1,297 0.6 Wisconsin 9,792 1.4 8,573 1.5 6,229 2.9 Wyoming 176 0.0 125 0.0 697 0.3 District of Columbia 4,881 0.7 1,538 0.3 1,308 0.6 Puerto Rico 5,528 0.8 5,055 0.9 1,320 0.6 Virgin Islands 243 0.0 236 0.0 141 0.1 Unallocated (3) 59,351 8.6 22,118 3.9 29,344 13.7 (1) Known value is defined as the value of exports by known exporters i.e. the(1) Known value is defined as the portion of U.S. total exports that could be matched to specific companies. (2) Detail may not sum to total because companies may export from more than one state.(2) Detail may not sum to total because companies may export from more than one state. (3) Includes transactions not reported by state low value estimates Canadian(3) Includes transactions not reported by state, low value estimates, Canadian revisions, and timing adjustments.
25
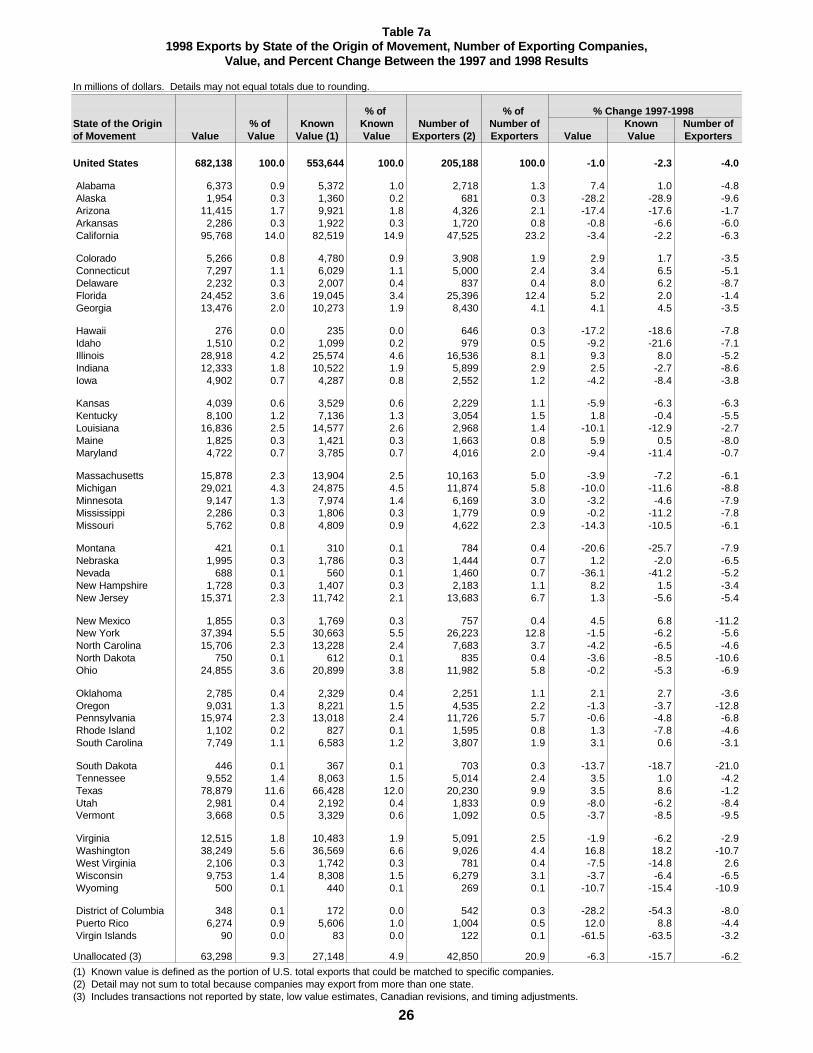
Table 7a1998 Exports by State of the Origin of Movement, Number of Exporting Companies,
Value, and Percent Change Between the 1997 and 1998 Results
In millions of dollars. Details may not equal totals due to rounding.
% of % of % Change 1997-1998State of the Origin % of Known Known Number of Number of Known Number ofof Movement Value Value Value (1) Value Exporters (2) Exporters Value Value Exporters United States 682,138 100.0 553,644 100.0 205,188 100.0 -1.0 -2.3 -4.0 Alabama 6,373 0.9 5,372 1.0 2,718 1.3 7.4 1.0 -4.8 Alaska 1,954 0.3 1,360 0.2 681 0.3 -28.2 -28.9 -9.6 Arizona 11,415 1.7 9,921 1.8 4,326 2.1 -17.4 -17.6 -1.7 Arkansas 2,286 0.3 1,922 0.3 1,720 0.8 -0.8 -6.6 -6.0 California 95,768 14.0 82,519 14.9 47,525 23.2 -3.4 -2.2 -6.3 Colorado 5,266 0.8 4,780 0.9 3,908 1.9 2.9 1.7 -3.5 Connecticut 7,297 1.1 6,029 1.1 5,000 2.4 3.4 6.5 -5.1 Delaware 2,232 0.3 2,007 0.4 837 0.4 8.0 6.2 -8.7 Florida 24,452 3.6 19,045 3.4 25,396 12.4 5.2 2.0 -1.4 Georgia 13,476 2.0 10,273 1.9 8,430 4.1 4.1 4.5 -3.5 Hawaii 276 0.0 235 0.0 646 0.3 -17.2 -18.6 -7.8 Idaho 1,510 0.2 1,099 0.2 979 0.5 -9.2 -21.6 -7.1 Illinois 28,918 4.2 25,574 4.6 16,536 8.1 9.3 8.0 -5.2 Indiana 12,333 1.8 10,522 1.9 5,899 2.9 2.5 -2.7 -8.6 Iowa 4,902 0.7 4,287 0.8 2,552 1.2 -4.2 -8.4 -3.8 Kansas 4,039 0.6 3,529 0.6 2,229 1.1 -5.9 -6.3 -6.3 Kentucky 8,100 1.2 7,136 1.3 3,054 1.5 1.8 -0.4 -5.5 Louisiana 16,836 2.5 14,577 2.6 2,968 1.4 -10.1 -12.9 -2.7 Maine 1,825 0.3 1,421 0.3 1,663 0.8 5.9 0.5 -8.0 Maryland 4,722 0.7 3,785 0.7 4,016 2.0 -9.4 -11.4 -0.7 Massachusetts 15,878 2.3 13,904 2.5 10,163 5.0 -3.9 -7.2 -6.1 Michigan 29,021 4.3 24,875 4.5 11,874 5.8 -10.0 -11.6 -8.8 Minnesota 9,147 1.3 7,974 1.4 6,169 3.0 -3.2 -4.6 -7.9 Mississippi 2,286 0.3 1,806 0.3 1,779 0.9 -0.2 -11.2 -7.8 Missouri 5,762 0.8 4,809 0.9 4,622 2.3 -14.3 -10.5 -6.1 Montana 421 0.1 310 0.1 784 0.4 -20.6 -25.7 -7.9 Nebraska 1,995 0.3 1,786 0.3 1,444 0.7 1.2 -2.0 -6.5 Nevada 688 0.1 560 0.1 1,460 0.7 -36.1 -41.2 -5.2 New Hampshire 1,728 0.3 1,407 0.3 2,183 1.1 8.2 1.5 -3.4 New Jersey 15,371 2.3 11,742 2.1 13,683 6.7 1.3 -5.6 -5.4 New Mexico 1,855 0.3 1,769 0.3 757 0.4 4.5 6.8 -11.2 New York 37,394 5.5 30,663 5.5 26,223 12.8 -1.5 -6.2 -5.6 North Carolina 15,706 2.3 13,228 2.4 7,683 3.7 -4.2 -6.5 -4.6 North Dakota 750 0.1 612 0.1 835 0.4 -3.6 -8.5 -10.6 Ohio 24,855 3.6 20,899 3.8 11,982 5.8 -0.2 -5.3 -6.9 Oklahoma 2,785 0.4 2,329 0.4 2,251 1.1 2.1 2.7 -3.6 Oregon 9,031 1.3 8,221 1.5 4,535 2.2 -1.3 -3.7 -12.8 Pennsylvania 15,974 2.3 13,018 2.4 11,726 5.7 -0.6 -4.8 -6.8 Rhode Island 1,102 0.2 827 0.1 1,595 0.8 1.3 -7.8 -4.6 South Carolina 7,749 1.1 6,583 1.2 3,807 1.9 3.1 0.6 -3.1 South Dakota 446 0.1 367 0.1 703 0.3 -13.7 -18.7 -21.0 Tennessee 9,552 1.4 8,063 1.5 5,014 2.4 3.5 1.0 -4.2 Texas 78,879 11.6 66,428 12.0 20,230 9.9 3.5 8.6 -1.2 Utah 2,981 0.4 2,192 0.4 1,833 0.9 -8.0 -6.2 -8.4 Vermont 3,668 0.5 3,329 0.6 1,092 0.5 -3.7 -8.5 -9.5 Virginia 12,515 1.8 10,483 1.9 5,091 2.5 -1.9 -6.2 -2.9 Washington 38,249 5.6 36,569 6.6 9,026 4.4 16.8 18.2 -10.7 West Virginia 2,106 0.3 1,742 0.3 781 0.4 -7.5 -14.8 2.6 Wisconsin 9,753 1.4 8,308 1.5 6,279 3.1 -3.7 -6.4 -6.5 Wyoming 500 0.1 440 0.1 269 0.1 -10.7 -15.4 -10.9 District of Columbia 348 0.1 172 0.0 542 0.3 -28.2 -54.3 -8.0 Puerto Rico 6,274 0.9 5,606 1.0 1,004 0.5 12.0 8.8 -4.4 Virgin Islands 90 0.0 83 0.0 122 0.1 -61.5 -63.5 -3.2 Unallocated (3) 63,298 9.3 27,148 4.9 42,850 20.9 -6.3 -15.7 -6.2 (1) Known value is defined as the portion of U.S. total exports that could be matched to specific companies. (2) Detail may not sum to total because companies may export from more than one state.(3) Includes transactions not reported by state, low value estimates, Canadian revisions, and timing adjustments.
26
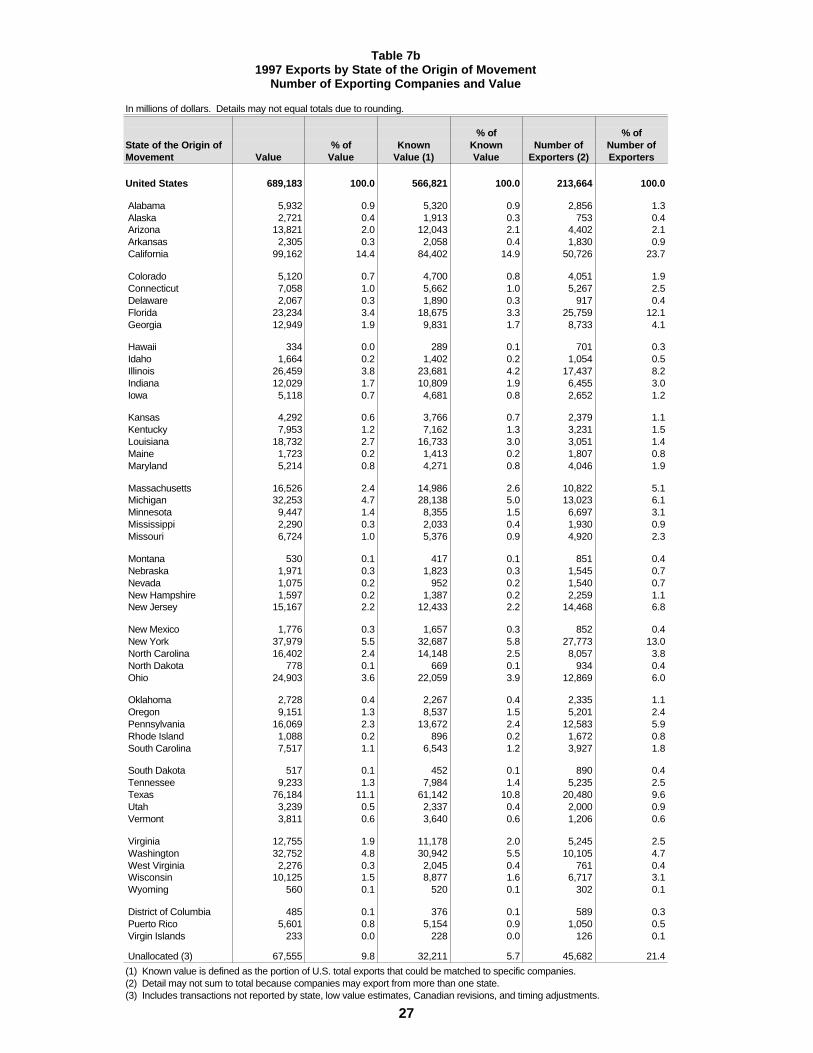
Table 7b1997 Exports by State of the Origin of Movement
Number of Exporting Companies and Value
In millions of dollars. Details may not equal totals due to rounding.
% of % ofState of the Origin of % of Known Known Number of Number ofMovement Value Value Value (1) Value Exporters (2) Exporters
United States 689,183 100.0 566,821 100.0 213,664 100.0
Alabama 5,932 0.9 5,320 0.9 2,856 1.3 Alaska 2,721 0.4 1,913 0.3 753 0.4 Arizona 13,821 2.0 12,043 2.1 4,402 2.1 Arkansas 2,305 0.3 2,058 0.4 1,830 0.9 California 99,162 14.4 84,402 14.9 50,726 23.7
Colorado 5,120 0.7 4,700 0.8 4,051 1.9 Connecticut 7,058 1.0 5,662 1.0 5,267 2.5 Delaware 2,067 0.3 1,890 0.3 917 0.4 Florida 23,234 3.4 18,675 3.3 25,759 12.1 Georgia 12,949 1.9 9,831 1.7 8,733 4.1
Hawaii 334 0.0 289 0.1 701 0.3 Idaho 1,664 0.2 1,402 0.2 1,054 0.5 Illinois 26,459 3.8 23,681 4.2 17,437 8.2 Indiana 12,029 1.7 10,809 1.9 6,455 3.0 Iowa 5,118 0.7 4,681 0.8 2,652 1.2
Kansas 4,292 0.6 3,766 0.7 2,379 1.1 Kentucky 7,953 1.2 7,162 1.3 3,231 1.5 Louisiana 18,732 2.7 16,733 3.0 3,051 1.4 Maine 1,723 0.2 1,413 0.2 1,807 0.8 Maryland 5,214 0.8 4,271 0.8 4,046 1.9
Massachusetts 16,526 2.4 14,986 2.6 10,822 5.1 Michigan 32,253 4.7 28,138 5.0 13,023 6.1 Minnesota 9,447 1.4 8,355 1.5 6,697 3.1 Mississippi 2,290 0.3 2,033 0.4 1,930 0.9 Missouri 6,724 1.0 5,376 0.9 4,920 2.3
Montana 530 0.1 417 0.1 851 0.4 Nebraska 1,971 0.3 1,823 0.3 1,545 0.7 Nevada 1,075 0.2 952 0.2 1,540 0.7 New Hampshire 1,597 0.2 1,387 0.2 2,259 1.1 New Jersey 15,167 2.2 12,433 2.2 14,468 6.8
New Mexico 1,776 0.3 1,657 0.3 852 0.4 New York 37,979 5.5 32,687 5.8 27,773 13.0 North Carolina 16,402 2.4 14,148 2.5 8,057 3.8 North Dakota 778 0.1 669 0.1 934 0.4 Ohio 24,903 3.6 22,059 3.9 12,869 6.0
Oklahoma 2,728 0.4 2,267 0.4 2,335 1.1 Oregon 9,151 1.3 8,537 1.5 5,201 2.4 Pennsylvania 16,069 2.3 13,672 2.4 12,583 5.9 Rhode Island 1,088 0.2 896 0.2 1,672 0.8 South Carolina 7,517 1.1 6,543 1.2 3,927 1.8
South Dakota 517 0.1 452 0.1 890 0.4 Tennessee 9,233 1.3 7,984 1.4 5,235 2.5 Texas 76,184 11.1 61,142 10.8 20,480 9.6 Utah 3,239 0.5 2,337 0.4 2,000 0.9 Vermont 3,811 0.6 3,640 0.6 1,206 0.6
Virginia 12,755 1.9 11,178 2.0 5,245 2.5 Washington 32,752 4.8 30,942 5.5 10,105 4.7 West Virginia 2,276 0.3 2,045 0.4 761 0.4 Wisconsin 10,125 1.5 8,877 1.6 6,717 3.1 Wyoming 560 0.1 520 0.1 302 0.1
District of Columbia 485 0.1 376 0.1 589 0.3 Puerto Rico 5,601 0.8 5,154 0.9 1,050 0.5 Virgin Islands 233 0.0 228 0.0 126 0.1
Unallocated (3) 67,555 9.8 32,211 5.7 45,682 21.4 (1) Known value is defined as the portion of U.S. total exports that could be matched to specific companies.(2) Detail may not sum to total because companies may export from more than one state.(3) Includes transactions not reported by state, low value estimates, Canadian revisions, and timing adjustments.
27
28
TECHNICAL NOTES
The 1997 and 1998 Profiles of U.S. Exporting Companies
The Census Bureau created the 1997 and 1998 profiles of U.S. exporting companies based upon thenormal export documentation used to compile the merchandise trade statistics and upon the CensusBureau’s Business Register, which contains company characteristics information.
The values in this report are on an f.a.s. (“free alongside ship”) basis for both domestic exports andreexports of foreign merchandise. They were adjusted to reflect revisions made after the December 1997and December 1998 FT900--“U.S. International Trade in Goods and Services,” press releases. However,these small revisions are not reflected in the “known value.”
Limitations
This report shows companies grouped by the NAICS instead of the SIC system. As described earlier andalso in the Appendix, this change did affect company assignments to the manufacturers, wholesalers, andother companies categories. Therefore, comparisons of these data to prior years should be made withcaution.
Nonsampling Errors
Nonsampling errors were attributable to many sources, including the inability to identify all exportingcompanies in the universe (16 percent of the total export value could not be assigned to companies for1998), imputation of missing data, data errors and bias, mistakes in recording or keying data, errors incollection or processing, and coverage problems. Explicit measures of the effects of these nonsamplingerrors are not available. However, it is believed that most of the important operational and data errors weredetected and corrected through automated data edits designed to review the data for reasonableness andconsistency. Quality control techniques were also used to verify that the operating procedures were carriedout as specified.
29
GLOSSARY OF TERMS
Company. A company is a business consisting of one domestic location (single location company) or morethan one domestic location (multiple location company) under its ownership or control.
Identified Companies. Identified companies are those companies to which one ormore export transaction was matched. The total export value associated with thesecompanies is termed "known value."
Unidentified Exports. These are export transactions that were not linked to aspecific company. Note that these shipments may have been exported either bypreviously identified companies or by other companies not included in this report.
Unclassified Companies. These are identified companies for which no proper NAICSclassification could be assigned.
Company Type. Company types are based on the North American Industry Classification System(NAICS) and are broken out into manufactures, wholesalers, and all other companies. Those companiesfor which a valid NAICS code was not available were placed in the unclassified grouping.
Employment. Employment includes all employees, full-time or part-time, reported on a firm’s payrollduring specific payroll periods in 1997 and 1998.
Low-value Estimates. Export transactions valued under $2,501 are not required to be reported. Instead,the Census Bureau estimates the value of such shipments to each country using factors based on the ratiosof low-valued shipments to individual country totals for past periods.
Related Party. A related party transaction is one between a U.S. exporter and a foreign consignee, whereeither party owns (directly or indirectly) 10 percent or more of the other party.
State of the Exporter Location (EL). The EL series data provides export statistics based on where theexporter of record is located. In practice, this is determined using the ZIP Code of the exporter addressgiven on the export record. Exporters often are intermediaries who export goods that were produced orpurchased in a state different than their own. Limitations: Exporters are not required to report on anestablishment basis. Thus, the ZIP Code reported for multiple location companies may reflect aheadquarters or administrative location. Also data entry errors or reporting errors can result in shipmentsbeing attributed to the wrong state or being credited to unknown.
State of the Origin of Movement (OM). The OM series data provides export statistics based on the statefrom which the merchandise starts its journey to the port of export; i.e., the transportation origin. Thisinformation is reported by the exporter. Limitations: In certain cases, such as for agricultural and otherbulk shipments, the OM state may reflect a consolidation point or port of exit. For example, intermediarieslocated in inland states ship agricultural commodities down the Mississippi River for export from the portof New Orleans. The consolidation state, Louisiana, is often reported as the OM state.
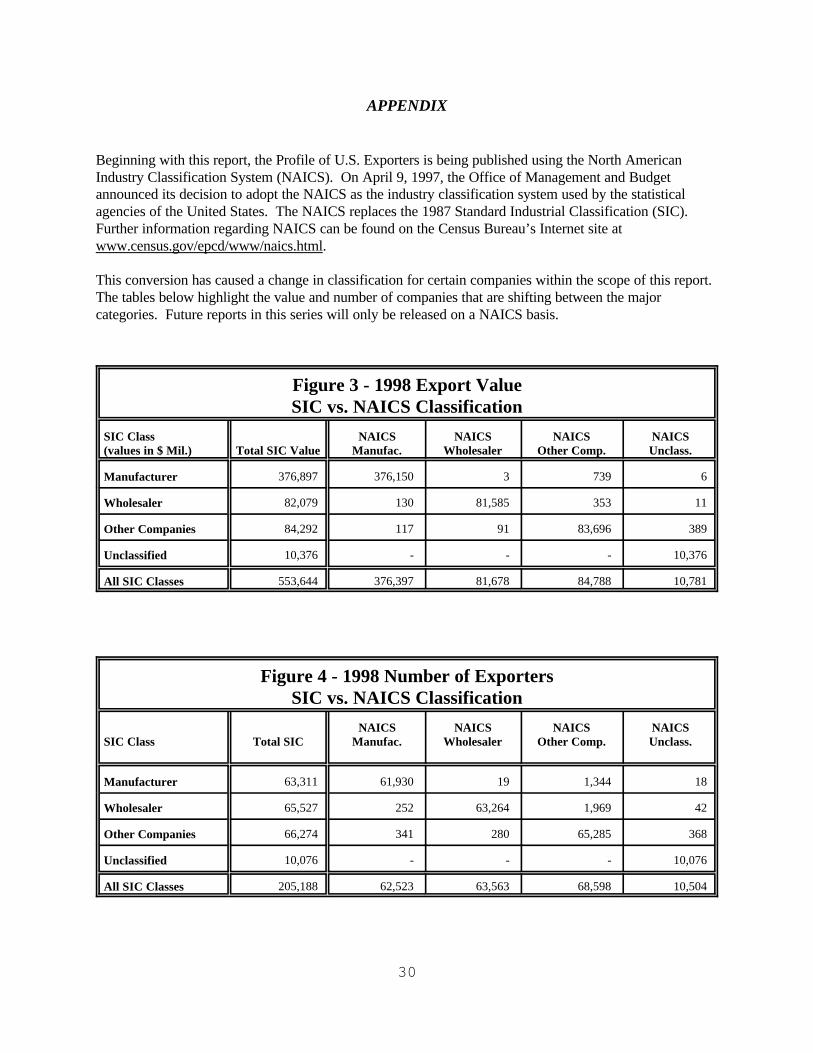
30
APPENDIX
Beginning with this report, the Profile of U.S. Exporters is being published using the North AmericanIndustry Classification System (NAICS). On April 9, 1997, the Office of Management and Budgetannounced its decision to adopt the NAICS as the industry classification system used by the statisticalagencies of the United States. The NAICS replaces the 1987 Standard Industrial Classification (SIC). Further information regarding NAICS can be found on the Census Bureau’s Internet site atwww.census.gov/epcd/www/naics.html.
This conversion has caused a change in classification for certain companies within the scope of this report. The tables below highlight the value and number of companies that are shifting between the majorcategories. Future reports in this series will only be released on a NAICS basis.
Figure 3 - 1998 Export ValueSIC vs. NAICS Classification
SIC Class(values in $ Mil.) Total SIC Value
NAICSManufac.
NAICSWholesaler
NAICSOther Comp.
NAICSUnclass.
Manufacturer 376,897 376,150 3 739 6
Wholesaler 82,079 130 81,585 353 11
Other Companies 84,292 117 91 83,696 389
Unclassified 10,376 - - - 10,376
All SIC Classes 553,644 376,397 81,678 84,788 10,781
Figure 4 - 1998 Number of ExportersSIC vs. NAICS Classification
SIC Class Total SICNAICS
Manufac.NAICS
WholesalerNAICS
Other Comp.NAICSUnclass.
Manufacturer 63,311 61,930 19 1,344 18
Wholesaler 65,527 252 63,264 1,969 42
Other Companies 66,274 341 280 65,285 368
Unclassified 10,076 - - - 10,076
All SIC Classes 205,188 62,523 63,563 68,598 10,504
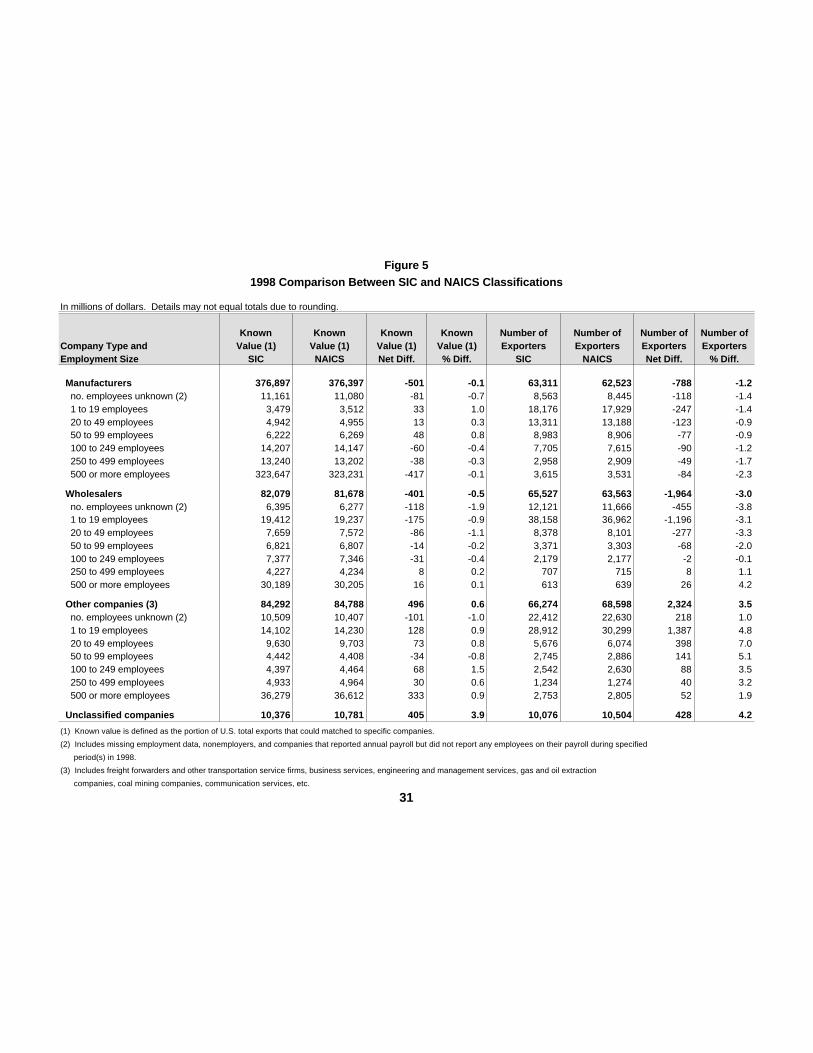
Figure 5
1998 Comparison Between SIC and NAICS Classifications
In millions of dollars. Details may not equal totals due to rounding.
Known Known Known Known Number of Number of Number of Number ofCompany Type and Value (1) Value (1) Value (1) Value (1) Exporters Exporters Exporters ExportersEmployment Size SIC NAICS Net Diff. % Diff. SIC NAICS Net Diff. % Diff.
Manufacturers 376,897 376,397 -501 -0.1 63,311 62,523 -788 -1.2 no. employees unknown (2) 11,161 11,080 -81 -0.7 8,563 8,445 -118 -1.4 1 to 19 employees 3,479 3,512 33 1.0 18,176 17,929 -247 -1.4 20 to 49 employees 4,942 4,955 13 0.3 13,311 13,188 -123 -0.9 50 to 99 employees 6,222 6,269 48 0.8 8,983 8,906 -77 -0.9 100 to 249 employees 14,207 14,147 -60 -0.4 7,705 7,615 -90 -1.2 250 to 499 employees 13,240 13,202 -38 -0.3 2,958 2,909 -49 -1.7 500 or more employees 323,647 323,231 -417 -0.1 3,615 3,531 -84 -2.3
Wholesalers 82,079 81,678 -401 -0.5 65,527 63,563 -1,964 -3.0 no. employees unknown (2) 6,395 6,277 -118 -1.9 12,121 11,666 -455 -3.8 1 to 19 employees 19,412 19,237 -175 -0.9 38,158 36,962 -1,196 -3.1 20 to 49 employees 7,659 7,572 -86 -1.1 8,378 8,101 -277 -3.3 50 to 99 employees 6,821 6,807 -14 -0.2 3,371 3,303 -68 -2.0 100 to 249 employees 7,377 7,346 -31 -0.4 2,179 2,177 -2 -0.1 250 to 499 employees 4,227 4,234 8 0.2 707 715 8 1.1 500 or more employees 30,189 30,205 16 0.1 613 639 26 4.2 Other companies (3) 84,292 84,788 496 0.6 66,274 68,598 2,324 3.5 no. employees unknown (2) 10,509 10,407 -101 -1.0 22,412 22,630 218 1.0 1 to 19 employees 14,102 14,230 128 0.9 28,912 30,299 1,387 4.8 20 to 49 employees 9,630 9,703 73 0.8 5,676 6,074 398 7.0 50 to 99 employees 4,442 4,408 -34 -0.8 2,745 2,886 141 5.1 100 to 249 employees 4,397 4,464 68 1.5 2,542 2,630 88 3.5 250 to 499 employees 4,933 4,964 30 0.6 1,234 1,274 40 3.2 500 or more employees 36,279 36,612 333 0.9 2,753 2,805 52 1.9 Unclassified companies 10,376 10,781 405 3.9 10,076 10,504 428 4.2
(1) Known value is defined as the portion of U.S. total exports that could matched to specific companies.
(2) Includes missing employment data, nonemployers, and companies that reported annual payroll but did not report any employees on their payroll during specified
period(s) in 1998.
(3) Includes freight forwarders and other transportation service firms, business services, engineering and management services, gas and oil extraction
companies, coal mining companies, communication services, etc.
31
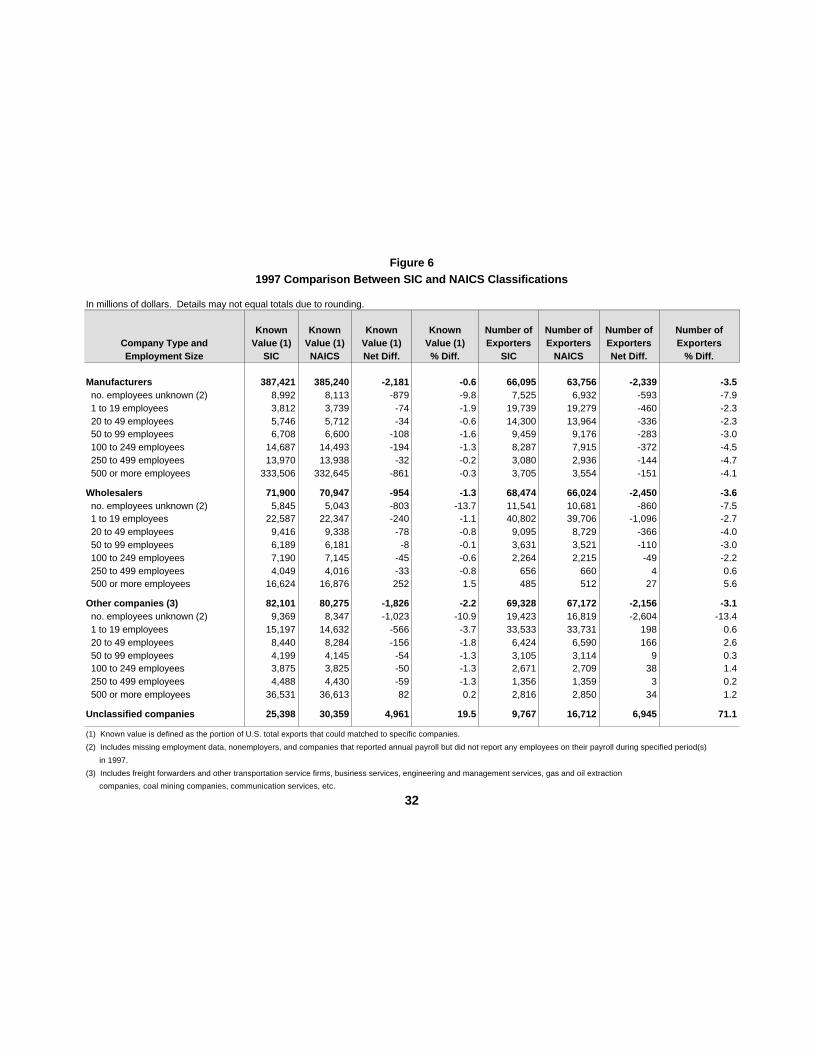
Figure 6
1997 Comparison Between SIC and NAICS Classifications
In millions of dollars. Details may not equal totals due to rounding.
Known Known Known Known Number of Number of Number of Number ofCompany Type and Value (1) Value (1) Value (1) Value (1) Exporters Exporters Exporters ExportersEmployment Size SIC NAICS Net Diff. % Diff. SIC NAICS Net Diff. % Diff.
Manufacturers 387,421 385,240 -2,181 -0.6 66,095 63,756 -2,339 -3.5 no. employees unknown (2) 8,992 8,113 -879 -9.8 7,525 6,932 -593 -7.9 1 to 19 employees 3,812 3,739 -74 -1.9 19,739 19,279 -460 -2.3 20 to 49 employees 5,746 5,712 -34 -0.6 14,300 13,964 -336 -2.3 50 to 99 employees 6,708 6,600 -108 -1.6 9,459 9,176 -283 -3.0 100 to 249 employees 14,687 14,493 -194 -1.3 8,287 7,915 -372 -4.5 250 to 499 employees 13,970 13,938 -32 -0.2 3,080 2,936 -144 -4.7 500 or more employees 333,506 332,645 -861 -0.3 3,705 3,554 -151 -4.1
Wholesalers 71,900 70,947 -954 -1.3 68,474 66,024 -2,450 -3.6 no. employees unknown (2) 5,845 5,043 -803 -13.7 11,541 10,681 -860 -7.5 1 to 19 employees 22,587 22,347 -240 -1.1 40,802 39,706 -1,096 -2.7 20 to 49 employees 9,416 9,338 -78 -0.8 9,095 8,729 -366 -4.0 50 to 99 employees 6,189 6,181 -8 -0.1 3,631 3,521 -110 -3.0 100 to 249 employees 7,190 7,145 -45 -0.6 2,264 2,215 -49 -2.2 250 to 499 employees 4,049 4,016 -33 -0.8 656 660 4 0.6 500 or more employees 16,624 16,876 252 1.5 485 512 27 5.6
Other companies (3) 82,101 80,275 -1,826 -2.2 69,328 67,172 -2,156 -3.1 no. employees unknown (2) 9,369 8,347 -1,023 -10.9 19,423 16,819 -2,604 -13.4 1 to 19 employees 15,197 14,632 -566 -3.7 33,533 33,731 198 0.6 20 to 49 employees 8,440 8,284 -156 -1.8 6,424 6,590 166 2.6 50 to 99 employees 4,199 4,145 -54 -1.3 3,105 3,114 9 0.3 100 to 249 employees 3,875 3,825 -50 -1.3 2,671 2,709 38 1.4 250 to 499 employees 4,488 4,430 -59 -1.3 1,356 1,359 3 0.2 500 or more employees 36,531 36,613 82 0.2 2,816 2,850 34 1.2
Unclassified companies 25,398 30,359 4,961 19.5 9,767 16,712 6,945 71.1
(1) Known value is defined as the portion of U.S. total exports that could matched to specific companies.
(2) Includes missing employment data, nonemployers, and companies that reported annual payroll but did not report any employees on their payroll during specified period(s)
in 1997.
(3) Includes freight forwarders and other transportation service firms, business services, engineering and management services, gas and oil extraction
companies, coal mining companies, communication services, etc.
32