Embed Size (px)
Citation preview
[1]
A PROFILE OF
MANITOBA'S COMMERCIAL FISHERY
Sustainable Development
Wildlife and Fisheries Branch
200 Saulteaux Crescent
Winnipeg, Manitoba
R3J 3W3
January 27, 2017
[2]
A PROFILE OF MANITOBA'S COMMERCIAL FISHERY
Allocation of Lakes and Licences - Potential Commercial Harvest
There are about 300 lakes, in addition to Manitoba's three major waterbodies - Lake Winnipeg, Winnipegosis, and Manitoba - listed in the commercial harvest schedule. The schedule lists seasons, limits, and conditions applied to commercial fisheries on each of these lakes. The commercial harvest schedule can be found on the Branch website at: www.gov.mb.ca/sd/waterstewardship/fisheries/regulations/regulations.html. The primary fish species under quota restrictions are Walleye, Sauger, Lake Whitefish, Northern Pike, Goldeye, and Lake Trout.
Although total quota for commercially fished lakes in the province is approximately 13.0 million kgs, significant harvest of non-quota species (e.g. suckers, Common Carp, Cisco) also occurs. Most lake quotas have been set for many years, and were originally based on traditional harvests adjusted by maximum sustainable yield estimates. Most northern lakes have lake quotas; a set number of fishers are licensed and they all fish until the entire lake quota is harvested for the season. Lakes Winnipeg and Winnipegosis have individual quota entitlements (access rights) that fishers may buy and sell. Fishers wishing to buy quota entitlements must meet certain eligibility criteria (residency, fishing experience). The number and size of quotas were originally established based on the number of participants, average harvests, and the total lake quotas at the time of implementation. It should be noted that fishers still must be licensed with individual quotas specified on the licence to use the access rights that they have purchased.
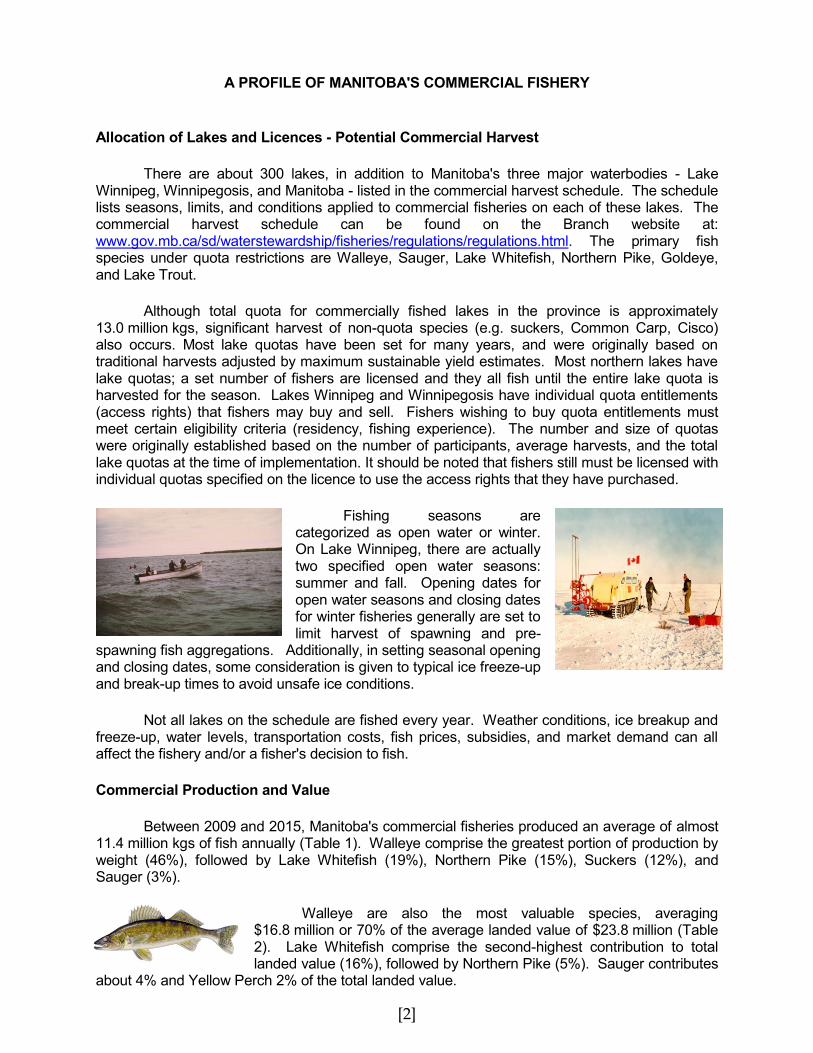
Fishing seasons are categorized as open water or winter. On Lake Winnipeg, there are actually two specified open water seasons: summer and fall. Opening dates for open water seasons and closing dates for winter fisheries generally are set to limit harvest of spawning and pre-
spawning fish aggregations. Additionally, in setting seasonal opening and closing dates, some consideration is given to typical ice freeze-up and break-up times to avoid unsafe ice conditions.
Not all lakes on the schedule are fished every year. Weather conditions, ice breakup and freeze-up, water levels, transportation costs, fish prices, subsidies, and market demand can all affect the fishery and/or a fisher's decision to fish.
Commercial Production and Value
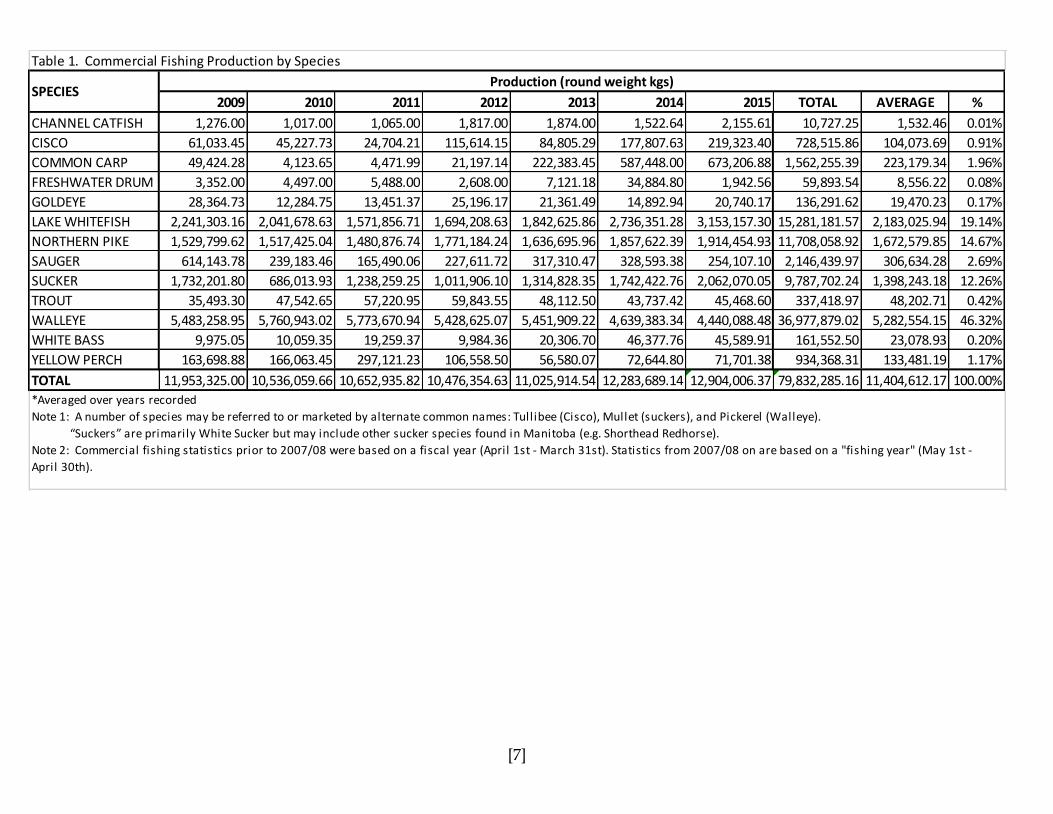
Between 2009 and 2015, Manitoba's commercial fisheries produced an average of almost 11.4 million kgs of fish annually (Table 1). Walleye comprise the greatest portion of production by weight (46%), followed by Lake Whitefish (19%), Northern Pike (15%), Suckers (12%), and Sauger (3%).
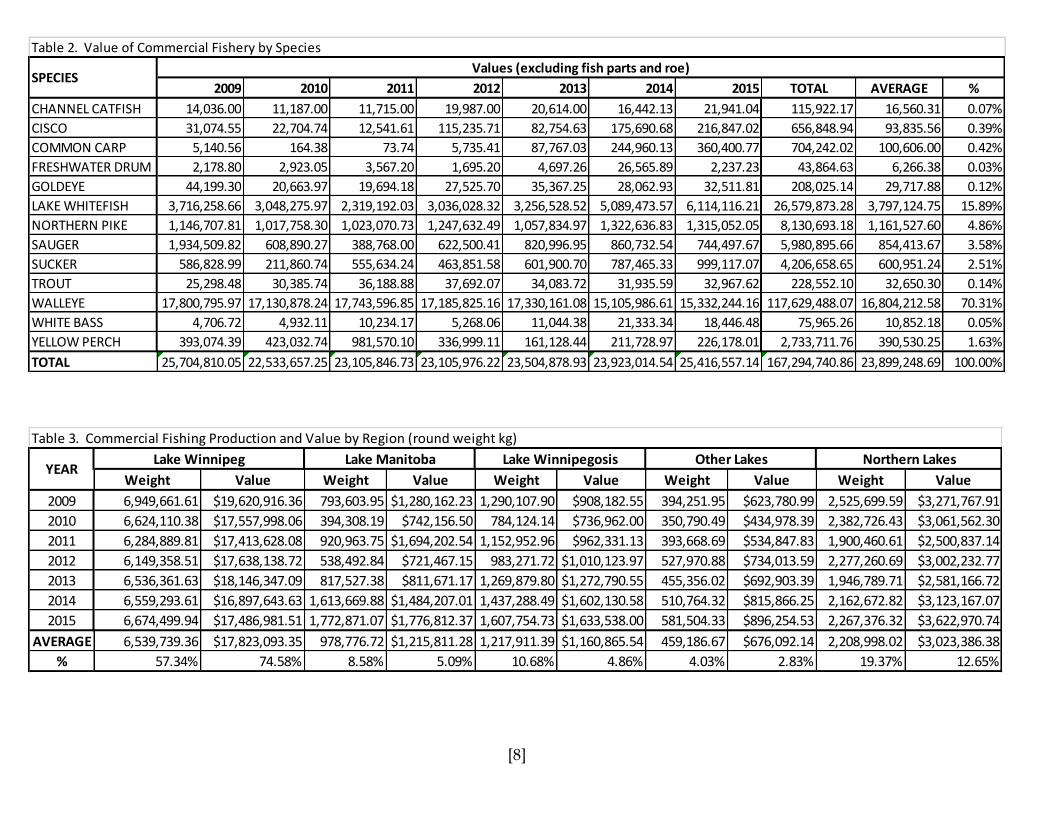
Walleye are also the most valuable species, averaging $16.8 million or 70% of the average landed value of $23.8 million (Table 2). Lake Whitefish comprise the second-highest contribution to total landed value (16%), followed by Northern Pike (5%). Sauger contributes
about 4% and Yellow Perch 2% of the total landed value.
[3]
Lake Winnipeg is the largest commercial fishery, contributing 57% of the province's total production and 75% of landed value of the harvest (Table 3). Northern lakes contribute 19% of total production and about 13% of landed value.
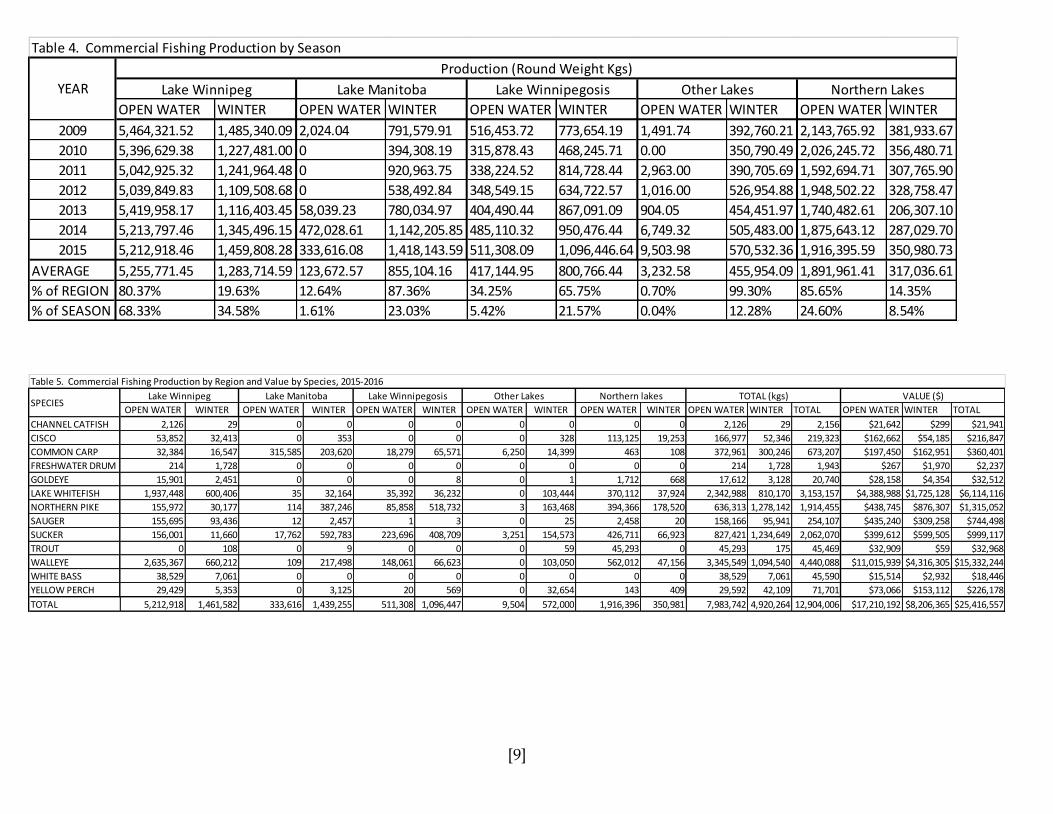
Over 67% of the total harvest occurs during open water (Table 4). Northern lakes are primarily summer fisheries and 80% of Lake Winnipeg production occurs during open water. However, Lake Manitoba is primarily a winter fishery; summer production is strictly for Common Carp and suckers. Lake Winnipegosis has been commercially fished as both a summer and winter fishery since 1921, with production split fairly evenly between the two seasons. About 99% of production from "Other Lakes" occurs during the winter.
In 2015/2016, 54% of summer production on Lake Winnipeg was Walleye/Sauger; 37% of production was Lake Whitefish (Table 5). Walleye/Sauger comprised 52% and Lake Whitefish 41% of winter production on Lake Winnipeg in 2015/2016. Production on Lake Manitoba in winter 2015/2016 was 41% suckers, .22% Yellow Perch, 15% Walleye/Sauger, and 27% Northern Pike. The Lake Winnipegosis summer fishery produced primarily suckers (44%), Walleye (29%), Northern Pike (17%) and a small amount of Lake Whitefish (7%). The winter fishery produced Northern Pike (47%), suckers/Common Carp (43%), and a small amount of Walleye (6%) and Lake Whitefish (3%).
Northern lakes produced Walleye (29%) Northern Pike (21%), Lake Whitefish (19%), and suckers (22%) in the summer (Table 5). In winter, they produced primarily Northern Pike (51%), suckers (19%), Lake Whitefish (11%), and Walleye (13%).
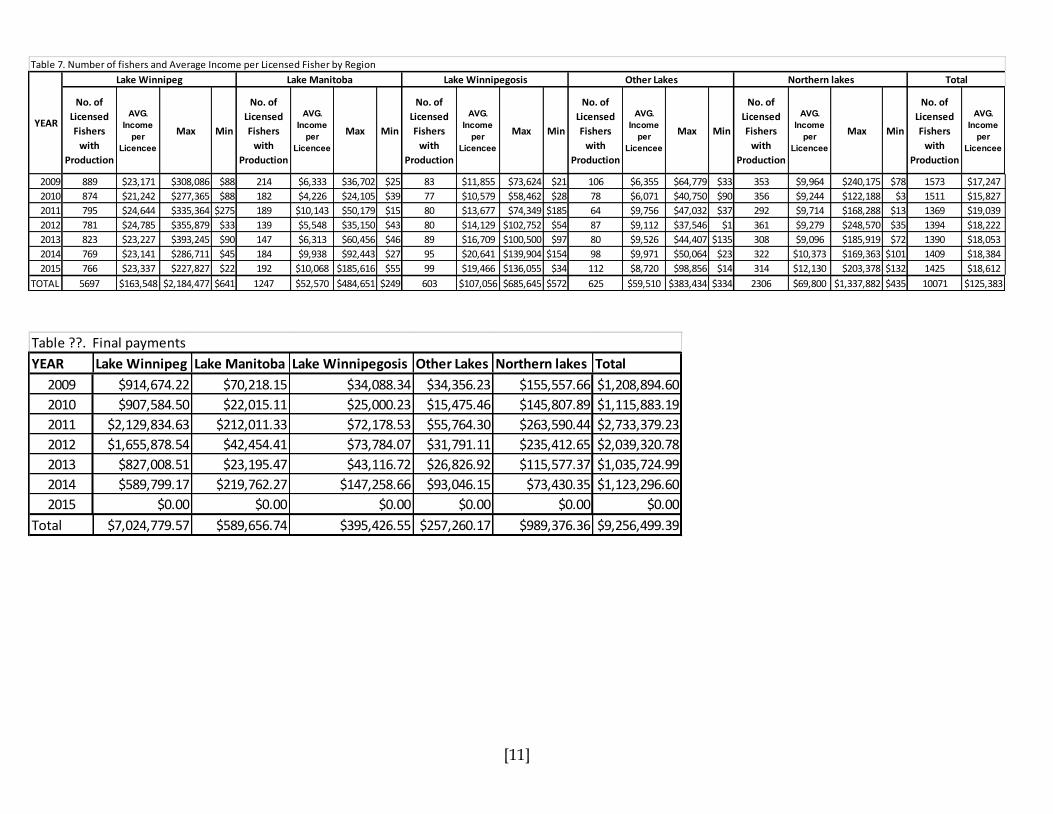
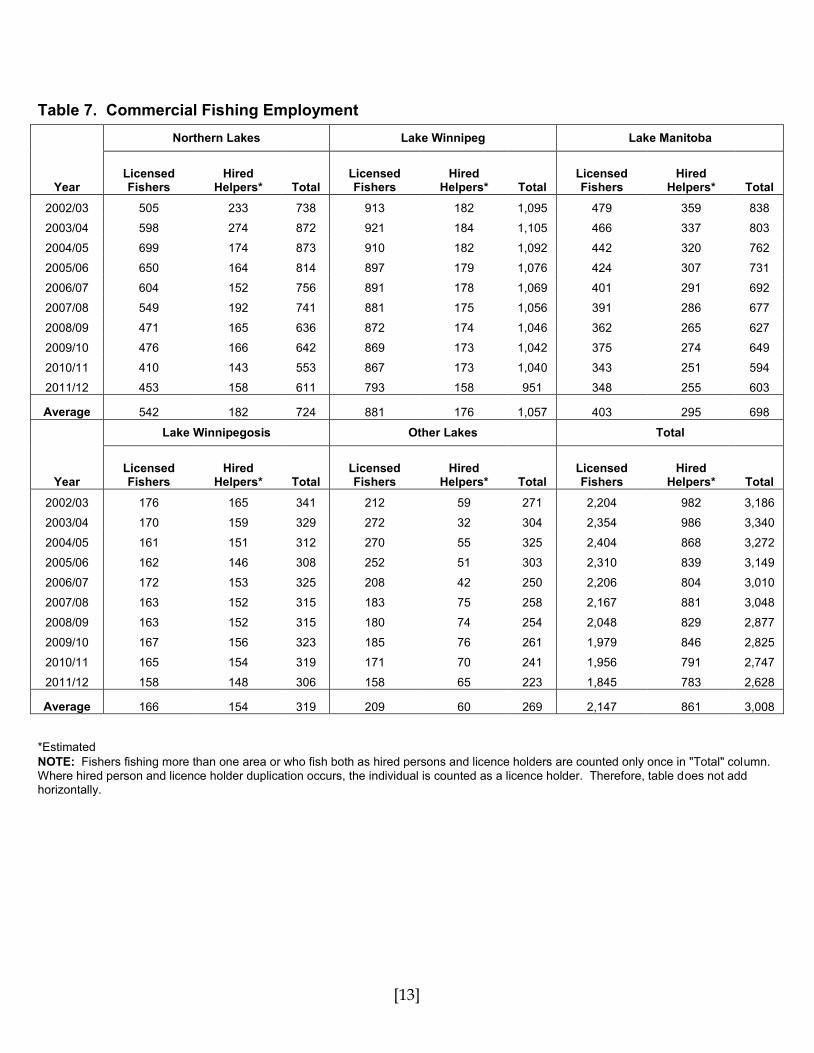
The importance of commercial fishing to local economies cannot be overstated. An average of 3,000 licensed fishers and hired helpers have been employed annually in commercial fishing in the province (Table 7); 57% of these fishers are employed on Lake Winnipeg, Manitoba's largest fishery.
Marketing
Over 80 percent of commercially caught fish in Manitoba traditionally have been destined for international markets primarily in the United States and Europe. Of the total value of Manitoba fish exports, , 60 % is sales in the USA ,24 % is comprised of sales into European markets, and 16 % is sales within Canada. The majority of Walleye harvested in Manitoba is sold into the United States, primarily into the Midwestern states of Minnesota, North Dakota, Wisconsin and Illinois; but markets also exist in other parts of Canada, France, Germany, Poland and Belgium. Sauger is generally sold within Canada. The majority of all Northern Pike harvested in Manitoba is sold into Europe, primarily into France, but other markets exist in Poland, Germany, Finland, the United States and China. The majority of Manitoba Lake Whitefish is sold into either the European and American markets.
On August 16, 2016, the government of Manitoba informed the Government of Canada, pursuant to its Participation Agreement under the Freshwater Fish Marketing Act (FFMA), that it would be withdrawing its participation. This is the first step toward allowing Manitoba to create flexible marketing options for commercial fishers in the province.
Licensed commercial fishers may personally sell fresh or frozen fish caught under the authority of their own commercial license, directly to individual consumers. These fish can only be sold for the personal use of the individual consumer and are not for re-sale.
The Manitoba government assigned a Fisheries Envoy to oversee the process of opting out of the Freshwater Fish Marketing Act and effectively carry out negotiations and consultations with the federal government and fishers.
[4]
Sustainable Fisheries / Certification
Sustainable fisheries management is increasingly becoming a factor in the marketability of fish products, particularly in key markets in the United States and Europe. Suppliers or Retailers around the world are responding to the increased consumer demand for fish / seafood products guaranteed to be from sustainably harvested fisheries.
Certification (or eco-certification) is a market-based process and global fish markets are increasingly demanding assurance from fish marketers that the product comes from sustainably managed fisheries. The term “eco-certification” refers to a process developed to certify that a commercial fishery is managed and operated in a sustainable manner. The decision whether or not to certify a fishery is made following an assessment of the fishery to determine if it meets or passes a given standard. If determined to be sustainable the fishery will receive a "seal of approval" or “eco-label”.
Manitoba started investigating the potential for certification in 2008 and has made efforts to advance eco-certification of Manitoba's commercial fisheries. This has included: 1) consulting with fishers, Associations, communities, industry, and Aboriginal groups; 2) engaging industry, other provincial/federal departments/agencies and academic institutions to explore funding opportunities and partnerships; and 3) undertaking four Marine Stewardship Council (MSC) certification pre-assessments: Lake Winnipeg (2008), northern lakes (2010), Waterhen Lake (2010), and Chitek Lake (2011).
Based on the pre-assessment survey results, Manitoba decided to focus its efforts on meeting the necessary requirements to conduct a full eco-certification assessment of Lake Waterhen to serve as a template to achieving full eco-certification of other Manitoba commercial fisheries. As of June 23rd, 2014 the Waterhen Lake Walleye and Northern Pike Commercial Gillnet Fishery became the first freshwater fishery in Canada and the entire Western Hemisphere, as well as, only the second in the world, to be certified with the right to claim that it is a “well managed and sustainable fishery” in accordance with the MSC’s Principles and Criteria for Sustainable Fishing. Waterhen Lake remains the only source of MSC-certified Northern Pike in the world.
In April 2016, the department re-organized a portion of the Fisheries section of the Wildlife and Fisheries Branch into the new Sustainable Fisheries Unit. The mission of this unit is to create maximally productive fisheries able to meet sustainable fishing certification standards, by working collaboratively with stakeholders and using sound science and community knowledge. Such fisheries, even if a sustainable fishing certificate is not sought, will ensure food security and lead sustainable economic development through fishing-related recreational and commercial economic activities.
The Premier of Manitoba’s mandate letter to the Minister of Sustainable Development directed the department to develop and implement a credible strategy to secure certification of Manitoba’s commercial fisheries.
[5]
Transportation Logistics
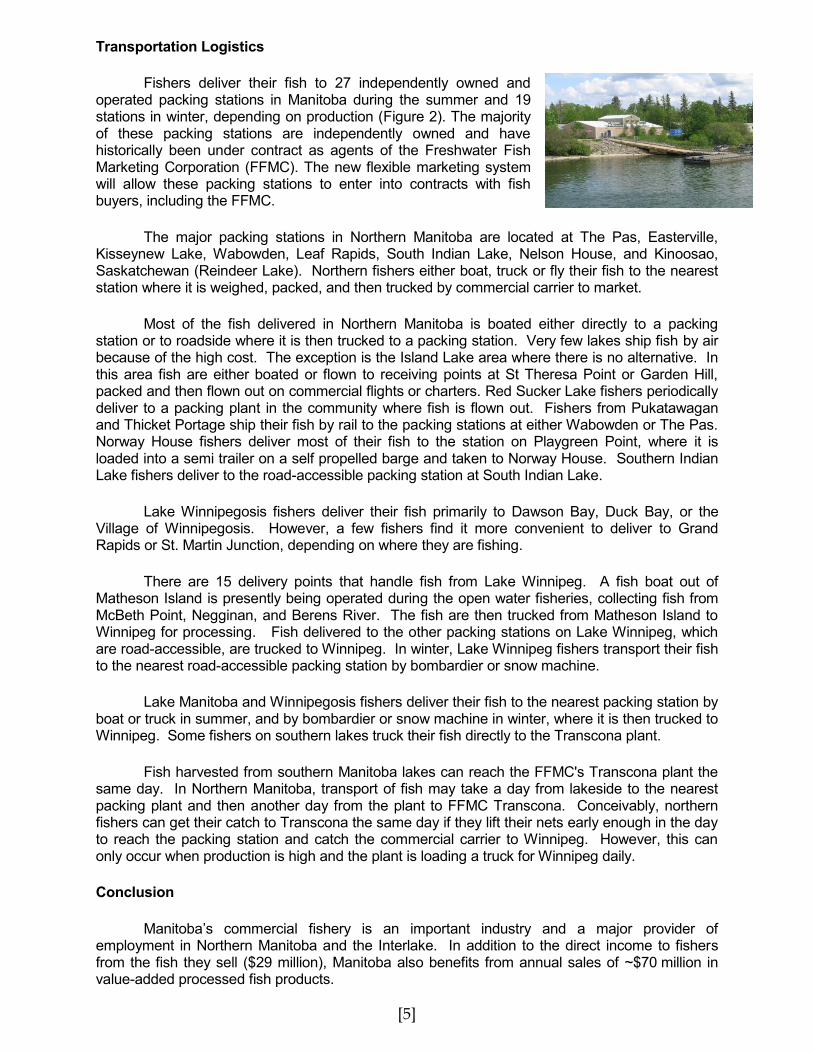
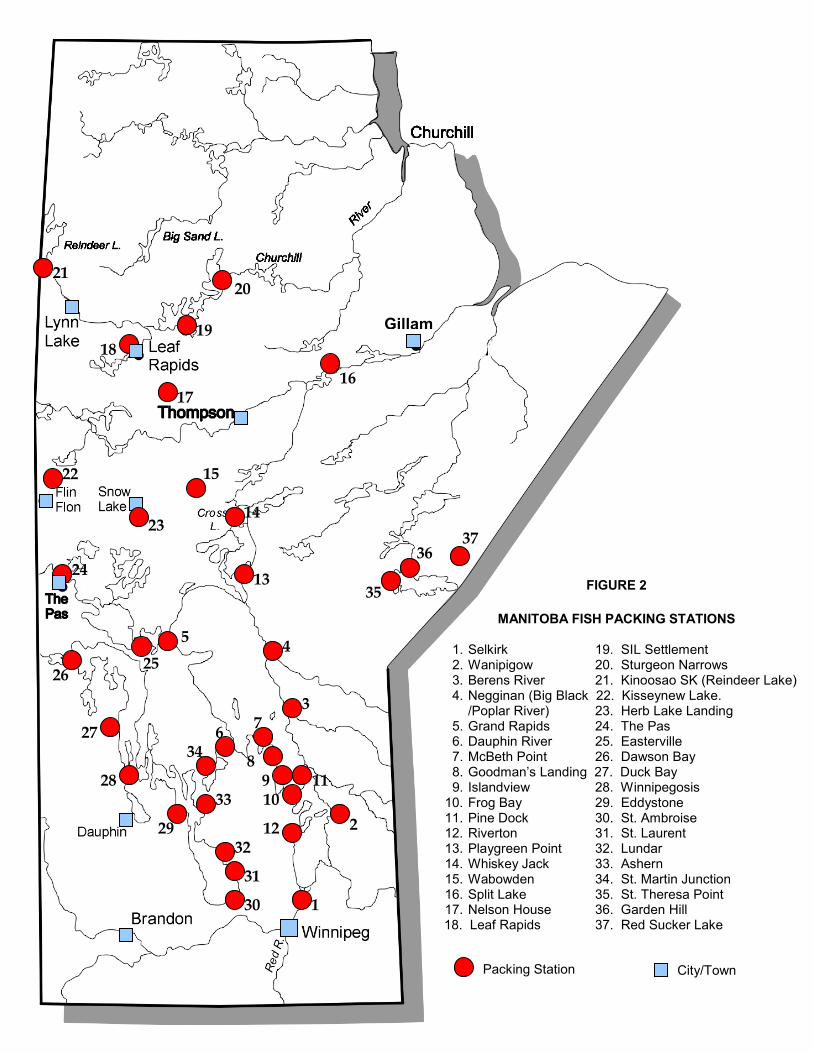
Fishers deliver their fish to 27 independently owned and operated packing stations in Manitoba during the summer and 19 stations in winter, depending on production (Figure 2). The majority of these packing stations are independently owned and have historically been under contract as agents of the Freshwater Fish Marketing Corporation (FFMC). The new flexible marketing system will allow these packing stations to enter into contracts with fish buyers, including the FFMC.
The major packing stations in Northern Manitoba are located at The Pas, Easterville, Kisseynew Lake, Wabowden, Leaf Rapids, South Indian Lake, Nelson House, and Kinoosao, Saskatchewan (Reindeer Lake). Northern fishers either boat, truck or fly their fish to the nearest station where it is weighed, packed, and then trucked by commercial carrier to market.
Most of the fish delivered in Northern Manitoba is boated either directly to a packing station or to roadside where it is then trucked to a packing station. Very few lakes ship fish by air because of the high cost. The exception is the Island Lake area where there is no alternative. In this area fish are either boated or flown to receiving points at St Theresa Point or Garden Hill, packed and then flown out on commercial flights or charters. Red Sucker Lake fishers periodically deliver to a packing plant in the community where fish is flown out. Fishers from Pukatawagan and Thicket Portage ship their fish by rail to the packing stations at either Wabowden or The Pas. Norway House fishers deliver most of their fish to the station on Playgreen Point, where it is loaded into a semi trailer on a self propelled barge and taken to Norway House. Southern Indian Lake fishers deliver to the road-accessible packing station at South Indian Lake.
Lake Winnipegosis fishers deliver their fish primarily to Dawson Bay, Duck Bay, or the Village of Winnipegosis. However, a few fishers find it more convenient to deliver to Grand Rapids or St. Martin Junction, depending on where they are fishing.
There are 15 delivery points that handle fish from Lake Winnipeg. A fish boat out of Matheson Island is presently being operated during the open water fisheries, collecting fish from McBeth Point, Negginan, and Berens River. The fish are then trucked from Matheson Island to Winnipeg for processing. Fish delivered to the other packing stations on Lake Winnipeg, which are road-accessible, are trucked to Winnipeg. In winter, Lake Winnipeg fishers transport their fish to the nearest road-accessible packing station by bombardier or snow machine.
Lake Manitoba and Winnipegosis fishers deliver their fish to the nearest packing station by boat or truck in summer, and by bombardier or snow machine in winter, where it is then trucked to Winnipeg. Some fishers on southern lakes truck their fish directly to the Transcona plant.
Fish harvested from southern Manitoba lakes can reach the FFMC's Transcona plant the same day. In Northern Manitoba, transport of fish may take a day from lakeside to the nearest packing plant and then another day from the plant to FFMC Transcona. Conceivably, northern fishers can get their catch to Transcona the same day if they lift their nets early enough in the day to reach the packing station and catch the commercial carrier to Winnipeg. However, this can only occur when production is high and the plant is loading a truck for Winnipeg daily.
Conclusion
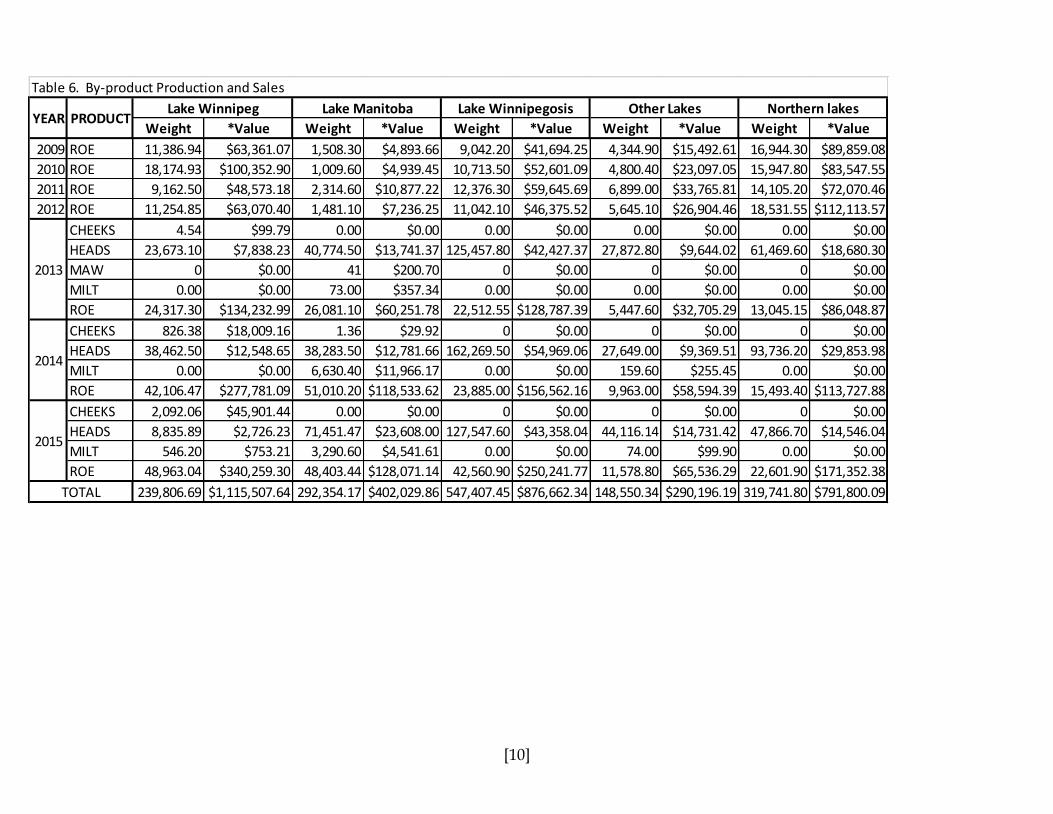
Manitoba’s commercial fishery is an important industry and a major provider of employment in Northern Manitoba and the Interlake. In addition to the direct income to fishers from the fish they sell ($29 million), Manitoba also benefits from annual sales of ~$70 million in value-added processed fish products.
[6]
Gillam
FIGURE 2
MANITOBA FISH PACKING STATIONS
1. Selkirk 19. SIL Settlement 2. Wanipigow 20. Sturgeon Narrows 3. Berens River 21. Kinoosao SK (Reindeer Lake) 4. Negginan (Big Black 22. Kisseynew Lake.
/Poplar River) 23. Herb Lake Landing 5. Grand Rapids 24. The Pas 6. Dauphin River 25. Easterville 7. McBeth Point 26. Dawson Bay 8. Goodman’s Landing 27. Duck Bay 9. Islandview 28. Winnipegosis
10. Frog Bay 29. Eddystone 11. Pine Dock 30. St. Ambroise 12. Riverton 31. St. Laurent 13. Playgreen Point 32. Lundar 14. Whiskey Jack 33. Ashern 15. Wabowden 34. St. Martin Junction 16. Split Lake 35. St. Theresa Point 17. Nelson House 36. Garden Hill 18. Leaf Rapids 37. Red Sucker Lake
1
2
3
4
13
14
15
16 17
19
21
18
22
24
5
26
27
28
29
30
31
32
33
34
12
10 11
8
7 6
20
9
Packing Station City/Town
25
23
35
36 37
[7]
2009 2010 2011 2012 2013 2014 2015 TOTAL AVERAGE %
CHANNEL CATFISH 1,276.00 1,017.00 1,065.00 1,817.00 1,874.00 1,522.64 2,155.61 10,727.25 1,532.46 0.01%
CISCO 61,033.45 45,227.73 24,704.21 115,614.15 84,805.29 177,807.63 219,323.40 728,515.86 104,073.69 0.91%
COMMON CARP 49,424.28 4,123.65 4,471.99 21,197.14 222,383.45 587,448.00 673,206.88 1,562,255.39 223,179.34 1.96%
FRESHWATER DRUM 3,352.00 4,497.00 5,488.00 2,608.00 7,121.18 34,884.80 1,942.56 59,893.54 8,556.22 0.08%
GOLDEYE 28,364.73 12,284.75 13,451.37 25,196.17 21,361.49 14,892.94 20,740.17 136,291.62 19,470.23 0.17%
LAKE WHITEFISH 2,241,303.16 2,041,678.63 1,571,856.71 1,694,208.63 1,842,625.86 2,736,351.28 3,153,157.30 15,281,181.57 2,183,025.94 19.14%
NORTHERN PIKE 1,529,799.62 1,517,425.04 1,480,876.74 1,771,184.24 1,636,695.96 1,857,622.39 1,914,454.93 11,708,058.92 1,672,579.85 14.67%
SAUGER 614,143.78 239,183.46 165,490.06 227,611.72 317,310.47 328,593.38 254,107.10 2,146,439.97 306,634.28 2.69%
SUCKER 1,732,201.80 686,013.93 1,238,259.25 1,011,906.10 1,314,828.35 1,742,422.76 2,062,070.05 9,787,702.24 1,398,243.18 12.26%
TROUT 35,493.30 47,542.65 57,220.95 59,843.55 48,112.50 43,737.42 45,468.60 337,418.97 48,202.71 0.42%
WALLEYE 5,483,258.95 5,760,943.02 5,773,670.94 5,428,625.07 5,451,909.22 4,639,383.34 4,440,088.48 36,977,879.02 5,282,554.15 46.32%
WHITE BASS 9,975.05 10,059.35 19,259.37 9,984.36 20,306.70 46,377.76 45,589.91 161,552.50 23,078.93 0.20%
YELLOW PERCH 163,698.88 166,063.45 297,121.23 106,558.50 56,580.07 72,644.80 71,701.38 934,368.31 133,481.19 1.17%
TOTAL 11,953,325.00 10,536,059.66 10,652,935.82 10,476,354.63 11,025,914.54 12,283,689.14 12,904,006.37 79,832,285.16 11,404,612.17 100.00%
Production (round weight kgs)SPECIES
Table 1. Commercial Fishing Production by Species
*Averaged over years recorded
Note 1: A number of species may be referred to or marketed by alternate common names: Tullibee (Cisco), Mullet (suckers), and Pickerel (Walleye).
“Suckers” are primarily White Sucker but may include other sucker species found in Manitoba (e.g. Shorthead Redhorse).
Note 2: Commercial fishing statistics prior to 2007/08 were based on a fiscal year (April 1st - March 31st). Statistics from 2007/08 on are based on a "fishing year" (May 1st -
April 30th).
[8]
2009 2010 2011 2012 2013 2014 2015 TOTAL AVERAGE %
CHANNEL CATFISH 14,036.00 11,187.00 11,715.00 19,987.00 20,614.00 16,442.13 21,941.04 115,922.17 16,560.31 0.07%
CISCO 31,074.55 22,704.74 12,541.61 115,235.71 82,754.63 175,690.68 216,847.02 656,848.94 93,835.56 0.39%
COMMON CARP 5,140.56 164.38 73.74 5,735.41 87,767.03 244,960.13 360,400.77 704,242.02 100,606.00 0.42%
FRESHWATER DRUM 2,178.80 2,923.05 3,567.20 1,695.20 4,697.26 26,565.89 2,237.23 43,864.63 6,266.38 0.03%
GOLDEYE 44,199.30 20,663.97 19,694.18 27,525.70 35,367.25 28,062.93 32,511.81 208,025.14 29,717.88 0.12%
LAKE WHITEFISH 3,716,258.66 3,048,275.97 2,319,192.03 3,036,028.32 3,256,528.52 5,089,473.57 6,114,116.21 26,579,873.28 3,797,124.75 15.89%
NORTHERN PIKE 1,146,707.81 1,017,758.30 1,023,070.73 1,247,632.49 1,057,834.97 1,322,636.83 1,315,052.05 8,130,693.18 1,161,527.60 4.86%
SAUGER 1,934,509.82 608,890.27 388,768.00 622,500.41 820,996.95 860,732.54 744,497.67 5,980,895.66 854,413.67 3.58%
SUCKER 586,828.99 211,860.74 555,634.24 463,851.58 601,900.70 787,465.33 999,117.07 4,206,658.65 600,951.24 2.51%
TROUT 25,298.48 30,385.74 36,188.88 37,692.07 34,083.72 31,935.59 32,967.62 228,552.10 32,650.30 0.14%
WALLEYE 17,800,795.97 17,130,878.24 17,743,596.85 17,185,825.16 17,330,161.08 15,105,986.61 15,332,244.16 117,629,488.07 16,804,212.58 70.31%
WHITE BASS 4,706.72 4,932.11 10,234.17 5,268.06 11,044.38 21,333.34 18,446.48 75,965.26 10,852.18 0.05%
YELLOW PERCH 393,074.39 423,032.74 981,570.10 336,999.11 161,128.44 211,728.97 226,178.01 2,733,711.76 390,530.25 1.63%
TOTAL 25,704,810.05 22,533,657.25 23,105,846.73 23,105,976.22 23,504,878.93 23,923,014.54 25,416,557.14 167,294,740.86 23,899,248.69 100.00%
Values (excluding fish parts and roe)
Table 2. Value of Commercial Fishery by Species
SPECIES
Weight Value Weight Value Weight Value Weight Value Weight Value
2009 6,949,661.61 $19,620,916.36 793,603.95 $1,280,162.23 1,290,107.90 $908,182.55 394,251.95 $623,780.99 2,525,699.59 $3,271,767.91
2010 6,624,110.38 $17,557,998.06 394,308.19 $742,156.50 784,124.14 $736,962.00 350,790.49 $434,978.39 2,382,726.43 $3,061,562.30
2011 6,284,889.81 $17,413,628.08 920,963.75 $1,694,202.54 1,152,952.96 $962,331.13 393,668.69 $534,847.83 1,900,460.61 $2,500,837.14
2012 6,149,358.51 $17,638,138.72 538,492.84 $721,467.15 983,271.72 $1,010,123.97 527,970.88 $734,013.59 2,277,260.69 $3,002,232.77
2013 6,536,361.63 $18,146,347.09 817,527.38 $811,671.17 1,269,879.80 $1,272,790.55 455,356.02 $692,903.39 1,946,789.71 $2,581,166.72
2014 6,559,293.61 $16,897,643.63 1,613,669.88 $1,484,207.01 1,437,288.49 $1,602,130.58 510,764.32 $815,866.25 2,162,672.82 $3,123,167.07
2015 6,674,499.94 $17,486,981.51 1,772,871.07 $1,776,812.37 1,607,754.73 $1,633,538.00 581,504.33 $896,254.53 2,267,376.32 $3,622,970.74
AVERAGE 6,539,739.36 $17,823,093.35 978,776.72 $1,215,811.28 1,217,911.39 $1,160,865.54 459,186.67 $676,092.14 2,208,998.02 $3,023,386.38
% 57.34% 74.58% 8.58% 5.09% 10.68% 4.86% 4.03% 2.83% 19.37% 12.65%
YEAR
Table 3. Commercial Fishing Production and Value by Region (round weight kg)
Lake Winnipeg Lake Manitoba Lake Winnipegosis Other Lakes Northern Lakes
[9]
OPEN WATER WINTER TOTAL OPEN WATER WINTER TOTAL
CHANNEL CATFISH 2,126 29 0 0 0 0 0 0 0 0 2,126 29 2,156 $21,642 $299 $21,941
CISCO 53,852 32,413 0 353 0 0 0 328 113,125 19,253 166,977 52,346 219,323 $162,662 $54,185 $216,847
COMMON CARP 32,384 16,547 315,585 203,620 18,279 65,571 6,250 14,399 463 108 372,961 300,246 673,207 $197,450 $162,951 $360,401
FRESHWATER DRUM 214 1,728 0 0 0 0 0 0 0 0 214 1,728 1,943 $267 $1,970 $2,237
GOLDEYE 15,901 2,451 0 0 0 8 0 1 1,712 668 17,612 3,128 20,740 $28,158 $4,354 $32,512
LAKE WHITEFISH 1,937,448 600,406 35 32,164 35,392 36,232 0 103,444 370,112 37,924 2,342,988 810,170 3,153,157 $4,388,988 $1,725,128 $6,114,116
NORTHERN PIKE 155,972 30,177 114 387,246 85,858 518,732 3 163,468 394,366 178,520 636,313 1,278,142 1,914,455 $438,745 $876,307 $1,315,052
SAUGER 155,695 93,436 12 2,457 1 3 0 25 2,458 20 158,166 95,941 254,107 $435,240 $309,258 $744,498
SUCKER 156,001 11,660 17,762 592,783 223,696 408,709 3,251 154,573 426,711 66,923 827,421 1,234,649 2,062,070 $399,612 $599,505 $999,117
TROUT 0 108 0 9 0 0 0 59 45,293 0 45,293 175 45,469 $32,909 $59 $32,968
WALLEYE 2,635,367 660,212 109 217,498 148,061 66,623 0 103,050 562,012 47,156 3,345,549 1,094,540 4,440,088 $11,015,939 $4,316,305 $15,332,244
WHITE BASS 38,529 7,061 0 0 0 0 0 0 0 0 38,529 7,061 45,590 $15,514 $2,932 $18,446
YELLOW PERCH 29,429 5,353 0 3,125 20 569 0 32,654 143 409 29,592 42,109 71,701 $73,066 $153,112 $226,178
TOTAL 5,212,918 1,461,582 333,616 1,439,255 511,308 1,096,447 9,504 572,000 1,916,396 350,981 7,983,742 4,920,264 12,904,006 $17,210,192 $8,206,365 $25,416,557
OPEN WATER WINTER
Northern lakes TOTAL (kgs)
Table 5. Commercial Fishing Production by Region and Value by Species, 2015-2016
VALUE ($)SPECIES
OPEN WATER WINTER
Lake Winnipegosis Other Lakes
WINTER
Lake Manitoba
OPEN WATER WINTEROPEN WATER WINTER
Lake Winnipeg
OPEN WATER
OPEN WATER WINTER OPEN WATER WINTER OPEN WATER WINTER OPEN WATER WINTER OPEN WATER WINTER
2009 5,464,321.52 1,485,340.09 2,024.04 791,579.91 516,453.72 773,654.19 1,491.74 392,760.21 2,143,765.92 381,933.67
2010 5,396,629.38 1,227,481.00 0 394,308.19 315,878.43 468,245.71 0.00 350,790.49 2,026,245.72 356,480.71
2011 5,042,925.32 1,241,964.48 0 920,963.75 338,224.52 814,728.44 2,963.00 390,705.69 1,592,694.71 307,765.90
2012 5,039,849.83 1,109,508.68 0 538,492.84 348,549.15 634,722.57 1,016.00 526,954.88 1,948,502.22 328,758.47
2013 5,419,958.17 1,116,403.45 58,039.23 780,034.97 404,490.44 867,091.09 904.05 454,451.97 1,740,482.61 206,307.10
2014 5,213,797.46 1,345,496.15 472,028.61 1,142,205.85 485,110.32 950,476.44 6,749.32 505,483.00 1,875,643.12 287,029.70
2015 5,212,918.46 1,459,808.28 333,616.08 1,418,143.59 511,308.09 1,096,446.64 9,503.98 570,532.36 1,916,395.59 350,980.73
AVERAGE 5,255,771.45 1,283,714.59 123,672.57 855,104.16 417,144.95 800,766.44 3,232.58 455,954.09 1,891,961.41 317,036.61
% of REGION 80.37% 19.63% 12.64% 87.36% 34.25% 65.75% 0.70% 99.30% 85.65% 14.35%
% of SEASON 68.33% 34.58% 1.61% 23.03% 5.42% 21.57% 0.04% 12.28% 24.60% 8.54%
YEAR
Production (Round Weight Kgs)
Table 4. Commercial Fishing Production by Season
Lake Winnipeg Lake Manitoba Lake Winnipegosis Other Lakes Northern Lakes
[10]
Weight *Value Weight *Value Weight *Value Weight *Value Weight *Value
2009 ROE 11,386.94 $63,361.07 1,508.30 $4,893.66 9,042.20 $41,694.25 4,344.90 $15,492.61 16,944.30 $89,859.08
2010 ROE 18,174.93 $100,352.90 1,009.60 $4,939.45 10,713.50 $52,601.09 4,800.40 $23,097.05 15,947.80 $83,547.55
2011 ROE 9,162.50 $48,573.18 2,314.60 $10,877.22 12,376.30 $59,645.69 6,899.00 $33,765.81 14,105.20 $72,070.46
2012 ROE 11,254.85 $63,070.40 1,481.10 $7,236.25 11,042.10 $46,375.52 5,645.10 $26,904.46 18,531.55 $112,113.57
CHEEKS 4.54 $99.79 0.00 $0.00 0.00 $0.00 0.00 $0.00 0.00 $0.00
HEADS 23,673.10 $7,838.23 40,774.50 $13,741.37 125,457.80 $42,427.37 27,872.80 $9,644.02 61,469.60 $18,680.30
MAW 0 $0.00 41 $200.70 0 $0.00 0 $0.00 0 $0.00
MILT 0.00 $0.00 73.00 $357.34 0.00 $0.00 0.00 $0.00 0.00 $0.00
ROE 24,317.30 $134,232.99 26,081.10 $60,251.78 22,512.55 $128,787.39 5,447.60 $32,705.29 13,045.15 $86,048.87
CHEEKS 826.38 $18,009.16 1.36 $29.92 0 $0.00 0 $0.00 0 $0.00
HEADS 38,462.50 $12,548.65 38,283.50 $12,781.66 162,269.50 $54,969.06 27,649.00 $9,369.51 93,736.20 $29,853.98
MILT 0.00 $0.00 6,630.40 $11,966.17 0.00 $0.00 159.60 $255.45 0.00 $0.00
ROE 42,106.47 $277,781.09 51,010.20 $118,533.62 23,885.00 $156,562.16 9,963.00 $58,594.39 15,493.40 $113,727.88
CHEEKS 2,092.06 $45,901.44 0.00 $0.00 0 $0.00 0 $0.00 0 $0.00
HEADS 8,835.89 $2,726.23 71,451.47 $23,608.00 127,547.60 $43,358.04 44,116.14 $14,731.42 47,866.70 $14,546.04
MILT 546.20 $753.21 3,290.60 $4,541.61 0.00 $0.00 74.00 $99.90 0.00 $0.00
ROE 48,963.04 $340,259.30 48,403.44 $128,071.14 42,560.90 $250,241.77 11,578.80 $65,536.29 22,601.90 $171,352.38
239,806.69 $1,115,507.64 292,354.17 $402,029.86 547,407.45 $876,662.34 148,550.34 $290,196.19 319,741.80 $791,800.09TOTAL
Table 6. By-product Production and Sales
PRODUCTYEAROther Lakes Northern lakes
2013
2014
2015
Lake Winnipeg Lake Manitoba Lake Winnipegosis
[11]
No. of
Licensed
Fishers
with
Production
AVG.
Income
per
Licencee
Max Min
No. of
Licensed
Fishers
with
Production
AVG.
Income
per
Licencee
Max Min
No. of
Licensed
Fishers
with
Production
AVG.
Income
per
Licencee
Max Min
No. of
Licensed
Fishers
with
Production
AVG.
Income
per
Licencee
Max Min
No. of
Licensed
Fishers
with
Production
AVG.
Income
per
Licencee
Max Min
No. of
Licensed
Fishers
with
Production
AVG.
Income
per
Licencee
2009 889 $23,171 $308,086 $88 214 $6,333 $36,702 $25 83 $11,855 $73,624 $21 106 $6,355 $64,779 $33 353 $9,964 $240,175 $78 1573 $17,247
2010 874 $21,242 $277,365 $88 182 $4,226 $24,105 $39 77 $10,579 $58,462 $28 78 $6,071 $40,750 $90 356 $9,244 $122,188 $3 1511 $15,827
2011 795 $24,644 $335,364 $275 189 $10,143 $50,179 $15 80 $13,677 $74,349 $185 64 $9,756 $47,032 $37 292 $9,714 $168,288 $13 1369 $19,039
2012 781 $24,785 $355,879 $33 139 $5,548 $35,150 $43 80 $14,129 $102,752 $54 87 $9,112 $37,546 $1 361 $9,279 $248,570 $35 1394 $18,222
2013 823 $23,227 $393,245 $90 147 $6,313 $60,456 $46 89 $16,709 $100,500 $97 80 $9,526 $44,407 $135 308 $9,096 $185,919 $72 1390 $18,053
2014 769 $23,141 $286,711 $45 184 $9,938 $92,443 $27 95 $20,641 $139,904 $154 98 $9,971 $50,064 $23 322 $10,373 $169,363 $101 1409 $18,384
2015 766 $23,337 $227,827 $22 192 $10,068 $185,616 $55 99 $19,466 $136,055 $34 112 $8,720 $98,856 $14 314 $12,130 $203,378 $132 1425 $18,612
TOTAL 5697 $163,548 $2,184,477 $641 1247 $52,570 $484,651 $249 603 $107,056 $685,645 $572 625 $59,510 $383,434 $334 2306 $69,800 $1,337,882 $435 10071 $125,383
Northern lakes Total
Table 7. Number of fishers and Average Income per Licensed Fisher by Region
YEAR
Lake Winnipeg Lake Manitoba Lake Winnipegosis Other Lakes
YEAR Lake Winnipeg Lake Manitoba Lake Winnipegosis Other Lakes Northern lakes Total
2009 $914,674.22 $70,218.15 $34,088.34 $34,356.23 $155,557.66 $1,208,894.60
2010 $907,584.50 $22,015.11 $25,000.23 $15,475.46 $145,807.89 $1,115,883.19
2011 $2,129,834.63 $212,011.33 $72,178.53 $55,764.30 $263,590.44 $2,733,379.23
2012 $1,655,878.54 $42,454.41 $73,784.07 $31,791.11 $235,412.65 $2,039,320.78
2013 $827,008.51 $23,195.47 $43,116.72 $26,826.92 $115,577.37 $1,035,724.99
2014 $589,799.17 $219,762.27 $147,258.66 $93,046.15 $73,430.35 $1,123,296.60
2015 $0.00 $0.00 $0.00 $0.00 $0.00 $0.00
Total $7,024,779.57 $589,656.74 $395,426.55 $257,260.17 $989,376.36 $9,256,499.39
Table ??. Final payments

[12]
[13]
Table 7. Commercial Fishing Employment
Northern Lakes Lake Winnipeg Lake Manitoba
Year Licensed Fishers
Hired Helpers* Total
Licensed Fishers
Hired Helpers* Total
Licensed Fishers
Hired Helpers* Total
2002/03 505 233 738 913 182 1,095 479 359 838
2003/04 598 274 872 921 184 1,105 466 337 803
2004/05 699 174 873 910 182 1,092 442 320 762
2005/06 650 164 814 897 179 1,076 424 307 731
2006/07 604 152 756 891 178 1,069 401 291 692
2007/08 549 192 741 881 175 1,056 391 286 677
2008/09 471 165 636 872 174 1,046 362 265 627
2009/10 476 166 642 869 173 1,042 375 274 649
2010/11 410 143 553 867 173 1,040 343 251 594
2011/12 453 158 611 793 158 951 348 255 603
Average 542 182 724 881 176 1,057 403 295 698
Lake Winnipegosis Other Lakes Total
Year Licensed Fishers
Hired Helpers* Total
Licensed Fishers
Hired Helpers* Total
Licensed Fishers
Hired Helpers* Total
2002/03 176 165 341 212 59 271 2,204 982 3,186
2003/04 170 159 329 272 32 304 2,354 986 3,340
2004/05 161 151 312 270 55 325 2,404 868 3,272
2005/06 162 146 308 252 51 303 2,310 839 3,149
2006/07 172 153 325 208 42 250 2,206 804 3,010
2007/08 163 152 315 183 75 258 2,167 881 3,048
2008/09 163 152 315 180 74 254 2,048 829 2,877
2009/10 167 156 323 185 76 261 1,979 846 2,825
2010/11 165 154 319 171 70 241 1,956 791 2,747
2011/12 158 148 306 158 65 223 1,845 783 2,628
Average 166 154 319 209 60 269 2,147 861 3,008
*Estimated
NOTE: Fishers fishing more than one area or who fish both as hired persons and licence holders are counted only once in "Total" column.
Where hired person and licence holder duplication occurs, the individual is counted as a licence holder. Therefore, table does not add horizontally.
[14]
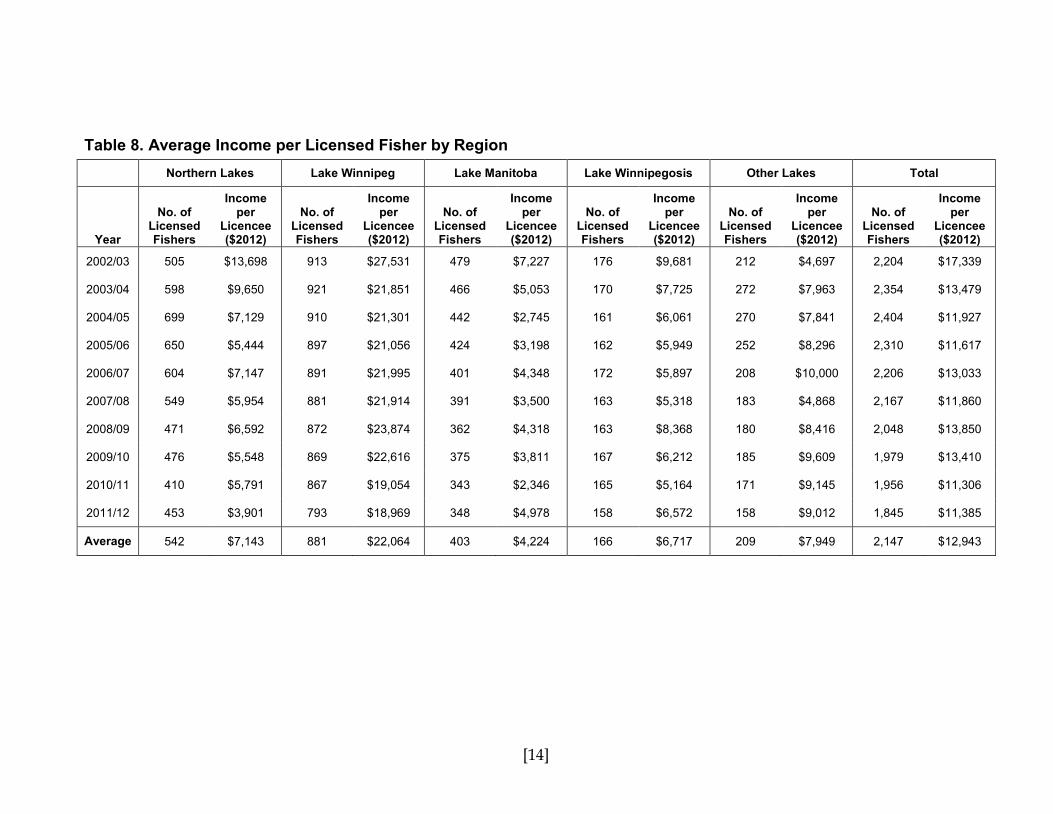
Table 8. Average Income per Licensed Fisher by Region
Northern Lakes Lake Winnipeg Lake Manitoba Lake Winnipegosis Other Lakes Total
Year
No. of Licensed Fishers
Income per
Licencee ($2012)
No. of Licensed Fishers
Income per
Licencee ($2012)
No. of Licensed Fishers
Income per
Licencee ($2012)
No. of Licensed Fishers
Income per
Licencee ($2012)
No. of Licensed Fishers
Income per
Licencee ($2012)
No. of Licensed Fishers
Income per
Licencee ($2012)
2002/03 505 $13,698 913 $27,531 479 $7,227 176 $9,681 212 $4,697 2,204 $17,339
2003/04 598 $9,650 921 $21,851 466 $5,053 170 $7,725 272 $7,963 2,354 $13,479
2004/05 699 $7,129 910 $21,301 442 $2,745 161 $6,061 270 $7,841 2,404 $11,927
2005/06 650 $5,444 897 $21,056 424 $3,198 162 $5,949 252 $8,296 2,310 $11,617
2006/07 604 $7,147 891 $21,995 401 $4,348 172 $5,897 208 $10,000 2,206 $13,033
2007/08 549 $5,954 881 $21,914 391 $3,500 163 $5,318 183 $4,868 2,167 $11,860
2008/09 471 $6,592 872 $23,874 362 $4,318 163 $8,368 180 $8,416 2,048 $13,850
2009/10 476 $5,548 869 $22,616 375 $3,811 167 $6,212 185 $9,609 1,979 $13,410
2010/11 410 $5,791 867 $19,054 343 $2,346 165 $5,164 171 $9,145 1,956 $11,306
2011/12 453 $3,901 793 $18,969 348 $4,978 158 $6,572 158 $9,012 1,845 $11,385
Average 542 $7,143 881 $22,064 403 $4,224 166 $6,717 209 $7,949 2,147 $12,943