Embed Size (px)
Citation preview
Background Paper Series
Background Paper 2005:1(5)
A profile of KwaZulu-Natal: Demographics, poverty,
inequality and unemployment
Elsenburg August 2005

Overview
The Provincial Decision-Making Enabling (PROVIDE) Project aims to facilitate policy design by supplying policymakers with provincial and national level quantitative policy
information. The project entails the development of a series of databases (in the format of Social Accounting Matrices) for use in Computable General Equilibrium
models.
The National and Provincial Departments of Agriculture are the stakeholders and funders of the PROVIDE Project. The research team is located at Elsenburg in the
Western Cape.
PROVIDE Research Team
Project Leader: Cecilia Punt Senior Researchers: Kalie Pauw Melt van Schoor Young Professional: Bonani Nyhodo Technical Expert: Scott McDonald Associate Researchers: Lindsay Chant Christine Valente
PROVIDE Contact Details
� Private Bag X1 Elsenburg, 7607 South Africa
� [email protected] � +27-21-8085191 � +27-21-8085210
For the original project proposal and a more detailed description of the project,
please visit www.elsenburg.com/provide
PROVIDE Project Background Paper 2005:1(5) August 2005
i © PROVIDE Project
A profile of KwaZulu-Natal: Demographics, poverty, inequality
and unemployment 1
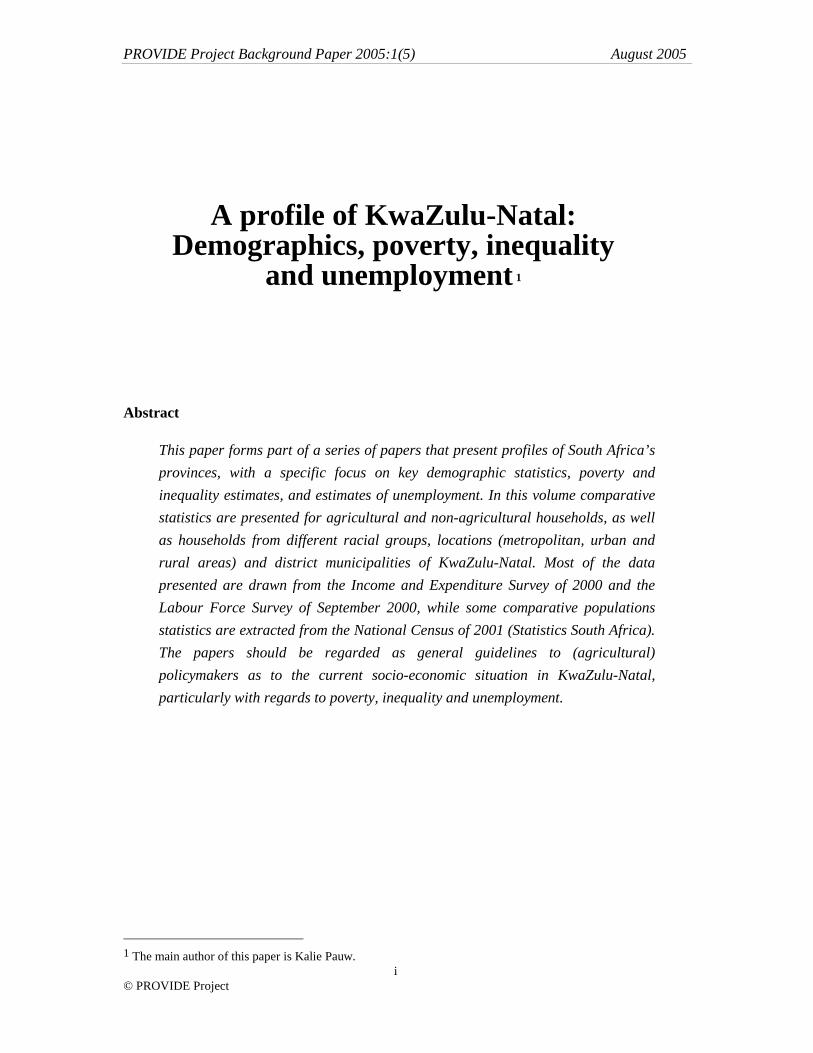
Abstract
This paper forms part of a series of papers that present profiles of South Africa’s provinces, with a specific focus on key demographic statistics, poverty and inequality estimates, and estimates of unemployment. In this volume comparative statistics are presented for agricultural and non-agricultural households, as well as households from different racial groups, locations (metropolitan, urban and rural areas) and district municipalities of KwaZulu-Natal. Most of the data presented are drawn from the Income and Expenditure Survey of 2000 and the Labour Force Survey of September 2000, while some comparative populations statistics are extracted from the National Census of 2001 (Statistics South Africa). The papers should be regarded as general guidelines to (agricultural) policymakers as to the current socio-economic situation in KwaZulu-Natal, particularly with regards to poverty, inequality and unemployment.
1 The main author of this paper is Kalie Pauw.
PROVIDE Project Background Paper 2005:1(5) August 2005
ii © PROVIDE Project
Table of Contents
1. Introduction ................................................................................................................ 1 2. Demographics.............................................................................................................. 2
2.1. Spatial distribution of households ........................................................................ 2 2.2. Agricultural households........................................................................................ 4
3. Poverty, inequality and unemployment.................................................................... 7 3.1. Poverty and agriculture......................................................................................... 8 3.2. Inequality in the distribution of income.............................................................. 11 3.3. Employment levels and unemployment.............................................................. 15
4. Conclusions ............................................................................................................... 19 5. References.................................................................................................................. 20
List of Figures Figure 1: District municipalities in KwaZulu-Natal ................................................................. 3 Figure 2: Agricultural household shares by region and race .................................................... 7 Figure 3: Poverty rates by population subgroups ................................................................... 10 Figure 4: Poverty rates by race and agricultural/non-agricultural population ........................ 11 Figure 5: Lorenz curves for KwaZulu-Natal and South Africa .............................................. 12 Figure 6: Racial representation in the workforce of KwaZulu-Natal ..................................... 17 Figure 7: Unemployment rates by population subgroups ....................................................... 18 Figure 8: Unemployment rates by race and agricultural/non-agricultural population............ 19 List of Tables Table 1: Racial composition of KwaZulu-Natal....................................................................... 2 Table 2: Population by district municipality and racial group.................................................. 4 Table 3: Population by urban/rural areas and racial group ....................................................... 4 Table 4: Agricultural households by race (broad and strict definitions) .................................. 6 Table 5: Agricultural population by race (broad and strict definitions) ................................... 6 Table 6: Average household incomes in KwaZulu-Natal......................................................... 8 Table 7: Trends in income distribution – 1960 and 1980....................................................... 12 Table 8: Gini decomposition by race and agriculture in KwaZulu-Natal............................... 14 Table 9: Theil decomposition – agricultural and non-agricultural households ...................... 15
PROVIDE Project Background Paper 2005:1(5) August 2005
1
1. Introduction
According to the National Census of 2001 KwaZulu-Natal is home to about 21.0% of South Africa’s population, South Africa’s largest province. Measured by its total current income, KwaZulu-Natal is the third richest province in South Africa after Gauteng and the Western Cape. In per capita income terms the province ranks fourth (SSA, 2003a).2 Although the people of KwaZulu-Natal are relatively well off, the province is still marred by high poverty rates, inequalities in the distribution of income between various population subgroups, and unemployment. Poverty and unemployment in South Africa are often rural phenomena, and given that many of the rural inhabitants are linked to agricultural activities, the various Departments of Agriculture in South Africa have an important role to play in addressing the needs in rural areas. In this paper an overview of the demographics, poverty, inequality and unemployment in KwaZulu-Natal is presented. A strong focus on agriculture and agricultural households is maintained throughout.
There are various sources of demographic data available in South Africa. In addition to the National Census of 2001 (SSA, 2003a), Statistics South Africa conducts a variety of regular surveys. Most suited to this type of study and fairly recent is the Income and Expenditure Survey of 2000 (IES 2000) (SSA, 2002a), which is a source of detailed income and expenditure statistics of households and household members. The twice-yearly Labour Force Survey (LFS) is an important source of employment and labour income data. In this paper we use the LFS September 2000 (LFS 2000:2) (SSA, 2002b) as this survey can be merged with the IES 2000. Although there are some concerns about the reliability of the IES and LFS datasets, whether merged or used separately, as well as the comparability of these with other datasets, one should attempt to work with it as it remains the most recent comprehensive source of household income, employment and expenditure information in South Africa. For a detailed description of the data, as well as data problems and data adjustments made to the version of the dataset used in this paper, refer to PROVIDE (2005a).
This paper is organised as follows. Section 2 presents a brief overview of the spatial distribution of households within the province, while also presenting some estimates of the number of people or households involved in agricultural activities. Section 3 focuses on poverty, inequality and unemployment in the province, while section 4 draws some general conclusions.
2 These population figures and income estimates are based on the Census 2001. Statistics South Africa warns that
the question simply asked about individual income without probing about informal income, income from profits, income in kind etc. As a result they believe this figure may be a misrepresentation of the true income. Comparative figures from the IES 2000 ranks KwaZulu-Natal fifth in terms of total provincial income, and also fourth as measured by per capita income.
PROVIDE Project Background Paper 2005:1(5) August 2005
2
2. Demographics
2.1. Spatial distribution of households
In 2000 KwaZulu-Natal was home to 2.06 million households and a total of 8.99 million people (IES/LFS 2000). These estimates are different from the Census 2001 estimates of 2.09 million households (9.43 million people, see Table 1). The discrepancies can be explained by possible changes in population size and composition between 2000 and 2001, but also points at the outdated IES/LFS 2000 sampling weights.3 Compared to the Census 2001 data African people were under-represented while the other population groups were over-represented in the IES/LFS 2000.
Table 1: Racial composition of KwaZulu-Natal
IES/LFS 2000 Population share Census 2001 Population share African 7,457,345 82.9% 8,002,409 84.9% Coloured 177,114 2.0% 141,888 1.5% Asian/Indian 809,052 9.0% 798,274 8.5% White 547,596 6.1% 483,448 5.1% Total 8,991,107 100.0% 9,426,019 100.0% Sources: IES/LFS 2000 and Census 2001.
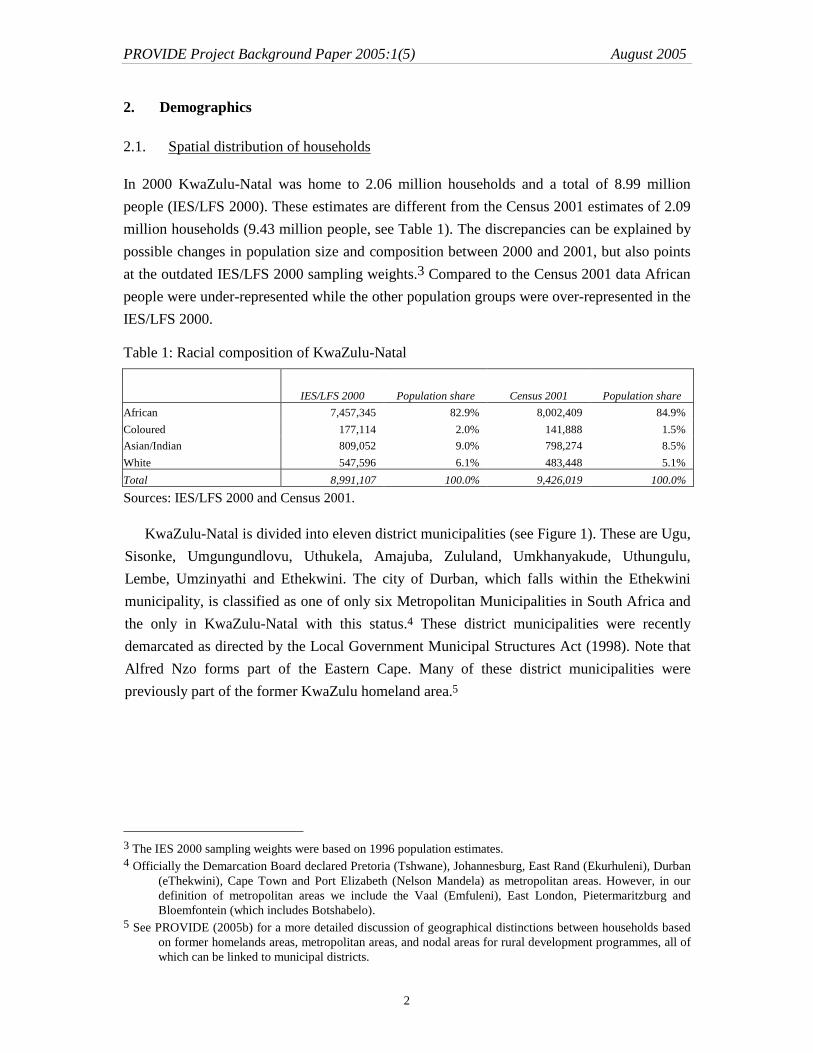
KwaZulu-Natal is divided into eleven district municipalities (see Figure 1). These are Ugu, Sisonke, Umgungundlovu, Uthukela, Amajuba, Zululand, Umkhanyakude, Uthungulu, Lembe, Umzinyathi and Ethekwini. The city of Durban, which falls within the Ethekwini municipality, is classified as one of only six Metropolitan Municipalities in South Africa and the only in KwaZulu-Natal with this status.4 These district municipalities were recently demarcated as directed by the Local Government Municipal Structures Act (1998). Note that Alfred Nzo forms part of the Eastern Cape. Many of these district municipalities were previously part of the former KwaZulu homeland area.5
3 The IES 2000 sampling weights were based on 1996 population estimates. 4 Officially the Demarcation Board declared Pretoria (Tshwane), Johannesburg, East Rand (Ekurhuleni), Durban
(eThekwini), Cape Town and Port Elizabeth (Nelson Mandela) as metropolitan areas. However, in our definition of metropolitan areas we include the Vaal (Emfuleni), East London, Pietermaritzburg and Bloemfontein (which includes Botshabelo).
5 See PROVIDE (2005b) for a more detailed discussion of geographical distinctions between households based on former homelands areas, metropolitan areas, and nodal areas for rural development programmes, all of which can be linked to municipal districts.
PROVIDE Project Background Paper 2005:1(5) August 2005
3
Figure 1: District municipalities in KwaZulu-Natal
Source: Demarcation Board (www.demarcation.org.za).
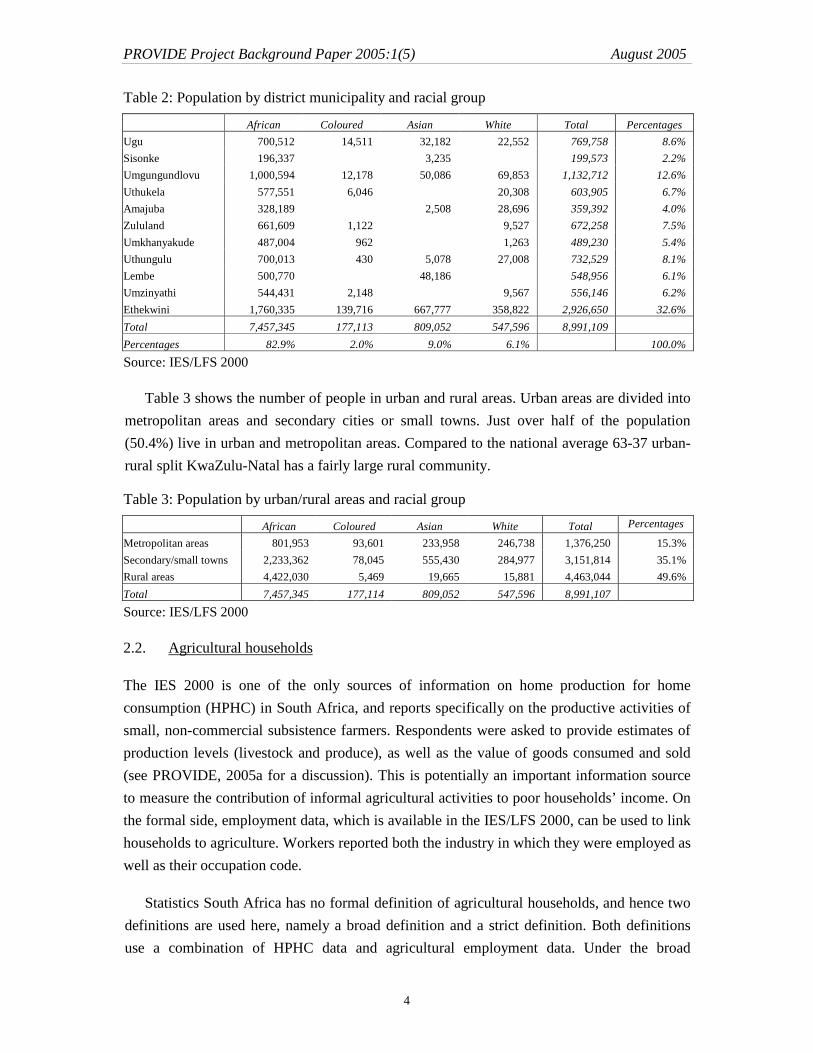
Table 2 shows the number of people in each district municipality by racial group. Almost one third (32.6%) live in Ethekwini. Umgungundlovu is the second largest municipality with 12.6% of the population. The population shares of the rest of the municipalities range between 2.2% and 8.6%. The majority of the population is classified as African (82.9%). A large proportion of South Africa’s Indian community also lives in KwaZulu-Natal. This population group makes up 9.0% of the provincial population. White and Coloured people make up 6.1% and 2.0% of the population respectively. Over three quarters of the Asian, Coloured and White population live in Ethekwini, i.e. in and around the Durban metropole.
PROVIDE Project Background Paper 2005:1(5) August 2005
4
Table 2: Population by district municipality and racial group
African Coloured Asian White Total Percentages Ugu 700,512 14,511 32,182 22,552 769,758 8.6% Sisonke 196,337 3,235 199,573 2.2% Umgungundlovu 1,000,594 12,178 50,086 69,853 1,132,712 12.6% Uthukela 577,551 6,046 20,308 603,905 6.7% Amajuba 328,189 2,508 28,696 359,392 4.0% Zululand 661,609 1,122 9,527 672,258 7.5% Umkhanyakude 487,004 962 1,263 489,230 5.4% Uthungulu 700,013 430 5,078 27,008 732,529 8.1% Lembe 500,770 48,186 548,956 6.1% Umzinyathi 544,431 2,148 9,567 556,146 6.2% Ethekwini 1,760,335 139,716 667,777 358,822 2,926,650 32.6% Total 7,457,345 177,113 809,052 547,596 8,991,109 Percentages 82.9% 2.0% 9.0% 6.1% 100.0% Source: IES/LFS 2000
Table 3 shows the number of people in urban and rural areas. Urban areas are divided into metropolitan areas and secondary cities or small towns. Just over half of the population (50.4%) live in urban and metropolitan areas. Compared to the national average 63-37 urban-rural split KwaZulu-Natal has a fairly large rural community.
Table 3: Population by urban/rural areas and racial group
African Coloured Asian White Total Percentages
Metropolitan areas 801,953 93,601 233,958 246,738 1,376,250 15.3% Secondary/small towns 2,233,362 78,045 555,430 284,977 3,151,814 35.1% Rural areas 4,422,030 5,469 19,665 15,881 4,463,044 49.6% Total 7,457,345 177,114 809,052 547,596 8,991,107 Source: IES/LFS 2000
2.2. Agricultural households
The IES 2000 is one of the only sources of information on home production for home consumption (HPHC) in South Africa, and reports specifically on the productive activities of small, non-commercial subsistence farmers. Respondents were asked to provide estimates of production levels (livestock and produce), as well as the value of goods consumed and sold (see PROVIDE, 2005a for a discussion). This is potentially an important information source to measure the contribution of informal agricultural activities to poor households’ income. On the formal side, employment data, which is available in the IES/LFS 2000, can be used to link households to agriculture. Workers reported both the industry in which they were employed as well as their occupation code.
Statistics South Africa has no formal definition of agricultural households, and hence two definitions are used here, namely a broad definition and a strict definition. Both definitions use a combination of HPHC data and agricultural employment data. Under the broad
PROVIDE Project Background Paper 2005:1(5) August 2005
5
definition any household that earns income from either formal employment in the agricultural industry or as a skilled agricultural worker, or from sales or consumption of home produce or livestock, is defined as an agricultural household.6 Under the strict definition a household has to earn at least 50% of its household-level income from formal and/or informal agricultural activities. A further way to ‘qualify’ as an agricultural household is when the value of consumption of own produce and livestock is at least 50% of total annual food expenditure.
About 496,230 households (24.1%) in KwaZulu-Natal are involved in HPHC, somewhat higher than the national average of 19.3%. This figure includes 483,364 African households (97.4%), 851 Coloured households, 3,353 Asian households and 8,662 White households. Much fewer households (226,870) earn some share of their income from wages of household members working in agricultural-related industries. The majority of these (217,249) of these households are African, while 688 are Coloured, 3,015 are Asian and 5,917 are White households. Income differences between these households suggest that the White households are typically the owners or managers of farms, with incomes averaging R149,825. African and Coloured households typically supply farm labour, with average household incomes of R18,180 and R31,289, respectively. When combining households in own production and agricultural employment, a total of 629,721 households (30.6%) in KwaZulu-Natal can broadly be defined as agricultural households. Note that some of these households ‘qualify’ as agricultural households on both own production and employment accounts, which is why the figures do not add up. Under the strict definition 298,957 households (14.5%) are defined as agricultural households (see Table 4).
6 Note that consumption of own produce or livestock in economic terms can be regarded as an ‘income’ in the
sense that the household ‘buys’ the goods from itself. If the household did not consume the goods it could have been sold in the market. This treatment of home-consumed production captures the notion of opportunity cost in economics.
PROVIDE Project Background Paper 2005:1(5) August 2005
6
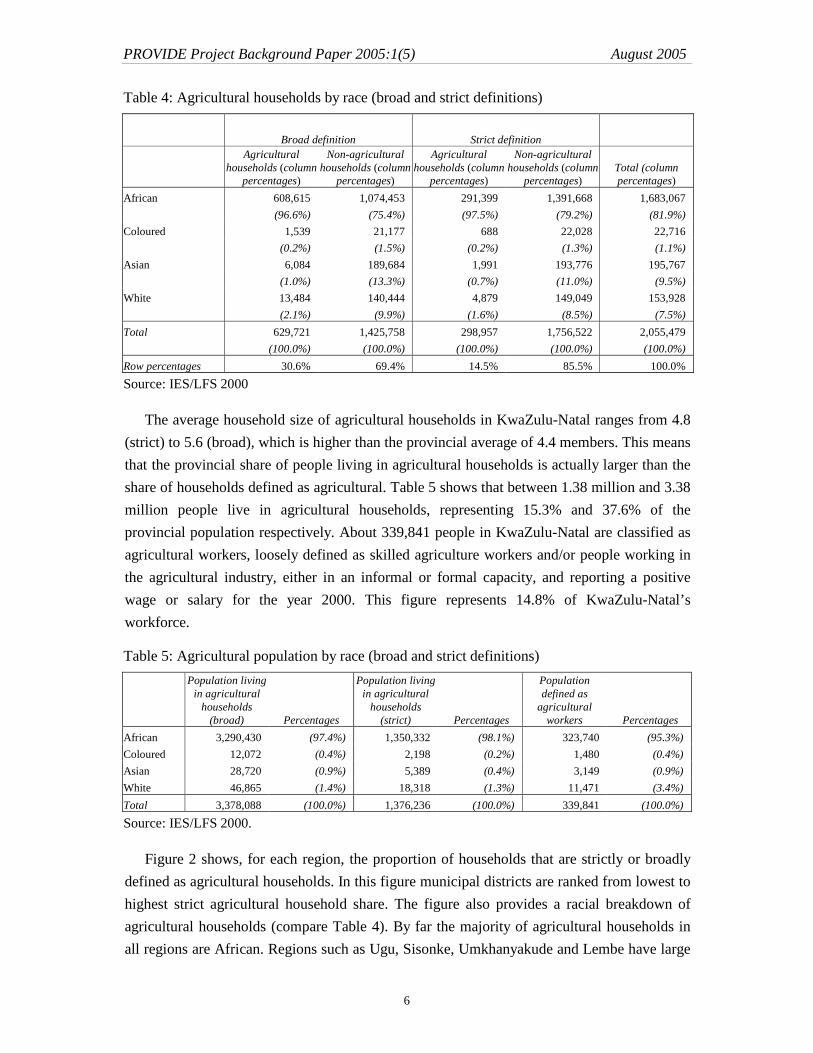
Table 4: Agricultural households by race (broad and strict definitions)
Broad definition Strict definition
Agricultural households (column
percentages)
Non-agricultural households (column
percentages)
Agricultural households (column
percentages)
Non-agricultural households (column
percentages) Total (column percentages)
African 608,615 1,074,453 291,399 1,391,668 1,683,067 (96.6%) (75.4%) (97.5%) (79.2%) (81.9%) Coloured 1,539 21,177 688 22,028 22,716 (0.2%) (1.5%) (0.2%) (1.3%) (1.1%) Asian 6,084 189,684 1,991 193,776 195,767 (1.0%) (13.3%) (0.7%) (11.0%) (9.5%) White 13,484 140,444 4,879 149,049 153,928 (2.1%) (9.9%) (1.6%) (8.5%) (7.5%) Total 629,721 1,425,758 298,957 1,756,522 2,055,479 (100.0%) (100.0%) (100.0%) (100.0%) (100.0%) Row percentages 30.6% 69.4% 14.5% 85.5% 100.0%
Source: IES/LFS 2000
The average household size of agricultural households in KwaZulu-Natal ranges from 4.8 (strict) to 5.6 (broad), which is higher than the provincial average of 4.4 members. This means that the provincial share of people living in agricultural households is actually larger than the share of households defined as agricultural. Table 5 shows that between 1.38 million and 3.38 million people live in agricultural households, representing 15.3% and 37.6% of the provincial population respectively. About 339,841 people in KwaZulu-Natal are classified as agricultural workers, loosely defined as skilled agriculture workers and/or people working in the agricultural industry, either in an informal or formal capacity, and reporting a positive wage or salary for the year 2000. This figure represents 14.8% of KwaZulu-Natal’s workforce.
Table 5: Agricultural population by race (broad and strict definitions)
Population living in agricultural
households (broad) Percentages
Population living in agricultural
households (strict) Percentages
Population defined as
agricultural workers Percentages
African 3,290,430 (97.4%) 1,350,332 (98.1%) 323,740 (95.3%) Coloured 12,072 (0.4%) 2,198 (0.2%) 1,480 (0.4%) Asian 28,720 (0.9%) 5,389 (0.4%) 3,149 (0.9%) White 46,865 (1.4%) 18,318 (1.3%) 11,471 (3.4%) Total 3,378,088 (100.0%) 1,376,236 (100.0%) 339,841 (100.0%) Source: IES/LFS 2000.
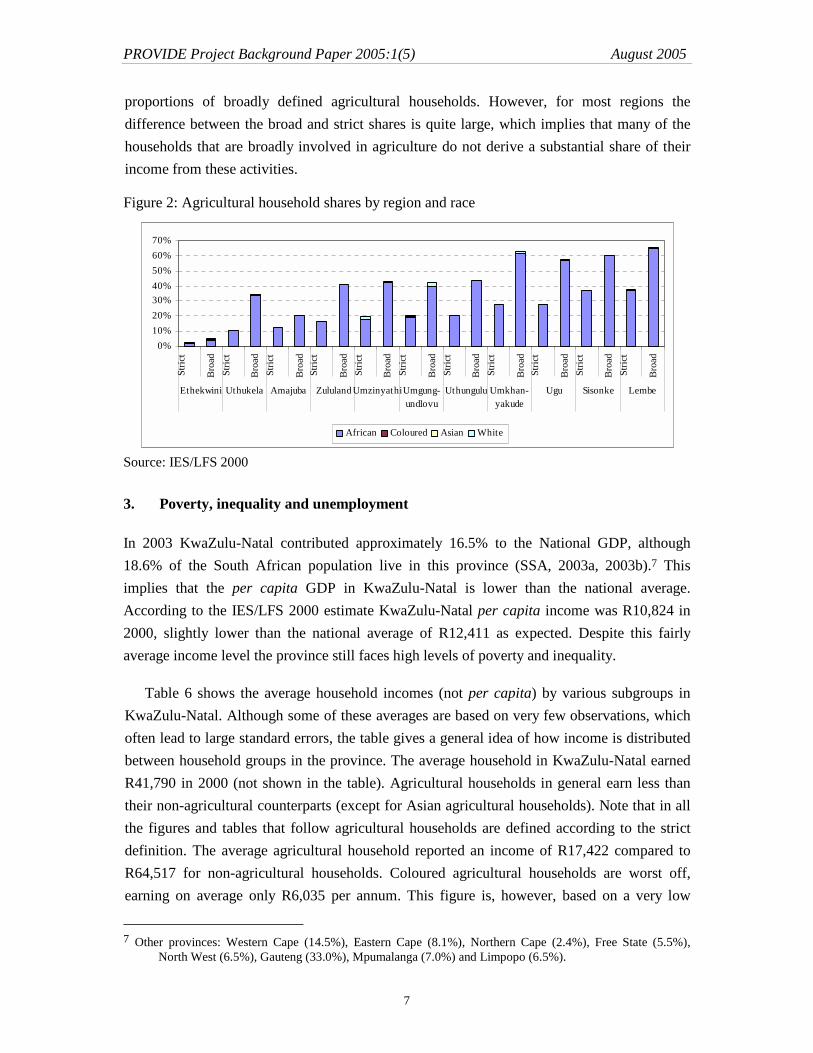
Figure 2 shows, for each region, the proportion of households that are strictly or broadly defined as agricultural households. In this figure municipal districts are ranked from lowest to highest strict agricultural household share. The figure also provides a racial breakdown of agricultural households (compare Table 4). By far the majority of agricultural households in all regions are African. Regions such as Ugu, Sisonke, Umkhanyakude and Lembe have large
PROVIDE Project Background Paper 2005:1(5) August 2005
7
proportions of broadly defined agricultural households. However, for most regions the difference between the broad and strict shares is quite large, which implies that many of the households that are broadly involved in agriculture do not derive a substantial share of their income from these activities.
Figure 2: Agricultural household shares by region and race
0%10%20%30%40%50%60%70%
Stric
t
Bro
adSt
rict
Bro
adSt
rict
Bro
adSt
rict
Bro
adSt
rict
Bro
adSt
rict
Bro
adSt
rict
Bro
adSt
rict
Bro
adSt
rict
Bro
adSt
rict
Bro
adSt
rict
Bro
ad
Ethekwini Uthukela Amajuba Zululand UmzinyathiUmgung-undlovu
Uthungulu Umkhan-yakude
Ugu Sisonke Lembe
African Coloured Asian White
Source: IES/LFS 2000
3. Poverty, inequality and unemployment
In 2003 KwaZulu-Natal contributed approximately 16.5% to the National GDP, although 18.6% of the South African population live in this province (SSA, 2003a, 2003b).7 This implies that the per capita GDP in KwaZulu-Natal is lower than the national average. According to the IES/LFS 2000 estimate KwaZulu-Natal per capita income was R10,824 in 2000, slightly lower than the national average of R12,411 as expected. Despite this fairly average income level the province still faces high levels of poverty and inequality.
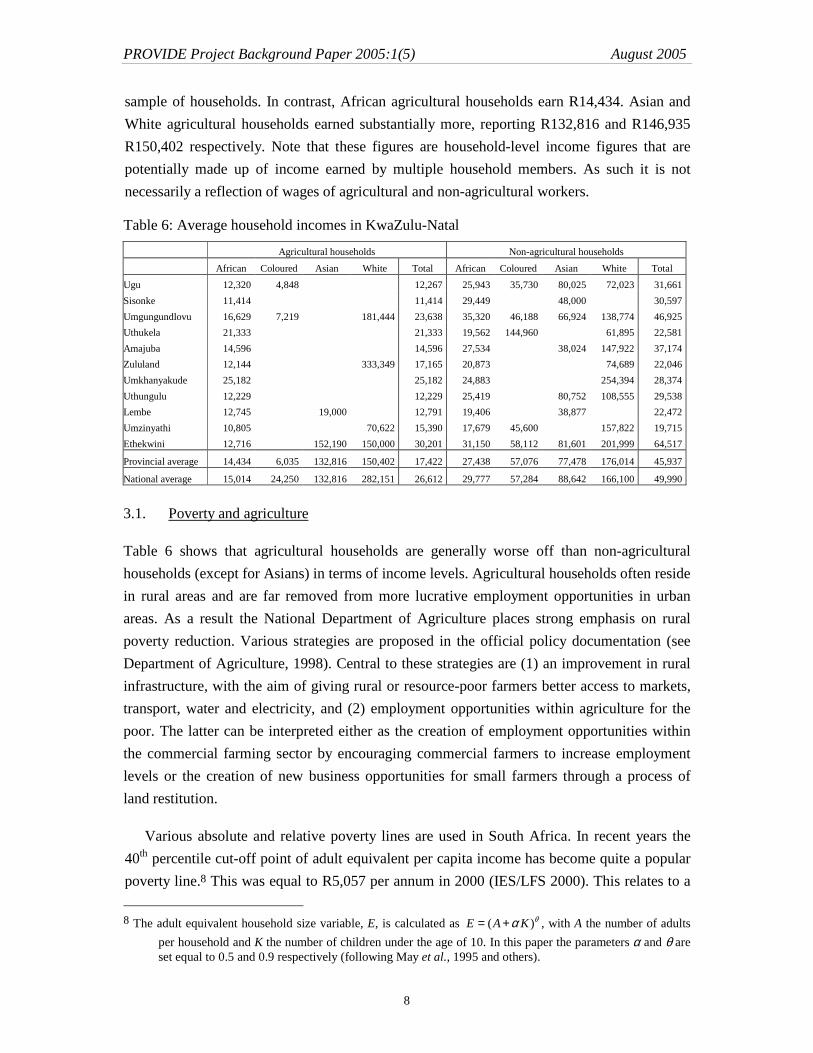
Table 6 shows the average household incomes (not per capita) by various subgroups in KwaZulu-Natal. Although some of these averages are based on very few observations, which often lead to large standard errors, the table gives a general idea of how income is distributed between household groups in the province. The average household in KwaZulu-Natal earned R41,790 in 2000 (not shown in the table). Agricultural households in general earn less than their non-agricultural counterparts (except for Asian agricultural households). Note that in all the figures and tables that follow agricultural households are defined according to the strict definition. The average agricultural household reported an income of R17,422 compared to R64,517 for non-agricultural households. Coloured agricultural households are worst off, earning on average only R6,035 per annum. This figure is, however, based on a very low
7 Other provinces: Western Cape (14.5%), Eastern Cape (8.1%), Northern Cape (2.4%), Free State (5.5%),
North West (6.5%), Gauteng (33.0%), Mpumalanga (7.0%) and Limpopo (6.5%).
PROVIDE Project Background Paper 2005:1(5) August 2005
8
sample of households. In contrast, African agricultural households earn R14,434. Asian and White agricultural households earned substantially more, reporting R132,816 and R146,935 R150,402 respectively. Note that these figures are household-level income figures that are potentially made up of income earned by multiple household members. As such it is not necessarily a reflection of wages of agricultural and non-agricultural workers.
Table 6: Average household incomes in KwaZulu-Natal Agricultural households Non-agricultural households African Coloured Asian White Total African Coloured Asian White Total Ugu 12,320 4,848 12,267 25,943 35,730 80,025 72,023 31,661Sisonke 11,414 11,414 29,449 48,000 30,597Umgungundlovu 16,629 7,219 181,444 23,638 35,320 46,188 66,924 138,774 46,925Uthukela 21,333 21,333 19,562 144,960 61,895 22,581Amajuba 14,596 14,596 27,534 38,024 147,922 37,174Zululand 12,144 333,349 17,165 20,873 74,689 22,046Umkhanyakude 25,182 25,182 24,883 254,394 28,374Uthungulu 12,229 12,229 25,419 80,752 108,555 29,538Lembe 12,745 19,000 12,791 19,406 38,877 22,472Umzinyathi 10,805 70,622 15,390 17,679 45,600 157,822 19,715Ethekwini 12,716 152,190 150,000 30,201 31,150 58,112 81,601 201,999 64,517
Provincial average 14,434 6,035 132,816 150,402 17,422 27,438 57,076 77,478 176,014 45,937
National average 15,014 24,250 132,816 282,151 26,612 29,777 57,284 88,642 166,100 49,990
3.1. Poverty and agriculture
Table 6 shows that agricultural households are generally worse off than non-agricultural households (except for Asians) in terms of income levels. Agricultural households often reside in rural areas and are far removed from more lucrative employment opportunities in urban areas. As a result the National Department of Agriculture places strong emphasis on rural poverty reduction. Various strategies are proposed in the official policy documentation (see Department of Agriculture, 1998). Central to these strategies are (1) an improvement in rural infrastructure, with the aim of giving rural or resource-poor farmers better access to markets, transport, water and electricity, and (2) employment opportunities within agriculture for the poor. The latter can be interpreted either as the creation of employment opportunities within the commercial farming sector by encouraging commercial farmers to increase employment levels or the creation of new business opportunities for small farmers through a process of land restitution.
Various absolute and relative poverty lines are used in South Africa. In recent years the 40th percentile cut-off point of adult equivalent per capita income has become quite a popular poverty line.8 This was equal to R5,057 per annum in 2000 (IES/LFS 2000). This relates to a 8 The adult equivalent household size variable, E, is calculated as ( )E A K θα= + , with A the number of adults
per household and K the number of children under the age of 10. In this paper the parameters α and θ are set equal to 0.5 and 0.9 respectively (following May et al., 1995 and others).
PROVIDE Project Background Paper 2005:1(5) August 2005
9
poverty headcount ratio (defined as the proportion of the population living below the poverty line) for South Africa of 49.8% (IES/LFS 2000).9 The 20th percentile cut-off of adult equivalent income (R2,717 per annum) is sometimes used as the ‘ultra-poverty line’. About 28.2% of the South African population lives below this poverty line.
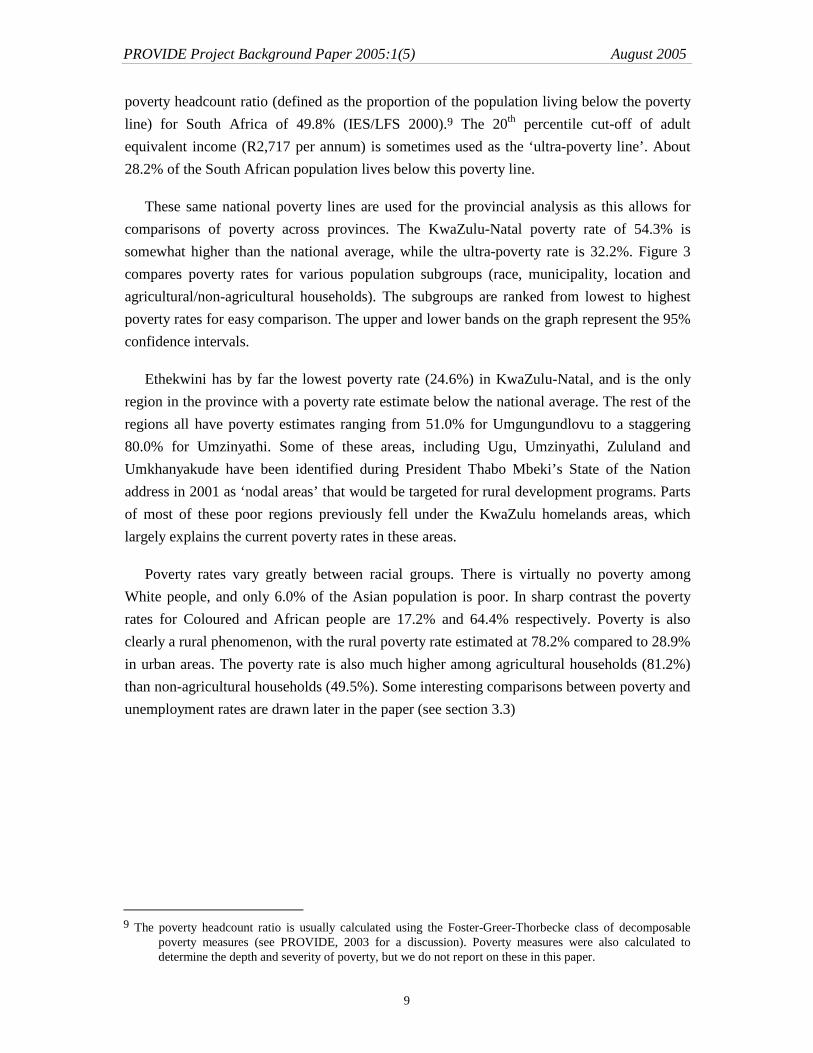
These same national poverty lines are used for the provincial analysis as this allows for comparisons of poverty across provinces. The KwaZulu-Natal poverty rate of 54.3% is somewhat higher than the national average, while the ultra-poverty rate is 32.2%. Figure 3 compares poverty rates for various population subgroups (race, municipality, location and agricultural/non-agricultural households). The subgroups are ranked from lowest to highest poverty rates for easy comparison. The upper and lower bands on the graph represent the 95% confidence intervals.
Ethekwini has by far the lowest poverty rate (24.6%) in KwaZulu-Natal, and is the only region in the province with a poverty rate estimate below the national average. The rest of the regions all have poverty estimates ranging from 51.0% for Umgungundlovu to a staggering 80.0% for Umzinyathi. Some of these areas, including Ugu, Umzinyathi, Zululand and Umkhanyakude have been identified during President Thabo Mbeki’s State of the Nation address in 2001 as ‘nodal areas’ that would be targeted for rural development programs. Parts of most of these poor regions previously fell under the KwaZulu homelands areas, which largely explains the current poverty rates in these areas.
Poverty rates vary greatly between racial groups. There is virtually no poverty among White people, and only 6.0% of the Asian population is poor. In sharp contrast the poverty rates for Coloured and African people are 17.2% and 64.4% respectively. Poverty is also clearly a rural phenomenon, with the rural poverty rate estimated at 78.2% compared to 28.9% in urban areas. The poverty rate is also much higher among agricultural households (81.2%) than non-agricultural households (49.5%). Some interesting comparisons between poverty and unemployment rates are drawn later in the paper (see section 3.3)
9 The poverty headcount ratio is usually calculated using the Foster-Greer-Thorbecke class of decomposable
poverty measures (see PROVIDE, 2003 for a discussion). Poverty measures were also calculated to determine the depth and severity of poverty, but we do not report on these in this paper.
PROVIDE Project Background Paper 2005:1(5) August 2005
10
Figure 3: Poverty rates by population subgroups
0.000.100.200.300.400.500.600.700.800.901.00
Ethekwini
Rest of S
A
Umgung
undlo
vu
Amajuba
Uthungu
lu
Uthukela Ugu
Lembe
Sisonk
e
Umkhanyak
ude
Zululan
d
Umzinyat
hi
Upper bound Estimate Lower bound
0.00
0.10
0.20
0.30
0.40
0.50
0.60
0.70
0.80
White Asian Coloured African
Upper bound Estimate Lower bound
0.00
0.10
0.20
0.30
0.40
0.50
0.60
0.70
0.80
0.90
Urban Rural
Upper bound Estimate Lower bound
0.00
0.10
0.20
0.30
0.40
0.50
0.60
0.70
0.80
0.90
Non-agricultural households Agricultural households
Upper bound Estimate Lower bound
Source: IES/LFS 2000 Note: The poverty headcount ratios show the proportion of people living in poverty and not the
proportion of households.
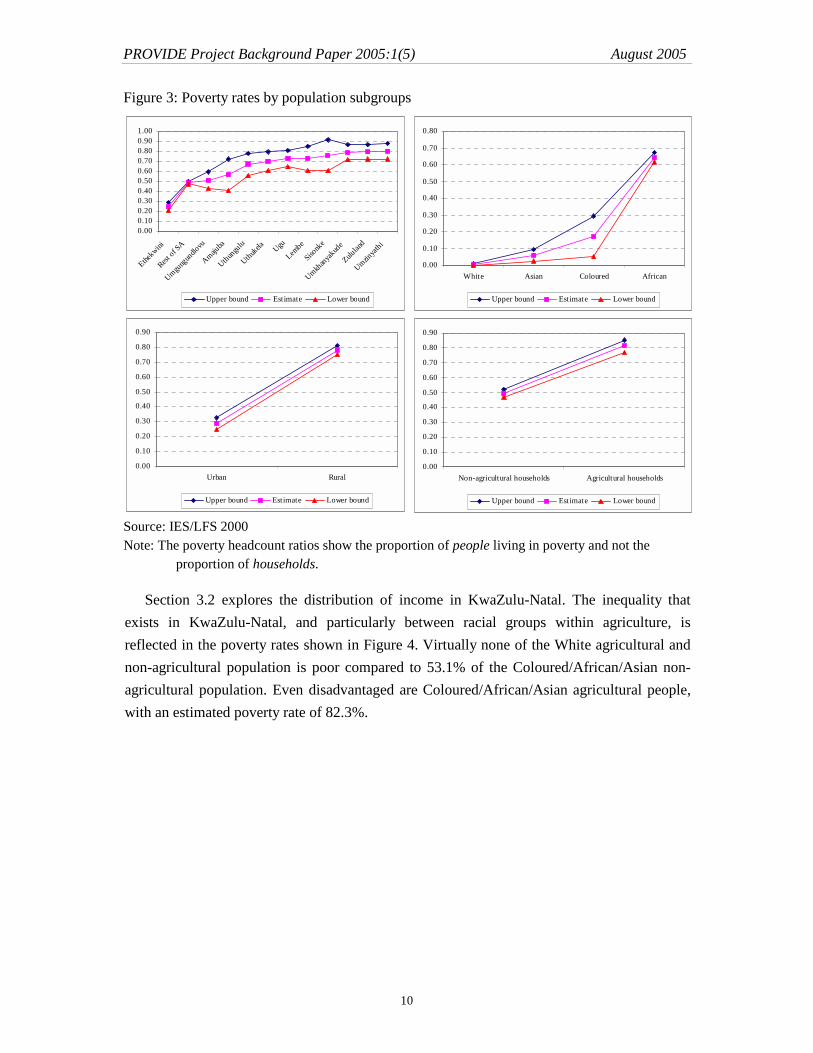
Section 3.2 explores the distribution of income in KwaZulu-Natal. The inequality that exists in KwaZulu-Natal, and particularly between racial groups within agriculture, is reflected in the poverty rates shown in Figure 4. Virtually none of the White agricultural and non-agricultural population is poor compared to 53.1% of the Coloured/African/Asian non-agricultural population. Even disadvantaged are Coloured/African/Asian agricultural people, with an estimated poverty rate of 82.3%.
PROVIDE Project Background Paper 2005:1(5) August 2005
11
Figure 4: Poverty rates by race and agricultural/non-agricultural population
0.00
0.10
0.20
0.30
0.40
0.50
0.60
0.70
0.80
0.90
1.00
White agric White non-agric Afr/Col/Asi non-agric Afr/Col/Asi agric
Upper bound Estimate Lower bound
Source: IES/LFS 2000
3.2. Inequality in the distribution of income
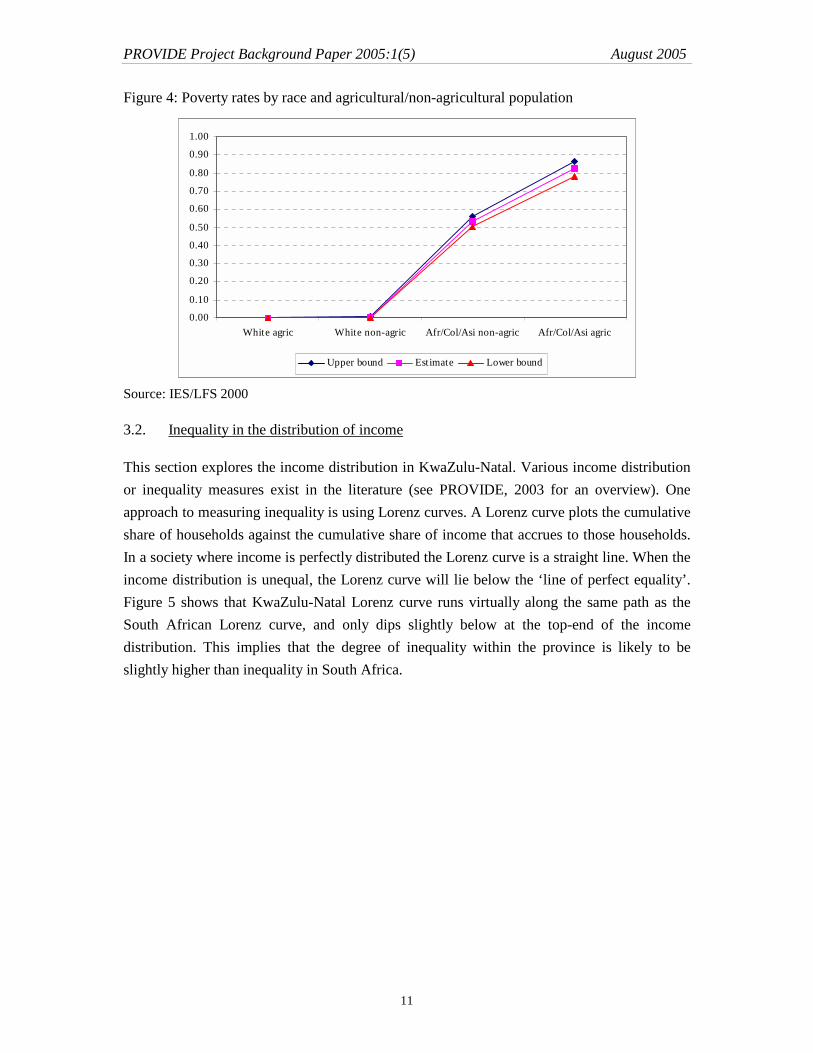
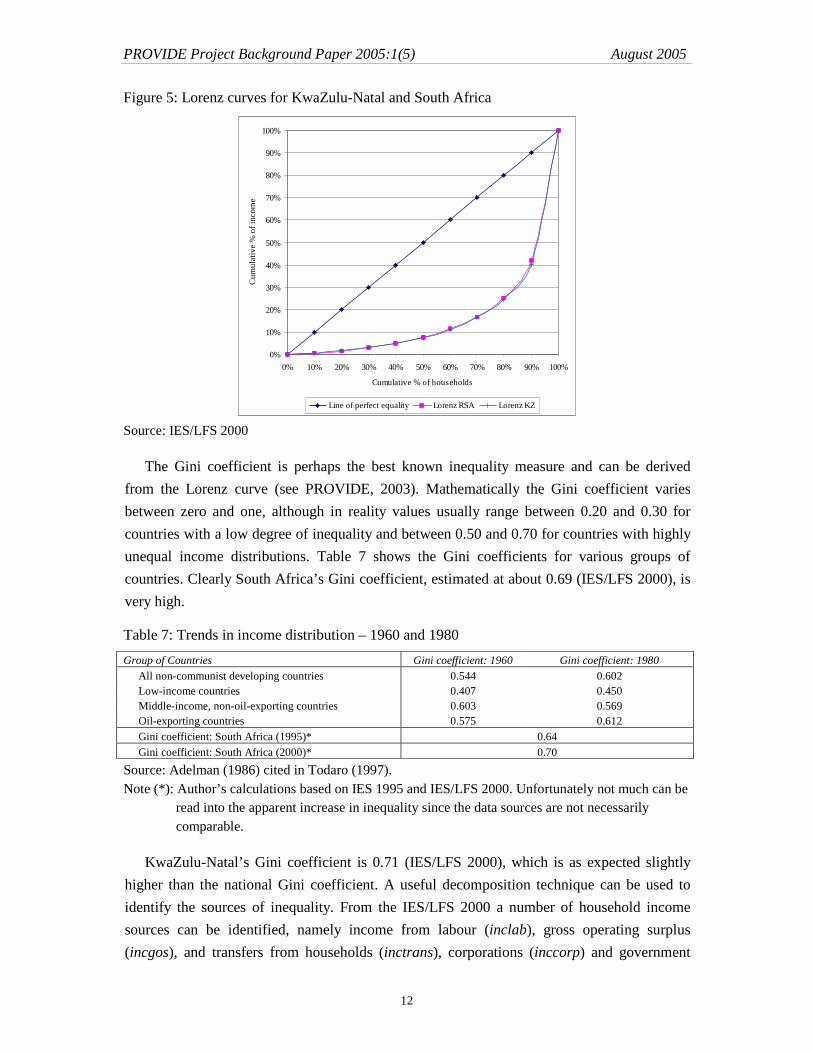
This section explores the income distribution in KwaZulu-Natal. Various income distribution or inequality measures exist in the literature (see PROVIDE, 2003 for an overview). One approach to measuring inequality is using Lorenz curves. A Lorenz curve plots the cumulative share of households against the cumulative share of income that accrues to those households. In a society where income is perfectly distributed the Lorenz curve is a straight line. When the income distribution is unequal, the Lorenz curve will lie below the ‘line of perfect equality’. Figure 5 shows that KwaZulu-Natal Lorenz curve runs virtually along the same path as the South African Lorenz curve, and only dips slightly below at the top-end of the income distribution. This implies that the degree of inequality within the province is likely to be slightly higher than inequality in South Africa.
PROVIDE Project Background Paper 2005:1(5) August 2005
12
Figure 5: Lorenz curves for KwaZulu-Natal and South Africa
0%
10%
20%
30%
40%
50%
60%
70%
80%
90%
100%
0% 10% 20% 30% 40% 50% 60% 70% 80% 90% 100%
Cumulative % of households
Cum
ulat
ive
% o
f inc
ome
Line of perfect equality Lorenz RSA Lorenz KZ
Source: IES/LFS 2000
The Gini coefficient is perhaps the best known inequality measure and can be derived from the Lorenz curve (see PROVIDE, 2003). Mathematically the Gini coefficient varies between zero and one, although in reality values usually range between 0.20 and 0.30 for countries with a low degree of inequality and between 0.50 and 0.70 for countries with highly unequal income distributions. Table 7 shows the Gini coefficients for various groups of countries. Clearly South Africa’s Gini coefficient, estimated at about 0.69 (IES/LFS 2000), is very high.
Table 7: Trends in income distribution – 1960 and 1980 Group of Countries Gini coefficient: 1960 Gini coefficient: 1980
All non-communist developing countries 0.544 0.602 Low-income countries 0.407 0.450 Middle-income, non-oil-exporting countries 0.603 0.569 Oil-exporting countries 0.575 0.612 Gini coefficient: South Africa (1995)* 0.64 Gini coefficient: South Africa (2000)* 0.70
Source: Adelman (1986) cited in Todaro (1997). Note (*): Author’s calculations based on IES 1995 and IES/LFS 2000. Unfortunately not much can be
read into the apparent increase in inequality since the data sources are not necessarily comparable.
KwaZulu-Natal’s Gini coefficient is 0.71 (IES/LFS 2000), which is as expected slightly higher than the national Gini coefficient. A useful decomposition technique can be used to identify the sources of inequality. From the IES/LFS 2000 a number of household income sources can be identified, namely income from labour (inclab), gross operating surplus (incgos), and transfers from households (inctrans), corporations (inccorp) and government
PROVIDE Project Background Paper 2005:1(5) August 2005
13
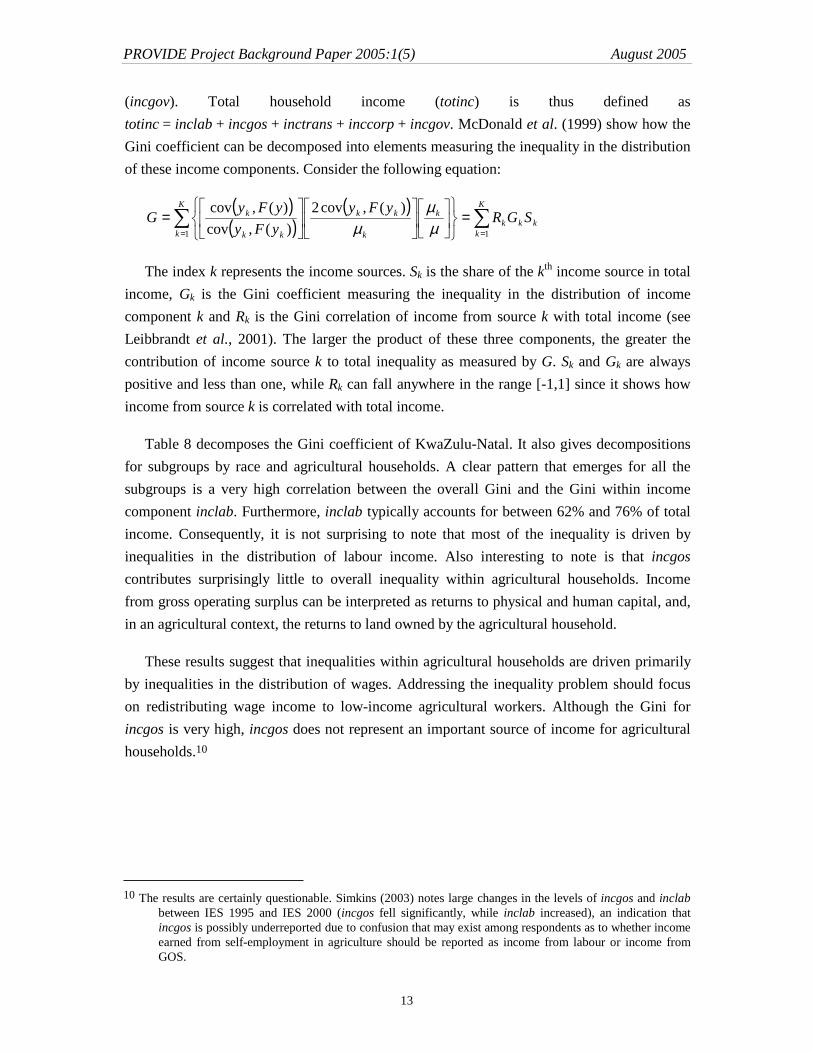
(incgov). Total household income (totinc) is thus defined as totinc = inclab + incgos + inctrans + inccorp + incgov. McDonald et al. (1999) show how the Gini coefficient can be decomposed into elements measuring the inequality in the distribution of these income components. Consider the following equation:
( )( )
( )∑∑
==
=
=
K
kkkk
K
k
k
k
kk
kk
k SGRyFyyFyyFyG
11
)(,cov2)(,cov)(,cov
µµ
µ
The index k represents the income sources. Sk is the share of the kth income source in total income, Gk is the Gini coefficient measuring the inequality in the distribution of income component k and Rk is the Gini correlation of income from source k with total income (see Leibbrandt et al., 2001). The larger the product of these three components, the greater the contribution of income source k to total inequality as measured by G. Sk and Gk are always positive and less than one, while Rk can fall anywhere in the range [-1,1] since it shows how income from source k is correlated with total income.
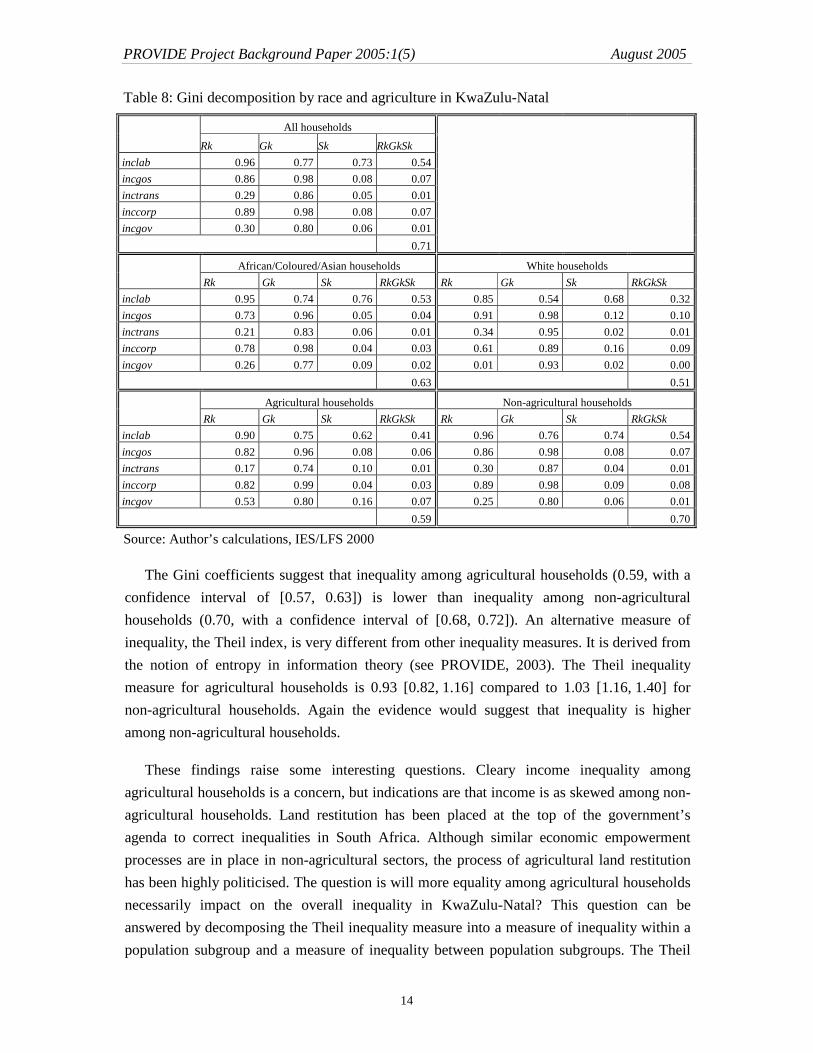
Table 8 decomposes the Gini coefficient of KwaZulu-Natal. It also gives decompositions for subgroups by race and agricultural households. A clear pattern that emerges for all the subgroups is a very high correlation between the overall Gini and the Gini within income component inclab. Furthermore, inclab typically accounts for between 62% and 76% of total income. Consequently, it is not surprising to note that most of the inequality is driven by inequalities in the distribution of labour income. Also interesting to note is that incgos contributes surprisingly little to overall inequality within agricultural households. Income from gross operating surplus can be interpreted as returns to physical and human capital, and, in an agricultural context, the returns to land owned by the agricultural household.
These results suggest that inequalities within agricultural households are driven primarily by inequalities in the distribution of wages. Addressing the inequality problem should focus on redistributing wage income to low-income agricultural workers. Although the Gini for incgos is very high, incgos does not represent an important source of income for agricultural households.10
10 The results are certainly questionable. Simkins (2003) notes large changes in the levels of incgos and inclab
between IES 1995 and IES 2000 (incgos fell significantly, while inclab increased), an indication that incgos is possibly underreported due to confusion that may exist among respondents as to whether income earned from self-employment in agriculture should be reported as income from labour or income from GOS.
PROVIDE Project Background Paper 2005:1(5) August 2005
14
Table 8: Gini decomposition by race and agriculture in KwaZulu-Natal
All households Rk Gk Sk RkGkSk
inclab 0.96 0.77 0.73 0.54 incgos 0.86 0.98 0.08 0.07 inctrans 0.29 0.86 0.05 0.01 inccorp 0.89 0.98 0.08 0.07 incgov 0.30 0.80 0.06 0.01
0.71
African/Coloured/Asian households White households Rk Gk Sk RkGkSk Rk Gk Sk RkGkSk
inclab 0.95 0.74 0.76 0.53 0.85 0.54 0.68 0.32 incgos 0.73 0.96 0.05 0.04 0.91 0.98 0.12 0.10 inctrans 0.21 0.83 0.06 0.01 0.34 0.95 0.02 0.01 inccorp 0.78 0.98 0.04 0.03 0.61 0.89 0.16 0.09 incgov 0.26 0.77 0.09 0.02 0.01 0.93 0.02 0.00
0.63 0.51
Agricultural households Non-agricultural households Rk Gk Sk RkGkSk Rk Gk Sk RkGkSk
inclab 0.90 0.75 0.62 0.41 0.96 0.76 0.74 0.54 incgos 0.82 0.96 0.08 0.06 0.86 0.98 0.08 0.07 inctrans 0.17 0.74 0.10 0.01 0.30 0.87 0.04 0.01 inccorp 0.82 0.99 0.04 0.03 0.89 0.98 0.09 0.08 incgov 0.53 0.80 0.16 0.07 0.25 0.80 0.06 0.01
0.59 0.70
Source: Author’s calculations, IES/LFS 2000
The Gini coefficients suggest that inequality among agricultural households (0.59, with a confidence interval of [0.57, 0.63]) is lower than inequality among non-agricultural households (0.70, with a confidence interval of [0.68, 0.72]). An alternative measure of inequality, the Theil index, is very different from other inequality measures. It is derived from the notion of entropy in information theory (see PROVIDE, 2003). The Theil inequality measure for agricultural households is 0.93 [0.82, 1.16] compared to 1.03 [1.16, 1.40] for non-agricultural households. Again the evidence would suggest that inequality is higher among non-agricultural households.
These findings raise some interesting questions. Cleary income inequality among agricultural households is a concern, but indications are that income is as skewed among non-agricultural households. Land restitution has been placed at the top of the government’s agenda to correct inequalities in South Africa. Although similar economic empowerment processes are in place in non-agricultural sectors, the process of agricultural land restitution has been highly politicised. The question is will more equality among agricultural households necessarily impact on the overall inequality in KwaZulu-Natal? This question can be answered by decomposing the Theil inequality measure into a measure of inequality within a population subgroup and a measure of inequality between population subgroups. The Theil
PROVIDE Project Background Paper 2005:1(5) August 2005
15
inequality measure (T) for KwaZulu-Natal population as a whole is 0.81. This figure can be decomposed as follows (see Leibbrandt et al., 2001):
∑ =+= n
i iiB TqTT1
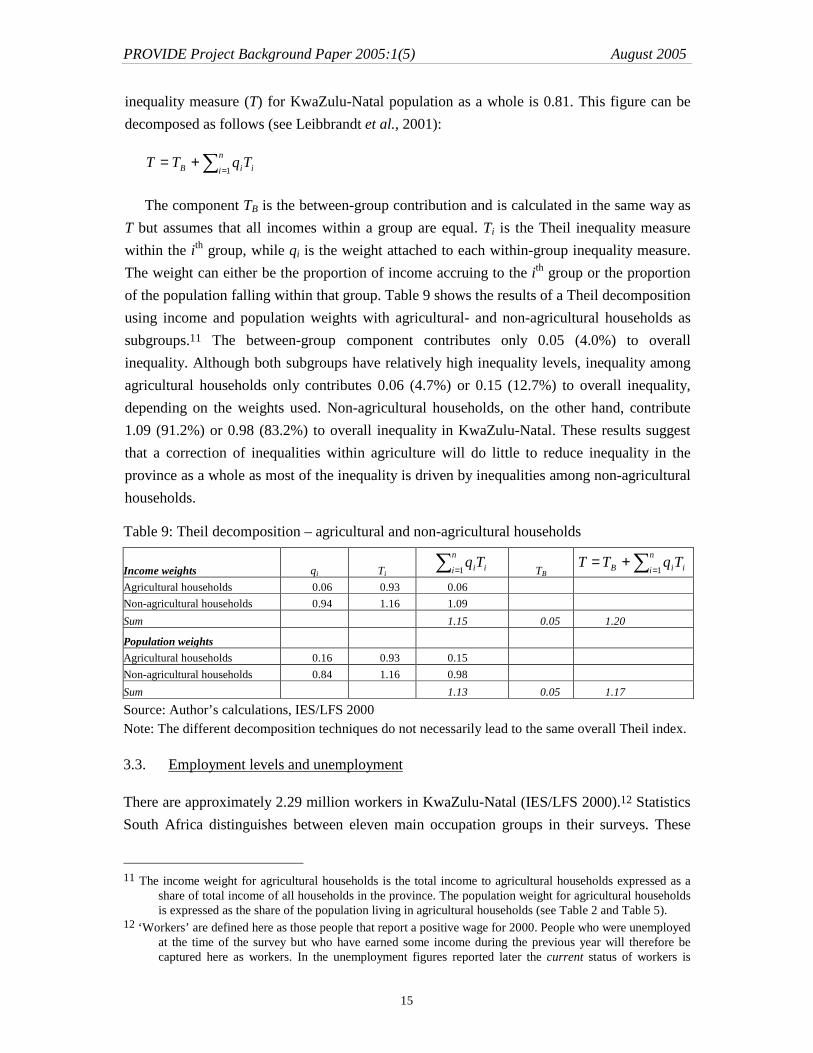
The component TB is the between-group contribution and is calculated in the same way as T but assumes that all incomes within a group are equal. Ti is the Theil inequality measure within the ith group, while qi is the weight attached to each within-group inequality measure. The weight can either be the proportion of income accruing to the ith group or the proportion of the population falling within that group. Table 9 shows the results of a Theil decomposition using income and population weights with agricultural- and non-agricultural households as subgroups.11 The between-group component contributes only 0.05 (4.0%) to overall inequality. Although both subgroups have relatively high inequality levels, inequality among agricultural households only contributes 0.06 (4.7%) or 0.15 (12.7%) to overall inequality, depending on the weights used. Non-agricultural households, on the other hand, contribute 1.09 (91.2%) or 0.98 (83.2%) to overall inequality in KwaZulu-Natal. These results suggest that a correction of inequalities within agriculture will do little to reduce inequality in the province as a whole as most of the inequality is driven by inequalities among non-agricultural households.
Table 9: Theil decomposition – agricultural and non-agricultural households
Income weights qi Ti ∑ =
n
i iiTq1
TB ∑ =+= n
i iiB TqTT1
Agricultural households 0.06 0.93 0.06 Non-agricultural households 0.94 1.16 1.09 Sum 1.15 0.05 1.20
Population weights Agricultural households 0.16 0.93 0.15 Non-agricultural households 0.84 1.16 0.98 Sum 1.13 0.05 1.17 Source: Author’s calculations, IES/LFS 2000 Note: The different decomposition techniques do not necessarily lead to the same overall Theil index.
3.3. Employment levels and unemployment
There are approximately 2.29 million workers in KwaZulu-Natal (IES/LFS 2000).12 Statistics South Africa distinguishes between eleven main occupation groups in their surveys. These
11 The income weight for agricultural households is the total income to agricultural households expressed as a
share of total income of all households in the province. The population weight for agricultural households is expressed as the share of the population living in agricultural households (see Table 2 and Table 5).
12 ‘Workers’ are defined here as those people that report a positive wage for 2000. People who were unemployed at the time of the survey but who have earned some income during the previous year will therefore be captured here as workers. In the unemployment figures reported later the current status of workers is
PROVIDE Project Background Paper 2005:1(5) August 2005
16
include (1) legislators, senior officials and managers; (2) professionals; (3) technical and associate professionals; (4) clerks; (5) service workers and shop and market sales workers; (6) skilled agricultural and fishery workers; (7) craft and related trades workers; (8) plant and machine operators and assemblers; (9) elementary occupations; (10) domestic workers; and (11) not adequately or elsewhere defined, unspecified.
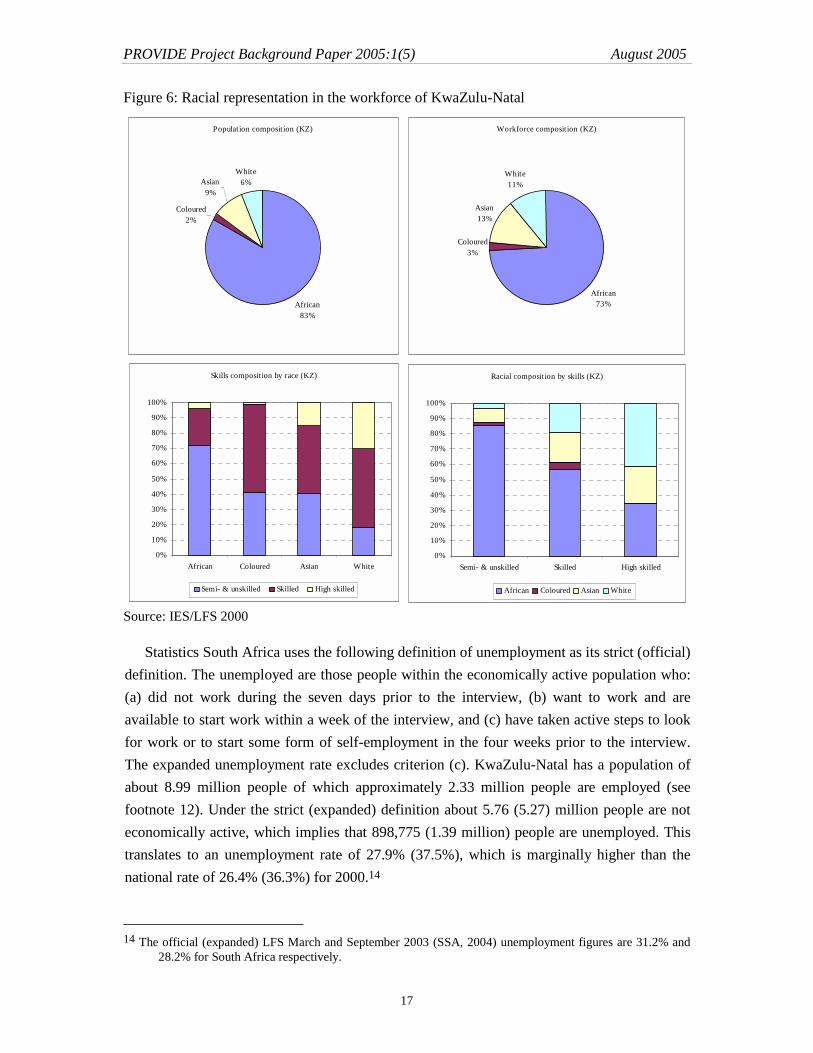
For simplification purposes the occupation groups are aggregated into various skill groups, namely high skilled (1 – 2), skilled (3 – 5), and semi- and unskilled (6 – 10).13 Figure 6 explores the racial composition of the workforce by race and skill and compares these figures with the provincial racial composition. As far as the overall racial distribution of the workforce is concerned, it is clear from the figures that African workers are under-represented. This becomes even more pronounced when looking at the racial representation within skills groups. African workers are typically found in the lower-skilled occupation groups, while White workers are more concentrated around the higher-skilled occupations. Clearly much still needs to be done in KwaZulu-Natal to bring the racial composition of the workforce more in line with the provincial-level population composition at all skills levels.
reported, irrespective of income earned. Employment figures reported here are therefore higher than the official employment figures.
13 Unspecified workers (code 11) are not included in a specific skill category since the highly dispersed average wage data suggests that these factors may in reality be distributed across the range of skill categories.
PROVIDE Project Background Paper 2005:1(5) August 2005
17
Figure 6: Racial representation in the workforce of KwaZulu-Natal
Population composition (KZ)
African83%
Coloured2%
Asian9%
White6%
Workforce composition (KZ)
African73%
Coloured3%
Asian13%
White11%
Skills composition by race (KZ)
0%
10%
20%
30%
40%
50%
60%
70%
80%
90%
100%
African Coloured Asian White
Semi- & unskilled Skilled High skilled
Racial composition by skills (KZ)
0%
10%
20%
30%
40%
50%
60%
70%
80%
90%
100%
Semi- & unskilled Skilled High skilled
African Coloured Asian White
Source: IES/LFS 2000
Statistics South Africa uses the following definition of unemployment as its strict (official) definition. The unemployed are those people within the economically active population who: (a) did not work during the seven days prior to the interview, (b) want to work and are available to start work within a week of the interview, and (c) have taken active steps to look for work or to start some form of self-employment in the four weeks prior to the interview. The expanded unemployment rate excludes criterion (c). KwaZulu-Natal has a population of about 8.99 million people of which approximately 2.33 million people are employed (see footnote 12). Under the strict (expanded) definition about 5.76 (5.27) million people are not economically active, which implies that 898,775 (1.39 million) people are unemployed. This translates to an unemployment rate of 27.9% (37.5%), which is marginally higher than the national rate of 26.4% (36.3%) for 2000.14
14 The official (expanded) LFS March and September 2003 (SSA, 2004) unemployment figures are 31.2% and
28.2% for South Africa respectively.
PROVIDE Project Background Paper 2005:1(5) August 2005
18
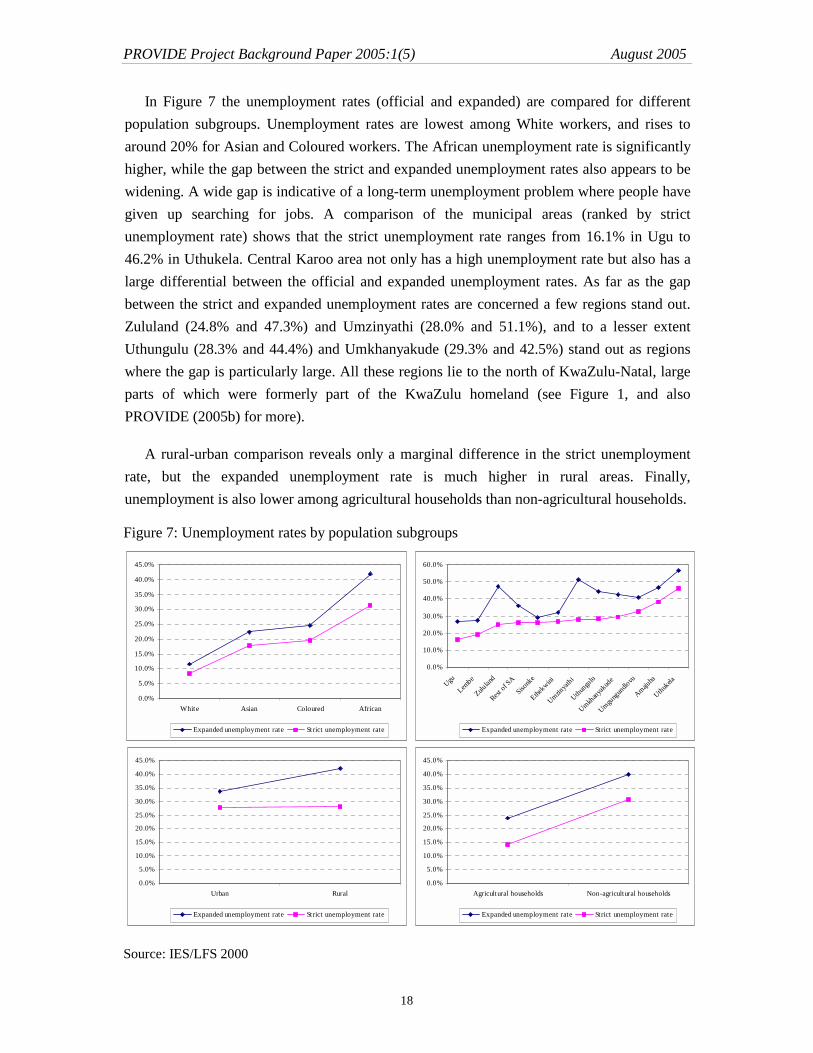
In Figure 7 the unemployment rates (official and expanded) are compared for different population subgroups. Unemployment rates are lowest among White workers, and rises to around 20% for Asian and Coloured workers. The African unemployment rate is significantly higher, while the gap between the strict and expanded unemployment rates also appears to be widening. A wide gap is indicative of a long-term unemployment problem where people have given up searching for jobs. A comparison of the municipal areas (ranked by strict unemployment rate) shows that the strict unemployment rate ranges from 16.1% in Ugu to 46.2% in Uthukela. Central Karoo area not only has a high unemployment rate but also has a large differential between the official and expanded unemployment rates. As far as the gap between the strict and expanded unemployment rates are concerned a few regions stand out. Zululand (24.8% and 47.3%) and Umzinyathi (28.0% and 51.1%), and to a lesser extent Uthungulu (28.3% and 44.4%) and Umkhanyakude (29.3% and 42.5%) stand out as regions where the gap is particularly large. All these regions lie to the north of KwaZulu-Natal, large parts of which were formerly part of the KwaZulu homeland (see Figure 1, and also PROVIDE (2005b) for more).
A rural-urban comparison reveals only a marginal difference in the strict unemployment rate, but the expanded unemployment rate is much higher in rural areas. Finally, unemployment is also lower among agricultural households than non-agricultural households.
Figure 7: Unemployment rates by population subgroups
0.0%
5.0%
10.0%
15.0%
20.0%
25.0%
30.0%
35.0%
40.0%
45.0%
White Asian Coloured African
Expanded unemployment rate Strict unemployment rate
0.0%
10.0%
20.0%
30.0%
40.0%
50.0%
60.0%
Ugu
Lembe
Zululan
d
Rest of S
A
Sisonk
e
Ethekwini
Umzinyat
hi
Uthungu
lu
Umkhanyak
ude
Umgung
undlo
vu
Amajuba
Uthukela
Expanded unemployment rate Strict unemployment rate
0.0%
5.0%
10.0%
15.0%
20.0%
25.0%
30.0%
35.0%
40.0%
45.0%
Urban Rural
Expanded unemployment rate Strict unemployment rate
0.0%
5.0%
10.0%
15.0%
20.0%
25.0%
30.0%
35.0%
40.0%
45.0%
Agricultural households Non-agricultural households
Expanded unemployment rate Strict unemployment rate
Source: IES/LFS 2000
PROVIDE Project Background Paper 2005:1(5) August 2005
19
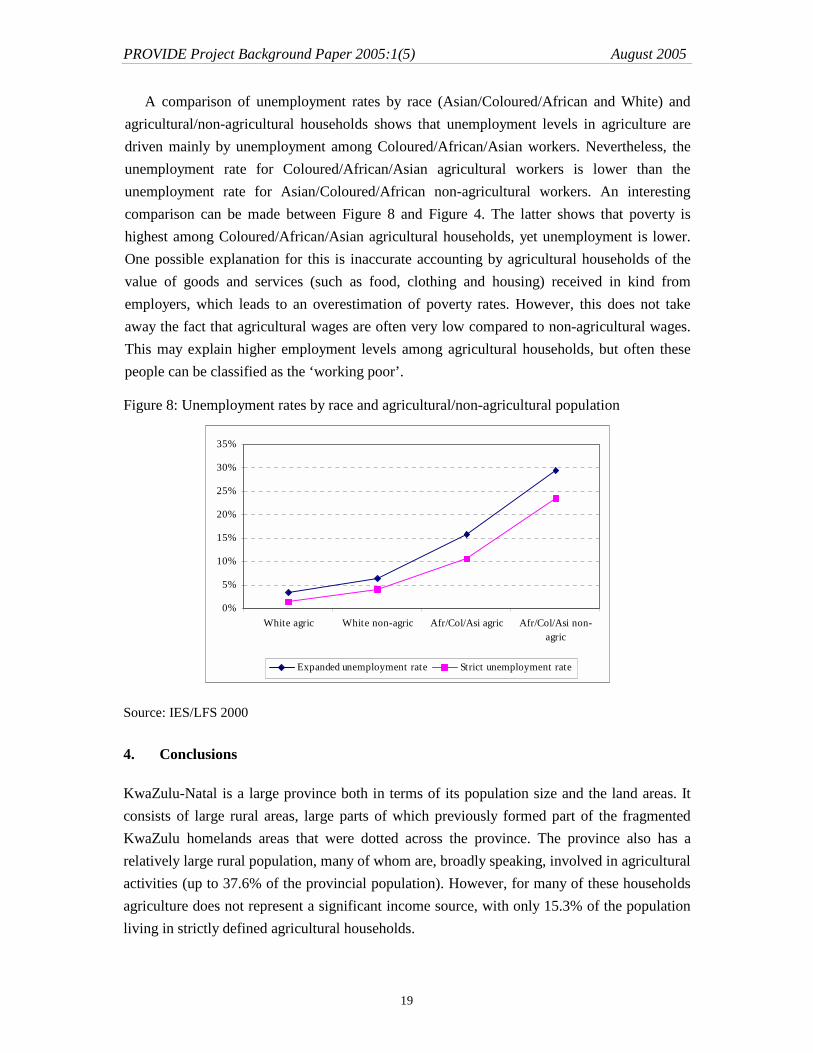
A comparison of unemployment rates by race (Asian/Coloured/African and White) and agricultural/non-agricultural households shows that unemployment levels in agriculture are driven mainly by unemployment among Coloured/African/Asian workers. Nevertheless, the unemployment rate for Coloured/African/Asian agricultural workers is lower than the unemployment rate for Asian/Coloured/African non-agricultural workers. An interesting comparison can be made between Figure 8 and Figure 4. The latter shows that poverty is highest among Coloured/African/Asian agricultural households, yet unemployment is lower. One possible explanation for this is inaccurate accounting by agricultural households of the value of goods and services (such as food, clothing and housing) received in kind from employers, which leads to an overestimation of poverty rates. However, this does not take away the fact that agricultural wages are often very low compared to non-agricultural wages. This may explain higher employment levels among agricultural households, but often these people can be classified as the ‘working poor’.
Figure 8: Unemployment rates by race and agricultural/non-agricultural population
0%
5%
10%
15%
20%
25%
30%
35%
White agric White non-agric Afr/Col/Asi agric Afr/Col/Asi non-agric
Expanded unemployment rate Strict unemployment rate
Source: IES/LFS 2000
4. Conclusions
KwaZulu-Natal is a large province both in terms of its population size and the land areas. It consists of large rural areas, large parts of which previously formed part of the fragmented KwaZulu homelands areas that were dotted across the province. The province also has a relatively large rural population, many of whom are, broadly speaking, involved in agricultural activities (up to 37.6% of the provincial population). However, for many of these households agriculture does not represent a significant income source, with only 15.3% of the population living in strictly defined agricultural households.
PROVIDE Project Background Paper 2005:1(5) August 2005
20
The per capita income of the people of KwaZulu-Natal does not compare badly with that of the rest of South Africa, but this income appears to be less equally distributed among the people. In particular, African and Coloured agricultural households are worse off than their non-agricultural counterparts. Furthermore, average household incomes of White, and to a lesser extent Asian households, are much higher than those of African and Coloured households. The province has relatively high poverty rates, especially in the former homelands areas. This implies that Africans in rural areas, often living in agricultural households, are mostly affected.
An interesting observation is that inequality among agricultural households is lower than inequality among non-agricultural households. The greater degree of equality possibly relates to the fact that many of the African agricultural households have access to communal or tribal land and as such the contribution of gross operating surplus (from land) to overall inequality among agricultural households is not as high as in some other parts of South Africa. Furthermore, much of the inequality in KwaZulu-Natal is driven by inequalities among non-agricultural households.
Finally, unemployment is most prevalent among Africans living in former homelands areas or rural areas. The fact that the expanded rate for these population sub-groups is much higher than the strict unemployment rate is indicative of a long-term structural unemployment problem. Interestingly though, unemployment among agricultural households is lower, possibly because family members would rather participate in the household farming activities than be unemployed. This of course reduces the per capita returns of farming, which explains in part why poverty is higher among agricultural household members.
5. References Department of Agriculture (1998). Agricultural Policy in South Africa. A Discussion
Document, Pretoria. Leibbrandt, M., Woolard, I. and Bhorat, H. (2001). "Understanding contemporary household
inequality in South Africa." In Fighting Poverty. Labour Markets and Inequality in South Africa, edited by Bhorat, H., Leibbrandt, M., Maziya, M., Van der Berg, S. and Woolard, I. Cape Town: UCT Press.
May, J., Carter, M.R. and Posel, D. (1995). "The composition and persistence of poverty in rural South Africa: an entitlements approach," Land and Agricultural Policy Centre Policy Paper No. 15.
McDonald, S., Piesse, J. and Van Zyl, J. (1999). "Exploring Income Distribution and Poverty in South Africa," South African Journal of Economics, 68(3): 423-454.
PROVIDE (2003). "Measures of Poverty and Inequality. A Reference Paper," PROVIDE Technical Paper Series, 2003:4. PROVIDE Project, Elsenburg. Available online at www.elsenburg.com/provide.
PROVIDE (2005a). "Creating an IES-LFS 2000 Database in Stata," PROVIDE Technical Paper Series, 2005:1. PROVIDE Project, Elsenburg. Available online at www.elsenburg.com/provide.
PROVIDE Project Background Paper 2005:1(5) August 2005
21
PROVIDE (2005b). "Forming Representative Household Groups in a SAM," PROVIDE Technical Paper Series, 2005:2. PROVIDE Project, Elsenburg. Available online at www.elsenburg.com/provide.
Simkins, C. (2003). "A Critical Assessment of the 1995 and 2000 Income and Expenditure Surveys as Sources of Information on Incomes," Mimeo.
SSA (2002a). Income and Expenditure Survey 2000, Pretoria: Statistics South Africa. SSA (2002b). Labour Force Survey September 2000, Pretoria: Statistics South Africa. SSA (2003a). Census 2001, Pretoria: Statistics South Africa. SSA (2003b). Gross Domestic Product, Statistical Release P0441, 25 November 2003,
Pretoria: Statistics South Africa. SSA (2004). Labour Force Survey, September 2003, Pretoria: Statistics South Africa. Todaro, M.P. (1997). Economic Development, 6th Edition. Longman: London.
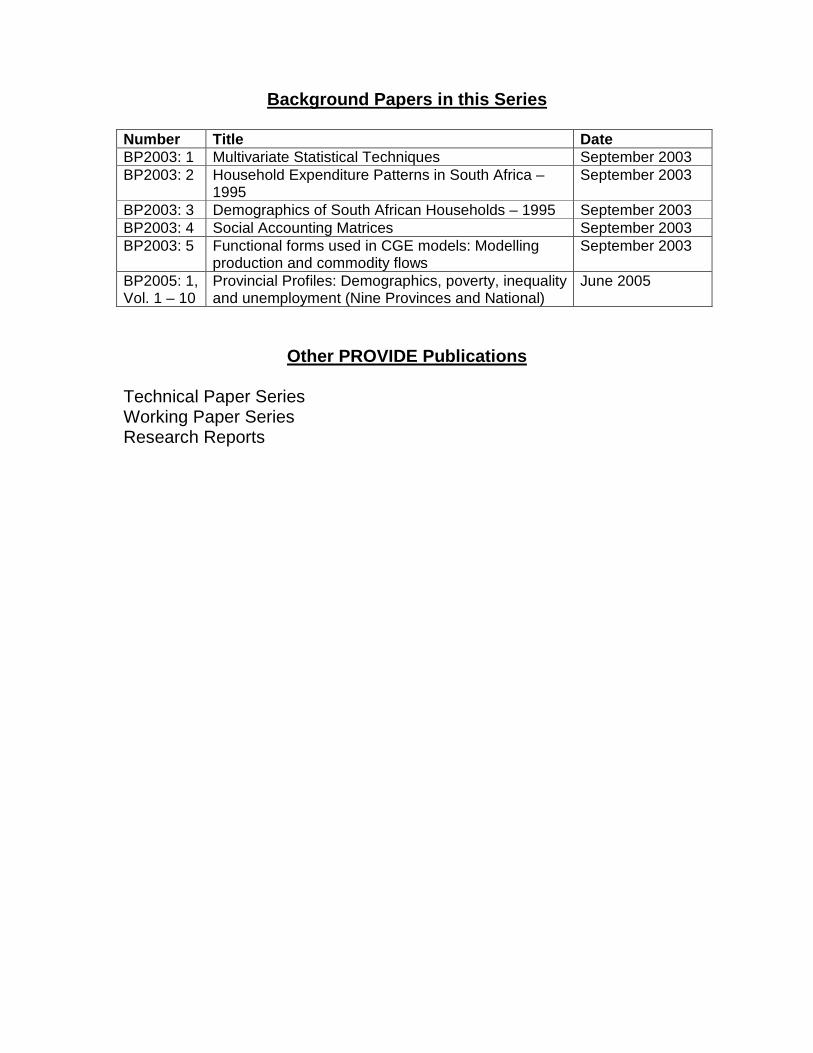
Background Papers in this Series Number Title Date BP2003: 1 Multivariate Statistical Techniques September 2003 BP2003: 2 Household Expenditure Patterns in South Africa –
1995 September 2003
BP2003: 3 Demographics of South African Households – 1995 September 2003 BP2003: 4 Social Accounting Matrices September 2003 BP2003: 5 Functional forms used in CGE models: Modelling
production and commodity flows September 2003
BP2005: 1, Vol. 1 – 10
Provincial Profiles: Demographics, poverty, inequality and unemployment (Nine Provinces and National)
June 2005
Other PROVIDE Publications Technical Paper Series Working Paper Series Research Reports