Embed Size (px)
Citation preview

A Profile of Banks2012-13
Reserve Bank of India

Copies of this publication are available from the Director,Division of Reports and Knowledge Dissemination (Sales Section)
Department of Economic and Policy Research, Reserve Bank of India,Amar Building (Ground Floor), Fort,
Post Box No. 1036, Mumbai – 400 001.Telephone : (022) 2260 3000 [Ext. : 4002] Fax : (022) 2263 2110
Email : [email protected]
PRICEInland : (i) ` 80 (Inclusive of postage)Inland : (ii) ` 110 (Inclusive of postage)Abroad : (i) US $ 7 (Inclusive of courier charges)
Cheque/Drafts should be drawn in favour of “Reserve Bank of India”Payable at Mumbai

Explanatory Notes
This publication provides quick data on select important items on scheduled commercial banks, excluding regional rural banks, from 2008-09 to 2012-13. This is the ninth volume in the series; first volume of the series was published for the year 2004-05.
1. Data definitions (also refer to item no. 3) 1.1. Capital, reserves & surplus, deposits, investments, advances, interest income, interest expended and operating expenses are as
in annual accounts of banks.
1.2. Business (defined as deposits plus advances) per employee, profit per employee, return on assets, capital adequacy ratio [capital to risk weighted assets ratio (CRAR)] and net non-performing assets (NPAs) as percentage of net advances (Net NPA ratio) are from ‘Notes on Accounts’ of annual accounts.
1.3. For the years 2008-09 to 2012-13, bank-wise CRAR is given as per Basel-II.
1.4. Number of offices includes branches and administrative offices.
1.5. Cost of Funds (CoF) is defined as the ratio (in %) of interest paid on deposits and borrowings to average of opening and closing balances of deposits and borrowings for the respective years.
1.6. Cost adjusted return on advances is CoF subtracted from return on advances, where return on advances is defined as the ratio (in %) of interest earned on advances to average of opening and closing balances of advances for the respective years.
1.7. Wages as percentage to total expenses is computed as the ratio (in %) of payment to and provisions for employees to total ex-penses.
1.8. Net Interest Margin is defined as ratio (in %) of Net Interest Income to Total Assets.
1.9. Return on Equity are computed as ratio (in %) of Net Profit to total of Capital and Reserves & Surplus.
2. Bank group level aggregates 2.1 Bank group level aggregates have been computed from respective items at bank level. Computation of ratios follows definitions
similar to those of bank level ratios; that is ratios of corresponding aggregates at bank group level. More specific details are as follows:
i) Business per employee (or profit per employee) is computed by dividing the total business (or profit) for the group by the number of employees in the group.

ii) CoF is computed as the ratio (in %) of interest paid on deposits and borrowings to average of opening and closing balances of deposits and borrowings of the respective years.
iii) Return on advances adjusted to CoF is computed by subtracting CoF for the group from return on advances for the group; the latter is computed as the ratio (in %) of interest earned on advances by the group to average of opening and closing bal-ances of total advances of the group.
iv) Return on assets (in %) for a group is obtained as weighted average of return on assets of individual banks in the group, weights being the proportion of total assets of the bank as percentage to total assets of the group.
v) Capital adequacy ratios for the bank groups have been obtained from OSMOS, Department of Banking Supervision, RBI.
3. General 3.1 IDBI Bank Ltd., a public sector bank, is clubbed along with nationalised banks.
3.2 The name of Oman International Bank has been changed to HSBC Bank Oman S.A.O.G with effect from June 3, 2012.
3.3 The Foreign Bank ‘Westpac Banking Corporation’ was included in the second schedule to the RBI Act, 1934 with effect from January 12, 2013.
3.4 The Foreign Bank ‘Sumitomo Mitsui Banking Corporation’ was included in the second schedule to the RBI Act, 1934 with effect from February 2, 2013.
3.5 For quick comparison, bank group aggregates and all banks’ aggregates for 2012-13 are given against every bank.
3.6 Wherever appropriate, denominators in the ratios use average of “current year” and “previous year” .For instance, ratio of Net In-terest Margin to total assets for the year 2012-13 uses denominator as average of total assets for the years 2011-12 and 2012-13
3.7 The symbol ‘0.00’ indicates nil or negligible or not applicable or not available.
4. Data sources 4.1 Most of the data presented in the publication are from annual accounts of banks.
4.2 Data on number of offices are from Master Office File (as on September 04, 2013), Department of Statistics and Information Man-agement, RBI.
4.3 Data on number of employees are as reported by respective banks.

Table of ContentsBank Group wise Page No. Bank wise : Nationalised Banks Page No.i. All Scheduled Commercial Banks 1 xiv. Punjab and Sind Bank 28ii. Public Sector Banks 2 xv. Punjab National Bank 29
(a) SBI & Associates 3 xvi. Syndicate Bank 30(b) Nationalised Banks 4 xvii. UCO Bank 31
iii. Private Sector Banks 5 xviii. Union Bank of India 32(a) Old Private Sector Banks 6 xix. United Bank of India 33(b) New Private Sector Banks 7 xx. Vijaya Bank 34
iv. Foreign Banks 8 Bank wise : Old Private Sector BanksBank wise: SBI & Associates i. Catholic Syrian Bank 35i. State Bank of India 9 ii. City Union Bank 36ii. State Bank of Bikaner & Jaipur 10 iii. Dhanlaxmi Bank 37iii. State Bank of Hyderabad 11 iv. Federal Bank 38iv. State Bank of Mysore 12 v. ING Vysya Bank 39v. State Bank of Patiala 13 vi. Jammu & Kashmir Bank 40vi. State Bank of Travancore 14 vii. Karnataka Bank 41Bank wise : Nationalised Banks viii. Karur Vysya Bank 42i. Allahabad Bank 15 ix. Lakshmi Vilas Bank 43ii. Andhra Bank 16 x. Nainital Bank 44iii. Bank of Baroda 17 xi. Ratnakar Bank 45iv. Bank of India 18 xii. South Indian Bank 46v. Bank of Maharashtra 19 xiii. Tamilnad Mercantile Bank 47vi. Canara Bank 20 Bank wise : New Private Sector Banksvii. Central Bank of India 21 i. Axis Bank 48viii. Corporation Bank 22 ii. Development Credit Bank 49ix. Dena Bank 23 iii. HDFC Bank 50x. IDBI Bank Ltd. 24 iv. ICICI Bank 51xi. Indian Bank 25 v. IndusInd Bank 52xii. Indian Overseas Bank 26 vi. Kotak Mahindra Bank 53xiii. Oriental Bank of Commerce 27 vii. Yes Bank 54

Table of Contents (contd..)Bank wise: Foreign Banks Page No. Page No.i. AB Bank 55 xxx. National Australia Bank 84ii. Abu Dhabi Commercial Bank 56 xxxi. Rabobank International 85iii. American Express Banking Corp. 57 xxxii. Royal Bank of Scotland 86iv. Antwerp Diamond Bank 58 xxxiii. Sberbank 87v. Australia And New Zealand Banking Group 59 xxxiv. Shinhan Bank 88vi. Bank Internasional Indonesia 60 xxxv. Societe Generale 89vii. Bank of America 61 xxxvi. Sonali Bank 90viii. Bank of Bahrain & Kuwait 62 xxxvii. Standard Chartered Bank 91ix. Bank of Ceylon 63 xxxviii. State Bank of Mauritius 92x. Bank of Nova Scotia 64 xxxix. Sumitomo Mitsui Banking Corporation 93xi. Bank of Tokyo-Mitsubishi UFJ 65 xl. UBS AG 94xii. Barclays Bank 66 xli. United Overseas Bank 95xiii. BNP Paribas 67 xlii. Westpac Banking Corporation 96xiv. Chinatrust Commercial Bank 68 xliii. Woori Bank 97xv. Citibank 69xvi. Commonwealth Bank of Australia 70xvii. Credit Agricole 71xviii. Credit Suisse AG 72xix. DBS Bank 73xx. Deutsche Bank 74xxi. FirstRand Bank 75xxii. Hongkong & Shanghai Banking Corporation 76xxiii. HSBC Bank Oman S.A.O.G 77xxiv. Industrial And Commercial Bank of China 78xxv. JP Morgan Chase Bank 79xxvi. JSC VTB Bank 80xxvii. Krung Thai Bank 81xxviii. Mashreqbank 82xxix. Mizuho Corporate Bank 83

1
All Scheduled Commercial Banks(Amount in ` Million)
Items 2008-09 2009-10 2010-11 2011-12 2012-13No. of banks 80 81 81 87 89No. of offices 67562 72906 78215 85262 92114No. of employees 954684 955990 1001096 1048520 1096984Business per employee 73.98 86.23 99.03 109.95 121.33Profit per employee 0.55 0.60 0.70 0.78 0.83
Capital and Reserve & Surplus 3679473 4301613 5099192 6085618 7089300Deposits 40632011 47469196 56158743 64535485 74295324Investments 14495506 17290059 19236333 22339033 26132752Advances 29999239 34967200 42974875 50735592 58797025
Interest Income 3884816 4151786 4913407 6552839 7636115Other income 752204 792676 798501 863437 977866Interest expended 2632232 2720836 2989248 4303557 5138027Operating expenses 895814 1000279 1231403 1375720 1565855Net Interest Margin 2.62 2.54 2.91 2.90 2.79
Cost of Funds (CoF) 5.99 5.10 4.75 5.90 6.12Return on advances adjusted to COF 4.56 4.19 4.47 4.51 4.21Wages as % to total expenses 13.60 14.85 17.22 13.73 13.02
Return on Equity 15.44 14.31 14.96 14.60 13.84Return on Assets 1.13 1.05 1.10 1.08 1.03CRAR 13.97 14.54 14.19 14.24 13.88Net NPA ratio 1.05 1.12 0.97 1.28 1.68

2
Public Sector Banks(Amount in ` Million)
Items 2008-09 2009-10 2010-11 2011-12 2012-13No. of banks 27 27 26 26 26No. of offices 57979 62080 65800 70969 75779No. of employees 731524 739646 755102 774329 801659Business per employee 73.44 86.43 101.67 114.68 127.47Profit per employee 0.47 0.53 0.59 0.64 0.63
Capital and Reserve & Surplus 2083419 2410014 2903020 3555749 4086022Deposits 31127471 36920194 43724487 50020134 57456972Investments 10126658 12155981 13360764 15072700 17591058Advances 22592117 27010187 33044329 38773075 44727740
Interest Income 2730882 3059826 3661345 4847318 5548765Other income 424662 488932 479649 503997 567812Interest expended 1934467 2119401 2311530 3285889 3879290Operating expenses 555037 660749 829652 902052 1018122Net Interest Margin 2.35 2.29 2.77 2.76 2.57
Cost of Funds (CoF) 6.06 5.35 4.91 6.06 6.27Return on advances adjusted to COF 4.05 3.75 4.23 4.25 3.81Wages as % to total expenses 13.88 14.79 17.50 13.72 13.09
Return on Equity 17.94 17.47 16.90 15.33 13.24Return on Assets 1.03 0.97 0.96 0.88 0.78CRAR 13.49 13.27 13.08 13.23 12.38Net NPA ratio 0.94 1.10 1.09 1.53 2.02

3
SBI and its Associates(Amount in ` Million)
Items 2008-09 2009-10 2010-11 2011-12 2012-13No. of banks 7 7 6 6 6No. of offices 16938 18390 19338 20256 21301No. of employees 268598 266605 283375 279809 293965Business per employee 65.02 73.74 79.05 91.38 101.97Profit per employee 0.44 0.47 0.42 0.55 0.60
Capital and Reserves & Surplus 724216 837256 843942 1072494 1253189Deposits 10070415 11080856 12458624 14050241 16184449Investments 3576239 3874734 3856967 4173221 4729979Advances 7394499 8579368 9941536 11519913 13792240
Interest Income 891958 979537 1098281 1435552 1637677Other income 160727 183937 192400 178231 197442Interest expended 617704 662285 670179 888609 1065334Operating expenses 200877 252828 291459 327299 370940Net Interest Margin 2.39 2.36 2.84 3.25 2.98
Cost of Funds (CoF) 6.00 5.32 4.85 5.66 5.96Return on advances adjusted to CoF 3.98 3.60 4.11 4.61 3.93Wages as % to total expenses 15.06 17.10 19.97 17.42 16.20
Return on Equity 17.74 15.92 14.11 16.00 15.29Return on Assets 1.02 0.91 0.79 0.89 0.88CRAR 13.96 13.46 12.25 13.70 12.67Net NPA ratio 1.47 1.50 1.49 1.76 2.04

4
Nationalised Banks (Includes IDBI Bank Ltd.)(Amount in ` Million)
Items 2008-09 2009-10 2010-11 2011-12 2012-13No. of banks 20 20 20 20 20No. of offices 41041 43690 46462 50713 54478No. of employees 462926 473041 471727 494520 507694Business per employee 78.32 93.59 115.25 127.85 142.23Profit per employee 0.49 0.57 0.70 0.69 0.65
Capital and Reserves & Surplus 1359202 1572758 2059079 2483255 2832832Deposits 21057056 25839338 31265862 35969893 41272523Investments 6550419 8281248 9503797 10899479 12861079Advances 15197619 18430819 23102793 27253162 30935500
Interest Income 1838924 2080289 2563064 3411767 3911088Other income 263936 304996 287249 325766 370370Interest expended 1316762 1457115 1641351 2397280 2813956Operating expenses 354160 407922 538193 574753 647182Net Interest Margin 2.32 2.26 2.74 2.55 2.39
Cost of Funds (CoF) 6.09 5.37 4.93 6.22 6.39Return on advances adjusted to CoF 4.09 3.82 4.28 4.10 3.76Wages as % to total expenses 13.31 13.65 16.41 12.20 11.81
Return on Equity 18.05 18.30 18.19 15.05 12.34Return on Assets 1.03 1.00 1.03 0.88 0.74CRAR 13.24 13.18 13.47 13.03 12.26Net NPA ratio 0.68 0.91 0.92 1.44 2.00

5
Private Sector Banks(Amount in ` Million)
Items 2008-09 2009-10 2010-11 2011-12 2012-13No. of banks 22 22 21 20 20No. of offices 9288 10516 12097 13970 16001No. of employees 193578 188332 217953 248284 269941Business per employee 67.76 77.27 82.60 86.23 94.06Profit per employee 0.56 0.70 0.81 0.92 1.07
Capital and Reserve & Surplus 996686 1199839 1385664 1592952 1929461Deposits 7363776 8228007 10027588 11745874 13958355Investments 3065312 3541169 4220576 5259822 6261063Advances 5753276 6324409 7975440 9664030 11432486
Interest Income 850714 828064 967131 1345555 1664864Other income 178602 204231 208734 250480 297927Interest expended 569574 512056 571491 867843 1071332Operating expenses 217794 228510 276064 340301 404851Net Interest Margin 2.86 2.90 3.10 3.09 3.22
Cost of Funds (CoF) 6.27 4.83 4.60 5.84 6.12Return on advances adjusted to COF 5.31 5.06 5.11 5.22 5.41Wages as % to total expenses 10.83 12.73 14.53 12.22 11.61
Return on Equity 11.38 11.94 13.70 15.25 16.47Return on Assets 1.13 1.28 1.43 1.53 1.63CRAR 15.23 17.43 16.46 16.21 16.84Net NPA ratio 1.29 1.04 0.56 0.46 0.52

6
Old Private Sector Banks(Amount in ` Million)
Items 2008-09 2009-10 2010-11 2011-12 2012-13No. of banks 15 15 14 13 13No. of offices 4952 5273 5090 5673 6283No. of employees 51341 55052 55380 62589 66208Business per employee 63.84 69.75 81.04 87.23 97.24Profit per employee 0.47 0.42 0.56 0.63 0.75
Capital and Reserves & Surplus 174765 201706 237982 278963 330127Deposits 1992735 2298969 2641571 3158914 3738964Investments 723926 834993 926545 1093333 1344993Advances 1285039 1540853 1846473 2300795 2699373
Interest Income 187898 204975 232989 325802 399275Other income 27821 31518 30286 33948 41452Interest expended 128340 140760 147681 225057 278598Operating expenses 39392 47153 56000 65404 77459Net Interest Margin 2.79 2.56 2.95 2.95 2.94
Cost of Funds (CoF) 6.67 6.13 5.66 7.10 7.27Return on advances adjusted to CoF 5.15 4.82 5.02 4.88 4.88Wages as % to total expenses 13.26 14.57 16.75 13.00 12.28
Return on Equity 14.69 12.29 14.11 15.18 16.22Return on Assets 1.15 0.95 1.12 1.20 1.26CRAR 14.74 14.85 14.55 14.12 13.73Net NPA ratio 0.90 0.82 0.53 0.58 0.77

7
New Private Sector Banks(Amount in ` Million)
Items 2008-09 2009-10 2010-11 2011-12 2012-13No. of banks 7 7 7 7 7No. of offices 4336 5243 7007 8297 9718No. of employees 142237 133280 162573 185695 203733Business per employee 69.18 80.38 83.13 85.89 93.03Profit per employee 0.59 0.81 0.90 1.01 1.18
Capital and Reserves & Surplus 821921 998133 1147682 1313989 1599334Deposits 5371041 5929038 7386018 8586960 10219391Investments 2341385 2706176 3294031 4166489 4916070Advances 4468237 4783556 6128967 7363235 8733113
Interest Income 662816 623090 734142 1019752 1265589Other income 150781 172713 178447 216532 256475Interest expended 441234 371296 423810 642787 792733Operating expenses 178401 181357 220064 274898 327392Net Interest Margin 2.88 3.00 3.15 3.13 3.30
Cost of Funds (CoF) 6.15 4.42 4.27 5.45 5.77Return on advances adjusted to CoF 5.36 5.14 5.14 5.32 5.57Wages as % to total expenses 10.17 12.10 13.83 11.97 11.40
Return on Equity 10.69 11.87 13.62 15.27 16.51Return on Assets 1.12 1.38 1.51 1.63 1.74CRAR 15.33 18.03 16.87 16.66 17.52Net NPA ratio 1.40 1.09 0.56 0.42 0.45

8
Foreign Banks(Amount in ` Million)
Items 2008-09 2009-10 2010-11 2011-12 2012-13No. of banks 31 32 34 41 43No. of offices 295 310 318 323 334No. of employees 29582 28012 28041 25907 25384Business per employee 128.27 141.14 155.55 195.62 217.33Profit per employee 2.54 1.69 2.75 3.64 4.56
Capital and Reserves & Surplus 599368 691760 810507 936917 1073817Deposits 2140764 2320995 2406668 2769477 2879997Investments 1303537 1592909 1654993 2006511 2280631Advances 1653846 1632604 1955106 2298488 2636799
Interest Income 303220 263897 284931 359966 422486Other income 148940 99513 110118 108959 112127Interest expended 128191 89379 106227 149824 187406Operating expenses 122984 111019 125686 133367 142882Net Interest Margin 4.33 3.96 3.86 3.89 3.89
Cost of Funds (CoF) 4.46 2.83 3.11 3.88 4.05Return on advances adjusted to CoF 8.15 7.16 5.64 5.72 5.50Wages as % to total expenses 19.44 23.48 23.30 20.35 18.22
Return on Equity 13.75 7.34 10.28 10.79 11.52Return on Assets 1.99 1.26 1.75 1.76 1.94CRAR 14.19 17.26 16.97 16.75 17.88Net NPA ratio 1.81 1.82 0.67 0.61 1.01

9
SBI AND ITS ASSOCIATES State Bank of India(Amount in ` Million)
Items 2008-09 2009-10 2010-11 2011-12 2012-13Group
Aggregate 2012-13
All Banks’ Aggregate
2012-13No. of offices 12070 13252 14350 14902 15564 21301 92114No. of employees 205896 200299 222933 215481 228296 293965 1096984Business per employee 55.60 63.60 70.47 79.84 94.39 101.97 121.33Profit per employee 0.47 0.45 0.39 0.53 0.65 0.60 0.83
Capital and Reserves & Surplus 579477 659492 649860 839512 988837 1253189 7089300Deposits 7420731 8041162 9339328 10436474 12027396 16184449 74295324Investments 2759540 2957852 2956006 3121976 3509273 4729979 26132752Advances 5425032 6319142 7567194 8675789 10456166 13792240 58797025
Interest Income 637884 709939 813944 1065215 1196571 1637677 7636115Other income 126908 149682 158246 143514 160348 197442 977866Interest expended 429153 473225 488680 632304 753258 1065334 5138027Operating expenses 156487 203187 230154 260690 292844 370940 1565855Net Interest Margin 2.48 2.35 2.86 3.38 3.06 2.98 2.79
Cost of Funds (CoF) 5.72 5.14 4.67 5.35 5.63 5.96 6.12Return on advances adjusted to CoF 3.95 3.48 3.97 4.63 3.83 3.93 4.21Wages as % to total expenses 16.64 18.86 21.16 19.01 17.57 16.20 13.02
Return on Equity 17.05 14.80 12.62 15.72 15.43 15.29 13.84Return on Assets 1.04 0.88 0.71 0.88 0.91 0.88 1.03CRAR 14.25 13.39 11.98 13.86 12.92 12.67 13.88Net NPA ratio 1.79 1.72 1.63 1.82 2.10 2.04 1.68
10
SBI AND ITS ASSOCIATES State Bank of Bikaner & Jaipur(Amount in ` Million)
Items 2008-09 2009-10 2010-11 2011-12 2012-13Group
Aggregate 2012-13
All Banks’ Aggregate
2012-13No. of offices 928 953 997 1036 1120 21301 92114No. of employees 11439 11629 11444 12866 12831 293965 1096984Business per employee 55.54 62.80 75.10 82.70 90.00 101.97 121.33Profit per employee 0.36 0.40 0.50 0.50 0.60 0.60 0.83
Capital and Reserves & Surplus 20465 24174 28508 41649 47641 1253189 7089300Deposits 392244 460588 538523 615721 721162 16184449 74295324Investments 109988 136005 135207 166695 201459 4729979 26132752Advances 298507 351764 412067 492443 575350 13792240 58797025
Interest Income 38103 39772 47965 62914 74982 1637677 7636115Other income 5771 5827 6397 5990 7263 197442 977866Interest expended 27071 27657 30268 40700 49324 1065334 5138027Operating expenses 7874 8905 12692 13308 15792 370940 1565855Net Interest Margin 2.52 2.41 3.02 3.28 3.24 2.98 2.79
Cost of Funds (CoF) 6.66 5.77 5.44 6.46 6.65 5.96 6.12Return on advances adjusted to CoF 4.22 3.81 4.44 4.77 4.57 3.93 4.21Wages as % to total expenses 13.19 13.73 19.25 15.18 15.17 16.20 13.02
Return on Equity 21.46 20.39 20.91 18.59 16.36 15.29 13.84Return on Assets 0.92 0.93 0.96 0.99 0.96 0.88 1.03CRAR 14.52 13.30 11.68 13.76 12.16 12.67 13.88Net NPA ratio 0.85 0.78 0.83 1.92 2.27 2.04 1.68

11
SBI AND ITS ASSOCIATES State Bank of Hyderabad(Amount in ` Million)
Items 2008-09 2009-10 2010-11 2011-12 2012-13Group
Aggregate 2012-13
All Banks’ Aggregate
2012-13No. of offices 1062 1215 1339 1499 1576 21301 92114No. of employees 12577 13597 14778 15043 15090 293965 1096984Business per employee 83.98 75.56 103.77 116.87 138.79 101.97 121.33Profit per employee 0.49 0.56 0.79 0.86 0.83 0.60 0.83
Capital and Reserves & Surplus 32083 42645 53152 64977 76317 1253189 7089300Deposits 624489 729707 886279 987319 1133243 16184449 74295324Investments 209817 240085 284467 292418 339680 4729979 26132752Advances 436792 528248 647203 770523 898565 13792240 58797025
Interest Income 57095 63341 78513 106467 124478 1637677 7636115Other income 7693 8413 9838 10243 9756 197442 977866Interest expended 42427 44709 50028 72822 85299 1065334 5138027Operating expenses 9331 9838 15128 17358 21051 370940 1565855Net Interest Margin 2.12 2.26 2.92 2.99 3.08 2.98 2.79
Cost of Funds (CoF) 6.75 5.76 5.43 6.92 7.29 5.96 6.12Return on advances adjusted to CoF 3.82 3.97 4.58 4.62 4.16 3.93 4.21Wages as % to total expenses 10.67 11.05 15.95 12.77 13.31 16.20 13.02
Return on Equity 20.87 22.02 24.35 21.98 17.70 15.29 13.84Return on Assets 0.91 1.03 1.22 1.15 0.99 0.88 1.03CRAR 11.53 14.90 14.25 13.56 12.36 12.67 13.88Net NPA ratio 0.38 0.55 0.87 1.30 1.61 2.04 1.68

12
SBI AND ITS ASSOCIATES State Bank of Mysore(Amount in ` Million)
Items 2008-09 2009-10 2010-11 2011-12 2012-13Group
Aggregate 2012-13
All Banks’ Aggregate
2012-13No. of offices 720 736 755 788 829 21301 92114No. of employees 9671 10111 9926 10249 10784 293965 1096984Business per employee 60.20 67.20 79.50 88.10 95.50 101.97 121.33Profit per employee 0.35 0.44 0.50 0.40 0.40 0.60 0.83
Capital and Reserves & Surplus 22710 26653 36833 39885 43325 1253189 7089300Deposits 329158 388800 432255 501863 569690 16184449 74295324Investments 113780 114944 129271 147327 167746 4729979 26132752Advances 256161 295359 340298 398353 449326 13792240 58797025
Interest Income 32473 35589 40791 50784 59655 1637677 7636115Other income 4804 4257 4552 5164 5956 197442 977866Interest expended 24090 23224 24431 34941 41253 1065334 5138027Operating expenses 6651 7249 9174 10411 11048 370940 1565855Net Interest Margin 2.28 2.88 3.36 2.82 2.88 2.98 2.79
Cost of Funds (CoF) 6.39 5.65 5.29 6.66 6.92 5.96 6.12Return on advances adjusted to CoF 4.45 4.35 4.78 4.34 4.38 3.93 4.21Wages as % to total expenses 12.51 13.73 16.32 13.68 12.24 16.20 13.02
Return on Equity 18.47 18.06 15.77 9.62 10.00 15.29 13.84Return on Assets 0.91 1.06 1.03 0.67 0.66 0.88 1.03CRAR 12.99 12.42 13.76 12.55 11.79 12.67 13.88Net NPA ratio 0.50 1.02 1.38 1.93 2.69 2.04 1.68

13
SBI AND ITS ASSOCIATES State Bank of Patiala(Amount in ` Million)
Items 2008-09 2009-10 2010-11 2011-12 2012-13Group
Aggregate 2012-13
All Banks’ Aggregate
2012-13No. of offices 895 943 1071 1121 1184 21301 92114No. of employees 11365 12409 12559 13573 14439 293965 1096984Business per employee 91.02 89.52 95.63 105.57 113.50 101.97 121.33Profit per employee 0.47 0.45 0.52 0.59 0.46 0.60 0.83
Capital and Reserves & Surplus 31337 37471 40953 47810 53419 1253189 7089300Deposits 600062 645519 680661 794166 886721 16184449 74295324Investments 170292 181651 172746 220429 239567 4729979 26132752Advances 435872 463472 514332 629345 737998 13792240 58797025
Interest Income 58041 59753 64781 81211 95643 1637677 7636115Other income 6316 6744 7555 7510 7588 197442 977866Interest expended 46763 44410 41446 57859 71134 1065334 5138027Operating expenses 7939 9009 13298 13234 15903 370940 1565855Net Interest Margin 1.75 2.11 2.97 2.60 2.37 2.98 2.79
Cost of Funds (CoF) 7.65 6.36 5.44 6.54 6.94 5.96 6.12Return on advances adjusted to CoF 3.61 3.89 4.87 4.71 4.24 3.93 4.21Wages as % to total expenses 8.12 9.37 16.09 11.74 11.02 16.20 13.02
Return on Equity 18.20 16.01 16.65 17.95 13.17 15.29 13.84Return on Assets 0.83 0.79 0.88 0.93 0.68 0.88 1.03CRAR 12.60 13.26 13.41 12.30 11.12 12.67 13.88Net NPA ratio 0.60 1.04 1.21 1.35 1.62 2.04 1.68

14
SBI AND ITS ASSOCIATES State Bank of Travancore(Amount in ` Million)
Items 2008-09 2009-10 2010-11 2011-12 2012-13Group
Aggregate 2012-13
All Banks’ Aggregate
2012-13No. of offices 756 781 826 910 1028 21301 92114No. of employees 11365 12192 11735 12597 12525 293965 1096984Business per employee 65.80 69.60 88.80 106.60 125.90 101.97 121.33Profit per employee 0.50 0.60 0.80 0.42 0.50 0.60 0.83
Capital and Reserves & Surplus 22499 28406 34635 38662 43650 1253189 7089300Deposits 420411 508834 581579 714698 846237 16184449 74295324Investments 132317 158444 179270 224376 272255 4729979 26132752Advances 326014 384613 460442 553460 674836 13792240 58797025
Interest Income 41232 43781 52288 68961 86348 1637677 7636115Other income 5731 5280 5812 5809 6530 197442 977866Interest expended 28406 29779 35327 49984 65066 1065334 5138027Operating expenses 7994 9559 11013 12299 14302 370940 1565855Net Interest Margin 2.75 2.57 2.60 2.42 2.27 2.98 2.79
Cost of Funds (CoF) 6.08 5.58 5.40 6.20 6.88 5.96 6.12Return on advances adjusted to CoF 4.37 3.88 4.14 4.45 4.11 3.93 4.21Wages as % to total expenses 13.40 15.64 15.11 12.65 11.15 16.20 13.02
Return on Equity 30.64 26.88 23.09 13.93 14.94 15.29 13.84Return on Assets 1.30 1.26 1.12 0.65 0.66 0.88 1.03CRAR 14.03 13.74 12.54 13.55 11.70 12.67 13.88Net NPA ratio 0.58 0.91 0.98 1.54 1.46 2.04 1.68

15
NATIONALISED BANKS Allahabad Bank(Amount in ` Million)
Items 2008-09 2009-10 2010-11 2011-12 2012-13Group
Aggregate 2012-13
All Banks’ Aggregate
2012-13No. of offices 2340 2367 2504 2594 2794 54478 92114No. of employees 20457 20959 21227 22334 22557 507694 1096984Business per employee 70.60 84.50 106.30 121.70 137.30 142.23 121.33Profit per employee 0.38 0.58 0.67 0.84 0.53 0.65 0.83
Capital and Reserves & Surplus 58519 67530 85074 105066 113525 2832832 7089300Deposits 849718 1060558 1318872 1595931 1787416 41272523 74295324Investments 296510 384286 432471 542832 583059 12861079 26132752Advances 588018 716049 936249 1111451 1294897 30935500 58797025
Interest Income 73647 83692 110147 155233 174357 3911088 7636115Other income 11419 15159 13704 12987 14769 370370 977866Interest expended 52061 57187 69922 103606 125693 2813956 5138027Operating expenses 13994 16178 23383 26914 29581 647182 1565855Net Interest Margin 2.39 2.42 2.95 3.09 2.51 2.39 2.79
Cost of Funds (CoF) 6.10 5.37 5.23 6.44 6.83 6.39 6.12Return on advances adjusted to CoF 4.02 4.44 4.78 4.95 3.76 3.76 4.21Wages as % to total expenses 13.23 13.79 16.69 14.06 12.79 11.81 13.02
Return on Equity 13.88 19.14 18.65 19.64 10.84 12.34 13.84Return on Assets 0.90 1.16 1.11 1.02 0.64 0.74 1.03CRAR 13.11 13.62 12.96 12.83 11.03 12.26 13.88Net NPA ratio 0.72 0.66 0.79 0.98 3.19 2.00 1.68

16
NATIONALISED BANKS Andhra Bank(Amount in ` Million)
Items 2008-09 2009-10 2010-11 2011-12 2012-13Group
Aggregate 2012-13
All Banks’ Aggregate
2012-13No. of offices 1471 1601 1678 1757 1910 54478 92114No. of employees 14255 14292 14098 15099 16523 507694 1096984Business per employee 72.83 93.90 116.50 126.20 135.50 142.23 121.33Profit per employee 0.46 0.70 0.90 0.90 0.90 0.65 0.83
Capital and Reserves & Surplus 36470 44100 64924 74794 84412 2832832 7089300Deposits 593900 776882 921563 1058512 1237956 41272523 74295324Investments 169111 208810 242040 296289 376324 12861079 26132752Advances 441393 561135 714354 832230 983733 30935500 58797025
Interest Income 53746 63729 82913 113387 129097 3911088 7636115Other income 7654 9646 8970 8599 10474 370370 977866Interest expended 37477 41781 50703 75794 91527 2813956 5138027Operating expenses 11043 13495 17049 18042 20372 647182 1565855Net Interest Margin 2.60 2.76 3.23 3.22 2.77 2.39 2.79
Cost of Funds (CoF) 6.40 5.38 5.23 6.83 7.13 6.39 6.12Return on advances adjusted to CoF 4.36 4.92 5.26 5.17 4.25 3.76 4.21Wages as % to total expenses 12.86 14.91 16.30 12.25 11.50 11.81 13.02
Return on Equity 18.94 25.96 23.24 19.25 16.19 12.34 13.84Return on Assets 1.09 1.39 1.36 1.19 0.99 0.74 1.03CRAR 13.22 13.93 14.38 13.18 11.76 12.26 13.88Net NPA ratio 0.18 0.17 0.38 0.91 2.45 2.00 1.68

17
NATIONALISED BANKS Bank of Baroda(Amount in ` Million)
Items 2008-09 2009-10 2010-11 2011-12 2012-13Group
Aggregate 2012-13
All Banks’ Aggregate
2012-13No. of offices 3006 3182 3447 3993 4377 54478 92114No. of employees 36440 38152 39385 41447 43108 507694 1096984Business per employee 91.40 98.10 122.90 146.60 168.90 142.23 121.33Profit per employee 0.60 0.80 1.10 1.20 1.00 0.65 0.83
Capital and Reserves & Surplus 128797 151064 210435 274769 319694 2832832 7089300Deposits 1923970 2412619 3054395 3848711 4738833 41272523 74295324Investments 524459 611824 713966 832094 1213937 12861079 26132752Advances 1432514 1750353 2286764 2873773 3281858 30935500 58797025
Interest Income 150916 166983 218859 296737 351967 3911088 7636115Other income 27577 28064 28092 34223 36306 370370 977866Interest expended 99682 107589 130837 193567 238814 2813956 5138027Operating expenses 35761 38106 46298 51587 59467 647182 1565855Net Interest Margin 2.52 2.35 2.76 2.56 2.28 2.39 2.79
Cost of Funds (CoF) 5.25 4.37 4.19 5.00 5.04 6.39 6.12Return on advances adjusted to CoF 3.71 3.51 3.82 3.67 3.36 3.76 4.21Wages as % to total expenses 17.34 16.14 16.47 12.18 11.57 11.81 13.02
Return on Equity 18.62 21.86 23.47 20.64 15.07 12.34 13.84Return on Assets 1.09 1.21 1.33 1.24 0.90 0.74 1.03CRAR 14.05 14.36 14.52 14.67 13.30 12.26 13.88Net NPA ratio 0.31 0.34 0.35 0.54 1.28 2.00 1.68

18
NATIONALISED BANKS Bank of India(Amount in ` Million)
Items 2008-09 2009-10 2010-11 2011-12 2012-13Group
Aggregate 2012-13
All Banks’ Aggregate
2012-13No. of offices 3118 3304 3586 4088 4373 54478 92114No. of employees 40155 39676 39788 41537 42348 507694 1096984Business per employee 83.30 101.10 128.40 136.00 158.20 142.23 121.33Profit per employee 0.75 0.44 0.62 0.64 0.64 0.65 0.83
Capital and Reserves & Surplus 134949 142300 172907 209618 239182 2832832 7089300Deposits 1897085 2297619 2988858 3182160 3818396 41272523 74295324Investments 526072 670802 858724 867536 946134 12861079 26132752Advances 1429094 1684907 2130962 2488333 2893675 30935500 58797025
Interest Income 163474 178780 217517 284807 319089 3911088 7636115Other income 30519 26166 26418 33212 37660 370370 977866Interest expended 108485 121220 139410 201672 228849 2813956 5138027Operating expenses 30940 36678 50682 49407 53315 647182 1565855Net Interest Margin 2.72 2.30 2.49 2.26 2.16 2.39 2.79
Cost of Funds (CoF) 5.69 4.97 4.53 5.69 5.66 6.39 6.12Return on advances adjusted to CoF 4.09 3.45 3.59 3.07 2.94 3.76 4.21Wages as % to total expenses 13.90 14.54 18.28 12.22 11.09 11.81 13.02
Return on Equity 24.97 12.56 15.79 14.00 12.25 12.34 13.84Return on Assets 1.49 0.70 0.82 0.72 0.65 0.74 1.03CRAR 13.01 12.94 12.17 11.95 11.02 12.26 13.88Net NPA ratio 0.44 1.31 0.91 1.47 2.06 2.00 1.68

19
NATIONALISED BANKS Bank of Maharashtra(Amount in ` Million)
Items 2008-09 2009-10 2010-11 2011-12 2012-13Group
Aggregate 2012-13
All Banks’ Aggregate
2012-13No. of offices 1463 1496 1577 1632 1771 54478 92114No. of employees 13631 13673 13861 13803 13593 507694 1096984Business per employee 63.60 76.20 82.50 96.70 125.60 142.23 121.33Profit per employee 0.28 0.32 0.24 0.31 0.56 0.65 0.83
Capital and Reserves & Surplus 25172 28584 39709 47227 63969 2832832 7089300Deposits 522549 633041 668447 765287 943369 41272523 74295324Investments 183821 213239 224911 260314 314303 12861079 26132752Advances 342908 403147 468808 560598 754708 30935500 58797025
Interest Income 42916 47356 55631 72140 96134 3911088 7636115Other income 5000 5912 5309 6407 9120 370370 977866Interest expended 30350 34393 35947 46969 65801 2813956 5138027Operating expenses 9630 10729 16442 16425 17966 647182 1565855Net Interest Margin 2.34 1.99 2.67 3.00 2.92 2.39 2.79
Cost of Funds (CoF) 5.86 5.28 4.89 5.75 6.49 6.39 6.12Return on advances adjusted to CoF 4.42 3.75 4.30 4.91 4.60 3.76 4.21Wages as % to total expenses 14.50 14.53 22.09 17.56 14.18 11.81 13.02
Return on Equity 17.46 16.35 9.68 9.91 13.66 12.34 13.84Return on Assets 0.72 0.70 0.47 0.55 0.74 0.74 1.03CRAR 12.05 12.78 13.35 12.43 12.59 12.26 13.88Net NPA ratio 0.79 1.64 1.32 0.84 0.52 2.00 1.68

20
NATIONALISED BANKS Canara Bank(Amount in ` Million)
Items 2008-09 2009-10 2010-11 2011-12 2012-13Group
Aggregate 2012-13
All Banks’ Aggregate
2012-13No. of offices 2850 3155 3365 3707 3837 54478 92114No. of employees 44090 43380 43397 42272 42693 507694 1096984Business per employee 78.02 98.26 119.91 137.44 142.02 142.23 121.33Profit per employee 0.50 0.74 0.98 0.82 0.70 0.65 0.83
Capital and Reserves & Surplus 122078 146718 200398 226900 248778 2832832 7089300Deposits 1868925 2346514 2934366 3270537 3558560 41272523 74295324Investments 577769 696770 836360 1020574 1211328 12861079 26132752Advances 1382194 1693346 2112683 2324898 2421766 30935500 58797025
Interest Income 171191 187520 229401 308506 340779 3911088 7636115Other income 23112 28579 28115 29276 31530 370370 977866Interest expended 124012 130714 152407 231613 261989 2813956 5138027Operating expenses 30652 34776 44193 46737 51420 647182 1565855Net Interest Margin 2.36 2.35 2.56 2.17 2.00 2.39 2.79
Cost of Funds (CoF) 6.62 5.61 5.29 6.89 7.07 6.39 6.12Return on advances adjusted to CoF 3.82 3.46 3.67 3.68 3.20 3.76 4.21Wages as % to total expenses 12.14 13.26 15.03 10.68 10.38 11.81 13.02
Return on Equity 18.25 22.48 23.20 15.36 12.08 12.34 13.84Return on Assets 1.06 1.30 1.42 0.95 0.77 0.74 1.03CRAR 14.10 13.43 15.38 13.76 12.40 12.26 13.88Net NPA ratio 1.09 1.06 1.10 1.46 2.18 2.00 1.68

21
NATIONALISED BANKS Central Bank of India(Amount in ` Million)
Items 2008-09 2009-10 2010-11 2011-12 2012-13Group
Aggregate 2012-13
All Banks’ Aggregate
2012-13No. of offices 3644 3704 3871 4151 4429 54478 92114No. of employees 32804 34826 34015 35901 37113 507694 1096984Business per employee 56.03 71.18 83.52 86.16 97.30 142.23 121.33Profit per employee 0.17 0.33 0.40 0.15 0.28 0.65 0.83
Capital and Reserves & Surplus 64121 76922 108734 124515 153129 2832832 7089300Deposits 1312718 1621075 1793560 1961733 2260383 41272523 74295324Investments 430607 505629 545045 592433 726038 12861079 26132752Advances 854832 1053835 1297254 1475129 1719358 30935500 58797025
Interest Income 104552 120643 152206 191495 218607 3911088 7636115Other income 10700 17352 12650 13953 16673 370370 977866Interest expended 82267 95190 98952 139809 161231 2813956 5138027Operating expenses 18617 22220 39990 37490 42323 647182 1565855Net Interest Margin 1.64 1.54 2.71 2.35 2.30 2.39 2.79
Cost of Funds (CoF) 6.59 6.06 5.09 6.55 6.67 6.39 6.12Return on advances adjusted to CoF 3.19 3.00 4.48 3.85 3.93 3.76 4.21Wages as % to total expenses 12.61 13.15 21.33 14.14 14.21 11.81 13.02
Return on Equity 9.25 15.01 13.49 4.57 7.31 12.34 13.84Return on Assets 0.45 0.66 0.70 0.26 0.44 0.74 1.03CRAR 13.12 12.23 11.64 12.40 11.49 12.26 13.88Net NPA ratio 1.24 0.69 0.65 3.09 2.90 2.00 1.68

22
NATIONALISED BANKS Corporation Bank(Amount in ` Million)
Items 2008-09 2009-10 2010-11 2011-12 2012-13Group
Aggregate 2012-13
All Banks’ Aggregate
2012-13No. of offices 1079 1180 1370 1512 1716 54478 92114No. of employees 12465 13143 13861 13813 14819 507694 1096984Business per employee 104.90 126.87 157.28 171.30 192.13 142.23 121.33Profit per employee 0.76 0.95 1.09 1.09 0.97 0.65 0.83
Capital and Reserves & Surplus 48965 57749 71378 82759 95657 2832832 7089300Deposits 739839 927337 1167475 1361422 1660055 41272523 74295324Investments 249378 345226 434527 474746 581645 12861079 26132752Advances 485122 632026 868504 1004690 1187166 30935500 58797025
Interest Income 60674 69877 91352 130178 153341 3911088 7636115Other income 11072 14933 12559 14926 16079 370370 977866Interest expended 43764 50843 61955 98709 119082 2813956 5138027Operating expenses 10466 12600 16417 17836 19968 647182 1565855Net Interest Margin 2.20 1.92 2.30 2.05 1.92 2.39 2.79
Cost of Funds (CoF) 6.14 5.08 4.68 6.54 6.89 6.39 6.12Return on advances adjusted to CoF 3.86 3.84 3.95 3.67 3.56 3.76 4.21Wages as % to total expenses 9.46 9.96 11.42 7.84 7.12 11.81 13.02
Return on Equity 19.57 21.93 21.89 19.54 16.08 12.34 13.84Return on Assets 1.24 1.28 1.21 1.06 0.88 0.74 1.03CRAR 13.61 15.37 14.11 13.00 12.33 12.26 13.88Net NPA ratio 0.29 0.31 0.46 0.87 1.19 2.00 1.68
23
NATIONALISED BANKS Dena Bank(Amount in ` Million)
Items 2008-09 2009-10 2010-11 2011-12 2012-13Group
Aggregate 2012-13
All Banks’ Aggregate
2012-13No. of offices 1125 1165 1233 1286 1411 54478 92114No. of employees 9883 10525 9953 10202 11093 507694 1096984Business per employee 71.40 82.70 107.70 128.40 143.10 142.23 121.33Profit per employee 0.43 0.49 0.62 0.79 0.73 0.65 0.83
Capital and Reserves & Surplus 21705 26017 36559 44773 57640 2832832 7089300Deposits 430506 513443 642096 771668 972072 41272523 74295324Investments 124731 156942 187689 230276 343431 12861079 26132752Advances 288780 354624 448280 566925 657812 30935500 58797025
Interest Income 34475 40104 50335 67941 88994 3911088 7636115Other income 4301 5886 5338 5822 6555 370370 977866Interest expended 23831 29103 32702 46931 65163 2813956 5138027Operating expenses 7682 8481 10734 11547 12997 647182 1565855Net Interest Margin 2.44 2.07 2.75 2.66 2.37 2.39 2.79
Cost of Funds (CoF) 5.77 5.67 5.26 6.19 6.74 6.39 6.12Return on advances adjusted to CoF 4.12 3.68 4.26 3.98 4.39 3.76 4.21Wages as % to total expenses 14.85 13.61 15.84 12.22 10.13 11.81 13.02
Return on Equity 21.29 21.43 19.55 19.75 15.83 12.34 13.84Return on Assets 1.02 1.01 1.00 1.08 0.86 0.74 1.03CRAR 12.07 12.77 13.41 11.51 11.03 12.26 13.88Net NPA ratio 1.09 1.21 1.22 1.01 1.39 2.00 1.68

24
NATIONALISED BANKS IDBI Bank Ltd.(Amount in ` Million)
Items 2008-09 2009-10 2010-11 2011-12 2012-13Group
Aggregate 2012-13
All Banks’ Aggregate
2012-13No. of offices 515 713 821 979 1085 54478 92114No. of employees 10201 12220 13598 15435 15465 507694 1096984Business per employee 203.03 241.74 234.64 238.33 256.44 142.23 121.33Profit per employee 0.84 0.84 1.19 1.32 1.22 0.65 0.83
Capital and Reserves & Surplus 94239 101648 145676 194279 212360 2832832 7089300Deposits 1124010 1676671 1804858 2104926 2271165 41272523 74295324Investments 500476 733455 682692 831754 988009 12861079 26132752Advances 1034445 1382019 1570981 1805723 1963064 30935500 58797025
Interest Income 115451 152613 185412 233699 250643 3911088 7636115Other income 14764 23017 21432 21122 32195 370370 977866Interest expended 103057 130052 142719 188251 196912 2813956 5138027Operating expenses 13379 18314 22547 26075 31344 647182 1565855Net Interest Margin 0.82 1.11 1.75 1.67 1.75 2.39 2.79
Cost of Funds (CoF) 5.14 5.19 4.90 6.21 5.95 6.39 6.12Return on advances adjusted to CoF 4.62 3.73 4.41 4.44 4.43 3.76 4.21Wages as % to total expenses 4.89 5.10 6.21 5.41 6.74 11.81 13.02
Return on Equity 9.41 10.53 13.35 11.95 9.26 12.34 13.84Return on Assets 0.62 0.53 0.73 0.83 0.72 0.74 1.03CRAR 11.57 11.31 13.64 14.58 13.13 12.26 13.88Net NPA ratio 0.92 1.02 1.06 1.61 1.58 2.00 1.68

25
NATIONALISED BANKS Indian Bank(Amount in ` Million)
Items 2008-09 2009-10 2010-11 2011-12 2012-13Group
Aggregate 2012-13
All Banks’ Aggregate
2012-13No. of offices 1680 1792 1899 1994 2128 54478 92114No. of employees 19993 19641 19311 18710 18793 507694 1096984Business per employee 61.70 76.10 93.00 111.40 130.10 142.23 121.33Profit per employee 0.62 0.79 0.89 0.93 0.84 0.65 0.83
Capital and Reserves & Surplus 71359 82721 95211 108014 119724 2832832 7089300Deposits 725818 882277 1058042 1208038 1419802 41272523 74295324Investments 228006 282683 347838 379760 418050 12861079 26132752Advances 513965 621461 752499 903236 1056425 30935500 58797025
Interest Income 68303 77144 93610 122313 138926 3911088 7636115Other income 10354 13164 11819 12322 12879 370370 977866Interest expended 42218 45532 53249 78133 93684 2813956 5138027Operating expenses 15881 17302 19263 21870 27509 647182 1565855Net Interest Margin 3.38 3.41 3.62 3.36 2.97 2.39 2.79
Cost of Funds (CoF) 6.13 5.56 5.39 6.67 6.92 6.39 6.12Return on advances adjusted to CoF 5.02 4.66 4.94 4.71 3.91 3.76 4.21Wages as % to total expenses 19.84 19.30 18.38 14.84 16.29 11.81 13.02
Return on Equity 20.26 20.18 19.27 17.19 13.89 12.34 13.84Return on Assets 1.62 1.67 1.53 1.31 1.02 0.74 1.03CRAR 13.98 12.71 13.56 13.47 13.08 12.26 13.88Net NPA ratio 0.18 0.23 0.53 1.33 2.26 2.00 1.68

26
NATIONALISED BANKS Indian Overseas Bank(Amount in ` Million)
Items 2008-09 2009-10 2010-11 2011-12 2012-13Group
Aggregate 2012-13
All Banks’ Aggregate
2012-13No. of offices 2012 2099 2281 2733 3042 54478 92114No. of employees 25512 26732 25626 27201 28280 507694 1096984Business per employee 68.95 71.20 100.50 117.60 128.80 142.23 121.33Profit per employee 0.52 0.26 0.42 0.38 0.20 0.65 0.83
Capital and Reserves & Surplus 71510 75246 93249 119277 134574 2832832 7089300Deposits 1001159 1107947 1452288 1784342 2021353 41272523 74295324Investments 312154 376506 486105 555659 614173 12861079 26132752Advances 748853 789992 1118330 1407244 1603641 30935500 58797025
Interest Income 96414 102458 121015 178891 206767 3911088 7636115Other income 15958 11433 12251 16810 19729 370370 977866Interest expended 67718 70779 78934 128729 154248 2813956 5138027Operating expenses 19417 24665 25725 31631 34078 647182 1565855Net Interest Margin 2.57 2.51 2.72 2.52 2.26 2.39 2.79
Cost of Funds (CoF) 6.42 6.14 5.55 7.02 7.22 6.39 6.12Return on advances adjusted to CoF 4.36 3.81 3.72 3.73 3.35 3.76 4.21Wages as % to total expenses 14.60 18.18 16.64 12.99 11.94 11.81 13.02
Return on Equity 22.07 9.63 12.73 9.88 4.47 12.34 13.84Return on Assets 1.17 0.53 0.71 0.52 0.24 0.74 1.03CRAR 13.20 14.78 14.55 13.32 11.85 12.26 13.88Net NPA ratio 1.33 2.52 1.19 1.35 2.50 2.00 1.68
27
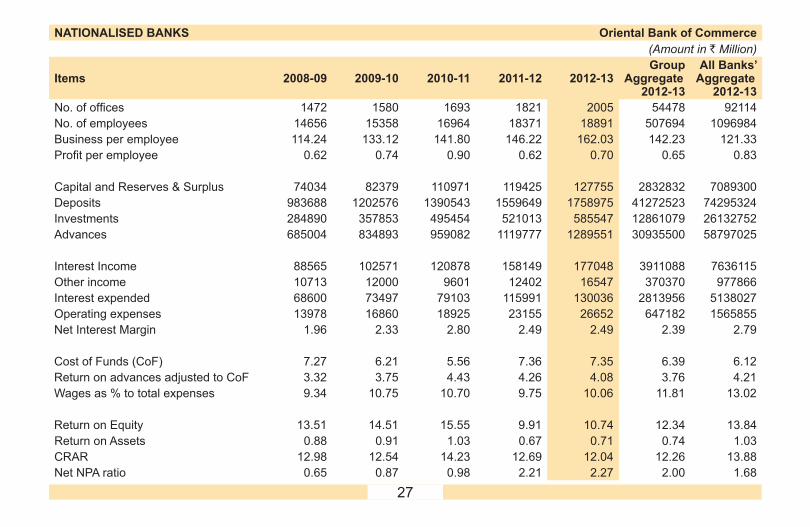
NATIONALISED BANKS Oriental Bank of Commerce(Amount in ` Million)
Items 2008-09 2009-10 2010-11 2011-12 2012-13Group
Aggregate 2012-13
All Banks’ Aggregate
2012-13No. of offices 1472 1580 1693 1821 2005 54478 92114No. of employees 14656 15358 16964 18371 18891 507694 1096984Business per employee 114.24 133.12 141.80 146.22 162.03 142.23 121.33Profit per employee 0.62 0.74 0.90 0.62 0.70 0.65 0.83
Capital and Reserves & Surplus 74034 82379 110971 119425 127755 2832832 7089300Deposits 983688 1202576 1390543 1559649 1758975 41272523 74295324Investments 284890 357853 495454 521013 585547 12861079 26132752Advances 685004 834893 959082 1119777 1289551 30935500 58797025
Interest Income 88565 102571 120878 158149 177048 3911088 7636115Other income 10713 12000 9601 12402 16547 370370 977866Interest expended 68600 73497 79103 115991 130036 2813956 5138027Operating expenses 13978 16860 18925 23155 26652 647182 1565855Net Interest Margin 1.96 2.33 2.80 2.49 2.49 2.39 2.79
Cost of Funds (CoF) 7.27 6.21 5.56 7.36 7.35 6.39 6.12Return on advances adjusted to CoF 3.32 3.75 4.43 4.26 4.08 3.76 4.21Wages as % to total expenses 9.34 10.75 10.70 9.75 10.06 11.81 13.02
Return on Equity 13.51 14.51 15.55 9.91 10.74 12.34 13.84Return on Assets 0.88 0.91 1.03 0.67 0.71 0.74 1.03CRAR 12.98 12.54 14.23 12.69 12.04 12.26 13.88Net NPA ratio 0.65 0.87 0.98 2.21 2.27 2.00 1.68

28
NATIONALISED BANKS Punjab and Sind Bank(Amount in ` Million)
Items 2008-09 2009-10 2010-11 2011-12 2012-13Group
Aggregate 2012-13
All Banks’ Aggregate
2012-13No. of offices 930 936 983 1045 1138 54478 92114No. of employees 8700 8259 8107 8041 8533 507694 1096984Business per employee 65.60 96.30 119.00 130.20 137.00 142.23 121.33Profit per employee 0.50 0.60 0.60 0.60 0.40 0.65 0.83
Capital and Reserves & Surplus 21403 26156 38034 42489 46041 2832832 7089300Deposits 346757 491551 597232 631240 706415 41272523 74295324Investments 126274 178868 186437 200641 225425 12861079 26132752Advances 246153 326391 426378 461514 514308 30935500 58797025
Interest Income 32472 39342 49325 64745 73401 3911088 7636115Other income 4077 4118 4371 4175 4172 370370 977866Interest expended 22353 27502 33721 49734 56991 2813956 5138027Operating expenses 6978 7182 9840 11585 11193 647182 1565855Net Interest Margin 2.80 2.42 2.49 2.12 2.14 2.39 2.79
Cost of Funds (CoF) 6.54 5.75 5.57 7.43 7.90 6.39 6.12Return on advances adjusted to CoF 5.04 3.87 4.01 3.72 3.80 3.76 4.21Wages as % to total expenses 17.91 15.27 17.35 13.58 11.34 11.81 13.02
Return on Equity 20.37 21.40 16.39 11.21 7.66 12.34 13.84Return on Assets 1.24 1.05 0.90 0.65 0.44 0.74 1.03CRAR 14.35 13.10 12.94 13.26 12.91 12.26 13.88Net NPA ratio 0.32 0.36 0.56 1.19 2.16 2.00 1.68

29
NATIONALISED BANKS Punjab National Bank(Amount in ` Million)
Items 2008-09 2009-10 2010-11 2011-12 2012-13Group
Aggregate 2012-13
All Banks’ Aggregate
2012-13No. of offices 4536 5056 5256 5777 5977 54478 92114No. of employees 54780 57103 53114 62127 63292 507694 1096984Business per employee 65.49 80.80 101.78 113.20 116.51 142.23 121.33Profit per employee 0.56 0.73 0.84 0.84 0.81 0.65 0.83
Capital and Reserves & Surplus 146536 177229 215086 278154 326769 2832832 7089300Deposits 2097605 2493298 3128987 3795885 3915601 41272523 74295324Investments 633852 777245 951623 1227030 1298962 12861079 26132752Advances 1547030 1866012 2421067 2937748 3087252 30935500 58797025
Interest Income 191272 214221 269865 364761 418933 3911088 7636115Other income 30647 36101 36126 42026 42159 370370 977866Interest expended 122953 129440 151791 230617 270368 2813956 5138027Operating expenses 42062 47619 63642 70028 81651 647182 1565855Net Interest Margin 3.06 3.12 3.50 3.21 3.17 2.39 2.79
Cost of Funds (CoF) 5.93 4.90 4.58 5.73 6.11 6.39 6.12Return on advances adjusted to CoF 4.71 4.87 5.26 4.88 4.46 3.76 4.21Wages as % to total expenses 17.72 17.63 20.71 15.71 16.12 11.81 13.02
Return on Equity 22.92 24.12 22.60 19.80 15.70 12.34 13.84Return on Assets 1.39 1.44 1.34 1.19 1.00 0.74 1.03CRAR 14.03 14.16 12.42 12.63 12.72 12.26 13.88Net NPA ratio 0.17 0.53 0.85 1.52 2.35 2.00 1.68

30
NATIONALISED BANKS Syndicate Bank(Amount in ` Million)
Items 2008-09 2009-10 2010-11 2011-12 2012-13Group
Aggregate 2012-13
All Banks’ Aggregate
2012-13No. of offices 2343 2429 2623 2828 3041 54478 92114No. of employees 25068 25569 28509 26904 26606 507694 1096984Business per employee 75.07 74.68 87.54 107.41 125.70 142.23 121.33Profit per employee 0.36 0.32 0.40 0.53 0.81 0.65 0.83
Capital and Reserves & Surplus 50100 56270 70508 90412 105413 2832832 7089300Deposits 1158851 1170258 1355961 1579411 1853559 41272523 74295324Investments 305372 330109 350676 408151 456477 12861079 26132752Advances 815323 904064 1067819 1236202 1475690 30935500 58797025
Interest Income 95254 100472 114509 152684 171207 3911088 7636115Other income 9147 11675 9151 10759 11744 370370 977866Interest expended 69776 73074 70681 101833 116666 2813956 5138027Operating expenses 17910 20336 25481 28141 31788 647182 1565855Net Interest Margin 2.15 2.03 2.97 3.00 2.74 2.39 2.79
Cost of Funds (CoF) 6.08 5.42 4.60 6.00 5.91 6.39 6.12Return on advances adjusted to CoF 4.06 3.53 4.73 4.74 4.07 3.76 4.21Wages as % to total expenses 12.77 14.32 18.44 14.55 14.68 11.81 13.02
Return on Equity 19.63 15.29 16.53 16.32 20.47 12.34 13.84Return on Assets 0.81 0.62 0.76 0.81 1.07 0.74 1.03CRAR 12.68 12.70 13.04 12.24 12.59 12.26 13.88Net NPA ratio 0.77 1.07 0.97 0.96 0.76 2.00 1.68

31
NATIONALISED BANKS UCO Bank(Amount in ` Million)
Items 2008-09 2009-10 2010-11 2011-12 2012-13Group
Aggregate 2012-13
All Banks’ Aggregate
2012-13No. of offices 2113 2195 2248 2436 2646 54478 92114No. of employees 23736 23264 23026 23147 24109 507694 1096984Business per employee 73.20 86.40 106.90 116.40 118.90 142.23 121.33Profit per employee 0.24 0.44 0.42 0.51 0.27 0.65 0.83
Capital and Reserves & Surplus 39570 52105 74192 86134 96824 2832832 7089300Deposits 1002216 1224156 1452776 1540035 1734310 41272523 74295324Investments 293848 435214 429273 457715 522449 12861079 26132752Advances 688039 825045 990708 1155400 1282829 30935500 58797025
Interest Income 81214 95263 113708 146324 167517 3911088 7636115Other income 10199 9659 9254 9656 9522 370370 977866Interest expended 64767 72022 75259 107303 121702 2813956 5138027Operating expenses 14630 15844 20754 20562 21766 647182 1565855Net Interest Margin 1.63 1.87 2.56 2.27 2.42 2.39 2.79
Cost of Funds (CoF) 6.50 5.78 5.03 6.44 6.68 6.39 6.12Return on advances adjusted to CoF 3.50 3.61 4.34 4.17 3.87 3.76 4.21Wages as % to total expenses 12.56 12.04 15.42 10.82 9.71 11.81 13.02
Return on Equity 16.20 22.08 14.36 13.83 6.76 12.34 13.84Return on Assets 0.59 0.87 0.66 0.69 0.33 0.74 1.03CRAR 11.93 13.21 13.71 12.35 14.15 12.26 13.88Net NPA ratio 1.18 1.17 1.84 1.96 3.17 2.00 1.68

32
NATIONALISED BANKS Union Bank of India(Amount in ` Million)
Items 2008-09 2009-10 2010-11 2011-12 2012-13Group
Aggregate 2012-13
All Banks’ Aggregate
2012-13No. of offices 2684 2941 3150 3344 3660 54478 92114No. of employees 29014 29419 27746 30838 31798 507694 1096984Business per employee 69.40 85.30 104.30 107.00 121.50 142.23 121.33Profit per employee 0.63 0.75 0.80 0.60 0.70 0.65 0.83
Capital and Reserves & Surplus 87404 104238 127645 146331 172962 2832832 7089300Deposits 1387028 1700397 2024613 2228689 2637616 41272523 74295324Investments 429970 544035 583991 623636 808304 12861079 26132752Advances 965342 1193153 1509861 1778821 2081022 30935500 58797025
Interest Income 118894 133027 164526 210285 251247 3911088 7636115Other income 14826 19747 20388 24482 25520 370370 977866Interest expended 80758 91103 102364 142354 175819 2813956 5138027Operating expenses 22141 25078 39500 39875 45122 647182 1565855Net Interest Margin 2.68 2.35 2.88 2.73 2.63 2.39 2.79
Cost of Funds (CoF) 6.03 5.28 4.89 5.93 6.37 6.39 6.12Return on advances adjusted to CoF 4.39 3.70 4.02 3.81 3.55 3.76 4.21Wages as % to total expenses 11.19 11.66 18.33 13.61 12.47 11.81 13.02
Return on Equity 21.46 21.65 17.96 13.05 13.52 12.34 13.84Return on Assets 1.27 1.25 1.05 0.79 0.79 0.74 1.03CRAR 13.27 12.51 12.95 11.85 11.45 12.26 13.88Net NPA ratio 0.34 0.81 1.19 1.70 1.61 2.00 1.68

33
NATIONALISED BANKS United Bank of India(Amount in ` Million)
Items 2008-09 2009-10 2010-11 2011-12 2012-13Group
Aggregate 2012-13
All Banks’ Aggregate
2012-13No. of offices 1485 1564 1601 1659 1706 54478 92114No. of employees 15111 15285 15062 15500 15479 507694 1096984Business per employee 58.50 71.40 86.00 97.10 108.30 142.23 121.33Profit per employee 0.12 0.21 0.35 0.41 0.25 0.65 0.83
Capital and Reserves & Surplus 30778 39029 50217 55797 58837 2832832 7089300Deposits 545359 681803 778448 891163 1006515 41272523 74295324Investments 179242 260677 262589 290588 334634 12861079 26132752Advances 353935 423300 535024 630433 689087 30935500 58797025
Interest Income 43119 52489 63415 79611 92515 3911088 7636115Other income 4909 5587 6371 7329 10666 370370 977866Interest expended 31504 38577 41721 54819 67642 2813956 5138027Operating expenses 9751 10741 12994 13833 15039 647182 1565855Net Interest Margin 2.00 2.00 2.60 2.58 2.30 2.39 2.79
Cost of Funds (CoF) 5.78 5.92 5.17 5.88 6.39 6.39 6.12Return on advances adjusted to CoF 3.72 3.55 4.50 4.47 4.06 3.76 4.21Wages as % to total expenses 15.94 13.43 14.88 12.98 11.28 11.81 13.02
Return on Equity 6.44 9.24 11.74 11.93 6.84 12.34 13.84Return on Assets 0.34 0.45 0.66 0.70 0.38 0.74 1.03CRAR 13.28 12.80 13.05 12.69 11.66 12.26 13.88Net NPA ratio 1.48 1.84 1.42 1.72 2.87 2.00 1.68

34
NATIONALISED BANKS Vijaya Bank(Amount in ` Million)
Items 2008-09 2009-10 2010-11 2011-12 2012-13Group
Aggregate 2012-13
All Banks’ Aggregate
2012-13No. of offices 1175 1231 1276 1377 1432 54478 92114No. of employees 11975 11565 11079 11838 12601 507694 1096984Business per employee 75.60 83.60 92.80 112.80 124.00 142.23 121.33Profit per employee 0.23 0.45 0.63 0.50 0.50 0.65 0.83
Capital and Reserves & Surplus 31493 34752 48170 52522 55587 2832832 7089300Deposits 545354 619317 732483 830555 970172 41272523 74295324Investments 173877 211074 251386 286438 312850 12861079 26132752Advances 354677 415067 487186 579037 697658 30935500 58797025
Interest Income 52378 52006 58441 79881 90519 3911088 7636115Other income 6988 6795 5332 5279 6070 370370 977866Interest expended 41130 37516 38973 60846 71739 2813956 5138027Operating expenses 9247 10716 14333 12014 13630 647182 1565855Net Interest Margin 1.90 2.19 2.56 2.14 1.82 2.39 2.79
Cost of Funds (CoF) 7.15 5.84 5.23 7.10 7.14 6.39 6.12Return on advances adjusted to CoF 4.25 4.13 4.06 4.24 3.52 3.76 4.21Wages as % to total expenses 11.86 14.63 18.96 10.16 9.94 11.81 13.02
Return on Equity 9.36 15.32 12.63 11.54 10.83 12.34 13.84Return on Assets 0.59 0.76 0.72 0.66 0.59 0.74 1.03CRAR 13.15 12.50 13.88 13.06 11.32 12.26 13.88Net NPA ratio 0.82 1.40 1.52 1.72 1.30 2.00 1.68

35
OLD PRIVATE SECTOR BANKS Catholic Syrian Bank(Amount in ` Million)
Items 2008-09 2009-10 2010-11 2011-12 2012-13Group
Aggregate 2012-13
All Banks’ Aggregate
2012-13No. of offices 377 378 377 385 403 6283 92114No. of employees 2676 2696 2820 2651 2817 66208 1096984Business per employee 37.40 41.90 53.70 67.50 73.60 97.24 121.33Profit per employee 0.14 0.01 0.05 0.10 0.12 0.75 0.83
Capital and Reserves & Surplus 3883 3898 5451 5655 7576 330127 7089300Deposits 63328 69784 87257 106049 123416 3738964 74295324Investments 21840 22894 26903 31451 33011 1344993 26132752Advances 36838 44669 62200 76635 88515 2699373 58797025
Interest Income 5566 5780 7621 10756 13209 399275 7636115Other income 996 740 745 852 946 41452 977866Interest expended 3909 4552 5140 7686 9816 278598 5138027Operating expenses 1865 1891 2890 2988 3318 77459 1565855Net Interest Margin 2.55 1.67 2.83 2.81 2.64 2.94 2.79
Cost of Funds (CoF) 6.50 6.61 6.20 7.36 8.07 7.27 6.12Return on advances adjusted to CoF 5.26 3.63 5.05 5.05 4.94 4.88 4.21Wages as % to total expenses 20.65 18.11 26.43 19.89 17.81 12.28 13.02
Return on Equity 10.72 0.43 2.60 4.66 4.94 16.22 13.84Return on Assets 0.57 0.02 0.14 0.24 0.25 1.26 1.03CRAR 12.29 10.82 11.22 11.08 12.29 13.73 13.88Net NPA ratio 2.39 1.58 1.74 1.10 1.12 0.77 1.68

36
OLD PRIVATE SECTOR BANKS City Union Bank(Amount in ` Million)
Items 2008-09 2009-10 2010-11 2011-12 2012-13Group
Aggregate 2012-13
All Banks’ Aggregate
2012-13No. of offices 210 225 249 303 377 6283 92114No. of employees 2424 2628 2840 3347 3785 66208 1096984Business per employee 56.52 65.10 78.10 84.70 93.80 97.24 121.33Profit per employee 0.50 0.60 0.80 0.80 0.90 0.75 0.83
Capital and Reserves & Surplus 6609 8256 10066 12431 16407 330127 7089300Deposits 82066 102846 129143 163408 203048 3738964 74295324Investments 23975 32104 36162 45862 52668 1344993 26132752Advances 56453 68335 92555 121375 152461 2699373 58797025
Interest Income 8044 9566 12184 16968 21888 399275 7636115Other income 1237 1435 1574 2071 2736 41452 977866Interest expended 5618 6785 7984 11970 15647 278598 5138027Operating expenses 1395 1659 2164 2798 3742 77459 1565855Net Interest Margin 2.92 2.67 3.21 3.03 3.02 2.94 2.79
Cost of Funds (CoF) 7.61 7.27 6.74 7.95 8.16 7.27 6.12Return on advances adjusted to CoF 5.27 4.85 5.26 5.03 5.07 4.88 4.21Wages as % to total expenses 9.26 9.49 10.01 8.28 7.78 12.28 13.02
Return on Equity 19.90 20.55 23.47 24.91 22.33 16.22 13.84Return on Assets 1.50 1.52 1.67 1.71 1.58 1.26 1.03CRAR 12.69 13.46 12.75 12.57 13.98 13.73 13.88Net NPA ratio 1.08 0.58 0.52 0.44 0.63 0.77 1.68

37
OLD PRIVATE SECTOR BANKS Dhanlaxmi Bank(Amount in ` Million)
Items 2008-09 2009-10 2010-11 2011-12 2012-13Group
Aggregate 2012-13
All Banks’ Aggregate
2012-13No. of offices 190 282 289 294 294 6283 92114No. of employees 1402 3275 3665 3468 2601 66208 1096984Business per employee 58.59 36.96 58.92 59.29 72.97 97.24 121.33Profit per employee 0.41 0.07 0.07 -0.33 0.01 0.75 0.83
Capital and Reserves & Surplus 4245 4401 8446 7282 7660 330127 7089300Deposits 49688 70985 125296 118044 112021 3738964 74295324Investments 15674 20278 36397 43602 46845 1344993 26132752Advances 31961 50063 90652 87581 77771 2699373 58797025
Interest Income 4084 5346 9064 13937 13080 399275 7636115Other income 794 910 1468 1436 1143 41452 977866Interest expended 2868 3940 6413 11461 10316 278598 5138027Operating expenses 1131 1929 3445 4890 3393 77459 1565855Net Interest Margin 2.51 2.05 2.37 1.71 1.94 2.94 2.79
Cost of Funds (CoF) 6.53 6.15 6.00 8.25 7.28 7.27 6.12Return on advances adjusted to CoF 4.50 4.07 3.94 3.82 4.47 4.88 4.21Wages as % to total expenses 15.65 18.59 20.44 16.75 13.62 12.28 13.02
Return on Equity 19.26 5.39 4.06 -14.70 0.35 16.22 13.84Return on Assets 1.21 0.35 0.23 -0.73 0.02 1.26 1.03CRAR 15.38 12.99 11.80 9.49 11.06 13.73 13.88Net NPA ratio 0.88 0.84 0.30 0.66 3.36 0.77 1.68

38
OLD PRIVATE SECTOR BANKS Federal Bank(Amount in ` Million)
Items 2008-09 2009-10 2010-11 2011-12 2012-13Group
Aggregate 2012-13
All Banks’ Aggregate
2012-13No. of offices 639 700 771 978 1128 6283 92114No. of employees 7570 7896 8270 8745 10059 66208 1096984Business per employee 75.00 81.30 92.30 101.10 107.50 97.24 121.33Profit per employee 0.69 0.60 0.70 0.90 0.90 0.75 0.83
Capital and Reserves & Surplus 43259 46904 51087 57063 63647 330127 7089300Deposits 321982 360580 430148 489371 576149 3738964 74295324Investments 121190 130546 145377 174025 211546 1344993 26132752Advances 223919 269501 319532 377560 440967 2699373 58797025
Interest Income 33154 36732 40520 55584 61676 399275 7636115Other income 5158 5309 5168 5323 6644 41452 977866Interest expended 19999 22624 23054 36050 41929 278598 5138027Operating expenses 5715 6769 8361 9793 11795 77459 1565855Net Interest Margin 3.69 3.42 3.67 3.49 3.00 2.94 2.79
Cost of Funds (CoF) 6.32 6.11 5.26 6.89 6.75 7.27 6.12Return on advances adjusted to CoF 6.10 5.44 5.49 5.13 4.57 4.88 4.21Wages as % to total expenses 12.35 12.45 15.29 11.86 11.66 12.28 13.02
Return on Equity 12.13 10.30 11.98 14.37 13.89 16.22 13.84Return on Assets 1.48 1.15 1.34 1.41 1.35 1.26 1.03CRAR 20.22 18.36 16.79 16.64 14.73 13.73 13.88Net NPA ratio 0.30 0.48 0.60 0.53 0.98 0.77 1.68

39
OLD PRIVATE SECTOR BANKS ING Vysya Bank(Amount in ` Million)
Items 2008-09 2009-10 2010-11 2011-12 2012-13Group
Aggregate 2012-13
All Banks’ Aggregate
2012-13No. of offices 474 497 527 547 562 6283 92114No. of employees 6086 6113 6909 9642 9381 66208 1096984Business per employee 60.64 62.38 67.48 55.98 64.43 97.24 121.33Profit per employee 0.30 0.39 0.45 0.46 0.63 0.75 0.83
Capital and Reserves & Surplus 17029 23309 26243 39798 46268 330127 7089300Deposits 248895 258653 301942 351954 413340 3738964 74295324Investments 104955 104729 110583 127155 182782 1344993 26132752Advances 167564 185072 236021 287214 317720 2699373 58797025
Interest Income 22399 22329 26941 38568 48616 399275 7636115Other income 5477 6202 6550 6698 7269 41452 977866Interest expended 15903 14031 16875 26485 33230 278598 5138027Operating expenses 7725 8081 10260 11102 12728 77459 1565855Net Interest Margin 2.26 2.52 2.76 2.81 3.02 2.94 2.79
Cost of Funds (CoF) 5.84 4.10 4.40 6.38 6.70 7.27 6.12Return on advances adjusted to CoF 5.29 5.59 5.26 4.58 5.04 4.88 4.21Wages as % to total expenses 16.60 19.39 22.32 17.32 16.33 12.28 13.02
Return on Equity 11.66 12.01 12.86 13.82 14.24 16.22 13.84Return on Assets 0.70 0.80 0.89 1.09 1.26 1.26 1.03CRAR 11.65 14.91 12.94 14.00 13.24 13.73 13.88Net NPA ratio 1.20 1.20 0.39 0.18 0.03 0.77 1.68
40
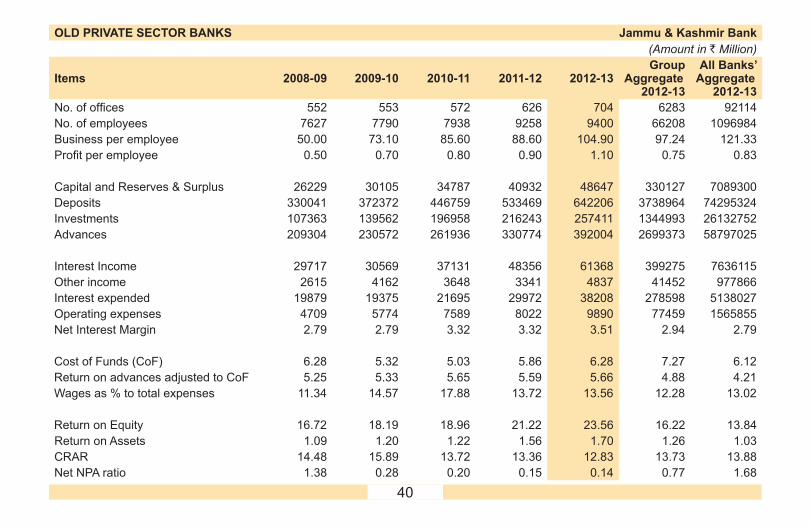
OLD PRIVATE SECTOR BANKS Jammu & Kashmir Bank(Amount in ` Million)
Items 2008-09 2009-10 2010-11 2011-12 2012-13Group
Aggregate 2012-13
All Banks’ Aggregate
2012-13No. of offices 552 553 572 626 704 6283 92114No. of employees 7627 7790 7938 9258 9400 66208 1096984Business per employee 50.00 73.10 85.60 88.60 104.90 97.24 121.33Profit per employee 0.50 0.70 0.80 0.90 1.10 0.75 0.83
Capital and Reserves & Surplus 26229 30105 34787 40932 48647 330127 7089300Deposits 330041 372372 446759 533469 642206 3738964 74295324Investments 107363 139562 196958 216243 257411 1344993 26132752Advances 209304 230572 261936 330774 392004 2699373 58797025
Interest Income 29717 30569 37131 48356 61368 399275 7636115Other income 2615 4162 3648 3341 4837 41452 977866Interest expended 19879 19375 21695 29972 38208 278598 5138027Operating expenses 4709 5774 7589 8022 9890 77459 1565855Net Interest Margin 2.79 2.79 3.32 3.32 3.51 2.94 2.79
Cost of Funds (CoF) 6.28 5.32 5.03 5.86 6.28 7.27 6.12Return on advances adjusted to CoF 5.25 5.33 5.65 5.59 5.66 4.88 4.21Wages as % to total expenses 11.34 14.57 17.88 13.72 13.56 12.28 13.02
Return on Equity 16.72 18.19 18.96 21.22 23.56 16.22 13.84Return on Assets 1.09 1.20 1.22 1.56 1.70 1.26 1.03CRAR 14.48 15.89 13.72 13.36 12.83 13.73 13.88Net NPA ratio 1.38 0.28 0.20 0.15 0.14 0.77 1.68
41
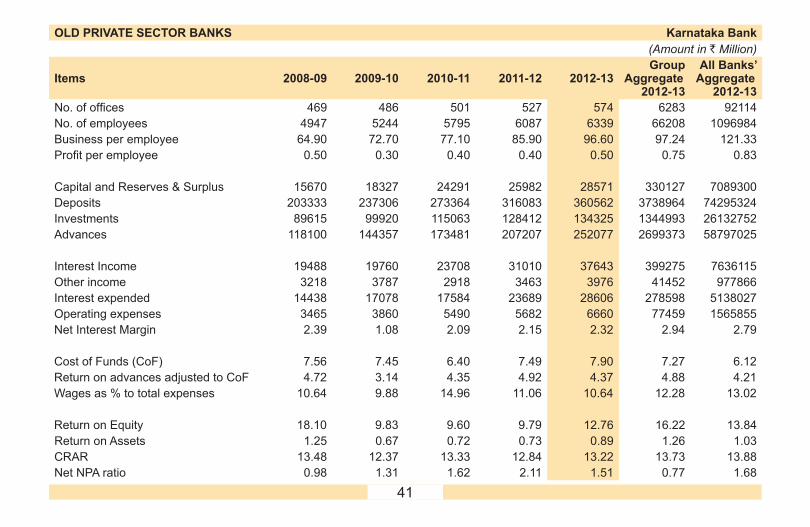
OLD PRIVATE SECTOR BANKS Karnataka Bank(Amount in ` Million)
Items 2008-09 2009-10 2010-11 2011-12 2012-13Group
Aggregate 2012-13
All Banks’ Aggregate
2012-13No. of offices 469 486 501 527 574 6283 92114No. of employees 4947 5244 5795 6087 6339 66208 1096984Business per employee 64.90 72.70 77.10 85.90 96.60 97.24 121.33Profit per employee 0.50 0.30 0.40 0.40 0.50 0.75 0.83
Capital and Reserves & Surplus 15670 18327 24291 25982 28571 330127 7089300Deposits 203333 237306 273364 316083 360562 3738964 74295324Investments 89615 99920 115063 128412 134325 1344993 26132752Advances 118100 144357 173481 207207 252077 2699373 58797025
Interest Income 19488 19760 23708 31010 37643 399275 7636115Other income 3218 3787 2918 3463 3976 41452 977866Interest expended 14438 17078 17584 23689 28606 278598 5138027Operating expenses 3465 3860 5490 5682 6660 77459 1565855Net Interest Margin 2.39 1.08 2.09 2.15 2.32 2.94 2.79
Cost of Funds (CoF) 7.56 7.45 6.40 7.49 7.90 7.27 6.12Return on advances adjusted to CoF 4.72 3.14 4.35 4.92 4.37 4.88 4.21Wages as % to total expenses 10.64 9.88 14.96 11.06 10.64 12.28 13.02
Return on Equity 18.10 9.83 9.60 9.79 12.76 16.22 13.84Return on Assets 1.25 0.67 0.72 0.73 0.89 1.26 1.03CRAR 13.48 12.37 13.33 12.84 13.22 13.73 13.88Net NPA ratio 0.98 1.31 1.62 2.11 1.51 0.77 1.68

42
OLD PRIVATE SECTOR BANKS Karur Vysya Bank(Amount in ` Million)
Items 2008-09 2009-10 2010-11 2011-12 2012-13Group
Aggregate 2012-13
All Banks’ Aggregate
2012-13No. of offices 343 369 404 487 592 6283 92114No. of employees 3941 4175 4572 5673 6730 66208 1096984Business per employee 63.80 78.90 92.60 98.40 101.40 97.24 121.33Profit per employee 0.60 0.81 0.91 0.88 0.82 0.75 0.83
Capital and Reserves & Surplus 13502 16200 21145 27082 30852 330127 7089300Deposits 151014 192719 247219 321116 386530 3738964 74295324Investments 47160 66022 77318 105061 138373 1344993 26132752Advances 104099 134470 178145 239492 294801 2699373 58797025
Interest Income 14461 17579 22177 32704 42424 399275 7636115Other income 2652 2470 2643 3501 4526 41452 977866Interest expended 10357 11930 14508 23532 30840 278598 5138027Operating expenses 2576 3487 4306 5416 7622 77459 1565855Net Interest Margin 2.59 2.90 3.06 2.79 2.75 2.94 2.79
Cost of Funds (CoF) 7.36 6.79 6.31 7.64 7.62 7.27 6.12Return on advances adjusted to CoF 4.14 4.42 4.45 4.51 4.64 4.88 4.21Wages as % to total expenses 9.50 10.59 12.20 9.13 8.93 12.28 13.02
Return on Equity 18.57 22.63 22.26 20.81 19.00 16.22 13.84Return on Assets 1.49 1.76 1.71 1.56 1.35 1.26 1.03CRAR 14.92 14.49 14.41 14.33 14.41 13.73 13.88Net NPA ratio 0.25 0.23 0.07 0.33 0.37 0.77 1.68

43
OLD PRIVATE SECTOR BANKS Lakshmi Vilas Bank(Amount in ` Million)
Items 2008-09 2009-10 2010-11 2011-12 2012-13Group
Aggregate 2012-13
All Banks’ Aggregate
2012-13No. of offices 265 285 289 310 311 6283 92114No. of employees 2433 2655 2626 3054 3149 66208 1096984Business per employee 51.00 56.00 71.90 78.70 86.30 97.24 121.33Profit per employee 0.21 0.11 0.39 0.35 0.29 0.75 0.83
Capital and Reserves & Surplus 4537 7390 8924 9584 10143 330127 7089300Deposits 73609 90754 111495 141141 156190 3738964 74295324Investments 18631 29832 35189 43951 43245 1344993 26132752Advances 52362 62775 80944 101887 117028 2699373 58797025
Interest Income 6576 9093 10648 15193 17605 399275 7636115Other income 1070 1036 1370 1579 1971 41452 977866Interest expended 5041 6602 6998 11480 13685 278598 5138027Operating expenses 1517 1865 2281 2937 3379 77459 1565855Net Interest Margin 2.07 2.65 3.07 2.52 2.32 2.94 2.79
Cost of Funds (CoF) 7.56 7.81 6.58 8.64 8.89 7.27 6.12Return on advances adjusted to CoF 3.83 4.70 5.03 4.34 3.84 4.88 4.21Wages as % to total expenses 11.96 10.92 12.53 9.80 9.24 12.28 13.02
Return on Equity 11.54 5.14 12.40 11.56 9.28 16.22 13.84Return on Assets 0.71 0.33 0.91 0.73 0.54 1.26 1.03CRAR 10.29 14.82 13.19 13.10 12.32 13.73 13.88Net NPA ratio 1.24 4.11 0.90 1.74 2.43 0.77 1.68
44
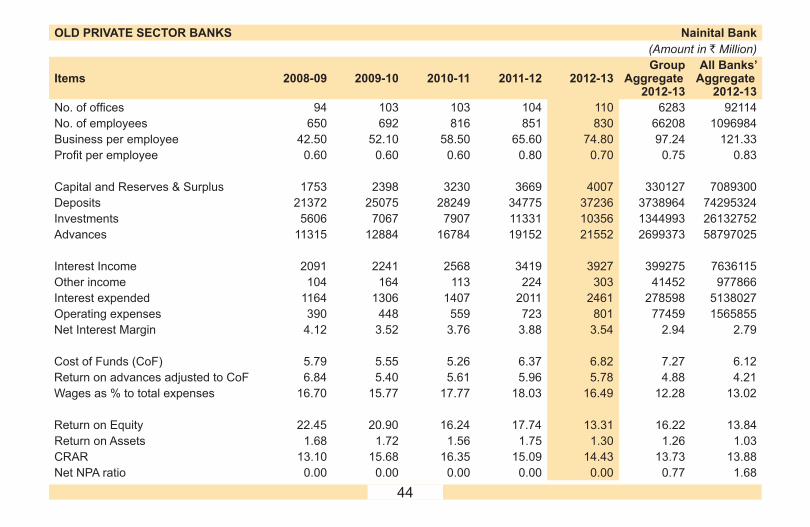
OLD PRIVATE SECTOR BANKS Nainital Bank(Amount in ` Million)
Items 2008-09 2009-10 2010-11 2011-12 2012-13Group
Aggregate 2012-13
All Banks’ Aggregate
2012-13No. of offices 94 103 103 104 110 6283 92114No. of employees 650 692 816 851 830 66208 1096984Business per employee 42.50 52.10 58.50 65.60 74.80 97.24 121.33Profit per employee 0.60 0.60 0.60 0.80 0.70 0.75 0.83
Capital and Reserves & Surplus 1753 2398 3230 3669 4007 330127 7089300Deposits 21372 25075 28249 34775 37236 3738964 74295324Investments 5606 7067 7907 11331 10356 1344993 26132752Advances 11315 12884 16784 19152 21552 2699373 58797025
Interest Income 2091 2241 2568 3419 3927 399275 7636115Other income 104 164 113 224 303 41452 977866Interest expended 1164 1306 1407 2011 2461 278598 5138027Operating expenses 390 448 559 723 801 77459 1565855Net Interest Margin 4.12 3.52 3.76 3.88 3.54 2.94 2.79
Cost of Funds (CoF) 5.79 5.55 5.26 6.37 6.82 7.27 6.12Return on advances adjusted to CoF 6.84 5.40 5.61 5.96 5.78 4.88 4.21Wages as % to total expenses 16.70 15.77 17.77 18.03 16.49 12.28 13.02
Return on Equity 22.45 20.90 16.24 17.74 13.31 16.22 13.84Return on Assets 1.68 1.72 1.56 1.75 1.30 1.26 1.03CRAR 13.10 15.68 16.35 15.09 14.43 13.73 13.88Net NPA ratio 0.00 0.00 0.00 0.00 0.00 0.77 1.68

45
OLD PRIVATE SECTOR BANKS Ratnakar Bank(Amount in ` Million)
Items 2008-09 2009-10 2010-11 2011-12 2012-13Group
Aggregate 2012-13
All Banks’ Aggregate
2012-13No. of offices 87 90 102 103 126 6283 92114No. of employees 566 707 907 1328 1859 66208 1096984Business per employee 37.30 39.10 43.50 60.70 73.90 97.24 121.33Profit per employee 0.50 0.30 0.10 0.50 0.50 0.75 0.83
Capital and Reserves & Surplus 3412 3530 10850 11432 16067 330127 7089300Deposits 13070 15850 20422 47393 83405 3738964 74295324Investments 4045 5072 8925 23338 55714 1344993 26132752Advances 8011 11704 19052 41323 63762 2699373 58797025
Interest Income 1379 1442 1892 4651 8793 399275 7636115Other income 157 132 186 671 1264 41452 977866Interest expended 744 852 940 2783 6218 278598 5138027Operating expenses 333 387 945 1391 2273 77459 1565855Net Interest Margin 3.99 3.11 3.58 3.58 2.55 2.94 2.79
Cost of Funds (CoF) 6.14 5.86 5.16 6.80 7.15 7.27 6.12Return on advances adjusted to CoF 5.02 3.86 3.56 4.71 4.59 4.88 4.21Wages as % to total expenses 19.04 18.47 38.34 20.16 14.73 12.28 13.02
Return on Equity 9.19 5.50 1.71 5.90 6.73 16.22 13.84Return on Assets 1.96 1.05 0.53 1.38 1.06 1.26 1.03CRAR 42.30 34.07 56.41 23.20 17.11 13.73 13.88Net NPA ratio 0.68 0.97 0.36 0.20 0.11 0.77 1.68

46
OLD PRIVATE SECTOR BANKS South Indian Bank(Amount in ` Million)
Items 2008-09 2009-10 2010-11 2011-12 2012-13Group
Aggregate 2012-13
All Banks’ Aggregate
2012-13No. of offices 541 591 653 713 762 6283 92114No. of employees 4523 4860 5619 5630 6087 66208 1096984Business per employee 64.50 77.10 91.80 107.90 120.10 97.24 121.33Profit per employee 0.40 0.50 0.50 0.70 0.80 0.75 0.83
Capital and Reserves & Surplus 13040 14853 18473 21704 30062 330127 7089300Deposits 180923 230115 297211 365005 442623 3738964 74295324Investments 60752 71556 89238 93999 125235 1344993 26132752Advances 118479 158229 204887 272807 318155 2699373 58797025
Interest Income 16869 19357 24460 35834 44343 399275 7636115Other income 1643 2085 1967 2471 3349 41452 977866Interest expended 11640 13674 16549 25617 31535 278598 5138027Operating expenses 3285 3662 4625 6173 7672 77459 1565855Net Interest Margin 2.79 2.48 2.71 2.79 2.84 2.94 2.79
Cost of Funds (CoF) 6.83 6.42 6.11 7.56 7.54 7.27 6.12Return on advances adjusted to CoF 4.56 4.56 4.52 4.45 4.56 4.88 4.21Wages as % to total expenses 14.35 13.06 13.69 11.77 12.05 12.28 13.02
Return on Equity 15.80 16.76 17.56 19.99 19.41 16.22 13.84Return on Assets 1.09 1.07 1.05 1.12 1.17 1.26 1.03CRAR 14.76 15.39 14.01 14.00 13.91 13.73 13.88Net NPA ratio 1.13 0.39 0.29 0.28 0.78 0.77 1.68

47
OLD PRIVATE SECTOR BANKS Tamilnad Mercantile Bank(Amount in ` Million)
Items 2008-09 2009-10 2010-11 2011-12 2012-13Group
Aggregate 2012-13
All Banks’ Aggregate
2012-13No. of offices 230 233 250 296 340 6283 92114No. of employees 2337 2267 2531 2855 3171 66208 1096984Business per employee 67.93 87.02 95.92 106.88 113.32 97.24 121.33Profit per employee 0.64 0.81 0.99 1.10 1.39 0.75 0.83
Capital and Reserves & Surplus 9885 11482 13660 16348 20221 330127 7089300Deposits 95660 116393 137933 171104 202238 3738964 74295324Investments 32072 34992 37671 48903 53483 1344993 26132752Advances 65717 82876 107587 137789 162560 2699373 58797025
Interest Income 9771 11184 13710 18824 24704 399275 7636115Other income 1358 1728 1883 2317 2487 41452 977866Interest expended 6434 7439 8272 12320 16108 278598 5138027Operating expenses 2043 2314 2980 3490 4185 77459 1565855Net Interest Margin 3.32 3.02 3.66 3.57 3.91 2.94 2.79
Cost of Funds (CoF) 7.41 6.96 6.42 7.71 8.21 7.27 6.12Return on advances adjusted to CoF 5.06 4.54 4.92 4.81 5.58 4.88 4.21Wages as % to total expenses 14.67 14.76 17.33 13.47 11.94 12.28 13.02
Return on Equity 16.27 17.27 19.96 20.89 24.08 16.22 13.84Return on Assets 1.51 1.54 1.74 1.75 2.00 1.26 1.03CRAR 16.05 15.54 15.13 14.69 15.01 13.73 13.88Net NPA ratio 0.34 0.24 0.27 0.45 0.66 0.77 1.68

48
NEW PRIVATE SECTOR BANKS Axis Bank(Amount in ` Million)
Items 2008-09 2009-10 2010-11 2011-12 2012-13Group
Aggregate 2012-13
All Banks’ Aggregate
2012-13No. of offices 831 1035 1466 1701 2019 9718 92114No. of employees 20624 21640 26341 31738 37901 203733 1096984Business per employee 106.00 111.10 136.60 127.60 121.50 93.03 121.33Profit per employee 1.00 1.20 1.40 1.40 1.50 1.18 0.83
Capital and Reserves & Surplus 102148 160446 189988 228085 331079 1599334 7089300Deposits 1173741 1413002 1892378 2201043 2526136 10219391 74295324Investments 463304 559748 719916 931921 1137375 4916070 26132752Advances 815568 1043409 1424078 1697595 1969660 8733113 58797025
Interest Income 108355 116380 151548 219946 271826 1265589 7636115Other income 28969 39458 46321 54202 65511 256475 977866Interest expended 71493 66335 85918 139769 175163 792733 5138027Operating expenses 28582 37097 47794 60071 69142 327392 1565855Net Interest Margin 2.87 3.05 3.10 3.04 3.09 3.30 2.79
Cost of Funds (CoF) 5.74 4.03 4.10 5.29 5.62 5.77 6.12Return on advances adjusted to CoF 4.83 4.57 4.34 4.57 4.83 5.57 4.21Wages as % to total expenses 9.97 12.14 12.07 10.41 9.73 11.40 13.02
Return on Equity 19.12 19.15 19.34 20.29 18.53 16.51 13.84Return on Assets 1.44 1.67 1.68 1.68 1.70 1.74 1.03CRAR 13.69 15.80 12.65 13.66 17.00 17.52 13.88Net NPA ratio 0.40 0.40 0.29 0.27 0.36 0.45 1.68

49
NEW PRIVATE SECTOR BANKS Development Credit Bank(Amount in ` Million)
Items 2008-09 2009-10 2010-11 2011-12 2012-13Group
Aggregate 2012-13
All Banks’ Aggregate
2012-13No. of offices 110 110 110 114 124 9718 92114No. of employees 1942 1591 2174 2053 2220 203733 1096984Business per employee 37.90 51.50 49.10 51.40 67.40 93.03 121.33Profit per employee -0.40 -0.50 0.10 0.20 0.50 1.18 0.83
Capital and Reserves & Surplus 5983 6011 6215 8614 10031 1599334 7089300Deposits 46469 47873 56102 63356 83638 10219391 74295324Investments 16217 20179 22950 25178 33587 4916070 26132752Advances 32740 34597 42817 52844 65861 8733113 58797025
Interest Income 6452 4590 5363 7170 9161 1265589 7636115Other income 1201 1075 1121 1004 1170 256475 977866Interest expended 4480 3174 3471 4893 6317 792733 5138027Operating expenses 2420 2008 2152 2443 2753 327392 1565855Net Interest Margin 2.92 2.34 2.79 2.83 2.85 3.30 2.79
Cost of Funds (CoF) 7.43 5.87 5.68 6.88 7.08 5.77 6.12Return on advances adjusted to CoF 6.04 4.82 4.73 4.33 4.91 5.57 4.21Wages as % to total expenses 15.14 16.99 18.92 16.98 15.20 11.40 13.02
Return on Equity -14.27 -13.08 3.51 7.43 10.95 16.51 13.84Return on Assets -1.25 -1.30 0.30 0.68 1.06 1.74 1.03CRAR 13.30 14.85 13.25 15.41 13.61 17.52 13.88Net NPA ratio 3.88 3.11 0.96 0.57 0.75 0.45 1.68

50
NEW PRIVATE SECTOR BANKS HDFC Bank(Amount in ` Million)
Items 2008-09 2009-10 2010-11 2011-12 2012-13Group
Aggregate 2012-13
All Banks’ Aggregate
2012-13No. of offices 1422 1736 1999 2553 3046 9718 92114No. of employees 52687 51888 55752 66076 69401 203733 1096984Business per employee 44.60 59.00 65.30 65.40 75.00 93.03 121.33Profit per employee 0.42 0.60 0.74 0.80 1.00 1.18 0.83
Capital and Reserves & Surplus 146518 215225 253793 299247 362141 1599334 7089300Deposits 1428116 1674044 2085864 2467064 2962470 10219391 74295324Investments 588175 586076 709294 974829 1116136 4916070 26132752Advances 988830 1258306 1599827 1954200 2397206 8733113 58797025
Interest Income 163323 161727 199282 278742 350649 1265589 7636115Other income 32906 39831 43352 57836 68526 256475 977866Interest expended 89111 77863 93851 149896 192538 792733 5138027Operating expenses 55328 59398 71529 92776 112361 327392 1565855Net Interest Margin 4.69 4.13 4.22 4.19 4.28 3.30 2.79
Cost of Funds (CoF) 6.92 4.66 4.64 6.06 6.41 5.77 6.12Return on advances adjusted to CoF 8.04 6.11 5.91 5.83 5.92 5.57 4.21Wages as % to total expenses 15.50 16.68 17.15 14.01 13.01 11.40 13.02
Return on Equity 17.17 16.30 16.74 18.69 20.34 16.51 13.84Return on Assets 1.28 1.53 1.58 1.77 1.90 1.74 1.03CRAR 15.69 17.44 16.22 16.52 16.80 17.52 13.88Net NPA ratio 0.63 0.31 0.19 0.18 0.20 0.45 1.68

51
NEW PRIVATE SECTOR BANKS ICICI Bank(Amount in ` Million)
Items 2008-09 2009-10 2010-11 2011-12 2012-13Group
Aggregate 2012-13
All Banks’ Aggregate
2012-13No. of offices 1434 1721 2565 2786 3134 9718 92114No. of employees 51835 41068 56969 58276 62065 203733 1096984Business per employee 115.40 76.50 73.50 70.80 73.50 93.03 121.33Profit per employee 1.10 0.90 1.00 1.10 1.40 1.18 0.83
Capital and Reserves & Surplus 495330 516184 550909 604052 667060 1599334 7089300Deposits 2183478 2020166 2256021 2555000 2926136 10219391 74295324Investments 1030583 1208928 1346860 1595600 1713936 4916070 26132752Advances 2183108 1812056 2163659 2537277 2902494 8733113 58797025
Interest Income 310925 257069 259741 335427 400756 1265589 7636115Other income 76037 74777 66479 75028 83457 256475 977866Interest expended 227259 175926 169572 228085 262092 792733 5138027Operating expenses 70451 58598 66172 78504 90129 327392 1565855Net Interest Margin 2.15 2.19 2.34 2.40 2.70 3.30 2.79
Cost of Funds (CoF) 5.72 4.18 3.59 4.32 4.55 5.77 6.12Return on advances adjusted to CoF 4.33 4.51 4.68 5.10 5.50 5.57 4.21Wages as % to total expenses 6.62 8.21 11.95 11.47 11.05 11.40 13.02
Return on Equity 7.80 7.96 9.65 11.20 13.10 16.51 13.84Return on Assets 0.98 1.13 1.35 1.50 1.70 1.74 1.03CRAR 15.53 19.41 19.54 18.52 18.74 17.52 13.88Net NPA ratio 2.09 2.12 1.11 0.73 0.77 0.45 1.68

52
NEW PRIVATE SECTOR BANKS IndusInd Bank(Amount in ` Million)
Items 2008-09 2009-10 2010-11 2011-12 2012-13Group
Aggregate 2012-13
All Banks’ Aggregate
2012-13No. of offices 196 233 323 423 521 9718 92114No. of employees 4251 5383 7008 9370 11502 203733 1096984Business per employee 83.60 83.75 84.40 78.84 84.05 93.03 121.33Profit per employee 0.35 0.65 0.82 0.86 0.92 1.18 0.83
Capital and Reserves & Surplus 16644 23972 40502 47417 76303 1599334 7089300Deposits 221103 267102 343654 423615 541167 10219391 74295324Investments 80834 104018 135508 145719 196542 4916070 26132752Advances 157706 205506 261656 350640 443206 8733113 58797025
Interest Income 23095 27070 35894 53592 69832 1265589 7636115Other income 4563 5535 7137 10118 13630 256475 977866Interest expended 18504 18206 22129 36549 47504 792733 5138027Operating expenses 5470 7360 10085 13430 17564 327392 1565855Net Interest Margin 1.80 2.81 3.40 3.30 3.41 3.30 2.79
Cost of Funds (CoF) 7.53 5.69 5.35 7.19 7.48 5.77 6.12Return on advances adjusted to CoF 5.03 5.95 6.79 6.58 6.66 5.57 4.21Wages as % to total expenses 7.81 11.37 11.88 9.71 10.17 11.40 13.02
Return on Equity 9.84 17.25 17.91 18.26 17.15 16.51 13.84Return on Assets 0.58 1.14 1.46 1.57 1.63 1.74 1.03CRAR 12.55 15.33 15.89 13.85 15.36 17.52 13.88Net NPA ratio 1.14 0.50 0.28 0.27 0.31 0.45 1.68

53
NEW PRIVATE SECTOR BANKS Kotak Mahindra Bank(Amount in ` Million)
Items 2008-09 2009-10 2010-11 2011-12 2012-13Group
Aggregate 2012-13
All Banks’ Aggregate
2012-13No. of offices 225 257 329 363 446 9718 92114No. of employees 8227 8804 10400 12540 13620 203733 1096984Business per employee 34.70 48.70 53.50 61.30 68.60 93.03 121.33Profit per employee 0.30 0.70 0.80 0.90 1.00 1.18 0.83
Capital and Reserves & Surplus 39055 45399 68334 79808 94645 1599334 7089300Deposits 156440 238865 292610 385365 510288 10219391 74295324Investments 91102 125127 171214 215668 288734 4916070 26132752Advances 166253 207751 293293 390792 484690 8733113 58797025
Interest Income 30651 32556 41898 61802 80425 1265589 7636115Other income 2736 6282 7805 9773 11607 256475 977866Interest expended 15466 13975 20922 36677 48368 792733 5138027Operating expenses 11964 11894 15533 18348 22097 327392 1565855Net Interest Margin 5.33 5.62 4.75 4.31 4.29 3.30 2.79
Cost of Funds (CoF) 6.00 4.50 5.20 6.82 6.95 5.77 6.12Return on advances adjusted to CoF 9.50 9.01 7.63 7.41 7.09 5.57 4.21Wages as % to total expenses 21.28 22.56 21.50 16.40 15.26 11.40 13.02
Return on Equity 7.36 13.29 14.39 14.65 15.60 16.51 13.84Return on Assets 1.03 1.72 1.77 1.83 1.81 1.74 1.03CRAR 20.01 18.35 19.92 17.52 16.05 17.52 13.88Net NPA ratio 2.39 1.73 0.72 0.61 0.64 0.45 1.68

54
NEW PRIVATE SECTOR BANKS Yes Bank(Amount in ` Million)
Items 2008-09 2009-10 2010-11 2011-12 2012-13Group
Aggregate 2012-13
All Banks’ Aggregate
2012-13No. of offices 118 151 215 357 428 9718 92114No. of employees 2671 2906 3929 5642 7024 203733 1096984Business per employee 98.84 162.38 222.03 174.77 177.42 93.03 121.33Profit per employee 1.14 1.68 2.09 2.04 2.10 1.18 0.83
Capital and Reserves & Surplus 16242 30896 37941 46766 58077 1599334 7089300Deposits 161694 267986 459389 491517 669556 10219391 74295324Investments 71170 102099 188288 277573 429760 4916070 26132752Advances 124031 221931 343636 379886 469996 8733113 58797025
Interest Income 20014 23697 40417 63074 82940 1265589 7636115Other income 4369 5755 6233 8571 12574 256475 977866Interest expended 14921 15818 27948 46917 60752 792733 5138027Operating expenses 4185 5002 6798 9325 13345 327392 1565855Net Interest Margin 2.55 2.66 2.61 2.44 2.57 3.30 2.79
Cost of Funds (CoF) 8.67 6.05 6.54 8.05 8.01 5.77 6.12Return on advances adjusted to CoF 4.96 4.19 4.03 4.19 4.69 5.57 4.21Wages as % to total expenses 11.41 12.34 10.43 8.45 8.85 11.40 13.02
Return on Equity 20.65 20.27 21.13 23.07 24.81 16.51 13.84Return on Assets 1.59 1.79 1.58 1.57 1.57 1.74 1.03CRAR 16.60 20.60 16.50 17.90 18.30 17.52 13.88Net NPA ratio 0.33 0.06 0.03 0.05 0.01 0.45 1.68
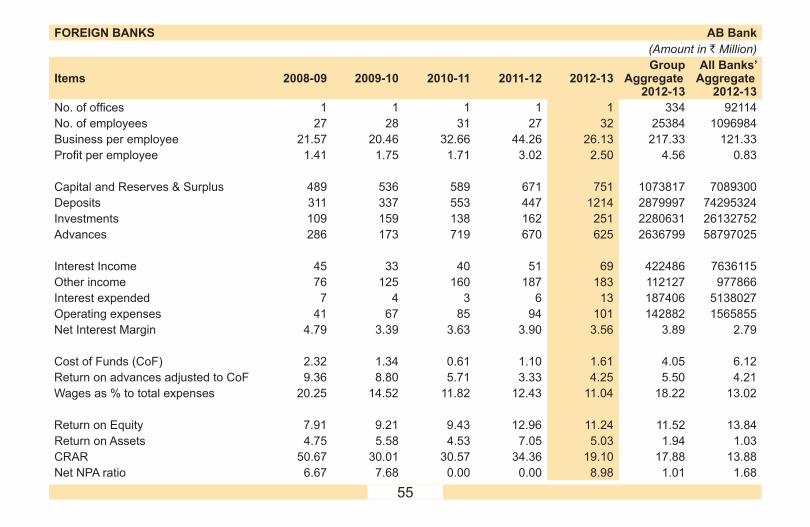
55
FOREIGN BANKS AB Bank(Amount in ` Million)
Items 2008-09 2009-10 2010-11 2011-12 2012-13Group
Aggregate 2012-13
All Banks’ Aggregate
2012-13No. of offices 1 1 1 1 1 334 92114No. of employees 27 28 31 27 32 25384 1096984Business per employee 21.57 20.46 32.66 44.26 26.13 217.33 121.33Profit per employee 1.41 1.75 1.71 3.02 2.50 4.56 0.83
Capital and Reserves & Surplus 489 536 589 671 751 1073817 7089300Deposits 311 337 553 447 1214 2879997 74295324Investments 109 159 138 162 251 2280631 26132752Advances 286 173 719 670 625 2636799 58797025
Interest Income 45 33 40 51 69 422486 7636115Other income 76 125 160 187 183 112127 977866Interest expended 7 4 3 6 13 187406 5138027Operating expenses 41 67 85 94 101 142882 1565855Net Interest Margin 4.79 3.39 3.63 3.90 3.56 3.89 2.79
Cost of Funds (CoF) 2.32 1.34 0.61 1.10 1.61 4.05 6.12Return on advances adjusted to CoF 9.36 8.80 5.71 3.33 4.25 5.50 4.21Wages as % to total expenses 20.25 14.52 11.82 12.43 11.04 18.22 13.02
Return on Equity 7.91 9.21 9.43 12.96 11.24 11.52 13.84Return on Assets 4.75 5.58 4.53 7.05 5.03 1.94 1.03CRAR 50.67 30.01 30.57 34.36 19.10 17.88 13.88Net NPA ratio 6.67 7.68 0.00 0.00 8.98 1.01 1.68

56
FOREIGN BANKS Abu Dhabi Commercial Bank(Amount in ` Million)
Items 2008-09 2009-10 2010-11 2011-12 2012-13Group
Aggregate 2012-13
All Banks’ Aggregate
2012-13No. of offices 2 2 2 2 2 334 92114No. of employees 40 41 43 47 51 25384 1096984Business per employee 176.00 154.26 160.77 163.51 271.80 217.33 121.33Profit per employee 4.20 1.86 1.91 3.40 3.57 4.56 0.83
Capital and Reserves & Surplus 1233 1309 1391 3092 3274 1073817 7089300Deposits 5086 5229 5650 6234 7043 2879997 74295324Investments 1947 2457 2202 2265 2326 2280631 26132752Advances 1373 1524 1803 2892 5198 2636799 58797025
Interest Income 478 411 428 760 1176 422486 7636115Other income 53 33 35 47 67 112127 977866Interest expended 200 201 244 403 694 187406 5138027Operating expenses 131 131 146 176 245 142882 1565855Net Interest Margin 4.51 3.16 2.27 3.30 3.37 3.89 2.79
Cost of Funds (CoF) 4.20 3.89 3.74 4.86 6.50 4.05 6.12Return on advances adjusted to CoF 7.54 4.57 4.54 5.11 2.53 5.50 4.21Wages as % to total expenses 16.30 20.89 21.47 16.63 14.79 18.22 13.02
Return on Equity 14.22 6.00 6.09 7.28 5.72 11.52 13.84Return on Assets 2.40 1.13 1.12 1.87 1.40 1.94 1.03CRAR 47.57 44.79 45.25 80.88 66.82 17.88 13.88Net NPA ratio 0.00 0.19 2.89 0.00 0.00 1.01 1.68

57
FOREIGN BANKS American Express Banking Corp.(Amount in ` Million)
Items 2008-09 2009-10 2010-11 2011-12 2012-13Group
Aggregate 2012-13
All Banks’ Aggregate
2012-13No. of offices 2 2 2 2 2 334 92114No. of employees 857 870 971 623 648 25384 1096984Business per employee 13.38 13.76 16.77 30.12 33.03 217.33 121.33Profit per employee 0.00 0.00 0.27 0.06 -1.12 4.56 0.83
Capital and Reserves & Surplus 4810 4810 6244 6254 7604 1073817 7089300Deposits 3299 5690 5194 5013 6747 2879997 74295324Investments 2134 2213 2390 3412 3909 2280631 26132752Advances 6950 8747 10781 14741 17103 2636799 58797025
Interest Income 774 638 622 783 886 422486 7636115Other income 3348 3146 3978 5046 5576 112127 977866Interest expended 812 321 381 807 1173 187406 5138027Operating expenses 3746 3214 4162 4825 5602 142882 1565855Net Interest Margin -0.31 2.36 1.50 -0.12 -1.23 3.89 2.79
Cost of Funds (CoF) 19.06 6.17 5.83 9.17 10.61 4.05 6.12Return on advances adjusted to CoF -10.55 1.03 -0.76 -4.75 -6.85 5.50 4.21Wages as % to total expenses 22.38 24.40 22.45 19.09 15.96 18.22 13.02
Return on Equity -21.80 -10.46 4.72 0.64 -10.50 11.52 13.84Return on Assets -7.92 -4.24 1.67 0.20 -3.23 1.94 1.03CRAR 21.34 19.10 23.61 19.30 18.17 17.88 13.88Net NPA ratio 4.34 1.59 1.50 1.19 1.87 1.01 1.68

58
FOREIGN BANKS Antwerp Diamond Bank(Amount in ` Million)
Items 2008-09 2009-10 2010-11 2011-12 2012-13Group
Aggregate 2012-13
All Banks’ Aggregate
2012-13No. of offices 1 1 1 1 1 334 92114No. of employees 24 24 25 24 28 25384 1096984Business per employee 337.20 195.56 259.23 387.45 287.20 217.33 121.33Profit per employee 7.08 -0.79 -6.01 5.72 5.09 4.56 0.83
Capital and Reserves & Surplus 2186 2167 2023 2160 2302 1073817 7089300Deposits 808 571 548 768 795 2879997 74295324Investments 2148 1946 1649 1592 1391 2280631 26132752Advances 7003 4461 5997 8878 7603 2636799 58797025
Interest Income 484 343 287 437 572 422486 7636115Other income 134 153 108 179 241 112127 977866Interest expended 225 80 73 198 214 187406 5138027Operating expenses 85 108 120 141 175 142882 1565855Net Interest Margin 2.95 3.14 2.66 2.33 3.31 3.89 2.79
Cost of Funds (CoF) 3.33 1.14 0.67 1.07 1.04 4.05 6.12Return on advances adjusted to CoF 2.33 3.36 2.67 2.35 4.36 5.50 4.21Wages as % to total expenses 11.73 23.24 36.78 23.33 22.33 18.22 13.02
Return on Equity 7.39 -0.87 -6.88 6.57 6.39 11.52 13.84Return on Assets 1.64 -0.25 -1.72 1.20 1.31 1.94 1.03CRAR 26.79 33.72 33.73 25.60 32.72 17.88 13.88Net NPA ratio 3.35 14.32 3.04 1.96 0.00 1.01 1.68

59
FOREIGN BANKS Australia and New Zealand Banking Group(Amount in ` Million)
Items 2011-12 2012-13Group
Aggregate 2012-13
All Banks’ Aggregate
2012-13No. of offices 1 1 334 92114No. of employees 76 79 25384 1096984Business per employee 362.21 617.75 217.33 121.33Profit per employee 0.12 0.55 4.56 0.83
Capital and Reserves & Surplus 5856 11324 1073817 7089300Deposits 17350 25092 2879997 74295324Investments 4520 9950 2280631 26132752Advances 13187 23767 2636799 58797025
Interest Income 944 2813 422486 7636115Other income 705 496 112127 977866Interest expended 405 1627 187406 5138027Operating expenses 1106 1235 142882 1565855Net Interest Margin 1.72 2.95 3.89 2.79
Cost of Funds (CoF) 1.74 5.50 4.05 6.12Return on advances adjusted to CoF 0.01 0.95 5.50 4.21Wages as % to total expenses 33.50 22.26 18.22 13.02
Return on Equity 0.15 0.50 11.52 13.84Return on Assets 0.05 0.10 1.94 1.03CRAR 25.50 26.39 17.88 13.88Net NPA ratio 0.00 0.00 1.01 1.68

60
FOREIGN BANKS Bank Internasional Indonesia(Amount in ` Million)
Items 2008-09 2009-10 2010-11 2011-12 2012-13Group
Aggregate 2012-13
All Banks’ Aggregate
2012-13No. of offices 1 1 1 1 1 334 92114No. of employees 2 2 2 0 9 25384 1096984Business per employee 0.00 0.00 0.00 0.00 0.00 217.33 121.33Profit per employee 0.00 0.00 0.00 0.00 -2.25 4.56 0.83
Capital and Reserves & Surplus 778 780 782 783 2138 1073817 7089300Deposits 0 0 0 0 0 2879997 74295324Investments 8 1 0 0 0 2280631 26132752Advances 0 0 0 0 0 2636799 58797025
Interest Income 2 9 18 27 33 422486 7636115Other income 12 -1 1 0 1 112127 977866Interest expended 0 0 0 0 0 187406 5138027Operating expenses 6 3 4 22 54 142882 1565855Net Interest Margin 0.30 1.17 2.20 3.42 2.19 3.89 2.79
Cost of Funds (CoF) 0.00 0.00 0.00 0.00 0.00 4.05 6.12Return on advances adjusted to CoF 0.00 0.00 0.00 0.00 0.00 5.50 4.21Wages as % to total expenses 0.00 0.00 0.00 0.00 42.32 18.22 13.02
Return on Equity 0.96 0.63 1.44 0.49 -1.38 11.52 13.84Return on Assets 0.94 0.62 1.40 0.48 -0.93 1.94 1.03CRAR 501.34 531.80 515.51 457.82 439.31 17.88 13.88Net NPA ratio 0.00 0.00 0.00 0.00 0.00 1.01 1.68

61
FOREIGN BANKS Bank of America(Amount in ` Million)
Items 2008-09 2009-10 2010-11 2011-12 2012-13Group
Aggregate 2012-13
All Banks’ Aggregate
2012-13No. of offices 5 5 5 5 5 334 92114No. of employees 293 284 323 382 395 25384 1096984Business per employee 243.06 310.20 385.23 339.93 380.70 217.33 121.33Profit per employee 11.09 12.13 13.90 14.89 12.07 4.56 0.83
Capital and Reserves & Surplus 27481 30985 35212 40466 45160 1073817 7089300Deposits 41668 54903 59689 59649 73780 2879997 74295324Investments 36703 83829 48606 82258 88335 2280631 26132752Advances 33559 36312 58591 62054 76230 2636799 58797025
Interest Income 6069 5686 7253 11131 13352 422486 7636115Other income 3933 4929 5810 5079 4735 112127 977866Interest expended 1519 1860 1975 4239 5731 187406 5138027Operating expenses 1752 2439 3585 4055 4307 142882 1565855Net Interest Margin 5.07 3.28 4.11 4.86 4.40 3.89 2.79
Cost of Funds (CoF) 2.22 1.85 1.95 3.55 2.47 4.05 6.12Return on advances adjusted to CoF 9.06 5.75 5.12 7.62 6.08 5.50 4.21Wages as % to total expenses 24.60 29.50 39.08 25.29 24.25 18.22 13.02
Return on Equity 13.06 11.99 12.77 13.89 10.96 11.52 13.84Return on Assets 3.42 2.60 3.77 3.62 2.57 1.94 1.03CRAR 12.73 15.49 14.51 17.59 18.40 17.88 13.88Net NPA ratio 0.00 0.00 0.00 0.00 0.00 1.01 1.68

62
FOREIGN BANKS Bank of Bahrain & Kuwait(Amount in ` Million)
Items 2008-09 2009-10 2010-11 2011-12 2012-13Group
Aggregate 2012-13
All Banks’ Aggregate
2012-13No. of offices 2 2 2 2 2 334 92114No. of employees 103 106 100 98 95 25384 1096984Business per employee 61.60 85.00 89.60 133.60 146.00 217.33 121.33Profit per employee 1.40 0.20 1.40 2.10 1.80 4.56 0.83
Capital and Reserves & Surplus 996 1002 1061 2711 2886 1073817 7089300Deposits 4719 5150 5148 6719 6958 2879997 74295324Investments 1490 2251 2332 3395 3254 2280631 26132752Advances 2868 3866 3829 6435 6926 2636799 58797025
Interest Income 486 405 520 760 947 422486 7636115Other income 148 102 96 107 105 112127 977866Interest expended 250 265 237 289 421 187406 5138027Operating expenses 168 168 173 186 191 142882 1565855Net Interest Margin 4.13 2.15 3.92 4.87 4.46 3.89 2.79
Cost of Funds (CoF) 5.19 4.90 3.55 3.31 4.83 4.05 6.12Return on advances adjusted to CoF 7.12 4.19 6.62 7.30 5.17 5.50 4.21Wages as % to total expenses 17.76 16.73 20.22 18.53 14.17 18.22 13.02
Return on Equity 17.86 2.42 13.87 10.98 6.24 11.52 13.84Return on Assets 3.14 0.37 1.99 2.14 1.48 1.94 1.03CRAR 25.52 25.01 23.28 38.60 34.70 17.88 13.88Net NPA ratio 0.09 1.95 0.52 2.49 3.16 1.01 1.68

63
FOREIGN BANKS Bank of Ceylon(Amount in ` Million)
Items 2008-09 2009-10 2010-11 2011-12 2012-13Group
Aggregate 2012-13
All Banks’ Aggregate
2012-13No. of offices 1 1 1 1 1 334 92114No. of employees 30 30 29 30 28 25384 1096984Business per employee 48.80 44.40 60.50 61.90 73.10 217.33 121.33Profit per employee 7.30 1.80 2.70 2.50 4.50 4.56 0.83
Capital and Reserves & Surplus 804 859 932 1621 1757 1073817 7089300Deposits 864 920 968 1048 1194 2879997 74295324Investments 308 626 375 602 498 2280631 26132752Advances 453 405 667 809 999 2636799 58797025
Interest Income 138 115 133 183 242 422486 7636115Other income 154 61 47 44 50 112127 977866Interest expended 32 38 38 44 56 187406 5138027Operating expenses 32 36 37 40 54 142882 1565855Net Interest Margin 6.03 4.10 4.97 5.87 6.35 3.89 2.79
Cost of Funds (CoF) 3.35 4.18 3.99 4.24 4.66 4.05 6.12Return on advances adjusted to CoF 10.76 7.41 7.03 6.49 5.83 5.50 4.21Wages as % to total expenses 16.28 17.69 17.37 16.72 15.01 18.22 13.02
Return on Equity 28.00 6.69 8.10 6.04 8.07 11.52 13.84Return on Assets 10.23 2.73 3.68 3.08 4.26 1.94 1.03CRAR 45.18 50.85 42.09 96.58 71.45 17.88 13.88Net NPA ratio 0.00 0.00 0.00 0.00 0.00 1.01 1.68

64
FOREIGN BANKS Bank of Nova Scotia(Amount in ` Million)
Items 2008-09 2009-10 2010-11 2011-12 2012-13Group
Aggregate 2012-13
All Banks’ Aggregate
2012-13No. of offices 5 5 5 5 5 334 92114No. of employees 195 196 197 195 195 25384 1096984Business per employee 389.10 375.04 429.41 543.06 576.45 217.33 121.33Profit per employee 7.84 10.14 9.74 12.66 14.70 4.56 0.83
Capital and Reserves & Surplus 8609 10597 12516 14985 17850 1073817 7089300Deposits 29757 34542 36546 46816 60556 2879997 74295324Investments 17262 19217 24385 34831 48422 2280631 26132752Advances 48053 50713 62991 66056 77661 2636799 58797025
Interest Income 5453 4238 4619 6626 8002 422486 7636115Other income 1714 1334 1540 2289 2405 112127 977866Interest expended 3710 1808 2386 3757 4554 187406 5138027Operating expenses 586 457 535 780 841 142882 1565855Net Interest Margin 2.48 3.34 2.63 2.80 2.76 3.89 2.79
Cost of Funds (CoF) 5.94 2.40 3.34 4.32 4.28 4.05 6.12Return on advances adjusted to CoF 2.58 4.58 2.50 2.07 2.12 5.50 4.21Wages as % to total expenses 4.16 8.48 8.11 5.88 5.77 18.22 13.02
Return on Equity 19.49 20.70 16.60 17.96 17.45 11.52 13.84Return on Assets 2.04 2.79 2.20 2.24 2.24 1.94 1.03CRAR 12.70 13.15 11.80 14.93 11.95 17.88 13.88Net NPA ratio 0.00 0.00 0.00 0.00 0.45 1.01 1.68

65
FOREIGN BANKS Bank of Tokyo-Mitsubishi UFJ(Amount in ` Million)
Items 2008-09 2009-10 2010-11 2011-12 2012-13Group
Aggregate 2012-13
All Banks’ Aggregate
2012-13No. of offices 3 3 3 3 4 334 92114No. of employees 95 180 223 273 315 25384 1096984Business per employee 310.79 306.98 310.30 356.60 334.90 217.33 121.33Profit per employee 4.16 4.07 4.60 7.80 8.20 4.56 0.83
Capital and Reserves & Surplus 12078 23071 29217 31341 34023 1073817 7089300Deposits 20760 21994 16543 32842 41464 2879997 74295324Investments 8751 14402 9059 35867 44608 2280631 26132752Advances 29913 33477 52673 64525 68395 2636799 58797025
Interest Income 3154 2564 3133 6019 8217 422486 7636115Other income 627 773 814 1613 1733 112127 977866Interest expended 1743 1264 672 1676 2922 187406 5138027Operating expenses 408 508 688 1308 1685 142882 1565855Net Interest Margin 3.51 2.56 3.92 4.76 4.33 3.89 2.79
Cost of Funds (CoF) 5.26 2.98 1.73 2.60 2.31 4.05 6.12Return on advances adjusted to CoF 3.77 3.45 3.85 4.10 4.71 5.50 4.21Wages as % to total expenses 8.69 11.72 24.31 18.83 16.33 18.22 13.02
Return on Equity 5.77 4.17 3.89 7.02 8.20 11.52 13.84Return on Assets 1.49 1.31 1.64 2.26 2.06 1.94 1.03CRAR 29.51 68.16 58.67 51.60 44.53 17.88 13.88Net NPA ratio 0.00 0.00 0.00 0.00 0.00 1.01 1.68

66
FOREIGN BANKS Barclays Bank(Amount in ` Million)
Items 2008-09 2009-10 2010-11 2011-12 2012-13Group
Aggregate 2012-13
All Banks’ Aggregate
2012-13No. of offices 5 7 9 9 9 334 92114No. of employees 1534 1084 978 610 391 25384 1096984Business per employee 111.01 120.81 143.67 183.14 275.48 217.33 121.33Profit per employee 0.20 -4.23 0.95 -2.31 -1.13 4.56 0.83
Capital and Reserves & Surplus 50014 55160 55410 55410 55410 1073817 7089300Deposits 124855 70754 67401 53826 50632 2879997 74295324Investments 78831 106473 125534 116000 138232 2280631 26132752Advances 105505 75652 83113 86570 84723 2636799 58797025
Interest Income 20365 16593 16804 12913 15086 422486 7636115Other income 5892 1492 4563 -875 2554 112127 977866Interest expended 9785 6981 8325 6190 9808 187406 5138027Operating expenses 8925 7801 7605 5330 5193 142882 1565855Net Interest Margin 6.29 4.58 3.76 2.88 2.23 3.89 2.79
Cost of Funds (CoF) 8.68 4.50 4.27 4.95 5.39 4.05 6.12Return on advances adjusted to CoF 8.61 8.88 6.98 4.87 1.62 5.50 4.21Wages as % to total expenses 14.15 22.00 19.96 28.08 18.14 18.22 13.02
Return on Equity 0.61 -10.54 1.81 -3.30 -1.02 11.52 13.84Return on Assets 0.16 -3.12 0.47 -0.91 -0.27 1.94 1.03CRAR 17.07 16.99 14.89 14.99 19.09 17.88 13.88Net NPA ratio 4.59 5.15 1.46 1.45 1.74 1.01 1.68

67
FOREIGN BANKS BNP Paribas(Amount in ` Million)
Items 2008-09 2009-10 2010-11 2011-12 2012-13Group
Aggregate 2012-13
All Banks’ Aggregate
2012-13No. of offices 9 9 9 9 9 334 92114No. of employees 347 330 335 342 333 25384 1096984Business per employee 203.50 277.60 300.80 351.90 390.50 217.33 121.33Profit per employee 4.90 5.50 5.60 2.40 5.60 4.56 0.83
Capital and Reserves & Surplus 16565 18344 20187 20973 22819 1073817 7089300Deposits 33531 50203 46465 59004 55797 2879997 74295324Investments 35618 40274 38065 33866 45643 2280631 26132752Advances 37099 37376 54507 61842 77373 2636799 58797025
Interest Income 6366 5850 6461 8424 8646 422486 7636115Other income 2432 1947 2581 730 2820 112127 977866Interest expended 2723 1430 2409 4038 4008 187406 5138027Operating expenses 1934 2382 2856 3580 3956 142882 1565855Net Interest Margin 4.18 4.59 4.03 3.91 3.65 3.89 2.79
Cost of Funds (CoF) 4.54 2.17 3.51 5.24 4.69 4.05 6.12Return on advances adjusted to CoF 5.57 5.41 4.48 3.24 2.82 5.50 4.21Wages as % to total expenses 19.57 26.72 21.61 16.83 17.11 18.22 13.02
Return on Equity 11.84 10.34 9.76 3.95 8.56 11.52 13.84Return on Assets 2.13 2.05 2.00 0.73 1.70 1.94 1.03CRAR 12.37 15.78 11.92 14.70 13.82 17.88 13.88Net NPA ratio 0.86 0.00 0.00 0.07 0.00 1.01 1.68

68
FOREIGN BANKS Chinatrust Commercial Bank(Amount in ` Million)
Items 2008-09 2009-10 2010-11 2011-12 2012-13Group
Aggregate 2012-13
All Banks’ Aggregate
2012-13No. of offices 1 1 1 1 2 334 92114No. of employees 31 33 35 34 42 25384 1096984Business per employee 67.50 96.30 107.00 128.90 117.80 217.33 121.33Profit per employee 1.80 1.00 1.30 -0.03 -3.10 4.56 0.83
Capital and Reserves & Surplus 1157 1189 1230 1735 1603 1073817 7089300Deposits 608 1143 971 1466 1927 2879997 74295324Investments 132 166 319 520 1197 2280631 26132752Advances 1485 2035 2346 2846 2765 2636799 58797025
Interest Income 186 169 208 363 382 422486 7636115Other income 30 36 53 59 53 112127 977866Interest expended 64 30 59 149 124 187406 5138027Operating expenses 86 124 115 147 201 142882 1565855Net Interest Margin 6.10 6.39 5.58 6.56 6.49 3.89 2.79
Cost of Funds (CoF) 5.68 3.11 4.12 8.63 5.61 4.05 6.12Return on advances adjusted to CoF 6.16 6.05 4.48 3.87 6.00 5.50 4.21Wages as % to total expenses 20.13 24.79 26.66 21.50 25.94 18.22 13.02
Return on Equity 6.98 2.79 3.33 -0.06 -7.87 11.52 13.84Return on Assets 2.91 1.33 1.39 -0.02 -3.26 1.94 1.03CRAR 45.40 31.12 36.27 44.78 35.12 17.88 13.88Net NPA ratio 0.00 1.39 1.07 3.24 9.71 1.01 1.68

69
FOREIGN BANKS Citibank(Amount in ` Million)
Items 2008-09 2009-10 2010-11 2011-12 2012-13Group
Aggregate 2012-13
All Banks’ Aggregate
2012-13No. of offices 41 43 43 43 43 334 92114No. of employees 4795 4613 5380 5176 5402 25384 1096984Business per employee 188.01 197.99 174.59 197.50 212.40 217.33 121.33Profit per employee 4.51 1.83 2.86 3.60 5.02 4.56 0.83
Capital and Reserves & Surplus 115180 135136 149607 159843 173794 1073817 7089300Deposits 516775 544521 566681 646977 665594 2879997 74295324Investments 245194 281087 303985 431667 440766 2280631 26132752Advances 399199 366551 405970 471030 520355 2636799 58797025
Interest Income 68402 60705 62693 77676 89161 422486 7636115Other income 35823 15913 19472 13933 19972 112127 977866Interest expended 24288 20168 22227 28875 37382 187406 5138027Operating expenses 25872 23543 27170 28014 28948 142882 1565855Net Interest Margin 4.67 4.04 3.91 4.07 4.03 3.89 2.79
Cost of Funds (CoF) 3.56 2.67 2.72 3.00 3.37 4.05 6.12Return on advances adjusted to CoF 9.04 7.82 6.34 6.68 6.40 5.50 4.21Wages as % to total expenses 17.56 20.02 20.47 18.65 16.02 18.22 13.02
Return on Equity 20.83 6.87 10.01 12.42 16.30 11.52 13.84Return on Assets 2.12 0.96 1.37 1.64 2.12 1.94 1.03CRAR 13.23 18.14 17.31 16.03 15.90 17.88 13.88Net NPA ratio 2.63 2.14 1.21 0.90 1.47 1.01 1.68

70
FOREIGN BANKS Commonwealth Bank of Australia(Amount in ` Million)
Items 2010-11 2011-12 2012-13Group
Aggregate 2012-13
All Banks’ Aggregate
2012-13No. of offices 1 1 1 334 92114No. of employees 29 27 29 25384 1096984Business per employee 9.81 37.35 74.19 217.33 121.33Profit per employee -5.81 -2.20 -2.13 4.56 0.83
Capital and Reserves & Surplus 1584 1692 1692 1073817 7089300Deposits 21 109 513 2879997 74295324Investments 68 164 347 2280631 26132752Advances 263 899 1652 2636799 58797025
Interest Income 83 147 174 422486 7636115Other income 20 69 51 112127 977866Interest expended 0 5 23 187406 5138027Operating expenses 270 268 261 142882 1565855Net Interest Margin 4.40 6.79 5.68 3.89 2.79
Cost of Funds (CoF) 0.10 1.28 2.56 4.05 6.12Return on advances adjusted to CoF 1.57 6.46 3.94 5.50 4.21Wages as % to total expenses 38.43 41.46 40.09 18.22 13.02
Return on Equity -10.63 -3.62 -3.66 11.52 13.84Return on Assets -11.50 -2.99 -2.56 1.94 1.03CRAR 143.96 78.29 63.77 17.88 13.88Net NPA ratio 0.00 0.00 0.00 1.01 1.68

71
FOREIGN BANKS Credit Agricole(Amount in ` Million)
Items 2008-09 2009-10 2010-11 2011-12 2012-13Group
Aggregate 2012-13
All Banks’ Aggregate
2012-13No. of offices 6 6 6 6 5 334 92114No. of employees 120 110 109 106 92 25384 1096984Business per employee 210.50 298.30 361.40 266.40 325.60 217.33 121.33Profit per employee 13.00 7.10 4.40 25.50 16.80 4.56 0.83
Capital and Reserves & Surplus 9098 13446 13924 17375 17593 1073817 7089300Deposits 8183 10662 6725 9131 5963 2879997 74295324Investments 40308 41228 38923 40141 32272 2280631 26132752Advances 17630 22345 32752 19186 24042 2636799 58797025
Interest Income 3466 3298 3689 4525 4312 422486 7636115Other income 2549 2398 1803 2633 922 112127 977866Interest expended 1737 1013 1745 2581 2229 187406 5138027Operating expenses 996 803 947 1030 939 142882 1565855Net Interest Margin 3.09 3.34 2.66 2.55 3.04 3.89 2.79
Cost of Funds (CoF) 3.92 1.60 2.92 4.20 4.04 4.05 6.12Return on advances adjusted to CoF 6.18 4.81 2.19 1.71 2.30 5.50 4.21Wages as % to total expenses 21.08 23.40 19.22 14.52 14.65 18.22 13.02
Return on Equity 17.68 6.94 3.50 17.29 8.85 11.52 13.84Return on Assets 4.10 1.72 0.89 4.92 3.21 1.94 1.03CRAR 13.20 19.50 13.98 14.34 17.27 17.88 13.88Net NPA ratio 0.00 6.18 0.00 0.00 0.00 1.01 1.68

72
FOREIGN BANKS Credit Suisse AG(Amount in ` Million)
Items 2011-12 2012-13Group
Aggregate 2012-13
All Banks’ Aggregate
2012-13No. of offices 1 1 334 92114No. of employees 32 34 25384 1096984Business per employee 187.01 256.99 217.33 121.33Profit per employee 27.86 26.60 4.56 0.83
Capital and Reserves & Surplus 12162 13066 1073817 7089300Deposits 3484 4187 2879997 74295324Investments 19554 27020 2280631 26132752Advances 2500 4550 2636799 58797025
Interest Income 1006 2172 422486 7636115Other income 1238 902 112127 977866Interest expended 89 961 187406 5138027Operating expenses 547 519 142882 1565855Net Interest Margin 3.70 4.11 3.89 2.79
Cost of Funds (CoF) 0.48 2.30 4.05 6.12Return on advances adjusted to CoF -0.40 5.82 5.50 4.21Wages as % to total expenses 61.48 23.35 18.22 13.02
Return on Equity 7.33 7.17 11.52 13.84Return on Assets 6.38 3.28 1.94 1.03CRAR 118.02 60.07 17.88 13.88Net NPA ratio 0.00 0.00 1.01 1.68

73
FOREIGN BANKS DBS Bank(Amount in ` Million)
Items 2008-09 2009-10 2010-11 2011-12 2012-13Group
Aggregate 2012-13
All Banks’ Aggregate
2012-13No. of offices 10 10 12 12 12 334 92114No. of employees 359 417 620 786 823 25384 1096984Business per employee 166.23 255.45 240.65 327.82 356.57 217.33 121.33Profit per employee 7.22 6.48 2.05 4.27 3.51 4.56 0.83
Capital and Reserves & Surplus 14005 16706 17978 26418 29303 1073817 7089300Deposits 60229 66371 73680 129220 154876 2879997 74295324Investments 78107 100863 103131 147806 181673 2280631 26132752Advances 27228 40152 75242 128443 138581 2636799 58797025
Interest Income 8086 8798 10659 17971 25592 422486 7636115Other income 3022 1549 961 3110 1288 112127 977866Interest expended 4939 3176 5908 10450 15359 187406 5138027Operating expenses 1648 1677 2726 4121 4881 142882 1565855Net Interest Margin 2.91 3.59 2.24 2.50 2.65 3.89 2.79
Cost of Funds (CoF) 5.47 2.59 3.72 4.56 5.11 4.05 6.12Return on advances adjusted to CoF 3.93 5.61 2.42 2.89 3.18 5.50 4.21Wages as % to total expenses 13.89 15.13 14.50 13.33 10.48 18.22 13.02
Return on Equity 20.38 17.59 7.34 15.12 10.36 11.52 13.84Return on Assets 2.72 2.38 0.79 1.12 0.72 1.94 1.03CRAR 15.70 16.96 14.98 14.38 12.99 17.88 13.88Net NPA ratio 0.55 1.00 0.31 0.60 2.37 1.01 1.68

74
FOREIGN BANKS Deutsche Bank(Amount in ` Million)
Items 2008-09 2009-10 2010-11 2011-12 2012-13Group
Aggregate 2012-13
All Banks’ Aggregate
2012-13No. of offices 13 13 15 15 17 334 92114No. of employees 1599 1498 1453 1351 1675 25384 1096984Business per employee 143.41 184.18 198.88 215.63 257.53 217.33 121.33Profit per employee 2.69 2.98 4.34 6.09 6.17 4.56 0.83
Capital and Reserves & Surplus 47603 49448 55749 63982 78913 1073817 7089300Deposits 141474 146930 146464 168427 207943 2879997 74295324Investments 87049 90471 85984 84215 106012 2280631 26132752Advances 87976 129228 142938 125489 223741 2636799 58797025
Interest Income 18814 15789 18802 23982 27031 422486 7636115Other income 10197 8170 9805 7530 9364 112127 977866Interest expended 5879 3023 4616 5898 7069 187406 5138027Operating expenses 11551 9564 11234 10552 11108 142882 1565855Net Interest Margin 5.21 4.79 4.98 6.31 5.78 3.89 2.79
Cost of Funds (CoF) 3.21 1.60 2.36 3.14 2.99 4.05 6.12Return on advances adjusted to CoF 10.11 7.10 6.16 9.97 8.51 5.50 4.21Wages as % to total expenses 24.34 40.56 34.48 30.08 28.17 18.22 13.02
Return on Equity 9.50 9.20 11.98 13.75 14.46 11.52 13.84Return on Assets 1.75 1.73 1.95 2.58 2.98 1.94 1.03CRAR 15.25 16.45 15.03 14.12 14.08 17.88 13.88Net NPA ratio 0.88 0.79 0.23 0.09 0.13 1.01 1.68

75
FOREIGN BANKS FirstRand Bank(Amount in ` Million)
Items 2009-10 2010-11 2011-12 2012-13Group
Aggregate 2012-13
All Banks’ Aggregate
2012-13No. of offices 1 1 1 1 334 92114No. of employees 35 45 77 88 25384 1096984Business per employee 7.16 36.56 35.80 37.30 217.33 121.33Profit per employee -10.66 -1.97 -0.03 -6.76 4.56 0.83
Capital and Reserves & Surplus 1773 4092 3627 3033 1073817 7089300Deposits 51 254 366 713 2879997 74295324Investments 2091 4937 5613 7848 2280631 26132752Advances 200 1414 2416 2594 2636799 58797025
Interest Income 56 353 629 767 422486 7636115Other income 119 234 223 292 112127 977866Interest expended 10 152 265 286 187406 5138027Operating expenses 539 519 616 1103 142882 1565855Net Interest Margin 1.53 3.83 4.50 4.77 3.89 2.79
Cost of Funds (CoF) 0.46 5.79 5.13 4.02 4.05 6.12Return on advances adjusted to CoF 3.10 -1.63 1.80 3.40 5.50 4.21Wages as % to total expenses 72.07 54.17 47.01 39.55 18.22 13.02
Return on Equity -21.05 -3.02 -0.06 -17.86 11.52 13.84Return on Assets -21.45 -1.37 -0.03 -6.09 1.94 1.03CRAR 74.73 94.81 61.47 47.84 17.88 13.88Net NPA ratio 0.00 0.00 0.00 0.00 1.01 1.68

76
FOREIGN BANKS Hongkong & Shanghai Banking Corporation(Amount in ` Million)
Items 2008-09 2009-10 2010-11 2011-12 2012-13Group
Aggregate 2012-13
All Banks’ Aggregate
2012-13No. of offices 47 50 50 50 50 334 92114No. of employees 7446 6685 6373 5166 4726 25384 1096984Business per employee 96.18 113.55 122.17 165.89 188.99 217.33 121.33Profit per employee 1.61 1.17 2.32 3.47 4.04 4.56 0.83
Capital and Reserves & Surplus 112143 121352 136875 149537 151958 1073817 7089300Deposits 499703 557478 541067 614233 568660 2879997 74295324Investments 311538 412891 372791 403238 451787 2280631 26132752Advances 275887 234748 274006 355123 357087 2636799 58797025
Interest Income 63269 51659 51950 62626 70332 422486 7636115Other income 26994 21355 17886 22008 17242 112127 977866Interest expended 26610 19147 18591 25168 30006 187406 5138027Operating expenses 21947 19501 21909 24183 24646 142882 1565855Net Interest Margin 4.30 3.51 3.67 3.74 3.74 3.89 2.79
Cost of Funds (CoF) 4.82 3.17 3.06 3.83 4.09 4.05 6.12Return on advances adjusted to CoF 8.81 7.19 6.41 4.91 5.85 5.50 4.21Wages as % to total expenses 18.01 21.28 21.59 19.35 19.95 18.22 13.02
Return on Equity 13.13 6.94 11.83 13.88 12.84 11.52 13.84Return on Assets 1.51 0.88 1.68 1.97 1.81 1.94 1.03CRAR 15.31 18.03 18.03 16.04 17.10 17.88 13.88Net NPA ratio 1.42 2.31 0.91 0.62 0.33 1.01 1.68

77
FOREIGN BANKS HSBC Bank Oman S.A.O.G.(Amount in ` Million)
Items 2008-09 2009-10 2010-11 2011-12 2012-13Group
Aggregate 2012-13
All Banks’ Aggregate
2012-13No. of offices 2 2 2 2 2 334 92114No. of employees 39 37 37 38 33 25384 1096984Business per employee 48.05 52.25 44.77 46.37 48.11 217.33 121.33Profit per employee 0.75 2.45 2.88 4.43 7.53 4.56 0.83
Capital and Reserves & Surplus 1681 1699 1720 2192 2229 1073817 7089300Deposits 1866 1716 1658 1552 1488 2879997 74295324Investments 944 938 927 773 401 2280631 26132752Advances 19 18 22 41 51 2636799 58797025
Interest Income 145 144 147 175 173 422486 7636115Other income 26 109 126 230 315 112127 977866Interest expended 92 85 83 95 94 187406 5138027Operating expenses 61 66 72 79 96 142882 1565855Net Interest Margin 1.36 1.52 1.63 1.95 1.98 3.89 2.79
Cost of Funds (CoF) 4.32 4.04 3.95 4.66 5.53 4.05 6.12Return on advances adjusted to CoF -0.25 0.21 0.24 6.64 5.19 5.50 4.21Wages as % to total expenses 11.32 12.59 14.53 15.40 19.41 18.22 13.02
Return on Equity 1.75 5.21 6.73 8.61 11.24 11.52 13.84Return on Assets 1.22 3.52 4.47 6.09 8.80 1.94 1.03CRAR 25.17 41.08 45.64 52.01 55.76 17.88 13.88Net NPA ratio 0.00 0.00 0.00 0.00 0.00 1.01 1.68

78
FOREIGN BANKS Industrial and Commercial Bank of China(Amount in ` Million)
Items 2011-12 2012-13Group
Aggregate 2012-13
All Banks’ Aggregate
2012-13No. of offices 1 1 334 92114No. of employees 15 25 25384 1096984Business per employee 26.71 205.73 217.33 121.33Profit per employee 6.19 6.58 4.56 0.83
Capital and Reserves & Surplus 4654 4818 1073817 7089300Deposits 1 1771 2879997 74295324Investments 0 1038 2280631 26132752Advances 455 3372 2636799 58797025
Interest Income 247 578 422486 7636115Other income 30 36 112127 977866Interest expended 0 74 187406 5138027Operating expenses 101 234 142882 1565855Net Interest Margin 4.76 7.77 3.89 2.79
Cost of Funds (CoF) 0.00 3.96 4.05 6.12Return on advances adjusted to CoF 2.58 10.67 5.50 4.21Wages as % to total expenses 35.97 48.84 18.22 13.02
Return on Equity 2.13 3.47 11.52 13.84Return on Assets 2.05 2.45 1.94 1.03CRAR 241.01 69.43 17.88 13.88Net NPA ratio 0.00 0.00 1.01 1.68

79
FOREIGN BANKS JPMorgan Chase Bank(Amount in ` Million)
Items 2008-09 2009-10 2010-11 2011-12 2012-13Group
Aggregate 2012-13
All Banks’ Aggregate
2012-13No. of offices 1 1 1 1 1 334 92114No. of employees 175 182 221 256 243 25384 1096984Business per employee 182.53 213.58 221.77 472.94 632.68 217.33 121.33Profit per employee 25.36 0.61 21.94 19.38 27.68 4.56 0.83
Capital and Reserves & Surplus 25116 29768 39266 50808 57535 1073817 7089300Deposits 35866 59309 63839 88445 103687 2879997 74295324Investments 66944 91618 99404 133038 176913 2280631 26132752Advances 7025 10122 34627 45293 53445 2636799 58797025
Interest Income 5132 4381 7396 11928 15451 422486 7636115Other income 7209 -1010 5417 3468 5620 112127 977866Interest expended 2308 1799 2471 4440 7423 187406 5138027Operating expenses 1378 1630 2044 2093 2137 142882 1565855Net Interest Margin 3.03 2.29 3.65 4.20 3.49 3.89 2.79
Cost of Funds (CoF) 2.69 2.04 2.40 3.32 4.36 4.05 6.12Return on advances adjusted to CoF 5.67 1.29 2.31 3.72 2.21 5.50 4.21Wages as % to total expenses 21.22 28.60 28.56 19.68 13.27 18.22 13.02
Return on Equity 19.38 0.40 14.05 11.02 12.42 11.52 13.84Return on Assets 4.21 0.09 3.56 2.90 3.07 1.94 1.03CRAR 15.90 23.63 22.99 23.96 26.89 17.88 13.88Net NPA ratio 1.27 2.88 0.00 0.00 0.00 1.01 1.68
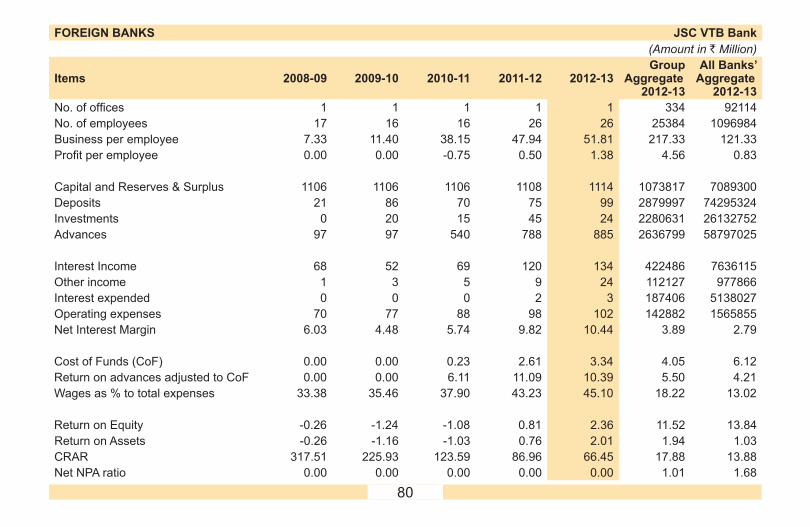
80
FOREIGN BANKS JSC VTB Bank(Amount in ` Million)
Items 2008-09 2009-10 2010-11 2011-12 2012-13Group
Aggregate 2012-13
All Banks’ Aggregate
2012-13No. of offices 1 1 1 1 1 334 92114No. of employees 17 16 16 26 26 25384 1096984Business per employee 7.33 11.40 38.15 47.94 51.81 217.33 121.33Profit per employee 0.00 0.00 -0.75 0.50 1.38 4.56 0.83
Capital and Reserves & Surplus 1106 1106 1106 1108 1114 1073817 7089300Deposits 21 86 70 75 99 2879997 74295324Investments 0 20 15 45 24 2280631 26132752Advances 97 97 540 788 885 2636799 58797025
Interest Income 68 52 69 120 134 422486 7636115Other income 1 3 5 9 24 112127 977866Interest expended 0 0 0 2 3 187406 5138027Operating expenses 70 77 88 98 102 142882 1565855Net Interest Margin 6.03 4.48 5.74 9.82 10.44 3.89 2.79
Cost of Funds (CoF) 0.00 0.00 0.23 2.61 3.34 4.05 6.12Return on advances adjusted to CoF 0.00 0.00 6.11 11.09 10.39 5.50 4.21Wages as % to total expenses 33.38 35.46 37.90 43.23 45.10 18.22 13.02
Return on Equity -0.26 -1.24 -1.08 0.81 2.36 11.52 13.84Return on Assets -0.26 -1.16 -1.03 0.76 2.01 1.94 1.03CRAR 317.51 225.93 123.59 86.96 66.45 17.88 13.88Net NPA ratio 0.00 0.00 0.00 0.00 0.00 1.01 1.68

81
FOREIGN BANKS Krung Thai Bank(Amount in ` Million)
Items 2008-09 2009-10 2010-11 2011-12 2012-13Group
Aggregate 2012-13
All Banks’ Aggregate
2012-13No. of offices 1 1 1 1 1 334 92114No. of employees 10 10 10 10 10 25384 1096984Business per employee 102.17 101.55 117.34 138.46 181.15 217.33 121.33Profit per employee 1.69 0.71 2.36 3.30 3.46 4.56 0.83
Capital and Reserves & Surplus 449 443 463 480 491 1073817 7089300Deposits 1033 1068 1161 1432 1835 2879997 74295324Investments 278 310 323 349 466 2280631 26132752Advances 93 51 132 93 160 2636799 58797025
Interest Income 103 79 95 129 166 422486 7636115Other income 9 11 17 20 15 112127 977866Interest expended 46 37 29 48 78 187406 5138027Operating expenses 32 39 37 34 37 142882 1565855Net Interest Margin 4.10 2.77 4.09 4.45 4.08 3.89 2.79
Cost of Funds (CoF) 4.95 3.48 2.58 3.60 4.75 4.05 6.12Return on advances adjusted to CoF 3.47 3.83 4.27 5.81 4.15 5.50 4.21Wages as % to total expenses 8.15 9.36 11.78 9.87 8.33 18.22 13.02
Return on Equity 4.15 1.75 5.73 7.71 7.85 11.52 13.84Return on Assets 1.36 0.52 1.67 2.12 1.82 1.94 1.03CRAR 81.86 61.02 71.18 62.57 54.57 17.88 13.88Net NPA ratio 0.00 0.00 0.00 0.00 0.00 1.01 1.68

82
FOREIGN BANKS Mashreqbank(Amount in ` Million)
Items 2008-09 2009-10 2010-11 2011-12 2012-13Group
Aggregate 2012-13
All Banks’ Aggregate
2012-13No. of offices 2 2 1 1 1 334 92114No. of employees 16 16 13 14 12 25384 1096984Business per employee 31.00 19.12 52.47 55.76 67.83 217.33 121.33Profit per employee 3.41 2.67 6.02 6.88 9.70 4.56 0.83
Capital and Reserves & Surplus 875 917 996 1092 1208 1073817 7089300Deposits 209 421 599 781 1194 2879997 74295324Investments 528 337 358 400 465 2280631 26132752Advances 98 562 413 523 547 2636799 58797025
Interest Income 53 52 54 52 98 422486 7636115Other income 104 131 168 222 206 112127 977866Interest expended 2 1 1 1 1 187406 5138027Operating expenses 60 84 84 115 110 142882 1565855Net Interest Margin 4.55 4.05 3.43 2.85 4.42 3.89 2.79
Cost of Funds (CoF) 0.59 0.33 0.27 0.15 0.10 4.05 6.12Return on advances adjusted to CoF 4.75 3.46 3.99 2.31 4.12 5.50 4.21Wages as % to total expenses 41.18 36.15 39.81 30.34 24.88 18.22 13.02
Return on Equity 6.44 4.77 8.18 9.23 10.12 11.52 13.84Return on Assets 4.43 3.35 5.03 5.76 5.61 1.94 1.03CRAR 76.80 78.21 59.07 55.37 49.62 17.88 13.88Net NPA ratio 0.00 0.00 0.00 0.00 0.00 1.01 1.68

83
FOREIGN BANKS Mizuho Corporate Bank(Amount in ` Million)
Items 2008-09 2009-10 2010-11 2011-12 2012-13Group
Aggregate 2012-13
All Banks’ Aggregate
2012-13No. of offices 2 2 2 2 2 334 92114No. of employees 113 126 153 174 204 25384 1096984Business per employee 202.38 194.09 208.29 248.80 419.78 217.33 121.33Profit per employee 3.81 1.76 4.77 10.36 9.99 4.56 0.83
Capital and Reserves & Surplus 7442 7647 32378 34149 35877 1073817 7089300Deposits 11475 11881 6710 6728 17434 2879997 74295324Investments 4036 4465 3956 6586 13835 2280631 26132752Advances 11191 10827 25158 35816 55188 2636799 58797025
Interest Income 1290 984 1544 2876 4248 422486 7636115Other income 381 373 673 1075 959 112127 977866Interest expended 582 506 380 163 603 187406 5138027Operating expenses 362 460 540 663 776 142882 1565855Net Interest Margin 4.16 2.20 3.82 5.83 5.61 3.89 2.79
Cost of Funds (CoF) 4.86 3.69 3.71 1.26 2.06 4.05 6.12Return on advances adjusted to CoF 5.96 3.52 3.40 5.63 4.76 5.50 4.21Wages as % to total expenses 15.83 18.74 25.63 37.32 27.34 18.22 13.02
Return on Equity 7.46 2.72 3.65 5.32 4.94 11.52 13.84Return on Assets 2.43 0.89 2.37 4.00 3.90 1.94 1.03CRAR 37.58 38.98 87.25 60.27 48.11 17.88 13.88Net NPA ratio 0.00 0.00 0.00 0.00 1.59 1.01 1.68

84
FOREIGN BANKS National Australia Bank(Amount in ` Million)
Items 2011-12 2012-13Group
Aggregate 2012-13
All Banks’ Aggregate
2012-13No. of offices 1 1 334 92114No. of employees 16 20 25384 1096984Business per employee 0.00 86.10 217.33 121.33Profit per employee -1.57 -4.64 4.56 0.83
Capital and Reserves & Surplus 1530 1530 1073817 7089300Deposits 0 0 2879997 74295324Investments 0 117 2280631 26132752Advances 0 1636 2636799 58797025
Interest Income 31 124 422486 7636115Other income 0 14 112127 977866Interest expended 0 0 187406 5138027Operating expenses 54 218 142882 1565855Net Interest Margin 1.98 5.18 3.89 2.79
Cost of Funds (CoF) 0.00 0.01 4.05 6.12Return on advances adjusted to CoF 0.00 0.02 5.50 4.21Wages as % to total expenses 74.15 62.41 18.22 13.02
Return on Equity -1.54 -5.76 11.52 13.84Return on Assets -1.54 -5.41 1.94 1.03CRAR 423.74 96.08 17.88 13.88Net NPA ratio 0.00 0.00 1.01 1.68

85
FOREIGN BANKS Rabobank International(Amount in ` Million)
Items 2011-12 2012-13Group
Aggregate 2012-13
All Banks’ Aggregate
2012-13No. of offices 1 1 334 92114No. of employees 43 55 25384 1096984Business per employee 84.41 132.01 217.33 121.33Profit per employee 0.38 2.39 4.56 0.83
Capital and Reserves & Surplus 6017 6139 1073817 7089300Deposits 117 834 2879997 74295324Investments 1384 1242 2280631 26132752Advances 3513 5899 2636799 58797025
Interest Income 253 720 422486 7636115Other income 225 209 112127 977866Interest expended 1 95 187406 5138027Operating expenses 352 578 142882 1565855Net Interest Margin 3.92 8.36 3.89 2.79
Cost of Funds (CoF) 0.59 6.65 4.05 6.12Return on advances adjusted to CoF 1.22 3.78 5.50 4.21Wages as % to total expenses 45.42 45.22 18.22 13.02
Return on Equity 0.27 2.01 11.52 13.84Return on Assets 0.40 1.42 1.94 1.03CRAR 123.86 70.34 17.88 13.88Net NPA ratio 0.00 0.00 1.01 1.68

86
FOREIGN BANKS Royal Bank of Scotland(Amount in ` Million)
Items 2008-09 2009-10 2010-11 2011-12 2012-13Group
Aggregate 2012-13
All Banks’ Aggregate
2012-13No. of offices 30 31 31 31 31 334 92114No. of employees 3241 2716 2183 1951 1554 25384 1096984Business per employee 102.94 115.90 111.32 130.73 162.11 217.33 121.33Profit per employee 0.06 -0.41 0.83 2.46 1.43 4.56 0.83
Capital and Reserves & Surplus 23858 22809 24623 29421 28319 1073817 7089300Deposits 159603 166015 139472 130395 127494 2879997 74295324Investments 108107 72654 89016 77214 91235 2280631 26132752Advances 166597 134060 105508 125345 125339 2636799 58797025
Interest Income 31197 21263 18128 17907 18904 422486 7636115Other income 12251 7495 7864 8180 5470 112127 977866Interest expended 14371 7141 7354 8658 9325 187406 5138027Operating expenses 14973 9963 10005 9033 10274 142882 1565855Net Interest Margin 5.04 5.24 4.70 3.70 3.52 3.89 2.79
Cost of Funds (CoF) 4.19 2.94 3.48 4.65 4.79 4.05 6.12Return on advances adjusted to CoF 8.28 7.38 4.86 3.82 3.53 5.50 4.21Wages as % to total expenses 25.61 24.37 21.90 18.60 17.67 18.22 13.02
Return on Equity 0.82 -4.49 7.65 17.75 7.71 11.52 13.84Return on Assets 0.06 -0.40 0.76 1.96 0.96 1.94 1.03CRAR 12.66 12.50 11.65 12.46 14.50 17.88 13.88Net NPA ratio 2.20 1.95 1.65 0.74 0.29 1.01 1.68

87
FOREIGN BANKS Sberbank(Amount in ` Million)
Items 2011-12 2012-13Group
Aggregate 2012-13
All Banks’ Aggregate
2012-13No. of offices 1 1 334 92114No. of employees 16 16 25384 1096984Business per employee 0.01 26.06 217.33 121.33Profit per employee -0.84 -1.00 4.56 0.83
Capital and Reserves & Surplus 1368 1443 1073817 7089300Deposits 0 47 2879997 74295324Investments 0 0 2280631 26132752Advances 0 370 2636799 58797025
Interest Income 103 117 422486 7636115Other income 0 3 112127 977866Interest expended 0 1 187406 5138027Operating expenses 117 133 142882 1565855Net Interest Margin 7.49 7.34 3.89 2.79
Cost of Funds (CoF) 0.00 0.59 4.05 6.12Return on advances adjusted to CoF 0.00 0.18 5.50 4.21Wages as % to total expenses 49.25 52.84 18.22 13.02
Return on Equity -0.98 -1.14 11.52 13.84Return on Assets -0.99 -1.08 1.94 1.03CRAR 329.86 193.98 17.88 13.88Net NPA ratio 0.00 0.00 1.01 1.68

88
FOREIGN BANKS Shinhan Bank(Amount in ` Million)
Items 2008-09 2009-10 2010-11 2011-12 2012-13Group
Aggregate 2012-13
All Banks’ Aggregate
2012-13No. of offices 2 2 3 3 3 334 92114No. of employees 53 53 76 76 91 25384 1096984Business per employee 244.50 221.05 185.58 243.94 294.06 217.33 121.33Profit per employee 3.86 4.58 3.34 5.49 4.89 4.56 0.83
Capital and Reserves & Surplus 2494 2736 4847 5286 5725 1073817 7089300Deposits 7660 6923 7925 10371 14404 2879997 74295324Investments 2027 1963 2279 2811 5906 2280631 26132752Advances 4576 4801 6192 9145 12061 2636799 58797025
Interest Income 639 693 892 1451 2050 422486 7636115Other income 84 126 132 173 194 112127 977866Interest expended 257 222 301 625 1048 187406 5138027Operating expenses 128 133 182 234 314 142882 1565855Net Interest Margin 4.38 4.49 4.81 5.26 4.75 3.89 2.79
Cost of Funds (CoF) 4.25 2.93 3.74 6.21 7.08 4.05 6.12Return on advances adjusted to CoF 6.95 6.61 4.61 3.92 2.87 5.50 4.21Wages as % to total expenses 13.74 13.54 15.52 10.42 8.82 18.22 13.02
Return on Equity 8.05 9.28 6.70 8.66 7.99 11.52 13.84Return on Assets 1.86 2.28 1.82 2.52 1.78 1.94 1.03CRAR 36.80 40.85 50.73 40.26 34.48 17.88 13.88Net NPA ratio 0.00 0.00 0.00 0.00 0.00 1.01 1.68
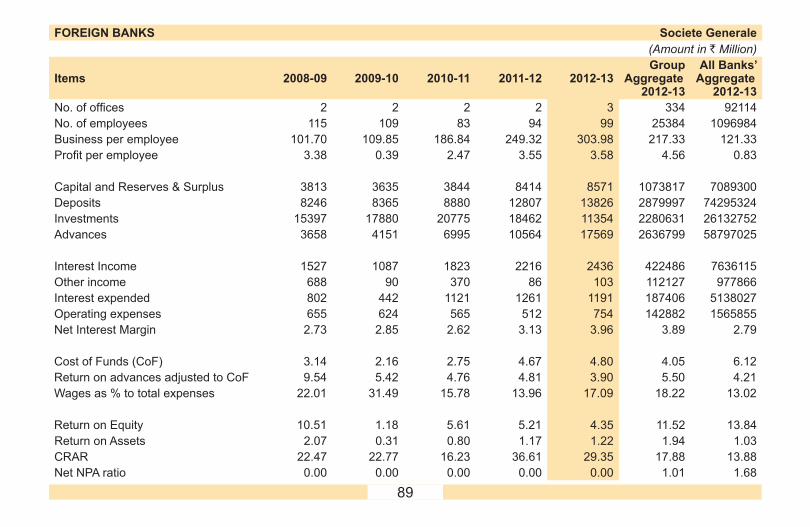
89
FOREIGN BANKS Societe Generale(Amount in ` Million)
Items 2008-09 2009-10 2010-11 2011-12 2012-13Group
Aggregate 2012-13
All Banks’ Aggregate
2012-13No. of offices 2 2 2 2 3 334 92114No. of employees 115 109 83 94 99 25384 1096984Business per employee 101.70 109.85 186.84 249.32 303.98 217.33 121.33Profit per employee 3.38 0.39 2.47 3.55 3.58 4.56 0.83
Capital and Reserves & Surplus 3813 3635 3844 8414 8571 1073817 7089300Deposits 8246 8365 8880 12807 13826 2879997 74295324Investments 15397 17880 20775 18462 11354 2280631 26132752Advances 3658 4151 6995 10564 17569 2636799 58797025
Interest Income 1527 1087 1823 2216 2436 422486 7636115Other income 688 90 370 86 103 112127 977866Interest expended 802 442 1121 1261 1191 187406 5138027Operating expenses 655 624 565 512 754 142882 1565855Net Interest Margin 2.73 2.85 2.62 3.13 3.96 3.89 2.79
Cost of Funds (CoF) 3.14 2.16 2.75 4.67 4.80 4.05 6.12Return on advances adjusted to CoF 9.54 5.42 4.76 4.81 3.90 5.50 4.21Wages as % to total expenses 22.01 31.49 15.78 13.96 17.09 18.22 13.02
Return on Equity 10.51 1.18 5.61 5.21 4.35 11.52 13.84Return on Assets 2.07 0.31 0.80 1.17 1.22 1.94 1.03CRAR 22.47 22.77 16.23 36.61 29.35 17.88 13.88Net NPA ratio 0.00 0.00 0.00 0.00 0.00 1.01 1.68

90
FOREIGN BANKS Sonali Bank(Amount in ` Million)
Items 2008-09 2009-10 2010-11 2011-12 2012-13Group
Aggregate 2012-13
All Banks’ Aggregate
2012-13No. of offices 2 2 2 2 2 334 92114No. of employees 34 35 38 34 34 25384 1096984Business per employee 13.85 8.91 8.39 13.06 17.10 217.33 121.33Profit per employee 0.13 0.16 0.04 0.26 0.55 4.56 0.83
Capital and Reserves & Surplus 57 63 66 79 98 1073817 7089300Deposits 417 318 280 312 398 2879997 74295324Investments 48 50 51 55 58 2280631 26132752Advances 104 78 88 185 184 2636799 58797025
Interest Income 14 11 12 23 33 422486 7636115Other income 46 50 44 59 74 112127 977866Interest expended 6 7 7 8 11 187406 5138027Operating expenses 34 40 43 50 54 142882 1565855Net Interest Margin 1.66 0.92 1.13 3.54 4.38 3.89 2.79
Cost of Funds (CoF) 1.22 1.34 1.67 1.93 2.32 4.05 6.12Return on advances adjusted to CoF 6.23 5.68 6.07 10.63 11.32 5.50 4.21Wages as % to total expenses 50.14 54.74 56.36 55.02 50.64 18.22 13.02
Return on Equity 19.55 11.50 2.62 13.79 21.14 11.52 13.84Return on Assets 1.98 1.64 0.43 2.23 3.37 1.94 1.03CRAR 20.31 20.03 21.60 16.81 12.91 17.88 13.88Net NPA ratio 2.55 3.39 2.46 1.16 2.36 1.01 1.68

91
FOREIGN BANKS Standard Chartered Bank(Amount in ` Million)
Items 2008-09 2009-10 2010-11 2011-12 2012-13Group
Aggregate 2012-13
All Banks’ Aggregate
2012-13No. of offices 91 95 95 95 100 334 92114No. of employees 7825 8084 7813 7527 7212 25384 1096984Business per employee 97.14 108.35 134.56 154.67 168.77 217.33 121.33Profit per employee 2.38 2.63 2.64 2.31 4.11 4.56 0.83
Capital and Reserves & Surplus 102768 116057 130624 141429 191531 1073817 7089300Deposits 418018 481924 584191 639647 620017 2879997 74295324Investments 155516 184774 230882 273239 307471 2280631 26132752Advances 374891 415522 492008 555700 619543 2636799 58797025
Interest Income 56494 56749 63524 79432 90835 422486 7636115Other income 30971 28376 24715 29882 28072 112127 977866Interest expended 24896 17838 23506 36904 40692 187406 5138027Operating expenses 24997 24190 25969 27408 29041 142882 1565855Net Interest Margin 3.70 4.18 4.10 3.73 4.15 3.89 2.79
Cost of Funds (CoF) 4.89 3.04 3.49 4.40 4.40 4.05 6.12Return on advances adjusted to CoF 7.41 7.53 6.26 6.89 6.99 5.50 4.21Wages as % to total expenses 21.09 24.38 25.48 20.81 18.50 18.22 13.02
Return on Equity 20.45 19.44 16.70 12.76 17.78 11.52 13.84Return on Assets 2.87 3.03 2.44 1.49 2.43 1.94 1.03CRAR 11.56 12.41 11.88 11.05 13.00 17.88 13.88Net NPA ratio 1.37 1.40 0.27 0.70 1.63 1.01 1.68

92
FOREIGN BANKS State Bank of Mauritius(Amount in ` Million)
Items 2008-09 2009-10 2010-11 2011-12 2012-13Group
Aggregate 2012-13
All Banks’ Aggregate
2012-13No. of offices 3 3 3 3 3 334 92114No. of employees 29 28 39 47 49 25384 1096984Business per employee 235.70 261.30 281.30 335.80 289.00 217.33 121.33Profit per employee 2.00 -1.40 1.90 2.40 6.80 4.56 0.83
Capital and Reserves & Surplus 1644 1624 3191 3298 6062 1073817 7089300Deposits 3722 3479 4999 7662 6009 2879997 74295324Investments 1328 1224 4170 4821 4602 2280631 26132752Advances 3027 4101 5971 8121 8150 2636799 58797025
Interest Income 445 436 575 1241 1460 422486 7636115Other income 31 46 55 125 202 112127 977866Interest expended 305 357 359 850 787 187406 5138027Operating expenses 62 72 99 168 164 142882 1565855Net Interest Margin 2.58 1.27 2.45 3.06 4.66 3.89 2.79
Cost of Funds (CoF) 8.37 8.01 5.40 7.93 5.76 4.05 6.12Return on advances adjusted to CoF 2.86 0.79 2.76 2.39 3.51 5.50 4.21Wages as % to total expenses 5.01 5.50 12.30 8.19 8.37 18.22 13.02
Return on Equity 3.50 -2.46 3.14 3.45 7.07 11.52 13.84Return on Assets 0.90 -0.66 0.93 0.81 2.53 1.94 1.03CRAR 38.01 34.40 45.66 39.02 55.01 17.88 13.88Net NPA ratio 0.00 4.32 2.18 0.87 1.88 1.01 1.68

93
FOREIGN BANKS Sumitomo Mitsui Banking Corporation(Amount in ` Million)
Items 2012-13Group
Aggregate 2012-13
All Banks’ Aggregate
2012-13No. of offices 1 334 92114No. of employees 71 25384 1096984Business per employee 0.23 217.33 121.33Profit per employee -2.51 4.56 0.83
Capital and Reserves & Surplus 10834 1073817 7089300Deposits 15 2879997 74295324Investments 2985 2280631 26132752Advances 0 2636799 58797025
Interest Income 102 422486 7636115Other income 0 112127 977866Interest expended 0 187406 5138027Operating expenses 257 142882 1565855Net Interest Margin 0.94 3.89 2.79
Cost of Funds (CoF) 0.03 4.05 6.12Return on advances adjusted to CoF -0.03 5.50 4.21Wages as % to total expenses 37.12 18.22 13.02
Return on Equity -1.51 11.52 13.84Return on Assets -5.06 1.94 1.03CRAR 625.69 17.88 13.88Net NPA ratio 0.00 1.01 1.68
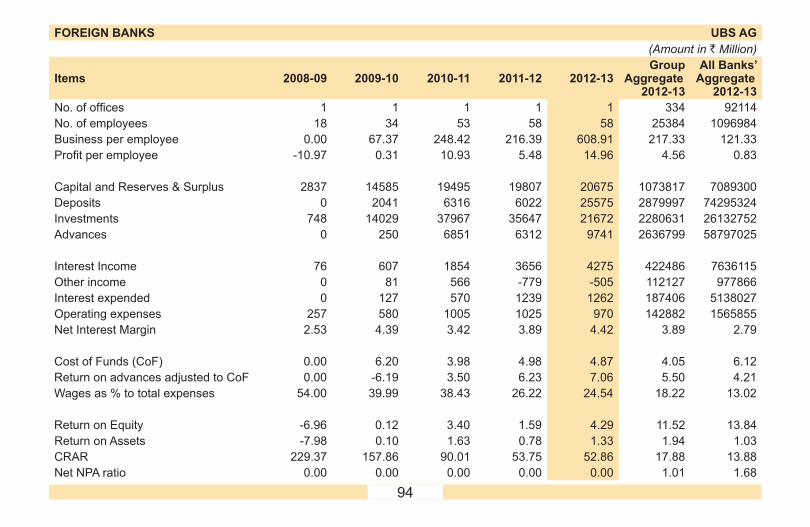
94
FOREIGN BANKS UBS AG(Amount in ` Million)
Items 2008-09 2009-10 2010-11 2011-12 2012-13Group
Aggregate 2012-13
All Banks’ Aggregate
2012-13No. of offices 1 1 1 1 1 334 92114No. of employees 18 34 53 58 58 25384 1096984Business per employee 0.00 67.37 248.42 216.39 608.91 217.33 121.33Profit per employee -10.97 0.31 10.93 5.48 14.96 4.56 0.83
Capital and Reserves & Surplus 2837 14585 19495 19807 20675 1073817 7089300Deposits 0 2041 6316 6022 25575 2879997 74295324Investments 748 14029 37967 35647 21672 2280631 26132752Advances 0 250 6851 6312 9741 2636799 58797025
Interest Income 76 607 1854 3656 4275 422486 7636115Other income 0 81 566 -779 -505 112127 977866Interest expended 0 127 570 1239 1262 187406 5138027Operating expenses 257 580 1005 1025 970 142882 1565855Net Interest Margin 2.53 4.39 3.42 3.89 4.42 3.89 2.79
Cost of Funds (CoF) 0.00 6.20 3.98 4.98 4.87 4.05 6.12Return on advances adjusted to CoF 0.00 -6.19 3.50 6.23 7.06 5.50 4.21Wages as % to total expenses 54.00 39.99 38.43 26.22 24.54 18.22 13.02
Return on Equity -6.96 0.12 3.40 1.59 4.29 11.52 13.84Return on Assets -7.98 0.10 1.63 0.78 1.33 1.94 1.03CRAR 229.37 157.86 90.01 53.75 52.86 17.88 13.88Net NPA ratio 0.00 0.00 0.00 0.00 0.00 1.01 1.68

95
FOREIGN BANKS United Overseas Bank(Amount in ` Million)
Items 2010-11 2011-12 2012-13Group
Aggregate 2012-13
All Banks’ Aggregate
2012-13No. of offices 1 1 1 334 92114No. of employees 5 9 13 25384 1096984Business per employee 0.00 0.00 32.27 217.33 121.33Profit per employee -0.64 1.81 1.54 4.56 0.83
Capital and Reserves & Surplus 1288 1478 1559 1073817 7089300Deposits 0 0 62 2879997 74295324Investments 0 0 148 2280631 26132752Advances 0 0 358 2636799 58797025
Interest Income 64 103 139 422486 7636115Other income 0 3 7 112127 977866Interest expended 0 0 1 187406 5138027Operating expenses 67 85 118 142882 1565855Net Interest Margin 4.68 7.00 7.58 3.89 2.79
Cost of Funds (CoF) 0.00 0.00 0.28 4.05 6.12Return on advances adjusted to CoF 0.00 0.00 3.66 5.50 4.21Wages as % to total expenses 36.58 36.47 48.76 18.22 13.02
Return on Equity -0.25 1.18 1.32 11.52 13.84Return on Assets -0.24 1.21 1.21 1.94 1.03CRAR 341.49 205.80 154.76 17.88 13.88Net NPA ratio 0.00 0.00 0.00 1.01 1.68

96
FOREIGN BANKS Westpac Banking Corporation(Amount in ` Million)
Items 2012-13Group
Aggregate 2012-13
All Banks’ Aggregate
2012-13No. of offices 1 334 92114No. of employees 24 25384 1096984Business per employee 0.01 217.33 121.33Profit per employee 3.52 4.56 0.83
Capital and Reserves & Surplus 8172 1073817 7089300Deposits 0 2879997 74295324Investments 4466 2280631 26132752Advances 0 2636799 58797025
Interest Income 275 422486 7636115Other income 51 112127 977866Interest expended 0 187406 5138027Operating expenses 154 142882 1565855Net Interest Margin 3.33 3.89 2.79
Cost of Funds (CoF) 3.83 4.05 6.12Return on advances adjusted to CoF -3.83 5.50 4.21Wages as % to total expenses 54.26 18.22 13.02
Return on Equity 1.03 11.52 13.84Return on Assets 1.03 1.94 1.03CRAR 280.06 17.88 13.88Net NPA ratio 0.00 1.01 1.68

97
FOREIGN BANKS Woori Bank(Amount in ` Million)
Items 2011-12 2012-13Group
Aggregate 2012-13
All Banks’ Aggregate
2012-13No. of offices 1 1 334 92114No. of employees 21 25 25384 1096984Business per employee 0.00 113.07 217.33 121.33Profit per employee 0.00 1.02 4.56 0.83
Capital and Reserves & Surplus 1614 1636 1073817 7089300Deposits 0 2158 2879997 74295324Investments 0 491 2280631 26132752Advances 0 329 2636799 58797025
Interest Income 42 206 422486 7636115Other income 0 10 112127 977866Interest expended 0 56 187406 5138027Operating expenses 26 118 142882 1565855Net Interest Margin 2.56 5.47 3.89 2.79
Cost of Funds (CoF) 0.00 2.62 4.05 6.12Return on advances adjusted to CoF 0.00 6.11 5.50 4.21Wages as % to total expenses 26.13 22.31 18.22 13.02
Return on Equity 0.53 1.38 11.52 13.84Return on Assets 0.00 0.90 1.94 1.03CRAR 421.70 163.28 17.88 13.88Net NPA ratio 0.00 0.00 1.01 1.68

Notes
98