Embed Size (px)
Citation preview

Atmos. Chem. Phys., 15, 12845–12865, 2015
www.atmos-chem-phys.net/15/12845/2015/
doi:10.5194/acp-15-12845-2015
© Author(s) 2015. CC Attribution 3.0 License.
A process-based 222radon flux map for Europe and its comparison to
long-term observations
U. Karstens1,a, C. Schwingshackl2,b, D. Schmithüsen2, and I. Levin2
1Max-Planck-Institut für Biogeochemie, Jena, Germany2Institut für Umweltphysik, Heidelberg University, Heidelberg, Germanyanow at: ICOS Carbon Portal, Lund University, Lund, Swedenbnow at: Institute for Atmospheric and Climate Science, ETH Zürich, Zürich, Switzerland
Correspondence to: U. Karstens ([email protected])
Received: 21 May 2015 – Published in Atmos. Chem. Phys. Discuss.: 25 June 2015
Revised: 19 October 2015 – Accepted: 2 November 2015 – Published: 19 November 2015
Abstract. Detailed 222radon (222Rn) flux maps are an essen-
tial pre-requisite for the use of radon in atmospheric trans-
port studies. Here we present a high-resolution 222Rn flux
map for Europe, based on a parameterization of 222Rn pro-
duction and transport in the soil. The 222Rn exhalation rate
is parameterized based on soil properties, uranium content,
and modelled soil moisture from two different land-surface
reanalysis data sets. Spatial variations in exhalation rates are
primarily determined by the uranium content of the soil, but
also influenced by soil texture and local water-table depth.
Temporal variations are related to soil moisture variations as
the molecular diffusion in the unsaturated soil zone depends
on available air-filled pore space. The implemented diffusion
parameterization was tested against campaign-based 222Rn
soil profile measurements. Monthly 222Rn exhalation rates
from European soils were calculated with a nominal spa-
tial resolution of 0.083◦× 0.083◦ and compared to long-
term direct measurements of 222Rn exhalation rates in dif-
ferent areas of Europe. The two realizations of the 222Rn
flux map, based on the different soil moisture data sets,
both realistically reproduce the observed seasonality in the
fluxes but yield considerable differences for absolute flux
values. The mean 222Rn flux from soils in Europe is esti-
mated to be 10 mBq m−2 s−1 (ERA-Interim/Land soil mois-
ture) or 15 mBq m−2 s−1 (GLDAS (Global Land Data As-
similation System) Noah soil moisture) for the period 2006–
2010. The corresponding seasonal variations with low fluxes
in winter and high fluxes in summer range in the two real-
izations from ca. 7 to ca. 14 mBq m−2 s−1 and from ca. 11
to ca. 20 mBq m−2 s−1, respectively. These systematic differ-
ences highlight the importance of realistic soil moisture data
for a reliable estimation of 222Rn exhalation rates. Compari-
son with observations suggests that the flux estimates based
on the GLDAS Noah soil moisture model on average better
represent observed fluxes.
1 Introduction
One of the limiting factors for applying atmospheric 222Rn
measurements for transport model validation is a reliable,
high-resolution 222Rn flux map for the global continents, but
also on the regional scale for Europe. It has been shown
earlier that the assumption of a constant exhalation rate of
1 atom cm−2 s−1 for continental areas, as was proposed by
Jacob and Prather (1990) as an intermediate value from
data reported by Wilkening et al. (1972) and Turekian et
al. (1977), is an over-simplification of the true conditions,
in particular for Europe (Dörr and Münnich, 1990; Schüßler,
1996; Conen and Robertson, 2002). Nevertheless, this as-
sumption was used, for simplicity, in different transport
model estimates and model inter-comparison studies (Rasch
et al., 2000; Chevillard et al., 2002; Taguchi et al., 2011).
Only in the last decade, a number of attempts have been
made to develop high-resolution maps of the variability of222Rn exhalation from continental soils (Schery and Wasi-
olek, 1998; Sun et al., 2004; Zhuo et al., 2008; Szegvary et
al., 2009; Griffiths et al., 2010; Hirao et al., 2010; López-
Coto et al., 2013). We present here a high-resolution 222Rn
Published by Copernicus Publications on behalf of the European Geosciences Union.

12846 U. Karstens et al.: A process-based 222radon flux map for Europe
flux map for Europe, based on a parameterization of 222Rn
production and transport in the soil.222Rn is a progeny of 238uranium (238U), a trace element
in natural soils. Since 222Rn is the first gaseous element in the238U decay chain that can escape from the soil, all daughter
nuclides from 238U up to 226radium (226Ra), the mother nu-
clide of 222Rn, are often assumed to be in equilibrium in the
soil. Besides the 226Ra content, 222Rn exhalation rates also
strongly depend on soil properties (Nazaroff, 1992). There-
fore, not only the 238U content but also the parameters influ-
encing diffusive transport characteristics of the soil need to
be known to properly estimate the variability of 222Rn exha-
lation rates (Schüßler, 1996). Taking these into account, Grif-
fiths et al. (2010) developed a high-resolution 222Rn flux map
for Australian land surfaces. They used a transport model
for the unsaturated upper soil layers, national γ -ray surveys,
maps of soil properties, such as porosity and bulk density,
as well as modelled soil moisture to estimate monthly 222Rn
exhalation rates at 0.05◦ spatial resolution. Likewise, López-
Coto et al. (2013) published a 222Rn flux map for Europe that
also uses numerical modelling of 222Rn transport in the up-
per soil layers. Their input parameters were measured 238U
activity concentrations from the Geochemical Atlas of Eu-
rope (Salminen, 2005) and other soil properties as well as
modelled soil temperature and moisture data. Based on these
parameters, they estimated average monthly 222Rn exhala-
tion rates for the time period of 1957–2002 at a spatial res-
olution of 1 km. Szegvary et al. (2007b) found an empirical
relation between 222Rn exhalation rate and γ -dose rate. Fol-
lowing this finding, Szegvary et al. (2009) published a 222Rn
flux map for Europe that solely uses γ -dose rate as a proxy
for 222Rn exhalation rate.
In the present work, we use a similar approach as Griffith
et al. (2010) for Australia and López-Coto et al. (2013) for
Europe. We estimate the 222Rn exhalation rate from Euro-
pean land surface based on the measured distribution of 238U
in the upper soil layers (Salminen, 2005), the soil texture
class distribution (Reynolds et al., 2000) as well as model
estimates of the soil moisture, which largely governs molec-
ular diffusion in the unsaturated soil. For the period of 2006
to 2010, we test two different soil moisture reanalysis data
sets: (1) from the Noah Land Surface Model in the Global
Land Data Assimilation System (GLDAS Noah, Rodell et
al., 2004), and (2) from the ERA-Interim/Land (ERA-I/L, re-
spectively) reanalysis (Balsamo et al., 2015). Soil moisture-
dependent molecular diffusive transport in the upper me-
tre of the soil is calculated based on the Millington and
Quirk (1960) model. The validity of our diffusion model ap-
proach is tested at different soil moisture regimes, using sys-
tematic 222Rn soil profile measurements at our observational
site close to Heidelberg, Germany. The European flux maps
are further compared to direct spot and long-term measure-
ments of 222Rn exhalation rates in different areas across Eu-
rope.
2 Theoretical considerations
2.1 Basic equations for 222Rn production, decay and
diffusion in soils
The derivations below essentially follow those presented
in Dörr and Münnich (1990), Born et al. (1990), Schüßler
(1996), and Griffiths et al. (2010). They are valid for an in-
finitely deep unsaturated homogeneous soil, and we consider
only changes of concentration c(z, t), flux j (z, t) as well as
sourceQ(z, t) or sink strength S(z, t) in the vertical direction
z (with the z coordinate defined as positive downwards and
z= 0 at the soil–atmosphere interface).
In this case the equation of continuity in the soil air can be
reduced to one spatial dimension, namely
dc(z, t)
dt+∂j (z, t)
∂z=Q(z, t)+ S(z, t). (1)
We further assume that, at any depth in the soil, the only
sink process is radioactive decay, which is described by
S(z, t)=−λc(z, t), (2)
with the decay constant λ(222Rn)= 2.0974× 10⁻⁶ s−1.
The source termQ, i.e. the production rate of 222Rn gas in
the soil, is calculated according to Schüßler (1996) from
Q(z)= λρb(z)cRa(z)ε(z), (3)
with ρb the dry bulk density of the soil (kg m−3), cRa the226Ra activity concentration in the soil material (Bq kg−1),
and ε the 222Rn emanation coefficient, which is defined as
the probability that a 222Rn atom produced in a soil grain can
actually escape into the soil air.
If we consider steady state conditions, i.e. no explicit de-
pendence on time, Eq. (1) simplifies to
0=−∂j (z)
∂z+Q(z)+ S(z)=−
∂j (z)
∂z+Q(z)− λc(z) or
∂j (z)
∂z=Q(z)− λc(z). (4)
Taking into account only molecular diffusion of the trace
gas in the soil air, we can apply Fick’s first law
j (z)=−De
∂c(z)
∂z, (5)
where De is the effective diffusion coefficient of the trace
gas in the soil air (hereafter also named effective diffusiv-
ity or simply diffusivity). De is assumed to be constant with
depth. Note that in Eq. (5), j (z) is the flux per unit area of the
bulk soil. This is not immediately obvious. In the respective
Eq. (1) in Griffiths et al. (2010) and also in Sun et al. (2004),
j (z) is multiplied with θP, the porosity of the soil to yield
the flux density per bulk unit area. However, they also use
a different expression to calculate the source strength Q in
Atmos. Chem. Phys., 15, 12845–12865, 2015 www.atmos-chem-phys.net/15/12845/2015/

U. Karstens et al.: A process-based 222radon flux map for Europe 12847
the soil (Eq. 3 in Griffiths et al., 2010) where they divide our
Eq. (3) by θP.
Combining Eqs. (4) and (5) yields
∂2c(z)
∂z2−λ
De
c(z)=−Q(z)
De
. (6)
If we further assume that the 226Ra activity concentration
in the soil particles, the 222Rn emanation coefficient, and the
soil bulk density are constant with depth, we obtain a depth-
independent source strength, i.e. Q(z)=Q, and Eq. (6) be-
comes
De
∂2c(z)
∂z2− λc(z)+Q= 0. (6a)
2.2 The 222Rn soil air profile and its exhalation rate at
the soil surface
The general solution of the inhomogeneous differential equa-
tion Eq. (6a) is
c(z)= c∞(1− e−zz̄ ),
where c∞ is the asymptotic concentration at large depths and
z̄ the relaxation depth.
With the boundary conditions of (1) the 222Rn concentra-
tion approaching zero at the soil–air interface and (2) zero
concentration gradient, i.e. equilibrium between 222Rn pro-
duction and decay, at great depths
c(z= 0)= 0 anddc
dz(z=∞)= 0
the solution of Eq. (6a) takes the following form:
c(z)= c∞(1− e−zz̄ )=
Q
λ(1− e
−
√λDez) (7)
i.e. c∞ =Q
λand z̄=
√De
λ. (7a)
Introducing solution (7) into the diffusion Eq. (5), we can
calculate the 222Rn flux at the soil surface
j (z= 0)=−De
∂c(z)
∂z
∣∣∣∣z=0
=−De
c∞
z̄=−z̄ c∞ λ=
−Q
√De
λ=−ρbcRaε
√De λ. (8)
Note that the last term in Eq. (8), which allows calculating
the 222Rn flux density per unit bulk surface of the soil from
“bottom-up” parameters and the effective diffusivity in the
soil, is now identical to Eq. (4) in Griffiths et al. (2010).
2.3 Approximation of 222Rn fluxes at sites with shallow
water-table depth
The solution of the differential Eq. (6a) given by Eqs. (7) and
(7a) is only valid if we can assume an infinitely deep unsat-
urated soil. This assumption is not always fulfilled. Partic-
ularly in northern Europe or in Siberian wetland areas, the
water-table depth can be as close to the surface as 10 or
20 cm. In that case there is only a very shallow soil depth
available for 222Rn production and exhalation into the atmo-
sphere (if we consider that the molecular diffusion coeffi-
cient of 222Rn in water is lower by 2–3 orders of magnitude
compared to air, and that there is only negligible 222Rn flux
from ground water into the unsaturated soil zone). With the
boundary conditions of zero 222Rn activity concentration at
the soil–air interface and zero 222Rn flux, i.e. zero concentra-
tion gradient, at water-table depth zG
c(z= 0)= 0 anddc
dz(z= zG)= 0,
the solution of the differential Eq. (6) gives the modified flux
at the surface according to
j (z= 0)=−Q
√De
λtanh
(zG
z̄
). (8a)
The solution Eq. (8a) has the same form as Eq. (8) and for
zG� z̄ it yields Eq. (8).
2.4 The role of snow cover and frost on the 222Rn
exhalation rate from continental soils
The role of snow cover on the 222Rn exhalation rate is not
yet fully understood. Robertson (2004) found in her mea-
surements that a layer of snow had no significant influence
on the 222Rn exhalation rate. However, when the top layer of
the snow melted and froze again, a smaller 222Rn exhalation
rate was measured. This finding suggests that the physical
properties of the snow, such as a thin ice layer on its top, de-
termine the magnitude of the 222Rn flux. However, most of
the studies cited in Robertson (2004) found no or merely a
small effect of snow cover on 222Rn exhalation rate. Thus,
although a shielding effect of snow cover has been included
in the López-Coto et al. (2013) flux map, this effect is not
taken into account in our 222Rn flux estimates.
Another point concerning the 222Rn exhalation rate in win-
ter months is the influence of frozen soils on 222Rn exhalation
rates. While different authors, e.g. cited by Robertson (2004)
report a reduction in 222Rn flux when the soil was frozen,
Robertson (2004) found no evidence for a strong influence
of frozen soils on 222Rn emissions. However, particularly
when soil moisture is high or when an ice layer forms on
the ground, this might cause a substantial decrease in 222Rn
exhalation rates. Because no systematic analysis of the in-
fluence of soil freezing on the 222Rn flux is available, our
www.atmos-chem-phys.net/15/12845/2015/ Atmos. Chem. Phys., 15, 12845–12865, 2015

12848 U. Karstens et al.: A process-based 222radon flux map for Europe
standard 222Rn flux maps do not take into account any pos-
itive or negative effect of frozen soil on the exhalation rate.
However, we will show one hypothetical scenario of the po-
tential influence of frost on the exhalation rate with reduced
fluxes, based on the number of ice days during winter months
(Sect. 4.3).
2.5 Estimating the effective diffusivity from soil
properties
From Eq. (8) we see that the 222Rn flux at the soil surface not
only depends on the production rateQ in the soil (see Eq. 3),
but also on the effective diffusivity De of 222Rn in the soil
air. Estimating De in soil air is, however, not a trivial task.
This parameter depends mostly on the percentage of soil air
volume available for gas diffusion, but also on the grain size
distribution of the soil, i.e. its texture. The unit volume of
soil consists of the soil material fraction θm, the fraction that
is filled with water θw, and the air-filled fraction θa so that
θm+ θw+ θa = 1. (9)
The porosity θp of the soil is defined as
θp = 1− θm = θa+ θw. (10)
Different models were developed in the past to estimate
De depending on soil properties and soil moisture. While the
more recent models by Moldrup et al. (1996, 1999) require
as input detailed parameters of the soil texture, i.e. percent-
ages of clay, coarse sand, and fine sand, the earlier models by
Millington and Quirk (1960, 1961) and also the parameteri-
zation reported by Rogers and Nielson (1991) only require
information on soil porosity and soil moisture. The latter pa-
rameterization by Rogers and Nielson (1991) has been used
by Zhuo et al. (2008), Griffiths et al. (2010) and López-Coto
et al. (2013) in their 222Rn flux estimates. However, Jin and
Jury (1996) could show that the original estimate of the ef-
fective diffusivity according to Millington and Quirk (1960),
i.e.
De =Da
θ2a
θ23
p
=Da
(θp− θw
)2θ
23
p
, (11)
where Da = 1.1× 10⁻⁵ m2 s−1 is the diffusion coefficient
of radon in air, yields excellent agreement with a large set
of available observational data of the effective diffusivity
De for soils with different texture obtained from different
studies in the literature (Jin and Jury, 1996, and references
therein). Moreover, when comparing diffusivity calculated
from the Millington and Quirk (1960) model with that of
Moldrup et al. (1996), both agree very well (and for a hy-
draulic parameter b = 6, which corresponds to a typical soil
with about 20 % clay, they yield identical values of De (see
Fig. S1 of the Supplement)). More importantly, when com-
paring measured 222Rn profile-based diffusivity values cal-
culated from Eq. (7a) (see Sect. 3, Table 1) with the model-
estimated results, we find the best agreement with these two
models (Millington and Quirk, 1960; Moldrup et al., 1996).
The Rogers and Nielson (1991) model seems to overestimate
diffusivity, particularly during dry conditions, and the Mol-
drup et al. (1999) model largely underestimates the measured
diffusivity. Therefore, we decided to use the Millington and
Quirk (1960) model (Eq. 11), which is solely based on soil
porosity and soil moisture, to estimate effective diffusivity.
The temperature dependence of the diffusivity for the222Rn flux map has been estimated according to Schery and
Wasiolek (1998):
De (T )=De0
(T
273 K
) 32
, (12)
with T the mean soil temperature in Kelvin and De0 the ef-
fective diffusivity at the reference temperature 273 K.
3 Validation of the theoretical concepts to estimate222Rn fluxes
3.1 Evaluation of measured 222Rn soil profiles and
diffusivity estimates
Schmithüsen (2012) measured the 222Rn exhalation rate and
corresponding vertical concentration profiles of 222Rn in a
loamy soil close to the Institut für Umweltphysik (IUP) in
Heidelberg, Germany. These measurements provide a first
validation of the theoretical concept described in Sect. 2,
which is used for estimating the 222Rn exhalation rates in
Europe from bottom-up data. Measured concentration pro-
files were binned into mean profiles for dry (nominal θw =
0.124, actual range 0.098–0.145), medium dry (nominal
θw = 0.199, actual range 0.160–0.239), and wet (nominal
θw = 0.311, actual range 0.264–0.345) soil moisture condi-
tions (Fig. 1). The ranges of the soil moisture classes resulted
from a roughly equal distribution of all measured soil mois-
tures (in the upper 20 cm of the soil) during the course of
1 year. By fitting a curve according to Eq. (7) to the mean
profile data, one obtains the parameters z̄ and c∞ as well as
values for the 222Rn source strength Q and the effective dif-
fusivity De, exp (Table 1). The values for Q, which should
be the same for all three moisture situations (wet, medium,
dry), indeed agree rather well (i.e. to within ±25 %). The222Rn exhalation rate at the soil surface (jprofile) calculated
according to Eq. (8) from the parameters fitted to the mea-
sured profiles as well as the mean exhalation rates jchamber in-
dependently measured using accumulation chambers are also
listed in Table 1. They agree within a factor of 2 for all three
soil moisture regimes and within 15 % for the annual mean
flux.
For comparison with the measured profile-based diffusiv-
ity, we can calculateDe with the Millington and Quirk (1960)
model De, MQ from measured porosity (θp = 0.368) and
measured mean soil moistures according to Eq. (11). The
Atmos. Chem. Phys., 15, 12845–12865, 2015 www.atmos-chem-phys.net/15/12845/2015/

U. Karstens et al.: A process-based 222radon flux map for Europe 12849
Table 1. Parameters of the fit curves plotted in Fig. 1, mean exhalation rates estimated from the measured radon concentration profiles
(jprofile) and directly measured with flux chambers (jchambers) at the same site, as well as mean diffusivity as estimated from the experimental
data (De, exp) from the Millington and Quirk (1960) model (De, MQ) and from the Rogers and Nielson (1991) model (De, RN).
Profile c∞ Q z̄ jprofile jchamber θw De, exp De, MQ De, RN
Bq m−3 mBq m−3 s−1 m mBq m−2 s−1 mBq m−2 s−1 m2 s−1 m2 s−1 m2 s−1
wet 10000 21.0 0.20 4.3 6.8 0.311 0.86× 10⁻⁷ 0.72× 10⁻⁷ 0.52× 10⁻⁷
medium 9900 20.8 0.38 7.8 13.5 0.199 2.97× 10⁻⁷ 6.59× 10⁻⁷ 10.3× 10⁻⁷
dry 13800 29.0 0.97 28 14.7 0.124 19.6× 10⁻⁷ 14.2× 10⁻⁷ 20.9× 10⁻⁷
0 5 10
0.6
0.5
0.4
0.3
0.2
0.1
0.00 5 10 0 5 10
dept
h (m
)
dry medium
222Radon (kBq m-3)
wet
Figure 1. Mean vertical profiles of the 222Rn activity concentra-
tions measured in a soil in Heidelberg (IUP) averaged over dry
(mean θw = 0.124), medium dry (mean θw = 0.199) and wet (mean
θw = 0.311) soil moisture conditions in 2011–2012. The coloured
lines are fitted curves through the data according to Eq. (7). The
dashed lines are activity concentration profiles calculated with dif-
fusivity estimated with the Millington and Quirk (1960) model,
while dotted lines are respective profiles calculated with the dif-
fusivity model from Rogers and Nielson (1991). Both estimates use
the measured soil porosity (θp = 0.368), mean θw and soil temper-
ature during the measurements, as well as a mean source strength
Q= 23.6 mBq m−3 s−1, i.e. the mean from all measured profiles
estimated according to Eq. (7a) (i.e. mean of Table 1, third column).
diffusivity was adjusted to the mean soil temperatures dur-
ing the measurement dates for wet, medium and dry con-
ditions according to Eq. (12). Likewise, we use the Rogers
and Nielson (1991) model (their Eq. 19) to estimate De, RN.
The numbers of De, MQ and De, RN are given in the last two
columns of Table 1. At our Heidelberg IUP sampling site
the Millington and Quirk (1960) model underestimates dif-
fusivity during wet and dry conditions by up to 25 %, while
it overestimates diffusivity during medium dry conditions by
about a factor of 2. However, the discrepancies between the
diffusivity calculated with the Rogers and Nielson (1991)
model and the experimental results are larger at wet and
medium dry conditions, while they fit very well at dry condi-
tions (θw< 0.15). Using an average Q= 23.6 mBq m−3 s−1
from the measured profiles and the respective De, i from Ta-
ble 1, we also estimated Millington and Quirk- and Rogers
and Nielson-based soil profiles according to Eqs. (7) and
0.0 0.2 0.4 0.6 0.80
1
2
3
4
5
6 Observations wet (z
q=0.2m)
median (zq=0.35m)
dry (zq=0.5m)
22
2R
n ex
hala
tion
(mB
q m
-2s-1
)
water table depth (m)
Figure 2. Dependency of the 222Rn exhalation rate on water-table
depth; the solid lines are calculated according to Eq. (8a) with Q=
12 mBq m−3 s−1 and different effective diffusivities, i.e. different
relaxation depths z̄(= zq ).
(7a). These profiles are plotted in Fig. 1 for comparison to
the observations. Again the Millington and Quirk model fits
the observations better than the Rogers and Nielson model.
Hence, we favour the Millington and Quirk (1960) model
(i.e. Eq. 11) for estimating moisture-dependent diffusivities
for all European soils.
3.2 Evaluation of the concept to estimate flux
restriction by water-table depth
As mentioned in Sect. 2.3, water-table depth can be of huge
importance limiting the 222Rn exhalation when it rises to
levels that are of the same order as z̄. These situations are
quite frequent in coastal areas, e.g. of northern Germany
or the Netherlands, or in wetland regions. Measurements of
co-located 222Rn exhalation rates and shallow water-table
depths are available from a field site in Federovskoye, west-
ern Russia (Levin et al., 2002). Thus, we can test the validity
of Eq. (8a) and compare the solution with the measurements
from the Federovskoye transect measurements from Levin et
al. (2002, their Fig. 3). The solid lines in Fig. 2 are estimates
of the 222Rn exhalation rate for a soil with a mean source
strengthQ= 12 mBq m−3 s−1 and relaxation depths z̄ of 0.2,
www.atmos-chem-phys.net/15/12845/2015/ Atmos. Chem. Phys., 15, 12845–12865, 2015

12850 U. Karstens et al.: A process-based 222radon flux map for Europe
0.35 and 0.5 m (roughly corresponding to wet, medium and
dry soil moisture conditions). The parameterization with the
water table limitation reproduces the observed relation rea-
sonably well and was thus applied to all areas with shallow
water-table depth.
4 Input data for estimation of the 222Rn fluxes from
soils in Europe
Estimation of bottom-up 222Rn fluxes for the whole of Eu-
rope according to Eqs. (8) or (8a) requires high-resolution
data of the following parameters: (1) 226Ra content in the
upper soil layers, (2) the distribution of soil types and poros-
ity in the unsaturated soil zone, (3) the emanation coefficient
of 222Rn from the soil grains into the soil air, and (4) soil
moisture and temperature as well as information on frozen
soil. Finally, (5) the water-table depth should be known, at
least for areas where it is less than 2–3 m below surface. The
respective input data used in our high-resolution 222Rn exha-
lation map are described in the following sections. If avail-
able, we compare with independently measured data to have
some quantitative evaluation of our input data fields (e.g. for
soil moisture).
4.1 226Ra content in the soil
The 226Ra activity concentration in soils is the governing pa-
rameter for the 222Rn flux at the soil surface. It scales linearly
with the exhalation rate. The Geochemical Atlas of Europe
(Salminen, 2005) summarises results of a European-wide ef-
fort within the FOREGS (Forum of European Geological
Surveys) Geochemical Baseline Mapping Programme to pro-
vide high quality environmental geochemical baseline data
for European stream waters, sediments and soils. Besides
many other elements and trace constituents, the uranium con-
tent was also measured in regularly distributed topsoil and
subsoil samples from 26 European countries. Topsoil sam-
ples were collected at 0–25 cm depth (with a potential overly-
ing humus layer being removed), while subsoil samples were
collected from another 25 cm layer located between 50 and
200 cm depth. Uranium content was measured on residual
soil samples (from the < 2 mm grain fraction, with total or-
ganic matter (TOC) being removed from these samples) and
is reported in mg uranium per kg residual soil. As total ura-
nium in soil material consists of ca. 99 % of 238U, the val-
ues given in the Geochemical Atlas (Salminen, 2005) can be
directly transferred into 226Ra activity concentrations, when
assuming secular equilibrium between 238U and its daughter226Ra. The conversion factor from uranium concentration to238U activity concentration was taken from IAEA (1989), i.e.
12.35 Bq kg−1 per mg kg−1 uranium.
The equally distributed 843 individual topsoil ura-
nium measurements (median ± standard deviation:
2.03± 2.35 mg kg−1) and the 792 subsoil uranium measure-
ments (median± standard deviation: 2.00± 2.34 mg kg−1)
were interpolated by ordinary kriging (e.g. Wackernagel,
2003) for both layers to the 0.083◦× 0.083◦ grid of our
map (see Fig. S2 of the Supplement). The resolution of our
basic map is restricted in its spatial resolution by that of the
global soil texture map of Reynolds et al. (2000), which we
used to determine soil texture parameters (see Sect. 4.2). As
the uranium content was measured on residual soil samples
with total organic carbon being removed, we corrected the
activity concentrations for “dilution” with organic carbon,
using the TOC data that have also been reported in the Geo-
chemical Atlas of Europe (Salminen, 2005). This correction
is small with typical TOC values in topsoil between 0 and
6 % (median± standard deviation: 1.73± 3.18 %) and in
subsoil between 0 and 3 % (median± standard deviation:
0.40± 2.86 %).
For calculating the 222Rn exhalation rates for each pixel,
we used the mean values of topsoil and subsoil from the
TOC-corrected interpolated 226Ra activity concentrations
(i.e. cRa of Eq. 3). Assuming a depth-constant cRa seems to
be well justified in view of the very good agreement between
topsoil and subsoil uranium concentrations reported in the
Geochemical Atlas of Europe (Salminen, 2005).
For those regions of our map, for which the uranium con-
tent was not available in the Geochemical Atlas (e.g. Be-
larus, Ukraine), we estimated the 226Ra activity concentra-
tion based on geological information available from the high-
resolution global lithological map “GLiM” (Hartmann and
Moosdorf, 2012). First, a median 226Ra activity concentra-
tion was computed for each lithological class in GLiM using
the measured uranium content at all sampling sites together
with co-located GLiM data. The resulting relation was then
used to extrapolate the 226Ra activity concentration map to
the regions not covered by the Geochemical Atlas. Due to
this very indirect approach, the resulting 222Rn exhalation
rates will have a much higher uncertainty in these regions
(hatched area in Fig. S2 of the Supplement).
4.2 Distribution of soil types and estimate of emanation
coefficients
Soil texture, i.e. the percentages of sand (0.5–2 mm), silt
(0.002–0.5 mm) and clay (< 0.002 mm) for our 222Rn exha-
lation map have been taken from Reynolds et al. (2000), a
soil database that is frequently used in modelling studies of
similar problems. Porosity and soil bulk density were com-
puted from soil texture according to Saxton et al. (1986). The
data are given at a horizontal resolution of 0.083◦× 0.083◦
and for two different depth intervals (from 0–30 cm and
from 30–100 cm). Here we use weighted mean values for
0–100 cm depth for all parameters. As has been shown by
Zhuo et al. (2006, 2008), the emanation coefficient ε, i.e.
the likelihood of a newly formed 222Rn atom to escape the
grain and reach the air-filled soil volume, depends on the
soil type and on soil moisture. The soil moisture depen-
Atmos. Chem. Phys., 15, 12845–12865, 2015 www.atmos-chem-phys.net/15/12845/2015/

U. Karstens et al.: A process-based 222radon flux map for Europe 12851
dency is, however, only relevant at very small moisture con-
tent below 15 % water saturation (i.e. at θw< 0.06 for a typ-
ical porosity of θp= 0.4). Outside this range ε was shown
to be largely constant (Zhuo et al., 2006). For simplicity
and because water contents below 15 % saturation are very
rare in European soils, we used constant (saturation) val-
ues for each texture class. We also neglected the temper-
ature dependence of ε, as it changes by only a few per-
cent within a temperature range of 0–20 ◦C (Iskandar et al.,
2004). The numbers to calculate εsat for sand, silt, and clay
are given in Zhuo et al. (2008) in their Table 2. The values
must, however, be exchanged, as was noted by Griffiths et
al. (2010) and confirmed by W. Zhuo (personal communi-
cation, 2013). From this we estimated εsat = 0.285 for sand,
εsat = 0.382 for silt, and εsat = 0.455 for clay. These num-
bers are well in accordance with emanation coefficients de-
termined by Schüßler (1996) from measured 222Rn profiles
and known 226Ra contents in different soils of the surround-
ings of Heidelberg (M1–M5, see Sect. 5.3 and Table 2). We
used weighted mean values for the different texture classes
to estimate the emanation coefficients for each pixel of our
map.
4.3 Determination of variable soil parameters: soil
moisture, temperature, and frost influence
4.3.1 Soil moisture
Soil moisture has a strong impact on the effective diffusivity
De of the soil. Its high temporal and spatial variability makes
it a crucial parameter for determining the 222Rn exhalation
rate at individual sites. As is illustrated in Fig. 1 and listed
in Table 1, the measured mean 222Rn flux from the loamy
soil at the IUP sampling site changes by about a factor of
6 between wet (θw ≈ 0.31) and dry (θw ≈ 0.12) conditions.
Systematic European-wide soil moisture measurements are
still limited. Only few long-term in situ monitoring stations
exist. Satellite-derived soil moisture, although providing rel-
atively good spatial coverage, is only representative for the
uppermost centimetres of the soil and hence not suited for
our approach. Therefore, we use here soil moisture data sim-
ulated by soil models driven by numerical weather predic-
tion models; i.e. these models have been specifically assimi-
lated to determine soil moisture. Two estimates that provide
data at high temporal resolution (3 or 6 h) have been used.
(1) Simulations were used from the Land Surface Model
Noah (driven by NCEP-GDAS meteorological reanalysis),
which are part of the Global Land Data Assimilation System
GLDAS (Rodell et al., 2004). The spatial resolution of these
estimates is 0.25◦× 0.25◦ with depth intervals of 0–10, 10–
40, 40–100, and 100–200 cm; data for the period of 2006–
2012 were used. (2) Simulations from the ERA-Interim/Land
reanalysis using the latest version of the ECMWF land sur-
face model driven by ERA-Interim atmospheric reanalysis
(Balsamo et al., 2015) were applied as alternative soil mois-
ture model. From this model we used a data set with a hor-
izontal resolution of 0.75◦× 0.75◦; it has a depth resolu-
tion with simulated values for 0–7, 7–28, 28–100 and 100–
289 cm and is available until 2010. From both soil moisture
models, we calculated vertical means from 0–100 cm depth
to cover the same depth interval as the other input parame-
ters. Note that with a relaxation depth of the 222Rn activity
concentration profile in the soil of typically 20–100 cm (Ta-
ble 1), soil parameters of the first 100 cm of the soil are most
relevant to describe diffusive transport and the related flux at
the soil surface. We further assume here that all parameters
do not change with depth and are valid also below 100 cm.
Both soil moisture data sets were compared to observa-
tions from the International Soil Moisture Network (ISMN;
http://ismn.geo.tuwien.ac.at/; Dorigo et al., 2011, and ref-
erences therein). In addition, data from two German sites,
Grenzhof near Heidelberg (Wollschläger et al., 2009) and
Gebesee, located in north-eastern Germany (O. Kolle, per-
sonal communication, 2013), as well as soil moisture data
from Binningen, Switzerland (Szegvary et al., 2007b) were
used for comparison (see also Fig. 7). Soil moisture con-
tents of the second and third model layer (10–40 and 40–
100 cm for GLDAS Noah, 7–28 and 28–100 cm for ERA-I/L)
were compared to measurements at corresponding depths.
This preliminary model–observation comparison at Euro-
pean sites yielded an overall mean bias in volumetric soil
moisture of GLDAS Noah observations = −0.01 m3 m−3
(relative bias =−5 %), while the bias between ERA-I/L and
observations is +0.07 m3 m−3 (relative bias=+32 %). This
underlines that soil moisture simulated by land surface mod-
els is a highly model-specific quantity, which often repre-
sents the time variations much better than the absolute mag-
nitude (Koster et al., 2009). The tendency of ERA-I/L to es-
timate relatively high soil moisture is also confirmed by the
study of Balsamo et al. (2015), who found an overestimation
of surface soil moisture at the European ISMN sites.
4.3.2 Spatial resolution and adjustment of soil moisture
estimates to grid/pixel porosities
Soil moisture estimates are only available at lower spatial
resolution than the other (constant) soil parameters described
above. In order to apply internally consistent data sets for the
flux estimates, based on the two different soil moisture mod-
els, we use the porosities originally applied in the respective
land surface model to calculate effective diffusivity accord-
ing to Eq. (11). Consequently, the different flux maps shown
in Figs. 3 and 4 have different spatial resolutions. For flux
estimates at higher spatial resolution, i.e. 0.083◦× 0.083◦,
it will be necessary to make an adjustment of the model-
estimated soil moisture (θw(model)) to the porosity of the pixel
(θp(pixel)) to make sure the same free pore space is available
for diffusion according to
θw(pixel) =θw(model)
θp(model)
θp(pixel). (13)
www.atmos-chem-phys.net/15/12845/2015/ Atmos. Chem. Phys., 15, 12845–12865, 2015

12852 U. Karstens et al.: A process-based 222radon flux map for Europe
40°N
50°N
60°N
70°N
40°N
50°N
60°N
70°N
10°W 0° 10°E 20°E
222 Rn Exhalation 01/2006 GLDAS-Noah
0 6 12 18 24 30 36 42 48222 Rn Exhalation [mBq m−2 s−1 ]
40°N
50°N
60°N
70°N
40°N
50°N
60°N
70°N
10°W 0° 10°E 20°E
222 Rn Exhalation 07/2006 GLDAS-Noah
0 6 12 18 24 30 36 42 48222 Rn Exhalation [mBq m−2 s−1 ]
40°N
50°N
60°N
70°N
40°N
50°N
60°N
70°N
10°W 0° 10°E 20°E
222 Rn Exhalation 01/2006 ERA-I/L
0 6 12 18 24 30 36 42 48222 Rn Exhalation [mBq m−2 s−1 ]
40°N
50°N
60°N
70°N
40°N
50°N
60°N
70°N
10°W 0° 10°E 20°E
222 Rn Exhalation 07/2006 ERA-I/L
0 6 12 18 24 30 36 42 48222 Rn Exhalation [mBq m−2 s−1 ]
40°N
50°N
60°N
70°N
40°N
50°N
60°N
70°N
10°W 0° 10°E 20°E
222 Rn Exhalation 01/2006 GLDAS-Noah - ERA-I/L
20 16 12 8 4 0 4 8 12 16 20222 Rn Exhalation [mBq m−2 s−1 ]
40°N
50°N
60°N
70°N
40°N
50°N
60°N
70°N
10°W 0° 10°E 20°E
222 Rn Exhalation 07/2006 GLDAS-Noah - ERA-I/L
20 16 12 8 4 0 4 8 12 16 20222 Rn Exhalation [mBq m−2 s−1 ]
0 10 20 30 40 50 60222 Rn Exhalation [mBq m−2 s−1 ]
0.00
0.02
0.04
0.06
0.08
0.10
0.12
0.14
Frequency
mean=12.87 median=12.08 IQR= 7.35
222 Rn Exhalation 01/2006 GLDAS-Noah
0 10 20 30 40 50 60222 Rn Exhalation [mBq m−2 s−1 ]
0.00
0.02
0.04
0.06
0.08
0.10
0.12
0.14
Frequency
mean= 7.39 median= 5.83 IQR= 5.38
222 Rn Exhalation 01/2006 ERA-I/L
0 10 20 30 40 50 60222 Rn Exhalation [mBq m−2 s−1 ]
0.00
0.02
0.04
0.06
0.08
0.10
0.12
0.14
Frequency
mean=20.42 median=19.32 IQR=11.47
222 Rn Exhalation 07/2006 GLDAS-Noah
0 10 20 30 40 50 60222 Rn Exhalation [mBq m−2 s−1 ]
0.00
0.02
0.04
0.06
0.08
0.10
0.12
0.14
Frequency
mean=15.18 median=14.35 IQR= 8.39
222 Rn Exhalation 07/2006 ERA-I/L
Figure 3. 222Rn exhalation rate maps of European soils, their differences and frequency distributions for January and July 2006. The left
panels show the flux maps and normalized frequency distributions calculated with the monthly mean soil moisture estimates from the
GLDAS Noah LSM for January and July 2006, while the middle panels show respective estimates with the ERA-Interim/Land model. The
mean values, median values and the interquartile range (IQR) of the normalized frequency distributions of January and July 2006 fluxes (in
mBq m−2 s−1) are also given. The right panels show the differences between GLDAS-Noah- and ERA-Interim/Land-based fluxes.
In Eq. (13) θw(pixel) is the adjusted soil moisture, and
θp(model) is the original porosity used in the soil moisture
model. However, in the present paper, we do not show any
flux estimates at higher resolution than given by the soil
moisture model estimates, but Eq. (13) is used here to adjust
modelled soil moisture to the porosities measured at M1–M5
shown in Sect. 5.3 and Fig. 6.
4.3.3 Soil temperature
Soil temperature estimates are available from both soil mod-
els that provide soil moisture for the different depths. For
respective flux estimates, we thus used these values to calcu-
late the temperature dependence of diffusivity according to
Eq. (12).
Atmos. Chem. Phys., 15, 12845–12865, 2015 www.atmos-chem-phys.net/15/12845/2015/

U. Karstens et al.: A process-based 222radon flux map for Europe 12853
Table 2. Characteristics of the long-term 222Rn flux sampling sites from IUP (compare Fig. 1 and Table 1), M1–M5 close to Heidelberg
as well as Gebesee, northern Germany, and Gif-sur-Yvette, France. For M1–M5, the percentage of clay, silt, and sand have been estimated
from the soil type description of Schüßler (1996), according to mean percentages reported by Cosby et al. (1984, Table 2); the 226Ra
activity concentrations have been reported by Schüßler (1996). For IUP, Gebesee and Gif-sur-Yvette, these parameters were measured by
Schwingshackl (2013). For comparison with measurements, we also list the data for the respective pixels from the high-resolution map of
soil parameters (“pixel”) (ε: emanation coefficient, θp: soil porosity, ρb: dry bulk density).
Site Location Measurement Clay Silt Sand ε θp ρb226Ra
Period % % % kg m−3 Bq kg−1
M1: Sandhausen 49.35◦ N, 8.65◦ E 1987–1995 6 12 82 0.307 0.365 1540 9.4
M2: Sandhausen 49.35◦ N, 8.65◦ E 1987–1995 10 32 58 0.333 0.430 1510 14
M3: Sandhausen 49.35◦ N, 8.65◦ E 1987–1998 6 12 82 0.307 0.350 1630 8.4
M1–M3 pixel 49.38◦ N, 8.63◦ E 2006–2010 15 22 63 0.332 0.436 1495 37
M4: Nußloch 49.3◦ N, 8.72◦ E 1987–1995 27 15 58 0.346 0.425 1540 34
M5: Nußloch 49.3◦ N, 8.72◦ E 1987–1998 27 15 58 0.346 0.425 1540 38
M4, M5 pixel 49.29◦ N, 8.71◦ E 2006–2010 15 22 63 0.332 0.436 1495 38
IUP: Heidelberg 49.42◦ N, 8.68◦ E 2011–2012 19 37 44 0.353 0.368 1440 36
IUP pixel 49.46◦ N, 8.71◦ E 2006–2010 15 22 63 0.332 0.436 1495 37
Gebesee 51.10◦ N, 10.92◦ E 2003–2004 36 62 2 0.406 0.480 1370 38
Gebesee pixel 51.13◦ N, 10.96◦ E 2006–2010 28 39 34 0.369 0.491 1349 31
Gif 48.72◦ N, 2.17◦ E 2013 16 79 5 0.390 0.370 1650 40
Gif pixel 48.71◦ N, 2.13◦ E 2006–2010 28 39 33 0.371 0.493 1345 18
4.3.4 Frost
While the reduction of the 222Rn exhalation rate through
snow cover is assumed as only minor according to Robert-
son (2004), the influence of frozen soil on the 222Rn flux
may not always be negligible. In order to test its potential im-
pact, we introduced a restriction of the exhalation rate based
on atmospheric temperature. A very simple parameterization
was used here for comparison with our standard estimates
without frost restriction: For each month we have summed
up the number of days with maximum air temperature below
0 ◦C (ice days) and then reduced, for these days, the 222Rn
exhalation rate by 50 %. The monthly mean exhalation rate
was then calculated as the weighted mean for all days during
this month with and without frost. With this parameteriza-
tion, we implicitly include also some potential effect of snow
cover that may be present during ice days. The effect of frost
restriction on the flux, compared to our standard estimates
where no frost restriction is assumed, is shown in Fig. S3 in
the Supplement.
4.4 Water-table depth
As in the case of soil moisture, systematic European-wide
measurements of water-table depth that could be used as in-
put for our 222Rn exhalation map are not existing. Hence, we
use data from a hydrological model simulation by Miguez-
Macho et al. (2008). Supplementary Fig. S4 shows the in-
fluence of low water-table depth on 222Rn fluxes for Europe.
Large areas of the Netherlands, northern Italy, and Hungary
with water table above 2 m are affected. For these areas, the
222Rn exhalation rate was reduced according to our estima-
tion described in Sect. 2.3.
5 Results and discussion
In this section, we first present results for a typical year
(2006) of our two 222Rn flux maps, using the two different
soil moisture model estimates described in Sect. 4.3.1. Sub-
sequently, we compare the annual mean 222Rn flux of our
two European maps for the period 2006–2010 with the earlier
published maps of Szegvary et al. (2009) and López-Coto et
al. (2013). Before comparing time series of map pixels with
observations, the representativeness issue is discussed for the
Heidelberg pixel, where Schüßler (1996) performed long-
term measurements at locations with different soil types. Fi-
nally, we show a comparison of episodic flux measurements
with the results of our map and discuss potential biases and
uncertainties of our approach.
5.1 Distribution of European 222Rn fluxes
Figure 3 shows the maps and frequency distributions of Eu-
ropean 222Rn fluxes as estimated with the model parameters
described in Sect. 4, applying the two different soil mois-
ture model estimates (GLDAS Noah (left panels) and ERA-
Interim/Land (central panels)) for January (top panels) and
July 2006 (middle panels). Both maps show some areas of
very high 222Rn exhalations rates, most pronounced in July,
which coincide with the areas in Europe where the 226Ra ac-
tivity concentration in the upper soil layer is very high. These
areas concern for example the Massif Central in southern
www.atmos-chem-phys.net/15/12845/2015/ Atmos. Chem. Phys., 15, 12845–12865, 2015

12854 U. Karstens et al.: A process-based 222radon flux map for Europe
France, the Iberian Peninsula and areas in central Italy (com-
pare 226Ra distribution displayed in Fig. S2 of the Supple-
ment).
For both soil moisture models, we find in many re-
gions seasonal differences of the fluxes that are as large
as a factor of 2. As mentioned before, these differ-
ences originate from the large changes of soil mois-
ture and thus soil diffusivity between the drier summer
and the, in general, wetter winter conditions. The fre-
quency distribution of 222Rn fluxes, displayed in the lower
part of Fig. 3, is most confined during winter (January
2006) and when calculated with the ERA-Interim/Land
soil moisture data; these fluxes also show a low median
value of only 5.83 mBq m−2 s−1 (interquartile range (IQR)
= 5.38 mBq m−2 s−1). This is about half of the median flux
estimated with the GLDAS Noah soil moisture data set for
January 2006 (12.08 mBq m−2 s−1). During summer (July
2006), both frequency distributions of fluxes are broader
than during winter (IQR: ERA-I/L= 8.39 mBq m−2 s−1 and
GLDAS Noah = 11.47 mBq m−2 s−1). The median values
are much larger than in January 2006, i.e. in the case of the
ERA-I/L soil moisture being more than a factor of 2 larger,
while the difference of the medians in July 2006 between the
two maps is much smaller than in winter (only about 30 %).
As both maps use the same 226Ra distribution and also the
same 222Rn emanation coefficient (i.e. the same 222Rn source
term), differences of 222Rn flux of the two maps are solely
due to the differences of diffusivity, which we calculate from
modelled soil moisture using the individual soil porosity data
from the two models (according to Eq. 11). The right panels
in Fig. 3 show the flux differences between the two maps for
January and July 2006. In fact, the differences of fluxes be-
tween the two maps are not homogeneous all over Europe,
but they show a distinct north to south gradient. While fluxes
estimated with ERA-I/L soil moisture for January 2006 are
slightly higher than those estimated based on GLDAS Noah
in Sweden, Denmark and some parts of northern Germany
and Poland, they are much smaller than GLDAS-Noah-based
fluxes in central and southern Europe. The differences in
soil porosity in the two models are only small (i.e. ERA-I/L
uses about 10 % smaller porosity in northern than in cen-
tral Europe, while porosity is pretty homogeneous all over
Europe in GLDAS Noah and similar to ERA-I/L in central
Europe) but very distinct differences are found in the soil
moisture distributions. Soil moisture is much lower in the
GLDAS Noah model estimates for central and southern Eu-
rope than in ERA-I/L. Only in some areas of Scandinavia
and the northern coasts of central Europe, ERA-I/L estimates
lower soil moisture than GLDAS Noah. This directly trans-
lates into higher 222Rn fluxes in the mentioned regions of
Scandinavia.
The mean 222Rn flux for the period 2006–2010 is esti-
mated to be 10 mBq m−2 s−1 (ERA I/L soil moisture) or
15 mBq m−2 s−1 (GLDAS Noah soil moisture) with mean
seasonal variations ranging from 7 mBq m−2 s−1 in Febru-
ary to 14 mBq m−2 s−1 in August (ERA I/L soil moisture)
and from 11 mBq m−2 s−1 in March to 20 mBq m−2 s−1 in
August (GLDAS Noah soil moisture).
The huge differences between the estimates with different
soil moisture input data emphasize the importance of direct
comparison of our process-based 222Rn flux estimates with
measured fluxes, in order to find out, which soil moisture
model would better fit real ambient conditions. This compar-
ison is shown below in Sect. 5.4 and 5.5.
5.2 Comparison of annual mean 222Rn fluxes with
those from other published maps
Before comparing with observations at individual sites, we
compare the distribution of annual mean fluxes calculated
here based on the two soil moisture models for 2006–2010
with the other published European maps of Szegvary et
al. (2009) for 2006 and of López-Coto et al. (2013). The lat-
ter is shown as climatology for the years 1957–2002. The
maps and normalized frequency distributions are displayed
in Fig. 4. Zonal averages of 1◦ latitudinal bands are com-
pared in Fig. 5. The general shape with higher 222Rn exha-
lation rates in regions of high 238U activity concentrations
(e.g., on the Iberian Peninsula) is similar in all four maps.
The difference between GLDAS-Noah- and ERA-I/L-based
fluxes, with generally higher fluxes estimated based on the
GLDAS Noah soil moisture model (except for some areas
in northern Europe), was discussed before for January and
July 2006 (Fig. 3) and is also visible in annual mean flux es-
timates. The annual median values for the 2006–2010 period
differ by more than 50 % (Fig. 4, lower four panels). There is
relatively good agreement in the spatial pattern, in the annual
medians and IQRs between the ERA-I/L and the López-Coto
et al. (2013) map. This is because the basis of the López-Coto
et al. (2013) map is also the 238U distribution from the Geo-
chemical Atlas of Europe (Salminen, 2005), and López-Coto
et al. (2013) use a similar process-based soil transport model
as described here, but the parameterization for diffusivity de-
veloped by Rogers and Nielson (1991). Soil moisture esti-
mates in López-Coto et al. (2013) are from ERA-40 reanal-
yses, which are based on an earlier version of the land sur-
face model than used in ERA-I/L. Soil moistures in ERA-40
show an overall smaller variability than the ERA-I/L model
estimates (Balsamo et al., 2015) used in our study (compare
also Sect. 5.4, which discusses time profiles in comparison
to observations). The maps of differences between our study
and the López-Coto et al. (2013) climatology are displayed
in Fig. S5 in the Supplement. While our GLDAS-Noah-based
estimates are higher than López-Coto et al. (2013) through-
out Europe (with the exception of northern Ireland and a few
areas in Italy) the higher fluxes of our ERA-I/L-based esti-
mates compared to López-Coto et al. (2013) are most promi-
nent in Scandinavia. Differences in annual mean 222Rn fluxes
between these two maps are small in central Europe. The dif-
ference in annual fluxes in regions north of 60◦ N (Fig. 5)
Atmos. Chem. Phys., 15, 12845–12865, 2015 www.atmos-chem-phys.net/15/12845/2015/

U. Karstens et al.: A process-based 222radon flux map for Europe 12855
40°N
50°N
60°N
70°N
40°N
50°N
60°N
70°N
10°W 0° 10°E 20°E
222 Rn Exhalation 2006-2010 GLDAS-Noah
0 4 8 12 16 20 24 28 32 36 40222 Rn Exhalation [mBq m−2 s−1 ]
40°N
50°N
60°N
70°N
40°N
50°N
60°N
70°N
10°W 0° 10°E 20°E
222 Rn Exhalation 2006-2010 ERA-I/L
0 4 8 12 16 20 24 28 32 36 40222 Rn Exhalation [mBq m−2 s−1 ]
40°N
50°N
60°N
70°N
40°N
50°N
60°N
70°N
10°W 0° 10°E 20°E
222 Rn Exhalation 2006 Szegvary
0 4 8 12 16 20 24 28 32 36 40222 Rn Exhalation [mBq m−2 s−1 ]
40°N
50°N
60°N
70°N
40°N
50°N
60°N
70°N
10°W 0° 10°E 20°E
222 Rn Exhalation 1957-2002 Lopez-Coto
0 4 8 12 16 20 24 28 32 36 40222 Rn Exhalation [mBq m−2 s−1 ]
0 10 20 30 40 50 60222 Rn Exhalation [mBq m−2 s−1 ]
0.00
0.02
0.04
0.06
0.08
0.10
Frequency
mean=15.21 median=13.99 IQR= 9.59
222 Rn Exhalation 2006-2010 GLDAS-Noah
0 10 20 30 40 50 60222 Rn Exhalation [mBq m−2 s−1 ]
0.00
0.02
0.04
0.06
0.08
0.10
Frequency
mean=10.14 median= 9.01 IQR= 6.14
222 Rn Exhalation 2006-2010 ERA-I/L
0 10 20 30 40 50 60222 Rn Exhalation [mBq m−2 s−1 ]
0.00
0.02
0.04
0.06
0.08
0.10
Frequency
mean=12.13 median=10.96 IQR= 7.52
222 Rn Exhalation 2006 Szegvary
0 10 20 30 40 50 60222 Rn Exhalation [mBq m−2 s−1 ]
0.00
0.02
0.04
0.06
0.08
0.10
Frequency
mean= 8.10 median= 7.24 IQR= 5.81
222 Rn Exhalation 1957-2002 Lopez-Coto
Figure 4. Annual mean 222Rn exhalation rates for 2006-2010 from this study in comparison with published maps (Szegvary et al., 2009;
López-Coto et al., 2013). The upper four panels show the geographical distributions, while the lower four panels display the normalized
frequency distributions of annual means from all pixels of the four maps.
might, at least to some extent, be caused by the reduction
of 222Rn fluxes in snow-covered regions, which is included
in the flux map of López-Coto et al. (2013) but not in our
standard estimates. Including a restriction during frozen soil
conditions in our flux estimates (orange and cyan lines in
Fig. 5) reduces the difference of the annual mean in this re-
gion, but they are still more than 50 % higher than López-
Coto et al. (2013). However, it is important to keep in mind
that López-Coto et al. (2013) use a ca. 40 % smaller ema-
nation coefficient of 0.2 for all soils, compared to a median
www.atmos-chem-phys.net/15/12845/2015/ Atmos. Chem. Phys., 15, 12845–12865, 2015

12856 U. Karstens et al.: A process-based 222radon flux map for Europe
35 40 45 50 55 60 65 70Latitude [ ◦ N]
0
5
10
15
20
25
222R
n E
xhala
tion [m
Bq m
−2 s−
1]
222 Radon Exhalation 2006-2010Rn flux (GLDAS-Noah)
Rn flux (GLDAS-Noah) with frost limit.
Rn flux (ERA-I/L)
Rn flux (ERA-I/L) with frost limit.
Lopez-Coto et al. (2013)
Szegvary et al. (2009)
Figure 5. Latitudinal gradient of annual mean 222Rn exhalation
rates for 2006–2010 from this study in comparison with published
maps (Szegvary et al., 2009; López-Coto et al., 2013). Zonal aver-
age land surface fluxes for 1◦ latitude bands are shown.
value of 0.35 in our study. This difference is responsible for
a generally 40 % lower 222Rn exhalation rate in the López-
Coto et al. (2013) map than estimated for our two maps.
The Szegvary et al. (2009) map has lower spatial resolu-
tion and less pronounced hotspots of exhalation rates, but
the median of its annual mean exhalation rates lies between
our GLDAS-Noah- and ERA-I/L-based estimates. However,
as Szegvary et al. (2009) used γ -dose rate observations and
an empirical correlation with measured 222Rn fluxes, their
fluxes are significantly different in certain areas of Europe.
In particular, the pronounced maximum in the French Mas-
sif Central, where high 238U concentrations are measured in
the soils (Fig. S2), is only slightly visible in the Szegvary
et al. (2009) map. A detailed picture of the differences be-
tween our maps and the Szegvary et al. (2009) estimate for
2006 is shown in the Supplement (Fig. S5). Largest differ-
ences are seen in central Europe, where our GLDAS-Noah-
based estimates are in many places larger than the Szegvary
et al. (2009) estimates by a factor of 2, while ERA-I/L-based
estimates are often about 50 % smaller compared to the Szeg-
vary et al. (2009) estimates. In northern Scandinavia our two
estimates are higher than the Szegvary et al. (2009) map. The
reason might be the shielding effect of snow cover on the
observed γ -dose rate (Szegvary et al., 2007a). Including the
frost restriction in our flux estimates reduces the difference
of the annual mean in this region but leads to values lower
than in the Szegvary et al. (2009) map in southern Scandi-
navia (Fig. 5).
0
10
20
30
40
0
10
20
30
40
0
10
20
30
40
0
10
20
30
40
2 4 6 8 10 120
10
20
30
40
observations GLDAS-Noah LSM ERA-Interim/Land
M1 - loamy sand
M2 - sandy loam
222 R
n E
xhal
atio
n (m
Bq
m-2 s
-1)
M3 - loamy sand
M4 - sandy clay loam
Month
M5 - sandy clay loam
Figure 6. Comparison of the observed climatology of monthly222Rn fluxes at the sampling sites M1–M5 (symbols with error bars
representing monthly mean observational data and their standard
error) with bottom-up estimates using the diffusivity estimate of
Millington and Quirk (1960). Soil moisture climatology is taken
either from the GLDAS Noah LSM (red lines) or from the ERA-
Interim/Land model (blue lines) for the respective pixels, averaged
over the period of 2006–2010. Note that the monthly soil moisture
values have been adjusted according to Eq. (13), i.e. taking into ac-
count the actual porosity at the measurement sites (see text).
5.3 Representativeness of local observations to validate
the 222Rn flux maps
A large number of systematic direct 222Rn flux measure-
ments using the accumulation chamber technique were car-
ried out in the 1980s and 1990s at five sampling sites south
of Heidelberg, Germany. Dörr and Münnich (1990) started
these measurements in 1984 at a sandy soil site (M1) as
well as at a clay-loam soil site (M4). Schüßler (1996),
who sampled additional sites close to the earlier plots from
Dörr and Münnich (1990), continued measurements on these
plots. The soil parameters of the five sampling sites M1–
M5 are listed in Table 2. For these sites we estimated the
percentages of clay, silt, and sand according to Cosby et
al. (1984, Table 2) from the soil type descriptions given by
Schüßler (1996). The soil properties of other IUP sampling
sites studied by Schell (2004; Gebesee), Schmithüsen (2012;
Atmos. Chem. Phys., 15, 12845–12865, 2015 www.atmos-chem-phys.net/15/12845/2015/

U. Karstens et al.: A process-based 222radon flux map for Europe 12857
IUP) and Schwingshackl (2013; Gif-sur-Yvette (Gif)) at lo-
cations in Germany and France are also listed in Table 2.
In addition, the soil parameter values of the 0.083◦× 0.083◦
pixels from the high-resolution soil parameter map, in which
the measurement sites are located, are listed. From compar-
ison, we can assess the representativeness of the measure-
ment sites for their corresponding pixel of the map. While
the Sandhausen sites M1–M3 are not at all representative for
the corresponding map pixel, the soil texture and 226Ra ac-
tivity concentration of the loamy sites M4 and M5 as well
as the IUP site, discussed already above (Sect. 3.1), are well
comparable with the map pixel. The latter are thus suitable
for validation of our maps and the transport model approach.
For Gebesee in northern Germany, actual site parameters
agree well with the soil parameters of the map. Only the226Ra content is about 20 % lower in the map than mea-
sured by Schwingshackl (2013). Contrary, for Gif-sur-Yvette
in France porosity, bulk density and 226Ra activity concen-
tration are significantly different from the pixel values. This
should be kept in mind when comparing our process-based
maps with these observations.
Figure 6 shows the climatology of the monthly mean222Rn exhalation rates measured at the Heidelberg M1–M5
stations over the periods of 1987–1995 (M1, M2, M4) and
1987–1998 (M3, M5). Jutzi (2001) calculated these averages
from the individual data of regular 1–2-weekly flux measure-
ments reported by Schüßler (1996). The strong dependency
of the mean exhalation rate on soil type is clearly visible. The
clay or loamy soils (M4 and M5) show the highest fluxes with
significant seasonal variations of the exhalation rate with up
to a factor of 2 larger values in July/August compared to Jan-
uary/February. In contrast, the seasonality at M1 and M3 is
only very weak, and fluxes at the sandy sites (M1–M3) are
about 3 times lower than at M4 and M5.
Figure 6 also shows calculated exhalation rates (according
to Eq. 8) based on the measured soil parameters listed in Ta-
ble 2 and the climatology of soil moisture for the Heidelberg
pixel as calculated from the two soil moisture models for the
years 2006–2010. Note that for these process-based calcula-
tions the GLDAS Noah model used a porosity of θp = 0.434
in the map pixels while the ERA-Interim/Land model used
θp = 0.439, i.e. both significantly different from measured
porosities, in particular at the sites with sandy soils (M1 and
M3, Table 2). For our calculations, we thus individually ad-
justed the soil moistures for all sites M1–M5 according to
Eq. (13) to better approximate the pore volumes available for
diffusion at the different sites. With these adjustments, the
flux estimates based on GLDAS Noah soil moisture agree
very well with observations for the sites M1–M3, but are
about 30 % too high for the stations M4 and M5. When using
modelled ERA-I/L soil moisture data, estimated mean sea-
sonal 222Rn fluxes are always lower than observations, by up
to a factor of 3 at M1 and M3 and by about a factor of 2
at the loamy and clay sites M2, M4, and M5. Without ad-
justment of modelled soil moisture to the site porosities, for
all sites and both soil moisture estimates, modelled 222Rn
fluxes would be up to a factor of 6 too low (results not shown
in Fig. 6). From this comparison of process-based estimates
with long-term observations, we can conclude that (1) the
agreement between estimates and observations strongly de-
pends on the validity of soil texture parameters used in the
map; (2) modelled soil moisture values need to be adjusted
to the local porosity according to Eq. (13), if reliable flux es-
timates shall be calculated; (3) in the Heidelberg pixels asso-
ciated to M1–M5, GLDAS-Noah-based 222Rn flux estimates
agree rather well with existing observations, while ERA-I/L-
based estimates largely underestimate fluxes at all sites. This
comparison also emphasizes that quantitative validation of
our 222Rn exhalation map can be misleading, if information
on soil properties is missing at the measurement sites.
5.4 Comparison of model-based 222Rn flux estimates
with measured time series and other flux maps
As demonstrated in the previous section, proper validation
of our 222Rn flux estimates requires comparison with direct
measurements carried out on soils representative for the re-
spective pixel of the map. However, systematic 222Rn flux
measurements in Europe are very sparse so that we include
in this section all sites (except for M1–M4 that have already
been discussed before, see Sect. 5.3), which have observa-
tions available to us over the course of at least 4 months.
Figure 7 compares estimates from our 222Rn flux map based
on the two soil moisture models GLDAS Noah (red lines:
standard, orange: with frost restriction), ERA-I/L (blue lines:
standard, cyan: with frost restriction) with those from Szeg-
vary et al. (2009: dark green lines), from López-Coto et
al. (2013: light yellow-green lines) and with observations
(black dots). Note that in case the observations do not fall
into the modelled time span of 2006–2008 displayed here, the
data points have been repeated as climatology for all years.
If the dotted red and blue lines can be distinguished, they
show the effect of shallow water-table depth. Fluxes that are
not restricted by the water table, contrary to those that are
restricted, are then visible as dotted (red and blue) lines (rel-
evant at Lutjewad and Gebesee where the water table is less
than 2 m below the soil surface); otherwise, the solid and dot-
ted lines fall onto each other. Figure 7 also shows the soil
moisture estimates calculated by the two land surface mod-
els as well as direct soil moisture measurements in different
depths, if available.
For most sites shown here, the ERA-Interim/Land-based222Rn fluxes (plotted in blue and cyan) are significantly lower
(often by more than a factor of 2) than those estimated with
the GLDAS Noah soil moisture data (plotted in red and or-
ange). Accordingly, ERA-I/L soil moisture estimates are sig-
nificantly higher than those estimated by GLDAS Noah at
these sites; note that porosities do not differ very much in be-
tween models at these sites, with a maximum difference of
6 % at Gebesee. Only at Lutjewad the two flux estimates are
www.atmos-chem-phys.net/15/12845/2015/ Atmos. Chem. Phys., 15, 12845–12865, 2015
12858 U. Karstens et al.: A process-based 222radon flux map for Europe
b)
e) f )d)
a) c)
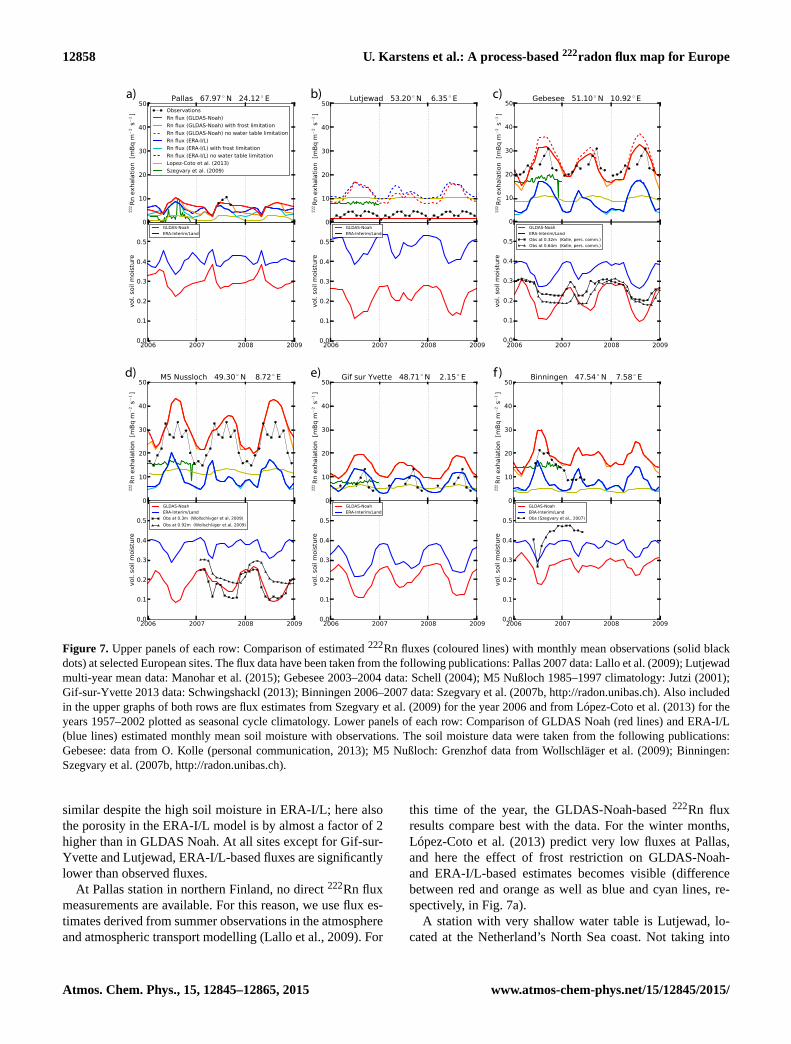
Figure 7. Upper panels of each row: Comparison of estimated 222Rn fluxes (coloured lines) with monthly mean observations (solid black
dots) at selected European sites. The flux data have been taken from the following publications: Pallas 2007 data: Lallo et al. (2009); Lutjewad
multi-year mean data: Manohar et al. (2015); Gebesee 2003–2004 data: Schell (2004); M5 Nußloch 1985–1997 climatology: Jutzi (2001);
Gif-sur-Yvette 2013 data: Schwingshackl (2013); Binningen 2006–2007 data: Szegvary et al. (2007b, http://radon.unibas.ch). Also included
in the upper graphs of both rows are flux estimates from Szegvary et al. (2009) for the year 2006 and from López-Coto et al. (2013) for the
years 1957–2002 plotted as seasonal cycle climatology. Lower panels of each row: Comparison of GLDAS Noah (red lines) and ERA-I/L
(blue lines) estimated monthly mean soil moisture with observations. The soil moisture data were taken from the following publications:
Gebesee: data from O. Kolle (personal communication, 2013); M5 Nußloch: Grenzhof data from Wollschläger et al. (2009); Binningen:
Szegvary et al. (2007b, http://radon.unibas.ch).
similar despite the high soil moisture in ERA-I/L; here also
the porosity in the ERA-I/L model is by almost a factor of 2
higher than in GLDAS Noah. At all sites except for Gif-sur-
Yvette and Lutjewad, ERA-I/L-based fluxes are significantly
lower than observed fluxes.
At Pallas station in northern Finland, no direct 222Rn flux
measurements are available. For this reason, we use flux es-
timates derived from summer observations in the atmosphere
and atmospheric transport modelling (Lallo et al., 2009). For
this time of the year, the GLDAS-Noah-based 222Rn flux
results compare best with the data. For the winter months,
López-Coto et al. (2013) predict very low fluxes at Pallas,
and here the effect of frost restriction on GLDAS-Noah-
and ERA-I/L-based estimates becomes visible (difference
between red and orange as well as blue and cyan lines, re-
spectively, in Fig. 7a).
A station with very shallow water table is Lutjewad, lo-
cated at the Netherland’s North Sea coast. Not taking into
Atmos. Chem. Phys., 15, 12845–12865, 2015 www.atmos-chem-phys.net/15/12845/2015/

U. Karstens et al.: A process-based 222radon flux map for Europe 12859
account ground water table restriction in the modelled 222Rn
exhalation rate (dotted lines in Fig. 7b) would largely over-
estimate the flux in both approaches by more than a factor
of 4. Here the Szegvary et al. (2009) and the López-Coto et
al. (2013) models overestimate observed fluxes by more than
a factor of 2–3. Taking into account the restriction due to
the shallow water table brings the modelled 222Rn exhalation
rate closer to the observations but also reduces the ampli-
tude of the seasonal variations. Note that ERA-I/L-based and
GLDAS-Noah-based fluxes are almost identical under wa-
ter table restriction and therefore hardly distinguishable in
Fig. 7b.
At Gebesee, co-located soil moisture measurements are
available. They agree very well with the GLDAS-Noah-
based model estimates (Fig. 7c); further, GLDAS-Noah-
based 222Rn fluxes fit the observations very well. Here again,
the water-table depth flux restriction turns out to be impor-
tant. Estimated GLDAS-Noah-based fluxes not restricted by
water-table depth are significantly higher in early summer
than observed fluxes (dotted red line in Fig. 7c), but those
restricted by water table agree, on average, well with obser-
vations. At the end of the summer, local water-table depth
may be deeper than in winter and spring, which is why obser-
vations then seem to fall on the unrestricted GLDAS-Noah-
based model estimates.
As has been indicated already in Fig. 6, the GLDAS-Noah-
based estimates for M5-Nußloch are slightly higher than ob-
servations, while the ERA-I/L-based estimates underestimate
the observations by about a factor of 2 (Fig. 7d). Note, how-
ever, that in the current comparison, contrary to the results
shown in Fig. 6, we use for both modelled fluxes all parame-
ters, including 226Ra activity concentration and soil porosity,
from our map and not from observations. Although absolute
fluxes are not perfectly reproduced, both of our models seem
to capture the seasonal amplitude of observations much bet-
ter than estimates by Szegvary et al. (2009) and López-Coto
et al. (2013) models. The good agreement between GLDAS-
Noah-based and observed 222Rn fluxes at M5 is accompanied
by good agreement of GLDAS-Noah-modelled soil moisture
and respective observations. Soil moisture data plotted for
M5 do not exactly stem from the M5 site but are taken from
a soil monitoring station north of Heidelberg at Grenzhof
(Wollschläger et al., 2009). Modelled soil moistures as well
as soil properties in the grid cells corresponding to the loca-
tion of M5 and Grenzhof are identical in GLDAS Noah and
very similar in ERA-I/L.
At Gif-sur-Yvette, all models except for GLDAS Noah
seem to reproduce well at least the annual mean observed
fluxes (Fig. 7e). However, the seasonal amplitude seems to be
best captured by the ERA-I/L-based and the GLDAS-Noah-
based estimates, whereas the Szegvary et al. (2009) model
for 2006, if also valid for other years, and the López-Coto
et al. (2013) model underestimate the seasonal amplitude.
GLDAS-Noah-based fluxes are larger than observations by
about a factor of 2. This is very surprising because 226Ra ac-
tivity concentration of the map pixel is a factor of 2 smaller
than those measured by Schwingshackl (2013) (see Table 2).
From this difference alone, we would expect an underestima-
tion of Gif-sur-Yvette flux observations by both of our flux
estimates. On the other hand, the shallow water table at the
measurement site (Campoy et al., 2013) might restrict the222Rn fluxes. This situation is not represented in our maps,
where the water table is well below 10 m in this region.
At Binningen, Switzerland, which is the measurement sta-
tion that Szegvary et al. (2009) also used for the empirical γ -
dose rate-based estimates of their 222Rn flux map for 2006,
their measured data fall in between our GLDAS-Noah- and
ERA-I/L-based fluxes (Fig. 7f). Only in spring 2007 both
of our estimates are higher than the observed fluxes. Soil
moisture estimates in both reanalyses are most of the time
lower than the observations but capture the temporal varia-
tion rather well. In 3 summer months of 2006, the Szegvary
et al. (2009) model estimates are slightly lower than the ob-
servations, while the López-Coto et al. (2013) model results
are considerably lower than all other model estimates and
lower than the observations by at least a factor of 2.
In summary, we conclude that at three out of six sta-
tions the (generally higher) GLDAS Noah soil-moisture-
based 222Rn exhalation rates are in good agreement with
observations. At two of these sites, where we have data
available, this correlates with good agreement of model-
calculated and observed soil moisture. Flux estimates based
on ERA-Interim/Land soil moistures have the tendency to
underestimate observed fluxes and only fit well at one of our
comparison sites (Gif-sur-Yvette). The two published maps,
in particular that developed by López-Coto et al. (2013),
generally underestimate measured fluxes with the exception
of the coastal site Lutjewad. There the shallow water-table
depth is not taken into account in these models, which leads
to large over-estimation. Concerning the seasonal amplitude
of fluxes, the GLDAS-Noah-based estimates as well as those
based on ERA-I/L soil moisture are in most cases very well in
line with observations. Contrary, Szegvary et al. (2009) flux
estimates largely underestimate seasonal amplitudes, at least
in 2006. The same is true for the López-Coto et al. (2013)
model estimates. As mentioned before, a large part of the
general underestimation by López-Coto et al. (2013) may
be due to the use of an overly low emanation coefficient in
their estimates. Based on available observations, the effect of
frozen soils cannot be evaluated. However, restriction due to
shallow water table turns out to be important, not only at the
coastal site Lutjewad, but potentially also in river plains such
as in the surroundings of the Gebesee site.
5.5 Comparison with published episodic 222Rn flux
observations
Since only very few systematic 222Rn flux measurements
during different seasons are available in the literature, vali-
dation of our new 222Rn flux map is far from exhaustive. In
www.atmos-chem-phys.net/15/12845/2015/ Atmos. Chem. Phys., 15, 12845–12865, 2015
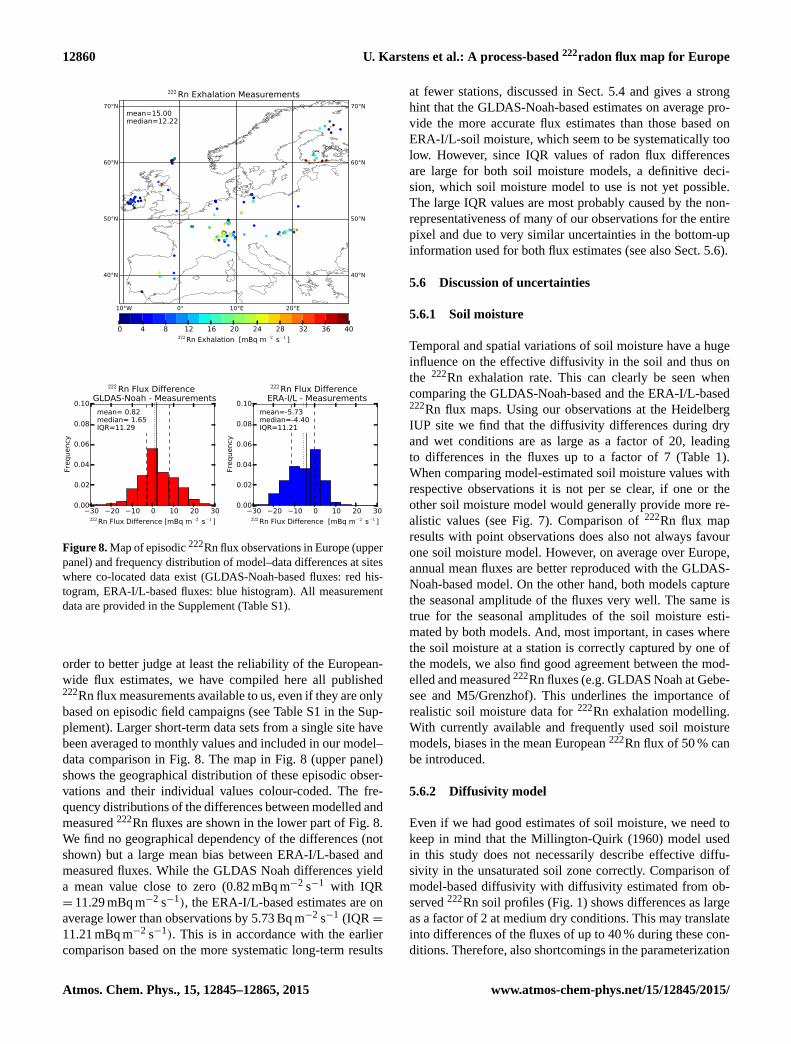
12860 U. Karstens et al.: A process-based 222radon flux map for Europe
30 20 10 0 10 20 30222 Rn Flux Difference [mBq m−2 s−1 ]
0.00
0.02
0.04
0.06
0.08
0.10
Frequency
mean= 0.82 median= 1.65 IQR=11.29
222 Rn Flux Difference GLDAS-Noah - Measurements
30 20 10 0 10 20 30222 Rn Flux Difference [mBq m−2 s−1 ]
0.00
0.02
0.04
0.06
0.08
0.10
Frequency
mean=-5.73 median=-4.40 IQR=11.21
222 Rn Flux Difference ERA-I/L - Measurements
40°N
50°N
60°N
70°N
40°N
50°N
60°N
70°N
10°W 0° 10°E 20°E
mean=15.00 median=12.22
222 Rn Exhalation Measurements
0 4 8 12 16 20 24 28 32 36 40222 Rn Exhalation [mBq m−2 s−1 ]
Figure 8. Map of episodic 222Rn flux observations in Europe (upper
panel) and frequency distribution of model–data differences at sites
where co-located data exist (GLDAS-Noah-based fluxes: red his-
togram, ERA-I/L-based fluxes: blue histogram). All measurement
data are provided in the Supplement (Table S1).
order to better judge at least the reliability of the European-
wide flux estimates, we have compiled here all published222Rn flux measurements available to us, even if they are only
based on episodic field campaigns (see Table S1 in the Sup-
plement). Larger short-term data sets from a single site have
been averaged to monthly values and included in our model–
data comparison in Fig. 8. The map in Fig. 8 (upper panel)
shows the geographical distribution of these episodic obser-
vations and their individual values colour-coded. The fre-
quency distributions of the differences between modelled and
measured 222Rn fluxes are shown in the lower part of Fig. 8.
We find no geographical dependency of the differences (not
shown) but a large mean bias between ERA-I/L-based and
measured fluxes. While the GLDAS Noah differences yield
a mean value close to zero (0.82 mBq m−2 s−1 with IQR
= 11.29 mBq m−2 s−1), the ERA-I/L-based estimates are on
average lower than observations by 5.73 Bq m−2 s−1 (IQR =
11.21 mBq m−2 s−1). This is in accordance with the earlier
comparison based on the more systematic long-term results
at fewer stations, discussed in Sect. 5.4 and gives a strong
hint that the GLDAS-Noah-based estimates on average pro-
vide the more accurate flux estimates than those based on
ERA-I/L-soil moisture, which seem to be systematically too
low. However, since IQR values of radon flux differences
are large for both soil moisture models, a definitive deci-
sion, which soil moisture model to use is not yet possible.
The large IQR values are most probably caused by the non-
representativeness of many of our observations for the entire
pixel and due to very similar uncertainties in the bottom-up
information used for both flux estimates (see also Sect. 5.6).
5.6 Discussion of uncertainties
5.6.1 Soil moisture
Temporal and spatial variations of soil moisture have a huge
influence on the effective diffusivity in the soil and thus on
the 222Rn exhalation rate. This can clearly be seen when
comparing the GLDAS-Noah-based and the ERA-I/L-based222Rn flux maps. Using our observations at the Heidelberg
IUP site we find that the diffusivity differences during dry
and wet conditions are as large as a factor of 20, leading
to differences in the fluxes up to a factor of 7 (Table 1).
When comparing model-estimated soil moisture values with
respective observations it is not per se clear, if one or the
other soil moisture model would generally provide more re-
alistic values (see Fig. 7). Comparison of 222Rn flux map
results with point observations does also not always favour
one soil moisture model. However, on average over Europe,
annual mean fluxes are better reproduced with the GLDAS-
Noah-based model. On the other hand, both models capture
the seasonal amplitude of the fluxes very well. The same is
true for the seasonal amplitudes of the soil moisture esti-
mated by both models. And, most important, in cases where
the soil moisture at a station is correctly captured by one of
the models, we also find good agreement between the mod-
elled and measured 222Rn fluxes (e.g. GLDAS Noah at Gebe-
see and M5/Grenzhof). This underlines the importance of
realistic soil moisture data for 222Rn exhalation modelling.
With currently available and frequently used soil moisture
models, biases in the mean European 222Rn flux of 50 % can
be introduced.
5.6.2 Diffusivity model
Even if we had good estimates of soil moisture, we need to
keep in mind that the Millington-Quirk (1960) model used
in this study does not necessarily describe effective diffu-
sivity in the unsaturated soil zone correctly. Comparison of
model-based diffusivity with diffusivity estimated from ob-
served 222Rn soil profiles (Fig. 1) shows differences as large
as a factor of 2 at medium dry conditions. This may translate
into differences of the fluxes of up to 40 % during these con-
ditions. Therefore, also shortcomings in the parameterization
Atmos. Chem. Phys., 15, 12845–12865, 2015 www.atmos-chem-phys.net/15/12845/2015/

U. Karstens et al.: A process-based 222radon flux map for Europe 12861
of diffusivity may considerably contribute to the uncertainty
of the 222Rn flux. However, using different parameterizations
as, e.g. that of Rogers and Nielson (1991), as done by Grif-
fiths et al. (2010) and López-Coto et al. (2013), does not im-
prove the situation (see Table 1). We estimate mean uncer-
tainty of 222Rn fluxes to be on the order of 30 % due to our
choice of the diffusivity model.
5.6.3 226Ra content
An important parameter determining the 222Rn flux from
soils is the 226Ra content. In our study we have used an
interpolated 238U distribution based on systematic measure-
ments published in the European Geochemical Atlas (Salmi-
nen, 2005). Uncertainties in the soil sample analysis (Sand-
ström et al., 2005) and in the interpolation are both less than
10 %. From the interpolated 238U distribution, we estimated226Ra activity concentration by assuming secular equilibrium
between 238U and its daughter 226Ra. This assumption may
not always be fulfilled at all sites due to preferential leaching
of 234U from the soil grains, so that our 238U-based equi-
librium estimate of 226Ra must be seen as an upper limit of
the true 226Ra values. However, when comparing the 226Ra
values from the map with point measurements made at IUP
Heidelberg, we find satisfactory agreement if other soil pa-
rameters, such as texture and bulk density, are similar, i.e. if
the point measurement is representative for the pixel (data
not shown). An example of obvious differences between the
soil characteristics of our measurement site and the pixel of
the map is Gif-sur-Yvette, France. Here we observe a factor
of 2 higher 226Ra activity concentration in our measurement
than assumed for the map pixel, but also bulk density and
porosity show a large difference. Therefore, the average un-
certainty of our interpolated 226Ra activity concentration data
is most probably less than 15 %.
5.6.4 Emanation coefficient
Besides the 226Ra activity concentration in the bulk soil ma-
terial, the emanation coefficient is an essential parameter
for correctly estimating the 222Rn exhalation rate. Only few
measurements of the emanation coefficients for different soil
types and environmental conditions exist and reported values
span a wide range of 0.05 to 0.7 (Nazaroff, 1992). The em-
anation coefficient estimates of our study compare well with
the observation-based estimates by Schüßler (1996) around
the Heidelberg site. The averaged value used in our study
(0.35) is, however, 75 % higher than the constant emanation
coefficient of 0.2 used by López-Coto et al. (2013) for all
soils. The underestimation of the 222Rn fluxes by the López-
Coto et al. (2013) model at most sites indicates that an ema-
nation coefficient of 0.2 is probably too small. More mea-
surements of emanation coefficients and their dependence
on soil texture would be helpful to reduce the uncertainty in
this parameter. Still, the uncertainty of our assumption of the
texture-specific emanation coefficient as used for our maps is
probably smaller than 20 %.
5.6.5 Constancy of transport parameters with depth
One basic assumption in our estimate is homogeneity of
soil parameters with depth up to 1m. While the differences
of 238U in the European Geochemical Atlas between up-
per and lower soil layers are only minor, other soil param-
eters such as porosity and texture may not be as homoge-
neous with depth. Porosity derived from the Reynolds et
al. (2000) soil texture data set differs by ca. 3 % between
the two soil layers, but this presumably underestimates ver-
tical variability. The largest vertical inhomogeneity is most
probably that of soil moisture. During summer months, at
one of our sampling sites we observed that soil moisture dif-
fers by a factor of 2 between 30 and 90 cm depths (see Fig. 7
for M5 Nußloch). However, the differences between the two
soil models, GLDAS Noah and ERA-I/L can be even larger.
Therefore, with the current reliability of soil moisture input
data from the models, our simplification assuming homoge-
neous parameters throughout the unsaturated soil seems jus-
tified. In any case, except for dry summer conditions, more
than three-quarters of the total 222Rn flux at the soil surface
originate from the upper 50 cm of the soil; one should thus
make sure that all parameters in this upper layer are deter-
mined to be as reliable as possible.
5.6.6 Soil texture
For consistency, we use in our European 222Rn flux estima-
tions the same porosity as applied in the soil moisture sim-
ulations of the respective land surface model. In both mod-
els, the soil properties were derived from the FAO Digital
Soil Map of the World (FAO DSMW), though from differ-
ent versions (Reynolds et al., 2000; FAO, 2003), and in-
deed soil porosities in both models are very similar. Only
parts of northern Europe show differences of up to 10 %.
Soil databases are constantly improving as more soil infor-
mation is collected and more detailed digital soil data sets
are becoming available, like the Harmonized World Soil
Database (HWSD, FAO/IIASA/ISRIC/ISSCAS/JRC, 2012)
and the Global Soil Dataset for use in Earth System Mod-
els (GSDE; Shangguan et al., 2014), which should reduce
uncertainties associated with soil texture. However, the com-
parisons between soil properties in these new data sets (in
Shangguan et al., 2014) also reveal maximum porosity dif-
ferences of around 10 % in northern Europe.
5.6.7 Frost
In our sensitivity test with a very simple parameterization of
frost and/or snow conditions, 222Rn flux estimates in Scan-
dinavia and eastern Europe are reduced by 30–40 % during
winter and by 10 % for annual mean fluxes in this region.
However, due to the lack of systematic flux measurements
www.atmos-chem-phys.net/15/12845/2015/ Atmos. Chem. Phys., 15, 12845–12865, 2015

12862 U. Karstens et al.: A process-based 222radon flux map for Europe
during winter conditions, this parameterization could not be
evaluated and can only give an estimate of the associated un-
certainties. For more reliable estimations of 222Rn fluxes in
higher latitudes during winter, more investigations on the in-
fluence of frost and snow on 222Rn exhalation is desirable.
Uncertainties in annual mean 222Rn fluxes mainly in north-
ern Europe due to neglecting flux restriction by frozen soil
may be of the order of 10–20 %. However, we do not include
this uncertainty in our overall uncertainty estimate below.
5.6.8 Combined uncertainty of the 222Rn flux map
The overall uncertainty of 222Rn flux estimates for individ-
ual pixels, not taking into account systematic biases in the
soil moisture models, can be roughly deduced from indi-
vidual uncertainties of all parameters by error propagation.
As discussed above, the two largest uncertainties stem from
the uncertainty to determine effective diffusivity based on
soil texture/porosity and soil moisture (ca. 30 %). The un-
certainty contribution of modelled soil moisture is probably
also of the order of 30 %, while the emanation coefficient is
assumed to be known to about 25 %. Other parameters are
uncertain to about 10–15 % on the pixel scale. Altogether,
we therefore estimate the uncertainty of modelled fluxes for
individual pixels to about 50 %. In atmospheric applications,
footprints are often covering several pixels and the relatively
large uncertainty on the pixel scale may be reduced through
averaging. At this larger multi-pixel scale, the uncertainty of
our 222Rn fluxes is probably smaller than 20–30 %.
Inspecting now our comparison between single measure-
ments and modelled flux for the respective pixel (Fig. 8), the
IQR of the differences were on the order of 11 mBq m−2 s−2
or about 70–100 % of the mean flux, depending on the
soil moisture model. Standard deviations of these distribu-
tions are slightly larger than IQRs, in our case about 100 %.
With an estimated uncertainty of the modelled flux of about
50 %, this would imply that the contribution from non-
representativeness and uncertainty of the measurements to
the scatter is larger than 80 %. This emphasises the impor-
tance of auxiliary measurements of soil properties that need
to be performed in future 222Rn flux measurement campaigns
if these data shall be useful for evaluation of bottom-up flux
estimates.
6 Conclusions and perspectives
A high-resolution 222Rn flux map for Europe was developed,
based on a parameterization of 222Rn production and trans-
port in the soil. The approach includes a well-established
parameterization of soil diffusivity (Millington and Quirk,
1960) and makes use of existing high-resolution data sets of
soil properties, uranium content, model-derived soil mois-
ture as well as model-derived water-table depth. Compar-
isons with direct 222Rn flux measurements in different re-
gions of Europe show that the observed seasonality is realis-
tically reproduced by our approach, which was not achieved
by earlier studies for Europe, and confirms the validity of es-
timating diffusivity in soil air based on the Millington and
Quirk (1960) model.
Using two different sets of soil moisture reanalyses un-
derlines the strong dependence of 222Rn flux estimates on
realistic soil moisture values. Both model-based soil mois-
ture estimates evaluated here, either from the GLDAS Noah
or the ERA-Interim/Land model, realistically reproduce ob-
served seasonality in soil moisture. This translates into a re-
alistic seasonality of 222Rn exhalation rates in both realiza-
tions of our flux map; however, the overall magnitude of
the 222Rn fluxes differs. Comparison of the two 222Rn flux
maps with European-wide point observations indicates bet-
ter agreement of GLDAS-Noah-based flux estimates than
of those calculated with ERA-I/L soil moisture. While at
a monthly time resolution the overall mean 222Rn flux val-
ues from the GLDAS-Noah-based map show almost no bias
to the overall mean of point observations in Europe (ca.
15 mBq m−2 s−1), the ERA-I/L-based model underestimates
mean fluxes by more than 60 %. The variability of model–
measurement differences is, however, large for both maps.
Besides model uncertainties, which are estimated to con-
tribute about 50 % to the scatter of the differences, limited
representativeness of single point measurements for the en-
tire pixel of the map contributes most.
The spatial resolution of the soil moisture models used
here restricts spatial resolution of the two realizations of our
European 222Rn exhalation map. In many applications, such
as the Radon Tracer Method (e.g. Levin et al., 1999), local
estimates of 222Rn fluxes would also be useful. In such cases,
our theoretical approach could easily be applied, e.g. by us-
ing local soil texture information and measured soil moisture
data, which become more and more available at ecosystem
sites in Europe or elsewhere (e.g. FLUXNET, Baldocchi et
al., 2001). Also, in our study we restricted the temporal res-
olution to 1 month because (quasi-) continuous 222Rn flux
measurements were not available to us for comparison. How-
ever, extension of the temporal resolution to that of the soil
moisture models (sub-daily) would be easily achievable.
Validation of our estimated 222Rn fluxes was restricted in
our study to relatively few not evenly distributed observa-
tional sites, most of them located in central Europe. Many
climate zones and soil types such as subarctic regions, wet-
lands and dry areas of Europe, could not be validated with
observations. This includes quantification of the influence
of snow cover or frozen soils. Hence, additional systematic222Rn flux measurements that are accompanied with ancil-
lary data of soil properties and soil moisture would facilitate
and improve validation of the presented maps or may allow
more reliable parameterizations, particularly for special re-
gions and climatic situations.
It would also be interesting to apply our approach to other
areas of the world, which would allow for comparison with
Atmos. Chem. Phys., 15, 12845–12865, 2015 www.atmos-chem-phys.net/15/12845/2015/

U. Karstens et al.: A process-based 222radon flux map for Europe 12863
maps developed for areas outside of Europe, using differ-
ent methodologies, e.g. of diffusivity estimation. We decided
to leave this effort to future work, also because of non-
availability of a systematic 238U or 226Ra survey in a num-
ber of important regions and continents of the world (e.g.
Russia, the Americas, and Africa). Empirical correlations be-
tween 226Ra activity concentrations and other soil parameters
turned out to be only weak and do not allow for accurate eval-
uations of the 222Rn source in these regions.
The presented 222Rn flux maps for Europe are freely avail-
able, e.g. for atmospheric transport model evaluations or
comparable studies. Feedback from such investigations that
also integrate atmospheric observations could help to im-
prove our flux map, e.g. during afternoon when atmospheric
model transport is more reliable.
Although we currently favour the GLDAS-Noah-based222Rn flux estimates for Europe, we emphasise that in cases
when soil moisture data or reliable model estimates are di-
rectly available in the transport model (as could be the case
in most online transport models) our approach could also be
applied using these measured or model-generated soil mois-
tures. This may improve local or regional 222Rn flux esti-
mates.
Digital versions of the maps are available at
doi:10.1594/PANGAEA.854715.
The Supplement related to this article is available online
at doi:10.5194/acp-15-12845-2015-supplement.
Acknowledgements. The research leading to these results has
received funding from the European Community’s Seventh
Framework Programme (FP7/2007-2013) in the InGOS project
under grant agreement n◦ 284274. S. D. Schery is gratefully
acknowledged for his insightful review and comments, which
helped to improve our paper. We thank G. Miguez-Macho (Uni-
versidade de Santiago de Compostela, Spain) for providing the
model-simulated water-table-depth data set, N. Manohar (Center
for Isotope Research, University of Groningen, The Netherlands)
for making available the 222Rn flux measurements at Lutjewad,
and Felix Vogel (Laboratoire des Sciences du Climat et de
l’Environnement, Gif-sur-Yvette, France) for helping with the flux
measurement in Gif-sur-Yvette. We further thank O. Kolle (Max
Planck Institute for Biogeochemistry, Jena, Germany) for providing
soil moisture measurements at Gebesee and A. Gassama (Institut
für Umweltphysik, Heidelberg University, Germany) for providing
soil moisture measurements at Grenzhof. The GLDAS Noah soil
moisture data used in this study were acquired as part of the mission
of NASA’s Earth Science Division and archived and distributed by
the Goddard Earth Sciences (GES) Data and Information Services
Center (DISC). ERA-Interim/Land soil moisture reanalysis data
were obtained from the ECMWF Data Server.
The article processing charges for this open-access
publication were covered by the Max Planck Society.
Edited by: P. Jöckel
References
Baldocchi, D., Falge, E., Gu, L., Olson, R., Hollinger, D., Run-
ning, S., Anthoni, P., Bernhofer, C., Davis, K., and Evans, R.:
FLUXNET: A new tool to study the temporal and spatial variabil-
ity of ecosystem-scale carbon dioxide, water vapor, and energy
flux densities, B. Am. Meteorol. Soc., 82, 2415–2434, 2001.
Balsamo, G., Albergel, C., Beljaars, A., Boussetta, S., Brun, E.,
Cloke, H., Dee, D., Dutra, E., Muñoz-Sabater, J., Pappen-
berger, F., de Rosnay, P., Stockdale, T., and Vitart, F.: ERA-
Interim/Land: a global land surface reanalysis data set, Hydrol.
Earth Syst. Sci., 19, 389–407, doi:10.5194/hess-19-389-2015,
2015.
Born, M., Dörr, H., and Levin, I.: Methane consumption in aerated
soils of the temperate zone, Tellus, 42B, 2–8, 1990.
Campoy, A., Ducharne, A., Cheruy, F., Hourdin, F., Polcher, J., and
Dupont, J. C.: Response of land surface fluxes and precipita-
tion to different soil bottom hydrological conditions in a general
circulation model, J. Geophys. Res. Atmos., 118, 10725–10739,
doi:10.1002/jgrd.50627, 2013.
Chevillard, A., Ciais, P., Karstens, U., Heimann, M., Schmidt, M.,
Levin, I., Jacob, D., and Podzun, R.: Transport of 222Rn using
the on-line regional scale model REMO: A detailed comparison
with measurements over Europe, Tellus, 54B, 850–871, 2002.
Conen, F. and Robertson, L.: Latitudinal distribution of radon-222
flux from continents, Tellus, 54B, 127–133, 2002.
Cosby, B. J., Hornberger, G. M., Clapp, B., and Ginn, T. R.: A Sta-
tistical Exploration of the Relationships of Soil Moisture Charac-
teristics to the Physical Properties of Soils, Water Resour. Res.,
20, 682–690, 1984.
Dorigo, W. A., Wagner, W., Hohensinn, R., Hahn, S., Paulik, C.,
Xaver, A., Gruber, A., Drusch, M., Mecklenburg, S., van Oeve-
len, P., Robock, A., and Jackson, T.: The International Soil Mois-
ture Network: a data hosting facility for global in situ soil mois-
ture measurements, Hydrol. Earth Syst. Sci., 15, 1675–1698,
doi:10.5194/hess-15-1675-2011, 2011.
Dörr, H. and Münnich, K. O.: 222Rn flux and soil air concentration
profiles in West Germany. Soil 222Rn as tracer for gas transport
in the unsaturated soil zone, Tellus, 42B, 20–28, 1990.
FAO: Digital soil map of the world and derived soil properties, Food
and Agriculture Organization of the United Nations, Land and
Water Digital Media Series, CD-ROM, Rome, Italy, 2003.
FAO/IIASA/ISRIC/ISSCAS/JRC: Harmonized World Soil
Database (version 1.2), FAO, Rome, Italy, IIASA, Laxen-
burg, Austria, 2012.
Griffiths, A. D., Zahorowski, W., Element, A., and Werczynski, S.:
A map of radon flux at the Australian land surface, Atmos. Chem.
Phys., 10, 8969–8982, doi:10.5194/acp-10-8969-2010, 2010.
Hartmann, J. and Moosdorf, N.: The new global lithological
map database GLiM: A representation of rock properties at
the Earth surface, Geochem. Geophys. Geosyst., 13, Q12004,
doi:10.1029/2012GC004370, 2012.
Hirao, S., Yamazawa, H., and Moriizumi, J.: Estimation of the
global 222Rn flux density from the Earth’s surface, Jpn. J. Health
Phys., 45, 161–171, 2010.
www.atmos-chem-phys.net/15/12845/2015/ Atmos. Chem. Phys., 15, 12845–12865, 2015

12864 U. Karstens et al.: A process-based 222radon flux map for Europe
IAEA: Construction and Use of Calibration Facilities for Radio-
metric Field Equipment, International Atomic Energy Agency,
Vienna, Austria, Technical Reports Series 309, 86 pp., 1989.
Iskandar, D., Yamazawa, H., and Iida, T.: Quantification of the de-
pendency of radon emanation power on soil temperature, Appl.
Radiat. Isotopes, 60, 971–973, 2004.
Jacob, D. J. and Prather, M. J.: Radon-222 as a test of convective
transport in a general circulation model, Tellus, 42B, 118–134,
1990.
Jin, Y. and Jury, W. A.: Characterizing the Dependence of Gas Dif-
fusion Coefficient on Soil Properties, Soil Sci. Soc. Am. J., 60,
66–71, 1996.
Jutzi, S.: Verteilung der Boden-Radon Exhalation in Europa, Staat-
sexamensarbeit, Institut für Umweltphysik, Heidelberg Univer-
sity, Germany, 57 pp., 2001.
Koster, R. D., Guo, Z., Yang, R., Dirmeyer, P. A., Mitchell,
K., and Puma, M. J.: On the Nature of Soil Mois-
ture in Land Surface Models, J. Climate, 22, 4322–4335,
doi:10.1175/2009JCLI2832.1, 2009.
Lallo, M., Aalto, T., Hatakka, J., and Laurila, T.: Hydrogen soil de-
position in the northern boreal zone, Boreal Environ. Res., 14,
784–793, 2009.
Levin, I., Glatzel Mattheier, H., Marik, T., Cuntz, M., Schmidt, M.,
and Worthy, D. E.: Verification of German methane emission in-
ventories and their recent changes based on atmospheric obser-
vations, J. Geophys. Res., 104, 3447–3456, 1999.
Levin, I., Born, M., Cuntz, M., Langendörfer, U., Mantsch, S., Nae-
gler, T., Schmidt, M., Varlagin, A., Verclas, S., and Wagenbach,
D.: Observations of atmospheric variability and soil exhalation
rate of Radon-222 at a Russian forest site: Technical approach
and deployment for boundary layer studies, Tellus, 54B, 462–
475, 2002.
López-Coto, J., Mas, J. L., and Bolivar, J. P.: A 40-
year retrospective European radon flux inventory includ-
ing climatological variability, Atmos. Environ., 73, 22–33,
doi:10.1016/j.atmosenv.2013.02.043, 2013.
Manohar, S. N., Meijer, H. A. J., Neubert, R. E. M., Kettner E., and
Herber, M. A.: Radon flux measurements at atmospheric station
Lutjewad – analysis of temporal trends and main drivers control-
ling the emissions, submitted, 2015.
Miguez-Macho, G., Li, H., and Fan, Y.: Simulated Water Table and
Soil Moisture Climatology Over North America, B. Am. Meteo-
rol. Soc., 89, 663–672, doi:10.1175/BAMS-89-5-663, 2008.
Millington, R. J. and Quirk, J. P.: Transport in Porous media, Pro-
ceedings of the 7th International Congress of soil Science, Madi-
son, Wisconsin, USA, 97–106, 1960.
Millington, R. J. and Quirk, J. P.: Permeability of porous solids,
Trans. Faraday Soc., 57, 1200–1207, 1961.
Moldrup, P., Kruse, C. W., Rolston, D. E., and Yamaguchi, T.: Mod-
eling diffusion and reaction in soils: III. Predicting gas diffusiv-
ity from the Campbell soil-water retention model, Soil Sci., 161,
366–375, 1996.
Moldrup, P., Olesen, T., Yamaguchi, T., Schjönning, P., and Rol-
ston, D. E.: Modeling diffusion and reaction in soils: IX. The
Buckingham-Burdine-Campbell Equation for gas diffusivity in
undisturbed soil, Soil Sci., 164, 542–551, 1999.
Nazaroff, W.: Radon transport from soil to air, Rev. Geophys., 30,
137–160, 1992.
Rasch, P. J., Feichter, J., Law, K., Mahowald, N. Benkovitz, C.,
Genthon, C., Giannakopoulos, C., Kasibhatla, P., Koch, D., Levy,
H., Maki, T., Prather, M., Roberts, D. L., Roelofs, G.-J., Steven-
son, D., Stockwell, Z., Taguchi, S., Kritz, M., Chipperfield, M.,
Baldocchi, D., McMurray, P., Barrie, L., Balkanski, Y., Chat-
field, R., Kjellstrom, E., Lawrence, M., Lee, H. N., Lelieveld,
J., Noone, K. J., Seinfeld, J., Stenchikov, G., Schwartz, S., Wal-
cek, C., and Williamson, D.: A comparison of scavenging and
deposition processes in global models: results from the WCRP
Cambridge Workshop of 1995, Tellus, 52B, 1025–1056, 2000.
Reynolds, C., Jackson, T., and Rawls, W.: Estimating soil water-
holding capacities by linking the Food and Agriculture Organiza-
tion soil map of the world with global pedon databases and con-
tinuous pedotransfer functions, Water Resour. Res., 36, 3653–
3662, 2000.
Robertson, L. B.: Radon Emissions to the Atmosphere and their use
as Atmospheric Tracers, PhD thesis, University of Edinburgh,
United Kingdom, 237 pp., 2004.
Rodell, M., Houser, P. R., Jambor, U., Gottschalck, J., Mitchell,
K., Meng, C.-J., Arsenault, K., Cosgrove, B., Radakovich, J.,
Bosilovich, M., Entin, J. K., Walker, J. P., Lohmann, D., and Toll,
D.: The Global Land Data Assimilation System, B. Am. Meteo-
rol. Soc., 85, 381–394, doi:10.1175/BAMS-85-3-381, 2004.
Rogers, V. C. and Nielson, K. K.: Correlations for predicting air
permeabilities and 222Rn diffusion coefficients of soils, Health
Phys., 61, 225–230, 1991.
Salminen, R. (Ed.): Geochemical Atlas of Europe. Part 1: Back-
ground Information, Methodology and Maps, Geological Survey
of Finland, Espoo, Finland, 2005.
Sandström, H., Reeder, S., Bartha, A., Birke, M., Berge, F., David-
sen, B., Grimstvedt, A., Hagel-Brunnström, M.-L., Kantor, W.,
Kallio, E., Klaver, G., Lucivjansky, P., Mackovych, D., Mjar-
tanova, H., van Os, B., Paslawski, P., Popiolek, E., Siewers, U.,
Varga-Barna, Z., van Vilsteren, E., and Ødegård, M.: Sample
Preparation and Analysis, in: Salminen, R. (ed.): Geochemical
Atlas of Europe, Part 1: Background Information, Methodology
and Maps, Geological Survey of Finland, Espoo, Finland, 2005.
Saxton, K., Rawls, W. J., Romberger, J., and Papendick, R.: Esti-
mating generalized soil-water characteristics from texture, Soil
Sci. Soc. Am. J., 50, 1031–1036, 1986.
Schell, S.: 222Radon-Profil-Messungen in Süd- und Ostdeutsch-
land, Anwendung der Radon-Tracer-Methode zur Berechnung
von CO2- und CH4-Flüssen, Diplomarbeit, Institut für Umwelt-
physik, Heidelberg University, Germany, 106 pp., 2004.
Schery, S. D. and Wasiolek, M. A.: Radon and Thoron in the Hu-
man Environment, chap. Modeling Radon Flux from the Earth’s
Surface, World Scientific Publishing, Singapore, 207–217, 1998.
Schmithüsen, D.: Atmospheric and soil flux radon measurements
in Heidelberg, Diplomarbeit, Institut für Umweltphysik, Heidel-
berg University, Germany, 66 pp., 2012.
Schüßler, W.: Effektive Parameter zur Bestimmung des Gasaus-
tauschs zwischen Boden und Atmosphäre, PhD thesis, Heidel-
berg University, Germany, 1996.
Schwingshackl, C.: Experimental Validation of a Radon-222 Flux
Map, Master Thesis, Institut für Umweltphysik, Heidelberg Uni-
versity, Germany, 100 pp., 2013.
Shangguan, W., Dai, Y., Duan, Q., Liu, B., and Yuan, H.: A global
soil data set for earth system modeling, J. Adv. Model. Earth
Syst. 6, 249–263, doi:10.1002/2013MS000293, 2014.
Atmos. Chem. Phys., 15, 12845–12865, 2015 www.atmos-chem-phys.net/15/12845/2015/

U. Karstens et al.: A process-based 222radon flux map for Europe 12865
Sun, K., Guo, Q., and Zhuo, W.: Feasibility for Mapping Radon
Exhalation Rate from Soil in China, J. Nucl. Sci. Technol., 41,
86–90, 2004.
Szegvary, T., Conen, F., Stöhlker, U., Dubois, G., Bossew, P.
and de Vries, G.: Mapping terrestrial γ -dose rate in Europe
based on routine monitoring data, Radiat. Meas., 42, 1561–1572,
doi:10.1016/j.radmeas.2007.09.002, 2007a.
Szegvary, T., Leuenberger, M. C., and Conen, F.: Predicting terres-
trial 222Rn flux using gamma dose rate as a proxy, Atmos. Chem.
Phys., 7, 2789–2795, doi:10.5194/acp-7-2789-2007, 2007b.
Szegvary, T., Conen, F., and Ciais, P.: European 222Rn inventory for
applied atmospheric studies, Atmos. Environ., 43, 1536–1539,
doi:10.1016/j.atmosenv.2008.11.025, 2009.
Taguchi, S., Law, R. M., Rödenbeck, C., Patra, P. K., Maksyutov, S.,
Zahorowski, W., Sartorius, H., and Levin, I.: TransCom continu-
ous experiment: comparison of 222Rn transport at hourly time
scales at three stations in Germany, Atmos. Chem. Phys., 11,
10071–10084, doi:10.5194/acp-11-10071-2011, 2011.
Turekian, K. K., Nozaki, Y., and Benninger L. K.: Geochemistry of
atmospheric radon and radon products, Annu. Rev. Earth Pl. Sc.,
5, 227–255, 1977.
Wackernagel, H.: Multivariate geostatistics: an introduction with
applications, Springer, Berlin, 2003.
Wilkening, M. H., Clements, W. E., and Stanley, D.: Radon-222
flux measurements in widely separated regions, in: The Natural
Radiation Environment 11, edited by: Adams, J. A. S., Lowder,
W. M., and Gesell, T. F., USAEC Report CONF-720805-P2 (Na-
tional Technical Information Service), Springfield, VA, 717 pp.,
1972.
Wollschläger, U., Pfaff, T., and Roth, K.: Field-scale apparent hy-
draulic parameterisation obtained from TDR time series and
inverse modelling, Hydrol. Earth Syst. Sci., 13, 1953–1966,
doi:10.5194/hess-13-1953-2009, 2009.
Zhuo, W., Iida, T., and Furukawa, M.: Modeling radon flux density
from the Earth’s surface, J. Nucl. Sci. Technol., 43, 479–482,
2006.
Zhuo, W., Guo, O., Chen, B., and Cheng, G.: Estimating the amount
and distribution of radon flux density from the soil surface in
China, J. Environ. Radioactiv., 99, 1143–1148, 2008.
www.atmos-chem-phys.net/15/12845/2015/ Atmos. Chem. Phys., 15, 12845–12865, 2015


![Error and Uncertainty Quantification in the Numerical ...€¦ · whenever the numerical flux satisfies the system extension of Osher’s famous “E-flux” condition [v]x+ x](https://img.pdfslide.us/doc/110x75/609e9124d937143e6073718a/error-and-uncertainty-quantification-in-the-numerical-whenever-the-numerical.jpg)