Embed Size (px)
Citation preview

A Procedure for the Sequential Determination of Polonium-210 Lead-210 Radium-226 Thorium and Uranium isotopes in Phosphogypsum by Liquid Scintillation Counting and Alpha Spectrometry
2
FOREWORD
Reliable comparable and ldquofit for purposerdquo results are an essential requirement for any decision based on analytical measurements For analyst the availability of tested and validated analytical procedures are extremely important tools for production such analytical data For maximum utility such procedures should be comprehensive clearly formulated and readily available to both the analyst and the customer for reference
Since 2004 the Environment programme of the IAEA has included activities aimed at the development of a set of procedures for the determination of radionuclides in terrestrial environmental samples In this report a combined procedure for the sequential determination of 210Pb 210Po 226Ra Th and U isotopes in phosphogypsum sample is described The method is based on the dissolution of small amounts of samples by microwave digestion followed by sequential separation of 210Po 210Pb Th and U isotopes by selective extraction chromatography using Sr resin TEVA and UTEVA Radium-226 is separated from interfering elements using Ba(Ra)SO4 co-precipitation Lead-210 is determined by liquid scintillation counting Alpha source of 210Po is prepared by auto-deposition on a silver plate The alpha sources of Th and U are prepared by electrodeposition on a stainless steel plate
A comprehensive methodology for the calculation of results including quantification of measurement uncertainty was also developed This report presents the final procedure which was developed and validated in terms of repeatability and reproducibility according to ISO guidelines
The IAEA wishes to thank all the participants for their valuable contributions to develop the procedure and review the document especially B Varga who prepared the draft of the manuscript The IAEA officer responsible for this publication was C-K Kim of the IAEA Environment Laboratories
CONTENTS
1 INTRODUCTION 1
2 SCOPE 2
3 NORMATIVE REFERENCES 2
4 RESPONSIBILITIES 2
5 TERMS AND DEFINITIONS SYMBOLS AND ABBREVIATIONS 3
6 PRINCIPLE 5
7 CHEMICAL REAGENTS AND EQUIPMENT 5
71 Tracers 5 72 Carrier 6 73 Equipment 6 74 Chemical reagents 6
8 PRECAUTIONS 7
9 PROCEDURE 8
91 Sample dissolution using microwave digestion system 8 92 Chemical separation procedures 8 93 Source preparation 10 94 Measurement 12
10 EXPRESSION OF RESULTS 14
101 Calculation of activity of relevant isotopes 14 102 Expression of combined uncertainty of relevant isotopes 17 103 Decision threshold 18 104 Detection limit 18
11 VALIDATION OF THE PROCEDURE 19
111 Trueness of the method 19 112 Precision of the method 19 113 Repeatability limit 20 114 Reproducibility limit 20 115 Outlier test 20 116 Acceptance criteria 20
12 TEST REPORT 20
REFERENCEShelliphelliphelliphelliphelliphelliphelliphelliphelliphelliphelliphelliphelliphelliphelliphelliphelliphelliphelliphelliphelliphelliphelliphelliphelliphelliphelliphelliphelliphellip26
APPENDIX I Nuclear data of relevant radionuclides and decay chains of U and Th series 28
APPENDIX II Flow chart for sequential separation of 210Po 210Pb Th U and 226Ra in phosphogypsumhelliphelliphelliphelliphelliphelliphelliphelliphelliphelliphelliphelliphelliphelliphelliphelliphelliphelliphelliphelliphellip32
APPENDIX III Properties of resinshelliphelliphelliphelliphelliphelliphelliphelliphelliphelliphelliphelliphelliphelliphelliphelliphelliphelliphelliphelliphellip33
4
APPENDIX IV Alpha spectra of analyteshelliphelliphelliphelliphelliphelliphelliphelliphelliphelliphelliphelliphelliphelliphelliphelliphelliphelliphellip37
APPENDIX V Liquide scintillation spectrahelliphelliphelliphelliphelliphelliphelliphelliphelliphelliphelliphelliphelliphelliphellip37
APPENDIX VI Calculation of the combined uncertainty of the activities of the analytes on sampling datehelliphelliphelliphelliphelliphelliphelliphelliphelliphelliphelliphelliphelliphelliphelliphelliphelliphelliphelliphelliphelliphelliphelliphelliphelliphelliphelliphelliphelliphelliphellip41
APPENDIX VII Detection threshold and limit of the applied procedurehelliphelliphelliphelliphelliphelliphellip49
APPENDIX VIII Validation results of the procedure50
CONTRIBUTORS TO DRAFTING AND REVIEWhelliphelliphelliphelliphelliphelliphelliphelliphelliphelliphelliphelliphelliphelliphellip55
1
1 INTRODUCTION
Phosphogypsum is a by-product derived from the wet process production of phosphoric acid by reacting phosphate rock with sulfuric acid and represents one of the most serious problems facing the phosphate industry today Very large quantities of phosphogypsum have been produced world-wide since the 1950s because of the high demand for phosphate fertilizer and because the wet phosphoric acid process produces about 5 t of phosphogypsum for every tonne of phosphoric acid manufactured Most of the phosphogypsum produced world-wide is stock-piled There has been high interest in findings uses for this by-product for example as a building material or a soil amendment for the remediation of soils Both the acidic process liquid wastes and the phosphogypsum itself are potential sources of contamination The main problem associated with this material concerns the relatively high levels of natural radionuclides of uranium-series (Fig I 1) and other radioactive (Fig I 2) and non radioactive contaminants which could have an impact on the environment There is concern related to the possible contamination of groundwater under phosphogypsum stacks and to radon exhalation which may pose a health risk to people working and living close to a stack
The presence of radionuclides puts restrictions on the use of phosphogypsum in building materials and in soil amendments The United States Environmental Protection Agency (US EPA) ruled that phosphogypsum would only be permitted for use in agriculture if the average concentration of 226Ra in the phosphogypsum does not exceed 370 Bqkg-1 [1 2] National Council of Radiation Protection [3] guideline recommends 226Ra content of 15 Bqg-1 in soil above which growing human food crops on it is restricted In addition the US EPA adopted an average 074 Bqmiddotm-2middots-1 upper limit on 222Rn emission from phosphogypsum stacks The phosphogypsum currently produced is stockpiled near the production site Recently there is considerable demand for provision of a reference material with a phosphogypsum matrix from IAEA Member State laboratories which have phosphate industry Consequently IAEA has prepared and released a phosphogypsum reference material (IAEA-434) after performing the necessary homogeneity and characterization tests As a part of this work the procedure described in this report was developed Alpha emitters such as U and Th isotopes 210Po and 226Ra are generally measured by alpha-spectrometry after radiochemical separation while 210Pb being a beta emitter is determined by liquid scintillation spectrometry The relevant decay data of relevant radionuclides are in Table I 1 and Figures I 1ndashI 2 [4] of Appendix I The purpose of this work was to develop a sequential separation method combining the extraction chromatography with Sr resin TEVA and UTEVA and Ba(Ra)SO4 co-precipitation for sequential determination of 210Po 210Pb Th U and 226Ra in phosphogypsum The method validation of the procedure was carried out in terms of trueness repeatability and reproducibility with the IAEA-434 reference material
2
2 SCOPE
The sequential separation method is described for the determination of 210Po 210Pb 226Ra Th and U isotopes in phosphogypsum by isotope dilution alpha particle spectrometry and liquid scintillation spectrometry (LSC) The mass of the sample required for the radiochemical analysis is typically 05 g The method validation was carried out during the preparation of reference material of IAEA-434 and the world wide intercomparison run of IAEA-CU-2008-03 [5] The typical chemical recovery and detection limits of relevant radionuclides in the proposed procedure are summarised in the Table 1
TABLE 1 TYPICAL CHEMICAL RECOVERIES AND DETECTION LIMITS OF RELEVANT RADIONUCLIDES IN THE PROPOSED PROCEDURE
Isotope Counting method Source preparation Typical recovery () Typical detection
limit (Bqkg-1 as dry mass)
210Pb LSC precipitation 80-90 24
210Po α-spectrometry auto-deposition 40-70 12
234U α-spectrometry electrodeposition 70-80
052
238U 019
230Th α-spectrometry electrodeposition 70-80
018
232Th 052
226Ra α-spectrometry electrodeposition 60-80 43
3 NORMATIVE REFERENCES
bull ISO 119292010 Determination of the characteristic limits (decision threshold detection limit and limits of the confidence interval) for measurements of ionizing radiation ndash Fundamentals and application
bull ISO 170252005 General requirements for the competence of testing and calibration laboratories
bull ISOTS 217482004 Guidance for the use of repeatability reproducibility and trueness estimates in measurement uncertainty estimation
bull ISOIEC Guide 98-32008 Uncertainty of measurement ndash Part 3 Guide to expression of uncertainty in measurement
bull ISO 7870-12007 Control charts ndash Part 1 General guidelines
4 RESPONSIBILITIES
It is the responsibility of the analyst to follow this procedure and to establish appropriate safety and health practices Compliance with national and or internal safety rules or chemical and radioactive safety is obligatory Although the method has been carefully tested each laboratory should perform an individual validation procedure
3
5 TERMS AND DEFINITIONS SYMBOLS AND ABBREVIATIONS
In the following u(x) indicates the uncertainty in quantity x and generally the relevant isotope is indicated as subscript
a Decision threshold [Bqkg-1]
a Detection limit [Bqkg-1]
a0 Activity of the analyte on the sampling date [Bqkg-1]
astd Activity of the calibration standard [Bq g-1]
as Activity of the analyte on the separation date [Bqkg-1]
AT Activity of 225Ra tracer [Bq]
C Certified activity of the analyte in the reference material [Bqkg-1]
CPb-c Mass fraction of Pb carrier solution
CPb-s Mass fraction of Pb already present in the sample
CT Certified activity of tracer on the reference date [Bqg-1]
fAB Tailing factor correction of interfered windows A and B
fg Mass ratio of atomic mass of Pb to molar mass of PbC2O4
fT Correction factor for the decay of the tracer during elapsed time between the reference date of tracer and the beginning of the measurement
f2 Correction factor for decay of the analyte during elapsed time between the separation and the beginning of the measurement
f3 Correction factor for decay of the analyte over the counting time
mC Mass of the carrier taken (in case of lead mass of carrier solution) [g]
mf Mass of the filter used [g]
mfcal Mass of the filter used in calibration [g]
mof Total mass of PbC2O4 and the filter used [g]
mofcal Total mass of PbC2O4 and the filter used in the calibration [g]
ms Mass of the sample [kg]
mT Mass of the tracer taken [g]
mTPb Mass of the 210Pb standard solution added [g]
MPb Atomic mass of Pb [gmiddotmol-1]
MPb-oxalat Molar mass of PbC2O4 [gmiddotmol-1]
n Net counts in ROI of analyte [counts]
nT Net counts in ROI of tracer [counts]
n0 Blank or background counts in ROI of analyte [counts]
n0T Blank or background counts in ROI of tracer [counts]
Pα Probability of α decay
Pγ Probability of γ decay
4
r0 Blank or background count rate in ROI of analyte [countss-1]
r0T Blank or background count rates in ROI of tracer [countss-1]
rcal Count rates during the calibration [countss-1]
rn Net count rates in ROI of analyte [countss-1]
rnT Net count rates in ROI of tracer [countss-1]
rg Gross count rates in ROI of analyte [countss-1]
rgT Gross count rates in ROI of tracer [countss-1]
rnTmax Maximum detectable count rate [countss-1]
r0A r0B Count rates in windows A and B of the blank spectrum [countss-1]
rgA rgB and u(rgA) u(rgB) Gross count rates in windows A and B of 210Pb spectrum [countss-1]
rnA rnB Net count rates in windows A and B of 210Pb spectrum [countss-1]
R Chemical recovery of the analyte
Rcal Chemical recovery of making the calibration source
RL Reproducibility limit [Bqkg-1]
rL Repeatability limit [Bqkg-1]
SR Standard deviation of reproducibility [Bqkg-1]
Sr Standard deviation of repeatability [Bqkg-1]
t Time interval between the sampling date and the measurement date [s]
t0 Counting time of the blank or background [s]
tTs Time interval between the reference date of the tracer standard and the separation date [s]
t1 Time interval between the sampling date and the separation date [s]
t2 Time interval between the separation date and the start of the measurement [s]
t3 Counting time of the sample [s]
tT Counting time of the tracer [s]
tAc-225 Time of build up of 225Ac [s]
ts Time of the separation noted [s]
tm Time of the starting of the measurement [s]
tem Time of the end of the measurement [s]
u(0) Uncertainty of non-negative measurand
X mean value of measurement results of the analyte in reference material [Bqkg-1]
δ Relative bias of the test result []
ε Counting efficiency of the detector
λ Decay constant of the isotope [countss-1]
λT Decay constant of the tracer [countss-1]
FWHM Full width at half maximum
5
LSC Liquid scintillation counting (spectrometry)
NNDC National Nuclear Data Center Brookhaven National Laboratory
ROI Region of interest
PSA Pulse shape analysis
T12 Half-life of any isotope
6 PRINCIPLE
The sample is digested in a microwave digestion system Polonium-210 210Pb U and Th isotopes and 226Ra are separated from interfering elements with a sequential chemical procedure using extraction chromatographic resins and Ba(Pb)SO4 co-precipitation The flow chart of the combined procedure is given in Appendix II The most important features of the resins are shown in Appendix III (Sr resin TEVA and UTEVA see Figs III 1ndashIII 7) U and Th are electrodeposited on a polished stainless steel plate The polonium source is prepared on a silver plate by auto-deposition The 226Ra source is prepared by Ba(Ra)SO4 microco-precipitation The 210Pb source is prepared with Pb-oxalate precipitation Polonium-210 U Th isotopes and 226Ra are determined by isotope dilution alpha-spectrometry and 210Pb is determined by liquid scintillation spectrometry
7 CHEMICAL REAGENTS AND EQUIPMENT
71Tracers
The two tracers commonly used for 210Po determination are 208Po and 209Po Polonium-209 has a clear advantage over 208Po in energy separation from the 210Po peak and is the preferred tracer if available It should also be noted that 208Po solutions normally contain traces of 209Po A typical alpha spectrum of 209Po and 210Po is shown in Fig IV 1 of Appendix IV
Naturally occurring thorium can be determined by the following tracers 228Th and 229Th Both of them have short lived daughters which emit alpha-particles but as the energies of all their daughters are higher than 568 MeV thus no spectral interference occurs from ingrowth of daughters either 228Th or 229Th The 228Th daughter of 232U can be used as a tracer for the determination of 230Th and 232Th In this case the natural 228Th content in phosphogypsum should be measured or estimated separately to allow for this [4] An alpha spectrum of Th isotopes and its progeny is depicted in Fig IV 2 of Appendix IV
Naturally occurring uranium can be determined by the following tracers 232U 233U or 236U Among them 232U (containing 228Th daughter in known ratio close to 1) is applied most frequently The amount of 232U tracer to be added to the sample should be carefully calculated because this is the highest-energy uranium peak in the uranium spectrum and hence its tailing might affects other peaks in low energy region if the added concentration is too high A typical alpha spectrum of uranium isotopes is shown in Fig IV 3 of Appendix IV
In the case of 226Ra analysis several tracers such as 133Ba 223Ra 224Ra 225Ra might be applied Barium-133 is a most commonly used tracer for the determination of 226Ra (can be measured by gamma-spectrometry) A disadvantage of this tracer is that although its chemical behavior is very similar to that of Ra their chemical behavior is not identical as they are different elements Alternative is 225Ra (daughter of 229Th) which does not exist in nature and its decay does not produce radon which might escape from the source Radium-225 is both a beta and
6
gamma emitter with a gamma line at 4009 keV (Pγ 0300) which is well measurable with an n-type HPGe detector with carbon-epoxi or Be window Alternatively its descendants 225Ac 221Fr 217At are alpha-emitters and the determination of chemical recovery is possible via 217At at 7066 7 MeV (Pα 0999 32) using ingrowth decay equations [4] (Fig IV 4 of Appendix IV)
72Carrier
If there is no suitable radioactive tracer available the chemical recovery can be checked by using an inactive carrier namely a stable isotope of the same element as the radioactive analyte In the present case 30 mg Pb2+ carrier is used as Pb(NO3)2 solution for checking the chemical recovery of 210Pb determination gravimetrically
73Equipments
bull Standard laboratory equipment well exhausted fume-hood bull Microwave oven bull Alpha spectrometer with Si semiconductor detector bull Vacuum pump bull Liquid scintillation spectrometer bull Auto-deposition system bull Silver disk fitted to the auto-deposition cell diameter is equal or less than the
diameter of the detector used for alpha spectrometry bull Electrodeposition apparatus (Pt wire anode) equipped with DC power supply to
provide up to 1 A of regulated current to the electrolytic cell bull Stainless steel disc diameter is equal or less than the diameter of the detector used for
alpha spectrometry bull Analytical balances with accuracies of 01 mg and 001 g bull Hot plate with magnetic stirrer bull Burner bull Centrifuge plastic centrifuge tube (minimum 20 mL volume) bull Water bath with temperature controller bull Filtering set with filter paper for fine precipitate bull Chromatography columns with stopper control valve and funnel (250 mL) and holder
for them bull pH meter or pH papers bull Teflon beakers with Teflon tops and clips bull Dispensers 5-50 mL and 10-100 mL bull Micropipettes with dispensable tips (100-5000 microL) bull Timer bull Liquid scintillation vial 20 mL plastic (polyethylene) inner surface coated with
Teflon
74Chemical reagents
bull 30 mgmL-1 Pb2+ solution (usually as Pb(NO3)2) bull 04 Bq of 209Po tracer as a certified solution bull 004 Bq of 232U tracer as a certified solution bull 005 Bq of 225Ra in equilibrium with its parent 229Th as a certified solution bull HNO3 (65) (nitric acid)
7
bull HF (40) (hydrogen fluoride) bull H3BO3 (boric acid) bull HCl (32) (hydrochloric acid) bull Ultra pure water bull DTPA (diethylenetriaminepentaacetic acid) bull Sr resin (100-150 microm) bull TEVA resin bull UTEVA resin bull Cation exchange resin (AG-50W-X8 or Dowex-50) bull Fine clean quartz crystals (analytical grade) bull C6H8O6 (Ascorbic acid) bull NH4SCN (ammonium thiocyanate) bull EDTA (ethylenediaminetetraacetic acid) bull NH3(aq) (ammonia) bull (NH4)2SO4 (10) (ammonium sulfate) bull C2O4H2middot2H2O (oxalic acid) bull Methyl red solution (025) bull Thymol blue solution (025) bull Ba seeding solution [6] Weigh between 0012 and 0016 g of BaCl2 2H2O into a tall
150 mL quartz beaker Add approximately 04 mL of ultra pure water to completely dissolve the BaCl2 2H2O In a fume hood add 10 mL of the 70 sodium hydrogen sulfate solution and 2 drops of 72 HClO4 Evaporate the solution on a hot plate or a burner at high heat with continuous swirling until most of the excess sulfuric acid has been expelled and a pyrosulfate fusion is obtained Cool the beaker while rolling the melt around the sides so that the cake is deposited on the sides as uniformly as possible to facilitate rapid dissolution Cool the beaker and contents to room temperature in a desiccating chamber Add a solution of 50 mL 20 Na2SO4 to the beaker Swirl continuously until the cake is completely dissolved (place it in an ultrasonic bath for 10 minutes before each use if a build up of particulate matter occurs then make a fresh solution)
bull Sodium sulfate wash solution dissolve 100 g of anhydrous Na2SO4 in 2 L of 05 H2SO4 Filter through a 045 microm pore size membrane filter
bull CH3CH2OH (ethyl alcohol) bull Filter paper (for example Whatman 41) bull Polypropylene filter (for example Pall 01 microm pore size 25 mm diameter) bull Scintillation cocktail which forms a gel (for example InstaGel Plus) or suitable for
alphabeta separation All the chemical reagents needed to carry out this procedure must be analytical grade
8 PRECAUTIONS
Do not ash the sample if 210Po determination is required gently drying is allowed but not higher than 80oC
During the handling of the ion exchange chromatography columns always keep several mm of liquid above the surface of resin do not allow it to become dry during the separation steps
Labeling of the different fraction is essential to avoiding mixing solutions this includes the different load solutions and chemicals
8
The complete separation of Po from U is important because 210Po (Eα 5263 MeV) can interfere with the alpha peak of 232U (Eα 5320 MeV) and its activity is much higher than of U in phosphogypsum In addition 209Po (Eα 4866 MeV) can interfere with the alpha peak of 234U (Eα 4766 MeV) These are shown in Fig IV 5 of Appendix IV
The complete separation of Th from U is also important because several peaks in the spectra overlap as it is shown on Fig IV 6 of Appendix IV
Applying 225Ra as a yield tracer for the determination of 226Ra the radiochemical procedure needs to include steps to guarantee the complete separation of the parentprogeny couples 229 Th225Ra and 225Ra225Ac
9 PROCEDURE
This procedure consists of the sample dissolution the sequential separation of 210Po 210Pb Th and U isotopes and 226Ra from interfering elements and the source preparation for alpha spectrometry and liquid scintillation spectrometry (see the flowchart in Appendix II)
91Sample dissolution using microwave digestion system
(a) Weigh 05 g of phosphogypsum into a microwave container
(b) Add about 30 mg of Pb2+ (usually as Pb(NO3)2 solution) about 04 Bq of 209Po and 004 Bq of 232U tracer and 005 Bq of 225Ra in equilibrium with its parent 229Th
(c) Add 15 mL 65 HNO3
(d) Consecutively digest the sample in the microwave oven at 120degC for 15 min and at 150degC for 25 min at 1000 W
(e) Transfer the sample solution into a plastic centrifuge tube and centrifuged for 10 min
(f) Transfer the supernatant into a Teflon beaker The residue is transferred back into the microwave container with 3 mL of 65 HNO3 and add 2 mL of 40 HF
(g) Digest the residue in the microwave oven using the same condition as mentioned above
(h) Combine the solution with the supernatant from step (f)
(i) Add 01 g H3BO3 and evaporate repeatedly to dryness with three portions of 5 mL of 65 HNO3 to remove HF
(j) Dissolve the residue in 30 mL of 2M HCl
92Chemical separation procedures
921 Polonium and lead separation
(a) Prepare the Sr resin column with volume of approximately 8 mL (diameter 10 mm length 100 mm) as follows soak the resin in ultra pure water for at least 1 hour before use then fill the column with resin and put a quartz crystal layer of approximately 10 mm on the top avoiding disturbance of the resin The elution steps should be finished on the same working day
(b) Load the sample solution onto the Sr resin column preconditioned in advance with
9
100 mL 2M HCl flow rate 5-6 dropmin rinse the baker several times with 1 mL of 2M HCl
(c) Wash the column with 100 mL of 2M HCl followed by 25 mL 6M HNO3 to remove the non-retained ions
(d) Combine the effluent and the washing solution into same beaker and use it for the analysis of uranium and thorium
(e) Strip Po with 60 mL 6M HNO3 flow rate 5-10 dropsmin
(f) Elute Pb with 60 mL 6M HCl into the centrifuge tube flow rate 5-10 dropsmin
(g) Sr resin columns can be reused several times Regenerate with 50 mL ultra pure water wash it with 10 mL 01M EDTA (pH adjusted to pH7 with NH3(aq)) then wash with 50 mL ultra pure water and before use load it with 100 mL 2M HCl
922 Thorium separation
(a) Prepare the TEVA column with a volume of 14 mL (diameter 8 mm length 28 mm) as follows soak the resin in ultra pure water for at least 1 hour before use then fill the column with resin and put a quartz crystal layer of approximately 3 mm on the top avoiding disturbance of the resin
(b) Evaporate the combined effluent and washing solutions from Sr resin column (921 step (d))
(c) Dissolve the residue in 20 mL 3M HNO3
(d) Load the sample on the TEVA column preconditioned in advance with 20 mL 3M HNO3
(e) Wash the column with 10 mL 3M HNO3
(f) Combine the effluent and the washing solution into the same baker and use it for analysis of uranium
(g) Additionally wash the column with 20 mL 3M HNO3 this fraction is discarded
(h) Elute Th with 20 mL 8M HCl
(i) Note the time of the separation of Th for recovery calculation of 226Ra
923 Uranium separation
(a) Prepare the UTEVA column with volume 14 mL (diameter 8 mm length 28 mm) as follows soak the resin in ultra pure water for at least 1 hour before use then fill the column with the resin and put a quartz crystal layer of approximately 3 mm on the top avoiding the disturbance of the resin
(b) Load the combined effluent and the washing solution from the TEVA column (922 step (f)) onto UTEVA column preconditioned in advance with 20 mL of 3M HNO3
(c) Wash the column with 20 mL 3M HNO3
(d) Combine the effluent and the washing solution into the same beaker and use it for Ra analysis
(e) Wash the column with 5 mL 9M HCl and 15 mL 6M HCl to remove small amounts of Po and Th remained on the column
10
(f) Elute U with 6 mL ultra pure water
924 Radium separation [6]
(a) Combine the effluent (20 mL 3M HNO3) and the washing solution (30 mL 3M HNO3) from the UTEVA column in a 200 mL volume of beaker (923 step (b) and (c))
(b) Add 4 mL concentrated H2SO4 and 20 mL 20 Na2SO4 to the solution
(c) Slowly add 5 mL Pb2+ carrier (10 mgmL-1) to form a Pb(RaBa)SO4 co-precipitate while stirring for 1ndash2 minutes
(d) Remove stirrer bars washing with a small amount of 01M HCl and ultra pure water
(e) Allow to sit for 3ndash4 hours
(f) Decant supernatant liquor to a volume as low as possible
(g) Transfer the precipitate into a 50 mL conical centrifuge tube using 80 ethanol and centrifuge at 3000 revolutionsmin for 10 minutes
(h) Wash the precipitate with 20 mL 80 ethanol and decant the supernatant
(i) Wash the sides of the centrifuge tube with 5ndash10 mL sodium sulfate wash solution and vortex to mix thoroughly then add a further 5ndash10 mL to wash down the walls and then re-centrifuge at 3000 revmin for 10 minutes
(j) Pour out supernatant then invert the tube and wash the walls with ultra pure water to remove excess acid and sulfate (take care not to disturb the precipitate)
(k) Add 10 mL 02M DTPA (diethylenetriaminepentaacetic acid) and 1 drop of 025 thymol blue The solution should turn deep blue if not add 10M NaOH dropwise until a deep blue color is reached (pHgt9)
(l) Vortex to dissolve the precipitate
93Source preparation
931 Polonium-210 source
(a) The Po solution is carefully evaporated to dryness at less than 150degC
(b) Dissolve the residue in 10 mL 05M HCl
(c) Clean a silver disc with acetone followed by cc NH3(aq) followed by ultra pure water
(d) Place the cleaned silver disc into the deposition cell (Teflon vial) with another disc placed underneath for support Check if the cell is watertight
(e) Add 005 g ascorbic acid into the sample solution to reduce Fe3+ to Fe2+ check the colour change after mixing one drop of sample solution and one drop of 01M NH4SCN Add ascorbic acid until the dark red colour disappears
(f) Transfer the solution to the deposition cell
(g) Rinse the beaker with 2 x 2 mL 05M HCl and adjust the pH of the solution in the deposition cell to pH2 with 6M NaOH
(h) Place the deposition cell into a water bath at 90oC for 90 min with mechanical stirring or air bubbling
11
(i) Remove the silver disc wash with acetone or ultra pure water and dry it at room temperature
932 Uranium and thorium sources
(a) The purified U or Th solution is evaporated to dryness three times with a few mL 65 HNO3 to destroy any existing organic matter
(b) Dissolve the residues in 10 mL 10 (NH4)2SO4 solution at pH2 (The pH of samples being deposited for thorium should be slightly more acidic pH15-pH2)
(c) Transfer the solution into an electrodeposition cell
(d) Electrodeposit U or Th onto polished stainless steel discs at 1 A for 90 minutes respectively
(e) At the end of the deposition time fill the cell with 15M NH4OH and continue deposition for 1 min then turn off the main power of deposition unit and disconnect the cathode
(f) Rinse the cell twice with 1 NH4OH then three times with ultra pure water
(g) Disassemble the cell rinse the disc with ultra pure water and dry it
933 Radium source (BaSO4 micro co-precipitation)
(a) Rapidly add 4 mL mixed solution of 5 parts of 20 Na2SO4 with 1 part of acetic acid to the solution from the step 924 (l)
(b) Add 04 ml Ba seeding solution as soon as possible (2ndash3 s)
(c) Adjust pH to 48 with diluted H2SO4 as indicated by the colour change to a bright red
(d) Allow to sit for at least 30 minutes
(e) Filter the colloidal suspension of Ba(Ra)SO4 through a pre-wetted (by 80 ethanol) polypropylene filter (for example 01 microm pore size 25 mm diameter Pall)
(f) Rinse the centrifuge tube walls with 4ndash5 mL sodium sulfate wash solution and filter
(g) Rinse the sides of the filter holder with 15ndash20 drops 80 ethanol
(h) Allow the filter to dry and place it into a 47 mm Petri dish The time is recorded which is considered as the time of 225Ra225Ac separation or start of 225Ac ingrowth
The source preparation must be completed on the same day
934 Lead-210 source
(a) Evaporate the Pb solution which obtained from the step of 921(f) and re-evaporate with three portion of 5 mL 65 HNO3
(b) Dissolve the residue in 10 mL 1M HNO3
(c) Add 40 mg oxalic acid to the solution and adjust pH2ndash3 with 25 NH4OH to prepare a Pb-oxalate precipitate
12
(d) Let the solution to cool down and filtrate the precipitate on a filter paper (for example Whatman 41 dried in a drying oven and weighed in advance) wash the filter 3 times with 1 mL water and 2 mL 80 ethanol
(e) Dry the precipitate (40ndash50oC) and cool down in a desiccator
(f) Weigh the dried precipitate and calculate the chemical recovery using the gravimetric method
(g) Quantitatively transfer the precipitate into a liquid scintillation vial together with the filter and add 1 mL of 6M HNO3 into the vial to dissolve the precipitate
(h) Mix the solution with 15 mL of scintillation cocktail
94Measurement
941 Alpha-spectrometry
(a) Introduce the source into the vacuum chamber and pump until a vacuum of about 05 Pa (5 x 10⁻³ mbar) is obtained Then switch on the bias voltage button of detector
(b) Record the file name sample information (unit code sample name sample volume as it is required by the actual quality management system) and measurement date in each detector log book and start the measurement A typical measuring time is about 1 day when using a 450 mm2 area detector
(c) Integrate the counts in the peaks corresponding to the alpha emitting tracers and analytes respectively The alpha spectra should be similar to the spectra illustrated in Fig IV 4 of Appendix IV The FWHM of alpha peaks should be in the range of 30ndash60 keV
(d) Spectrum analysis Integrate the channel counts in a region of interest (ROI) which has the width of about 4 x FWHM (about 3 x FWHM to the left and 1 x FWHM to the right when FWHM is about 30ndash60 keV) Integrate the channel counts in the same regions of interest (ROI) in the sample spectrum and in the blank spectrum then subtract them from the sample spectrum to give the net area of peaks for further calculation
Performing a reliable measurement knowing the background of the chamber and detector is essential moreover it is important to prepare a separate reagent blank Therefore the set of measurement always has to involve above the samples a background and a reagent blank If the quality of the determination has to be proved a reference material also should be part of the preparation series
942 Liquid scintillation spectrometry for determination of 210Pb
9421Source preparation for determination of counting efficiency of 210Pb
(a) Take 10 mL 2M HCl solution into a 50 mL beaker
(b) Add the 210Pb standard solution (10ndash15 Bq) and 30 mg Pb2+ carrier to the solution
(c) Load the solution onto a Sr resin column (3 g of Sr resin 100-150 microm) which has been preconditioned in advance with 100 mL 2M HCl
(d) Wash the column with 80 mL 2M HCl Combine the washing solution with the effluent to get a pure 210Bi fraction
13
(e) Rinse the column with 20 mL 2M HCl This last portion of 20 mL 2M HCl is discarded to avoid overlapping between the 210Bi and 210Po portions
(f) Wash the column with 25 mL 6M HNO3
(g) Elute Po with 60 mL 6M HNO3
(h) Elute Pb with 60 mL 6M HCl
(i) Evaporate the Bi Po and Pb fractions to dryness
(j) Dissolve each portion of 210Bi and 210Po in 1 mL 6M HNO3 and then transfer them into 20 mL polyethylene vials coated with PTFE (polytetrafluoroethylene)
(k) Mix the solution with 14 mL scintillation cocktail
(l) Evaporate Pb fraction three times with 2 mL 65 HNO3
(m) Dissolve the residue in 20 mL 1M HNO3
(n) Add 04 g oxalic acid while warming and stirring
(o) Adjust the pH to 3ndash5 with NH4OH to form a Pb-oxalate precipitate
(p) Filter the precipitate through a pre-weighed filter paper (diameter of 24 mm)
(q) Wash the precipitate three times with 1 mL water followed by 2 mL 80 ethanol
(r) Dry the precipitate in an oven at 40ndash50oC
(s) Cool and weigh the precipitate to determine the chemical recovery of lead
(t) Carefully transfer the Pb-oxalate precipitate into a 20 mL of liquid scintillation vial together with the filter
(u) Add 1 mL 6M HNO3 to the vial to dissolve the precipitate
(v) Mix with 14 mL of scintillation cocktail
(w) Set up windows for 210Pb and 210Bi and count the three vials (for 210Pb 210Bi and 210Po) in a liquid scintillation counter until the counting statistic uncertainty is less than 1
9422Optimum window setting for 210Pb
The activity concentration of 210Pb is determined by LSC adjusted to the low energy mode and low bias with double energetic window method [7] For the successful determination of this radionuclide two counting windows should be optimized because of the overlapping of the beta spectra of 210Pb and 210Bi The result of the optimization of counting region is shown in the Fig V 1 of Appendix V In this example the lower limit for the 210Pb energy (window A) is set at channel 115 to avoid the counts caused by chemiluminescence in the cocktail while the upper limit is set at channel 320 where the 210Pb peak ends The lower limit for the 210Bi energy region (window B) is set at channel 320 and the upper limit is set at channel 410 to avoid interference from the 210Po peak
9423 Counting efficiency of 210Pb
The efficiency of liquid scintillation for beta particles depends on the energy of the beta decay For most beta particles with a maximum beta-energy above 100 keV efficiency is high more than 90 For lower energy beta particles the efficiency is usually less and the real value depends on the degree of quenching in the sample
14
To determine the efficiency a known activity of 210Pb in equilibrium with its daughters has to be measured several times (it is practical to choose more than 10 times of counting for getting a good estimate of the uncertainty in the efficiency)
10 EXPRESSION OF RESULTS
101 Calculation of activities of relevant isotopes
1011 Calculation of the activity of 210Pb
10111 Calculation of the counting efficiency of 210Pb
The counting efficiency (ε) of 210Pb can be calculated by Eqs (1 2)
TsPb tPbTPbstdcal emaR
Z210
210210minusminus
minusminus
= λε ( 1 )
BAnBnA frrZ minus= ( 2 )
where
BBgBnAAgAn rrrrrr 00 minus=minus=
fAB Tailing factor (See Ch 10112)
Rcal Chemical recovery of making the calibration source (See Ch 10113)
10112 Calculation of the tailing factor
The 210Pb energy region (window A) is interfered with counts from ingrown 210Bi The interference is compensated for by using the ratio of counts in window A to those in window B in a pure 210Bi spectrum the so-called ldquotailing factorrdquo fAB The tailing factor is independent of the activity level of 210Bi in the sample but is dependent on the quenching level of the sample The quenching levels of the calibrant the sample and the reagent blank are necessary to keep constant within plusmn2 relative standard deviation The tailing factor can be calculated by the following formula
210
210
minus
minus=BistdBn
BistdAnBA r
rf (3)
where BBistdBgBistdBnABistdAgBistdAn rrrrrr 02102100210210 minus=minus= minusminusminusminus
10113 Chemical recoveries of Pb in calibration source and sample
The chemical recovery of lead in the calibration source preparation process is determined gravimetrically using Eq (4)
15
ccPb
calfcalofgcal mC
mmfR
minus
minus=
)( ( 4 )
When the amount of Pb in the sample is not negligible compared with that in the Pb carrier the sample Pb content should be allowed for in calculation of the chemical recovery of Pb The chemical recovery of Pb in the sample can be calculated by Eqs (5 6)
)(
)(
ssPbccPb
fofg
mCmC
mmfR
minusminus +minus
= ( 5 )
Mass ratio (fg) of atomic mass of Pb to molar mass of Pb-oxalate
oxalatePb
Pbg M
Mf
minus
= (6 )
10114 Calculation of the activity of 210Pb
The activity of 210Pb on the separation date can be calculated from the LSC measurement using the following equations
Rm
ffZa
s
PbPbsPb ε
minusminusminus = 32
210 (7)
22102
tPb
Pbef minusminusminus = λ ( 8 )
321013210
3 tPb
PbPbe
tf
minusminus= minus
minus λλ
(9 )
However if the time interval (t2) between the separation of 210Pb and the beginning of the measurement and the counting time of the sample (t3) are much smaller than the half life of 210Pb (222 y) f2-Pb f3-Pb u(f2-Pb) and u(f3-Pb) are negligible
1012 Calculation of the activity of 210Po
The activity of 210Po on the separation date is calculated according to the procedure detailed in IAEAAQ12 [8]
1013 Calculation of the activities of the U and Th isotopes
The ratio of the net counts of the tracer and analyte peak is used to calculate the activity of the analyte in the sample on the date of chemical separation taking into account the activity of the tracer solution the masses of the sample and the tracer used The activity of the analyte (as Bq(kg dry)-1) at the separation time is calculated by the following formula
16
TgT
g
s
TTTTT
nTs
nTs rr
rr
m
fmCfm
rm
rCa
0
0
minusminus
== (16)
The decay of the tracer between its reference date (from the certificate) and counting is taken into correction by fT as follows
sTT t
T ef λminus= (17)
The activity of analyte in the sample should be calculated back to the date of sample collection
teaa
λminus=0 (18)
The detector efficiency is not needed in isotope dilution alpha spectrometry for calculation of the activity of the analyte but is needed for calculation of the chemical recovery It is determined from the activity of the tracer added and the net counts in the corresponding peak as follows
sTT t
TT
nT emC
rR λ
εminus= (19)
The detector efficiency is determined by the calibration source prepared in a similar way as the analytes and using the same measurement conditions For analytes which are co-precipitated the calibration source also should be co-precipitated using the same conditions including filter diameter For analytes which are electrodeposited the calibration source should also be prepared by electrodeposition Efficiency determinations are typically performed and regularly checked in the frame of analytical quality control The efficiency can be calculated according to the following equation
cal
caln
A
r =ε (20)
Where
Rn cal net count rate of calibration source in respective ROI
Acal certified activity of the calibration source
1014 Calculation of the activity of 226Ra [9]
10141 Calculation of the chemical recovery of Ra
The chemical recovery is determined by using the peak of 217At at 70669 keV (Pα 0999 32) The ingrowth of 225Ac (T12 100 d) the daughter of 225Ra is directly associated with the short lived progenies 221Fr (T12 48 min) 217At (T12 323 ms) and 213Po (T12 37 micros) When the daughters are in equilibrium with 225Ra the 217At peak shows no overlap with descendants of natural isotopes of radium in the alpha spectrum (225Ac interferes with 224Ra 221Fr interferes with 220Rn) From the initial tracer activity AT (added 229Th225Ra) the maximum detectable count rate rnTmax is calculated by taking into account the decay of unsupported 225Ra after its separation from Th (tsTh-229) as well as the build-up of 225Ac (tsRa-225) in the following equation
17
225225
225)(max
229225225
minusminus
minusminusminus
minus= minusminusminus
RaAc
ActtTnT
sThsRaRaeArλλ
λε λ (21)
The chemical recovery R is calculated as ratio of the measured count rate rnT and theoretical value rnTmax
maxnT
nT
r
rR = (22)
10142 Calculation of activity of 226Ra
While AT is the activity of the 225Ra tracer after the separation from 229Th its activity at the beginning of the build-up of 225Ac is yielded as follows
)(225
225225 sAcRa ttTRa eAA minusminus
minusminusminus= λ
( 2 4 )
The activity of 225Ac in any time is given by
( )225225
)()(225225
225
225225225225
minusminus
minusminusminusminusminusminus
minus minusminus=
minusminusminusminus
RaAc
ttttRaAc
Ac
AcAcAcRa eeAA
λλλ λλ
(25)
Integrating over the counting period with tm as the start and tem as the end of the measurement results into the activity of 225Ac at tem
( )( )( ) ( )( )
minusminusminus
= minusminusminusminus minusminusminusminus
minusminusminus
minusminusminus
225225225225
225225225
225225225
1)( AcemRaAcmRa tttt
RamemRaAc
AcRaemmAc ee
ttAttA λλ
λλλλ
( ) ( )( )
minusminus minusminusminusminus minusminusminusminus
minus
225225225225
225
1AcemAcAcmAc tttt
Ac
ee λλ
λ (26)
Finally the activity concentration of 226Ra is the following
217
226225226 )(
minus
minusminusminus =
At
RaemmAcRa r
rttAA (27)
where
0
0226226226 t
n
tt
nr Ra
mem
RaRa
minusminusminus minus
minus= and
0
0217217217 t
n
tt
nr At
mem
AtAt
minusminusminus minus
minus=
102 Expression of combined uncertainties of relevant isotopes
According to the Guide to Expression of Uncertainty in Measurement [11 12] the combined uncertainty is described in detail and an example is calculated for each relevant radionuclide in Appendix VI
18
103 Decision threshold
In accordance with ISO 119292010 the decision threshold gives a decision on whether or not the physical effect quantified by the measurand is present
The decision threshold a is the non-negative measurand quantifying the physical effect of interest If the result a is below the decision threshold the result can not be attributed to the physical effect nevertheless it can not be concluded that it is absent If the physical effect is really absent the probability of taking the wrong decision that the effect is present is equal to the specified probability of α (the error of first kind often chosen 005 and moreover α=β where β is the error of second kind then k1-α=k1-β=165) Any of the determined primary measurement result is only significant for the true value of the measurand to differ from zero if it is larger than the decision threshold given here
a=k1-αu(0) where u(0) is the uncertainty associated to the non-negative measurand uncertainty of decision threshold itself (with other words it can be estimated as uncertainty associated to slightly higher values than background or reagent blank depending on the procedure) and can be quantified here as
20
0
03
01)0(
t
n
tt
n
Rmu
s
+=ε
(28)
104 Detection limit
In accordance with ISO 119292010 the detection limit indicates the smallest true value of the measurand which can be still detected with the applied procedure this gives a decision on whether or not the measurement procedure satisfies the requirements and is therefore suitable for the intended measurement purpose In order to find out whether a procedure is suitable for the purpose the detection limit is compared with the specified guideline value of the measurand
The detection limit a is the smallest true value of the measurand for which the probability of the wrong assumption that the physical effect is absent does not exceed the probability β (error of the second kind) The detection limit is obtained as the smallest solution of the following equation
a=a+k1-β(a) where a ge a (29)
Eq (29) is an implicit equation which can be calculated by iteration As a starting approximation a1=3a can be chosen in most cases the iteration converges and the linear interpolation with approximation of a=(k1-α+k1-β)u(a) leads to the approximation
)0()( 221
21
2 ukkqqa αβ minusminus minus++= (30)
with [ ]
minus+= minusminus )0()(
2
1)0( 2
12
1
21
1 uaua
kukq a
β (31)
If α=β than k1-α=k1-β=k a=2q follows
19
[ ])0()()0(2 21
2
1
2 uau
a
kuka minus+= (32)
Where α is the probability of the error of first kind the probability of rejecting a hypothesis if it is true and β is the probability of the error of second kind the probability of accepting a hypothesis if it is false
The detection threshold and limit of the isotopes in the applied procedure are described in Table VII 1 of Appendix VII
The difference between using the decision threshold and using the detection limit is that the measured values are to be compared with the decision threshold whereas the detection limit is to be compared with the guideline value (guideline value corresponds to scientific legal or other requirements for which the measuring procedure intended to assess)
11 VALIDATION OF THE PROCEDURE
The procedure was validated with an IAEA reference material IAEA-434 The material was initially characterized at IAEA Environment Laboratories in Seibersdorf during the feasibility study phase Then the characterization of the material took place within the interlaboratory comparison piloted by IAEA Environment Laboratories in Seibersdorf in cooperation with the Consultative Committee on Ionization Radiation (CCRI) of the International Bureau des Poids et Mesure (PIBM) The results reported in this comparison were used to derive the property values of the measurands of interest The IAEA-434 reference material [12] was collected from a processing plant located in Gdansk (Poland) in 2003 The matrix composition is CaSO4middot2H2O (96) P2O5 (1-2) F total (12) SiO2 (1) Al2O3 (02) The property values of all radionuclides of IAEA 434 were established on the basis of a robust approach proposed by DL Duewer [13] and the Mixture Model median (MM-median) of the analytical results reported by the expert laboratories was calculated To estimate the standard uncertainty associated with the property value the MM-median based standard deviation was calculated from the span of the central 50 of the MM probability density function The validation results of the procedure are shown in Tables VIII 1 and VIII 2 Figs VIII 1ndashVIII 7 of Appendix VIII 111 Trueness of the method
The relative bias of the method is calculated by the following formula
100() timesminus=C
CXδ (34)
112 Precision of the method
The precision index ( PI() ) is calculated according to the following formulas
100)()(
()2
2
2
2
times+=X
Xu
C
CuPI (35)
20
113 Repeatability limit
The repeatability limit is estimated by analyzing five subsamples from the same bottle of the IAEA-434 reference material for the relevant radionuclides investigating the repeatability conditions instrument analyst shortest time etc The repeatability limit is calculated by the following formula
rL Sr 82= (36)
114 Reproducibility limit
The reproducibility limit is also estimated by analyzing the IAEA-434 reference material from ten duplicates samples were taken from ten randomly selected packing unit with at least one parameter being changed in the analytical system (analyst analysis date instrument etc) The reproducibility limit is calculated by the following formula
RL SR 82= (37)
115 Outlier test
The presence of individual values that appear to be inconsistent with all other laboratories or values may cause some problems during the final evaluation of data According to ISO 5725-2 an outlier test should be performed before the calculation of repeatability and reproducibility The analysis includes a systematic application of a statistical test of outliers a great variety are available which could be used for the purposes of this part of ISOIEC 17025 Usually the graphical consistency technique or the numerical outlier test are applied Cohranrsquos test of variabilities should be applied first and then any necessary action should be taken Grubbrsquos test is primarily a test of in between laboratory variability
116 Acceptance criteria
The method can be accepted if
PI()lt 25
LRltδ ( 3 8 )
According to these criteria the method performs well as the Table VIII 1 of Appendix VIII shows
12 TEST REPORT
The test report shall conform to ISOIEC 17025 requirements and shall contain the following information
bull a title (test report calibration report reference material production etc)
bull the name and address of the laboratory and location where any part of the test or calibration or production of reference material etc were carried out
bull unique identification of the report on each page with numbering of pages
21
bull analysis request code
bull reference to the measurement method used
bull sampling date (if available)
bull sample description
bull sample code or identification number
bull date of the separation of analyte
bull applied tracers with their reference dates and activity values with the code of their certificate
bull the results with units of measurement and associated uncertainty value expressed in the same unit as the result
bull date to which the test result has been corrected (corrected to the sampling date or separation time dd-mm-yyyy)
bull responsible person (with accessibility)
22
REFERENCES
[1] FEDERAL REGISTER National emission standards for hazardous air pollutants 57 107 (1992) 23305-23320
[2] RUTHERFORD PM DUDAS MJ AROCENA JM Heterogeneous distribution of radionuclides barium and strontium in phosphogypsum by-product Sci Total Environ 180 (1996) 201-209
[3] NATIONAL COUNCIL ON RADIATION PROTECTION AND MEASUREMENTS Evaluation of Occupational and Environmental Exposures to Radon and Radon Daughters in the United States NCRP Report 78 (1984)
[4] MARTIN P HANCOCK GJ Routine analysis of naturally occurring radionuclides in environmental samples by alpha-particle spectrometry Supervising Scientist Report 180 (2004) httpwwwenvironmentgovaussdpublicationsssr180html
[5] INTERNATIONAL ATOMIC ENERGY AGENCY Reference Material IAEA-434 Naturally Occurring Radionuclides in Phosphogypsum IAEA Analytical Quality in Nuclear Applications Series No 17 IAEAAQ17 IAEA Vienna (2010)
[6] MEDLEY P BOLLHOumlFER A ILES M RYAN B MARTIN P Barium sulfate method for radium-226 analysis by alpha spectrometry Environmental Research Institute of the Supervising Scientist internal report 501 (2005)
[7] VAJDA N LAROSA J ZEISLER R DANESI P KIS-BENEDEK G A Novel Technique for the Simultaneous Determination of 210Pb and 210Po using a Crown Ether J Environ Radioactivity 37 (1997) 355-372
[8] INTERNATIONAL ATOMIC ENERGY AGENCY A Procedure for the Determination of Po-210 in Water Samples by Alpha Spectrometry IAEA Analytical Quality in Nuclear Applications Series No 12 IAEAAQ12 IAEA Vienna (2009)
[9] GUOGANG J TORRI G INNOCENZI P OZONE R Di LULLO A Determination of radium isotopes in mineral and environmental water samples by alpha-spectrometry J of Radioanalytical and Nuclear Chemistry 267 3 (2005) 505-514
[10] EURACHEMCITAC Guide Quantifying uncertainty in analytical measurement 2nd Ed(2000)
[11] INTERNATIONAL ATOMIC ENERGY AGENCY Quantifying Uncertainty in Nuclear Analytical Measurements IAEA-TECDOC-1401 IAEA Vienna (2004)
[12] SHAKHASHIRO A SANSONE U Technically Enhanced Naturally Occurring Radionuclides (TENORM) in Phosphogypsum The Interlaboratory Comparison CCRI(II)07-35 Metrologia (2009)
[13] DUEWER DL A Robust Approach for the Determination of CCQM Key Comparison Reference Values and Uncertainties Working document CCQM04-15 BIPM wwwbipminfoccCCQMAllowed10CCQM04-15pdf (2004)
23
[14] Monographie BIPM-5 Vol 1ndashMonographie BIPM-5 Vol 5
httpwwwnucleideorg Decay Data Evaluation Project (DDEP) accessed in October 2010
[15] NuDat 25 (Database at the US NNDC) httpwww-ndsiaeaorg accessed in October 2010
[16] HORWITZ et al A Novel Strontium-Selective Extraction Chromatographic Resin Solvent Extraction amp Ion Exchange 10 (1992) 313
[17] HORWITZ et al Extraction Chromatography of Actinides and Selected Fission Products Principles and Achievement of Selectivity presented at International Workshop on the Application of Extraction Chromatography in Radionuclide Measurement IRMM Geel 1998
[18] HORWITZ et al Separation and Preconcentration of Actinides by Extraction Chromatography Using a Supported Liquid Anion Exchanger Application to the Characterization of High-Level Nuclear Waste Solutions Analytica Chimica Acta 310 (1995) 63-78
[19] HORWITZ et al Separation and Preconcentration of Uranium from Acidic Media by Extraction Chromatography Analytica Chimica Acta 266 (1992) 25-37
[20] C-K KIM MARTIN P FAJGELJ A Quantification of measurement uncertainty in the sequential determination of 210Pb and 210Po by liquid scintillation counting and alpha particle spectrometry Accreditation and Quality Assurance 13 12 (2008) 691-702
[21] J KRAGTEN Calculating Standard Deviation and Confidence Intervals with a Universally Applicable Spreadsheet Technique Analyst 119 (1994) 2161ndash2165
24
APPENDIX I NUCLEAR DATA OF RELEVANT RADIONUCLIDES AND DECAY CHAINS OF U
AND Th SERIES
TABLE I 1 NUCLEAR DATA OF RELEVANT RADIONUCLIDES [14]
Radionuclide Half-life Disintegration modes
E (MeV) Probability ()
225Ac 100(1) d α 5580 5(14) 095(4)
α 5599 3(14) 0114(7)
α 5609 0(14) 109(5)
α 5637 3(14) 416(23)
α 5682 2(14) 131(4)
α 5686 4(14) 0021(14)
α 5723 1(14) 203(23)
α 5730 5(14) 16(3)
α 5731 6(14) 124(10)
α 5731 9(17) 90(5)
α 5797 7(14) 62(9)
α 5793 1(21) 189(20)
α 5804 2(14) 03
α 5829 6(14) 524(24)
217At 323(4) x 10-3 s α 6484 7(16) 0016 7(8)
α 6813 8(16) 0038 4(15)
α 7066 9(16) 99932(3)
133Ba 10540(6) y γ 0053 162 2(6) 214(3)
γ 0079 614 2(12) 265(5)
γ 0080 997 9(11) 329(3)
γ 0276 398 9(12) 716(5)
γ 0302 850 8(5) 1834(13)
γ 0356 012 9(7) 6205(19)
γ 0383 848 5(12) 894(6)
210Bi 5012(5) d β 1162 1(8) 99999 86(2)
212Bi 6054(6) min β 0633(2) 190(4)
β 0741(2) 145(29)
β 1527(2) 458(21)
β 2254(2) 5523(21)
α 6050 92(4) 251(1)
α 6090 02(4) 97(1)
221Fr 479(2) min α 6126 3(15) 151(2)
α 6243(2) 134(7)
α 6341 0(13) 828(2)
TABLE I 1 NUCLEAR DATA OF RELEVANT RADIONUCLIDES [14] (cont)
25
Radionuclide Half-life Disintegration modes
E (MeV) Probability ()
210Pb 2223(12) y β 0017 0(5) 802(13)
β 0063 5(5) 198(13)
γ 0046 539(1) 4252(40)
208Po 2898(2) y α 5114 9(14) 99995 8(4)
α 4220(15) 24(7)x10-4
209Po 115(13) y α 4885(2) 198(32)
α 4883(2) 792(32)
α 4622(5) 0548(7)
210Po 138376 3(17) d α 5304 33(7) 99998 76
α 4516 66(9) 0001 24(4)
213Po 370(5) x 10-6 s α 8375 9(25) 99995 0(5)
216Po 0150(5) s α 6778 6(5) 99998 1(3)
α 5988 6(10) 0001 9(3)
218Po 3094(6) min α 6002 35(9) 99976 9(32)
223Ra 1143(5) d α 5747 0(4) 900(20)
α 5716 23(29) 516(13)
α 5606 73(30) 252(5)
α 5539 80(90) 900(20)
224Ra 3627(7) d α 5448 81(16) 526(7)
α 5685 50(15) 9472(7)
γ 0240 986(6) 412(4)
225Ra 1482(19)d β 0316(5) 688(20)
β 0356(5) 312(20)
γ 0040 09(5) 300(7)
226Ra 1 600(7) y α 4601(1) 595(4)
α 4784 34(25) 94038(40)
228Ra 575(4) y β 00127(7) 30(10)
β 00256(7) 87(9)
β 00391(7) 49(10)
β 00395(7) 12(10)
220Rn 558(3) s α 5748 46(14) 0118(15)
α 6288 22(10) 99882(15)
222Rn 3823 2(8) d α 5489 48(30) 9992(1)
228 Th 69860(23) d α 5176 89(23) 020(2)
α 5211 08(22) 038(3)
α 5340 38(22) 262(2)
α 5423 28(22) 732(2)
TABEL I 1 NUCLEAR DATA OF RELEVANT RADIONUCLIDES [14] (cont)
26
Radionuclide Half-life Disintegration
modes E (MeV) Probability ()
229 Th 7 340(160) y α 5053(2) 660(10)
α 4978 5(12) 317(4)
α 4967 5(12) 597(6)
α 4901 0(12) 1020(8)
α 4845 3(12) 5620(20)
α 4814 6(12) 930(8)
230 Th 7538(30) x 104 y α 4687 0(15) 763(3)
α 4620 5(15) 234(10)
232 Th 1402(6) x 109 y α 3810 0(14) 0068(20)
α 3948 5(14) 210(13)
α 4011 2(14) 789(13)
234 Th 2410(3) d β 0105(10) 65(7)
β 0106(10) 141(12)
β 0198(10) 778(15)
γ 0063 30(2) 375(8)
232U 706(11) y α 5263 48(9) 306(6)
α 5320 24(9) 691(6)
233U 1592(2) x 105 y α 4824 2(12) 843(6)
α 4783 5(12) 132
234U 2455(6) x 105 y α 4603 5(7) 0210(2)
α 4722 4(7) 2842(2)
α 4774 6(7) 7137(2)
235U 704(1) x 106 y α 4322(4) 333(6)
α 4397 8(13) 5719(20)
α 4414 9(5) 301(16)
α 4502 4(7) 128(5)
α 4556 0(4) 379(6)
α 4596 4(13) 474(6)
236U 2343(6) x 107 y α 4445(5) 261(40)
α 4494(3) 738(40)
238U 4468(5) x 109 y α 4038(5) 013(3)
α 4151(5) 2233(50)
α 4198(3) 7754(50)
Emax for beta emitting radioisotopes
Data were taken from [15]
27
FIG I 1 Decay chain of 238U [4]
FIG I 2 Decay chain of 232Th [4]
28
APPENDIX II FLOW CHART FOR SEQUENTIAL SEPARATION OF 210Po 210Pb Th U AND 226Ra
IN PHOSPHOGYPSUM
29
APPENDIX III PROPERTIES OF RESINS
III1 Sr resin
FIG III 1 Structure of the Sr resin (wwweichromcom)
FIG III 2 Capacity factor of Sr resin in nitric acid (wwweichromcom) [16]
30
FIG III 3 Capacity factor of Sr resin in nitric acid (wwweichromcom) [17]
III2 TEVA resin
FIG III 4 Structure of the TEVA resin (wwweichromcom)
31
FIG III 5 Capacity factor of TEVA resin in nitric acid and hydrochloric acid (wwweichromcom) [18]
III3 UTEVA resin
FIG III 6 Structure of the UTEVA resin (wwweichromcom)
32
FIG III 7 Capacity factor of UTEVA resin in nitric acid and hydrochloric acid (wwweichromcom) [19]
33
APPENDIX IV ALPHA SPECTRA OF ANALYTES
FIG IV 1 Alpha spectrum of Po isotopes
FIG IV 2 Alpha spectrum of Th isotopes in phosphogypsum (with progeny)
228Th is resulted from 232U tracer spiked in the sample
34
FIG IV 3 Alpha spectrum of U isotopes
FIG IV 4 Alpha spectrum of 226Ra and its progeny (spiked with 225Ra)
35
FIG IV 5 Overlapping alpha spectra of U and Po isotopes
FIG IV 6 Overlapping alpha spectra of U and Th (with progeny) isotopes
36
APPENDIX V LIQUIDE SCINTILLATION SPECTRA
a)
b)
A window
(115-320 ch)
B window
(320 -410 ch)
210Po
210Pb
210Bi
210Bi
Co
unts
Ch
ann
elC
oun
tsC
han
nel
Channel number
a)
b)
A window
(115-320 ch)
B window
(320 -410 ch)
210Po
210Pb
210Bi
210Bi
Co
unts
Ch
ann
elC
oun
tsC
han
nel
Channel number
FIG V 1 Typical liquid scintillation spectra of beta-emitting 210Pb and 210Bi and alpha emitting 210Po (calibration sources) a) 210Pb 210Bi and 210Po spectra
b) pure 210Bi spectrum
37
APPENDIX VI CALCULATION OF THE COMBINED UNCERTAINTY
OF THE ACTIVITIES OF THE ANALYTES ON SAMPLING DATE
VI1 Uncertainty of the 210Pb result [20]
VI11 Uncertainty of counting efficiency of 210Pb
2
2
2
2
2210
2
210
2210
222
)()()()()()( )( PbTPbT
calcal
stdPbstdPb
Pbb mum
RuR
aua
utZuZ
u
minus+
minus+
minus++
= minusminus
minusεεελεεε (VI-1)
2
222
2 )()()()()( (Z) BABnBnBAAn furrufruu minus+minus+= (VI-2)
20
2 )()()( AAgAn rururu += (VI-3)
20
2 )()()( BBgBn rururu += (VI-4)
VI12 Uncertainty of the tailing factor fAB
The uncertainty of the tailing factor fAB is calculated according to following equations
2
210
210
2
210
210
)()()(
+
=
minus
minus
minus
minus
BicalnB
BicalnB
BicalAn
BicalAnBABA r
ru
r
ruffu (VI-5)
20
2210210 )()()( ABicalAgBicalAn rururu += minusminus (VI-6)
20
2210210 )()()( BBicalBgBicalBn rururu += minusminus (VI-7)
The uncertainty of counting efficiency for 210Pb can be calculated by Eq (VI-8)
2
2
2
2
2210
2
210
2210
222
)()()()()()( )( PbTPbT
calcal
stdPbstdPb
Pbb mum
RuR
aua
utZuZ
u
minus+
minus+
minus++
= minusminus
minusεεελεεε (VI-8)
2
222
2 )()()()()( (Z) BABnBnBAAn furrufruu minus+minus+= (VI-9)
20
2 )()()( AAgAn rururu += (VI-10)
20
2 )()()( BBgBn rururu += (VI-11)
38
VI13 Uncertainty of chemical recovery of Pb
Uncertainty of chemical recoveries of Pb in calibration source
minusminus+
minus+
= 2
2
2
2
2
2
cal )()(
)()(
)( )(R calfcalfcalof
calcalof
calfcalof
calg
g
cal mumm
Rmu
mm
Rfu
f
Ru
2
1
2
2
2
2
)()(
)()(
minus+
minus+
minus
minusminus
minusc
ccPb
cPbcalcPb
ccPb
ccal mumC
CRCu
mC
mR (VI-12)
The uncertainty of chemical recovery of Pb in the sample can be calculated
minusminus+
minus+
= 2
2
2
2
2
2
)()(
)()(
)( (R) ffof
offof
gg
mumm
Rmu
mm
Rfu
f
Ru
2
2
2
2
)()(
)()( c
ssPbccPb
cPbcPb
ssPbccPb
c mumCmC
CRCu
mCmC
mR
+minus+
+minus+
minusminus
minusminus
minusminus
2
1
2
2
2
2
)()(
)()(
+minus+
+minus+
minusminus
minusminus
minusminuss
ssPbccPb
sPbsPb
ssPbccPb
s mumCmC
CRCu
mCmC
mR (VI-13)
VI14 Uncertainty of mass ratio
The uncertainty of the mass ratio (fg) of atomic mass of Pb to molar mass of Pb-oxalate is calculated using the equations below
22
M Pb)(
+
=
minus
minus
oxalatePb
M
Pbgg M
u
M
uffu oxalatePb (VI-14)
The uncertainty of the molar mass of lead oxalate u(MPb-oxalate) can be derived by combining standard uncertainties in atomic masses of its constituents as shown in Table VI 1
39
TABLE VI 1 STANDARD UNCERTAINTIES OF ATOMIC WEIGHT AND THE GRAVIMETRIC FACTOR fg
Element Atomic weight
(gmol-1)
Quoted uncertainty (gmol-1)
Conversion factor
Standard uncertainty (gmol-1)
Mass ratio of atomic mass of Pb to
molar mass of Pb-oxalate
Uncertainty ofatomic mass
of Pb to molar mass of
Pb-oxalate
Pb 207215 2 0000 15 3 0000 087 0701 9 0000 002
C 12010 7 0000 8 3 0000 46
O 15999 4 0000 3 3 0000 17
VI15 Combined uncertainty of activity of 210Pb
The combined uncertainty of the 210Pb activity is calculated from Eq (VI-15)
minus+
minus+
minus+
= minusminusminusminus 2
2
2102
2
2102
2
210
2
2
2101 )()()()()( s
d
sPb
BA
sPb
nBnB
sPb
BAnA
sPb
Pbc mum
afu
Z
arru
Z
afru
Z
aau
2
1
23
2
3
21022
2
2
2102
2
2102
2
210 )()()()(
+
+
minus+
minus+ minus
minus
minusminus
minus
minusminusminusPb
Pb
sPbPb
Pb
sPbsPbsPb fuf
afu
f
aRu
R
au
aε
ε (VI-15)
)()( 210222 minusminusminus = PbPbPb utffu λ (VI-16)
210
210321033
)(
11)(
3210
3210
minus
minusminus
minus
minusminusminus
minusminus=
minus
minus
Pb
Pbt
t
PbPbPb
u
e
etffu
Pb
Pb
λλλ λ
λ
(VI-17)
However if the time interval (t2) between the separation of 210Pb and the beginning of the measurement and the counting time of the sample (t3) are much smaller than the half life of 210Pb f2-Pb f3-Pb u(f2-Pb) and u(f3-Pb) are negligible The uncertainties associated to components mentioned above can be calculated as follows
0
0
3
)(t
r
t
rru
Po
gn +=
minus
(VI-18)
0
0
3
)(t
r
t
rru t
Po
tgtn +=
minus
(VI-19)
minus+
+
= minusminusminus
minus2
2
2102
2
2102
2
210210 )()()( )( tn
tn
sPo
nn
sPo
TT
sPo
sPo rur
aru
r
aAu
A
aau
2
2
21022
2
2
2102
2
2102
2
210)()()()( T
T
sPo
PoPo
sPo
TT
sPo
ss
sPofu
f
afu
f
amu
m
amu
m
a
+
+
+
minus+ minus
minusminus
minusminusminus
40
2
1
3
2
3
210 )(
+ minus
minus
minusPo
Po
sPo fuf
a (VI-20)
)()( TTTt utffu λ= (VI-21)
)()( 210222 minusminusminusminus = PoPoPoPo utffu λ (VI-22)
210
210321033
)(
11)(
3210
3210
minus
minusminus
minus
minusminusminus
minusminus=
minus
minus
Po
Pot
t
PoPoPo
u
e
etffu
Po
Po
λλλ λ
λ (VI-23)
VI16 Combined uncertainty of activity of 210Po
The uncertainty of the activity of 210Po on the separation date is calculated according to IAEAAQ12 procedure [8]
VI2 Uncertainty of other alpha emitting isotopes
The same formulas are used to calculate the combined uncertainties as equations that are used for calculation of the activity of alpha emitting analytes at the separation time and the sampling date as well as the chemical recovery and counting efficiency These formulas have to be applied in the spreadsheet approach for calculating the combined uncertainties knowing the standard uncertainty of each component VI3 Spreadsheet approach
For the quantifying the uncertainties the spreadsheet technique [21] was used which could be summarised as follows and showed in the Fig VI 1
bull Calculate function y using parameter xj
y=f(x1x2xj xn) (VI-24)
bull recalculate the same function n times increasing xj to xj+dxj (dxj standard deviation) and keeping the remaining parameters constant
y=f(x1x2xj+dxj xn) (VI-25)
bull the uncertainty on the function dy is the square root of the sum of squares
( )sum minus=n
jyydy1
2 (VI-26)
bull The individual variance contribution fj is
( )( )sum minus
minus=
n
j
jj
yy
yyf
1
2
2
(VI-27)
41
FIG VI 1 Spreadsheet approach for quantifying the uncertainty of the measurement
The results are summarised for the individual isotopes in the Tables VI 2ndashVI 9 and the results of the individual analysis with their uncertainties are shown in the Figs VI 3ndashVI 9 The detailed study about the usual contributors of uncertainty in the nuclear analytical techniques could be found in the IAEA-TECDOC-1401 [11] TABLE VI 2 AN EXAMPLE OF QUANTIFYING UNCERTAINTIES OF 210Po RESULT
Symbol unit Value of variable
Uncertainty Conversion factor to standard uncertainty
Standard uncertainty
Contribution to combined
uncertainty ()
m g 0508 9 0007 3 3 0004 2 010
rgt s-1 0197 0075 1 0075 361
r0t s-1 0000 017 0000 034 1 0000 034 0000 014
rg s-1 0081 0029 1 0029 6352
r0 s-1 0000 034 0000 033 1 0000 033 0000 08
at Bq 0829 0019 1 0019 0252
λt d-1 0000 019 0000 013 1 0000 013 negligible
λPo d-1 0005 72 x 10-9 1 72x10-9 negligible
ft 0982 14 0000 43 1 0000 43 0000 091
f2-Po 1005 73 x 10-9 1 73x10-9 negligible
f3-Po 1005 5 18 x 10-8 1 18 x10-8 negligible
aPo1 Bqmiddotkg-1 672 94
contribution is less than 1 x 10⁻⁵
TABLE VI 3 AN EXAMPLE OF QUANTIFYING UNCERTAINTIES OF EFFICIENCY OF 210Pb
Symbol unit Value of variable
Uncertainty
Conversion factor to standard
uncertainty
Standard uncertainty
Contribution to combined
uncertainty ()
mvial g 14936 35 0000 1 3 0000 17 0004 8
42
Symbol unit Value of variable
Uncertainty
Conversion factor to standard
uncertainty
Standard uncertainty
Contribution to combined
uncertainty ()
mvial+carrsol g 16036 54 0000 1 3 0000 17 0004 8
cPb g g-1 0027 42 0000 021 1 0000 021 011
mvial g 16036 72 0000 10 3 0000 17 0004 8
mvial+std g 17132 6 0000 10 3 0000 17 0004 8
astd Bq 1245 0189 1 0189 805
fgravimetry 0701 85 0000 41 1 0000 41 0066
mfilter g 0036 54 0000 10 3 0000 17 42
mfilter+Pb-precipitate g 0073 77 0000 10 3 0000 17 41
rA s-1 7362 0041 1 0041 76
rA0 s-1 0029 5 0003 1 0002 7 0035
rB s-1 0416 0 0011 1 0011 060
rB0 s-1 0011 7 0002 1 0002 2 0024
fAB 1049 0023 1 0023 040
t12 Pb d 814508 7305 1 731 23
tmeas-ref d 4 532 -
ε 0859 7 0015 3
43
TABLE VI 4 AN EXAMPLE OF QUANTIFYING UNCERTAINTIES OF 210Pb RESULT
Symbol unit Value of variable
Uncertainty Conversion factor to standard uncertainty
Standard uncertainty
Contribution to combined
uncertainty ()
ms g 0508 9 0007 3 3 0004 2 03
rgA s-1 0283 0035 1 0035 883
r0A s-1 0011 7 0002 2 1 0002 2 03
rgB s-1 0031 0009 1 0009 58
r0B s-1 0005 6 0002 3 1 0002 3 04
Ζ s-1 0245 1 0032 7 1 0032 7 -
fAB 1015 3 0012 9 1 0012 9 001
ε 0859 7 0015 3 1 0015 3 13
R 0858 8 0025 3 1 0077 2 35
aPb1 Bqmiddotkg-1 652 12
TABLE VI 5 AN EXAMPLE OF QUANTIFYING UNCERTAINTIES OF 234U RESULT
Symbol unit Value of variable
Uncertainty Conversion factor to standard uncertainty
Standard uncertainty
Contribution to combined
uncertainty ()
ms g 0508 9 0007 3 3 0004 2 003
rgt s-1 0021 78 0008 01 1 0008 369
r0t s-1 0000 030 0000 022 1 0000 022 0000 5
rg s-1 0016 15 0005 90 1 0006 628
r0 s-1 0000 016 0000 022 1 0000 022 0000 1
at Bq 0088 35 0002 10 1 0002 01 029
aU-234_1 Bqmiddotkg-1 129 3
TABLE VI 6 AN EXAMPLE OF QUANTIFYING UNCERTAINTIES OF 238U RESULT
Symbol unit Value of variable
Uncertainty Conversion factor to standard uncertainty
Standard uncertainty
Contribution to combined
uncertainty ()
ms g 0508 9 0007 3 3 0004 2 003
rgt s-1 0021 78 0008 01 1 0008 353
r0t s-1 0000 030 0000 022 1 0000 022 0000 5
rg s-1 0015 61 0005 67 1 0006 644
r0 s-1 0000 009 0000 008 1 0000 008 0000 1
at Bq 0088 35 0002 10 1 0002 1 028
aU-238_1 Bqmiddotkg-1 124 3
44
TABLE VI 7 AN EXAMPLE OF QUANTIFYING UNCERTAINTIES OF 230Th RESULT
Symbol unit Value of variable
Uncertainty Conversion factor to standard uncertainty
Standard uncertainty
Contribution to combined
uncertainty ()
ms g 0508 9 0007 3 3 0004 2 005
rgt s-1 0022 63 0006 44 1 0006 387
r0t s-1 0000 077 0000 063 1 0000 063 0006 1
rg s-1 0028 38 0007 90 1 0008 608
r0 s-1 0000 012 0000 010 1 0000 010 0000 1
at Bq 0090 03 0002 30 1 0002 303 051
aTh-230_1 Bqmiddotkg-1 223 9
TABLE VI 8 AN EXAMPLE OF QUANTIFYING UNCERTAINTIES OF 232Th RESULT
Symbol unit Value of variable
Uncertainty Conversion factor to standard uncertainty
Standard uncertainty
Contribution to combined
uncertainty ()
ms g 0508 9 0007 3 3 0004 2 004
rgt s-1 0022 63 0006 44 1 0006 265
r0t s-1 0000 077 0000 063 1 0000 063 0004 2
rg s-1 0000 28 0000 10 1 0000 1 727
r0 s-1 0000 011 0000 008 1 0000 008 048
at Bq 0090 03 0002 30 1 0002 3 035
aTh-232_1 Bqmiddotkg-1 21 009
TABLE VI 9 AN EXAMPLE OF QUANTIFYING UNCERTAINTIES OF 226Ra RESULT
Symbol unit Value of variable
Uncertainty Conversion factor
to standard uncertainty
Standard uncertainty
Contribution to combined
uncertainty ()
ms g 0508 9 0007 3 3 0004 2 003
rgt s-1 0043 10 0025 05 1 0025 05 603
r0t s-1 0000 111 0000 128 1 0000 128 0004
rg s-1 0063 32 0018 78 1 0018 78 393
r0 s-1 0000 070 015 0000 070 013 1 0000 070 013 0000 5
at Ra-225 Bq 0779 50 0022 53 1 0022 53 04
λAc225 d-1 0069 315 0000 624 1 0000 624 0000 02
λRa225 d-1 0046 520 0000 693 1 0000 693 008
t1-t0 d 337
aRa-226_1 Bqmiddotkg-1 766 39
45
APPENDIX VII DETECTION THRESHOLD AND LIMIT OF THE APPLIED PROCEDURE
TABLE VII 1 TYPICAL DECISION THRESHOLD AND DETECTION LIMIT FOR RELEVANT ISOTOPES
Symbol unit 210Pb 210Po 234U 238U 230 Th 232 Th 226Ra
k 165 165 165 165 165 165 165
m kg 0000 5 0000 5 0000 5 0000 5 0000 5 0000 5 0000 5
ε 086 031 026 026 035 035 025
R 086 073 094 094 068 068 061
n0 52 16 4 4 6 6 28
Tg s 36 000 98 899 343 024 343 024 277 345 277 345 124 984
t0 s 35 542 548 190 512 901 512 901 559 286 559 286 446 755
a Bqmiddotkg-1 13 036 009 009 012 012 068
a1 Bqmiddotkg-1 38 11 028 028 036 036 205
u2(0) Bq2middotkg-2 29 015 0008 4 0008 4 0006 5 0004 7 078
u2(a1) Bq2middotkg-2 23 041 0059 0025 0028 0052 204
a Bqmiddotkg-1 24 12 052 019 018 019 43
46
APPENDIX VIII VALIDATION TEST RESULTS OF THE PROCEDURE
TABLE VIII 1 VALIDATION RESULTS FOR RELEVANT RADIONUCLIDES
Parameters 210Po 210Pb 234U 238U 230Th 226Ra
C Bq kg-1 680 680 120 120 211 780
X Bq kg-1 653 659 127 123 221 793
u(C) Bq kg-1 58 58 9 11 9 62
u(X ) Bq kg-1 23 22 5 5 10 35
δ() -40 -31 58 25 47 17
rL Bq kg-1 106 102 48 47 62 498
RL Bq kg-1 237 454 59 53 89 707
PI() 92 92 85 100 62 91
TABLE VIII 2 ANALYSIS OF VARIANCE (ANOVA) FOR 210Po 210Pb 238U 230Th AND 226Ra IN PHOSPHOGYPSUM
Nuclide SSwb SSbb MSwb MSbb Swb
(as CV)
Sbb
(as CV)
210Po 124 62 151 79 312 1687 271 254
210Pb 8385 197 54 210 2195 220 302
238U 314 386 785 429 227 215
230Th 2176 1598 544 178 334 225
226Ra 412 686 137 858 121 054
SSwb sum of squares within bottles
SSbb sum of squares between bottles
MSwb mean of squares within bottles
MSbb mean of squares between bottles
Swb standard deviation as percent of covalent variance within bottles
Sbb standard deviation as percent of covalent variance between bottles
47
550
600
650
700
750
0 10 20 30 40 50
Samples
Act
ivity
of
21
0 Pb
in th
e sa
mp
le (
Bq
kg
dry
)
Mean1σ
-2σ
-1σ
3σ
2σ
-3σ
FIG VIII 1 210Pb results with associated uncertainties
550
600
650
700
750
0 10 20 30 40 50Samples
Act
ivity
of
21
0 Po
in t
he s
ampl
e (B
qkg
dry
)
Mean
1σ
-1σ
3σ
2σ
-3σ-2σ
FIG VIII 2 210Po results with associated uncertainties
48
110
115
120
125
130
135
140
0 10 20 30 40 50
Samples
Act
ivity
of
238
U in
the
sam
ple
(B
qkg
dry
)
Mean
1σ
-1σ
3σ
2σ
-3σ
-2σ
FIG VIII 3 238U results with associated uncertainties
105
110
115
120
125
130
135
140
145
150
0 10 20 30 40 50
Samples
Act
ivity
of
23
4 U in
the
sa
mpl
e (B
qkg
dry
)
Mean1σ
-2σ-1σ
3σ2σ
-3σ
FIG VIII 4 234U results with associated uncertainties
49
190
200
210
220
230
240
250
0 5 10 15 20 25 30 35 40 45 50
Samples
Act
ivity
of
23
0 Th
in th
e s
am
ple
(B
qk
g d
ry)
2σ
3σ
1σ
-1σ
-2σ
-3σ
Mean
FIG VIII 5 230 Th results with associated uncertainties
05
10
15
20
25
30
35
40
0 10 20 30 40 50
Samples
Act
ivity
of
23
2 Th
in th
e sa
mp
le (
Bq
kg
dry
)
Mean
1σ
-2σ
-1σ
3σ
2σ
-3σ
FIG VIII 6 232 Th results with associated uncertainties
50
650
700
750
800
850
900
1 2 3 4 5 6 7 8 9 10 11 12 13 14 15 16 17 18 19 20
Sample
Act
ivity
of
226 R
a in
th
e sa
mp
le (
Bq
kg
dry
)
Mean
1σ
-1σ
3σ
2σ
-3σ
-2σ
FIG VIII 7 226Ra results with associated uncertainties
51
CONTRIBUTORS TO DRAFTING AND REVIEW
Hampe D Gaigl FA
Verein fuumlr Kernverfahrenstechnik und Analytik Rossendorf eV Dresden Germany IAEA Environment Laboratories Terrestrial Environment Laboratory Seibersdorf Austria
Kim C-K IAEA Environment Laboratories Terrestrial Environment Laboratory Seibersdorf Austria
Kis-Benedek Gy IAEA Environment Laboratories Terrestrial Environment Laboratory Seibersdorf Austria
Martin P IAEA Environment Laboratories Terrestrial Environment Laboratory Seibersdorf Austria
Mietelski J W The Henryk Niewodniczanski Institute of Nuclear Physics Polish Academy of Sciences Poland
Sansone U IAEA Environment Laboratories Terrestrial Environment Laboratory Seibersdorf Austria
Varga B Central Agricultural Office Food and Feed Safety Directorate Hungary
2
FOREWORD
Reliable comparable and ldquofit for purposerdquo results are an essential requirement for any decision based on analytical measurements For analyst the availability of tested and validated analytical procedures are extremely important tools for production such analytical data For maximum utility such procedures should be comprehensive clearly formulated and readily available to both the analyst and the customer for reference
Since 2004 the Environment programme of the IAEA has included activities aimed at the development of a set of procedures for the determination of radionuclides in terrestrial environmental samples In this report a combined procedure for the sequential determination of 210Pb 210Po 226Ra Th and U isotopes in phosphogypsum sample is described The method is based on the dissolution of small amounts of samples by microwave digestion followed by sequential separation of 210Po 210Pb Th and U isotopes by selective extraction chromatography using Sr resin TEVA and UTEVA Radium-226 is separated from interfering elements using Ba(Ra)SO4 co-precipitation Lead-210 is determined by liquid scintillation counting Alpha source of 210Po is prepared by auto-deposition on a silver plate The alpha sources of Th and U are prepared by electrodeposition on a stainless steel plate
A comprehensive methodology for the calculation of results including quantification of measurement uncertainty was also developed This report presents the final procedure which was developed and validated in terms of repeatability and reproducibility according to ISO guidelines
The IAEA wishes to thank all the participants for their valuable contributions to develop the procedure and review the document especially B Varga who prepared the draft of the manuscript The IAEA officer responsible for this publication was C-K Kim of the IAEA Environment Laboratories
CONTENTS
1 INTRODUCTION 1
2 SCOPE 2
3 NORMATIVE REFERENCES 2
4 RESPONSIBILITIES 2
5 TERMS AND DEFINITIONS SYMBOLS AND ABBREVIATIONS 3
6 PRINCIPLE 5
7 CHEMICAL REAGENTS AND EQUIPMENT 5
71 Tracers 5 72 Carrier 6 73 Equipment 6 74 Chemical reagents 6
8 PRECAUTIONS 7
9 PROCEDURE 8
91 Sample dissolution using microwave digestion system 8 92 Chemical separation procedures 8 93 Source preparation 10 94 Measurement 12
10 EXPRESSION OF RESULTS 14
101 Calculation of activity of relevant isotopes 14 102 Expression of combined uncertainty of relevant isotopes 17 103 Decision threshold 18 104 Detection limit 18
11 VALIDATION OF THE PROCEDURE 19
111 Trueness of the method 19 112 Precision of the method 19 113 Repeatability limit 20 114 Reproducibility limit 20 115 Outlier test 20 116 Acceptance criteria 20
12 TEST REPORT 20
REFERENCEShelliphelliphelliphelliphelliphelliphelliphelliphelliphelliphelliphelliphelliphelliphelliphelliphelliphelliphelliphelliphelliphelliphelliphelliphelliphelliphelliphelliphelliphellip26
APPENDIX I Nuclear data of relevant radionuclides and decay chains of U and Th series 28
APPENDIX II Flow chart for sequential separation of 210Po 210Pb Th U and 226Ra in phosphogypsumhelliphelliphelliphelliphelliphelliphelliphelliphelliphelliphelliphelliphelliphelliphelliphelliphelliphelliphelliphelliphellip32
APPENDIX III Properties of resinshelliphelliphelliphelliphelliphelliphelliphelliphelliphelliphelliphelliphelliphelliphelliphelliphelliphelliphelliphelliphellip33
4
APPENDIX IV Alpha spectra of analyteshelliphelliphelliphelliphelliphelliphelliphelliphelliphelliphelliphelliphelliphelliphelliphelliphelliphelliphellip37
APPENDIX V Liquide scintillation spectrahelliphelliphelliphelliphelliphelliphelliphelliphelliphelliphelliphelliphelliphelliphellip37
APPENDIX VI Calculation of the combined uncertainty of the activities of the analytes on sampling datehelliphelliphelliphelliphelliphelliphelliphelliphelliphelliphelliphelliphelliphelliphelliphelliphelliphelliphelliphelliphelliphelliphelliphelliphelliphelliphelliphelliphelliphelliphellip41
APPENDIX VII Detection threshold and limit of the applied procedurehelliphelliphelliphelliphelliphelliphellip49
APPENDIX VIII Validation results of the procedure50
CONTRIBUTORS TO DRAFTING AND REVIEWhelliphelliphelliphelliphelliphelliphelliphelliphelliphelliphelliphelliphelliphelliphellip55
1
1 INTRODUCTION
Phosphogypsum is a by-product derived from the wet process production of phosphoric acid by reacting phosphate rock with sulfuric acid and represents one of the most serious problems facing the phosphate industry today Very large quantities of phosphogypsum have been produced world-wide since the 1950s because of the high demand for phosphate fertilizer and because the wet phosphoric acid process produces about 5 t of phosphogypsum for every tonne of phosphoric acid manufactured Most of the phosphogypsum produced world-wide is stock-piled There has been high interest in findings uses for this by-product for example as a building material or a soil amendment for the remediation of soils Both the acidic process liquid wastes and the phosphogypsum itself are potential sources of contamination The main problem associated with this material concerns the relatively high levels of natural radionuclides of uranium-series (Fig I 1) and other radioactive (Fig I 2) and non radioactive contaminants which could have an impact on the environment There is concern related to the possible contamination of groundwater under phosphogypsum stacks and to radon exhalation which may pose a health risk to people working and living close to a stack
The presence of radionuclides puts restrictions on the use of phosphogypsum in building materials and in soil amendments The United States Environmental Protection Agency (US EPA) ruled that phosphogypsum would only be permitted for use in agriculture if the average concentration of 226Ra in the phosphogypsum does not exceed 370 Bqkg-1 [1 2] National Council of Radiation Protection [3] guideline recommends 226Ra content of 15 Bqg-1 in soil above which growing human food crops on it is restricted In addition the US EPA adopted an average 074 Bqmiddotm-2middots-1 upper limit on 222Rn emission from phosphogypsum stacks The phosphogypsum currently produced is stockpiled near the production site Recently there is considerable demand for provision of a reference material with a phosphogypsum matrix from IAEA Member State laboratories which have phosphate industry Consequently IAEA has prepared and released a phosphogypsum reference material (IAEA-434) after performing the necessary homogeneity and characterization tests As a part of this work the procedure described in this report was developed Alpha emitters such as U and Th isotopes 210Po and 226Ra are generally measured by alpha-spectrometry after radiochemical separation while 210Pb being a beta emitter is determined by liquid scintillation spectrometry The relevant decay data of relevant radionuclides are in Table I 1 and Figures I 1ndashI 2 [4] of Appendix I The purpose of this work was to develop a sequential separation method combining the extraction chromatography with Sr resin TEVA and UTEVA and Ba(Ra)SO4 co-precipitation for sequential determination of 210Po 210Pb Th U and 226Ra in phosphogypsum The method validation of the procedure was carried out in terms of trueness repeatability and reproducibility with the IAEA-434 reference material
2
2 SCOPE
The sequential separation method is described for the determination of 210Po 210Pb 226Ra Th and U isotopes in phosphogypsum by isotope dilution alpha particle spectrometry and liquid scintillation spectrometry (LSC) The mass of the sample required for the radiochemical analysis is typically 05 g The method validation was carried out during the preparation of reference material of IAEA-434 and the world wide intercomparison run of IAEA-CU-2008-03 [5] The typical chemical recovery and detection limits of relevant radionuclides in the proposed procedure are summarised in the Table 1
TABLE 1 TYPICAL CHEMICAL RECOVERIES AND DETECTION LIMITS OF RELEVANT RADIONUCLIDES IN THE PROPOSED PROCEDURE
Isotope Counting method Source preparation Typical recovery () Typical detection
limit (Bqkg-1 as dry mass)
210Pb LSC precipitation 80-90 24
210Po α-spectrometry auto-deposition 40-70 12
234U α-spectrometry electrodeposition 70-80
052
238U 019
230Th α-spectrometry electrodeposition 70-80
018
232Th 052
226Ra α-spectrometry electrodeposition 60-80 43
3 NORMATIVE REFERENCES
bull ISO 119292010 Determination of the characteristic limits (decision threshold detection limit and limits of the confidence interval) for measurements of ionizing radiation ndash Fundamentals and application
bull ISO 170252005 General requirements for the competence of testing and calibration laboratories
bull ISOTS 217482004 Guidance for the use of repeatability reproducibility and trueness estimates in measurement uncertainty estimation
bull ISOIEC Guide 98-32008 Uncertainty of measurement ndash Part 3 Guide to expression of uncertainty in measurement
bull ISO 7870-12007 Control charts ndash Part 1 General guidelines
4 RESPONSIBILITIES
It is the responsibility of the analyst to follow this procedure and to establish appropriate safety and health practices Compliance with national and or internal safety rules or chemical and radioactive safety is obligatory Although the method has been carefully tested each laboratory should perform an individual validation procedure
3
5 TERMS AND DEFINITIONS SYMBOLS AND ABBREVIATIONS
In the following u(x) indicates the uncertainty in quantity x and generally the relevant isotope is indicated as subscript
a Decision threshold [Bqkg-1]
a Detection limit [Bqkg-1]
a0 Activity of the analyte on the sampling date [Bqkg-1]
astd Activity of the calibration standard [Bq g-1]
as Activity of the analyte on the separation date [Bqkg-1]
AT Activity of 225Ra tracer [Bq]
C Certified activity of the analyte in the reference material [Bqkg-1]
CPb-c Mass fraction of Pb carrier solution
CPb-s Mass fraction of Pb already present in the sample
CT Certified activity of tracer on the reference date [Bqg-1]
fAB Tailing factor correction of interfered windows A and B
fg Mass ratio of atomic mass of Pb to molar mass of PbC2O4
fT Correction factor for the decay of the tracer during elapsed time between the reference date of tracer and the beginning of the measurement
f2 Correction factor for decay of the analyte during elapsed time between the separation and the beginning of the measurement
f3 Correction factor for decay of the analyte over the counting time
mC Mass of the carrier taken (in case of lead mass of carrier solution) [g]
mf Mass of the filter used [g]
mfcal Mass of the filter used in calibration [g]
mof Total mass of PbC2O4 and the filter used [g]
mofcal Total mass of PbC2O4 and the filter used in the calibration [g]
ms Mass of the sample [kg]
mT Mass of the tracer taken [g]
mTPb Mass of the 210Pb standard solution added [g]
MPb Atomic mass of Pb [gmiddotmol-1]
MPb-oxalat Molar mass of PbC2O4 [gmiddotmol-1]
n Net counts in ROI of analyte [counts]
nT Net counts in ROI of tracer [counts]
n0 Blank or background counts in ROI of analyte [counts]
n0T Blank or background counts in ROI of tracer [counts]
Pα Probability of α decay
Pγ Probability of γ decay
4
r0 Blank or background count rate in ROI of analyte [countss-1]
r0T Blank or background count rates in ROI of tracer [countss-1]
rcal Count rates during the calibration [countss-1]
rn Net count rates in ROI of analyte [countss-1]
rnT Net count rates in ROI of tracer [countss-1]
rg Gross count rates in ROI of analyte [countss-1]
rgT Gross count rates in ROI of tracer [countss-1]
rnTmax Maximum detectable count rate [countss-1]
r0A r0B Count rates in windows A and B of the blank spectrum [countss-1]
rgA rgB and u(rgA) u(rgB) Gross count rates in windows A and B of 210Pb spectrum [countss-1]
rnA rnB Net count rates in windows A and B of 210Pb spectrum [countss-1]
R Chemical recovery of the analyte
Rcal Chemical recovery of making the calibration source
RL Reproducibility limit [Bqkg-1]
rL Repeatability limit [Bqkg-1]
SR Standard deviation of reproducibility [Bqkg-1]
Sr Standard deviation of repeatability [Bqkg-1]
t Time interval between the sampling date and the measurement date [s]
t0 Counting time of the blank or background [s]
tTs Time interval between the reference date of the tracer standard and the separation date [s]
t1 Time interval between the sampling date and the separation date [s]
t2 Time interval between the separation date and the start of the measurement [s]
t3 Counting time of the sample [s]
tT Counting time of the tracer [s]
tAc-225 Time of build up of 225Ac [s]
ts Time of the separation noted [s]
tm Time of the starting of the measurement [s]
tem Time of the end of the measurement [s]
u(0) Uncertainty of non-negative measurand
X mean value of measurement results of the analyte in reference material [Bqkg-1]
δ Relative bias of the test result []
ε Counting efficiency of the detector
λ Decay constant of the isotope [countss-1]
λT Decay constant of the tracer [countss-1]
FWHM Full width at half maximum
5
LSC Liquid scintillation counting (spectrometry)
NNDC National Nuclear Data Center Brookhaven National Laboratory
ROI Region of interest
PSA Pulse shape analysis
T12 Half-life of any isotope
6 PRINCIPLE
The sample is digested in a microwave digestion system Polonium-210 210Pb U and Th isotopes and 226Ra are separated from interfering elements with a sequential chemical procedure using extraction chromatographic resins and Ba(Pb)SO4 co-precipitation The flow chart of the combined procedure is given in Appendix II The most important features of the resins are shown in Appendix III (Sr resin TEVA and UTEVA see Figs III 1ndashIII 7) U and Th are electrodeposited on a polished stainless steel plate The polonium source is prepared on a silver plate by auto-deposition The 226Ra source is prepared by Ba(Ra)SO4 microco-precipitation The 210Pb source is prepared with Pb-oxalate precipitation Polonium-210 U Th isotopes and 226Ra are determined by isotope dilution alpha-spectrometry and 210Pb is determined by liquid scintillation spectrometry
7 CHEMICAL REAGENTS AND EQUIPMENT
71Tracers
The two tracers commonly used for 210Po determination are 208Po and 209Po Polonium-209 has a clear advantage over 208Po in energy separation from the 210Po peak and is the preferred tracer if available It should also be noted that 208Po solutions normally contain traces of 209Po A typical alpha spectrum of 209Po and 210Po is shown in Fig IV 1 of Appendix IV
Naturally occurring thorium can be determined by the following tracers 228Th and 229Th Both of them have short lived daughters which emit alpha-particles but as the energies of all their daughters are higher than 568 MeV thus no spectral interference occurs from ingrowth of daughters either 228Th or 229Th The 228Th daughter of 232U can be used as a tracer for the determination of 230Th and 232Th In this case the natural 228Th content in phosphogypsum should be measured or estimated separately to allow for this [4] An alpha spectrum of Th isotopes and its progeny is depicted in Fig IV 2 of Appendix IV
Naturally occurring uranium can be determined by the following tracers 232U 233U or 236U Among them 232U (containing 228Th daughter in known ratio close to 1) is applied most frequently The amount of 232U tracer to be added to the sample should be carefully calculated because this is the highest-energy uranium peak in the uranium spectrum and hence its tailing might affects other peaks in low energy region if the added concentration is too high A typical alpha spectrum of uranium isotopes is shown in Fig IV 3 of Appendix IV
In the case of 226Ra analysis several tracers such as 133Ba 223Ra 224Ra 225Ra might be applied Barium-133 is a most commonly used tracer for the determination of 226Ra (can be measured by gamma-spectrometry) A disadvantage of this tracer is that although its chemical behavior is very similar to that of Ra their chemical behavior is not identical as they are different elements Alternative is 225Ra (daughter of 229Th) which does not exist in nature and its decay does not produce radon which might escape from the source Radium-225 is both a beta and
6
gamma emitter with a gamma line at 4009 keV (Pγ 0300) which is well measurable with an n-type HPGe detector with carbon-epoxi or Be window Alternatively its descendants 225Ac 221Fr 217At are alpha-emitters and the determination of chemical recovery is possible via 217At at 7066 7 MeV (Pα 0999 32) using ingrowth decay equations [4] (Fig IV 4 of Appendix IV)
72Carrier
If there is no suitable radioactive tracer available the chemical recovery can be checked by using an inactive carrier namely a stable isotope of the same element as the radioactive analyte In the present case 30 mg Pb2+ carrier is used as Pb(NO3)2 solution for checking the chemical recovery of 210Pb determination gravimetrically
73Equipments
bull Standard laboratory equipment well exhausted fume-hood bull Microwave oven bull Alpha spectrometer with Si semiconductor detector bull Vacuum pump bull Liquid scintillation spectrometer bull Auto-deposition system bull Silver disk fitted to the auto-deposition cell diameter is equal or less than the
diameter of the detector used for alpha spectrometry bull Electrodeposition apparatus (Pt wire anode) equipped with DC power supply to
provide up to 1 A of regulated current to the electrolytic cell bull Stainless steel disc diameter is equal or less than the diameter of the detector used for
alpha spectrometry bull Analytical balances with accuracies of 01 mg and 001 g bull Hot plate with magnetic stirrer bull Burner bull Centrifuge plastic centrifuge tube (minimum 20 mL volume) bull Water bath with temperature controller bull Filtering set with filter paper for fine precipitate bull Chromatography columns with stopper control valve and funnel (250 mL) and holder
for them bull pH meter or pH papers bull Teflon beakers with Teflon tops and clips bull Dispensers 5-50 mL and 10-100 mL bull Micropipettes with dispensable tips (100-5000 microL) bull Timer bull Liquid scintillation vial 20 mL plastic (polyethylene) inner surface coated with
Teflon
74Chemical reagents
bull 30 mgmL-1 Pb2+ solution (usually as Pb(NO3)2) bull 04 Bq of 209Po tracer as a certified solution bull 004 Bq of 232U tracer as a certified solution bull 005 Bq of 225Ra in equilibrium with its parent 229Th as a certified solution bull HNO3 (65) (nitric acid)
7
bull HF (40) (hydrogen fluoride) bull H3BO3 (boric acid) bull HCl (32) (hydrochloric acid) bull Ultra pure water bull DTPA (diethylenetriaminepentaacetic acid) bull Sr resin (100-150 microm) bull TEVA resin bull UTEVA resin bull Cation exchange resin (AG-50W-X8 or Dowex-50) bull Fine clean quartz crystals (analytical grade) bull C6H8O6 (Ascorbic acid) bull NH4SCN (ammonium thiocyanate) bull EDTA (ethylenediaminetetraacetic acid) bull NH3(aq) (ammonia) bull (NH4)2SO4 (10) (ammonium sulfate) bull C2O4H2middot2H2O (oxalic acid) bull Methyl red solution (025) bull Thymol blue solution (025) bull Ba seeding solution [6] Weigh between 0012 and 0016 g of BaCl2 2H2O into a tall
150 mL quartz beaker Add approximately 04 mL of ultra pure water to completely dissolve the BaCl2 2H2O In a fume hood add 10 mL of the 70 sodium hydrogen sulfate solution and 2 drops of 72 HClO4 Evaporate the solution on a hot plate or a burner at high heat with continuous swirling until most of the excess sulfuric acid has been expelled and a pyrosulfate fusion is obtained Cool the beaker while rolling the melt around the sides so that the cake is deposited on the sides as uniformly as possible to facilitate rapid dissolution Cool the beaker and contents to room temperature in a desiccating chamber Add a solution of 50 mL 20 Na2SO4 to the beaker Swirl continuously until the cake is completely dissolved (place it in an ultrasonic bath for 10 minutes before each use if a build up of particulate matter occurs then make a fresh solution)
bull Sodium sulfate wash solution dissolve 100 g of anhydrous Na2SO4 in 2 L of 05 H2SO4 Filter through a 045 microm pore size membrane filter
bull CH3CH2OH (ethyl alcohol) bull Filter paper (for example Whatman 41) bull Polypropylene filter (for example Pall 01 microm pore size 25 mm diameter) bull Scintillation cocktail which forms a gel (for example InstaGel Plus) or suitable for
alphabeta separation All the chemical reagents needed to carry out this procedure must be analytical grade
8 PRECAUTIONS
Do not ash the sample if 210Po determination is required gently drying is allowed but not higher than 80oC
During the handling of the ion exchange chromatography columns always keep several mm of liquid above the surface of resin do not allow it to become dry during the separation steps
Labeling of the different fraction is essential to avoiding mixing solutions this includes the different load solutions and chemicals
8
The complete separation of Po from U is important because 210Po (Eα 5263 MeV) can interfere with the alpha peak of 232U (Eα 5320 MeV) and its activity is much higher than of U in phosphogypsum In addition 209Po (Eα 4866 MeV) can interfere with the alpha peak of 234U (Eα 4766 MeV) These are shown in Fig IV 5 of Appendix IV
The complete separation of Th from U is also important because several peaks in the spectra overlap as it is shown on Fig IV 6 of Appendix IV
Applying 225Ra as a yield tracer for the determination of 226Ra the radiochemical procedure needs to include steps to guarantee the complete separation of the parentprogeny couples 229 Th225Ra and 225Ra225Ac
9 PROCEDURE
This procedure consists of the sample dissolution the sequential separation of 210Po 210Pb Th and U isotopes and 226Ra from interfering elements and the source preparation for alpha spectrometry and liquid scintillation spectrometry (see the flowchart in Appendix II)
91Sample dissolution using microwave digestion system
(a) Weigh 05 g of phosphogypsum into a microwave container
(b) Add about 30 mg of Pb2+ (usually as Pb(NO3)2 solution) about 04 Bq of 209Po and 004 Bq of 232U tracer and 005 Bq of 225Ra in equilibrium with its parent 229Th
(c) Add 15 mL 65 HNO3
(d) Consecutively digest the sample in the microwave oven at 120degC for 15 min and at 150degC for 25 min at 1000 W
(e) Transfer the sample solution into a plastic centrifuge tube and centrifuged for 10 min
(f) Transfer the supernatant into a Teflon beaker The residue is transferred back into the microwave container with 3 mL of 65 HNO3 and add 2 mL of 40 HF
(g) Digest the residue in the microwave oven using the same condition as mentioned above
(h) Combine the solution with the supernatant from step (f)
(i) Add 01 g H3BO3 and evaporate repeatedly to dryness with three portions of 5 mL of 65 HNO3 to remove HF
(j) Dissolve the residue in 30 mL of 2M HCl
92Chemical separation procedures
921 Polonium and lead separation
(a) Prepare the Sr resin column with volume of approximately 8 mL (diameter 10 mm length 100 mm) as follows soak the resin in ultra pure water for at least 1 hour before use then fill the column with resin and put a quartz crystal layer of approximately 10 mm on the top avoiding disturbance of the resin The elution steps should be finished on the same working day
(b) Load the sample solution onto the Sr resin column preconditioned in advance with
9
100 mL 2M HCl flow rate 5-6 dropmin rinse the baker several times with 1 mL of 2M HCl
(c) Wash the column with 100 mL of 2M HCl followed by 25 mL 6M HNO3 to remove the non-retained ions
(d) Combine the effluent and the washing solution into same beaker and use it for the analysis of uranium and thorium
(e) Strip Po with 60 mL 6M HNO3 flow rate 5-10 dropsmin
(f) Elute Pb with 60 mL 6M HCl into the centrifuge tube flow rate 5-10 dropsmin
(g) Sr resin columns can be reused several times Regenerate with 50 mL ultra pure water wash it with 10 mL 01M EDTA (pH adjusted to pH7 with NH3(aq)) then wash with 50 mL ultra pure water and before use load it with 100 mL 2M HCl
922 Thorium separation
(a) Prepare the TEVA column with a volume of 14 mL (diameter 8 mm length 28 mm) as follows soak the resin in ultra pure water for at least 1 hour before use then fill the column with resin and put a quartz crystal layer of approximately 3 mm on the top avoiding disturbance of the resin
(b) Evaporate the combined effluent and washing solutions from Sr resin column (921 step (d))
(c) Dissolve the residue in 20 mL 3M HNO3
(d) Load the sample on the TEVA column preconditioned in advance with 20 mL 3M HNO3
(e) Wash the column with 10 mL 3M HNO3
(f) Combine the effluent and the washing solution into the same baker and use it for analysis of uranium
(g) Additionally wash the column with 20 mL 3M HNO3 this fraction is discarded
(h) Elute Th with 20 mL 8M HCl
(i) Note the time of the separation of Th for recovery calculation of 226Ra
923 Uranium separation
(a) Prepare the UTEVA column with volume 14 mL (diameter 8 mm length 28 mm) as follows soak the resin in ultra pure water for at least 1 hour before use then fill the column with the resin and put a quartz crystal layer of approximately 3 mm on the top avoiding the disturbance of the resin
(b) Load the combined effluent and the washing solution from the TEVA column (922 step (f)) onto UTEVA column preconditioned in advance with 20 mL of 3M HNO3
(c) Wash the column with 20 mL 3M HNO3
(d) Combine the effluent and the washing solution into the same beaker and use it for Ra analysis
(e) Wash the column with 5 mL 9M HCl and 15 mL 6M HCl to remove small amounts of Po and Th remained on the column
10
(f) Elute U with 6 mL ultra pure water
924 Radium separation [6]
(a) Combine the effluent (20 mL 3M HNO3) and the washing solution (30 mL 3M HNO3) from the UTEVA column in a 200 mL volume of beaker (923 step (b) and (c))
(b) Add 4 mL concentrated H2SO4 and 20 mL 20 Na2SO4 to the solution
(c) Slowly add 5 mL Pb2+ carrier (10 mgmL-1) to form a Pb(RaBa)SO4 co-precipitate while stirring for 1ndash2 minutes
(d) Remove stirrer bars washing with a small amount of 01M HCl and ultra pure water
(e) Allow to sit for 3ndash4 hours
(f) Decant supernatant liquor to a volume as low as possible
(g) Transfer the precipitate into a 50 mL conical centrifuge tube using 80 ethanol and centrifuge at 3000 revolutionsmin for 10 minutes
(h) Wash the precipitate with 20 mL 80 ethanol and decant the supernatant
(i) Wash the sides of the centrifuge tube with 5ndash10 mL sodium sulfate wash solution and vortex to mix thoroughly then add a further 5ndash10 mL to wash down the walls and then re-centrifuge at 3000 revmin for 10 minutes
(j) Pour out supernatant then invert the tube and wash the walls with ultra pure water to remove excess acid and sulfate (take care not to disturb the precipitate)
(k) Add 10 mL 02M DTPA (diethylenetriaminepentaacetic acid) and 1 drop of 025 thymol blue The solution should turn deep blue if not add 10M NaOH dropwise until a deep blue color is reached (pHgt9)
(l) Vortex to dissolve the precipitate
93Source preparation
931 Polonium-210 source
(a) The Po solution is carefully evaporated to dryness at less than 150degC
(b) Dissolve the residue in 10 mL 05M HCl
(c) Clean a silver disc with acetone followed by cc NH3(aq) followed by ultra pure water
(d) Place the cleaned silver disc into the deposition cell (Teflon vial) with another disc placed underneath for support Check if the cell is watertight
(e) Add 005 g ascorbic acid into the sample solution to reduce Fe3+ to Fe2+ check the colour change after mixing one drop of sample solution and one drop of 01M NH4SCN Add ascorbic acid until the dark red colour disappears
(f) Transfer the solution to the deposition cell
(g) Rinse the beaker with 2 x 2 mL 05M HCl and adjust the pH of the solution in the deposition cell to pH2 with 6M NaOH
(h) Place the deposition cell into a water bath at 90oC for 90 min with mechanical stirring or air bubbling
11
(i) Remove the silver disc wash with acetone or ultra pure water and dry it at room temperature
932 Uranium and thorium sources
(a) The purified U or Th solution is evaporated to dryness three times with a few mL 65 HNO3 to destroy any existing organic matter
(b) Dissolve the residues in 10 mL 10 (NH4)2SO4 solution at pH2 (The pH of samples being deposited for thorium should be slightly more acidic pH15-pH2)
(c) Transfer the solution into an electrodeposition cell
(d) Electrodeposit U or Th onto polished stainless steel discs at 1 A for 90 minutes respectively
(e) At the end of the deposition time fill the cell with 15M NH4OH and continue deposition for 1 min then turn off the main power of deposition unit and disconnect the cathode
(f) Rinse the cell twice with 1 NH4OH then three times with ultra pure water
(g) Disassemble the cell rinse the disc with ultra pure water and dry it
933 Radium source (BaSO4 micro co-precipitation)
(a) Rapidly add 4 mL mixed solution of 5 parts of 20 Na2SO4 with 1 part of acetic acid to the solution from the step 924 (l)
(b) Add 04 ml Ba seeding solution as soon as possible (2ndash3 s)
(c) Adjust pH to 48 with diluted H2SO4 as indicated by the colour change to a bright red
(d) Allow to sit for at least 30 minutes
(e) Filter the colloidal suspension of Ba(Ra)SO4 through a pre-wetted (by 80 ethanol) polypropylene filter (for example 01 microm pore size 25 mm diameter Pall)
(f) Rinse the centrifuge tube walls with 4ndash5 mL sodium sulfate wash solution and filter
(g) Rinse the sides of the filter holder with 15ndash20 drops 80 ethanol
(h) Allow the filter to dry and place it into a 47 mm Petri dish The time is recorded which is considered as the time of 225Ra225Ac separation or start of 225Ac ingrowth
The source preparation must be completed on the same day
934 Lead-210 source
(a) Evaporate the Pb solution which obtained from the step of 921(f) and re-evaporate with three portion of 5 mL 65 HNO3
(b) Dissolve the residue in 10 mL 1M HNO3
(c) Add 40 mg oxalic acid to the solution and adjust pH2ndash3 with 25 NH4OH to prepare a Pb-oxalate precipitate
12
(d) Let the solution to cool down and filtrate the precipitate on a filter paper (for example Whatman 41 dried in a drying oven and weighed in advance) wash the filter 3 times with 1 mL water and 2 mL 80 ethanol
(e) Dry the precipitate (40ndash50oC) and cool down in a desiccator
(f) Weigh the dried precipitate and calculate the chemical recovery using the gravimetric method
(g) Quantitatively transfer the precipitate into a liquid scintillation vial together with the filter and add 1 mL of 6M HNO3 into the vial to dissolve the precipitate
(h) Mix the solution with 15 mL of scintillation cocktail
94Measurement
941 Alpha-spectrometry
(a) Introduce the source into the vacuum chamber and pump until a vacuum of about 05 Pa (5 x 10⁻³ mbar) is obtained Then switch on the bias voltage button of detector
(b) Record the file name sample information (unit code sample name sample volume as it is required by the actual quality management system) and measurement date in each detector log book and start the measurement A typical measuring time is about 1 day when using a 450 mm2 area detector
(c) Integrate the counts in the peaks corresponding to the alpha emitting tracers and analytes respectively The alpha spectra should be similar to the spectra illustrated in Fig IV 4 of Appendix IV The FWHM of alpha peaks should be in the range of 30ndash60 keV
(d) Spectrum analysis Integrate the channel counts in a region of interest (ROI) which has the width of about 4 x FWHM (about 3 x FWHM to the left and 1 x FWHM to the right when FWHM is about 30ndash60 keV) Integrate the channel counts in the same regions of interest (ROI) in the sample spectrum and in the blank spectrum then subtract them from the sample spectrum to give the net area of peaks for further calculation
Performing a reliable measurement knowing the background of the chamber and detector is essential moreover it is important to prepare a separate reagent blank Therefore the set of measurement always has to involve above the samples a background and a reagent blank If the quality of the determination has to be proved a reference material also should be part of the preparation series
942 Liquid scintillation spectrometry for determination of 210Pb
9421Source preparation for determination of counting efficiency of 210Pb
(a) Take 10 mL 2M HCl solution into a 50 mL beaker
(b) Add the 210Pb standard solution (10ndash15 Bq) and 30 mg Pb2+ carrier to the solution
(c) Load the solution onto a Sr resin column (3 g of Sr resin 100-150 microm) which has been preconditioned in advance with 100 mL 2M HCl
(d) Wash the column with 80 mL 2M HCl Combine the washing solution with the effluent to get a pure 210Bi fraction
13
(e) Rinse the column with 20 mL 2M HCl This last portion of 20 mL 2M HCl is discarded to avoid overlapping between the 210Bi and 210Po portions
(f) Wash the column with 25 mL 6M HNO3
(g) Elute Po with 60 mL 6M HNO3
(h) Elute Pb with 60 mL 6M HCl
(i) Evaporate the Bi Po and Pb fractions to dryness
(j) Dissolve each portion of 210Bi and 210Po in 1 mL 6M HNO3 and then transfer them into 20 mL polyethylene vials coated with PTFE (polytetrafluoroethylene)
(k) Mix the solution with 14 mL scintillation cocktail
(l) Evaporate Pb fraction three times with 2 mL 65 HNO3
(m) Dissolve the residue in 20 mL 1M HNO3
(n) Add 04 g oxalic acid while warming and stirring
(o) Adjust the pH to 3ndash5 with NH4OH to form a Pb-oxalate precipitate
(p) Filter the precipitate through a pre-weighed filter paper (diameter of 24 mm)
(q) Wash the precipitate three times with 1 mL water followed by 2 mL 80 ethanol
(r) Dry the precipitate in an oven at 40ndash50oC
(s) Cool and weigh the precipitate to determine the chemical recovery of lead
(t) Carefully transfer the Pb-oxalate precipitate into a 20 mL of liquid scintillation vial together with the filter
(u) Add 1 mL 6M HNO3 to the vial to dissolve the precipitate
(v) Mix with 14 mL of scintillation cocktail
(w) Set up windows for 210Pb and 210Bi and count the three vials (for 210Pb 210Bi and 210Po) in a liquid scintillation counter until the counting statistic uncertainty is less than 1
9422Optimum window setting for 210Pb
The activity concentration of 210Pb is determined by LSC adjusted to the low energy mode and low bias with double energetic window method [7] For the successful determination of this radionuclide two counting windows should be optimized because of the overlapping of the beta spectra of 210Pb and 210Bi The result of the optimization of counting region is shown in the Fig V 1 of Appendix V In this example the lower limit for the 210Pb energy (window A) is set at channel 115 to avoid the counts caused by chemiluminescence in the cocktail while the upper limit is set at channel 320 where the 210Pb peak ends The lower limit for the 210Bi energy region (window B) is set at channel 320 and the upper limit is set at channel 410 to avoid interference from the 210Po peak
9423 Counting efficiency of 210Pb
The efficiency of liquid scintillation for beta particles depends on the energy of the beta decay For most beta particles with a maximum beta-energy above 100 keV efficiency is high more than 90 For lower energy beta particles the efficiency is usually less and the real value depends on the degree of quenching in the sample
14
To determine the efficiency a known activity of 210Pb in equilibrium with its daughters has to be measured several times (it is practical to choose more than 10 times of counting for getting a good estimate of the uncertainty in the efficiency)
10 EXPRESSION OF RESULTS
101 Calculation of activities of relevant isotopes
1011 Calculation of the activity of 210Pb
10111 Calculation of the counting efficiency of 210Pb
The counting efficiency (ε) of 210Pb can be calculated by Eqs (1 2)
TsPb tPbTPbstdcal emaR
Z210
210210minusminus
minusminus
= λε ( 1 )
BAnBnA frrZ minus= ( 2 )
where
BBgBnAAgAn rrrrrr 00 minus=minus=
fAB Tailing factor (See Ch 10112)
Rcal Chemical recovery of making the calibration source (See Ch 10113)
10112 Calculation of the tailing factor
The 210Pb energy region (window A) is interfered with counts from ingrown 210Bi The interference is compensated for by using the ratio of counts in window A to those in window B in a pure 210Bi spectrum the so-called ldquotailing factorrdquo fAB The tailing factor is independent of the activity level of 210Bi in the sample but is dependent on the quenching level of the sample The quenching levels of the calibrant the sample and the reagent blank are necessary to keep constant within plusmn2 relative standard deviation The tailing factor can be calculated by the following formula
210
210
minus
minus=BistdBn
BistdAnBA r
rf (3)
where BBistdBgBistdBnABistdAgBistdAn rrrrrr 02102100210210 minus=minus= minusminusminusminus
10113 Chemical recoveries of Pb in calibration source and sample
The chemical recovery of lead in the calibration source preparation process is determined gravimetrically using Eq (4)
15
ccPb
calfcalofgcal mC
mmfR
minus
minus=
)( ( 4 )
When the amount of Pb in the sample is not negligible compared with that in the Pb carrier the sample Pb content should be allowed for in calculation of the chemical recovery of Pb The chemical recovery of Pb in the sample can be calculated by Eqs (5 6)
)(
)(
ssPbccPb
fofg
mCmC
mmfR
minusminus +minus
= ( 5 )
Mass ratio (fg) of atomic mass of Pb to molar mass of Pb-oxalate
oxalatePb
Pbg M
Mf
minus
= (6 )
10114 Calculation of the activity of 210Pb
The activity of 210Pb on the separation date can be calculated from the LSC measurement using the following equations
Rm
ffZa
s
PbPbsPb ε
minusminusminus = 32
210 (7)
22102
tPb
Pbef minusminusminus = λ ( 8 )
321013210
3 tPb
PbPbe
tf
minusminus= minus
minus λλ
(9 )
However if the time interval (t2) between the separation of 210Pb and the beginning of the measurement and the counting time of the sample (t3) are much smaller than the half life of 210Pb (222 y) f2-Pb f3-Pb u(f2-Pb) and u(f3-Pb) are negligible
1012 Calculation of the activity of 210Po
The activity of 210Po on the separation date is calculated according to the procedure detailed in IAEAAQ12 [8]
1013 Calculation of the activities of the U and Th isotopes
The ratio of the net counts of the tracer and analyte peak is used to calculate the activity of the analyte in the sample on the date of chemical separation taking into account the activity of the tracer solution the masses of the sample and the tracer used The activity of the analyte (as Bq(kg dry)-1) at the separation time is calculated by the following formula
16
TgT
g
s
TTTTT
nTs
nTs rr
rr
m
fmCfm
rm
rCa
0
0
minusminus
== (16)
The decay of the tracer between its reference date (from the certificate) and counting is taken into correction by fT as follows
sTT t
T ef λminus= (17)
The activity of analyte in the sample should be calculated back to the date of sample collection
teaa
λminus=0 (18)
The detector efficiency is not needed in isotope dilution alpha spectrometry for calculation of the activity of the analyte but is needed for calculation of the chemical recovery It is determined from the activity of the tracer added and the net counts in the corresponding peak as follows
sTT t
TT
nT emC
rR λ
εminus= (19)
The detector efficiency is determined by the calibration source prepared in a similar way as the analytes and using the same measurement conditions For analytes which are co-precipitated the calibration source also should be co-precipitated using the same conditions including filter diameter For analytes which are electrodeposited the calibration source should also be prepared by electrodeposition Efficiency determinations are typically performed and regularly checked in the frame of analytical quality control The efficiency can be calculated according to the following equation
cal
caln
A
r =ε (20)
Where
Rn cal net count rate of calibration source in respective ROI
Acal certified activity of the calibration source
1014 Calculation of the activity of 226Ra [9]
10141 Calculation of the chemical recovery of Ra
The chemical recovery is determined by using the peak of 217At at 70669 keV (Pα 0999 32) The ingrowth of 225Ac (T12 100 d) the daughter of 225Ra is directly associated with the short lived progenies 221Fr (T12 48 min) 217At (T12 323 ms) and 213Po (T12 37 micros) When the daughters are in equilibrium with 225Ra the 217At peak shows no overlap with descendants of natural isotopes of radium in the alpha spectrum (225Ac interferes with 224Ra 221Fr interferes with 220Rn) From the initial tracer activity AT (added 229Th225Ra) the maximum detectable count rate rnTmax is calculated by taking into account the decay of unsupported 225Ra after its separation from Th (tsTh-229) as well as the build-up of 225Ac (tsRa-225) in the following equation
17
225225
225)(max
229225225
minusminus
minusminusminus
minus= minusminusminus
RaAc
ActtTnT
sThsRaRaeArλλ
λε λ (21)
The chemical recovery R is calculated as ratio of the measured count rate rnT and theoretical value rnTmax
maxnT
nT
r
rR = (22)
10142 Calculation of activity of 226Ra
While AT is the activity of the 225Ra tracer after the separation from 229Th its activity at the beginning of the build-up of 225Ac is yielded as follows
)(225
225225 sAcRa ttTRa eAA minusminus
minusminusminus= λ
( 2 4 )
The activity of 225Ac in any time is given by
( )225225
)()(225225
225
225225225225
minusminus
minusminusminusminusminusminus
minus minusminus=
minusminusminusminus
RaAc
ttttRaAc
Ac
AcAcAcRa eeAA
λλλ λλ
(25)
Integrating over the counting period with tm as the start and tem as the end of the measurement results into the activity of 225Ac at tem
( )( )( ) ( )( )
minusminusminus
= minusminusminusminus minusminusminusminus
minusminusminus
minusminusminus
225225225225
225225225
225225225
1)( AcemRaAcmRa tttt
RamemRaAc
AcRaemmAc ee
ttAttA λλ
λλλλ
( ) ( )( )
minusminus minusminusminusminus minusminusminusminus
minus
225225225225
225
1AcemAcAcmAc tttt
Ac
ee λλ
λ (26)
Finally the activity concentration of 226Ra is the following
217
226225226 )(
minus
minusminusminus =
At
RaemmAcRa r
rttAA (27)
where
0
0226226226 t
n
tt
nr Ra
mem
RaRa
minusminusminus minus
minus= and
0
0217217217 t
n
tt
nr At
mem
AtAt
minusminusminus minus
minus=
102 Expression of combined uncertainties of relevant isotopes
According to the Guide to Expression of Uncertainty in Measurement [11 12] the combined uncertainty is described in detail and an example is calculated for each relevant radionuclide in Appendix VI
18
103 Decision threshold
In accordance with ISO 119292010 the decision threshold gives a decision on whether or not the physical effect quantified by the measurand is present
The decision threshold a is the non-negative measurand quantifying the physical effect of interest If the result a is below the decision threshold the result can not be attributed to the physical effect nevertheless it can not be concluded that it is absent If the physical effect is really absent the probability of taking the wrong decision that the effect is present is equal to the specified probability of α (the error of first kind often chosen 005 and moreover α=β where β is the error of second kind then k1-α=k1-β=165) Any of the determined primary measurement result is only significant for the true value of the measurand to differ from zero if it is larger than the decision threshold given here
a=k1-αu(0) where u(0) is the uncertainty associated to the non-negative measurand uncertainty of decision threshold itself (with other words it can be estimated as uncertainty associated to slightly higher values than background or reagent blank depending on the procedure) and can be quantified here as
20
0
03
01)0(
t
n
tt
n
Rmu
s
+=ε
(28)
104 Detection limit
In accordance with ISO 119292010 the detection limit indicates the smallest true value of the measurand which can be still detected with the applied procedure this gives a decision on whether or not the measurement procedure satisfies the requirements and is therefore suitable for the intended measurement purpose In order to find out whether a procedure is suitable for the purpose the detection limit is compared with the specified guideline value of the measurand
The detection limit a is the smallest true value of the measurand for which the probability of the wrong assumption that the physical effect is absent does not exceed the probability β (error of the second kind) The detection limit is obtained as the smallest solution of the following equation
a=a+k1-β(a) where a ge a (29)
Eq (29) is an implicit equation which can be calculated by iteration As a starting approximation a1=3a can be chosen in most cases the iteration converges and the linear interpolation with approximation of a=(k1-α+k1-β)u(a) leads to the approximation
)0()( 221
21
2 ukkqqa αβ minusminus minus++= (30)
with [ ]
minus+= minusminus )0()(
2
1)0( 2
12
1
21
1 uaua
kukq a
β (31)
If α=β than k1-α=k1-β=k a=2q follows
19
[ ])0()()0(2 21
2
1
2 uau
a
kuka minus+= (32)
Where α is the probability of the error of first kind the probability of rejecting a hypothesis if it is true and β is the probability of the error of second kind the probability of accepting a hypothesis if it is false
The detection threshold and limit of the isotopes in the applied procedure are described in Table VII 1 of Appendix VII
The difference between using the decision threshold and using the detection limit is that the measured values are to be compared with the decision threshold whereas the detection limit is to be compared with the guideline value (guideline value corresponds to scientific legal or other requirements for which the measuring procedure intended to assess)
11 VALIDATION OF THE PROCEDURE
The procedure was validated with an IAEA reference material IAEA-434 The material was initially characterized at IAEA Environment Laboratories in Seibersdorf during the feasibility study phase Then the characterization of the material took place within the interlaboratory comparison piloted by IAEA Environment Laboratories in Seibersdorf in cooperation with the Consultative Committee on Ionization Radiation (CCRI) of the International Bureau des Poids et Mesure (PIBM) The results reported in this comparison were used to derive the property values of the measurands of interest The IAEA-434 reference material [12] was collected from a processing plant located in Gdansk (Poland) in 2003 The matrix composition is CaSO4middot2H2O (96) P2O5 (1-2) F total (12) SiO2 (1) Al2O3 (02) The property values of all radionuclides of IAEA 434 were established on the basis of a robust approach proposed by DL Duewer [13] and the Mixture Model median (MM-median) of the analytical results reported by the expert laboratories was calculated To estimate the standard uncertainty associated with the property value the MM-median based standard deviation was calculated from the span of the central 50 of the MM probability density function The validation results of the procedure are shown in Tables VIII 1 and VIII 2 Figs VIII 1ndashVIII 7 of Appendix VIII 111 Trueness of the method
The relative bias of the method is calculated by the following formula
100() timesminus=C
CXδ (34)
112 Precision of the method
The precision index ( PI() ) is calculated according to the following formulas
100)()(
()2
2
2
2
times+=X
Xu
C
CuPI (35)
20
113 Repeatability limit
The repeatability limit is estimated by analyzing five subsamples from the same bottle of the IAEA-434 reference material for the relevant radionuclides investigating the repeatability conditions instrument analyst shortest time etc The repeatability limit is calculated by the following formula
rL Sr 82= (36)
114 Reproducibility limit
The reproducibility limit is also estimated by analyzing the IAEA-434 reference material from ten duplicates samples were taken from ten randomly selected packing unit with at least one parameter being changed in the analytical system (analyst analysis date instrument etc) The reproducibility limit is calculated by the following formula
RL SR 82= (37)
115 Outlier test
The presence of individual values that appear to be inconsistent with all other laboratories or values may cause some problems during the final evaluation of data According to ISO 5725-2 an outlier test should be performed before the calculation of repeatability and reproducibility The analysis includes a systematic application of a statistical test of outliers a great variety are available which could be used for the purposes of this part of ISOIEC 17025 Usually the graphical consistency technique or the numerical outlier test are applied Cohranrsquos test of variabilities should be applied first and then any necessary action should be taken Grubbrsquos test is primarily a test of in between laboratory variability
116 Acceptance criteria
The method can be accepted if
PI()lt 25
LRltδ ( 3 8 )
According to these criteria the method performs well as the Table VIII 1 of Appendix VIII shows
12 TEST REPORT
The test report shall conform to ISOIEC 17025 requirements and shall contain the following information
bull a title (test report calibration report reference material production etc)
bull the name and address of the laboratory and location where any part of the test or calibration or production of reference material etc were carried out
bull unique identification of the report on each page with numbering of pages
21
bull analysis request code
bull reference to the measurement method used
bull sampling date (if available)
bull sample description
bull sample code or identification number
bull date of the separation of analyte
bull applied tracers with their reference dates and activity values with the code of their certificate
bull the results with units of measurement and associated uncertainty value expressed in the same unit as the result
bull date to which the test result has been corrected (corrected to the sampling date or separation time dd-mm-yyyy)
bull responsible person (with accessibility)
22
REFERENCES
[1] FEDERAL REGISTER National emission standards for hazardous air pollutants 57 107 (1992) 23305-23320
[2] RUTHERFORD PM DUDAS MJ AROCENA JM Heterogeneous distribution of radionuclides barium and strontium in phosphogypsum by-product Sci Total Environ 180 (1996) 201-209
[3] NATIONAL COUNCIL ON RADIATION PROTECTION AND MEASUREMENTS Evaluation of Occupational and Environmental Exposures to Radon and Radon Daughters in the United States NCRP Report 78 (1984)
[4] MARTIN P HANCOCK GJ Routine analysis of naturally occurring radionuclides in environmental samples by alpha-particle spectrometry Supervising Scientist Report 180 (2004) httpwwwenvironmentgovaussdpublicationsssr180html
[5] INTERNATIONAL ATOMIC ENERGY AGENCY Reference Material IAEA-434 Naturally Occurring Radionuclides in Phosphogypsum IAEA Analytical Quality in Nuclear Applications Series No 17 IAEAAQ17 IAEA Vienna (2010)
[6] MEDLEY P BOLLHOumlFER A ILES M RYAN B MARTIN P Barium sulfate method for radium-226 analysis by alpha spectrometry Environmental Research Institute of the Supervising Scientist internal report 501 (2005)
[7] VAJDA N LAROSA J ZEISLER R DANESI P KIS-BENEDEK G A Novel Technique for the Simultaneous Determination of 210Pb and 210Po using a Crown Ether J Environ Radioactivity 37 (1997) 355-372
[8] INTERNATIONAL ATOMIC ENERGY AGENCY A Procedure for the Determination of Po-210 in Water Samples by Alpha Spectrometry IAEA Analytical Quality in Nuclear Applications Series No 12 IAEAAQ12 IAEA Vienna (2009)
[9] GUOGANG J TORRI G INNOCENZI P OZONE R Di LULLO A Determination of radium isotopes in mineral and environmental water samples by alpha-spectrometry J of Radioanalytical and Nuclear Chemistry 267 3 (2005) 505-514
[10] EURACHEMCITAC Guide Quantifying uncertainty in analytical measurement 2nd Ed(2000)
[11] INTERNATIONAL ATOMIC ENERGY AGENCY Quantifying Uncertainty in Nuclear Analytical Measurements IAEA-TECDOC-1401 IAEA Vienna (2004)
[12] SHAKHASHIRO A SANSONE U Technically Enhanced Naturally Occurring Radionuclides (TENORM) in Phosphogypsum The Interlaboratory Comparison CCRI(II)07-35 Metrologia (2009)
[13] DUEWER DL A Robust Approach for the Determination of CCQM Key Comparison Reference Values and Uncertainties Working document CCQM04-15 BIPM wwwbipminfoccCCQMAllowed10CCQM04-15pdf (2004)
23
[14] Monographie BIPM-5 Vol 1ndashMonographie BIPM-5 Vol 5
httpwwwnucleideorg Decay Data Evaluation Project (DDEP) accessed in October 2010
[15] NuDat 25 (Database at the US NNDC) httpwww-ndsiaeaorg accessed in October 2010
[16] HORWITZ et al A Novel Strontium-Selective Extraction Chromatographic Resin Solvent Extraction amp Ion Exchange 10 (1992) 313
[17] HORWITZ et al Extraction Chromatography of Actinides and Selected Fission Products Principles and Achievement of Selectivity presented at International Workshop on the Application of Extraction Chromatography in Radionuclide Measurement IRMM Geel 1998
[18] HORWITZ et al Separation and Preconcentration of Actinides by Extraction Chromatography Using a Supported Liquid Anion Exchanger Application to the Characterization of High-Level Nuclear Waste Solutions Analytica Chimica Acta 310 (1995) 63-78
[19] HORWITZ et al Separation and Preconcentration of Uranium from Acidic Media by Extraction Chromatography Analytica Chimica Acta 266 (1992) 25-37
[20] C-K KIM MARTIN P FAJGELJ A Quantification of measurement uncertainty in the sequential determination of 210Pb and 210Po by liquid scintillation counting and alpha particle spectrometry Accreditation and Quality Assurance 13 12 (2008) 691-702
[21] J KRAGTEN Calculating Standard Deviation and Confidence Intervals with a Universally Applicable Spreadsheet Technique Analyst 119 (1994) 2161ndash2165
24
APPENDIX I NUCLEAR DATA OF RELEVANT RADIONUCLIDES AND DECAY CHAINS OF U
AND Th SERIES
TABLE I 1 NUCLEAR DATA OF RELEVANT RADIONUCLIDES [14]
Radionuclide Half-life Disintegration modes
E (MeV) Probability ()
225Ac 100(1) d α 5580 5(14) 095(4)
α 5599 3(14) 0114(7)
α 5609 0(14) 109(5)
α 5637 3(14) 416(23)
α 5682 2(14) 131(4)
α 5686 4(14) 0021(14)
α 5723 1(14) 203(23)
α 5730 5(14) 16(3)
α 5731 6(14) 124(10)
α 5731 9(17) 90(5)
α 5797 7(14) 62(9)
α 5793 1(21) 189(20)
α 5804 2(14) 03
α 5829 6(14) 524(24)
217At 323(4) x 10-3 s α 6484 7(16) 0016 7(8)
α 6813 8(16) 0038 4(15)
α 7066 9(16) 99932(3)
133Ba 10540(6) y γ 0053 162 2(6) 214(3)
γ 0079 614 2(12) 265(5)
γ 0080 997 9(11) 329(3)
γ 0276 398 9(12) 716(5)
γ 0302 850 8(5) 1834(13)
γ 0356 012 9(7) 6205(19)
γ 0383 848 5(12) 894(6)
210Bi 5012(5) d β 1162 1(8) 99999 86(2)
212Bi 6054(6) min β 0633(2) 190(4)
β 0741(2) 145(29)
β 1527(2) 458(21)
β 2254(2) 5523(21)
α 6050 92(4) 251(1)
α 6090 02(4) 97(1)
221Fr 479(2) min α 6126 3(15) 151(2)
α 6243(2) 134(7)
α 6341 0(13) 828(2)
TABLE I 1 NUCLEAR DATA OF RELEVANT RADIONUCLIDES [14] (cont)
25
Radionuclide Half-life Disintegration modes
E (MeV) Probability ()
210Pb 2223(12) y β 0017 0(5) 802(13)
β 0063 5(5) 198(13)
γ 0046 539(1) 4252(40)
208Po 2898(2) y α 5114 9(14) 99995 8(4)
α 4220(15) 24(7)x10-4
209Po 115(13) y α 4885(2) 198(32)
α 4883(2) 792(32)
α 4622(5) 0548(7)
210Po 138376 3(17) d α 5304 33(7) 99998 76
α 4516 66(9) 0001 24(4)
213Po 370(5) x 10-6 s α 8375 9(25) 99995 0(5)
216Po 0150(5) s α 6778 6(5) 99998 1(3)
α 5988 6(10) 0001 9(3)
218Po 3094(6) min α 6002 35(9) 99976 9(32)
223Ra 1143(5) d α 5747 0(4) 900(20)
α 5716 23(29) 516(13)
α 5606 73(30) 252(5)
α 5539 80(90) 900(20)
224Ra 3627(7) d α 5448 81(16) 526(7)
α 5685 50(15) 9472(7)
γ 0240 986(6) 412(4)
225Ra 1482(19)d β 0316(5) 688(20)
β 0356(5) 312(20)
γ 0040 09(5) 300(7)
226Ra 1 600(7) y α 4601(1) 595(4)
α 4784 34(25) 94038(40)
228Ra 575(4) y β 00127(7) 30(10)
β 00256(7) 87(9)
β 00391(7) 49(10)
β 00395(7) 12(10)
220Rn 558(3) s α 5748 46(14) 0118(15)
α 6288 22(10) 99882(15)
222Rn 3823 2(8) d α 5489 48(30) 9992(1)
228 Th 69860(23) d α 5176 89(23) 020(2)
α 5211 08(22) 038(3)
α 5340 38(22) 262(2)
α 5423 28(22) 732(2)
TABEL I 1 NUCLEAR DATA OF RELEVANT RADIONUCLIDES [14] (cont)
26
Radionuclide Half-life Disintegration
modes E (MeV) Probability ()
229 Th 7 340(160) y α 5053(2) 660(10)
α 4978 5(12) 317(4)
α 4967 5(12) 597(6)
α 4901 0(12) 1020(8)
α 4845 3(12) 5620(20)
α 4814 6(12) 930(8)
230 Th 7538(30) x 104 y α 4687 0(15) 763(3)
α 4620 5(15) 234(10)
232 Th 1402(6) x 109 y α 3810 0(14) 0068(20)
α 3948 5(14) 210(13)
α 4011 2(14) 789(13)
234 Th 2410(3) d β 0105(10) 65(7)
β 0106(10) 141(12)
β 0198(10) 778(15)
γ 0063 30(2) 375(8)
232U 706(11) y α 5263 48(9) 306(6)
α 5320 24(9) 691(6)
233U 1592(2) x 105 y α 4824 2(12) 843(6)
α 4783 5(12) 132
234U 2455(6) x 105 y α 4603 5(7) 0210(2)
α 4722 4(7) 2842(2)
α 4774 6(7) 7137(2)
235U 704(1) x 106 y α 4322(4) 333(6)
α 4397 8(13) 5719(20)
α 4414 9(5) 301(16)
α 4502 4(7) 128(5)
α 4556 0(4) 379(6)
α 4596 4(13) 474(6)
236U 2343(6) x 107 y α 4445(5) 261(40)
α 4494(3) 738(40)
238U 4468(5) x 109 y α 4038(5) 013(3)
α 4151(5) 2233(50)
α 4198(3) 7754(50)
Emax for beta emitting radioisotopes
Data were taken from [15]
27
FIG I 1 Decay chain of 238U [4]
FIG I 2 Decay chain of 232Th [4]
28
APPENDIX II FLOW CHART FOR SEQUENTIAL SEPARATION OF 210Po 210Pb Th U AND 226Ra
IN PHOSPHOGYPSUM
29
APPENDIX III PROPERTIES OF RESINS
III1 Sr resin
FIG III 1 Structure of the Sr resin (wwweichromcom)
FIG III 2 Capacity factor of Sr resin in nitric acid (wwweichromcom) [16]
30
FIG III 3 Capacity factor of Sr resin in nitric acid (wwweichromcom) [17]
III2 TEVA resin
FIG III 4 Structure of the TEVA resin (wwweichromcom)
31
FIG III 5 Capacity factor of TEVA resin in nitric acid and hydrochloric acid (wwweichromcom) [18]
III3 UTEVA resin
FIG III 6 Structure of the UTEVA resin (wwweichromcom)
32
FIG III 7 Capacity factor of UTEVA resin in nitric acid and hydrochloric acid (wwweichromcom) [19]
33
APPENDIX IV ALPHA SPECTRA OF ANALYTES
FIG IV 1 Alpha spectrum of Po isotopes
FIG IV 2 Alpha spectrum of Th isotopes in phosphogypsum (with progeny)
228Th is resulted from 232U tracer spiked in the sample
34
FIG IV 3 Alpha spectrum of U isotopes
FIG IV 4 Alpha spectrum of 226Ra and its progeny (spiked with 225Ra)
35
FIG IV 5 Overlapping alpha spectra of U and Po isotopes
FIG IV 6 Overlapping alpha spectra of U and Th (with progeny) isotopes
36
APPENDIX V LIQUIDE SCINTILLATION SPECTRA
a)
b)
A window
(115-320 ch)
B window
(320 -410 ch)
210Po
210Pb
210Bi
210Bi
Co
unts
Ch
ann
elC
oun
tsC
han
nel
Channel number
a)
b)
A window
(115-320 ch)
B window
(320 -410 ch)
210Po
210Pb
210Bi
210Bi
Co
unts
Ch
ann
elC
oun
tsC
han
nel
Channel number
FIG V 1 Typical liquid scintillation spectra of beta-emitting 210Pb and 210Bi and alpha emitting 210Po (calibration sources) a) 210Pb 210Bi and 210Po spectra
b) pure 210Bi spectrum
37
APPENDIX VI CALCULATION OF THE COMBINED UNCERTAINTY
OF THE ACTIVITIES OF THE ANALYTES ON SAMPLING DATE
VI1 Uncertainty of the 210Pb result [20]
VI11 Uncertainty of counting efficiency of 210Pb
2
2
2
2
2210
2
210
2210
222
)()()()()()( )( PbTPbT
calcal
stdPbstdPb
Pbb mum
RuR
aua
utZuZ
u
minus+
minus+
minus++
= minusminus
minusεεελεεε (VI-1)
2
222
2 )()()()()( (Z) BABnBnBAAn furrufruu minus+minus+= (VI-2)
20
2 )()()( AAgAn rururu += (VI-3)
20
2 )()()( BBgBn rururu += (VI-4)
VI12 Uncertainty of the tailing factor fAB
The uncertainty of the tailing factor fAB is calculated according to following equations
2
210
210
2
210
210
)()()(
+
=
minus
minus
minus
minus
BicalnB
BicalnB
BicalAn
BicalAnBABA r
ru
r
ruffu (VI-5)
20
2210210 )()()( ABicalAgBicalAn rururu += minusminus (VI-6)
20
2210210 )()()( BBicalBgBicalBn rururu += minusminus (VI-7)
The uncertainty of counting efficiency for 210Pb can be calculated by Eq (VI-8)
2
2
2
2
2210
2
210
2210
222
)()()()()()( )( PbTPbT
calcal
stdPbstdPb
Pbb mum
RuR
aua
utZuZ
u
minus+
minus+
minus++
= minusminus
minusεεελεεε (VI-8)
2
222
2 )()()()()( (Z) BABnBnBAAn furrufruu minus+minus+= (VI-9)
20
2 )()()( AAgAn rururu += (VI-10)
20
2 )()()( BBgBn rururu += (VI-11)
38
VI13 Uncertainty of chemical recovery of Pb
Uncertainty of chemical recoveries of Pb in calibration source
minusminus+
minus+
= 2
2
2
2
2
2
cal )()(
)()(
)( )(R calfcalfcalof
calcalof
calfcalof
calg
g
cal mumm
Rmu
mm
Rfu
f
Ru
2
1
2
2
2
2
)()(
)()(
minus+
minus+
minus
minusminus
minusc
ccPb
cPbcalcPb
ccPb
ccal mumC
CRCu
mC
mR (VI-12)
The uncertainty of chemical recovery of Pb in the sample can be calculated
minusminus+
minus+
= 2
2
2
2
2
2
)()(
)()(
)( (R) ffof
offof
gg
mumm
Rmu
mm
Rfu
f
Ru
2
2
2
2
)()(
)()( c
ssPbccPb
cPbcPb
ssPbccPb
c mumCmC
CRCu
mCmC
mR
+minus+
+minus+
minusminus
minusminus
minusminus
2
1
2
2
2
2
)()(
)()(
+minus+
+minus+
minusminus
minusminus
minusminuss
ssPbccPb
sPbsPb
ssPbccPb
s mumCmC
CRCu
mCmC
mR (VI-13)
VI14 Uncertainty of mass ratio
The uncertainty of the mass ratio (fg) of atomic mass of Pb to molar mass of Pb-oxalate is calculated using the equations below
22
M Pb)(
+
=
minus
minus
oxalatePb
M
Pbgg M
u
M
uffu oxalatePb (VI-14)
The uncertainty of the molar mass of lead oxalate u(MPb-oxalate) can be derived by combining standard uncertainties in atomic masses of its constituents as shown in Table VI 1
39
TABLE VI 1 STANDARD UNCERTAINTIES OF ATOMIC WEIGHT AND THE GRAVIMETRIC FACTOR fg
Element Atomic weight
(gmol-1)
Quoted uncertainty (gmol-1)
Conversion factor
Standard uncertainty (gmol-1)
Mass ratio of atomic mass of Pb to
molar mass of Pb-oxalate
Uncertainty ofatomic mass
of Pb to molar mass of
Pb-oxalate
Pb 207215 2 0000 15 3 0000 087 0701 9 0000 002
C 12010 7 0000 8 3 0000 46
O 15999 4 0000 3 3 0000 17
VI15 Combined uncertainty of activity of 210Pb
The combined uncertainty of the 210Pb activity is calculated from Eq (VI-15)
minus+
minus+
minus+
= minusminusminusminus 2
2
2102
2
2102
2
210
2
2
2101 )()()()()( s
d
sPb
BA
sPb
nBnB
sPb
BAnA
sPb
Pbc mum
afu
Z
arru
Z
afru
Z
aau
2
1
23
2
3
21022
2
2
2102
2
2102
2
210 )()()()(
+
+
minus+
minus+ minus
minus
minusminus
minus
minusminusminusPb
Pb
sPbPb
Pb
sPbsPbsPb fuf
afu
f
aRu
R
au
aε
ε (VI-15)
)()( 210222 minusminusminus = PbPbPb utffu λ (VI-16)
210
210321033
)(
11)(
3210
3210
minus
minusminus
minus
minusminusminus
minusminus=
minus
minus
Pb
Pbt
t
PbPbPb
u
e
etffu
Pb
Pb
λλλ λ
λ
(VI-17)
However if the time interval (t2) between the separation of 210Pb and the beginning of the measurement and the counting time of the sample (t3) are much smaller than the half life of 210Pb f2-Pb f3-Pb u(f2-Pb) and u(f3-Pb) are negligible The uncertainties associated to components mentioned above can be calculated as follows
0
0
3
)(t
r
t
rru
Po
gn +=
minus
(VI-18)
0
0
3
)(t
r
t
rru t
Po
tgtn +=
minus
(VI-19)
minus+
+
= minusminusminus
minus2
2
2102
2
2102
2
210210 )()()( )( tn
tn
sPo
nn
sPo
TT
sPo
sPo rur
aru
r
aAu
A
aau
2
2
21022
2
2
2102
2
2102
2
210)()()()( T
T
sPo
PoPo
sPo
TT
sPo
ss
sPofu
f
afu
f
amu
m
amu
m
a
+
+
+
minus+ minus
minusminus
minusminusminus
40
2
1
3
2
3
210 )(
+ minus
minus
minusPo
Po
sPo fuf
a (VI-20)
)()( TTTt utffu λ= (VI-21)
)()( 210222 minusminusminusminus = PoPoPoPo utffu λ (VI-22)
210
210321033
)(
11)(
3210
3210
minus
minusminus
minus
minusminusminus
minusminus=
minus
minus
Po
Pot
t
PoPoPo
u
e
etffu
Po
Po
λλλ λ
λ (VI-23)
VI16 Combined uncertainty of activity of 210Po
The uncertainty of the activity of 210Po on the separation date is calculated according to IAEAAQ12 procedure [8]
VI2 Uncertainty of other alpha emitting isotopes
The same formulas are used to calculate the combined uncertainties as equations that are used for calculation of the activity of alpha emitting analytes at the separation time and the sampling date as well as the chemical recovery and counting efficiency These formulas have to be applied in the spreadsheet approach for calculating the combined uncertainties knowing the standard uncertainty of each component VI3 Spreadsheet approach
For the quantifying the uncertainties the spreadsheet technique [21] was used which could be summarised as follows and showed in the Fig VI 1
bull Calculate function y using parameter xj
y=f(x1x2xj xn) (VI-24)
bull recalculate the same function n times increasing xj to xj+dxj (dxj standard deviation) and keeping the remaining parameters constant
y=f(x1x2xj+dxj xn) (VI-25)
bull the uncertainty on the function dy is the square root of the sum of squares
( )sum minus=n
jyydy1
2 (VI-26)
bull The individual variance contribution fj is
( )( )sum minus
minus=
n
j
jj
yy
yyf
1
2
2
(VI-27)
41
FIG VI 1 Spreadsheet approach for quantifying the uncertainty of the measurement
The results are summarised for the individual isotopes in the Tables VI 2ndashVI 9 and the results of the individual analysis with their uncertainties are shown in the Figs VI 3ndashVI 9 The detailed study about the usual contributors of uncertainty in the nuclear analytical techniques could be found in the IAEA-TECDOC-1401 [11] TABLE VI 2 AN EXAMPLE OF QUANTIFYING UNCERTAINTIES OF 210Po RESULT
Symbol unit Value of variable
Uncertainty Conversion factor to standard uncertainty
Standard uncertainty
Contribution to combined
uncertainty ()
m g 0508 9 0007 3 3 0004 2 010
rgt s-1 0197 0075 1 0075 361
r0t s-1 0000 017 0000 034 1 0000 034 0000 014
rg s-1 0081 0029 1 0029 6352
r0 s-1 0000 034 0000 033 1 0000 033 0000 08
at Bq 0829 0019 1 0019 0252
λt d-1 0000 019 0000 013 1 0000 013 negligible
λPo d-1 0005 72 x 10-9 1 72x10-9 negligible
ft 0982 14 0000 43 1 0000 43 0000 091
f2-Po 1005 73 x 10-9 1 73x10-9 negligible
f3-Po 1005 5 18 x 10-8 1 18 x10-8 negligible
aPo1 Bqmiddotkg-1 672 94
contribution is less than 1 x 10⁻⁵
TABLE VI 3 AN EXAMPLE OF QUANTIFYING UNCERTAINTIES OF EFFICIENCY OF 210Pb
Symbol unit Value of variable
Uncertainty
Conversion factor to standard
uncertainty
Standard uncertainty
Contribution to combined
uncertainty ()
mvial g 14936 35 0000 1 3 0000 17 0004 8
42
Symbol unit Value of variable
Uncertainty
Conversion factor to standard
uncertainty
Standard uncertainty
Contribution to combined
uncertainty ()
mvial+carrsol g 16036 54 0000 1 3 0000 17 0004 8
cPb g g-1 0027 42 0000 021 1 0000 021 011
mvial g 16036 72 0000 10 3 0000 17 0004 8
mvial+std g 17132 6 0000 10 3 0000 17 0004 8
astd Bq 1245 0189 1 0189 805
fgravimetry 0701 85 0000 41 1 0000 41 0066
mfilter g 0036 54 0000 10 3 0000 17 42
mfilter+Pb-precipitate g 0073 77 0000 10 3 0000 17 41
rA s-1 7362 0041 1 0041 76
rA0 s-1 0029 5 0003 1 0002 7 0035
rB s-1 0416 0 0011 1 0011 060
rB0 s-1 0011 7 0002 1 0002 2 0024
fAB 1049 0023 1 0023 040
t12 Pb d 814508 7305 1 731 23
tmeas-ref d 4 532 -
ε 0859 7 0015 3
43
TABLE VI 4 AN EXAMPLE OF QUANTIFYING UNCERTAINTIES OF 210Pb RESULT
Symbol unit Value of variable
Uncertainty Conversion factor to standard uncertainty
Standard uncertainty
Contribution to combined
uncertainty ()
ms g 0508 9 0007 3 3 0004 2 03
rgA s-1 0283 0035 1 0035 883
r0A s-1 0011 7 0002 2 1 0002 2 03
rgB s-1 0031 0009 1 0009 58
r0B s-1 0005 6 0002 3 1 0002 3 04
Ζ s-1 0245 1 0032 7 1 0032 7 -
fAB 1015 3 0012 9 1 0012 9 001
ε 0859 7 0015 3 1 0015 3 13
R 0858 8 0025 3 1 0077 2 35
aPb1 Bqmiddotkg-1 652 12
TABLE VI 5 AN EXAMPLE OF QUANTIFYING UNCERTAINTIES OF 234U RESULT
Symbol unit Value of variable
Uncertainty Conversion factor to standard uncertainty
Standard uncertainty
Contribution to combined
uncertainty ()
ms g 0508 9 0007 3 3 0004 2 003
rgt s-1 0021 78 0008 01 1 0008 369
r0t s-1 0000 030 0000 022 1 0000 022 0000 5
rg s-1 0016 15 0005 90 1 0006 628
r0 s-1 0000 016 0000 022 1 0000 022 0000 1
at Bq 0088 35 0002 10 1 0002 01 029
aU-234_1 Bqmiddotkg-1 129 3
TABLE VI 6 AN EXAMPLE OF QUANTIFYING UNCERTAINTIES OF 238U RESULT
Symbol unit Value of variable
Uncertainty Conversion factor to standard uncertainty
Standard uncertainty
Contribution to combined
uncertainty ()
ms g 0508 9 0007 3 3 0004 2 003
rgt s-1 0021 78 0008 01 1 0008 353
r0t s-1 0000 030 0000 022 1 0000 022 0000 5
rg s-1 0015 61 0005 67 1 0006 644
r0 s-1 0000 009 0000 008 1 0000 008 0000 1
at Bq 0088 35 0002 10 1 0002 1 028
aU-238_1 Bqmiddotkg-1 124 3
44
TABLE VI 7 AN EXAMPLE OF QUANTIFYING UNCERTAINTIES OF 230Th RESULT
Symbol unit Value of variable
Uncertainty Conversion factor to standard uncertainty
Standard uncertainty
Contribution to combined
uncertainty ()
ms g 0508 9 0007 3 3 0004 2 005
rgt s-1 0022 63 0006 44 1 0006 387
r0t s-1 0000 077 0000 063 1 0000 063 0006 1
rg s-1 0028 38 0007 90 1 0008 608
r0 s-1 0000 012 0000 010 1 0000 010 0000 1
at Bq 0090 03 0002 30 1 0002 303 051
aTh-230_1 Bqmiddotkg-1 223 9
TABLE VI 8 AN EXAMPLE OF QUANTIFYING UNCERTAINTIES OF 232Th RESULT
Symbol unit Value of variable
Uncertainty Conversion factor to standard uncertainty
Standard uncertainty
Contribution to combined
uncertainty ()
ms g 0508 9 0007 3 3 0004 2 004
rgt s-1 0022 63 0006 44 1 0006 265
r0t s-1 0000 077 0000 063 1 0000 063 0004 2
rg s-1 0000 28 0000 10 1 0000 1 727
r0 s-1 0000 011 0000 008 1 0000 008 048
at Bq 0090 03 0002 30 1 0002 3 035
aTh-232_1 Bqmiddotkg-1 21 009
TABLE VI 9 AN EXAMPLE OF QUANTIFYING UNCERTAINTIES OF 226Ra RESULT
Symbol unit Value of variable
Uncertainty Conversion factor
to standard uncertainty
Standard uncertainty
Contribution to combined
uncertainty ()
ms g 0508 9 0007 3 3 0004 2 003
rgt s-1 0043 10 0025 05 1 0025 05 603
r0t s-1 0000 111 0000 128 1 0000 128 0004
rg s-1 0063 32 0018 78 1 0018 78 393
r0 s-1 0000 070 015 0000 070 013 1 0000 070 013 0000 5
at Ra-225 Bq 0779 50 0022 53 1 0022 53 04
λAc225 d-1 0069 315 0000 624 1 0000 624 0000 02
λRa225 d-1 0046 520 0000 693 1 0000 693 008
t1-t0 d 337
aRa-226_1 Bqmiddotkg-1 766 39
45
APPENDIX VII DETECTION THRESHOLD AND LIMIT OF THE APPLIED PROCEDURE
TABLE VII 1 TYPICAL DECISION THRESHOLD AND DETECTION LIMIT FOR RELEVANT ISOTOPES
Symbol unit 210Pb 210Po 234U 238U 230 Th 232 Th 226Ra
k 165 165 165 165 165 165 165
m kg 0000 5 0000 5 0000 5 0000 5 0000 5 0000 5 0000 5
ε 086 031 026 026 035 035 025
R 086 073 094 094 068 068 061
n0 52 16 4 4 6 6 28
Tg s 36 000 98 899 343 024 343 024 277 345 277 345 124 984
t0 s 35 542 548 190 512 901 512 901 559 286 559 286 446 755
a Bqmiddotkg-1 13 036 009 009 012 012 068
a1 Bqmiddotkg-1 38 11 028 028 036 036 205
u2(0) Bq2middotkg-2 29 015 0008 4 0008 4 0006 5 0004 7 078
u2(a1) Bq2middotkg-2 23 041 0059 0025 0028 0052 204
a Bqmiddotkg-1 24 12 052 019 018 019 43
46
APPENDIX VIII VALIDATION TEST RESULTS OF THE PROCEDURE
TABLE VIII 1 VALIDATION RESULTS FOR RELEVANT RADIONUCLIDES
Parameters 210Po 210Pb 234U 238U 230Th 226Ra
C Bq kg-1 680 680 120 120 211 780
X Bq kg-1 653 659 127 123 221 793
u(C) Bq kg-1 58 58 9 11 9 62
u(X ) Bq kg-1 23 22 5 5 10 35
δ() -40 -31 58 25 47 17
rL Bq kg-1 106 102 48 47 62 498
RL Bq kg-1 237 454 59 53 89 707
PI() 92 92 85 100 62 91
TABLE VIII 2 ANALYSIS OF VARIANCE (ANOVA) FOR 210Po 210Pb 238U 230Th AND 226Ra IN PHOSPHOGYPSUM
Nuclide SSwb SSbb MSwb MSbb Swb
(as CV)
Sbb
(as CV)
210Po 124 62 151 79 312 1687 271 254
210Pb 8385 197 54 210 2195 220 302
238U 314 386 785 429 227 215
230Th 2176 1598 544 178 334 225
226Ra 412 686 137 858 121 054
SSwb sum of squares within bottles
SSbb sum of squares between bottles
MSwb mean of squares within bottles
MSbb mean of squares between bottles
Swb standard deviation as percent of covalent variance within bottles
Sbb standard deviation as percent of covalent variance between bottles
47
550
600
650
700
750
0 10 20 30 40 50
Samples
Act
ivity
of
21
0 Pb
in th
e sa
mp
le (
Bq
kg
dry
)
Mean1σ
-2σ
-1σ
3σ
2σ
-3σ
FIG VIII 1 210Pb results with associated uncertainties
550
600
650
700
750
0 10 20 30 40 50Samples
Act
ivity
of
21
0 Po
in t
he s
ampl
e (B
qkg
dry
)
Mean
1σ
-1σ
3σ
2σ
-3σ-2σ
FIG VIII 2 210Po results with associated uncertainties
48
110
115
120
125
130
135
140
0 10 20 30 40 50
Samples
Act
ivity
of
238
U in
the
sam
ple
(B
qkg
dry
)
Mean
1σ
-1σ
3σ
2σ
-3σ
-2σ
FIG VIII 3 238U results with associated uncertainties
105
110
115
120
125
130
135
140
145
150
0 10 20 30 40 50
Samples
Act
ivity
of
23
4 U in
the
sa
mpl
e (B
qkg
dry
)
Mean1σ
-2σ-1σ
3σ2σ
-3σ
FIG VIII 4 234U results with associated uncertainties
49
190
200
210
220
230
240
250
0 5 10 15 20 25 30 35 40 45 50
Samples
Act
ivity
of
23
0 Th
in th
e s
am
ple
(B
qk
g d
ry)
2σ
3σ
1σ
-1σ
-2σ
-3σ
Mean
FIG VIII 5 230 Th results with associated uncertainties
05
10
15
20
25
30
35
40
0 10 20 30 40 50
Samples
Act
ivity
of
23
2 Th
in th
e sa
mp
le (
Bq
kg
dry
)
Mean
1σ
-2σ
-1σ
3σ
2σ
-3σ
FIG VIII 6 232 Th results with associated uncertainties
50
650
700
750
800
850
900
1 2 3 4 5 6 7 8 9 10 11 12 13 14 15 16 17 18 19 20
Sample
Act
ivity
of
226 R
a in
th
e sa
mp
le (
Bq
kg
dry
)
Mean
1σ
-1σ
3σ
2σ
-3σ
-2σ
FIG VIII 7 226Ra results with associated uncertainties
51
CONTRIBUTORS TO DRAFTING AND REVIEW
Hampe D Gaigl FA
Verein fuumlr Kernverfahrenstechnik und Analytik Rossendorf eV Dresden Germany IAEA Environment Laboratories Terrestrial Environment Laboratory Seibersdorf Austria
Kim C-K IAEA Environment Laboratories Terrestrial Environment Laboratory Seibersdorf Austria
Kis-Benedek Gy IAEA Environment Laboratories Terrestrial Environment Laboratory Seibersdorf Austria
Martin P IAEA Environment Laboratories Terrestrial Environment Laboratory Seibersdorf Austria
Mietelski J W The Henryk Niewodniczanski Institute of Nuclear Physics Polish Academy of Sciences Poland
Sansone U IAEA Environment Laboratories Terrestrial Environment Laboratory Seibersdorf Austria
Varga B Central Agricultural Office Food and Feed Safety Directorate Hungary

4
APPENDIX IV Alpha spectra of analyteshelliphelliphelliphelliphelliphelliphelliphelliphelliphelliphelliphelliphelliphelliphelliphelliphelliphelliphellip37
APPENDIX V Liquide scintillation spectrahelliphelliphelliphelliphelliphelliphelliphelliphelliphelliphelliphelliphelliphelliphellip37
APPENDIX VI Calculation of the combined uncertainty of the activities of the analytes on sampling datehelliphelliphelliphelliphelliphelliphelliphelliphelliphelliphelliphelliphelliphelliphelliphelliphelliphelliphelliphelliphelliphelliphelliphelliphelliphelliphelliphelliphelliphelliphellip41
APPENDIX VII Detection threshold and limit of the applied procedurehelliphelliphelliphelliphelliphelliphellip49
APPENDIX VIII Validation results of the procedure50
CONTRIBUTORS TO DRAFTING AND REVIEWhelliphelliphelliphelliphelliphelliphelliphelliphelliphelliphelliphelliphelliphelliphellip55
1
1 INTRODUCTION
Phosphogypsum is a by-product derived from the wet process production of phosphoric acid by reacting phosphate rock with sulfuric acid and represents one of the most serious problems facing the phosphate industry today Very large quantities of phosphogypsum have been produced world-wide since the 1950s because of the high demand for phosphate fertilizer and because the wet phosphoric acid process produces about 5 t of phosphogypsum for every tonne of phosphoric acid manufactured Most of the phosphogypsum produced world-wide is stock-piled There has been high interest in findings uses for this by-product for example as a building material or a soil amendment for the remediation of soils Both the acidic process liquid wastes and the phosphogypsum itself are potential sources of contamination The main problem associated with this material concerns the relatively high levels of natural radionuclides of uranium-series (Fig I 1) and other radioactive (Fig I 2) and non radioactive contaminants which could have an impact on the environment There is concern related to the possible contamination of groundwater under phosphogypsum stacks and to radon exhalation which may pose a health risk to people working and living close to a stack
The presence of radionuclides puts restrictions on the use of phosphogypsum in building materials and in soil amendments The United States Environmental Protection Agency (US EPA) ruled that phosphogypsum would only be permitted for use in agriculture if the average concentration of 226Ra in the phosphogypsum does not exceed 370 Bqkg-1 [1 2] National Council of Radiation Protection [3] guideline recommends 226Ra content of 15 Bqg-1 in soil above which growing human food crops on it is restricted In addition the US EPA adopted an average 074 Bqmiddotm-2middots-1 upper limit on 222Rn emission from phosphogypsum stacks The phosphogypsum currently produced is stockpiled near the production site Recently there is considerable demand for provision of a reference material with a phosphogypsum matrix from IAEA Member State laboratories which have phosphate industry Consequently IAEA has prepared and released a phosphogypsum reference material (IAEA-434) after performing the necessary homogeneity and characterization tests As a part of this work the procedure described in this report was developed Alpha emitters such as U and Th isotopes 210Po and 226Ra are generally measured by alpha-spectrometry after radiochemical separation while 210Pb being a beta emitter is determined by liquid scintillation spectrometry The relevant decay data of relevant radionuclides are in Table I 1 and Figures I 1ndashI 2 [4] of Appendix I The purpose of this work was to develop a sequential separation method combining the extraction chromatography with Sr resin TEVA and UTEVA and Ba(Ra)SO4 co-precipitation for sequential determination of 210Po 210Pb Th U and 226Ra in phosphogypsum The method validation of the procedure was carried out in terms of trueness repeatability and reproducibility with the IAEA-434 reference material
2
2 SCOPE
The sequential separation method is described for the determination of 210Po 210Pb 226Ra Th and U isotopes in phosphogypsum by isotope dilution alpha particle spectrometry and liquid scintillation spectrometry (LSC) The mass of the sample required for the radiochemical analysis is typically 05 g The method validation was carried out during the preparation of reference material of IAEA-434 and the world wide intercomparison run of IAEA-CU-2008-03 [5] The typical chemical recovery and detection limits of relevant radionuclides in the proposed procedure are summarised in the Table 1
TABLE 1 TYPICAL CHEMICAL RECOVERIES AND DETECTION LIMITS OF RELEVANT RADIONUCLIDES IN THE PROPOSED PROCEDURE
Isotope Counting method Source preparation Typical recovery () Typical detection
limit (Bqkg-1 as dry mass)
210Pb LSC precipitation 80-90 24
210Po α-spectrometry auto-deposition 40-70 12
234U α-spectrometry electrodeposition 70-80
052
238U 019
230Th α-spectrometry electrodeposition 70-80
018
232Th 052
226Ra α-spectrometry electrodeposition 60-80 43
3 NORMATIVE REFERENCES
bull ISO 119292010 Determination of the characteristic limits (decision threshold detection limit and limits of the confidence interval) for measurements of ionizing radiation ndash Fundamentals and application
bull ISO 170252005 General requirements for the competence of testing and calibration laboratories
bull ISOTS 217482004 Guidance for the use of repeatability reproducibility and trueness estimates in measurement uncertainty estimation
bull ISOIEC Guide 98-32008 Uncertainty of measurement ndash Part 3 Guide to expression of uncertainty in measurement
bull ISO 7870-12007 Control charts ndash Part 1 General guidelines
4 RESPONSIBILITIES
It is the responsibility of the analyst to follow this procedure and to establish appropriate safety and health practices Compliance with national and or internal safety rules or chemical and radioactive safety is obligatory Although the method has been carefully tested each laboratory should perform an individual validation procedure
3
5 TERMS AND DEFINITIONS SYMBOLS AND ABBREVIATIONS
In the following u(x) indicates the uncertainty in quantity x and generally the relevant isotope is indicated as subscript
a Decision threshold [Bqkg-1]
a Detection limit [Bqkg-1]
a0 Activity of the analyte on the sampling date [Bqkg-1]
astd Activity of the calibration standard [Bq g-1]
as Activity of the analyte on the separation date [Bqkg-1]
AT Activity of 225Ra tracer [Bq]
C Certified activity of the analyte in the reference material [Bqkg-1]
CPb-c Mass fraction of Pb carrier solution
CPb-s Mass fraction of Pb already present in the sample
CT Certified activity of tracer on the reference date [Bqg-1]
fAB Tailing factor correction of interfered windows A and B
fg Mass ratio of atomic mass of Pb to molar mass of PbC2O4
fT Correction factor for the decay of the tracer during elapsed time between the reference date of tracer and the beginning of the measurement
f2 Correction factor for decay of the analyte during elapsed time between the separation and the beginning of the measurement
f3 Correction factor for decay of the analyte over the counting time
mC Mass of the carrier taken (in case of lead mass of carrier solution) [g]
mf Mass of the filter used [g]
mfcal Mass of the filter used in calibration [g]
mof Total mass of PbC2O4 and the filter used [g]
mofcal Total mass of PbC2O4 and the filter used in the calibration [g]
ms Mass of the sample [kg]
mT Mass of the tracer taken [g]
mTPb Mass of the 210Pb standard solution added [g]
MPb Atomic mass of Pb [gmiddotmol-1]
MPb-oxalat Molar mass of PbC2O4 [gmiddotmol-1]
n Net counts in ROI of analyte [counts]
nT Net counts in ROI of tracer [counts]
n0 Blank or background counts in ROI of analyte [counts]
n0T Blank or background counts in ROI of tracer [counts]
Pα Probability of α decay
Pγ Probability of γ decay
4
r0 Blank or background count rate in ROI of analyte [countss-1]
r0T Blank or background count rates in ROI of tracer [countss-1]
rcal Count rates during the calibration [countss-1]
rn Net count rates in ROI of analyte [countss-1]
rnT Net count rates in ROI of tracer [countss-1]
rg Gross count rates in ROI of analyte [countss-1]
rgT Gross count rates in ROI of tracer [countss-1]
rnTmax Maximum detectable count rate [countss-1]
r0A r0B Count rates in windows A and B of the blank spectrum [countss-1]
rgA rgB and u(rgA) u(rgB) Gross count rates in windows A and B of 210Pb spectrum [countss-1]
rnA rnB Net count rates in windows A and B of 210Pb spectrum [countss-1]
R Chemical recovery of the analyte
Rcal Chemical recovery of making the calibration source
RL Reproducibility limit [Bqkg-1]
rL Repeatability limit [Bqkg-1]
SR Standard deviation of reproducibility [Bqkg-1]
Sr Standard deviation of repeatability [Bqkg-1]
t Time interval between the sampling date and the measurement date [s]
t0 Counting time of the blank or background [s]
tTs Time interval between the reference date of the tracer standard and the separation date [s]
t1 Time interval between the sampling date and the separation date [s]
t2 Time interval between the separation date and the start of the measurement [s]
t3 Counting time of the sample [s]
tT Counting time of the tracer [s]
tAc-225 Time of build up of 225Ac [s]
ts Time of the separation noted [s]
tm Time of the starting of the measurement [s]
tem Time of the end of the measurement [s]
u(0) Uncertainty of non-negative measurand
X mean value of measurement results of the analyte in reference material [Bqkg-1]
δ Relative bias of the test result []
ε Counting efficiency of the detector
λ Decay constant of the isotope [countss-1]
λT Decay constant of the tracer [countss-1]
FWHM Full width at half maximum
5
LSC Liquid scintillation counting (spectrometry)
NNDC National Nuclear Data Center Brookhaven National Laboratory
ROI Region of interest
PSA Pulse shape analysis
T12 Half-life of any isotope
6 PRINCIPLE
The sample is digested in a microwave digestion system Polonium-210 210Pb U and Th isotopes and 226Ra are separated from interfering elements with a sequential chemical procedure using extraction chromatographic resins and Ba(Pb)SO4 co-precipitation The flow chart of the combined procedure is given in Appendix II The most important features of the resins are shown in Appendix III (Sr resin TEVA and UTEVA see Figs III 1ndashIII 7) U and Th are electrodeposited on a polished stainless steel plate The polonium source is prepared on a silver plate by auto-deposition The 226Ra source is prepared by Ba(Ra)SO4 microco-precipitation The 210Pb source is prepared with Pb-oxalate precipitation Polonium-210 U Th isotopes and 226Ra are determined by isotope dilution alpha-spectrometry and 210Pb is determined by liquid scintillation spectrometry
7 CHEMICAL REAGENTS AND EQUIPMENT
71Tracers
The two tracers commonly used for 210Po determination are 208Po and 209Po Polonium-209 has a clear advantage over 208Po in energy separation from the 210Po peak and is the preferred tracer if available It should also be noted that 208Po solutions normally contain traces of 209Po A typical alpha spectrum of 209Po and 210Po is shown in Fig IV 1 of Appendix IV
Naturally occurring thorium can be determined by the following tracers 228Th and 229Th Both of them have short lived daughters which emit alpha-particles but as the energies of all their daughters are higher than 568 MeV thus no spectral interference occurs from ingrowth of daughters either 228Th or 229Th The 228Th daughter of 232U can be used as a tracer for the determination of 230Th and 232Th In this case the natural 228Th content in phosphogypsum should be measured or estimated separately to allow for this [4] An alpha spectrum of Th isotopes and its progeny is depicted in Fig IV 2 of Appendix IV
Naturally occurring uranium can be determined by the following tracers 232U 233U or 236U Among them 232U (containing 228Th daughter in known ratio close to 1) is applied most frequently The amount of 232U tracer to be added to the sample should be carefully calculated because this is the highest-energy uranium peak in the uranium spectrum and hence its tailing might affects other peaks in low energy region if the added concentration is too high A typical alpha spectrum of uranium isotopes is shown in Fig IV 3 of Appendix IV
In the case of 226Ra analysis several tracers such as 133Ba 223Ra 224Ra 225Ra might be applied Barium-133 is a most commonly used tracer for the determination of 226Ra (can be measured by gamma-spectrometry) A disadvantage of this tracer is that although its chemical behavior is very similar to that of Ra their chemical behavior is not identical as they are different elements Alternative is 225Ra (daughter of 229Th) which does not exist in nature and its decay does not produce radon which might escape from the source Radium-225 is both a beta and
6
gamma emitter with a gamma line at 4009 keV (Pγ 0300) which is well measurable with an n-type HPGe detector with carbon-epoxi or Be window Alternatively its descendants 225Ac 221Fr 217At are alpha-emitters and the determination of chemical recovery is possible via 217At at 7066 7 MeV (Pα 0999 32) using ingrowth decay equations [4] (Fig IV 4 of Appendix IV)
72Carrier
If there is no suitable radioactive tracer available the chemical recovery can be checked by using an inactive carrier namely a stable isotope of the same element as the radioactive analyte In the present case 30 mg Pb2+ carrier is used as Pb(NO3)2 solution for checking the chemical recovery of 210Pb determination gravimetrically
73Equipments
bull Standard laboratory equipment well exhausted fume-hood bull Microwave oven bull Alpha spectrometer with Si semiconductor detector bull Vacuum pump bull Liquid scintillation spectrometer bull Auto-deposition system bull Silver disk fitted to the auto-deposition cell diameter is equal or less than the
diameter of the detector used for alpha spectrometry bull Electrodeposition apparatus (Pt wire anode) equipped with DC power supply to
provide up to 1 A of regulated current to the electrolytic cell bull Stainless steel disc diameter is equal or less than the diameter of the detector used for
alpha spectrometry bull Analytical balances with accuracies of 01 mg and 001 g bull Hot plate with magnetic stirrer bull Burner bull Centrifuge plastic centrifuge tube (minimum 20 mL volume) bull Water bath with temperature controller bull Filtering set with filter paper for fine precipitate bull Chromatography columns with stopper control valve and funnel (250 mL) and holder
for them bull pH meter or pH papers bull Teflon beakers with Teflon tops and clips bull Dispensers 5-50 mL and 10-100 mL bull Micropipettes with dispensable tips (100-5000 microL) bull Timer bull Liquid scintillation vial 20 mL plastic (polyethylene) inner surface coated with
Teflon
74Chemical reagents
bull 30 mgmL-1 Pb2+ solution (usually as Pb(NO3)2) bull 04 Bq of 209Po tracer as a certified solution bull 004 Bq of 232U tracer as a certified solution bull 005 Bq of 225Ra in equilibrium with its parent 229Th as a certified solution bull HNO3 (65) (nitric acid)
7
bull HF (40) (hydrogen fluoride) bull H3BO3 (boric acid) bull HCl (32) (hydrochloric acid) bull Ultra pure water bull DTPA (diethylenetriaminepentaacetic acid) bull Sr resin (100-150 microm) bull TEVA resin bull UTEVA resin bull Cation exchange resin (AG-50W-X8 or Dowex-50) bull Fine clean quartz crystals (analytical grade) bull C6H8O6 (Ascorbic acid) bull NH4SCN (ammonium thiocyanate) bull EDTA (ethylenediaminetetraacetic acid) bull NH3(aq) (ammonia) bull (NH4)2SO4 (10) (ammonium sulfate) bull C2O4H2middot2H2O (oxalic acid) bull Methyl red solution (025) bull Thymol blue solution (025) bull Ba seeding solution [6] Weigh between 0012 and 0016 g of BaCl2 2H2O into a tall
150 mL quartz beaker Add approximately 04 mL of ultra pure water to completely dissolve the BaCl2 2H2O In a fume hood add 10 mL of the 70 sodium hydrogen sulfate solution and 2 drops of 72 HClO4 Evaporate the solution on a hot plate or a burner at high heat with continuous swirling until most of the excess sulfuric acid has been expelled and a pyrosulfate fusion is obtained Cool the beaker while rolling the melt around the sides so that the cake is deposited on the sides as uniformly as possible to facilitate rapid dissolution Cool the beaker and contents to room temperature in a desiccating chamber Add a solution of 50 mL 20 Na2SO4 to the beaker Swirl continuously until the cake is completely dissolved (place it in an ultrasonic bath for 10 minutes before each use if a build up of particulate matter occurs then make a fresh solution)
bull Sodium sulfate wash solution dissolve 100 g of anhydrous Na2SO4 in 2 L of 05 H2SO4 Filter through a 045 microm pore size membrane filter
bull CH3CH2OH (ethyl alcohol) bull Filter paper (for example Whatman 41) bull Polypropylene filter (for example Pall 01 microm pore size 25 mm diameter) bull Scintillation cocktail which forms a gel (for example InstaGel Plus) or suitable for
alphabeta separation All the chemical reagents needed to carry out this procedure must be analytical grade
8 PRECAUTIONS
Do not ash the sample if 210Po determination is required gently drying is allowed but not higher than 80oC
During the handling of the ion exchange chromatography columns always keep several mm of liquid above the surface of resin do not allow it to become dry during the separation steps
Labeling of the different fraction is essential to avoiding mixing solutions this includes the different load solutions and chemicals
8
The complete separation of Po from U is important because 210Po (Eα 5263 MeV) can interfere with the alpha peak of 232U (Eα 5320 MeV) and its activity is much higher than of U in phosphogypsum In addition 209Po (Eα 4866 MeV) can interfere with the alpha peak of 234U (Eα 4766 MeV) These are shown in Fig IV 5 of Appendix IV
The complete separation of Th from U is also important because several peaks in the spectra overlap as it is shown on Fig IV 6 of Appendix IV
Applying 225Ra as a yield tracer for the determination of 226Ra the radiochemical procedure needs to include steps to guarantee the complete separation of the parentprogeny couples 229 Th225Ra and 225Ra225Ac
9 PROCEDURE
This procedure consists of the sample dissolution the sequential separation of 210Po 210Pb Th and U isotopes and 226Ra from interfering elements and the source preparation for alpha spectrometry and liquid scintillation spectrometry (see the flowchart in Appendix II)
91Sample dissolution using microwave digestion system
(a) Weigh 05 g of phosphogypsum into a microwave container
(b) Add about 30 mg of Pb2+ (usually as Pb(NO3)2 solution) about 04 Bq of 209Po and 004 Bq of 232U tracer and 005 Bq of 225Ra in equilibrium with its parent 229Th
(c) Add 15 mL 65 HNO3
(d) Consecutively digest the sample in the microwave oven at 120degC for 15 min and at 150degC for 25 min at 1000 W
(e) Transfer the sample solution into a plastic centrifuge tube and centrifuged for 10 min
(f) Transfer the supernatant into a Teflon beaker The residue is transferred back into the microwave container with 3 mL of 65 HNO3 and add 2 mL of 40 HF
(g) Digest the residue in the microwave oven using the same condition as mentioned above
(h) Combine the solution with the supernatant from step (f)
(i) Add 01 g H3BO3 and evaporate repeatedly to dryness with three portions of 5 mL of 65 HNO3 to remove HF
(j) Dissolve the residue in 30 mL of 2M HCl
92Chemical separation procedures
921 Polonium and lead separation
(a) Prepare the Sr resin column with volume of approximately 8 mL (diameter 10 mm length 100 mm) as follows soak the resin in ultra pure water for at least 1 hour before use then fill the column with resin and put a quartz crystal layer of approximately 10 mm on the top avoiding disturbance of the resin The elution steps should be finished on the same working day
(b) Load the sample solution onto the Sr resin column preconditioned in advance with
9
100 mL 2M HCl flow rate 5-6 dropmin rinse the baker several times with 1 mL of 2M HCl
(c) Wash the column with 100 mL of 2M HCl followed by 25 mL 6M HNO3 to remove the non-retained ions
(d) Combine the effluent and the washing solution into same beaker and use it for the analysis of uranium and thorium
(e) Strip Po with 60 mL 6M HNO3 flow rate 5-10 dropsmin
(f) Elute Pb with 60 mL 6M HCl into the centrifuge tube flow rate 5-10 dropsmin
(g) Sr resin columns can be reused several times Regenerate with 50 mL ultra pure water wash it with 10 mL 01M EDTA (pH adjusted to pH7 with NH3(aq)) then wash with 50 mL ultra pure water and before use load it with 100 mL 2M HCl
922 Thorium separation
(a) Prepare the TEVA column with a volume of 14 mL (diameter 8 mm length 28 mm) as follows soak the resin in ultra pure water for at least 1 hour before use then fill the column with resin and put a quartz crystal layer of approximately 3 mm on the top avoiding disturbance of the resin
(b) Evaporate the combined effluent and washing solutions from Sr resin column (921 step (d))
(c) Dissolve the residue in 20 mL 3M HNO3
(d) Load the sample on the TEVA column preconditioned in advance with 20 mL 3M HNO3
(e) Wash the column with 10 mL 3M HNO3
(f) Combine the effluent and the washing solution into the same baker and use it for analysis of uranium
(g) Additionally wash the column with 20 mL 3M HNO3 this fraction is discarded
(h) Elute Th with 20 mL 8M HCl
(i) Note the time of the separation of Th for recovery calculation of 226Ra
923 Uranium separation
(a) Prepare the UTEVA column with volume 14 mL (diameter 8 mm length 28 mm) as follows soak the resin in ultra pure water for at least 1 hour before use then fill the column with the resin and put a quartz crystal layer of approximately 3 mm on the top avoiding the disturbance of the resin
(b) Load the combined effluent and the washing solution from the TEVA column (922 step (f)) onto UTEVA column preconditioned in advance with 20 mL of 3M HNO3
(c) Wash the column with 20 mL 3M HNO3
(d) Combine the effluent and the washing solution into the same beaker and use it for Ra analysis
(e) Wash the column with 5 mL 9M HCl and 15 mL 6M HCl to remove small amounts of Po and Th remained on the column
10
(f) Elute U with 6 mL ultra pure water
924 Radium separation [6]
(a) Combine the effluent (20 mL 3M HNO3) and the washing solution (30 mL 3M HNO3) from the UTEVA column in a 200 mL volume of beaker (923 step (b) and (c))
(b) Add 4 mL concentrated H2SO4 and 20 mL 20 Na2SO4 to the solution
(c) Slowly add 5 mL Pb2+ carrier (10 mgmL-1) to form a Pb(RaBa)SO4 co-precipitate while stirring for 1ndash2 minutes
(d) Remove stirrer bars washing with a small amount of 01M HCl and ultra pure water
(e) Allow to sit for 3ndash4 hours
(f) Decant supernatant liquor to a volume as low as possible
(g) Transfer the precipitate into a 50 mL conical centrifuge tube using 80 ethanol and centrifuge at 3000 revolutionsmin for 10 minutes
(h) Wash the precipitate with 20 mL 80 ethanol and decant the supernatant
(i) Wash the sides of the centrifuge tube with 5ndash10 mL sodium sulfate wash solution and vortex to mix thoroughly then add a further 5ndash10 mL to wash down the walls and then re-centrifuge at 3000 revmin for 10 minutes
(j) Pour out supernatant then invert the tube and wash the walls with ultra pure water to remove excess acid and sulfate (take care not to disturb the precipitate)
(k) Add 10 mL 02M DTPA (diethylenetriaminepentaacetic acid) and 1 drop of 025 thymol blue The solution should turn deep blue if not add 10M NaOH dropwise until a deep blue color is reached (pHgt9)
(l) Vortex to dissolve the precipitate
93Source preparation
931 Polonium-210 source
(a) The Po solution is carefully evaporated to dryness at less than 150degC
(b) Dissolve the residue in 10 mL 05M HCl
(c) Clean a silver disc with acetone followed by cc NH3(aq) followed by ultra pure water
(d) Place the cleaned silver disc into the deposition cell (Teflon vial) with another disc placed underneath for support Check if the cell is watertight
(e) Add 005 g ascorbic acid into the sample solution to reduce Fe3+ to Fe2+ check the colour change after mixing one drop of sample solution and one drop of 01M NH4SCN Add ascorbic acid until the dark red colour disappears
(f) Transfer the solution to the deposition cell
(g) Rinse the beaker with 2 x 2 mL 05M HCl and adjust the pH of the solution in the deposition cell to pH2 with 6M NaOH
(h) Place the deposition cell into a water bath at 90oC for 90 min with mechanical stirring or air bubbling
11
(i) Remove the silver disc wash with acetone or ultra pure water and dry it at room temperature
932 Uranium and thorium sources
(a) The purified U or Th solution is evaporated to dryness three times with a few mL 65 HNO3 to destroy any existing organic matter
(b) Dissolve the residues in 10 mL 10 (NH4)2SO4 solution at pH2 (The pH of samples being deposited for thorium should be slightly more acidic pH15-pH2)
(c) Transfer the solution into an electrodeposition cell
(d) Electrodeposit U or Th onto polished stainless steel discs at 1 A for 90 minutes respectively
(e) At the end of the deposition time fill the cell with 15M NH4OH and continue deposition for 1 min then turn off the main power of deposition unit and disconnect the cathode
(f) Rinse the cell twice with 1 NH4OH then three times with ultra pure water
(g) Disassemble the cell rinse the disc with ultra pure water and dry it
933 Radium source (BaSO4 micro co-precipitation)
(a) Rapidly add 4 mL mixed solution of 5 parts of 20 Na2SO4 with 1 part of acetic acid to the solution from the step 924 (l)
(b) Add 04 ml Ba seeding solution as soon as possible (2ndash3 s)
(c) Adjust pH to 48 with diluted H2SO4 as indicated by the colour change to a bright red
(d) Allow to sit for at least 30 minutes
(e) Filter the colloidal suspension of Ba(Ra)SO4 through a pre-wetted (by 80 ethanol) polypropylene filter (for example 01 microm pore size 25 mm diameter Pall)
(f) Rinse the centrifuge tube walls with 4ndash5 mL sodium sulfate wash solution and filter
(g) Rinse the sides of the filter holder with 15ndash20 drops 80 ethanol
(h) Allow the filter to dry and place it into a 47 mm Petri dish The time is recorded which is considered as the time of 225Ra225Ac separation or start of 225Ac ingrowth
The source preparation must be completed on the same day
934 Lead-210 source
(a) Evaporate the Pb solution which obtained from the step of 921(f) and re-evaporate with three portion of 5 mL 65 HNO3
(b) Dissolve the residue in 10 mL 1M HNO3
(c) Add 40 mg oxalic acid to the solution and adjust pH2ndash3 with 25 NH4OH to prepare a Pb-oxalate precipitate
12
(d) Let the solution to cool down and filtrate the precipitate on a filter paper (for example Whatman 41 dried in a drying oven and weighed in advance) wash the filter 3 times with 1 mL water and 2 mL 80 ethanol
(e) Dry the precipitate (40ndash50oC) and cool down in a desiccator
(f) Weigh the dried precipitate and calculate the chemical recovery using the gravimetric method
(g) Quantitatively transfer the precipitate into a liquid scintillation vial together with the filter and add 1 mL of 6M HNO3 into the vial to dissolve the precipitate
(h) Mix the solution with 15 mL of scintillation cocktail
94Measurement
941 Alpha-spectrometry
(a) Introduce the source into the vacuum chamber and pump until a vacuum of about 05 Pa (5 x 10⁻³ mbar) is obtained Then switch on the bias voltage button of detector
(b) Record the file name sample information (unit code sample name sample volume as it is required by the actual quality management system) and measurement date in each detector log book and start the measurement A typical measuring time is about 1 day when using a 450 mm2 area detector
(c) Integrate the counts in the peaks corresponding to the alpha emitting tracers and analytes respectively The alpha spectra should be similar to the spectra illustrated in Fig IV 4 of Appendix IV The FWHM of alpha peaks should be in the range of 30ndash60 keV
(d) Spectrum analysis Integrate the channel counts in a region of interest (ROI) which has the width of about 4 x FWHM (about 3 x FWHM to the left and 1 x FWHM to the right when FWHM is about 30ndash60 keV) Integrate the channel counts in the same regions of interest (ROI) in the sample spectrum and in the blank spectrum then subtract them from the sample spectrum to give the net area of peaks for further calculation
Performing a reliable measurement knowing the background of the chamber and detector is essential moreover it is important to prepare a separate reagent blank Therefore the set of measurement always has to involve above the samples a background and a reagent blank If the quality of the determination has to be proved a reference material also should be part of the preparation series
942 Liquid scintillation spectrometry for determination of 210Pb
9421Source preparation for determination of counting efficiency of 210Pb
(a) Take 10 mL 2M HCl solution into a 50 mL beaker
(b) Add the 210Pb standard solution (10ndash15 Bq) and 30 mg Pb2+ carrier to the solution
(c) Load the solution onto a Sr resin column (3 g of Sr resin 100-150 microm) which has been preconditioned in advance with 100 mL 2M HCl
(d) Wash the column with 80 mL 2M HCl Combine the washing solution with the effluent to get a pure 210Bi fraction
13
(e) Rinse the column with 20 mL 2M HCl This last portion of 20 mL 2M HCl is discarded to avoid overlapping between the 210Bi and 210Po portions
(f) Wash the column with 25 mL 6M HNO3
(g) Elute Po with 60 mL 6M HNO3
(h) Elute Pb with 60 mL 6M HCl
(i) Evaporate the Bi Po and Pb fractions to dryness
(j) Dissolve each portion of 210Bi and 210Po in 1 mL 6M HNO3 and then transfer them into 20 mL polyethylene vials coated with PTFE (polytetrafluoroethylene)
(k) Mix the solution with 14 mL scintillation cocktail
(l) Evaporate Pb fraction three times with 2 mL 65 HNO3
(m) Dissolve the residue in 20 mL 1M HNO3
(n) Add 04 g oxalic acid while warming and stirring
(o) Adjust the pH to 3ndash5 with NH4OH to form a Pb-oxalate precipitate
(p) Filter the precipitate through a pre-weighed filter paper (diameter of 24 mm)
(q) Wash the precipitate three times with 1 mL water followed by 2 mL 80 ethanol
(r) Dry the precipitate in an oven at 40ndash50oC
(s) Cool and weigh the precipitate to determine the chemical recovery of lead
(t) Carefully transfer the Pb-oxalate precipitate into a 20 mL of liquid scintillation vial together with the filter
(u) Add 1 mL 6M HNO3 to the vial to dissolve the precipitate
(v) Mix with 14 mL of scintillation cocktail
(w) Set up windows for 210Pb and 210Bi and count the three vials (for 210Pb 210Bi and 210Po) in a liquid scintillation counter until the counting statistic uncertainty is less than 1
9422Optimum window setting for 210Pb
The activity concentration of 210Pb is determined by LSC adjusted to the low energy mode and low bias with double energetic window method [7] For the successful determination of this radionuclide two counting windows should be optimized because of the overlapping of the beta spectra of 210Pb and 210Bi The result of the optimization of counting region is shown in the Fig V 1 of Appendix V In this example the lower limit for the 210Pb energy (window A) is set at channel 115 to avoid the counts caused by chemiluminescence in the cocktail while the upper limit is set at channel 320 where the 210Pb peak ends The lower limit for the 210Bi energy region (window B) is set at channel 320 and the upper limit is set at channel 410 to avoid interference from the 210Po peak
9423 Counting efficiency of 210Pb
The efficiency of liquid scintillation for beta particles depends on the energy of the beta decay For most beta particles with a maximum beta-energy above 100 keV efficiency is high more than 90 For lower energy beta particles the efficiency is usually less and the real value depends on the degree of quenching in the sample
14
To determine the efficiency a known activity of 210Pb in equilibrium with its daughters has to be measured several times (it is practical to choose more than 10 times of counting for getting a good estimate of the uncertainty in the efficiency)
10 EXPRESSION OF RESULTS
101 Calculation of activities of relevant isotopes
1011 Calculation of the activity of 210Pb
10111 Calculation of the counting efficiency of 210Pb
The counting efficiency (ε) of 210Pb can be calculated by Eqs (1 2)
TsPb tPbTPbstdcal emaR
Z210
210210minusminus
minusminus
= λε ( 1 )
BAnBnA frrZ minus= ( 2 )
where
BBgBnAAgAn rrrrrr 00 minus=minus=
fAB Tailing factor (See Ch 10112)
Rcal Chemical recovery of making the calibration source (See Ch 10113)
10112 Calculation of the tailing factor
The 210Pb energy region (window A) is interfered with counts from ingrown 210Bi The interference is compensated for by using the ratio of counts in window A to those in window B in a pure 210Bi spectrum the so-called ldquotailing factorrdquo fAB The tailing factor is independent of the activity level of 210Bi in the sample but is dependent on the quenching level of the sample The quenching levels of the calibrant the sample and the reagent blank are necessary to keep constant within plusmn2 relative standard deviation The tailing factor can be calculated by the following formula
210
210
minus
minus=BistdBn
BistdAnBA r
rf (3)
where BBistdBgBistdBnABistdAgBistdAn rrrrrr 02102100210210 minus=minus= minusminusminusminus
10113 Chemical recoveries of Pb in calibration source and sample
The chemical recovery of lead in the calibration source preparation process is determined gravimetrically using Eq (4)
15
ccPb
calfcalofgcal mC
mmfR
minus
minus=
)( ( 4 )
When the amount of Pb in the sample is not negligible compared with that in the Pb carrier the sample Pb content should be allowed for in calculation of the chemical recovery of Pb The chemical recovery of Pb in the sample can be calculated by Eqs (5 6)
)(
)(
ssPbccPb
fofg
mCmC
mmfR
minusminus +minus
= ( 5 )
Mass ratio (fg) of atomic mass of Pb to molar mass of Pb-oxalate
oxalatePb
Pbg M
Mf
minus
= (6 )
10114 Calculation of the activity of 210Pb
The activity of 210Pb on the separation date can be calculated from the LSC measurement using the following equations
Rm
ffZa
s
PbPbsPb ε
minusminusminus = 32
210 (7)
22102
tPb
Pbef minusminusminus = λ ( 8 )
321013210
3 tPb
PbPbe
tf
minusminus= minus
minus λλ
(9 )
However if the time interval (t2) between the separation of 210Pb and the beginning of the measurement and the counting time of the sample (t3) are much smaller than the half life of 210Pb (222 y) f2-Pb f3-Pb u(f2-Pb) and u(f3-Pb) are negligible
1012 Calculation of the activity of 210Po
The activity of 210Po on the separation date is calculated according to the procedure detailed in IAEAAQ12 [8]
1013 Calculation of the activities of the U and Th isotopes
The ratio of the net counts of the tracer and analyte peak is used to calculate the activity of the analyte in the sample on the date of chemical separation taking into account the activity of the tracer solution the masses of the sample and the tracer used The activity of the analyte (as Bq(kg dry)-1) at the separation time is calculated by the following formula
16
TgT
g
s
TTTTT
nTs
nTs rr
rr
m
fmCfm
rm
rCa
0
0
minusminus
== (16)
The decay of the tracer between its reference date (from the certificate) and counting is taken into correction by fT as follows
sTT t
T ef λminus= (17)
The activity of analyte in the sample should be calculated back to the date of sample collection
teaa
λminus=0 (18)
The detector efficiency is not needed in isotope dilution alpha spectrometry for calculation of the activity of the analyte but is needed for calculation of the chemical recovery It is determined from the activity of the tracer added and the net counts in the corresponding peak as follows
sTT t
TT
nT emC
rR λ
εminus= (19)
The detector efficiency is determined by the calibration source prepared in a similar way as the analytes and using the same measurement conditions For analytes which are co-precipitated the calibration source also should be co-precipitated using the same conditions including filter diameter For analytes which are electrodeposited the calibration source should also be prepared by electrodeposition Efficiency determinations are typically performed and regularly checked in the frame of analytical quality control The efficiency can be calculated according to the following equation
cal
caln
A
r =ε (20)
Where
Rn cal net count rate of calibration source in respective ROI
Acal certified activity of the calibration source
1014 Calculation of the activity of 226Ra [9]
10141 Calculation of the chemical recovery of Ra
The chemical recovery is determined by using the peak of 217At at 70669 keV (Pα 0999 32) The ingrowth of 225Ac (T12 100 d) the daughter of 225Ra is directly associated with the short lived progenies 221Fr (T12 48 min) 217At (T12 323 ms) and 213Po (T12 37 micros) When the daughters are in equilibrium with 225Ra the 217At peak shows no overlap with descendants of natural isotopes of radium in the alpha spectrum (225Ac interferes with 224Ra 221Fr interferes with 220Rn) From the initial tracer activity AT (added 229Th225Ra) the maximum detectable count rate rnTmax is calculated by taking into account the decay of unsupported 225Ra after its separation from Th (tsTh-229) as well as the build-up of 225Ac (tsRa-225) in the following equation
17
225225
225)(max
229225225
minusminus
minusminusminus
minus= minusminusminus
RaAc
ActtTnT
sThsRaRaeArλλ
λε λ (21)
The chemical recovery R is calculated as ratio of the measured count rate rnT and theoretical value rnTmax
maxnT
nT
r
rR = (22)
10142 Calculation of activity of 226Ra
While AT is the activity of the 225Ra tracer after the separation from 229Th its activity at the beginning of the build-up of 225Ac is yielded as follows
)(225
225225 sAcRa ttTRa eAA minusminus
minusminusminus= λ
( 2 4 )
The activity of 225Ac in any time is given by
( )225225
)()(225225
225
225225225225
minusminus
minusminusminusminusminusminus
minus minusminus=
minusminusminusminus
RaAc
ttttRaAc
Ac
AcAcAcRa eeAA
λλλ λλ
(25)
Integrating over the counting period with tm as the start and tem as the end of the measurement results into the activity of 225Ac at tem
( )( )( ) ( )( )
minusminusminus
= minusminusminusminus minusminusminusminus
minusminusminus
minusminusminus
225225225225
225225225
225225225
1)( AcemRaAcmRa tttt
RamemRaAc
AcRaemmAc ee
ttAttA λλ
λλλλ
( ) ( )( )
minusminus minusminusminusminus minusminusminusminus
minus
225225225225
225
1AcemAcAcmAc tttt
Ac
ee λλ
λ (26)
Finally the activity concentration of 226Ra is the following
217
226225226 )(
minus
minusminusminus =
At
RaemmAcRa r
rttAA (27)
where
0
0226226226 t
n
tt
nr Ra
mem
RaRa
minusminusminus minus
minus= and
0
0217217217 t
n
tt
nr At
mem
AtAt
minusminusminus minus
minus=
102 Expression of combined uncertainties of relevant isotopes
According to the Guide to Expression of Uncertainty in Measurement [11 12] the combined uncertainty is described in detail and an example is calculated for each relevant radionuclide in Appendix VI
18
103 Decision threshold
In accordance with ISO 119292010 the decision threshold gives a decision on whether or not the physical effect quantified by the measurand is present
The decision threshold a is the non-negative measurand quantifying the physical effect of interest If the result a is below the decision threshold the result can not be attributed to the physical effect nevertheless it can not be concluded that it is absent If the physical effect is really absent the probability of taking the wrong decision that the effect is present is equal to the specified probability of α (the error of first kind often chosen 005 and moreover α=β where β is the error of second kind then k1-α=k1-β=165) Any of the determined primary measurement result is only significant for the true value of the measurand to differ from zero if it is larger than the decision threshold given here
a=k1-αu(0) where u(0) is the uncertainty associated to the non-negative measurand uncertainty of decision threshold itself (with other words it can be estimated as uncertainty associated to slightly higher values than background or reagent blank depending on the procedure) and can be quantified here as
20
0
03
01)0(
t
n
tt
n
Rmu
s
+=ε
(28)
104 Detection limit
In accordance with ISO 119292010 the detection limit indicates the smallest true value of the measurand which can be still detected with the applied procedure this gives a decision on whether or not the measurement procedure satisfies the requirements and is therefore suitable for the intended measurement purpose In order to find out whether a procedure is suitable for the purpose the detection limit is compared with the specified guideline value of the measurand
The detection limit a is the smallest true value of the measurand for which the probability of the wrong assumption that the physical effect is absent does not exceed the probability β (error of the second kind) The detection limit is obtained as the smallest solution of the following equation
a=a+k1-β(a) where a ge a (29)
Eq (29) is an implicit equation which can be calculated by iteration As a starting approximation a1=3a can be chosen in most cases the iteration converges and the linear interpolation with approximation of a=(k1-α+k1-β)u(a) leads to the approximation
)0()( 221
21
2 ukkqqa αβ minusminus minus++= (30)
with [ ]
minus+= minusminus )0()(
2
1)0( 2
12
1
21
1 uaua
kukq a
β (31)
If α=β than k1-α=k1-β=k a=2q follows
19
[ ])0()()0(2 21
2
1
2 uau
a
kuka minus+= (32)
Where α is the probability of the error of first kind the probability of rejecting a hypothesis if it is true and β is the probability of the error of second kind the probability of accepting a hypothesis if it is false
The detection threshold and limit of the isotopes in the applied procedure are described in Table VII 1 of Appendix VII
The difference between using the decision threshold and using the detection limit is that the measured values are to be compared with the decision threshold whereas the detection limit is to be compared with the guideline value (guideline value corresponds to scientific legal or other requirements for which the measuring procedure intended to assess)
11 VALIDATION OF THE PROCEDURE
The procedure was validated with an IAEA reference material IAEA-434 The material was initially characterized at IAEA Environment Laboratories in Seibersdorf during the feasibility study phase Then the characterization of the material took place within the interlaboratory comparison piloted by IAEA Environment Laboratories in Seibersdorf in cooperation with the Consultative Committee on Ionization Radiation (CCRI) of the International Bureau des Poids et Mesure (PIBM) The results reported in this comparison were used to derive the property values of the measurands of interest The IAEA-434 reference material [12] was collected from a processing plant located in Gdansk (Poland) in 2003 The matrix composition is CaSO4middot2H2O (96) P2O5 (1-2) F total (12) SiO2 (1) Al2O3 (02) The property values of all radionuclides of IAEA 434 were established on the basis of a robust approach proposed by DL Duewer [13] and the Mixture Model median (MM-median) of the analytical results reported by the expert laboratories was calculated To estimate the standard uncertainty associated with the property value the MM-median based standard deviation was calculated from the span of the central 50 of the MM probability density function The validation results of the procedure are shown in Tables VIII 1 and VIII 2 Figs VIII 1ndashVIII 7 of Appendix VIII 111 Trueness of the method
The relative bias of the method is calculated by the following formula
100() timesminus=C
CXδ (34)
112 Precision of the method
The precision index ( PI() ) is calculated according to the following formulas
100)()(
()2
2
2
2
times+=X
Xu
C
CuPI (35)
20
113 Repeatability limit
The repeatability limit is estimated by analyzing five subsamples from the same bottle of the IAEA-434 reference material for the relevant radionuclides investigating the repeatability conditions instrument analyst shortest time etc The repeatability limit is calculated by the following formula
rL Sr 82= (36)
114 Reproducibility limit
The reproducibility limit is also estimated by analyzing the IAEA-434 reference material from ten duplicates samples were taken from ten randomly selected packing unit with at least one parameter being changed in the analytical system (analyst analysis date instrument etc) The reproducibility limit is calculated by the following formula
RL SR 82= (37)
115 Outlier test
The presence of individual values that appear to be inconsistent with all other laboratories or values may cause some problems during the final evaluation of data According to ISO 5725-2 an outlier test should be performed before the calculation of repeatability and reproducibility The analysis includes a systematic application of a statistical test of outliers a great variety are available which could be used for the purposes of this part of ISOIEC 17025 Usually the graphical consistency technique or the numerical outlier test are applied Cohranrsquos test of variabilities should be applied first and then any necessary action should be taken Grubbrsquos test is primarily a test of in between laboratory variability
116 Acceptance criteria
The method can be accepted if
PI()lt 25
LRltδ ( 3 8 )
According to these criteria the method performs well as the Table VIII 1 of Appendix VIII shows
12 TEST REPORT
The test report shall conform to ISOIEC 17025 requirements and shall contain the following information
bull a title (test report calibration report reference material production etc)
bull the name and address of the laboratory and location where any part of the test or calibration or production of reference material etc were carried out
bull unique identification of the report on each page with numbering of pages
21
bull analysis request code
bull reference to the measurement method used
bull sampling date (if available)
bull sample description
bull sample code or identification number
bull date of the separation of analyte
bull applied tracers with their reference dates and activity values with the code of their certificate
bull the results with units of measurement and associated uncertainty value expressed in the same unit as the result
bull date to which the test result has been corrected (corrected to the sampling date or separation time dd-mm-yyyy)
bull responsible person (with accessibility)
22
REFERENCES
[1] FEDERAL REGISTER National emission standards for hazardous air pollutants 57 107 (1992) 23305-23320
[2] RUTHERFORD PM DUDAS MJ AROCENA JM Heterogeneous distribution of radionuclides barium and strontium in phosphogypsum by-product Sci Total Environ 180 (1996) 201-209
[3] NATIONAL COUNCIL ON RADIATION PROTECTION AND MEASUREMENTS Evaluation of Occupational and Environmental Exposures to Radon and Radon Daughters in the United States NCRP Report 78 (1984)
[4] MARTIN P HANCOCK GJ Routine analysis of naturally occurring radionuclides in environmental samples by alpha-particle spectrometry Supervising Scientist Report 180 (2004) httpwwwenvironmentgovaussdpublicationsssr180html
[5] INTERNATIONAL ATOMIC ENERGY AGENCY Reference Material IAEA-434 Naturally Occurring Radionuclides in Phosphogypsum IAEA Analytical Quality in Nuclear Applications Series No 17 IAEAAQ17 IAEA Vienna (2010)
[6] MEDLEY P BOLLHOumlFER A ILES M RYAN B MARTIN P Barium sulfate method for radium-226 analysis by alpha spectrometry Environmental Research Institute of the Supervising Scientist internal report 501 (2005)
[7] VAJDA N LAROSA J ZEISLER R DANESI P KIS-BENEDEK G A Novel Technique for the Simultaneous Determination of 210Pb and 210Po using a Crown Ether J Environ Radioactivity 37 (1997) 355-372
[8] INTERNATIONAL ATOMIC ENERGY AGENCY A Procedure for the Determination of Po-210 in Water Samples by Alpha Spectrometry IAEA Analytical Quality in Nuclear Applications Series No 12 IAEAAQ12 IAEA Vienna (2009)
[9] GUOGANG J TORRI G INNOCENZI P OZONE R Di LULLO A Determination of radium isotopes in mineral and environmental water samples by alpha-spectrometry J of Radioanalytical and Nuclear Chemistry 267 3 (2005) 505-514
[10] EURACHEMCITAC Guide Quantifying uncertainty in analytical measurement 2nd Ed(2000)
[11] INTERNATIONAL ATOMIC ENERGY AGENCY Quantifying Uncertainty in Nuclear Analytical Measurements IAEA-TECDOC-1401 IAEA Vienna (2004)
[12] SHAKHASHIRO A SANSONE U Technically Enhanced Naturally Occurring Radionuclides (TENORM) in Phosphogypsum The Interlaboratory Comparison CCRI(II)07-35 Metrologia (2009)
[13] DUEWER DL A Robust Approach for the Determination of CCQM Key Comparison Reference Values and Uncertainties Working document CCQM04-15 BIPM wwwbipminfoccCCQMAllowed10CCQM04-15pdf (2004)
23
[14] Monographie BIPM-5 Vol 1ndashMonographie BIPM-5 Vol 5
httpwwwnucleideorg Decay Data Evaluation Project (DDEP) accessed in October 2010
[15] NuDat 25 (Database at the US NNDC) httpwww-ndsiaeaorg accessed in October 2010
[16] HORWITZ et al A Novel Strontium-Selective Extraction Chromatographic Resin Solvent Extraction amp Ion Exchange 10 (1992) 313
[17] HORWITZ et al Extraction Chromatography of Actinides and Selected Fission Products Principles and Achievement of Selectivity presented at International Workshop on the Application of Extraction Chromatography in Radionuclide Measurement IRMM Geel 1998
[18] HORWITZ et al Separation and Preconcentration of Actinides by Extraction Chromatography Using a Supported Liquid Anion Exchanger Application to the Characterization of High-Level Nuclear Waste Solutions Analytica Chimica Acta 310 (1995) 63-78
[19] HORWITZ et al Separation and Preconcentration of Uranium from Acidic Media by Extraction Chromatography Analytica Chimica Acta 266 (1992) 25-37
[20] C-K KIM MARTIN P FAJGELJ A Quantification of measurement uncertainty in the sequential determination of 210Pb and 210Po by liquid scintillation counting and alpha particle spectrometry Accreditation and Quality Assurance 13 12 (2008) 691-702
[21] J KRAGTEN Calculating Standard Deviation and Confidence Intervals with a Universally Applicable Spreadsheet Technique Analyst 119 (1994) 2161ndash2165
24
APPENDIX I NUCLEAR DATA OF RELEVANT RADIONUCLIDES AND DECAY CHAINS OF U
AND Th SERIES
TABLE I 1 NUCLEAR DATA OF RELEVANT RADIONUCLIDES [14]
Radionuclide Half-life Disintegration modes
E (MeV) Probability ()
225Ac 100(1) d α 5580 5(14) 095(4)
α 5599 3(14) 0114(7)
α 5609 0(14) 109(5)
α 5637 3(14) 416(23)
α 5682 2(14) 131(4)
α 5686 4(14) 0021(14)
α 5723 1(14) 203(23)
α 5730 5(14) 16(3)
α 5731 6(14) 124(10)
α 5731 9(17) 90(5)
α 5797 7(14) 62(9)
α 5793 1(21) 189(20)
α 5804 2(14) 03
α 5829 6(14) 524(24)
217At 323(4) x 10-3 s α 6484 7(16) 0016 7(8)
α 6813 8(16) 0038 4(15)
α 7066 9(16) 99932(3)
133Ba 10540(6) y γ 0053 162 2(6) 214(3)
γ 0079 614 2(12) 265(5)
γ 0080 997 9(11) 329(3)
γ 0276 398 9(12) 716(5)
γ 0302 850 8(5) 1834(13)
γ 0356 012 9(7) 6205(19)
γ 0383 848 5(12) 894(6)
210Bi 5012(5) d β 1162 1(8) 99999 86(2)
212Bi 6054(6) min β 0633(2) 190(4)
β 0741(2) 145(29)
β 1527(2) 458(21)
β 2254(2) 5523(21)
α 6050 92(4) 251(1)
α 6090 02(4) 97(1)
221Fr 479(2) min α 6126 3(15) 151(2)
α 6243(2) 134(7)
α 6341 0(13) 828(2)
TABLE I 1 NUCLEAR DATA OF RELEVANT RADIONUCLIDES [14] (cont)
25
Radionuclide Half-life Disintegration modes
E (MeV) Probability ()
210Pb 2223(12) y β 0017 0(5) 802(13)
β 0063 5(5) 198(13)
γ 0046 539(1) 4252(40)
208Po 2898(2) y α 5114 9(14) 99995 8(4)
α 4220(15) 24(7)x10-4
209Po 115(13) y α 4885(2) 198(32)
α 4883(2) 792(32)
α 4622(5) 0548(7)
210Po 138376 3(17) d α 5304 33(7) 99998 76
α 4516 66(9) 0001 24(4)
213Po 370(5) x 10-6 s α 8375 9(25) 99995 0(5)
216Po 0150(5) s α 6778 6(5) 99998 1(3)
α 5988 6(10) 0001 9(3)
218Po 3094(6) min α 6002 35(9) 99976 9(32)
223Ra 1143(5) d α 5747 0(4) 900(20)
α 5716 23(29) 516(13)
α 5606 73(30) 252(5)
α 5539 80(90) 900(20)
224Ra 3627(7) d α 5448 81(16) 526(7)
α 5685 50(15) 9472(7)
γ 0240 986(6) 412(4)
225Ra 1482(19)d β 0316(5) 688(20)
β 0356(5) 312(20)
γ 0040 09(5) 300(7)
226Ra 1 600(7) y α 4601(1) 595(4)
α 4784 34(25) 94038(40)
228Ra 575(4) y β 00127(7) 30(10)
β 00256(7) 87(9)
β 00391(7) 49(10)
β 00395(7) 12(10)
220Rn 558(3) s α 5748 46(14) 0118(15)
α 6288 22(10) 99882(15)
222Rn 3823 2(8) d α 5489 48(30) 9992(1)
228 Th 69860(23) d α 5176 89(23) 020(2)
α 5211 08(22) 038(3)
α 5340 38(22) 262(2)
α 5423 28(22) 732(2)
TABEL I 1 NUCLEAR DATA OF RELEVANT RADIONUCLIDES [14] (cont)
26
Radionuclide Half-life Disintegration
modes E (MeV) Probability ()
229 Th 7 340(160) y α 5053(2) 660(10)
α 4978 5(12) 317(4)
α 4967 5(12) 597(6)
α 4901 0(12) 1020(8)
α 4845 3(12) 5620(20)
α 4814 6(12) 930(8)
230 Th 7538(30) x 104 y α 4687 0(15) 763(3)
α 4620 5(15) 234(10)
232 Th 1402(6) x 109 y α 3810 0(14) 0068(20)
α 3948 5(14) 210(13)
α 4011 2(14) 789(13)
234 Th 2410(3) d β 0105(10) 65(7)
β 0106(10) 141(12)
β 0198(10) 778(15)
γ 0063 30(2) 375(8)
232U 706(11) y α 5263 48(9) 306(6)
α 5320 24(9) 691(6)
233U 1592(2) x 105 y α 4824 2(12) 843(6)
α 4783 5(12) 132
234U 2455(6) x 105 y α 4603 5(7) 0210(2)
α 4722 4(7) 2842(2)
α 4774 6(7) 7137(2)
235U 704(1) x 106 y α 4322(4) 333(6)
α 4397 8(13) 5719(20)
α 4414 9(5) 301(16)
α 4502 4(7) 128(5)
α 4556 0(4) 379(6)
α 4596 4(13) 474(6)
236U 2343(6) x 107 y α 4445(5) 261(40)
α 4494(3) 738(40)
238U 4468(5) x 109 y α 4038(5) 013(3)
α 4151(5) 2233(50)
α 4198(3) 7754(50)
Emax for beta emitting radioisotopes
Data were taken from [15]
27
FIG I 1 Decay chain of 238U [4]
FIG I 2 Decay chain of 232Th [4]
28
APPENDIX II FLOW CHART FOR SEQUENTIAL SEPARATION OF 210Po 210Pb Th U AND 226Ra
IN PHOSPHOGYPSUM
29
APPENDIX III PROPERTIES OF RESINS
III1 Sr resin
FIG III 1 Structure of the Sr resin (wwweichromcom)
FIG III 2 Capacity factor of Sr resin in nitric acid (wwweichromcom) [16]
30
FIG III 3 Capacity factor of Sr resin in nitric acid (wwweichromcom) [17]
III2 TEVA resin
FIG III 4 Structure of the TEVA resin (wwweichromcom)
31
FIG III 5 Capacity factor of TEVA resin in nitric acid and hydrochloric acid (wwweichromcom) [18]
III3 UTEVA resin
FIG III 6 Structure of the UTEVA resin (wwweichromcom)
32
FIG III 7 Capacity factor of UTEVA resin in nitric acid and hydrochloric acid (wwweichromcom) [19]
33
APPENDIX IV ALPHA SPECTRA OF ANALYTES
FIG IV 1 Alpha spectrum of Po isotopes
FIG IV 2 Alpha spectrum of Th isotopes in phosphogypsum (with progeny)
228Th is resulted from 232U tracer spiked in the sample
34
FIG IV 3 Alpha spectrum of U isotopes
FIG IV 4 Alpha spectrum of 226Ra and its progeny (spiked with 225Ra)
35
FIG IV 5 Overlapping alpha spectra of U and Po isotopes
FIG IV 6 Overlapping alpha spectra of U and Th (with progeny) isotopes
36
APPENDIX V LIQUIDE SCINTILLATION SPECTRA
a)
b)
A window
(115-320 ch)
B window
(320 -410 ch)
210Po
210Pb
210Bi
210Bi
Co
unts
Ch
ann
elC
oun
tsC
han
nel
Channel number
a)
b)
A window
(115-320 ch)
B window
(320 -410 ch)
210Po
210Pb
210Bi
210Bi
Co
unts
Ch
ann
elC
oun
tsC
han
nel
Channel number
FIG V 1 Typical liquid scintillation spectra of beta-emitting 210Pb and 210Bi and alpha emitting 210Po (calibration sources) a) 210Pb 210Bi and 210Po spectra
b) pure 210Bi spectrum
37
APPENDIX VI CALCULATION OF THE COMBINED UNCERTAINTY
OF THE ACTIVITIES OF THE ANALYTES ON SAMPLING DATE
VI1 Uncertainty of the 210Pb result [20]
VI11 Uncertainty of counting efficiency of 210Pb
2
2
2
2
2210
2
210
2210
222
)()()()()()( )( PbTPbT
calcal
stdPbstdPb
Pbb mum
RuR
aua
utZuZ
u
minus+
minus+
minus++
= minusminus
minusεεελεεε (VI-1)
2
222
2 )()()()()( (Z) BABnBnBAAn furrufruu minus+minus+= (VI-2)
20
2 )()()( AAgAn rururu += (VI-3)
20
2 )()()( BBgBn rururu += (VI-4)
VI12 Uncertainty of the tailing factor fAB
The uncertainty of the tailing factor fAB is calculated according to following equations
2
210
210
2
210
210
)()()(
+
=
minus
minus
minus
minus
BicalnB
BicalnB
BicalAn
BicalAnBABA r
ru
r
ruffu (VI-5)
20
2210210 )()()( ABicalAgBicalAn rururu += minusminus (VI-6)
20
2210210 )()()( BBicalBgBicalBn rururu += minusminus (VI-7)
The uncertainty of counting efficiency for 210Pb can be calculated by Eq (VI-8)
2
2
2
2
2210
2
210
2210
222
)()()()()()( )( PbTPbT
calcal
stdPbstdPb
Pbb mum
RuR
aua
utZuZ
u
minus+
minus+
minus++
= minusminus
minusεεελεεε (VI-8)
2
222
2 )()()()()( (Z) BABnBnBAAn furrufruu minus+minus+= (VI-9)
20
2 )()()( AAgAn rururu += (VI-10)
20
2 )()()( BBgBn rururu += (VI-11)
38
VI13 Uncertainty of chemical recovery of Pb
Uncertainty of chemical recoveries of Pb in calibration source
minusminus+
minus+
= 2
2
2
2
2
2
cal )()(
)()(
)( )(R calfcalfcalof
calcalof
calfcalof
calg
g
cal mumm
Rmu
mm
Rfu
f
Ru
2
1
2
2
2
2
)()(
)()(
minus+
minus+
minus
minusminus
minusc
ccPb
cPbcalcPb
ccPb
ccal mumC
CRCu
mC
mR (VI-12)
The uncertainty of chemical recovery of Pb in the sample can be calculated
minusminus+
minus+
= 2
2
2
2
2
2
)()(
)()(
)( (R) ffof
offof
gg
mumm
Rmu
mm
Rfu
f
Ru
2
2
2
2
)()(
)()( c
ssPbccPb
cPbcPb
ssPbccPb
c mumCmC
CRCu
mCmC
mR
+minus+
+minus+
minusminus
minusminus
minusminus
2
1
2
2
2
2
)()(
)()(
+minus+
+minus+
minusminus
minusminus
minusminuss
ssPbccPb
sPbsPb
ssPbccPb
s mumCmC
CRCu
mCmC
mR (VI-13)
VI14 Uncertainty of mass ratio
The uncertainty of the mass ratio (fg) of atomic mass of Pb to molar mass of Pb-oxalate is calculated using the equations below
22
M Pb)(
+
=
minus
minus
oxalatePb
M
Pbgg M
u
M
uffu oxalatePb (VI-14)
The uncertainty of the molar mass of lead oxalate u(MPb-oxalate) can be derived by combining standard uncertainties in atomic masses of its constituents as shown in Table VI 1
39
TABLE VI 1 STANDARD UNCERTAINTIES OF ATOMIC WEIGHT AND THE GRAVIMETRIC FACTOR fg
Element Atomic weight
(gmol-1)
Quoted uncertainty (gmol-1)
Conversion factor
Standard uncertainty (gmol-1)
Mass ratio of atomic mass of Pb to
molar mass of Pb-oxalate
Uncertainty ofatomic mass
of Pb to molar mass of
Pb-oxalate
Pb 207215 2 0000 15 3 0000 087 0701 9 0000 002
C 12010 7 0000 8 3 0000 46
O 15999 4 0000 3 3 0000 17
VI15 Combined uncertainty of activity of 210Pb
The combined uncertainty of the 210Pb activity is calculated from Eq (VI-15)
minus+
minus+
minus+
= minusminusminusminus 2
2
2102
2
2102
2
210
2
2
2101 )()()()()( s
d
sPb
BA
sPb
nBnB
sPb
BAnA
sPb
Pbc mum
afu
Z
arru
Z
afru
Z
aau
2
1
23
2
3
21022
2
2
2102
2
2102
2
210 )()()()(
+
+
minus+
minus+ minus
minus
minusminus
minus
minusminusminusPb
Pb
sPbPb
Pb
sPbsPbsPb fuf
afu
f
aRu
R
au
aε
ε (VI-15)
)()( 210222 minusminusminus = PbPbPb utffu λ (VI-16)
210
210321033
)(
11)(
3210
3210
minus
minusminus
minus
minusminusminus
minusminus=
minus
minus
Pb
Pbt
t
PbPbPb
u
e
etffu
Pb
Pb
λλλ λ
λ
(VI-17)
However if the time interval (t2) between the separation of 210Pb and the beginning of the measurement and the counting time of the sample (t3) are much smaller than the half life of 210Pb f2-Pb f3-Pb u(f2-Pb) and u(f3-Pb) are negligible The uncertainties associated to components mentioned above can be calculated as follows
0
0
3
)(t
r
t
rru
Po
gn +=
minus
(VI-18)
0
0
3
)(t
r
t
rru t
Po
tgtn +=
minus
(VI-19)
minus+
+
= minusminusminus
minus2
2
2102
2
2102
2
210210 )()()( )( tn
tn
sPo
nn
sPo
TT
sPo
sPo rur
aru
r
aAu
A
aau
2
2
21022
2
2
2102
2
2102
2
210)()()()( T
T
sPo
PoPo
sPo
TT
sPo
ss
sPofu
f
afu
f
amu
m
amu
m
a
+
+
+
minus+ minus
minusminus
minusminusminus
40
2
1
3
2
3
210 )(
+ minus
minus
minusPo
Po
sPo fuf
a (VI-20)
)()( TTTt utffu λ= (VI-21)
)()( 210222 minusminusminusminus = PoPoPoPo utffu λ (VI-22)
210
210321033
)(
11)(
3210
3210
minus
minusminus
minus
minusminusminus
minusminus=
minus
minus
Po
Pot
t
PoPoPo
u
e
etffu
Po
Po
λλλ λ
λ (VI-23)
VI16 Combined uncertainty of activity of 210Po
The uncertainty of the activity of 210Po on the separation date is calculated according to IAEAAQ12 procedure [8]
VI2 Uncertainty of other alpha emitting isotopes
The same formulas are used to calculate the combined uncertainties as equations that are used for calculation of the activity of alpha emitting analytes at the separation time and the sampling date as well as the chemical recovery and counting efficiency These formulas have to be applied in the spreadsheet approach for calculating the combined uncertainties knowing the standard uncertainty of each component VI3 Spreadsheet approach
For the quantifying the uncertainties the spreadsheet technique [21] was used which could be summarised as follows and showed in the Fig VI 1
bull Calculate function y using parameter xj
y=f(x1x2xj xn) (VI-24)
bull recalculate the same function n times increasing xj to xj+dxj (dxj standard deviation) and keeping the remaining parameters constant
y=f(x1x2xj+dxj xn) (VI-25)
bull the uncertainty on the function dy is the square root of the sum of squares
( )sum minus=n
jyydy1
2 (VI-26)
bull The individual variance contribution fj is
( )( )sum minus
minus=
n
j
jj
yy
yyf
1
2
2
(VI-27)
41
FIG VI 1 Spreadsheet approach for quantifying the uncertainty of the measurement
The results are summarised for the individual isotopes in the Tables VI 2ndashVI 9 and the results of the individual analysis with their uncertainties are shown in the Figs VI 3ndashVI 9 The detailed study about the usual contributors of uncertainty in the nuclear analytical techniques could be found in the IAEA-TECDOC-1401 [11] TABLE VI 2 AN EXAMPLE OF QUANTIFYING UNCERTAINTIES OF 210Po RESULT
Symbol unit Value of variable
Uncertainty Conversion factor to standard uncertainty
Standard uncertainty
Contribution to combined
uncertainty ()
m g 0508 9 0007 3 3 0004 2 010
rgt s-1 0197 0075 1 0075 361
r0t s-1 0000 017 0000 034 1 0000 034 0000 014
rg s-1 0081 0029 1 0029 6352
r0 s-1 0000 034 0000 033 1 0000 033 0000 08
at Bq 0829 0019 1 0019 0252
λt d-1 0000 019 0000 013 1 0000 013 negligible
λPo d-1 0005 72 x 10-9 1 72x10-9 negligible
ft 0982 14 0000 43 1 0000 43 0000 091
f2-Po 1005 73 x 10-9 1 73x10-9 negligible
f3-Po 1005 5 18 x 10-8 1 18 x10-8 negligible
aPo1 Bqmiddotkg-1 672 94
contribution is less than 1 x 10⁻⁵
TABLE VI 3 AN EXAMPLE OF QUANTIFYING UNCERTAINTIES OF EFFICIENCY OF 210Pb
Symbol unit Value of variable
Uncertainty
Conversion factor to standard
uncertainty
Standard uncertainty
Contribution to combined
uncertainty ()
mvial g 14936 35 0000 1 3 0000 17 0004 8
42
Symbol unit Value of variable
Uncertainty
Conversion factor to standard
uncertainty
Standard uncertainty
Contribution to combined
uncertainty ()
mvial+carrsol g 16036 54 0000 1 3 0000 17 0004 8
cPb g g-1 0027 42 0000 021 1 0000 021 011
mvial g 16036 72 0000 10 3 0000 17 0004 8
mvial+std g 17132 6 0000 10 3 0000 17 0004 8
astd Bq 1245 0189 1 0189 805
fgravimetry 0701 85 0000 41 1 0000 41 0066
mfilter g 0036 54 0000 10 3 0000 17 42
mfilter+Pb-precipitate g 0073 77 0000 10 3 0000 17 41
rA s-1 7362 0041 1 0041 76
rA0 s-1 0029 5 0003 1 0002 7 0035
rB s-1 0416 0 0011 1 0011 060
rB0 s-1 0011 7 0002 1 0002 2 0024
fAB 1049 0023 1 0023 040
t12 Pb d 814508 7305 1 731 23
tmeas-ref d 4 532 -
ε 0859 7 0015 3
43
TABLE VI 4 AN EXAMPLE OF QUANTIFYING UNCERTAINTIES OF 210Pb RESULT
Symbol unit Value of variable
Uncertainty Conversion factor to standard uncertainty
Standard uncertainty
Contribution to combined
uncertainty ()
ms g 0508 9 0007 3 3 0004 2 03
rgA s-1 0283 0035 1 0035 883
r0A s-1 0011 7 0002 2 1 0002 2 03
rgB s-1 0031 0009 1 0009 58
r0B s-1 0005 6 0002 3 1 0002 3 04
Ζ s-1 0245 1 0032 7 1 0032 7 -
fAB 1015 3 0012 9 1 0012 9 001
ε 0859 7 0015 3 1 0015 3 13
R 0858 8 0025 3 1 0077 2 35
aPb1 Bqmiddotkg-1 652 12
TABLE VI 5 AN EXAMPLE OF QUANTIFYING UNCERTAINTIES OF 234U RESULT
Symbol unit Value of variable
Uncertainty Conversion factor to standard uncertainty
Standard uncertainty
Contribution to combined
uncertainty ()
ms g 0508 9 0007 3 3 0004 2 003
rgt s-1 0021 78 0008 01 1 0008 369
r0t s-1 0000 030 0000 022 1 0000 022 0000 5
rg s-1 0016 15 0005 90 1 0006 628
r0 s-1 0000 016 0000 022 1 0000 022 0000 1
at Bq 0088 35 0002 10 1 0002 01 029
aU-234_1 Bqmiddotkg-1 129 3
TABLE VI 6 AN EXAMPLE OF QUANTIFYING UNCERTAINTIES OF 238U RESULT
Symbol unit Value of variable
Uncertainty Conversion factor to standard uncertainty
Standard uncertainty
Contribution to combined
uncertainty ()
ms g 0508 9 0007 3 3 0004 2 003
rgt s-1 0021 78 0008 01 1 0008 353
r0t s-1 0000 030 0000 022 1 0000 022 0000 5
rg s-1 0015 61 0005 67 1 0006 644
r0 s-1 0000 009 0000 008 1 0000 008 0000 1
at Bq 0088 35 0002 10 1 0002 1 028
aU-238_1 Bqmiddotkg-1 124 3
44
TABLE VI 7 AN EXAMPLE OF QUANTIFYING UNCERTAINTIES OF 230Th RESULT
Symbol unit Value of variable
Uncertainty Conversion factor to standard uncertainty
Standard uncertainty
Contribution to combined
uncertainty ()
ms g 0508 9 0007 3 3 0004 2 005
rgt s-1 0022 63 0006 44 1 0006 387
r0t s-1 0000 077 0000 063 1 0000 063 0006 1
rg s-1 0028 38 0007 90 1 0008 608
r0 s-1 0000 012 0000 010 1 0000 010 0000 1
at Bq 0090 03 0002 30 1 0002 303 051
aTh-230_1 Bqmiddotkg-1 223 9
TABLE VI 8 AN EXAMPLE OF QUANTIFYING UNCERTAINTIES OF 232Th RESULT
Symbol unit Value of variable
Uncertainty Conversion factor to standard uncertainty
Standard uncertainty
Contribution to combined
uncertainty ()
ms g 0508 9 0007 3 3 0004 2 004
rgt s-1 0022 63 0006 44 1 0006 265
r0t s-1 0000 077 0000 063 1 0000 063 0004 2
rg s-1 0000 28 0000 10 1 0000 1 727
r0 s-1 0000 011 0000 008 1 0000 008 048
at Bq 0090 03 0002 30 1 0002 3 035
aTh-232_1 Bqmiddotkg-1 21 009
TABLE VI 9 AN EXAMPLE OF QUANTIFYING UNCERTAINTIES OF 226Ra RESULT
Symbol unit Value of variable
Uncertainty Conversion factor
to standard uncertainty
Standard uncertainty
Contribution to combined
uncertainty ()
ms g 0508 9 0007 3 3 0004 2 003
rgt s-1 0043 10 0025 05 1 0025 05 603
r0t s-1 0000 111 0000 128 1 0000 128 0004
rg s-1 0063 32 0018 78 1 0018 78 393
r0 s-1 0000 070 015 0000 070 013 1 0000 070 013 0000 5
at Ra-225 Bq 0779 50 0022 53 1 0022 53 04
λAc225 d-1 0069 315 0000 624 1 0000 624 0000 02
λRa225 d-1 0046 520 0000 693 1 0000 693 008
t1-t0 d 337
aRa-226_1 Bqmiddotkg-1 766 39
45
APPENDIX VII DETECTION THRESHOLD AND LIMIT OF THE APPLIED PROCEDURE
TABLE VII 1 TYPICAL DECISION THRESHOLD AND DETECTION LIMIT FOR RELEVANT ISOTOPES
Symbol unit 210Pb 210Po 234U 238U 230 Th 232 Th 226Ra
k 165 165 165 165 165 165 165
m kg 0000 5 0000 5 0000 5 0000 5 0000 5 0000 5 0000 5
ε 086 031 026 026 035 035 025
R 086 073 094 094 068 068 061
n0 52 16 4 4 6 6 28
Tg s 36 000 98 899 343 024 343 024 277 345 277 345 124 984
t0 s 35 542 548 190 512 901 512 901 559 286 559 286 446 755
a Bqmiddotkg-1 13 036 009 009 012 012 068
a1 Bqmiddotkg-1 38 11 028 028 036 036 205
u2(0) Bq2middotkg-2 29 015 0008 4 0008 4 0006 5 0004 7 078
u2(a1) Bq2middotkg-2 23 041 0059 0025 0028 0052 204
a Bqmiddotkg-1 24 12 052 019 018 019 43
46
APPENDIX VIII VALIDATION TEST RESULTS OF THE PROCEDURE
TABLE VIII 1 VALIDATION RESULTS FOR RELEVANT RADIONUCLIDES
Parameters 210Po 210Pb 234U 238U 230Th 226Ra
C Bq kg-1 680 680 120 120 211 780
X Bq kg-1 653 659 127 123 221 793
u(C) Bq kg-1 58 58 9 11 9 62
u(X ) Bq kg-1 23 22 5 5 10 35
δ() -40 -31 58 25 47 17
rL Bq kg-1 106 102 48 47 62 498
RL Bq kg-1 237 454 59 53 89 707
PI() 92 92 85 100 62 91
TABLE VIII 2 ANALYSIS OF VARIANCE (ANOVA) FOR 210Po 210Pb 238U 230Th AND 226Ra IN PHOSPHOGYPSUM
Nuclide SSwb SSbb MSwb MSbb Swb
(as CV)
Sbb
(as CV)
210Po 124 62 151 79 312 1687 271 254
210Pb 8385 197 54 210 2195 220 302
238U 314 386 785 429 227 215
230Th 2176 1598 544 178 334 225
226Ra 412 686 137 858 121 054
SSwb sum of squares within bottles
SSbb sum of squares between bottles
MSwb mean of squares within bottles
MSbb mean of squares between bottles
Swb standard deviation as percent of covalent variance within bottles
Sbb standard deviation as percent of covalent variance between bottles
47
550
600
650
700
750
0 10 20 30 40 50
Samples
Act
ivity
of
21
0 Pb
in th
e sa
mp
le (
Bq
kg
dry
)
Mean1σ
-2σ
-1σ
3σ
2σ
-3σ
FIG VIII 1 210Pb results with associated uncertainties
550
600
650
700
750
0 10 20 30 40 50Samples
Act
ivity
of
21
0 Po
in t
he s
ampl
e (B
qkg
dry
)
Mean
1σ
-1σ
3σ
2σ
-3σ-2σ
FIG VIII 2 210Po results with associated uncertainties
48
110
115
120
125
130
135
140
0 10 20 30 40 50
Samples
Act
ivity
of
238
U in
the
sam
ple
(B
qkg
dry
)
Mean
1σ
-1σ
3σ
2σ
-3σ
-2σ
FIG VIII 3 238U results with associated uncertainties
105
110
115
120
125
130
135
140
145
150
0 10 20 30 40 50
Samples
Act
ivity
of
23
4 U in
the
sa
mpl
e (B
qkg
dry
)
Mean1σ
-2σ-1σ
3σ2σ
-3σ
FIG VIII 4 234U results with associated uncertainties
49
190
200
210
220
230
240
250
0 5 10 15 20 25 30 35 40 45 50
Samples
Act
ivity
of
23
0 Th
in th
e s
am
ple
(B
qk
g d
ry)
2σ
3σ
1σ
-1σ
-2σ
-3σ
Mean
FIG VIII 5 230 Th results with associated uncertainties
05
10
15
20
25
30
35
40
0 10 20 30 40 50
Samples
Act
ivity
of
23
2 Th
in th
e sa
mp
le (
Bq
kg
dry
)
Mean
1σ
-2σ
-1σ
3σ
2σ
-3σ
FIG VIII 6 232 Th results with associated uncertainties
50
650
700
750
800
850
900
1 2 3 4 5 6 7 8 9 10 11 12 13 14 15 16 17 18 19 20
Sample
Act
ivity
of
226 R
a in
th
e sa
mp
le (
Bq
kg
dry
)
Mean
1σ
-1σ
3σ
2σ
-3σ
-2σ
FIG VIII 7 226Ra results with associated uncertainties
51
CONTRIBUTORS TO DRAFTING AND REVIEW
Hampe D Gaigl FA
Verein fuumlr Kernverfahrenstechnik und Analytik Rossendorf eV Dresden Germany IAEA Environment Laboratories Terrestrial Environment Laboratory Seibersdorf Austria
Kim C-K IAEA Environment Laboratories Terrestrial Environment Laboratory Seibersdorf Austria
Kis-Benedek Gy IAEA Environment Laboratories Terrestrial Environment Laboratory Seibersdorf Austria
Martin P IAEA Environment Laboratories Terrestrial Environment Laboratory Seibersdorf Austria
Mietelski J W The Henryk Niewodniczanski Institute of Nuclear Physics Polish Academy of Sciences Poland
Sansone U IAEA Environment Laboratories Terrestrial Environment Laboratory Seibersdorf Austria
Varga B Central Agricultural Office Food and Feed Safety Directorate Hungary
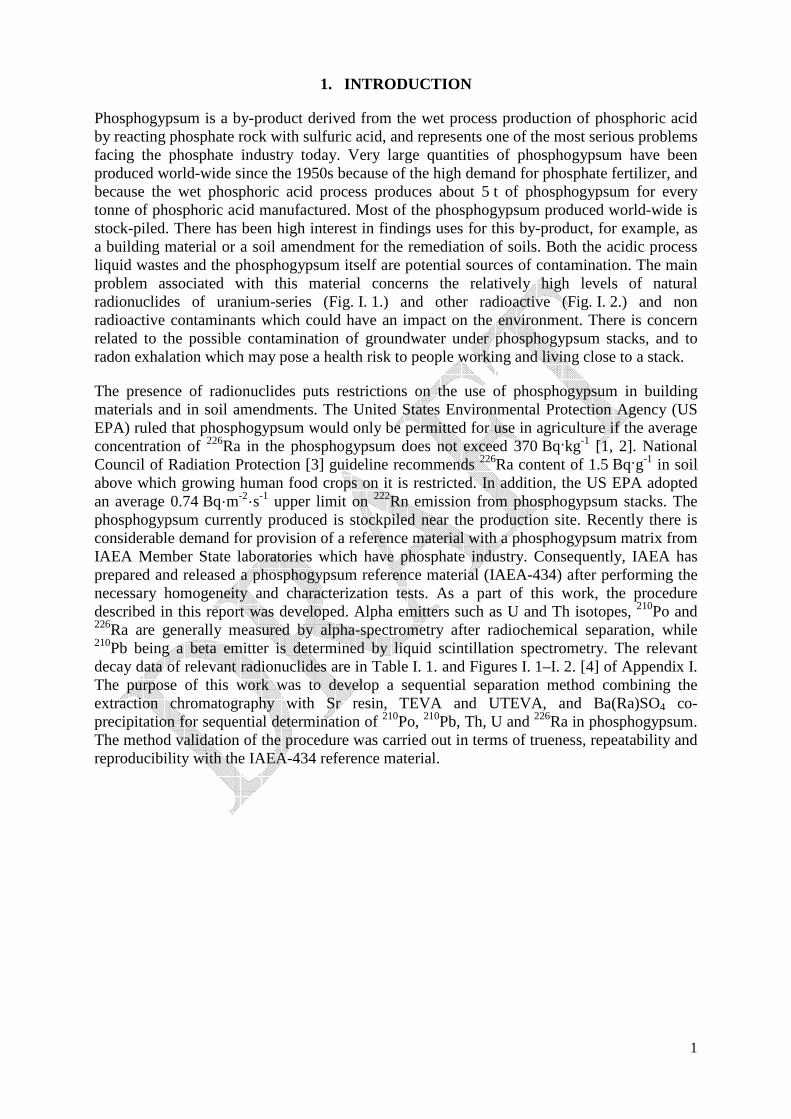
1
1 INTRODUCTION
Phosphogypsum is a by-product derived from the wet process production of phosphoric acid by reacting phosphate rock with sulfuric acid and represents one of the most serious problems facing the phosphate industry today Very large quantities of phosphogypsum have been produced world-wide since the 1950s because of the high demand for phosphate fertilizer and because the wet phosphoric acid process produces about 5 t of phosphogypsum for every tonne of phosphoric acid manufactured Most of the phosphogypsum produced world-wide is stock-piled There has been high interest in findings uses for this by-product for example as a building material or a soil amendment for the remediation of soils Both the acidic process liquid wastes and the phosphogypsum itself are potential sources of contamination The main problem associated with this material concerns the relatively high levels of natural radionuclides of uranium-series (Fig I 1) and other radioactive (Fig I 2) and non radioactive contaminants which could have an impact on the environment There is concern related to the possible contamination of groundwater under phosphogypsum stacks and to radon exhalation which may pose a health risk to people working and living close to a stack
The presence of radionuclides puts restrictions on the use of phosphogypsum in building materials and in soil amendments The United States Environmental Protection Agency (US EPA) ruled that phosphogypsum would only be permitted for use in agriculture if the average concentration of 226Ra in the phosphogypsum does not exceed 370 Bqkg-1 [1 2] National Council of Radiation Protection [3] guideline recommends 226Ra content of 15 Bqg-1 in soil above which growing human food crops on it is restricted In addition the US EPA adopted an average 074 Bqmiddotm-2middots-1 upper limit on 222Rn emission from phosphogypsum stacks The phosphogypsum currently produced is stockpiled near the production site Recently there is considerable demand for provision of a reference material with a phosphogypsum matrix from IAEA Member State laboratories which have phosphate industry Consequently IAEA has prepared and released a phosphogypsum reference material (IAEA-434) after performing the necessary homogeneity and characterization tests As a part of this work the procedure described in this report was developed Alpha emitters such as U and Th isotopes 210Po and 226Ra are generally measured by alpha-spectrometry after radiochemical separation while 210Pb being a beta emitter is determined by liquid scintillation spectrometry The relevant decay data of relevant radionuclides are in Table I 1 and Figures I 1ndashI 2 [4] of Appendix I The purpose of this work was to develop a sequential separation method combining the extraction chromatography with Sr resin TEVA and UTEVA and Ba(Ra)SO4 co-precipitation for sequential determination of 210Po 210Pb Th U and 226Ra in phosphogypsum The method validation of the procedure was carried out in terms of trueness repeatability and reproducibility with the IAEA-434 reference material
2
2 SCOPE
The sequential separation method is described for the determination of 210Po 210Pb 226Ra Th and U isotopes in phosphogypsum by isotope dilution alpha particle spectrometry and liquid scintillation spectrometry (LSC) The mass of the sample required for the radiochemical analysis is typically 05 g The method validation was carried out during the preparation of reference material of IAEA-434 and the world wide intercomparison run of IAEA-CU-2008-03 [5] The typical chemical recovery and detection limits of relevant radionuclides in the proposed procedure are summarised in the Table 1
TABLE 1 TYPICAL CHEMICAL RECOVERIES AND DETECTION LIMITS OF RELEVANT RADIONUCLIDES IN THE PROPOSED PROCEDURE
Isotope Counting method Source preparation Typical recovery () Typical detection
limit (Bqkg-1 as dry mass)
210Pb LSC precipitation 80-90 24
210Po α-spectrometry auto-deposition 40-70 12
234U α-spectrometry electrodeposition 70-80
052
238U 019
230Th α-spectrometry electrodeposition 70-80
018
232Th 052
226Ra α-spectrometry electrodeposition 60-80 43
3 NORMATIVE REFERENCES
bull ISO 119292010 Determination of the characteristic limits (decision threshold detection limit and limits of the confidence interval) for measurements of ionizing radiation ndash Fundamentals and application
bull ISO 170252005 General requirements for the competence of testing and calibration laboratories
bull ISOTS 217482004 Guidance for the use of repeatability reproducibility and trueness estimates in measurement uncertainty estimation
bull ISOIEC Guide 98-32008 Uncertainty of measurement ndash Part 3 Guide to expression of uncertainty in measurement
bull ISO 7870-12007 Control charts ndash Part 1 General guidelines
4 RESPONSIBILITIES
It is the responsibility of the analyst to follow this procedure and to establish appropriate safety and health practices Compliance with national and or internal safety rules or chemical and radioactive safety is obligatory Although the method has been carefully tested each laboratory should perform an individual validation procedure
3
5 TERMS AND DEFINITIONS SYMBOLS AND ABBREVIATIONS
In the following u(x) indicates the uncertainty in quantity x and generally the relevant isotope is indicated as subscript
a Decision threshold [Bqkg-1]
a Detection limit [Bqkg-1]
a0 Activity of the analyte on the sampling date [Bqkg-1]
astd Activity of the calibration standard [Bq g-1]
as Activity of the analyte on the separation date [Bqkg-1]
AT Activity of 225Ra tracer [Bq]
C Certified activity of the analyte in the reference material [Bqkg-1]
CPb-c Mass fraction of Pb carrier solution
CPb-s Mass fraction of Pb already present in the sample
CT Certified activity of tracer on the reference date [Bqg-1]
fAB Tailing factor correction of interfered windows A and B
fg Mass ratio of atomic mass of Pb to molar mass of PbC2O4
fT Correction factor for the decay of the tracer during elapsed time between the reference date of tracer and the beginning of the measurement
f2 Correction factor for decay of the analyte during elapsed time between the separation and the beginning of the measurement
f3 Correction factor for decay of the analyte over the counting time
mC Mass of the carrier taken (in case of lead mass of carrier solution) [g]
mf Mass of the filter used [g]
mfcal Mass of the filter used in calibration [g]
mof Total mass of PbC2O4 and the filter used [g]
mofcal Total mass of PbC2O4 and the filter used in the calibration [g]
ms Mass of the sample [kg]
mT Mass of the tracer taken [g]
mTPb Mass of the 210Pb standard solution added [g]
MPb Atomic mass of Pb [gmiddotmol-1]
MPb-oxalat Molar mass of PbC2O4 [gmiddotmol-1]
n Net counts in ROI of analyte [counts]
nT Net counts in ROI of tracer [counts]
n0 Blank or background counts in ROI of analyte [counts]
n0T Blank or background counts in ROI of tracer [counts]
Pα Probability of α decay
Pγ Probability of γ decay
4
r0 Blank or background count rate in ROI of analyte [countss-1]
r0T Blank or background count rates in ROI of tracer [countss-1]
rcal Count rates during the calibration [countss-1]
rn Net count rates in ROI of analyte [countss-1]
rnT Net count rates in ROI of tracer [countss-1]
rg Gross count rates in ROI of analyte [countss-1]
rgT Gross count rates in ROI of tracer [countss-1]
rnTmax Maximum detectable count rate [countss-1]
r0A r0B Count rates in windows A and B of the blank spectrum [countss-1]
rgA rgB and u(rgA) u(rgB) Gross count rates in windows A and B of 210Pb spectrum [countss-1]
rnA rnB Net count rates in windows A and B of 210Pb spectrum [countss-1]
R Chemical recovery of the analyte
Rcal Chemical recovery of making the calibration source
RL Reproducibility limit [Bqkg-1]
rL Repeatability limit [Bqkg-1]
SR Standard deviation of reproducibility [Bqkg-1]
Sr Standard deviation of repeatability [Bqkg-1]
t Time interval between the sampling date and the measurement date [s]
t0 Counting time of the blank or background [s]
tTs Time interval between the reference date of the tracer standard and the separation date [s]
t1 Time interval between the sampling date and the separation date [s]
t2 Time interval between the separation date and the start of the measurement [s]
t3 Counting time of the sample [s]
tT Counting time of the tracer [s]
tAc-225 Time of build up of 225Ac [s]
ts Time of the separation noted [s]
tm Time of the starting of the measurement [s]
tem Time of the end of the measurement [s]
u(0) Uncertainty of non-negative measurand
X mean value of measurement results of the analyte in reference material [Bqkg-1]
δ Relative bias of the test result []
ε Counting efficiency of the detector
λ Decay constant of the isotope [countss-1]
λT Decay constant of the tracer [countss-1]
FWHM Full width at half maximum
5
LSC Liquid scintillation counting (spectrometry)
NNDC National Nuclear Data Center Brookhaven National Laboratory
ROI Region of interest
PSA Pulse shape analysis
T12 Half-life of any isotope
6 PRINCIPLE
The sample is digested in a microwave digestion system Polonium-210 210Pb U and Th isotopes and 226Ra are separated from interfering elements with a sequential chemical procedure using extraction chromatographic resins and Ba(Pb)SO4 co-precipitation The flow chart of the combined procedure is given in Appendix II The most important features of the resins are shown in Appendix III (Sr resin TEVA and UTEVA see Figs III 1ndashIII 7) U and Th are electrodeposited on a polished stainless steel plate The polonium source is prepared on a silver plate by auto-deposition The 226Ra source is prepared by Ba(Ra)SO4 microco-precipitation The 210Pb source is prepared with Pb-oxalate precipitation Polonium-210 U Th isotopes and 226Ra are determined by isotope dilution alpha-spectrometry and 210Pb is determined by liquid scintillation spectrometry
7 CHEMICAL REAGENTS AND EQUIPMENT
71Tracers
The two tracers commonly used for 210Po determination are 208Po and 209Po Polonium-209 has a clear advantage over 208Po in energy separation from the 210Po peak and is the preferred tracer if available It should also be noted that 208Po solutions normally contain traces of 209Po A typical alpha spectrum of 209Po and 210Po is shown in Fig IV 1 of Appendix IV
Naturally occurring thorium can be determined by the following tracers 228Th and 229Th Both of them have short lived daughters which emit alpha-particles but as the energies of all their daughters are higher than 568 MeV thus no spectral interference occurs from ingrowth of daughters either 228Th or 229Th The 228Th daughter of 232U can be used as a tracer for the determination of 230Th and 232Th In this case the natural 228Th content in phosphogypsum should be measured or estimated separately to allow for this [4] An alpha spectrum of Th isotopes and its progeny is depicted in Fig IV 2 of Appendix IV
Naturally occurring uranium can be determined by the following tracers 232U 233U or 236U Among them 232U (containing 228Th daughter in known ratio close to 1) is applied most frequently The amount of 232U tracer to be added to the sample should be carefully calculated because this is the highest-energy uranium peak in the uranium spectrum and hence its tailing might affects other peaks in low energy region if the added concentration is too high A typical alpha spectrum of uranium isotopes is shown in Fig IV 3 of Appendix IV
In the case of 226Ra analysis several tracers such as 133Ba 223Ra 224Ra 225Ra might be applied Barium-133 is a most commonly used tracer for the determination of 226Ra (can be measured by gamma-spectrometry) A disadvantage of this tracer is that although its chemical behavior is very similar to that of Ra their chemical behavior is not identical as they are different elements Alternative is 225Ra (daughter of 229Th) which does not exist in nature and its decay does not produce radon which might escape from the source Radium-225 is both a beta and
6
gamma emitter with a gamma line at 4009 keV (Pγ 0300) which is well measurable with an n-type HPGe detector with carbon-epoxi or Be window Alternatively its descendants 225Ac 221Fr 217At are alpha-emitters and the determination of chemical recovery is possible via 217At at 7066 7 MeV (Pα 0999 32) using ingrowth decay equations [4] (Fig IV 4 of Appendix IV)
72Carrier
If there is no suitable radioactive tracer available the chemical recovery can be checked by using an inactive carrier namely a stable isotope of the same element as the radioactive analyte In the present case 30 mg Pb2+ carrier is used as Pb(NO3)2 solution for checking the chemical recovery of 210Pb determination gravimetrically
73Equipments
bull Standard laboratory equipment well exhausted fume-hood bull Microwave oven bull Alpha spectrometer with Si semiconductor detector bull Vacuum pump bull Liquid scintillation spectrometer bull Auto-deposition system bull Silver disk fitted to the auto-deposition cell diameter is equal or less than the
diameter of the detector used for alpha spectrometry bull Electrodeposition apparatus (Pt wire anode) equipped with DC power supply to
provide up to 1 A of regulated current to the electrolytic cell bull Stainless steel disc diameter is equal or less than the diameter of the detector used for
alpha spectrometry bull Analytical balances with accuracies of 01 mg and 001 g bull Hot plate with magnetic stirrer bull Burner bull Centrifuge plastic centrifuge tube (minimum 20 mL volume) bull Water bath with temperature controller bull Filtering set with filter paper for fine precipitate bull Chromatography columns with stopper control valve and funnel (250 mL) and holder
for them bull pH meter or pH papers bull Teflon beakers with Teflon tops and clips bull Dispensers 5-50 mL and 10-100 mL bull Micropipettes with dispensable tips (100-5000 microL) bull Timer bull Liquid scintillation vial 20 mL plastic (polyethylene) inner surface coated with
Teflon
74Chemical reagents
bull 30 mgmL-1 Pb2+ solution (usually as Pb(NO3)2) bull 04 Bq of 209Po tracer as a certified solution bull 004 Bq of 232U tracer as a certified solution bull 005 Bq of 225Ra in equilibrium with its parent 229Th as a certified solution bull HNO3 (65) (nitric acid)
7
bull HF (40) (hydrogen fluoride) bull H3BO3 (boric acid) bull HCl (32) (hydrochloric acid) bull Ultra pure water bull DTPA (diethylenetriaminepentaacetic acid) bull Sr resin (100-150 microm) bull TEVA resin bull UTEVA resin bull Cation exchange resin (AG-50W-X8 or Dowex-50) bull Fine clean quartz crystals (analytical grade) bull C6H8O6 (Ascorbic acid) bull NH4SCN (ammonium thiocyanate) bull EDTA (ethylenediaminetetraacetic acid) bull NH3(aq) (ammonia) bull (NH4)2SO4 (10) (ammonium sulfate) bull C2O4H2middot2H2O (oxalic acid) bull Methyl red solution (025) bull Thymol blue solution (025) bull Ba seeding solution [6] Weigh between 0012 and 0016 g of BaCl2 2H2O into a tall
150 mL quartz beaker Add approximately 04 mL of ultra pure water to completely dissolve the BaCl2 2H2O In a fume hood add 10 mL of the 70 sodium hydrogen sulfate solution and 2 drops of 72 HClO4 Evaporate the solution on a hot plate or a burner at high heat with continuous swirling until most of the excess sulfuric acid has been expelled and a pyrosulfate fusion is obtained Cool the beaker while rolling the melt around the sides so that the cake is deposited on the sides as uniformly as possible to facilitate rapid dissolution Cool the beaker and contents to room temperature in a desiccating chamber Add a solution of 50 mL 20 Na2SO4 to the beaker Swirl continuously until the cake is completely dissolved (place it in an ultrasonic bath for 10 minutes before each use if a build up of particulate matter occurs then make a fresh solution)
bull Sodium sulfate wash solution dissolve 100 g of anhydrous Na2SO4 in 2 L of 05 H2SO4 Filter through a 045 microm pore size membrane filter
bull CH3CH2OH (ethyl alcohol) bull Filter paper (for example Whatman 41) bull Polypropylene filter (for example Pall 01 microm pore size 25 mm diameter) bull Scintillation cocktail which forms a gel (for example InstaGel Plus) or suitable for
alphabeta separation All the chemical reagents needed to carry out this procedure must be analytical grade
8 PRECAUTIONS
Do not ash the sample if 210Po determination is required gently drying is allowed but not higher than 80oC
During the handling of the ion exchange chromatography columns always keep several mm of liquid above the surface of resin do not allow it to become dry during the separation steps
Labeling of the different fraction is essential to avoiding mixing solutions this includes the different load solutions and chemicals
8
The complete separation of Po from U is important because 210Po (Eα 5263 MeV) can interfere with the alpha peak of 232U (Eα 5320 MeV) and its activity is much higher than of U in phosphogypsum In addition 209Po (Eα 4866 MeV) can interfere with the alpha peak of 234U (Eα 4766 MeV) These are shown in Fig IV 5 of Appendix IV
The complete separation of Th from U is also important because several peaks in the spectra overlap as it is shown on Fig IV 6 of Appendix IV
Applying 225Ra as a yield tracer for the determination of 226Ra the radiochemical procedure needs to include steps to guarantee the complete separation of the parentprogeny couples 229 Th225Ra and 225Ra225Ac
9 PROCEDURE
This procedure consists of the sample dissolution the sequential separation of 210Po 210Pb Th and U isotopes and 226Ra from interfering elements and the source preparation for alpha spectrometry and liquid scintillation spectrometry (see the flowchart in Appendix II)
91Sample dissolution using microwave digestion system
(a) Weigh 05 g of phosphogypsum into a microwave container
(b) Add about 30 mg of Pb2+ (usually as Pb(NO3)2 solution) about 04 Bq of 209Po and 004 Bq of 232U tracer and 005 Bq of 225Ra in equilibrium with its parent 229Th
(c) Add 15 mL 65 HNO3
(d) Consecutively digest the sample in the microwave oven at 120degC for 15 min and at 150degC for 25 min at 1000 W
(e) Transfer the sample solution into a plastic centrifuge tube and centrifuged for 10 min
(f) Transfer the supernatant into a Teflon beaker The residue is transferred back into the microwave container with 3 mL of 65 HNO3 and add 2 mL of 40 HF
(g) Digest the residue in the microwave oven using the same condition as mentioned above
(h) Combine the solution with the supernatant from step (f)
(i) Add 01 g H3BO3 and evaporate repeatedly to dryness with three portions of 5 mL of 65 HNO3 to remove HF
(j) Dissolve the residue in 30 mL of 2M HCl
92Chemical separation procedures
921 Polonium and lead separation
(a) Prepare the Sr resin column with volume of approximately 8 mL (diameter 10 mm length 100 mm) as follows soak the resin in ultra pure water for at least 1 hour before use then fill the column with resin and put a quartz crystal layer of approximately 10 mm on the top avoiding disturbance of the resin The elution steps should be finished on the same working day
(b) Load the sample solution onto the Sr resin column preconditioned in advance with
9
100 mL 2M HCl flow rate 5-6 dropmin rinse the baker several times with 1 mL of 2M HCl
(c) Wash the column with 100 mL of 2M HCl followed by 25 mL 6M HNO3 to remove the non-retained ions
(d) Combine the effluent and the washing solution into same beaker and use it for the analysis of uranium and thorium
(e) Strip Po with 60 mL 6M HNO3 flow rate 5-10 dropsmin
(f) Elute Pb with 60 mL 6M HCl into the centrifuge tube flow rate 5-10 dropsmin
(g) Sr resin columns can be reused several times Regenerate with 50 mL ultra pure water wash it with 10 mL 01M EDTA (pH adjusted to pH7 with NH3(aq)) then wash with 50 mL ultra pure water and before use load it with 100 mL 2M HCl
922 Thorium separation
(a) Prepare the TEVA column with a volume of 14 mL (diameter 8 mm length 28 mm) as follows soak the resin in ultra pure water for at least 1 hour before use then fill the column with resin and put a quartz crystal layer of approximately 3 mm on the top avoiding disturbance of the resin
(b) Evaporate the combined effluent and washing solutions from Sr resin column (921 step (d))
(c) Dissolve the residue in 20 mL 3M HNO3
(d) Load the sample on the TEVA column preconditioned in advance with 20 mL 3M HNO3
(e) Wash the column with 10 mL 3M HNO3
(f) Combine the effluent and the washing solution into the same baker and use it for analysis of uranium
(g) Additionally wash the column with 20 mL 3M HNO3 this fraction is discarded
(h) Elute Th with 20 mL 8M HCl
(i) Note the time of the separation of Th for recovery calculation of 226Ra
923 Uranium separation
(a) Prepare the UTEVA column with volume 14 mL (diameter 8 mm length 28 mm) as follows soak the resin in ultra pure water for at least 1 hour before use then fill the column with the resin and put a quartz crystal layer of approximately 3 mm on the top avoiding the disturbance of the resin
(b) Load the combined effluent and the washing solution from the TEVA column (922 step (f)) onto UTEVA column preconditioned in advance with 20 mL of 3M HNO3
(c) Wash the column with 20 mL 3M HNO3
(d) Combine the effluent and the washing solution into the same beaker and use it for Ra analysis
(e) Wash the column with 5 mL 9M HCl and 15 mL 6M HCl to remove small amounts of Po and Th remained on the column
10
(f) Elute U with 6 mL ultra pure water
924 Radium separation [6]
(a) Combine the effluent (20 mL 3M HNO3) and the washing solution (30 mL 3M HNO3) from the UTEVA column in a 200 mL volume of beaker (923 step (b) and (c))
(b) Add 4 mL concentrated H2SO4 and 20 mL 20 Na2SO4 to the solution
(c) Slowly add 5 mL Pb2+ carrier (10 mgmL-1) to form a Pb(RaBa)SO4 co-precipitate while stirring for 1ndash2 minutes
(d) Remove stirrer bars washing with a small amount of 01M HCl and ultra pure water
(e) Allow to sit for 3ndash4 hours
(f) Decant supernatant liquor to a volume as low as possible
(g) Transfer the precipitate into a 50 mL conical centrifuge tube using 80 ethanol and centrifuge at 3000 revolutionsmin for 10 minutes
(h) Wash the precipitate with 20 mL 80 ethanol and decant the supernatant
(i) Wash the sides of the centrifuge tube with 5ndash10 mL sodium sulfate wash solution and vortex to mix thoroughly then add a further 5ndash10 mL to wash down the walls and then re-centrifuge at 3000 revmin for 10 minutes
(j) Pour out supernatant then invert the tube and wash the walls with ultra pure water to remove excess acid and sulfate (take care not to disturb the precipitate)
(k) Add 10 mL 02M DTPA (diethylenetriaminepentaacetic acid) and 1 drop of 025 thymol blue The solution should turn deep blue if not add 10M NaOH dropwise until a deep blue color is reached (pHgt9)
(l) Vortex to dissolve the precipitate
93Source preparation
931 Polonium-210 source
(a) The Po solution is carefully evaporated to dryness at less than 150degC
(b) Dissolve the residue in 10 mL 05M HCl
(c) Clean a silver disc with acetone followed by cc NH3(aq) followed by ultra pure water
(d) Place the cleaned silver disc into the deposition cell (Teflon vial) with another disc placed underneath for support Check if the cell is watertight
(e) Add 005 g ascorbic acid into the sample solution to reduce Fe3+ to Fe2+ check the colour change after mixing one drop of sample solution and one drop of 01M NH4SCN Add ascorbic acid until the dark red colour disappears
(f) Transfer the solution to the deposition cell
(g) Rinse the beaker with 2 x 2 mL 05M HCl and adjust the pH of the solution in the deposition cell to pH2 with 6M NaOH
(h) Place the deposition cell into a water bath at 90oC for 90 min with mechanical stirring or air bubbling
11
(i) Remove the silver disc wash with acetone or ultra pure water and dry it at room temperature
932 Uranium and thorium sources
(a) The purified U or Th solution is evaporated to dryness three times with a few mL 65 HNO3 to destroy any existing organic matter
(b) Dissolve the residues in 10 mL 10 (NH4)2SO4 solution at pH2 (The pH of samples being deposited for thorium should be slightly more acidic pH15-pH2)
(c) Transfer the solution into an electrodeposition cell
(d) Electrodeposit U or Th onto polished stainless steel discs at 1 A for 90 minutes respectively
(e) At the end of the deposition time fill the cell with 15M NH4OH and continue deposition for 1 min then turn off the main power of deposition unit and disconnect the cathode
(f) Rinse the cell twice with 1 NH4OH then three times with ultra pure water
(g) Disassemble the cell rinse the disc with ultra pure water and dry it
933 Radium source (BaSO4 micro co-precipitation)
(a) Rapidly add 4 mL mixed solution of 5 parts of 20 Na2SO4 with 1 part of acetic acid to the solution from the step 924 (l)
(b) Add 04 ml Ba seeding solution as soon as possible (2ndash3 s)
(c) Adjust pH to 48 with diluted H2SO4 as indicated by the colour change to a bright red
(d) Allow to sit for at least 30 minutes
(e) Filter the colloidal suspension of Ba(Ra)SO4 through a pre-wetted (by 80 ethanol) polypropylene filter (for example 01 microm pore size 25 mm diameter Pall)
(f) Rinse the centrifuge tube walls with 4ndash5 mL sodium sulfate wash solution and filter
(g) Rinse the sides of the filter holder with 15ndash20 drops 80 ethanol
(h) Allow the filter to dry and place it into a 47 mm Petri dish The time is recorded which is considered as the time of 225Ra225Ac separation or start of 225Ac ingrowth
The source preparation must be completed on the same day
934 Lead-210 source
(a) Evaporate the Pb solution which obtained from the step of 921(f) and re-evaporate with three portion of 5 mL 65 HNO3
(b) Dissolve the residue in 10 mL 1M HNO3
(c) Add 40 mg oxalic acid to the solution and adjust pH2ndash3 with 25 NH4OH to prepare a Pb-oxalate precipitate
12
(d) Let the solution to cool down and filtrate the precipitate on a filter paper (for example Whatman 41 dried in a drying oven and weighed in advance) wash the filter 3 times with 1 mL water and 2 mL 80 ethanol
(e) Dry the precipitate (40ndash50oC) and cool down in a desiccator
(f) Weigh the dried precipitate and calculate the chemical recovery using the gravimetric method
(g) Quantitatively transfer the precipitate into a liquid scintillation vial together with the filter and add 1 mL of 6M HNO3 into the vial to dissolve the precipitate
(h) Mix the solution with 15 mL of scintillation cocktail
94Measurement
941 Alpha-spectrometry
(a) Introduce the source into the vacuum chamber and pump until a vacuum of about 05 Pa (5 x 10⁻³ mbar) is obtained Then switch on the bias voltage button of detector
(b) Record the file name sample information (unit code sample name sample volume as it is required by the actual quality management system) and measurement date in each detector log book and start the measurement A typical measuring time is about 1 day when using a 450 mm2 area detector
(c) Integrate the counts in the peaks corresponding to the alpha emitting tracers and analytes respectively The alpha spectra should be similar to the spectra illustrated in Fig IV 4 of Appendix IV The FWHM of alpha peaks should be in the range of 30ndash60 keV
(d) Spectrum analysis Integrate the channel counts in a region of interest (ROI) which has the width of about 4 x FWHM (about 3 x FWHM to the left and 1 x FWHM to the right when FWHM is about 30ndash60 keV) Integrate the channel counts in the same regions of interest (ROI) in the sample spectrum and in the blank spectrum then subtract them from the sample spectrum to give the net area of peaks for further calculation
Performing a reliable measurement knowing the background of the chamber and detector is essential moreover it is important to prepare a separate reagent blank Therefore the set of measurement always has to involve above the samples a background and a reagent blank If the quality of the determination has to be proved a reference material also should be part of the preparation series
942 Liquid scintillation spectrometry for determination of 210Pb
9421Source preparation for determination of counting efficiency of 210Pb
(a) Take 10 mL 2M HCl solution into a 50 mL beaker
(b) Add the 210Pb standard solution (10ndash15 Bq) and 30 mg Pb2+ carrier to the solution
(c) Load the solution onto a Sr resin column (3 g of Sr resin 100-150 microm) which has been preconditioned in advance with 100 mL 2M HCl
(d) Wash the column with 80 mL 2M HCl Combine the washing solution with the effluent to get a pure 210Bi fraction
13
(e) Rinse the column with 20 mL 2M HCl This last portion of 20 mL 2M HCl is discarded to avoid overlapping between the 210Bi and 210Po portions
(f) Wash the column with 25 mL 6M HNO3
(g) Elute Po with 60 mL 6M HNO3
(h) Elute Pb with 60 mL 6M HCl
(i) Evaporate the Bi Po and Pb fractions to dryness
(j) Dissolve each portion of 210Bi and 210Po in 1 mL 6M HNO3 and then transfer them into 20 mL polyethylene vials coated with PTFE (polytetrafluoroethylene)
(k) Mix the solution with 14 mL scintillation cocktail
(l) Evaporate Pb fraction three times with 2 mL 65 HNO3
(m) Dissolve the residue in 20 mL 1M HNO3
(n) Add 04 g oxalic acid while warming and stirring
(o) Adjust the pH to 3ndash5 with NH4OH to form a Pb-oxalate precipitate
(p) Filter the precipitate through a pre-weighed filter paper (diameter of 24 mm)
(q) Wash the precipitate three times with 1 mL water followed by 2 mL 80 ethanol
(r) Dry the precipitate in an oven at 40ndash50oC
(s) Cool and weigh the precipitate to determine the chemical recovery of lead
(t) Carefully transfer the Pb-oxalate precipitate into a 20 mL of liquid scintillation vial together with the filter
(u) Add 1 mL 6M HNO3 to the vial to dissolve the precipitate
(v) Mix with 14 mL of scintillation cocktail
(w) Set up windows for 210Pb and 210Bi and count the three vials (for 210Pb 210Bi and 210Po) in a liquid scintillation counter until the counting statistic uncertainty is less than 1
9422Optimum window setting for 210Pb
The activity concentration of 210Pb is determined by LSC adjusted to the low energy mode and low bias with double energetic window method [7] For the successful determination of this radionuclide two counting windows should be optimized because of the overlapping of the beta spectra of 210Pb and 210Bi The result of the optimization of counting region is shown in the Fig V 1 of Appendix V In this example the lower limit for the 210Pb energy (window A) is set at channel 115 to avoid the counts caused by chemiluminescence in the cocktail while the upper limit is set at channel 320 where the 210Pb peak ends The lower limit for the 210Bi energy region (window B) is set at channel 320 and the upper limit is set at channel 410 to avoid interference from the 210Po peak
9423 Counting efficiency of 210Pb
The efficiency of liquid scintillation for beta particles depends on the energy of the beta decay For most beta particles with a maximum beta-energy above 100 keV efficiency is high more than 90 For lower energy beta particles the efficiency is usually less and the real value depends on the degree of quenching in the sample
14
To determine the efficiency a known activity of 210Pb in equilibrium with its daughters has to be measured several times (it is practical to choose more than 10 times of counting for getting a good estimate of the uncertainty in the efficiency)
10 EXPRESSION OF RESULTS
101 Calculation of activities of relevant isotopes
1011 Calculation of the activity of 210Pb
10111 Calculation of the counting efficiency of 210Pb
The counting efficiency (ε) of 210Pb can be calculated by Eqs (1 2)
TsPb tPbTPbstdcal emaR
Z210
210210minusminus
minusminus
= λε ( 1 )
BAnBnA frrZ minus= ( 2 )
where
BBgBnAAgAn rrrrrr 00 minus=minus=
fAB Tailing factor (See Ch 10112)
Rcal Chemical recovery of making the calibration source (See Ch 10113)
10112 Calculation of the tailing factor
The 210Pb energy region (window A) is interfered with counts from ingrown 210Bi The interference is compensated for by using the ratio of counts in window A to those in window B in a pure 210Bi spectrum the so-called ldquotailing factorrdquo fAB The tailing factor is independent of the activity level of 210Bi in the sample but is dependent on the quenching level of the sample The quenching levels of the calibrant the sample and the reagent blank are necessary to keep constant within plusmn2 relative standard deviation The tailing factor can be calculated by the following formula
210
210
minus
minus=BistdBn
BistdAnBA r
rf (3)
where BBistdBgBistdBnABistdAgBistdAn rrrrrr 02102100210210 minus=minus= minusminusminusminus
10113 Chemical recoveries of Pb in calibration source and sample
The chemical recovery of lead in the calibration source preparation process is determined gravimetrically using Eq (4)
15
ccPb
calfcalofgcal mC
mmfR
minus
minus=
)( ( 4 )
When the amount of Pb in the sample is not negligible compared with that in the Pb carrier the sample Pb content should be allowed for in calculation of the chemical recovery of Pb The chemical recovery of Pb in the sample can be calculated by Eqs (5 6)
)(
)(
ssPbccPb
fofg
mCmC
mmfR
minusminus +minus
= ( 5 )
Mass ratio (fg) of atomic mass of Pb to molar mass of Pb-oxalate
oxalatePb
Pbg M
Mf
minus
= (6 )
10114 Calculation of the activity of 210Pb
The activity of 210Pb on the separation date can be calculated from the LSC measurement using the following equations
Rm
ffZa
s
PbPbsPb ε
minusminusminus = 32
210 (7)
22102
tPb
Pbef minusminusminus = λ ( 8 )
321013210
3 tPb
PbPbe
tf
minusminus= minus
minus λλ
(9 )
However if the time interval (t2) between the separation of 210Pb and the beginning of the measurement and the counting time of the sample (t3) are much smaller than the half life of 210Pb (222 y) f2-Pb f3-Pb u(f2-Pb) and u(f3-Pb) are negligible
1012 Calculation of the activity of 210Po
The activity of 210Po on the separation date is calculated according to the procedure detailed in IAEAAQ12 [8]
1013 Calculation of the activities of the U and Th isotopes
The ratio of the net counts of the tracer and analyte peak is used to calculate the activity of the analyte in the sample on the date of chemical separation taking into account the activity of the tracer solution the masses of the sample and the tracer used The activity of the analyte (as Bq(kg dry)-1) at the separation time is calculated by the following formula
16
TgT
g
s
TTTTT
nTs
nTs rr
rr
m
fmCfm
rm
rCa
0
0
minusminus
== (16)
The decay of the tracer between its reference date (from the certificate) and counting is taken into correction by fT as follows
sTT t
T ef λminus= (17)
The activity of analyte in the sample should be calculated back to the date of sample collection
teaa
λminus=0 (18)
The detector efficiency is not needed in isotope dilution alpha spectrometry for calculation of the activity of the analyte but is needed for calculation of the chemical recovery It is determined from the activity of the tracer added and the net counts in the corresponding peak as follows
sTT t
TT
nT emC
rR λ
εminus= (19)
The detector efficiency is determined by the calibration source prepared in a similar way as the analytes and using the same measurement conditions For analytes which are co-precipitated the calibration source also should be co-precipitated using the same conditions including filter diameter For analytes which are electrodeposited the calibration source should also be prepared by electrodeposition Efficiency determinations are typically performed and regularly checked in the frame of analytical quality control The efficiency can be calculated according to the following equation
cal
caln
A
r =ε (20)
Where
Rn cal net count rate of calibration source in respective ROI
Acal certified activity of the calibration source
1014 Calculation of the activity of 226Ra [9]
10141 Calculation of the chemical recovery of Ra
The chemical recovery is determined by using the peak of 217At at 70669 keV (Pα 0999 32) The ingrowth of 225Ac (T12 100 d) the daughter of 225Ra is directly associated with the short lived progenies 221Fr (T12 48 min) 217At (T12 323 ms) and 213Po (T12 37 micros) When the daughters are in equilibrium with 225Ra the 217At peak shows no overlap with descendants of natural isotopes of radium in the alpha spectrum (225Ac interferes with 224Ra 221Fr interferes with 220Rn) From the initial tracer activity AT (added 229Th225Ra) the maximum detectable count rate rnTmax is calculated by taking into account the decay of unsupported 225Ra after its separation from Th (tsTh-229) as well as the build-up of 225Ac (tsRa-225) in the following equation
17
225225
225)(max
229225225
minusminus
minusminusminus
minus= minusminusminus
RaAc
ActtTnT
sThsRaRaeArλλ
λε λ (21)
The chemical recovery R is calculated as ratio of the measured count rate rnT and theoretical value rnTmax
maxnT
nT
r
rR = (22)
10142 Calculation of activity of 226Ra
While AT is the activity of the 225Ra tracer after the separation from 229Th its activity at the beginning of the build-up of 225Ac is yielded as follows
)(225
225225 sAcRa ttTRa eAA minusminus
minusminusminus= λ
( 2 4 )
The activity of 225Ac in any time is given by
( )225225
)()(225225
225
225225225225
minusminus
minusminusminusminusminusminus
minus minusminus=
minusminusminusminus
RaAc
ttttRaAc
Ac
AcAcAcRa eeAA
λλλ λλ
(25)
Integrating over the counting period with tm as the start and tem as the end of the measurement results into the activity of 225Ac at tem
( )( )( ) ( )( )
minusminusminus
= minusminusminusminus minusminusminusminus
minusminusminus
minusminusminus
225225225225
225225225
225225225
1)( AcemRaAcmRa tttt
RamemRaAc
AcRaemmAc ee
ttAttA λλ
λλλλ
( ) ( )( )
minusminus minusminusminusminus minusminusminusminus
minus
225225225225
225
1AcemAcAcmAc tttt
Ac
ee λλ
λ (26)
Finally the activity concentration of 226Ra is the following
217
226225226 )(
minus
minusminusminus =
At
RaemmAcRa r
rttAA (27)
where
0
0226226226 t
n
tt
nr Ra
mem
RaRa
minusminusminus minus
minus= and
0
0217217217 t
n
tt
nr At
mem
AtAt
minusminusminus minus
minus=
102 Expression of combined uncertainties of relevant isotopes
According to the Guide to Expression of Uncertainty in Measurement [11 12] the combined uncertainty is described in detail and an example is calculated for each relevant radionuclide in Appendix VI
18
103 Decision threshold
In accordance with ISO 119292010 the decision threshold gives a decision on whether or not the physical effect quantified by the measurand is present
The decision threshold a is the non-negative measurand quantifying the physical effect of interest If the result a is below the decision threshold the result can not be attributed to the physical effect nevertheless it can not be concluded that it is absent If the physical effect is really absent the probability of taking the wrong decision that the effect is present is equal to the specified probability of α (the error of first kind often chosen 005 and moreover α=β where β is the error of second kind then k1-α=k1-β=165) Any of the determined primary measurement result is only significant for the true value of the measurand to differ from zero if it is larger than the decision threshold given here
a=k1-αu(0) where u(0) is the uncertainty associated to the non-negative measurand uncertainty of decision threshold itself (with other words it can be estimated as uncertainty associated to slightly higher values than background or reagent blank depending on the procedure) and can be quantified here as
20
0
03
01)0(
t
n
tt
n
Rmu
s
+=ε
(28)
104 Detection limit
In accordance with ISO 119292010 the detection limit indicates the smallest true value of the measurand which can be still detected with the applied procedure this gives a decision on whether or not the measurement procedure satisfies the requirements and is therefore suitable for the intended measurement purpose In order to find out whether a procedure is suitable for the purpose the detection limit is compared with the specified guideline value of the measurand
The detection limit a is the smallest true value of the measurand for which the probability of the wrong assumption that the physical effect is absent does not exceed the probability β (error of the second kind) The detection limit is obtained as the smallest solution of the following equation
a=a+k1-β(a) where a ge a (29)
Eq (29) is an implicit equation which can be calculated by iteration As a starting approximation a1=3a can be chosen in most cases the iteration converges and the linear interpolation with approximation of a=(k1-α+k1-β)u(a) leads to the approximation
)0()( 221
21
2 ukkqqa αβ minusminus minus++= (30)
with [ ]
minus+= minusminus )0()(
2
1)0( 2
12
1
21
1 uaua
kukq a
β (31)
If α=β than k1-α=k1-β=k a=2q follows
19
[ ])0()()0(2 21
2
1
2 uau
a
kuka minus+= (32)
Where α is the probability of the error of first kind the probability of rejecting a hypothesis if it is true and β is the probability of the error of second kind the probability of accepting a hypothesis if it is false
The detection threshold and limit of the isotopes in the applied procedure are described in Table VII 1 of Appendix VII
The difference between using the decision threshold and using the detection limit is that the measured values are to be compared with the decision threshold whereas the detection limit is to be compared with the guideline value (guideline value corresponds to scientific legal or other requirements for which the measuring procedure intended to assess)
11 VALIDATION OF THE PROCEDURE
The procedure was validated with an IAEA reference material IAEA-434 The material was initially characterized at IAEA Environment Laboratories in Seibersdorf during the feasibility study phase Then the characterization of the material took place within the interlaboratory comparison piloted by IAEA Environment Laboratories in Seibersdorf in cooperation with the Consultative Committee on Ionization Radiation (CCRI) of the International Bureau des Poids et Mesure (PIBM) The results reported in this comparison were used to derive the property values of the measurands of interest The IAEA-434 reference material [12] was collected from a processing plant located in Gdansk (Poland) in 2003 The matrix composition is CaSO4middot2H2O (96) P2O5 (1-2) F total (12) SiO2 (1) Al2O3 (02) The property values of all radionuclides of IAEA 434 were established on the basis of a robust approach proposed by DL Duewer [13] and the Mixture Model median (MM-median) of the analytical results reported by the expert laboratories was calculated To estimate the standard uncertainty associated with the property value the MM-median based standard deviation was calculated from the span of the central 50 of the MM probability density function The validation results of the procedure are shown in Tables VIII 1 and VIII 2 Figs VIII 1ndashVIII 7 of Appendix VIII 111 Trueness of the method
The relative bias of the method is calculated by the following formula
100() timesminus=C
CXδ (34)
112 Precision of the method
The precision index ( PI() ) is calculated according to the following formulas
100)()(
()2
2
2
2
times+=X
Xu
C
CuPI (35)
20
113 Repeatability limit
The repeatability limit is estimated by analyzing five subsamples from the same bottle of the IAEA-434 reference material for the relevant radionuclides investigating the repeatability conditions instrument analyst shortest time etc The repeatability limit is calculated by the following formula
rL Sr 82= (36)
114 Reproducibility limit
The reproducibility limit is also estimated by analyzing the IAEA-434 reference material from ten duplicates samples were taken from ten randomly selected packing unit with at least one parameter being changed in the analytical system (analyst analysis date instrument etc) The reproducibility limit is calculated by the following formula
RL SR 82= (37)
115 Outlier test
The presence of individual values that appear to be inconsistent with all other laboratories or values may cause some problems during the final evaluation of data According to ISO 5725-2 an outlier test should be performed before the calculation of repeatability and reproducibility The analysis includes a systematic application of a statistical test of outliers a great variety are available which could be used for the purposes of this part of ISOIEC 17025 Usually the graphical consistency technique or the numerical outlier test are applied Cohranrsquos test of variabilities should be applied first and then any necessary action should be taken Grubbrsquos test is primarily a test of in between laboratory variability
116 Acceptance criteria
The method can be accepted if
PI()lt 25
LRltδ ( 3 8 )
According to these criteria the method performs well as the Table VIII 1 of Appendix VIII shows
12 TEST REPORT
The test report shall conform to ISOIEC 17025 requirements and shall contain the following information
bull a title (test report calibration report reference material production etc)
bull the name and address of the laboratory and location where any part of the test or calibration or production of reference material etc were carried out
bull unique identification of the report on each page with numbering of pages
21
bull analysis request code
bull reference to the measurement method used
bull sampling date (if available)
bull sample description
bull sample code or identification number
bull date of the separation of analyte
bull applied tracers with their reference dates and activity values with the code of their certificate
bull the results with units of measurement and associated uncertainty value expressed in the same unit as the result
bull date to which the test result has been corrected (corrected to the sampling date or separation time dd-mm-yyyy)
bull responsible person (with accessibility)
22
REFERENCES
[1] FEDERAL REGISTER National emission standards for hazardous air pollutants 57 107 (1992) 23305-23320
[2] RUTHERFORD PM DUDAS MJ AROCENA JM Heterogeneous distribution of radionuclides barium and strontium in phosphogypsum by-product Sci Total Environ 180 (1996) 201-209
[3] NATIONAL COUNCIL ON RADIATION PROTECTION AND MEASUREMENTS Evaluation of Occupational and Environmental Exposures to Radon and Radon Daughters in the United States NCRP Report 78 (1984)
[4] MARTIN P HANCOCK GJ Routine analysis of naturally occurring radionuclides in environmental samples by alpha-particle spectrometry Supervising Scientist Report 180 (2004) httpwwwenvironmentgovaussdpublicationsssr180html
[5] INTERNATIONAL ATOMIC ENERGY AGENCY Reference Material IAEA-434 Naturally Occurring Radionuclides in Phosphogypsum IAEA Analytical Quality in Nuclear Applications Series No 17 IAEAAQ17 IAEA Vienna (2010)
[6] MEDLEY P BOLLHOumlFER A ILES M RYAN B MARTIN P Barium sulfate method for radium-226 analysis by alpha spectrometry Environmental Research Institute of the Supervising Scientist internal report 501 (2005)
[7] VAJDA N LAROSA J ZEISLER R DANESI P KIS-BENEDEK G A Novel Technique for the Simultaneous Determination of 210Pb and 210Po using a Crown Ether J Environ Radioactivity 37 (1997) 355-372
[8] INTERNATIONAL ATOMIC ENERGY AGENCY A Procedure for the Determination of Po-210 in Water Samples by Alpha Spectrometry IAEA Analytical Quality in Nuclear Applications Series No 12 IAEAAQ12 IAEA Vienna (2009)
[9] GUOGANG J TORRI G INNOCENZI P OZONE R Di LULLO A Determination of radium isotopes in mineral and environmental water samples by alpha-spectrometry J of Radioanalytical and Nuclear Chemistry 267 3 (2005) 505-514
[10] EURACHEMCITAC Guide Quantifying uncertainty in analytical measurement 2nd Ed(2000)
[11] INTERNATIONAL ATOMIC ENERGY AGENCY Quantifying Uncertainty in Nuclear Analytical Measurements IAEA-TECDOC-1401 IAEA Vienna (2004)
[12] SHAKHASHIRO A SANSONE U Technically Enhanced Naturally Occurring Radionuclides (TENORM) in Phosphogypsum The Interlaboratory Comparison CCRI(II)07-35 Metrologia (2009)
[13] DUEWER DL A Robust Approach for the Determination of CCQM Key Comparison Reference Values and Uncertainties Working document CCQM04-15 BIPM wwwbipminfoccCCQMAllowed10CCQM04-15pdf (2004)
23
[14] Monographie BIPM-5 Vol 1ndashMonographie BIPM-5 Vol 5
httpwwwnucleideorg Decay Data Evaluation Project (DDEP) accessed in October 2010
[15] NuDat 25 (Database at the US NNDC) httpwww-ndsiaeaorg accessed in October 2010
[16] HORWITZ et al A Novel Strontium-Selective Extraction Chromatographic Resin Solvent Extraction amp Ion Exchange 10 (1992) 313
[17] HORWITZ et al Extraction Chromatography of Actinides and Selected Fission Products Principles and Achievement of Selectivity presented at International Workshop on the Application of Extraction Chromatography in Radionuclide Measurement IRMM Geel 1998
[18] HORWITZ et al Separation and Preconcentration of Actinides by Extraction Chromatography Using a Supported Liquid Anion Exchanger Application to the Characterization of High-Level Nuclear Waste Solutions Analytica Chimica Acta 310 (1995) 63-78
[19] HORWITZ et al Separation and Preconcentration of Uranium from Acidic Media by Extraction Chromatography Analytica Chimica Acta 266 (1992) 25-37
[20] C-K KIM MARTIN P FAJGELJ A Quantification of measurement uncertainty in the sequential determination of 210Pb and 210Po by liquid scintillation counting and alpha particle spectrometry Accreditation and Quality Assurance 13 12 (2008) 691-702
[21] J KRAGTEN Calculating Standard Deviation and Confidence Intervals with a Universally Applicable Spreadsheet Technique Analyst 119 (1994) 2161ndash2165
24
APPENDIX I NUCLEAR DATA OF RELEVANT RADIONUCLIDES AND DECAY CHAINS OF U
AND Th SERIES
TABLE I 1 NUCLEAR DATA OF RELEVANT RADIONUCLIDES [14]
Radionuclide Half-life Disintegration modes
E (MeV) Probability ()
225Ac 100(1) d α 5580 5(14) 095(4)
α 5599 3(14) 0114(7)
α 5609 0(14) 109(5)
α 5637 3(14) 416(23)
α 5682 2(14) 131(4)
α 5686 4(14) 0021(14)
α 5723 1(14) 203(23)
α 5730 5(14) 16(3)
α 5731 6(14) 124(10)
α 5731 9(17) 90(5)
α 5797 7(14) 62(9)
α 5793 1(21) 189(20)
α 5804 2(14) 03
α 5829 6(14) 524(24)
217At 323(4) x 10-3 s α 6484 7(16) 0016 7(8)
α 6813 8(16) 0038 4(15)
α 7066 9(16) 99932(3)
133Ba 10540(6) y γ 0053 162 2(6) 214(3)
γ 0079 614 2(12) 265(5)
γ 0080 997 9(11) 329(3)
γ 0276 398 9(12) 716(5)
γ 0302 850 8(5) 1834(13)
γ 0356 012 9(7) 6205(19)
γ 0383 848 5(12) 894(6)
210Bi 5012(5) d β 1162 1(8) 99999 86(2)
212Bi 6054(6) min β 0633(2) 190(4)
β 0741(2) 145(29)
β 1527(2) 458(21)
β 2254(2) 5523(21)
α 6050 92(4) 251(1)
α 6090 02(4) 97(1)
221Fr 479(2) min α 6126 3(15) 151(2)
α 6243(2) 134(7)
α 6341 0(13) 828(2)
TABLE I 1 NUCLEAR DATA OF RELEVANT RADIONUCLIDES [14] (cont)
25
Radionuclide Half-life Disintegration modes
E (MeV) Probability ()
210Pb 2223(12) y β 0017 0(5) 802(13)
β 0063 5(5) 198(13)
γ 0046 539(1) 4252(40)
208Po 2898(2) y α 5114 9(14) 99995 8(4)
α 4220(15) 24(7)x10-4
209Po 115(13) y α 4885(2) 198(32)
α 4883(2) 792(32)
α 4622(5) 0548(7)
210Po 138376 3(17) d α 5304 33(7) 99998 76
α 4516 66(9) 0001 24(4)
213Po 370(5) x 10-6 s α 8375 9(25) 99995 0(5)
216Po 0150(5) s α 6778 6(5) 99998 1(3)
α 5988 6(10) 0001 9(3)
218Po 3094(6) min α 6002 35(9) 99976 9(32)
223Ra 1143(5) d α 5747 0(4) 900(20)
α 5716 23(29) 516(13)
α 5606 73(30) 252(5)
α 5539 80(90) 900(20)
224Ra 3627(7) d α 5448 81(16) 526(7)
α 5685 50(15) 9472(7)
γ 0240 986(6) 412(4)
225Ra 1482(19)d β 0316(5) 688(20)
β 0356(5) 312(20)
γ 0040 09(5) 300(7)
226Ra 1 600(7) y α 4601(1) 595(4)
α 4784 34(25) 94038(40)
228Ra 575(4) y β 00127(7) 30(10)
β 00256(7) 87(9)
β 00391(7) 49(10)
β 00395(7) 12(10)
220Rn 558(3) s α 5748 46(14) 0118(15)
α 6288 22(10) 99882(15)
222Rn 3823 2(8) d α 5489 48(30) 9992(1)
228 Th 69860(23) d α 5176 89(23) 020(2)
α 5211 08(22) 038(3)
α 5340 38(22) 262(2)
α 5423 28(22) 732(2)
TABEL I 1 NUCLEAR DATA OF RELEVANT RADIONUCLIDES [14] (cont)
26
Radionuclide Half-life Disintegration
modes E (MeV) Probability ()
229 Th 7 340(160) y α 5053(2) 660(10)
α 4978 5(12) 317(4)
α 4967 5(12) 597(6)
α 4901 0(12) 1020(8)
α 4845 3(12) 5620(20)
α 4814 6(12) 930(8)
230 Th 7538(30) x 104 y α 4687 0(15) 763(3)
α 4620 5(15) 234(10)
232 Th 1402(6) x 109 y α 3810 0(14) 0068(20)
α 3948 5(14) 210(13)
α 4011 2(14) 789(13)
234 Th 2410(3) d β 0105(10) 65(7)
β 0106(10) 141(12)
β 0198(10) 778(15)
γ 0063 30(2) 375(8)
232U 706(11) y α 5263 48(9) 306(6)
α 5320 24(9) 691(6)
233U 1592(2) x 105 y α 4824 2(12) 843(6)
α 4783 5(12) 132
234U 2455(6) x 105 y α 4603 5(7) 0210(2)
α 4722 4(7) 2842(2)
α 4774 6(7) 7137(2)
235U 704(1) x 106 y α 4322(4) 333(6)
α 4397 8(13) 5719(20)
α 4414 9(5) 301(16)
α 4502 4(7) 128(5)
α 4556 0(4) 379(6)
α 4596 4(13) 474(6)
236U 2343(6) x 107 y α 4445(5) 261(40)
α 4494(3) 738(40)
238U 4468(5) x 109 y α 4038(5) 013(3)
α 4151(5) 2233(50)
α 4198(3) 7754(50)
Emax for beta emitting radioisotopes
Data were taken from [15]
27
FIG I 1 Decay chain of 238U [4]
FIG I 2 Decay chain of 232Th [4]
28
APPENDIX II FLOW CHART FOR SEQUENTIAL SEPARATION OF 210Po 210Pb Th U AND 226Ra
IN PHOSPHOGYPSUM
29
APPENDIX III PROPERTIES OF RESINS
III1 Sr resin
FIG III 1 Structure of the Sr resin (wwweichromcom)
FIG III 2 Capacity factor of Sr resin in nitric acid (wwweichromcom) [16]
30
FIG III 3 Capacity factor of Sr resin in nitric acid (wwweichromcom) [17]
III2 TEVA resin
FIG III 4 Structure of the TEVA resin (wwweichromcom)
31
FIG III 5 Capacity factor of TEVA resin in nitric acid and hydrochloric acid (wwweichromcom) [18]
III3 UTEVA resin
FIG III 6 Structure of the UTEVA resin (wwweichromcom)
32
FIG III 7 Capacity factor of UTEVA resin in nitric acid and hydrochloric acid (wwweichromcom) [19]
33
APPENDIX IV ALPHA SPECTRA OF ANALYTES
FIG IV 1 Alpha spectrum of Po isotopes
FIG IV 2 Alpha spectrum of Th isotopes in phosphogypsum (with progeny)
228Th is resulted from 232U tracer spiked in the sample
34
FIG IV 3 Alpha spectrum of U isotopes
FIG IV 4 Alpha spectrum of 226Ra and its progeny (spiked with 225Ra)
35
FIG IV 5 Overlapping alpha spectra of U and Po isotopes
FIG IV 6 Overlapping alpha spectra of U and Th (with progeny) isotopes
36
APPENDIX V LIQUIDE SCINTILLATION SPECTRA
a)
b)
A window
(115-320 ch)
B window
(320 -410 ch)
210Po
210Pb
210Bi
210Bi
Co
unts
Ch
ann
elC
oun
tsC
han
nel
Channel number
a)
b)
A window
(115-320 ch)
B window
(320 -410 ch)
210Po
210Pb
210Bi
210Bi
Co
unts
Ch
ann
elC
oun
tsC
han
nel
Channel number
FIG V 1 Typical liquid scintillation spectra of beta-emitting 210Pb and 210Bi and alpha emitting 210Po (calibration sources) a) 210Pb 210Bi and 210Po spectra
b) pure 210Bi spectrum
37
APPENDIX VI CALCULATION OF THE COMBINED UNCERTAINTY
OF THE ACTIVITIES OF THE ANALYTES ON SAMPLING DATE
VI1 Uncertainty of the 210Pb result [20]
VI11 Uncertainty of counting efficiency of 210Pb
2
2
2
2
2210
2
210
2210
222
)()()()()()( )( PbTPbT
calcal
stdPbstdPb
Pbb mum
RuR
aua
utZuZ
u
minus+
minus+
minus++
= minusminus
minusεεελεεε (VI-1)
2
222
2 )()()()()( (Z) BABnBnBAAn furrufruu minus+minus+= (VI-2)
20
2 )()()( AAgAn rururu += (VI-3)
20
2 )()()( BBgBn rururu += (VI-4)
VI12 Uncertainty of the tailing factor fAB
The uncertainty of the tailing factor fAB is calculated according to following equations
2
210
210
2
210
210
)()()(
+
=
minus
minus
minus
minus
BicalnB
BicalnB
BicalAn
BicalAnBABA r
ru
r
ruffu (VI-5)
20
2210210 )()()( ABicalAgBicalAn rururu += minusminus (VI-6)
20
2210210 )()()( BBicalBgBicalBn rururu += minusminus (VI-7)
The uncertainty of counting efficiency for 210Pb can be calculated by Eq (VI-8)
2
2
2
2
2210
2
210
2210
222
)()()()()()( )( PbTPbT
calcal
stdPbstdPb
Pbb mum
RuR
aua
utZuZ
u
minus+
minus+
minus++
= minusminus
minusεεελεεε (VI-8)
2
222
2 )()()()()( (Z) BABnBnBAAn furrufruu minus+minus+= (VI-9)
20
2 )()()( AAgAn rururu += (VI-10)
20
2 )()()( BBgBn rururu += (VI-11)
38
VI13 Uncertainty of chemical recovery of Pb
Uncertainty of chemical recoveries of Pb in calibration source
minusminus+
minus+
= 2
2
2
2
2
2
cal )()(
)()(
)( )(R calfcalfcalof
calcalof
calfcalof
calg
g
cal mumm
Rmu
mm
Rfu
f
Ru
2
1
2
2
2
2
)()(
)()(
minus+
minus+
minus
minusminus
minusc
ccPb
cPbcalcPb
ccPb
ccal mumC
CRCu
mC
mR (VI-12)
The uncertainty of chemical recovery of Pb in the sample can be calculated
minusminus+
minus+
= 2
2
2
2
2
2
)()(
)()(
)( (R) ffof
offof
gg
mumm
Rmu
mm
Rfu
f
Ru
2
2
2
2
)()(
)()( c
ssPbccPb
cPbcPb
ssPbccPb
c mumCmC
CRCu
mCmC
mR
+minus+
+minus+
minusminus
minusminus
minusminus
2
1
2
2
2
2
)()(
)()(
+minus+
+minus+
minusminus
minusminus
minusminuss
ssPbccPb
sPbsPb
ssPbccPb
s mumCmC
CRCu
mCmC
mR (VI-13)
VI14 Uncertainty of mass ratio
The uncertainty of the mass ratio (fg) of atomic mass of Pb to molar mass of Pb-oxalate is calculated using the equations below
22
M Pb)(
+
=
minus
minus
oxalatePb
M
Pbgg M
u
M
uffu oxalatePb (VI-14)
The uncertainty of the molar mass of lead oxalate u(MPb-oxalate) can be derived by combining standard uncertainties in atomic masses of its constituents as shown in Table VI 1
39
TABLE VI 1 STANDARD UNCERTAINTIES OF ATOMIC WEIGHT AND THE GRAVIMETRIC FACTOR fg
Element Atomic weight
(gmol-1)
Quoted uncertainty (gmol-1)
Conversion factor
Standard uncertainty (gmol-1)
Mass ratio of atomic mass of Pb to
molar mass of Pb-oxalate
Uncertainty ofatomic mass
of Pb to molar mass of
Pb-oxalate
Pb 207215 2 0000 15 3 0000 087 0701 9 0000 002
C 12010 7 0000 8 3 0000 46
O 15999 4 0000 3 3 0000 17
VI15 Combined uncertainty of activity of 210Pb
The combined uncertainty of the 210Pb activity is calculated from Eq (VI-15)
minus+
minus+
minus+
= minusminusminusminus 2
2
2102
2
2102
2
210
2
2
2101 )()()()()( s
d
sPb
BA
sPb
nBnB
sPb
BAnA
sPb
Pbc mum
afu
Z
arru
Z
afru
Z
aau
2
1
23
2
3
21022
2
2
2102
2
2102
2
210 )()()()(
+
+
minus+
minus+ minus
minus
minusminus
minus
minusminusminusPb
Pb
sPbPb
Pb
sPbsPbsPb fuf
afu
f
aRu
R
au
aε
ε (VI-15)
)()( 210222 minusminusminus = PbPbPb utffu λ (VI-16)
210
210321033
)(
11)(
3210
3210
minus
minusminus
minus
minusminusminus
minusminus=
minus
minus
Pb
Pbt
t
PbPbPb
u
e
etffu
Pb
Pb
λλλ λ
λ
(VI-17)
However if the time interval (t2) between the separation of 210Pb and the beginning of the measurement and the counting time of the sample (t3) are much smaller than the half life of 210Pb f2-Pb f3-Pb u(f2-Pb) and u(f3-Pb) are negligible The uncertainties associated to components mentioned above can be calculated as follows
0
0
3
)(t
r
t
rru
Po
gn +=
minus
(VI-18)
0
0
3
)(t
r
t
rru t
Po
tgtn +=
minus
(VI-19)
minus+
+
= minusminusminus
minus2
2
2102
2
2102
2
210210 )()()( )( tn
tn
sPo
nn
sPo
TT
sPo
sPo rur
aru
r
aAu
A
aau
2
2
21022
2
2
2102
2
2102
2
210)()()()( T
T
sPo
PoPo
sPo
TT
sPo
ss
sPofu
f
afu
f
amu
m
amu
m
a
+
+
+
minus+ minus
minusminus
minusminusminus
40
2
1
3
2
3
210 )(
+ minus
minus
minusPo
Po
sPo fuf
a (VI-20)
)()( TTTt utffu λ= (VI-21)
)()( 210222 minusminusminusminus = PoPoPoPo utffu λ (VI-22)
210
210321033
)(
11)(
3210
3210
minus
minusminus
minus
minusminusminus
minusminus=
minus
minus
Po
Pot
t
PoPoPo
u
e
etffu
Po
Po
λλλ λ
λ (VI-23)
VI16 Combined uncertainty of activity of 210Po
The uncertainty of the activity of 210Po on the separation date is calculated according to IAEAAQ12 procedure [8]
VI2 Uncertainty of other alpha emitting isotopes
The same formulas are used to calculate the combined uncertainties as equations that are used for calculation of the activity of alpha emitting analytes at the separation time and the sampling date as well as the chemical recovery and counting efficiency These formulas have to be applied in the spreadsheet approach for calculating the combined uncertainties knowing the standard uncertainty of each component VI3 Spreadsheet approach
For the quantifying the uncertainties the spreadsheet technique [21] was used which could be summarised as follows and showed in the Fig VI 1
bull Calculate function y using parameter xj
y=f(x1x2xj xn) (VI-24)
bull recalculate the same function n times increasing xj to xj+dxj (dxj standard deviation) and keeping the remaining parameters constant
y=f(x1x2xj+dxj xn) (VI-25)
bull the uncertainty on the function dy is the square root of the sum of squares
( )sum minus=n
jyydy1
2 (VI-26)
bull The individual variance contribution fj is
( )( )sum minus
minus=
n
j
jj
yy
yyf
1
2
2
(VI-27)
41
FIG VI 1 Spreadsheet approach for quantifying the uncertainty of the measurement
The results are summarised for the individual isotopes in the Tables VI 2ndashVI 9 and the results of the individual analysis with their uncertainties are shown in the Figs VI 3ndashVI 9 The detailed study about the usual contributors of uncertainty in the nuclear analytical techniques could be found in the IAEA-TECDOC-1401 [11] TABLE VI 2 AN EXAMPLE OF QUANTIFYING UNCERTAINTIES OF 210Po RESULT
Symbol unit Value of variable
Uncertainty Conversion factor to standard uncertainty
Standard uncertainty
Contribution to combined
uncertainty ()
m g 0508 9 0007 3 3 0004 2 010
rgt s-1 0197 0075 1 0075 361
r0t s-1 0000 017 0000 034 1 0000 034 0000 014
rg s-1 0081 0029 1 0029 6352
r0 s-1 0000 034 0000 033 1 0000 033 0000 08
at Bq 0829 0019 1 0019 0252
λt d-1 0000 019 0000 013 1 0000 013 negligible
λPo d-1 0005 72 x 10-9 1 72x10-9 negligible
ft 0982 14 0000 43 1 0000 43 0000 091
f2-Po 1005 73 x 10-9 1 73x10-9 negligible
f3-Po 1005 5 18 x 10-8 1 18 x10-8 negligible
aPo1 Bqmiddotkg-1 672 94
contribution is less than 1 x 10⁻⁵
TABLE VI 3 AN EXAMPLE OF QUANTIFYING UNCERTAINTIES OF EFFICIENCY OF 210Pb
Symbol unit Value of variable
Uncertainty
Conversion factor to standard
uncertainty
Standard uncertainty
Contribution to combined
uncertainty ()
mvial g 14936 35 0000 1 3 0000 17 0004 8
42
Symbol unit Value of variable
Uncertainty
Conversion factor to standard
uncertainty
Standard uncertainty
Contribution to combined
uncertainty ()
mvial+carrsol g 16036 54 0000 1 3 0000 17 0004 8
cPb g g-1 0027 42 0000 021 1 0000 021 011
mvial g 16036 72 0000 10 3 0000 17 0004 8
mvial+std g 17132 6 0000 10 3 0000 17 0004 8
astd Bq 1245 0189 1 0189 805
fgravimetry 0701 85 0000 41 1 0000 41 0066
mfilter g 0036 54 0000 10 3 0000 17 42
mfilter+Pb-precipitate g 0073 77 0000 10 3 0000 17 41
rA s-1 7362 0041 1 0041 76
rA0 s-1 0029 5 0003 1 0002 7 0035
rB s-1 0416 0 0011 1 0011 060
rB0 s-1 0011 7 0002 1 0002 2 0024
fAB 1049 0023 1 0023 040
t12 Pb d 814508 7305 1 731 23
tmeas-ref d 4 532 -
ε 0859 7 0015 3
43
TABLE VI 4 AN EXAMPLE OF QUANTIFYING UNCERTAINTIES OF 210Pb RESULT
Symbol unit Value of variable
Uncertainty Conversion factor to standard uncertainty
Standard uncertainty
Contribution to combined
uncertainty ()
ms g 0508 9 0007 3 3 0004 2 03
rgA s-1 0283 0035 1 0035 883
r0A s-1 0011 7 0002 2 1 0002 2 03
rgB s-1 0031 0009 1 0009 58
r0B s-1 0005 6 0002 3 1 0002 3 04
Ζ s-1 0245 1 0032 7 1 0032 7 -
fAB 1015 3 0012 9 1 0012 9 001
ε 0859 7 0015 3 1 0015 3 13
R 0858 8 0025 3 1 0077 2 35
aPb1 Bqmiddotkg-1 652 12
TABLE VI 5 AN EXAMPLE OF QUANTIFYING UNCERTAINTIES OF 234U RESULT
Symbol unit Value of variable
Uncertainty Conversion factor to standard uncertainty
Standard uncertainty
Contribution to combined
uncertainty ()
ms g 0508 9 0007 3 3 0004 2 003
rgt s-1 0021 78 0008 01 1 0008 369
r0t s-1 0000 030 0000 022 1 0000 022 0000 5
rg s-1 0016 15 0005 90 1 0006 628
r0 s-1 0000 016 0000 022 1 0000 022 0000 1
at Bq 0088 35 0002 10 1 0002 01 029
aU-234_1 Bqmiddotkg-1 129 3
TABLE VI 6 AN EXAMPLE OF QUANTIFYING UNCERTAINTIES OF 238U RESULT
Symbol unit Value of variable
Uncertainty Conversion factor to standard uncertainty
Standard uncertainty
Contribution to combined
uncertainty ()
ms g 0508 9 0007 3 3 0004 2 003
rgt s-1 0021 78 0008 01 1 0008 353
r0t s-1 0000 030 0000 022 1 0000 022 0000 5
rg s-1 0015 61 0005 67 1 0006 644
r0 s-1 0000 009 0000 008 1 0000 008 0000 1
at Bq 0088 35 0002 10 1 0002 1 028
aU-238_1 Bqmiddotkg-1 124 3
44
TABLE VI 7 AN EXAMPLE OF QUANTIFYING UNCERTAINTIES OF 230Th RESULT
Symbol unit Value of variable
Uncertainty Conversion factor to standard uncertainty
Standard uncertainty
Contribution to combined
uncertainty ()
ms g 0508 9 0007 3 3 0004 2 005
rgt s-1 0022 63 0006 44 1 0006 387
r0t s-1 0000 077 0000 063 1 0000 063 0006 1
rg s-1 0028 38 0007 90 1 0008 608
r0 s-1 0000 012 0000 010 1 0000 010 0000 1
at Bq 0090 03 0002 30 1 0002 303 051
aTh-230_1 Bqmiddotkg-1 223 9
TABLE VI 8 AN EXAMPLE OF QUANTIFYING UNCERTAINTIES OF 232Th RESULT
Symbol unit Value of variable
Uncertainty Conversion factor to standard uncertainty
Standard uncertainty
Contribution to combined
uncertainty ()
ms g 0508 9 0007 3 3 0004 2 004
rgt s-1 0022 63 0006 44 1 0006 265
r0t s-1 0000 077 0000 063 1 0000 063 0004 2
rg s-1 0000 28 0000 10 1 0000 1 727
r0 s-1 0000 011 0000 008 1 0000 008 048
at Bq 0090 03 0002 30 1 0002 3 035
aTh-232_1 Bqmiddotkg-1 21 009
TABLE VI 9 AN EXAMPLE OF QUANTIFYING UNCERTAINTIES OF 226Ra RESULT
Symbol unit Value of variable
Uncertainty Conversion factor
to standard uncertainty
Standard uncertainty
Contribution to combined
uncertainty ()
ms g 0508 9 0007 3 3 0004 2 003
rgt s-1 0043 10 0025 05 1 0025 05 603
r0t s-1 0000 111 0000 128 1 0000 128 0004
rg s-1 0063 32 0018 78 1 0018 78 393
r0 s-1 0000 070 015 0000 070 013 1 0000 070 013 0000 5
at Ra-225 Bq 0779 50 0022 53 1 0022 53 04
λAc225 d-1 0069 315 0000 624 1 0000 624 0000 02
λRa225 d-1 0046 520 0000 693 1 0000 693 008
t1-t0 d 337
aRa-226_1 Bqmiddotkg-1 766 39
45
APPENDIX VII DETECTION THRESHOLD AND LIMIT OF THE APPLIED PROCEDURE
TABLE VII 1 TYPICAL DECISION THRESHOLD AND DETECTION LIMIT FOR RELEVANT ISOTOPES
Symbol unit 210Pb 210Po 234U 238U 230 Th 232 Th 226Ra
k 165 165 165 165 165 165 165
m kg 0000 5 0000 5 0000 5 0000 5 0000 5 0000 5 0000 5
ε 086 031 026 026 035 035 025
R 086 073 094 094 068 068 061
n0 52 16 4 4 6 6 28
Tg s 36 000 98 899 343 024 343 024 277 345 277 345 124 984
t0 s 35 542 548 190 512 901 512 901 559 286 559 286 446 755
a Bqmiddotkg-1 13 036 009 009 012 012 068
a1 Bqmiddotkg-1 38 11 028 028 036 036 205
u2(0) Bq2middotkg-2 29 015 0008 4 0008 4 0006 5 0004 7 078
u2(a1) Bq2middotkg-2 23 041 0059 0025 0028 0052 204
a Bqmiddotkg-1 24 12 052 019 018 019 43
46
APPENDIX VIII VALIDATION TEST RESULTS OF THE PROCEDURE
TABLE VIII 1 VALIDATION RESULTS FOR RELEVANT RADIONUCLIDES
Parameters 210Po 210Pb 234U 238U 230Th 226Ra
C Bq kg-1 680 680 120 120 211 780
X Bq kg-1 653 659 127 123 221 793
u(C) Bq kg-1 58 58 9 11 9 62
u(X ) Bq kg-1 23 22 5 5 10 35
δ() -40 -31 58 25 47 17
rL Bq kg-1 106 102 48 47 62 498
RL Bq kg-1 237 454 59 53 89 707
PI() 92 92 85 100 62 91
TABLE VIII 2 ANALYSIS OF VARIANCE (ANOVA) FOR 210Po 210Pb 238U 230Th AND 226Ra IN PHOSPHOGYPSUM
Nuclide SSwb SSbb MSwb MSbb Swb
(as CV)
Sbb
(as CV)
210Po 124 62 151 79 312 1687 271 254
210Pb 8385 197 54 210 2195 220 302
238U 314 386 785 429 227 215
230Th 2176 1598 544 178 334 225
226Ra 412 686 137 858 121 054
SSwb sum of squares within bottles
SSbb sum of squares between bottles
MSwb mean of squares within bottles
MSbb mean of squares between bottles
Swb standard deviation as percent of covalent variance within bottles
Sbb standard deviation as percent of covalent variance between bottles
47
550
600
650
700
750
0 10 20 30 40 50
Samples
Act
ivity
of
21
0 Pb
in th
e sa
mp
le (
Bq
kg
dry
)
Mean1σ
-2σ
-1σ
3σ
2σ
-3σ
FIG VIII 1 210Pb results with associated uncertainties
550
600
650
700
750
0 10 20 30 40 50Samples
Act
ivity
of
21
0 Po
in t
he s
ampl
e (B
qkg
dry
)
Mean
1σ
-1σ
3σ
2σ
-3σ-2σ
FIG VIII 2 210Po results with associated uncertainties
48
110
115
120
125
130
135
140
0 10 20 30 40 50
Samples
Act
ivity
of
238
U in
the
sam
ple
(B
qkg
dry
)
Mean
1σ
-1σ
3σ
2σ
-3σ
-2σ
FIG VIII 3 238U results with associated uncertainties
105
110
115
120
125
130
135
140
145
150
0 10 20 30 40 50
Samples
Act
ivity
of
23
4 U in
the
sa
mpl
e (B
qkg
dry
)
Mean1σ
-2σ-1σ
3σ2σ
-3σ
FIG VIII 4 234U results with associated uncertainties
49
190
200
210
220
230
240
250
0 5 10 15 20 25 30 35 40 45 50
Samples
Act
ivity
of
23
0 Th
in th
e s
am
ple
(B
qk
g d
ry)
2σ
3σ
1σ
-1σ
-2σ
-3σ
Mean
FIG VIII 5 230 Th results with associated uncertainties
05
10
15
20
25
30
35
40
0 10 20 30 40 50
Samples
Act
ivity
of
23
2 Th
in th
e sa
mp
le (
Bq
kg
dry
)
Mean
1σ
-2σ
-1σ
3σ
2σ
-3σ
FIG VIII 6 232 Th results with associated uncertainties
50
650
700
750
800
850
900
1 2 3 4 5 6 7 8 9 10 11 12 13 14 15 16 17 18 19 20
Sample
Act
ivity
of
226 R
a in
th
e sa
mp
le (
Bq
kg
dry
)
Mean
1σ
-1σ
3σ
2σ
-3σ
-2σ
FIG VIII 7 226Ra results with associated uncertainties
51
CONTRIBUTORS TO DRAFTING AND REVIEW
Hampe D Gaigl FA
Verein fuumlr Kernverfahrenstechnik und Analytik Rossendorf eV Dresden Germany IAEA Environment Laboratories Terrestrial Environment Laboratory Seibersdorf Austria
Kim C-K IAEA Environment Laboratories Terrestrial Environment Laboratory Seibersdorf Austria
Kis-Benedek Gy IAEA Environment Laboratories Terrestrial Environment Laboratory Seibersdorf Austria
Martin P IAEA Environment Laboratories Terrestrial Environment Laboratory Seibersdorf Austria
Mietelski J W The Henryk Niewodniczanski Institute of Nuclear Physics Polish Academy of Sciences Poland
Sansone U IAEA Environment Laboratories Terrestrial Environment Laboratory Seibersdorf Austria
Varga B Central Agricultural Office Food and Feed Safety Directorate Hungary
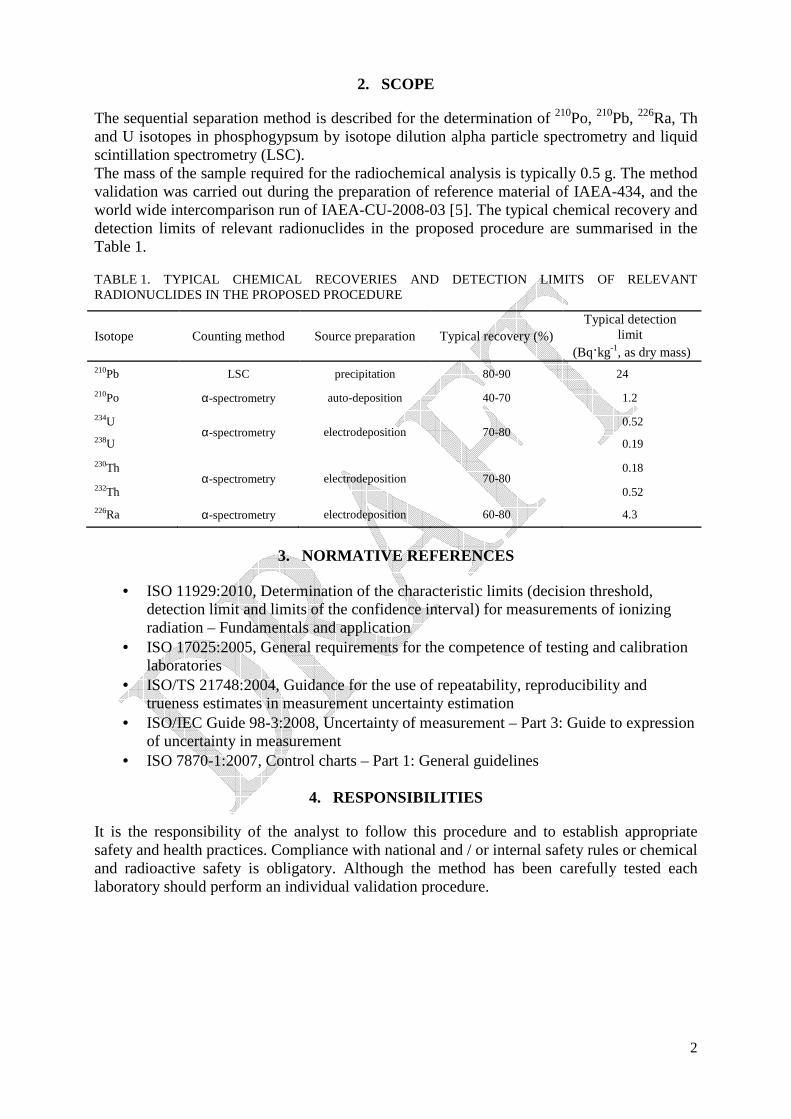
2
2 SCOPE
The sequential separation method is described for the determination of 210Po 210Pb 226Ra Th and U isotopes in phosphogypsum by isotope dilution alpha particle spectrometry and liquid scintillation spectrometry (LSC) The mass of the sample required for the radiochemical analysis is typically 05 g The method validation was carried out during the preparation of reference material of IAEA-434 and the world wide intercomparison run of IAEA-CU-2008-03 [5] The typical chemical recovery and detection limits of relevant radionuclides in the proposed procedure are summarised in the Table 1
TABLE 1 TYPICAL CHEMICAL RECOVERIES AND DETECTION LIMITS OF RELEVANT RADIONUCLIDES IN THE PROPOSED PROCEDURE
Isotope Counting method Source preparation Typical recovery () Typical detection
limit (Bqkg-1 as dry mass)
210Pb LSC precipitation 80-90 24
210Po α-spectrometry auto-deposition 40-70 12
234U α-spectrometry electrodeposition 70-80
052
238U 019
230Th α-spectrometry electrodeposition 70-80
018
232Th 052
226Ra α-spectrometry electrodeposition 60-80 43
3 NORMATIVE REFERENCES
bull ISO 119292010 Determination of the characteristic limits (decision threshold detection limit and limits of the confidence interval) for measurements of ionizing radiation ndash Fundamentals and application
bull ISO 170252005 General requirements for the competence of testing and calibration laboratories
bull ISOTS 217482004 Guidance for the use of repeatability reproducibility and trueness estimates in measurement uncertainty estimation
bull ISOIEC Guide 98-32008 Uncertainty of measurement ndash Part 3 Guide to expression of uncertainty in measurement
bull ISO 7870-12007 Control charts ndash Part 1 General guidelines
4 RESPONSIBILITIES
It is the responsibility of the analyst to follow this procedure and to establish appropriate safety and health practices Compliance with national and or internal safety rules or chemical and radioactive safety is obligatory Although the method has been carefully tested each laboratory should perform an individual validation procedure
3
5 TERMS AND DEFINITIONS SYMBOLS AND ABBREVIATIONS
In the following u(x) indicates the uncertainty in quantity x and generally the relevant isotope is indicated as subscript
a Decision threshold [Bqkg-1]
a Detection limit [Bqkg-1]
a0 Activity of the analyte on the sampling date [Bqkg-1]
astd Activity of the calibration standard [Bq g-1]
as Activity of the analyte on the separation date [Bqkg-1]
AT Activity of 225Ra tracer [Bq]
C Certified activity of the analyte in the reference material [Bqkg-1]
CPb-c Mass fraction of Pb carrier solution
CPb-s Mass fraction of Pb already present in the sample
CT Certified activity of tracer on the reference date [Bqg-1]
fAB Tailing factor correction of interfered windows A and B
fg Mass ratio of atomic mass of Pb to molar mass of PbC2O4
fT Correction factor for the decay of the tracer during elapsed time between the reference date of tracer and the beginning of the measurement
f2 Correction factor for decay of the analyte during elapsed time between the separation and the beginning of the measurement
f3 Correction factor for decay of the analyte over the counting time
mC Mass of the carrier taken (in case of lead mass of carrier solution) [g]
mf Mass of the filter used [g]
mfcal Mass of the filter used in calibration [g]
mof Total mass of PbC2O4 and the filter used [g]
mofcal Total mass of PbC2O4 and the filter used in the calibration [g]
ms Mass of the sample [kg]
mT Mass of the tracer taken [g]
mTPb Mass of the 210Pb standard solution added [g]
MPb Atomic mass of Pb [gmiddotmol-1]
MPb-oxalat Molar mass of PbC2O4 [gmiddotmol-1]
n Net counts in ROI of analyte [counts]
nT Net counts in ROI of tracer [counts]
n0 Blank or background counts in ROI of analyte [counts]
n0T Blank or background counts in ROI of tracer [counts]
Pα Probability of α decay
Pγ Probability of γ decay
4
r0 Blank or background count rate in ROI of analyte [countss-1]
r0T Blank or background count rates in ROI of tracer [countss-1]
rcal Count rates during the calibration [countss-1]
rn Net count rates in ROI of analyte [countss-1]
rnT Net count rates in ROI of tracer [countss-1]
rg Gross count rates in ROI of analyte [countss-1]
rgT Gross count rates in ROI of tracer [countss-1]
rnTmax Maximum detectable count rate [countss-1]
r0A r0B Count rates in windows A and B of the blank spectrum [countss-1]
rgA rgB and u(rgA) u(rgB) Gross count rates in windows A and B of 210Pb spectrum [countss-1]
rnA rnB Net count rates in windows A and B of 210Pb spectrum [countss-1]
R Chemical recovery of the analyte
Rcal Chemical recovery of making the calibration source
RL Reproducibility limit [Bqkg-1]
rL Repeatability limit [Bqkg-1]
SR Standard deviation of reproducibility [Bqkg-1]
Sr Standard deviation of repeatability [Bqkg-1]
t Time interval between the sampling date and the measurement date [s]
t0 Counting time of the blank or background [s]
tTs Time interval between the reference date of the tracer standard and the separation date [s]
t1 Time interval between the sampling date and the separation date [s]
t2 Time interval between the separation date and the start of the measurement [s]
t3 Counting time of the sample [s]
tT Counting time of the tracer [s]
tAc-225 Time of build up of 225Ac [s]
ts Time of the separation noted [s]
tm Time of the starting of the measurement [s]
tem Time of the end of the measurement [s]
u(0) Uncertainty of non-negative measurand
X mean value of measurement results of the analyte in reference material [Bqkg-1]
δ Relative bias of the test result []
ε Counting efficiency of the detector
λ Decay constant of the isotope [countss-1]
λT Decay constant of the tracer [countss-1]
FWHM Full width at half maximum
5
LSC Liquid scintillation counting (spectrometry)
NNDC National Nuclear Data Center Brookhaven National Laboratory
ROI Region of interest
PSA Pulse shape analysis
T12 Half-life of any isotope
6 PRINCIPLE
The sample is digested in a microwave digestion system Polonium-210 210Pb U and Th isotopes and 226Ra are separated from interfering elements with a sequential chemical procedure using extraction chromatographic resins and Ba(Pb)SO4 co-precipitation The flow chart of the combined procedure is given in Appendix II The most important features of the resins are shown in Appendix III (Sr resin TEVA and UTEVA see Figs III 1ndashIII 7) U and Th are electrodeposited on a polished stainless steel plate The polonium source is prepared on a silver plate by auto-deposition The 226Ra source is prepared by Ba(Ra)SO4 microco-precipitation The 210Pb source is prepared with Pb-oxalate precipitation Polonium-210 U Th isotopes and 226Ra are determined by isotope dilution alpha-spectrometry and 210Pb is determined by liquid scintillation spectrometry
7 CHEMICAL REAGENTS AND EQUIPMENT
71Tracers
The two tracers commonly used for 210Po determination are 208Po and 209Po Polonium-209 has a clear advantage over 208Po in energy separation from the 210Po peak and is the preferred tracer if available It should also be noted that 208Po solutions normally contain traces of 209Po A typical alpha spectrum of 209Po and 210Po is shown in Fig IV 1 of Appendix IV
Naturally occurring thorium can be determined by the following tracers 228Th and 229Th Both of them have short lived daughters which emit alpha-particles but as the energies of all their daughters are higher than 568 MeV thus no spectral interference occurs from ingrowth of daughters either 228Th or 229Th The 228Th daughter of 232U can be used as a tracer for the determination of 230Th and 232Th In this case the natural 228Th content in phosphogypsum should be measured or estimated separately to allow for this [4] An alpha spectrum of Th isotopes and its progeny is depicted in Fig IV 2 of Appendix IV
Naturally occurring uranium can be determined by the following tracers 232U 233U or 236U Among them 232U (containing 228Th daughter in known ratio close to 1) is applied most frequently The amount of 232U tracer to be added to the sample should be carefully calculated because this is the highest-energy uranium peak in the uranium spectrum and hence its tailing might affects other peaks in low energy region if the added concentration is too high A typical alpha spectrum of uranium isotopes is shown in Fig IV 3 of Appendix IV
In the case of 226Ra analysis several tracers such as 133Ba 223Ra 224Ra 225Ra might be applied Barium-133 is a most commonly used tracer for the determination of 226Ra (can be measured by gamma-spectrometry) A disadvantage of this tracer is that although its chemical behavior is very similar to that of Ra their chemical behavior is not identical as they are different elements Alternative is 225Ra (daughter of 229Th) which does not exist in nature and its decay does not produce radon which might escape from the source Radium-225 is both a beta and
6
gamma emitter with a gamma line at 4009 keV (Pγ 0300) which is well measurable with an n-type HPGe detector with carbon-epoxi or Be window Alternatively its descendants 225Ac 221Fr 217At are alpha-emitters and the determination of chemical recovery is possible via 217At at 7066 7 MeV (Pα 0999 32) using ingrowth decay equations [4] (Fig IV 4 of Appendix IV)
72Carrier
If there is no suitable radioactive tracer available the chemical recovery can be checked by using an inactive carrier namely a stable isotope of the same element as the radioactive analyte In the present case 30 mg Pb2+ carrier is used as Pb(NO3)2 solution for checking the chemical recovery of 210Pb determination gravimetrically
73Equipments
bull Standard laboratory equipment well exhausted fume-hood bull Microwave oven bull Alpha spectrometer with Si semiconductor detector bull Vacuum pump bull Liquid scintillation spectrometer bull Auto-deposition system bull Silver disk fitted to the auto-deposition cell diameter is equal or less than the
diameter of the detector used for alpha spectrometry bull Electrodeposition apparatus (Pt wire anode) equipped with DC power supply to
provide up to 1 A of regulated current to the electrolytic cell bull Stainless steel disc diameter is equal or less than the diameter of the detector used for
alpha spectrometry bull Analytical balances with accuracies of 01 mg and 001 g bull Hot plate with magnetic stirrer bull Burner bull Centrifuge plastic centrifuge tube (minimum 20 mL volume) bull Water bath with temperature controller bull Filtering set with filter paper for fine precipitate bull Chromatography columns with stopper control valve and funnel (250 mL) and holder
for them bull pH meter or pH papers bull Teflon beakers with Teflon tops and clips bull Dispensers 5-50 mL and 10-100 mL bull Micropipettes with dispensable tips (100-5000 microL) bull Timer bull Liquid scintillation vial 20 mL plastic (polyethylene) inner surface coated with
Teflon
74Chemical reagents
bull 30 mgmL-1 Pb2+ solution (usually as Pb(NO3)2) bull 04 Bq of 209Po tracer as a certified solution bull 004 Bq of 232U tracer as a certified solution bull 005 Bq of 225Ra in equilibrium with its parent 229Th as a certified solution bull HNO3 (65) (nitric acid)
7
bull HF (40) (hydrogen fluoride) bull H3BO3 (boric acid) bull HCl (32) (hydrochloric acid) bull Ultra pure water bull DTPA (diethylenetriaminepentaacetic acid) bull Sr resin (100-150 microm) bull TEVA resin bull UTEVA resin bull Cation exchange resin (AG-50W-X8 or Dowex-50) bull Fine clean quartz crystals (analytical grade) bull C6H8O6 (Ascorbic acid) bull NH4SCN (ammonium thiocyanate) bull EDTA (ethylenediaminetetraacetic acid) bull NH3(aq) (ammonia) bull (NH4)2SO4 (10) (ammonium sulfate) bull C2O4H2middot2H2O (oxalic acid) bull Methyl red solution (025) bull Thymol blue solution (025) bull Ba seeding solution [6] Weigh between 0012 and 0016 g of BaCl2 2H2O into a tall
150 mL quartz beaker Add approximately 04 mL of ultra pure water to completely dissolve the BaCl2 2H2O In a fume hood add 10 mL of the 70 sodium hydrogen sulfate solution and 2 drops of 72 HClO4 Evaporate the solution on a hot plate or a burner at high heat with continuous swirling until most of the excess sulfuric acid has been expelled and a pyrosulfate fusion is obtained Cool the beaker while rolling the melt around the sides so that the cake is deposited on the sides as uniformly as possible to facilitate rapid dissolution Cool the beaker and contents to room temperature in a desiccating chamber Add a solution of 50 mL 20 Na2SO4 to the beaker Swirl continuously until the cake is completely dissolved (place it in an ultrasonic bath for 10 minutes before each use if a build up of particulate matter occurs then make a fresh solution)
bull Sodium sulfate wash solution dissolve 100 g of anhydrous Na2SO4 in 2 L of 05 H2SO4 Filter through a 045 microm pore size membrane filter
bull CH3CH2OH (ethyl alcohol) bull Filter paper (for example Whatman 41) bull Polypropylene filter (for example Pall 01 microm pore size 25 mm diameter) bull Scintillation cocktail which forms a gel (for example InstaGel Plus) or suitable for
alphabeta separation All the chemical reagents needed to carry out this procedure must be analytical grade
8 PRECAUTIONS
Do not ash the sample if 210Po determination is required gently drying is allowed but not higher than 80oC
During the handling of the ion exchange chromatography columns always keep several mm of liquid above the surface of resin do not allow it to become dry during the separation steps
Labeling of the different fraction is essential to avoiding mixing solutions this includes the different load solutions and chemicals
8
The complete separation of Po from U is important because 210Po (Eα 5263 MeV) can interfere with the alpha peak of 232U (Eα 5320 MeV) and its activity is much higher than of U in phosphogypsum In addition 209Po (Eα 4866 MeV) can interfere with the alpha peak of 234U (Eα 4766 MeV) These are shown in Fig IV 5 of Appendix IV
The complete separation of Th from U is also important because several peaks in the spectra overlap as it is shown on Fig IV 6 of Appendix IV
Applying 225Ra as a yield tracer for the determination of 226Ra the radiochemical procedure needs to include steps to guarantee the complete separation of the parentprogeny couples 229 Th225Ra and 225Ra225Ac
9 PROCEDURE
This procedure consists of the sample dissolution the sequential separation of 210Po 210Pb Th and U isotopes and 226Ra from interfering elements and the source preparation for alpha spectrometry and liquid scintillation spectrometry (see the flowchart in Appendix II)
91Sample dissolution using microwave digestion system
(a) Weigh 05 g of phosphogypsum into a microwave container
(b) Add about 30 mg of Pb2+ (usually as Pb(NO3)2 solution) about 04 Bq of 209Po and 004 Bq of 232U tracer and 005 Bq of 225Ra in equilibrium with its parent 229Th
(c) Add 15 mL 65 HNO3
(d) Consecutively digest the sample in the microwave oven at 120degC for 15 min and at 150degC for 25 min at 1000 W
(e) Transfer the sample solution into a plastic centrifuge tube and centrifuged for 10 min
(f) Transfer the supernatant into a Teflon beaker The residue is transferred back into the microwave container with 3 mL of 65 HNO3 and add 2 mL of 40 HF
(g) Digest the residue in the microwave oven using the same condition as mentioned above
(h) Combine the solution with the supernatant from step (f)
(i) Add 01 g H3BO3 and evaporate repeatedly to dryness with three portions of 5 mL of 65 HNO3 to remove HF
(j) Dissolve the residue in 30 mL of 2M HCl
92Chemical separation procedures
921 Polonium and lead separation
(a) Prepare the Sr resin column with volume of approximately 8 mL (diameter 10 mm length 100 mm) as follows soak the resin in ultra pure water for at least 1 hour before use then fill the column with resin and put a quartz crystal layer of approximately 10 mm on the top avoiding disturbance of the resin The elution steps should be finished on the same working day
(b) Load the sample solution onto the Sr resin column preconditioned in advance with
9
100 mL 2M HCl flow rate 5-6 dropmin rinse the baker several times with 1 mL of 2M HCl
(c) Wash the column with 100 mL of 2M HCl followed by 25 mL 6M HNO3 to remove the non-retained ions
(d) Combine the effluent and the washing solution into same beaker and use it for the analysis of uranium and thorium
(e) Strip Po with 60 mL 6M HNO3 flow rate 5-10 dropsmin
(f) Elute Pb with 60 mL 6M HCl into the centrifuge tube flow rate 5-10 dropsmin
(g) Sr resin columns can be reused several times Regenerate with 50 mL ultra pure water wash it with 10 mL 01M EDTA (pH adjusted to pH7 with NH3(aq)) then wash with 50 mL ultra pure water and before use load it with 100 mL 2M HCl
922 Thorium separation
(a) Prepare the TEVA column with a volume of 14 mL (diameter 8 mm length 28 mm) as follows soak the resin in ultra pure water for at least 1 hour before use then fill the column with resin and put a quartz crystal layer of approximately 3 mm on the top avoiding disturbance of the resin
(b) Evaporate the combined effluent and washing solutions from Sr resin column (921 step (d))
(c) Dissolve the residue in 20 mL 3M HNO3
(d) Load the sample on the TEVA column preconditioned in advance with 20 mL 3M HNO3
(e) Wash the column with 10 mL 3M HNO3
(f) Combine the effluent and the washing solution into the same baker and use it for analysis of uranium
(g) Additionally wash the column with 20 mL 3M HNO3 this fraction is discarded
(h) Elute Th with 20 mL 8M HCl
(i) Note the time of the separation of Th for recovery calculation of 226Ra
923 Uranium separation
(a) Prepare the UTEVA column with volume 14 mL (diameter 8 mm length 28 mm) as follows soak the resin in ultra pure water for at least 1 hour before use then fill the column with the resin and put a quartz crystal layer of approximately 3 mm on the top avoiding the disturbance of the resin
(b) Load the combined effluent and the washing solution from the TEVA column (922 step (f)) onto UTEVA column preconditioned in advance with 20 mL of 3M HNO3
(c) Wash the column with 20 mL 3M HNO3
(d) Combine the effluent and the washing solution into the same beaker and use it for Ra analysis
(e) Wash the column with 5 mL 9M HCl and 15 mL 6M HCl to remove small amounts of Po and Th remained on the column
10
(f) Elute U with 6 mL ultra pure water
924 Radium separation [6]
(a) Combine the effluent (20 mL 3M HNO3) and the washing solution (30 mL 3M HNO3) from the UTEVA column in a 200 mL volume of beaker (923 step (b) and (c))
(b) Add 4 mL concentrated H2SO4 and 20 mL 20 Na2SO4 to the solution
(c) Slowly add 5 mL Pb2+ carrier (10 mgmL-1) to form a Pb(RaBa)SO4 co-precipitate while stirring for 1ndash2 minutes
(d) Remove stirrer bars washing with a small amount of 01M HCl and ultra pure water
(e) Allow to sit for 3ndash4 hours
(f) Decant supernatant liquor to a volume as low as possible
(g) Transfer the precipitate into a 50 mL conical centrifuge tube using 80 ethanol and centrifuge at 3000 revolutionsmin for 10 minutes
(h) Wash the precipitate with 20 mL 80 ethanol and decant the supernatant
(i) Wash the sides of the centrifuge tube with 5ndash10 mL sodium sulfate wash solution and vortex to mix thoroughly then add a further 5ndash10 mL to wash down the walls and then re-centrifuge at 3000 revmin for 10 minutes
(j) Pour out supernatant then invert the tube and wash the walls with ultra pure water to remove excess acid and sulfate (take care not to disturb the precipitate)
(k) Add 10 mL 02M DTPA (diethylenetriaminepentaacetic acid) and 1 drop of 025 thymol blue The solution should turn deep blue if not add 10M NaOH dropwise until a deep blue color is reached (pHgt9)
(l) Vortex to dissolve the precipitate
93Source preparation
931 Polonium-210 source
(a) The Po solution is carefully evaporated to dryness at less than 150degC
(b) Dissolve the residue in 10 mL 05M HCl
(c) Clean a silver disc with acetone followed by cc NH3(aq) followed by ultra pure water
(d) Place the cleaned silver disc into the deposition cell (Teflon vial) with another disc placed underneath for support Check if the cell is watertight
(e) Add 005 g ascorbic acid into the sample solution to reduce Fe3+ to Fe2+ check the colour change after mixing one drop of sample solution and one drop of 01M NH4SCN Add ascorbic acid until the dark red colour disappears
(f) Transfer the solution to the deposition cell
(g) Rinse the beaker with 2 x 2 mL 05M HCl and adjust the pH of the solution in the deposition cell to pH2 with 6M NaOH
(h) Place the deposition cell into a water bath at 90oC for 90 min with mechanical stirring or air bubbling
11
(i) Remove the silver disc wash with acetone or ultra pure water and dry it at room temperature
932 Uranium and thorium sources
(a) The purified U or Th solution is evaporated to dryness three times with a few mL 65 HNO3 to destroy any existing organic matter
(b) Dissolve the residues in 10 mL 10 (NH4)2SO4 solution at pH2 (The pH of samples being deposited for thorium should be slightly more acidic pH15-pH2)
(c) Transfer the solution into an electrodeposition cell
(d) Electrodeposit U or Th onto polished stainless steel discs at 1 A for 90 minutes respectively
(e) At the end of the deposition time fill the cell with 15M NH4OH and continue deposition for 1 min then turn off the main power of deposition unit and disconnect the cathode
(f) Rinse the cell twice with 1 NH4OH then three times with ultra pure water
(g) Disassemble the cell rinse the disc with ultra pure water and dry it
933 Radium source (BaSO4 micro co-precipitation)
(a) Rapidly add 4 mL mixed solution of 5 parts of 20 Na2SO4 with 1 part of acetic acid to the solution from the step 924 (l)
(b) Add 04 ml Ba seeding solution as soon as possible (2ndash3 s)
(c) Adjust pH to 48 with diluted H2SO4 as indicated by the colour change to a bright red
(d) Allow to sit for at least 30 minutes
(e) Filter the colloidal suspension of Ba(Ra)SO4 through a pre-wetted (by 80 ethanol) polypropylene filter (for example 01 microm pore size 25 mm diameter Pall)
(f) Rinse the centrifuge tube walls with 4ndash5 mL sodium sulfate wash solution and filter
(g) Rinse the sides of the filter holder with 15ndash20 drops 80 ethanol
(h) Allow the filter to dry and place it into a 47 mm Petri dish The time is recorded which is considered as the time of 225Ra225Ac separation or start of 225Ac ingrowth
The source preparation must be completed on the same day
934 Lead-210 source
(a) Evaporate the Pb solution which obtained from the step of 921(f) and re-evaporate with three portion of 5 mL 65 HNO3
(b) Dissolve the residue in 10 mL 1M HNO3
(c) Add 40 mg oxalic acid to the solution and adjust pH2ndash3 with 25 NH4OH to prepare a Pb-oxalate precipitate
12
(d) Let the solution to cool down and filtrate the precipitate on a filter paper (for example Whatman 41 dried in a drying oven and weighed in advance) wash the filter 3 times with 1 mL water and 2 mL 80 ethanol
(e) Dry the precipitate (40ndash50oC) and cool down in a desiccator
(f) Weigh the dried precipitate and calculate the chemical recovery using the gravimetric method
(g) Quantitatively transfer the precipitate into a liquid scintillation vial together with the filter and add 1 mL of 6M HNO3 into the vial to dissolve the precipitate
(h) Mix the solution with 15 mL of scintillation cocktail
94Measurement
941 Alpha-spectrometry
(a) Introduce the source into the vacuum chamber and pump until a vacuum of about 05 Pa (5 x 10⁻³ mbar) is obtained Then switch on the bias voltage button of detector
(b) Record the file name sample information (unit code sample name sample volume as it is required by the actual quality management system) and measurement date in each detector log book and start the measurement A typical measuring time is about 1 day when using a 450 mm2 area detector
(c) Integrate the counts in the peaks corresponding to the alpha emitting tracers and analytes respectively The alpha spectra should be similar to the spectra illustrated in Fig IV 4 of Appendix IV The FWHM of alpha peaks should be in the range of 30ndash60 keV
(d) Spectrum analysis Integrate the channel counts in a region of interest (ROI) which has the width of about 4 x FWHM (about 3 x FWHM to the left and 1 x FWHM to the right when FWHM is about 30ndash60 keV) Integrate the channel counts in the same regions of interest (ROI) in the sample spectrum and in the blank spectrum then subtract them from the sample spectrum to give the net area of peaks for further calculation
Performing a reliable measurement knowing the background of the chamber and detector is essential moreover it is important to prepare a separate reagent blank Therefore the set of measurement always has to involve above the samples a background and a reagent blank If the quality of the determination has to be proved a reference material also should be part of the preparation series
942 Liquid scintillation spectrometry for determination of 210Pb
9421Source preparation for determination of counting efficiency of 210Pb
(a) Take 10 mL 2M HCl solution into a 50 mL beaker
(b) Add the 210Pb standard solution (10ndash15 Bq) and 30 mg Pb2+ carrier to the solution
(c) Load the solution onto a Sr resin column (3 g of Sr resin 100-150 microm) which has been preconditioned in advance with 100 mL 2M HCl
(d) Wash the column with 80 mL 2M HCl Combine the washing solution with the effluent to get a pure 210Bi fraction
13
(e) Rinse the column with 20 mL 2M HCl This last portion of 20 mL 2M HCl is discarded to avoid overlapping between the 210Bi and 210Po portions
(f) Wash the column with 25 mL 6M HNO3
(g) Elute Po with 60 mL 6M HNO3
(h) Elute Pb with 60 mL 6M HCl
(i) Evaporate the Bi Po and Pb fractions to dryness
(j) Dissolve each portion of 210Bi and 210Po in 1 mL 6M HNO3 and then transfer them into 20 mL polyethylene vials coated with PTFE (polytetrafluoroethylene)
(k) Mix the solution with 14 mL scintillation cocktail
(l) Evaporate Pb fraction three times with 2 mL 65 HNO3
(m) Dissolve the residue in 20 mL 1M HNO3
(n) Add 04 g oxalic acid while warming and stirring
(o) Adjust the pH to 3ndash5 with NH4OH to form a Pb-oxalate precipitate
(p) Filter the precipitate through a pre-weighed filter paper (diameter of 24 mm)
(q) Wash the precipitate three times with 1 mL water followed by 2 mL 80 ethanol
(r) Dry the precipitate in an oven at 40ndash50oC
(s) Cool and weigh the precipitate to determine the chemical recovery of lead
(t) Carefully transfer the Pb-oxalate precipitate into a 20 mL of liquid scintillation vial together with the filter
(u) Add 1 mL 6M HNO3 to the vial to dissolve the precipitate
(v) Mix with 14 mL of scintillation cocktail
(w) Set up windows for 210Pb and 210Bi and count the three vials (for 210Pb 210Bi and 210Po) in a liquid scintillation counter until the counting statistic uncertainty is less than 1
9422Optimum window setting for 210Pb
The activity concentration of 210Pb is determined by LSC adjusted to the low energy mode and low bias with double energetic window method [7] For the successful determination of this radionuclide two counting windows should be optimized because of the overlapping of the beta spectra of 210Pb and 210Bi The result of the optimization of counting region is shown in the Fig V 1 of Appendix V In this example the lower limit for the 210Pb energy (window A) is set at channel 115 to avoid the counts caused by chemiluminescence in the cocktail while the upper limit is set at channel 320 where the 210Pb peak ends The lower limit for the 210Bi energy region (window B) is set at channel 320 and the upper limit is set at channel 410 to avoid interference from the 210Po peak
9423 Counting efficiency of 210Pb
The efficiency of liquid scintillation for beta particles depends on the energy of the beta decay For most beta particles with a maximum beta-energy above 100 keV efficiency is high more than 90 For lower energy beta particles the efficiency is usually less and the real value depends on the degree of quenching in the sample
14
To determine the efficiency a known activity of 210Pb in equilibrium with its daughters has to be measured several times (it is practical to choose more than 10 times of counting for getting a good estimate of the uncertainty in the efficiency)
10 EXPRESSION OF RESULTS
101 Calculation of activities of relevant isotopes
1011 Calculation of the activity of 210Pb
10111 Calculation of the counting efficiency of 210Pb
The counting efficiency (ε) of 210Pb can be calculated by Eqs (1 2)
TsPb tPbTPbstdcal emaR
Z210
210210minusminus
minusminus
= λε ( 1 )
BAnBnA frrZ minus= ( 2 )
where
BBgBnAAgAn rrrrrr 00 minus=minus=
fAB Tailing factor (See Ch 10112)
Rcal Chemical recovery of making the calibration source (See Ch 10113)
10112 Calculation of the tailing factor
The 210Pb energy region (window A) is interfered with counts from ingrown 210Bi The interference is compensated for by using the ratio of counts in window A to those in window B in a pure 210Bi spectrum the so-called ldquotailing factorrdquo fAB The tailing factor is independent of the activity level of 210Bi in the sample but is dependent on the quenching level of the sample The quenching levels of the calibrant the sample and the reagent blank are necessary to keep constant within plusmn2 relative standard deviation The tailing factor can be calculated by the following formula
210
210
minus
minus=BistdBn
BistdAnBA r
rf (3)
where BBistdBgBistdBnABistdAgBistdAn rrrrrr 02102100210210 minus=minus= minusminusminusminus
10113 Chemical recoveries of Pb in calibration source and sample
The chemical recovery of lead in the calibration source preparation process is determined gravimetrically using Eq (4)
15
ccPb
calfcalofgcal mC
mmfR
minus
minus=
)( ( 4 )
When the amount of Pb in the sample is not negligible compared with that in the Pb carrier the sample Pb content should be allowed for in calculation of the chemical recovery of Pb The chemical recovery of Pb in the sample can be calculated by Eqs (5 6)
)(
)(
ssPbccPb
fofg
mCmC
mmfR
minusminus +minus
= ( 5 )
Mass ratio (fg) of atomic mass of Pb to molar mass of Pb-oxalate
oxalatePb
Pbg M
Mf
minus
= (6 )
10114 Calculation of the activity of 210Pb
The activity of 210Pb on the separation date can be calculated from the LSC measurement using the following equations
Rm
ffZa
s
PbPbsPb ε
minusminusminus = 32
210 (7)
22102
tPb
Pbef minusminusminus = λ ( 8 )
321013210
3 tPb
PbPbe
tf
minusminus= minus
minus λλ
(9 )
However if the time interval (t2) between the separation of 210Pb and the beginning of the measurement and the counting time of the sample (t3) are much smaller than the half life of 210Pb (222 y) f2-Pb f3-Pb u(f2-Pb) and u(f3-Pb) are negligible
1012 Calculation of the activity of 210Po
The activity of 210Po on the separation date is calculated according to the procedure detailed in IAEAAQ12 [8]
1013 Calculation of the activities of the U and Th isotopes
The ratio of the net counts of the tracer and analyte peak is used to calculate the activity of the analyte in the sample on the date of chemical separation taking into account the activity of the tracer solution the masses of the sample and the tracer used The activity of the analyte (as Bq(kg dry)-1) at the separation time is calculated by the following formula
16
TgT
g
s
TTTTT
nTs
nTs rr
rr
m
fmCfm
rm
rCa
0
0
minusminus
== (16)
The decay of the tracer between its reference date (from the certificate) and counting is taken into correction by fT as follows
sTT t
T ef λminus= (17)
The activity of analyte in the sample should be calculated back to the date of sample collection
teaa
λminus=0 (18)
The detector efficiency is not needed in isotope dilution alpha spectrometry for calculation of the activity of the analyte but is needed for calculation of the chemical recovery It is determined from the activity of the tracer added and the net counts in the corresponding peak as follows
sTT t
TT
nT emC
rR λ
εminus= (19)
The detector efficiency is determined by the calibration source prepared in a similar way as the analytes and using the same measurement conditions For analytes which are co-precipitated the calibration source also should be co-precipitated using the same conditions including filter diameter For analytes which are electrodeposited the calibration source should also be prepared by electrodeposition Efficiency determinations are typically performed and regularly checked in the frame of analytical quality control The efficiency can be calculated according to the following equation
cal
caln
A
r =ε (20)
Where
Rn cal net count rate of calibration source in respective ROI
Acal certified activity of the calibration source
1014 Calculation of the activity of 226Ra [9]
10141 Calculation of the chemical recovery of Ra
The chemical recovery is determined by using the peak of 217At at 70669 keV (Pα 0999 32) The ingrowth of 225Ac (T12 100 d) the daughter of 225Ra is directly associated with the short lived progenies 221Fr (T12 48 min) 217At (T12 323 ms) and 213Po (T12 37 micros) When the daughters are in equilibrium with 225Ra the 217At peak shows no overlap with descendants of natural isotopes of radium in the alpha spectrum (225Ac interferes with 224Ra 221Fr interferes with 220Rn) From the initial tracer activity AT (added 229Th225Ra) the maximum detectable count rate rnTmax is calculated by taking into account the decay of unsupported 225Ra after its separation from Th (tsTh-229) as well as the build-up of 225Ac (tsRa-225) in the following equation
17
225225
225)(max
229225225
minusminus
minusminusminus
minus= minusminusminus
RaAc
ActtTnT
sThsRaRaeArλλ
λε λ (21)
The chemical recovery R is calculated as ratio of the measured count rate rnT and theoretical value rnTmax
maxnT
nT
r
rR = (22)
10142 Calculation of activity of 226Ra
While AT is the activity of the 225Ra tracer after the separation from 229Th its activity at the beginning of the build-up of 225Ac is yielded as follows
)(225
225225 sAcRa ttTRa eAA minusminus
minusminusminus= λ
( 2 4 )
The activity of 225Ac in any time is given by
( )225225
)()(225225
225
225225225225
minusminus
minusminusminusminusminusminus
minus minusminus=
minusminusminusminus
RaAc
ttttRaAc
Ac
AcAcAcRa eeAA
λλλ λλ
(25)
Integrating over the counting period with tm as the start and tem as the end of the measurement results into the activity of 225Ac at tem
( )( )( ) ( )( )
minusminusminus
= minusminusminusminus minusminusminusminus
minusminusminus
minusminusminus
225225225225
225225225
225225225
1)( AcemRaAcmRa tttt
RamemRaAc
AcRaemmAc ee
ttAttA λλ
λλλλ
( ) ( )( )
minusminus minusminusminusminus minusminusminusminus
minus
225225225225
225
1AcemAcAcmAc tttt
Ac
ee λλ
λ (26)
Finally the activity concentration of 226Ra is the following
217
226225226 )(
minus
minusminusminus =
At
RaemmAcRa r
rttAA (27)
where
0
0226226226 t
n
tt
nr Ra
mem
RaRa
minusminusminus minus
minus= and
0
0217217217 t
n
tt
nr At
mem
AtAt
minusminusminus minus
minus=
102 Expression of combined uncertainties of relevant isotopes
According to the Guide to Expression of Uncertainty in Measurement [11 12] the combined uncertainty is described in detail and an example is calculated for each relevant radionuclide in Appendix VI
18
103 Decision threshold
In accordance with ISO 119292010 the decision threshold gives a decision on whether or not the physical effect quantified by the measurand is present
The decision threshold a is the non-negative measurand quantifying the physical effect of interest If the result a is below the decision threshold the result can not be attributed to the physical effect nevertheless it can not be concluded that it is absent If the physical effect is really absent the probability of taking the wrong decision that the effect is present is equal to the specified probability of α (the error of first kind often chosen 005 and moreover α=β where β is the error of second kind then k1-α=k1-β=165) Any of the determined primary measurement result is only significant for the true value of the measurand to differ from zero if it is larger than the decision threshold given here
a=k1-αu(0) where u(0) is the uncertainty associated to the non-negative measurand uncertainty of decision threshold itself (with other words it can be estimated as uncertainty associated to slightly higher values than background or reagent blank depending on the procedure) and can be quantified here as
20
0
03
01)0(
t
n
tt
n
Rmu
s
+=ε
(28)
104 Detection limit
In accordance with ISO 119292010 the detection limit indicates the smallest true value of the measurand which can be still detected with the applied procedure this gives a decision on whether or not the measurement procedure satisfies the requirements and is therefore suitable for the intended measurement purpose In order to find out whether a procedure is suitable for the purpose the detection limit is compared with the specified guideline value of the measurand
The detection limit a is the smallest true value of the measurand for which the probability of the wrong assumption that the physical effect is absent does not exceed the probability β (error of the second kind) The detection limit is obtained as the smallest solution of the following equation
a=a+k1-β(a) where a ge a (29)
Eq (29) is an implicit equation which can be calculated by iteration As a starting approximation a1=3a can be chosen in most cases the iteration converges and the linear interpolation with approximation of a=(k1-α+k1-β)u(a) leads to the approximation
)0()( 221
21
2 ukkqqa αβ minusminus minus++= (30)
with [ ]
minus+= minusminus )0()(
2
1)0( 2
12
1
21
1 uaua
kukq a
β (31)
If α=β than k1-α=k1-β=k a=2q follows
19
[ ])0()()0(2 21
2
1
2 uau
a
kuka minus+= (32)
Where α is the probability of the error of first kind the probability of rejecting a hypothesis if it is true and β is the probability of the error of second kind the probability of accepting a hypothesis if it is false
The detection threshold and limit of the isotopes in the applied procedure are described in Table VII 1 of Appendix VII
The difference between using the decision threshold and using the detection limit is that the measured values are to be compared with the decision threshold whereas the detection limit is to be compared with the guideline value (guideline value corresponds to scientific legal or other requirements for which the measuring procedure intended to assess)
11 VALIDATION OF THE PROCEDURE
The procedure was validated with an IAEA reference material IAEA-434 The material was initially characterized at IAEA Environment Laboratories in Seibersdorf during the feasibility study phase Then the characterization of the material took place within the interlaboratory comparison piloted by IAEA Environment Laboratories in Seibersdorf in cooperation with the Consultative Committee on Ionization Radiation (CCRI) of the International Bureau des Poids et Mesure (PIBM) The results reported in this comparison were used to derive the property values of the measurands of interest The IAEA-434 reference material [12] was collected from a processing plant located in Gdansk (Poland) in 2003 The matrix composition is CaSO4middot2H2O (96) P2O5 (1-2) F total (12) SiO2 (1) Al2O3 (02) The property values of all radionuclides of IAEA 434 were established on the basis of a robust approach proposed by DL Duewer [13] and the Mixture Model median (MM-median) of the analytical results reported by the expert laboratories was calculated To estimate the standard uncertainty associated with the property value the MM-median based standard deviation was calculated from the span of the central 50 of the MM probability density function The validation results of the procedure are shown in Tables VIII 1 and VIII 2 Figs VIII 1ndashVIII 7 of Appendix VIII 111 Trueness of the method
The relative bias of the method is calculated by the following formula
100() timesminus=C
CXδ (34)
112 Precision of the method
The precision index ( PI() ) is calculated according to the following formulas
100)()(
()2
2
2
2
times+=X
Xu
C
CuPI (35)
20
113 Repeatability limit
The repeatability limit is estimated by analyzing five subsamples from the same bottle of the IAEA-434 reference material for the relevant radionuclides investigating the repeatability conditions instrument analyst shortest time etc The repeatability limit is calculated by the following formula
rL Sr 82= (36)
114 Reproducibility limit
The reproducibility limit is also estimated by analyzing the IAEA-434 reference material from ten duplicates samples were taken from ten randomly selected packing unit with at least one parameter being changed in the analytical system (analyst analysis date instrument etc) The reproducibility limit is calculated by the following formula
RL SR 82= (37)
115 Outlier test
The presence of individual values that appear to be inconsistent with all other laboratories or values may cause some problems during the final evaluation of data According to ISO 5725-2 an outlier test should be performed before the calculation of repeatability and reproducibility The analysis includes a systematic application of a statistical test of outliers a great variety are available which could be used for the purposes of this part of ISOIEC 17025 Usually the graphical consistency technique or the numerical outlier test are applied Cohranrsquos test of variabilities should be applied first and then any necessary action should be taken Grubbrsquos test is primarily a test of in between laboratory variability
116 Acceptance criteria
The method can be accepted if
PI()lt 25
LRltδ ( 3 8 )
According to these criteria the method performs well as the Table VIII 1 of Appendix VIII shows
12 TEST REPORT
The test report shall conform to ISOIEC 17025 requirements and shall contain the following information
bull a title (test report calibration report reference material production etc)
bull the name and address of the laboratory and location where any part of the test or calibration or production of reference material etc were carried out
bull unique identification of the report on each page with numbering of pages
21
bull analysis request code
bull reference to the measurement method used
bull sampling date (if available)
bull sample description
bull sample code or identification number
bull date of the separation of analyte
bull applied tracers with their reference dates and activity values with the code of their certificate
bull the results with units of measurement and associated uncertainty value expressed in the same unit as the result
bull date to which the test result has been corrected (corrected to the sampling date or separation time dd-mm-yyyy)
bull responsible person (with accessibility)
22
REFERENCES
[1] FEDERAL REGISTER National emission standards for hazardous air pollutants 57 107 (1992) 23305-23320
[2] RUTHERFORD PM DUDAS MJ AROCENA JM Heterogeneous distribution of radionuclides barium and strontium in phosphogypsum by-product Sci Total Environ 180 (1996) 201-209
[3] NATIONAL COUNCIL ON RADIATION PROTECTION AND MEASUREMENTS Evaluation of Occupational and Environmental Exposures to Radon and Radon Daughters in the United States NCRP Report 78 (1984)
[4] MARTIN P HANCOCK GJ Routine analysis of naturally occurring radionuclides in environmental samples by alpha-particle spectrometry Supervising Scientist Report 180 (2004) httpwwwenvironmentgovaussdpublicationsssr180html
[5] INTERNATIONAL ATOMIC ENERGY AGENCY Reference Material IAEA-434 Naturally Occurring Radionuclides in Phosphogypsum IAEA Analytical Quality in Nuclear Applications Series No 17 IAEAAQ17 IAEA Vienna (2010)
[6] MEDLEY P BOLLHOumlFER A ILES M RYAN B MARTIN P Barium sulfate method for radium-226 analysis by alpha spectrometry Environmental Research Institute of the Supervising Scientist internal report 501 (2005)
[7] VAJDA N LAROSA J ZEISLER R DANESI P KIS-BENEDEK G A Novel Technique for the Simultaneous Determination of 210Pb and 210Po using a Crown Ether J Environ Radioactivity 37 (1997) 355-372
[8] INTERNATIONAL ATOMIC ENERGY AGENCY A Procedure for the Determination of Po-210 in Water Samples by Alpha Spectrometry IAEA Analytical Quality in Nuclear Applications Series No 12 IAEAAQ12 IAEA Vienna (2009)
[9] GUOGANG J TORRI G INNOCENZI P OZONE R Di LULLO A Determination of radium isotopes in mineral and environmental water samples by alpha-spectrometry J of Radioanalytical and Nuclear Chemistry 267 3 (2005) 505-514
[10] EURACHEMCITAC Guide Quantifying uncertainty in analytical measurement 2nd Ed(2000)
[11] INTERNATIONAL ATOMIC ENERGY AGENCY Quantifying Uncertainty in Nuclear Analytical Measurements IAEA-TECDOC-1401 IAEA Vienna (2004)
[12] SHAKHASHIRO A SANSONE U Technically Enhanced Naturally Occurring Radionuclides (TENORM) in Phosphogypsum The Interlaboratory Comparison CCRI(II)07-35 Metrologia (2009)
[13] DUEWER DL A Robust Approach for the Determination of CCQM Key Comparison Reference Values and Uncertainties Working document CCQM04-15 BIPM wwwbipminfoccCCQMAllowed10CCQM04-15pdf (2004)
23
[14] Monographie BIPM-5 Vol 1ndashMonographie BIPM-5 Vol 5
httpwwwnucleideorg Decay Data Evaluation Project (DDEP) accessed in October 2010
[15] NuDat 25 (Database at the US NNDC) httpwww-ndsiaeaorg accessed in October 2010
[16] HORWITZ et al A Novel Strontium-Selective Extraction Chromatographic Resin Solvent Extraction amp Ion Exchange 10 (1992) 313
[17] HORWITZ et al Extraction Chromatography of Actinides and Selected Fission Products Principles and Achievement of Selectivity presented at International Workshop on the Application of Extraction Chromatography in Radionuclide Measurement IRMM Geel 1998
[18] HORWITZ et al Separation and Preconcentration of Actinides by Extraction Chromatography Using a Supported Liquid Anion Exchanger Application to the Characterization of High-Level Nuclear Waste Solutions Analytica Chimica Acta 310 (1995) 63-78
[19] HORWITZ et al Separation and Preconcentration of Uranium from Acidic Media by Extraction Chromatography Analytica Chimica Acta 266 (1992) 25-37
[20] C-K KIM MARTIN P FAJGELJ A Quantification of measurement uncertainty in the sequential determination of 210Pb and 210Po by liquid scintillation counting and alpha particle spectrometry Accreditation and Quality Assurance 13 12 (2008) 691-702
[21] J KRAGTEN Calculating Standard Deviation and Confidence Intervals with a Universally Applicable Spreadsheet Technique Analyst 119 (1994) 2161ndash2165
24
APPENDIX I NUCLEAR DATA OF RELEVANT RADIONUCLIDES AND DECAY CHAINS OF U
AND Th SERIES
TABLE I 1 NUCLEAR DATA OF RELEVANT RADIONUCLIDES [14]
Radionuclide Half-life Disintegration modes
E (MeV) Probability ()
225Ac 100(1) d α 5580 5(14) 095(4)
α 5599 3(14) 0114(7)
α 5609 0(14) 109(5)
α 5637 3(14) 416(23)
α 5682 2(14) 131(4)
α 5686 4(14) 0021(14)
α 5723 1(14) 203(23)
α 5730 5(14) 16(3)
α 5731 6(14) 124(10)
α 5731 9(17) 90(5)
α 5797 7(14) 62(9)
α 5793 1(21) 189(20)
α 5804 2(14) 03
α 5829 6(14) 524(24)
217At 323(4) x 10-3 s α 6484 7(16) 0016 7(8)
α 6813 8(16) 0038 4(15)
α 7066 9(16) 99932(3)
133Ba 10540(6) y γ 0053 162 2(6) 214(3)
γ 0079 614 2(12) 265(5)
γ 0080 997 9(11) 329(3)
γ 0276 398 9(12) 716(5)
γ 0302 850 8(5) 1834(13)
γ 0356 012 9(7) 6205(19)
γ 0383 848 5(12) 894(6)
210Bi 5012(5) d β 1162 1(8) 99999 86(2)
212Bi 6054(6) min β 0633(2) 190(4)
β 0741(2) 145(29)
β 1527(2) 458(21)
β 2254(2) 5523(21)
α 6050 92(4) 251(1)
α 6090 02(4) 97(1)
221Fr 479(2) min α 6126 3(15) 151(2)
α 6243(2) 134(7)
α 6341 0(13) 828(2)
TABLE I 1 NUCLEAR DATA OF RELEVANT RADIONUCLIDES [14] (cont)
25
Radionuclide Half-life Disintegration modes
E (MeV) Probability ()
210Pb 2223(12) y β 0017 0(5) 802(13)
β 0063 5(5) 198(13)
γ 0046 539(1) 4252(40)
208Po 2898(2) y α 5114 9(14) 99995 8(4)
α 4220(15) 24(7)x10-4
209Po 115(13) y α 4885(2) 198(32)
α 4883(2) 792(32)
α 4622(5) 0548(7)
210Po 138376 3(17) d α 5304 33(7) 99998 76
α 4516 66(9) 0001 24(4)
213Po 370(5) x 10-6 s α 8375 9(25) 99995 0(5)
216Po 0150(5) s α 6778 6(5) 99998 1(3)
α 5988 6(10) 0001 9(3)
218Po 3094(6) min α 6002 35(9) 99976 9(32)
223Ra 1143(5) d α 5747 0(4) 900(20)
α 5716 23(29) 516(13)
α 5606 73(30) 252(5)
α 5539 80(90) 900(20)
224Ra 3627(7) d α 5448 81(16) 526(7)
α 5685 50(15) 9472(7)
γ 0240 986(6) 412(4)
225Ra 1482(19)d β 0316(5) 688(20)
β 0356(5) 312(20)
γ 0040 09(5) 300(7)
226Ra 1 600(7) y α 4601(1) 595(4)
α 4784 34(25) 94038(40)
228Ra 575(4) y β 00127(7) 30(10)
β 00256(7) 87(9)
β 00391(7) 49(10)
β 00395(7) 12(10)
220Rn 558(3) s α 5748 46(14) 0118(15)
α 6288 22(10) 99882(15)
222Rn 3823 2(8) d α 5489 48(30) 9992(1)
228 Th 69860(23) d α 5176 89(23) 020(2)
α 5211 08(22) 038(3)
α 5340 38(22) 262(2)
α 5423 28(22) 732(2)
TABEL I 1 NUCLEAR DATA OF RELEVANT RADIONUCLIDES [14] (cont)
26
Radionuclide Half-life Disintegration
modes E (MeV) Probability ()
229 Th 7 340(160) y α 5053(2) 660(10)
α 4978 5(12) 317(4)
α 4967 5(12) 597(6)
α 4901 0(12) 1020(8)
α 4845 3(12) 5620(20)
α 4814 6(12) 930(8)
230 Th 7538(30) x 104 y α 4687 0(15) 763(3)
α 4620 5(15) 234(10)
232 Th 1402(6) x 109 y α 3810 0(14) 0068(20)
α 3948 5(14) 210(13)
α 4011 2(14) 789(13)
234 Th 2410(3) d β 0105(10) 65(7)
β 0106(10) 141(12)
β 0198(10) 778(15)
γ 0063 30(2) 375(8)
232U 706(11) y α 5263 48(9) 306(6)
α 5320 24(9) 691(6)
233U 1592(2) x 105 y α 4824 2(12) 843(6)
α 4783 5(12) 132
234U 2455(6) x 105 y α 4603 5(7) 0210(2)
α 4722 4(7) 2842(2)
α 4774 6(7) 7137(2)
235U 704(1) x 106 y α 4322(4) 333(6)
α 4397 8(13) 5719(20)
α 4414 9(5) 301(16)
α 4502 4(7) 128(5)
α 4556 0(4) 379(6)
α 4596 4(13) 474(6)
236U 2343(6) x 107 y α 4445(5) 261(40)
α 4494(3) 738(40)
238U 4468(5) x 109 y α 4038(5) 013(3)
α 4151(5) 2233(50)
α 4198(3) 7754(50)
Emax for beta emitting radioisotopes
Data were taken from [15]
27
FIG I 1 Decay chain of 238U [4]
FIG I 2 Decay chain of 232Th [4]
28
APPENDIX II FLOW CHART FOR SEQUENTIAL SEPARATION OF 210Po 210Pb Th U AND 226Ra
IN PHOSPHOGYPSUM
29
APPENDIX III PROPERTIES OF RESINS
III1 Sr resin
FIG III 1 Structure of the Sr resin (wwweichromcom)
FIG III 2 Capacity factor of Sr resin in nitric acid (wwweichromcom) [16]
30
FIG III 3 Capacity factor of Sr resin in nitric acid (wwweichromcom) [17]
III2 TEVA resin
FIG III 4 Structure of the TEVA resin (wwweichromcom)
31
FIG III 5 Capacity factor of TEVA resin in nitric acid and hydrochloric acid (wwweichromcom) [18]
III3 UTEVA resin
FIG III 6 Structure of the UTEVA resin (wwweichromcom)
32
FIG III 7 Capacity factor of UTEVA resin in nitric acid and hydrochloric acid (wwweichromcom) [19]
33
APPENDIX IV ALPHA SPECTRA OF ANALYTES
FIG IV 1 Alpha spectrum of Po isotopes
FIG IV 2 Alpha spectrum of Th isotopes in phosphogypsum (with progeny)
228Th is resulted from 232U tracer spiked in the sample
34
FIG IV 3 Alpha spectrum of U isotopes
FIG IV 4 Alpha spectrum of 226Ra and its progeny (spiked with 225Ra)
35
FIG IV 5 Overlapping alpha spectra of U and Po isotopes
FIG IV 6 Overlapping alpha spectra of U and Th (with progeny) isotopes
36
APPENDIX V LIQUIDE SCINTILLATION SPECTRA
a)
b)
A window
(115-320 ch)
B window
(320 -410 ch)
210Po
210Pb
210Bi
210Bi
Co
unts
Ch
ann
elC
oun
tsC
han
nel
Channel number
a)
b)
A window
(115-320 ch)
B window
(320 -410 ch)
210Po
210Pb
210Bi
210Bi
Co
unts
Ch
ann
elC
oun
tsC
han
nel
Channel number
FIG V 1 Typical liquid scintillation spectra of beta-emitting 210Pb and 210Bi and alpha emitting 210Po (calibration sources) a) 210Pb 210Bi and 210Po spectra
b) pure 210Bi spectrum
37
APPENDIX VI CALCULATION OF THE COMBINED UNCERTAINTY
OF THE ACTIVITIES OF THE ANALYTES ON SAMPLING DATE
VI1 Uncertainty of the 210Pb result [20]
VI11 Uncertainty of counting efficiency of 210Pb
2
2
2
2
2210
2
210
2210
222
)()()()()()( )( PbTPbT
calcal
stdPbstdPb
Pbb mum
RuR
aua
utZuZ
u
minus+
minus+
minus++
= minusminus
minusεεελεεε (VI-1)
2
222
2 )()()()()( (Z) BABnBnBAAn furrufruu minus+minus+= (VI-2)
20
2 )()()( AAgAn rururu += (VI-3)
20
2 )()()( BBgBn rururu += (VI-4)
VI12 Uncertainty of the tailing factor fAB
The uncertainty of the tailing factor fAB is calculated according to following equations
2
210
210
2
210
210
)()()(
+
=
minus
minus
minus
minus
BicalnB
BicalnB
BicalAn
BicalAnBABA r
ru
r
ruffu (VI-5)
20
2210210 )()()( ABicalAgBicalAn rururu += minusminus (VI-6)
20
2210210 )()()( BBicalBgBicalBn rururu += minusminus (VI-7)
The uncertainty of counting efficiency for 210Pb can be calculated by Eq (VI-8)
2
2
2
2
2210
2
210
2210
222
)()()()()()( )( PbTPbT
calcal
stdPbstdPb
Pbb mum
RuR
aua
utZuZ
u
minus+
minus+
minus++
= minusminus
minusεεελεεε (VI-8)
2
222
2 )()()()()( (Z) BABnBnBAAn furrufruu minus+minus+= (VI-9)
20
2 )()()( AAgAn rururu += (VI-10)
20
2 )()()( BBgBn rururu += (VI-11)
38
VI13 Uncertainty of chemical recovery of Pb
Uncertainty of chemical recoveries of Pb in calibration source
minusminus+
minus+
= 2
2
2
2
2
2
cal )()(
)()(
)( )(R calfcalfcalof
calcalof
calfcalof
calg
g
cal mumm
Rmu
mm
Rfu
f
Ru
2
1
2
2
2
2
)()(
)()(
minus+
minus+
minus
minusminus
minusc
ccPb
cPbcalcPb
ccPb
ccal mumC
CRCu
mC
mR (VI-12)
The uncertainty of chemical recovery of Pb in the sample can be calculated
minusminus+
minus+
= 2
2
2
2
2
2
)()(
)()(
)( (R) ffof
offof
gg
mumm
Rmu
mm
Rfu
f
Ru
2
2
2
2
)()(
)()( c
ssPbccPb
cPbcPb
ssPbccPb
c mumCmC
CRCu
mCmC
mR
+minus+
+minus+
minusminus
minusminus
minusminus
2
1
2
2
2
2
)()(
)()(
+minus+
+minus+
minusminus
minusminus
minusminuss
ssPbccPb
sPbsPb
ssPbccPb
s mumCmC
CRCu
mCmC
mR (VI-13)
VI14 Uncertainty of mass ratio
The uncertainty of the mass ratio (fg) of atomic mass of Pb to molar mass of Pb-oxalate is calculated using the equations below
22
M Pb)(
+
=
minus
minus
oxalatePb
M
Pbgg M
u
M
uffu oxalatePb (VI-14)
The uncertainty of the molar mass of lead oxalate u(MPb-oxalate) can be derived by combining standard uncertainties in atomic masses of its constituents as shown in Table VI 1
39
TABLE VI 1 STANDARD UNCERTAINTIES OF ATOMIC WEIGHT AND THE GRAVIMETRIC FACTOR fg
Element Atomic weight
(gmol-1)
Quoted uncertainty (gmol-1)
Conversion factor
Standard uncertainty (gmol-1)
Mass ratio of atomic mass of Pb to
molar mass of Pb-oxalate
Uncertainty ofatomic mass
of Pb to molar mass of
Pb-oxalate
Pb 207215 2 0000 15 3 0000 087 0701 9 0000 002
C 12010 7 0000 8 3 0000 46
O 15999 4 0000 3 3 0000 17
VI15 Combined uncertainty of activity of 210Pb
The combined uncertainty of the 210Pb activity is calculated from Eq (VI-15)
minus+
minus+
minus+
= minusminusminusminus 2
2
2102
2
2102
2
210
2
2
2101 )()()()()( s
d
sPb
BA
sPb
nBnB
sPb
BAnA
sPb
Pbc mum
afu
Z
arru
Z
afru
Z
aau
2
1
23
2
3
21022
2
2
2102
2
2102
2
210 )()()()(
+
+
minus+
minus+ minus
minus
minusminus
minus
minusminusminusPb
Pb
sPbPb
Pb
sPbsPbsPb fuf
afu
f
aRu
R
au
aε
ε (VI-15)
)()( 210222 minusminusminus = PbPbPb utffu λ (VI-16)
210
210321033
)(
11)(
3210
3210
minus
minusminus
minus
minusminusminus
minusminus=
minus
minus
Pb
Pbt
t
PbPbPb
u
e
etffu
Pb
Pb
λλλ λ
λ
(VI-17)
However if the time interval (t2) between the separation of 210Pb and the beginning of the measurement and the counting time of the sample (t3) are much smaller than the half life of 210Pb f2-Pb f3-Pb u(f2-Pb) and u(f3-Pb) are negligible The uncertainties associated to components mentioned above can be calculated as follows
0
0
3
)(t
r
t
rru
Po
gn +=
minus
(VI-18)
0
0
3
)(t
r
t
rru t
Po
tgtn +=
minus
(VI-19)
minus+
+
= minusminusminus
minus2
2
2102
2
2102
2
210210 )()()( )( tn
tn
sPo
nn
sPo
TT
sPo
sPo rur
aru
r
aAu
A
aau
2
2
21022
2
2
2102
2
2102
2
210)()()()( T
T
sPo
PoPo
sPo
TT
sPo
ss
sPofu
f
afu
f
amu
m
amu
m
a
+
+
+
minus+ minus
minusminus
minusminusminus
40
2
1
3
2
3
210 )(
+ minus
minus
minusPo
Po
sPo fuf
a (VI-20)
)()( TTTt utffu λ= (VI-21)
)()( 210222 minusminusminusminus = PoPoPoPo utffu λ (VI-22)
210
210321033
)(
11)(
3210
3210
minus
minusminus
minus
minusminusminus
minusminus=
minus
minus
Po
Pot
t
PoPoPo
u
e
etffu
Po
Po
λλλ λ
λ (VI-23)
VI16 Combined uncertainty of activity of 210Po
The uncertainty of the activity of 210Po on the separation date is calculated according to IAEAAQ12 procedure [8]
VI2 Uncertainty of other alpha emitting isotopes
The same formulas are used to calculate the combined uncertainties as equations that are used for calculation of the activity of alpha emitting analytes at the separation time and the sampling date as well as the chemical recovery and counting efficiency These formulas have to be applied in the spreadsheet approach for calculating the combined uncertainties knowing the standard uncertainty of each component VI3 Spreadsheet approach
For the quantifying the uncertainties the spreadsheet technique [21] was used which could be summarised as follows and showed in the Fig VI 1
bull Calculate function y using parameter xj
y=f(x1x2xj xn) (VI-24)
bull recalculate the same function n times increasing xj to xj+dxj (dxj standard deviation) and keeping the remaining parameters constant
y=f(x1x2xj+dxj xn) (VI-25)
bull the uncertainty on the function dy is the square root of the sum of squares
( )sum minus=n
jyydy1
2 (VI-26)
bull The individual variance contribution fj is
( )( )sum minus
minus=
n
j
jj
yy
yyf
1
2
2
(VI-27)
41
FIG VI 1 Spreadsheet approach for quantifying the uncertainty of the measurement
The results are summarised for the individual isotopes in the Tables VI 2ndashVI 9 and the results of the individual analysis with their uncertainties are shown in the Figs VI 3ndashVI 9 The detailed study about the usual contributors of uncertainty in the nuclear analytical techniques could be found in the IAEA-TECDOC-1401 [11] TABLE VI 2 AN EXAMPLE OF QUANTIFYING UNCERTAINTIES OF 210Po RESULT
Symbol unit Value of variable
Uncertainty Conversion factor to standard uncertainty
Standard uncertainty
Contribution to combined
uncertainty ()
m g 0508 9 0007 3 3 0004 2 010
rgt s-1 0197 0075 1 0075 361
r0t s-1 0000 017 0000 034 1 0000 034 0000 014
rg s-1 0081 0029 1 0029 6352
r0 s-1 0000 034 0000 033 1 0000 033 0000 08
at Bq 0829 0019 1 0019 0252
λt d-1 0000 019 0000 013 1 0000 013 negligible
λPo d-1 0005 72 x 10-9 1 72x10-9 negligible
ft 0982 14 0000 43 1 0000 43 0000 091
f2-Po 1005 73 x 10-9 1 73x10-9 negligible
f3-Po 1005 5 18 x 10-8 1 18 x10-8 negligible
aPo1 Bqmiddotkg-1 672 94
contribution is less than 1 x 10⁻⁵
TABLE VI 3 AN EXAMPLE OF QUANTIFYING UNCERTAINTIES OF EFFICIENCY OF 210Pb
Symbol unit Value of variable
Uncertainty
Conversion factor to standard
uncertainty
Standard uncertainty
Contribution to combined
uncertainty ()
mvial g 14936 35 0000 1 3 0000 17 0004 8
42
Symbol unit Value of variable
Uncertainty
Conversion factor to standard
uncertainty
Standard uncertainty
Contribution to combined
uncertainty ()
mvial+carrsol g 16036 54 0000 1 3 0000 17 0004 8
cPb g g-1 0027 42 0000 021 1 0000 021 011
mvial g 16036 72 0000 10 3 0000 17 0004 8
mvial+std g 17132 6 0000 10 3 0000 17 0004 8
astd Bq 1245 0189 1 0189 805
fgravimetry 0701 85 0000 41 1 0000 41 0066
mfilter g 0036 54 0000 10 3 0000 17 42
mfilter+Pb-precipitate g 0073 77 0000 10 3 0000 17 41
rA s-1 7362 0041 1 0041 76
rA0 s-1 0029 5 0003 1 0002 7 0035
rB s-1 0416 0 0011 1 0011 060
rB0 s-1 0011 7 0002 1 0002 2 0024
fAB 1049 0023 1 0023 040
t12 Pb d 814508 7305 1 731 23
tmeas-ref d 4 532 -
ε 0859 7 0015 3
43
TABLE VI 4 AN EXAMPLE OF QUANTIFYING UNCERTAINTIES OF 210Pb RESULT
Symbol unit Value of variable
Uncertainty Conversion factor to standard uncertainty
Standard uncertainty
Contribution to combined
uncertainty ()
ms g 0508 9 0007 3 3 0004 2 03
rgA s-1 0283 0035 1 0035 883
r0A s-1 0011 7 0002 2 1 0002 2 03
rgB s-1 0031 0009 1 0009 58
r0B s-1 0005 6 0002 3 1 0002 3 04
Ζ s-1 0245 1 0032 7 1 0032 7 -
fAB 1015 3 0012 9 1 0012 9 001
ε 0859 7 0015 3 1 0015 3 13
R 0858 8 0025 3 1 0077 2 35
aPb1 Bqmiddotkg-1 652 12
TABLE VI 5 AN EXAMPLE OF QUANTIFYING UNCERTAINTIES OF 234U RESULT
Symbol unit Value of variable
Uncertainty Conversion factor to standard uncertainty
Standard uncertainty
Contribution to combined
uncertainty ()
ms g 0508 9 0007 3 3 0004 2 003
rgt s-1 0021 78 0008 01 1 0008 369
r0t s-1 0000 030 0000 022 1 0000 022 0000 5
rg s-1 0016 15 0005 90 1 0006 628
r0 s-1 0000 016 0000 022 1 0000 022 0000 1
at Bq 0088 35 0002 10 1 0002 01 029
aU-234_1 Bqmiddotkg-1 129 3
TABLE VI 6 AN EXAMPLE OF QUANTIFYING UNCERTAINTIES OF 238U RESULT
Symbol unit Value of variable
Uncertainty Conversion factor to standard uncertainty
Standard uncertainty
Contribution to combined
uncertainty ()
ms g 0508 9 0007 3 3 0004 2 003
rgt s-1 0021 78 0008 01 1 0008 353
r0t s-1 0000 030 0000 022 1 0000 022 0000 5
rg s-1 0015 61 0005 67 1 0006 644
r0 s-1 0000 009 0000 008 1 0000 008 0000 1
at Bq 0088 35 0002 10 1 0002 1 028
aU-238_1 Bqmiddotkg-1 124 3
44
TABLE VI 7 AN EXAMPLE OF QUANTIFYING UNCERTAINTIES OF 230Th RESULT
Symbol unit Value of variable
Uncertainty Conversion factor to standard uncertainty
Standard uncertainty
Contribution to combined
uncertainty ()
ms g 0508 9 0007 3 3 0004 2 005
rgt s-1 0022 63 0006 44 1 0006 387
r0t s-1 0000 077 0000 063 1 0000 063 0006 1
rg s-1 0028 38 0007 90 1 0008 608
r0 s-1 0000 012 0000 010 1 0000 010 0000 1
at Bq 0090 03 0002 30 1 0002 303 051
aTh-230_1 Bqmiddotkg-1 223 9
TABLE VI 8 AN EXAMPLE OF QUANTIFYING UNCERTAINTIES OF 232Th RESULT
Symbol unit Value of variable
Uncertainty Conversion factor to standard uncertainty
Standard uncertainty
Contribution to combined
uncertainty ()
ms g 0508 9 0007 3 3 0004 2 004
rgt s-1 0022 63 0006 44 1 0006 265
r0t s-1 0000 077 0000 063 1 0000 063 0004 2
rg s-1 0000 28 0000 10 1 0000 1 727
r0 s-1 0000 011 0000 008 1 0000 008 048
at Bq 0090 03 0002 30 1 0002 3 035
aTh-232_1 Bqmiddotkg-1 21 009
TABLE VI 9 AN EXAMPLE OF QUANTIFYING UNCERTAINTIES OF 226Ra RESULT
Symbol unit Value of variable
Uncertainty Conversion factor
to standard uncertainty
Standard uncertainty
Contribution to combined
uncertainty ()
ms g 0508 9 0007 3 3 0004 2 003
rgt s-1 0043 10 0025 05 1 0025 05 603
r0t s-1 0000 111 0000 128 1 0000 128 0004
rg s-1 0063 32 0018 78 1 0018 78 393
r0 s-1 0000 070 015 0000 070 013 1 0000 070 013 0000 5
at Ra-225 Bq 0779 50 0022 53 1 0022 53 04
λAc225 d-1 0069 315 0000 624 1 0000 624 0000 02
λRa225 d-1 0046 520 0000 693 1 0000 693 008
t1-t0 d 337
aRa-226_1 Bqmiddotkg-1 766 39
45
APPENDIX VII DETECTION THRESHOLD AND LIMIT OF THE APPLIED PROCEDURE
TABLE VII 1 TYPICAL DECISION THRESHOLD AND DETECTION LIMIT FOR RELEVANT ISOTOPES
Symbol unit 210Pb 210Po 234U 238U 230 Th 232 Th 226Ra
k 165 165 165 165 165 165 165
m kg 0000 5 0000 5 0000 5 0000 5 0000 5 0000 5 0000 5
ε 086 031 026 026 035 035 025
R 086 073 094 094 068 068 061
n0 52 16 4 4 6 6 28
Tg s 36 000 98 899 343 024 343 024 277 345 277 345 124 984
t0 s 35 542 548 190 512 901 512 901 559 286 559 286 446 755
a Bqmiddotkg-1 13 036 009 009 012 012 068
a1 Bqmiddotkg-1 38 11 028 028 036 036 205
u2(0) Bq2middotkg-2 29 015 0008 4 0008 4 0006 5 0004 7 078
u2(a1) Bq2middotkg-2 23 041 0059 0025 0028 0052 204
a Bqmiddotkg-1 24 12 052 019 018 019 43
46
APPENDIX VIII VALIDATION TEST RESULTS OF THE PROCEDURE
TABLE VIII 1 VALIDATION RESULTS FOR RELEVANT RADIONUCLIDES
Parameters 210Po 210Pb 234U 238U 230Th 226Ra
C Bq kg-1 680 680 120 120 211 780
X Bq kg-1 653 659 127 123 221 793
u(C) Bq kg-1 58 58 9 11 9 62
u(X ) Bq kg-1 23 22 5 5 10 35
δ() -40 -31 58 25 47 17
rL Bq kg-1 106 102 48 47 62 498
RL Bq kg-1 237 454 59 53 89 707
PI() 92 92 85 100 62 91
TABLE VIII 2 ANALYSIS OF VARIANCE (ANOVA) FOR 210Po 210Pb 238U 230Th AND 226Ra IN PHOSPHOGYPSUM
Nuclide SSwb SSbb MSwb MSbb Swb
(as CV)
Sbb
(as CV)
210Po 124 62 151 79 312 1687 271 254
210Pb 8385 197 54 210 2195 220 302
238U 314 386 785 429 227 215
230Th 2176 1598 544 178 334 225
226Ra 412 686 137 858 121 054
SSwb sum of squares within bottles
SSbb sum of squares between bottles
MSwb mean of squares within bottles
MSbb mean of squares between bottles
Swb standard deviation as percent of covalent variance within bottles
Sbb standard deviation as percent of covalent variance between bottles
47
550
600
650
700
750
0 10 20 30 40 50
Samples
Act
ivity
of
21
0 Pb
in th
e sa
mp
le (
Bq
kg
dry
)
Mean1σ
-2σ
-1σ
3σ
2σ
-3σ
FIG VIII 1 210Pb results with associated uncertainties
550
600
650
700
750
0 10 20 30 40 50Samples
Act
ivity
of
21
0 Po
in t
he s
ampl
e (B
qkg
dry
)
Mean
1σ
-1σ
3σ
2σ
-3σ-2σ
FIG VIII 2 210Po results with associated uncertainties
48
110
115
120
125
130
135
140
0 10 20 30 40 50
Samples
Act
ivity
of
238
U in
the
sam
ple
(B
qkg
dry
)
Mean
1σ
-1σ
3σ
2σ
-3σ
-2σ
FIG VIII 3 238U results with associated uncertainties
105
110
115
120
125
130
135
140
145
150
0 10 20 30 40 50
Samples
Act
ivity
of
23
4 U in
the
sa
mpl
e (B
qkg
dry
)
Mean1σ
-2σ-1σ
3σ2σ
-3σ
FIG VIII 4 234U results with associated uncertainties
49
190
200
210
220
230
240
250
0 5 10 15 20 25 30 35 40 45 50
Samples
Act
ivity
of
23
0 Th
in th
e s
am
ple
(B
qk
g d
ry)
2σ
3σ
1σ
-1σ
-2σ
-3σ
Mean
FIG VIII 5 230 Th results with associated uncertainties
05
10
15
20
25
30
35
40
0 10 20 30 40 50
Samples
Act
ivity
of
23
2 Th
in th
e sa
mp
le (
Bq
kg
dry
)
Mean
1σ
-2σ
-1σ
3σ
2σ
-3σ
FIG VIII 6 232 Th results with associated uncertainties
50
650
700
750
800
850
900
1 2 3 4 5 6 7 8 9 10 11 12 13 14 15 16 17 18 19 20
Sample
Act
ivity
of
226 R
a in
th
e sa
mp
le (
Bq
kg
dry
)
Mean
1σ
-1σ
3σ
2σ
-3σ
-2σ
FIG VIII 7 226Ra results with associated uncertainties
51
CONTRIBUTORS TO DRAFTING AND REVIEW
Hampe D Gaigl FA
Verein fuumlr Kernverfahrenstechnik und Analytik Rossendorf eV Dresden Germany IAEA Environment Laboratories Terrestrial Environment Laboratory Seibersdorf Austria
Kim C-K IAEA Environment Laboratories Terrestrial Environment Laboratory Seibersdorf Austria
Kis-Benedek Gy IAEA Environment Laboratories Terrestrial Environment Laboratory Seibersdorf Austria
Martin P IAEA Environment Laboratories Terrestrial Environment Laboratory Seibersdorf Austria
Mietelski J W The Henryk Niewodniczanski Institute of Nuclear Physics Polish Academy of Sciences Poland
Sansone U IAEA Environment Laboratories Terrestrial Environment Laboratory Seibersdorf Austria
Varga B Central Agricultural Office Food and Feed Safety Directorate Hungary
3
5 TERMS AND DEFINITIONS SYMBOLS AND ABBREVIATIONS
In the following u(x) indicates the uncertainty in quantity x and generally the relevant isotope is indicated as subscript
a Decision threshold [Bqkg-1]
a Detection limit [Bqkg-1]
a0 Activity of the analyte on the sampling date [Bqkg-1]
astd Activity of the calibration standard [Bq g-1]
as Activity of the analyte on the separation date [Bqkg-1]
AT Activity of 225Ra tracer [Bq]
C Certified activity of the analyte in the reference material [Bqkg-1]
CPb-c Mass fraction of Pb carrier solution
CPb-s Mass fraction of Pb already present in the sample
CT Certified activity of tracer on the reference date [Bqg-1]
fAB Tailing factor correction of interfered windows A and B
fg Mass ratio of atomic mass of Pb to molar mass of PbC2O4
fT Correction factor for the decay of the tracer during elapsed time between the reference date of tracer and the beginning of the measurement
f2 Correction factor for decay of the analyte during elapsed time between the separation and the beginning of the measurement
f3 Correction factor for decay of the analyte over the counting time
mC Mass of the carrier taken (in case of lead mass of carrier solution) [g]
mf Mass of the filter used [g]
mfcal Mass of the filter used in calibration [g]
mof Total mass of PbC2O4 and the filter used [g]
mofcal Total mass of PbC2O4 and the filter used in the calibration [g]
ms Mass of the sample [kg]
mT Mass of the tracer taken [g]
mTPb Mass of the 210Pb standard solution added [g]
MPb Atomic mass of Pb [gmiddotmol-1]
MPb-oxalat Molar mass of PbC2O4 [gmiddotmol-1]
n Net counts in ROI of analyte [counts]
nT Net counts in ROI of tracer [counts]
n0 Blank or background counts in ROI of analyte [counts]
n0T Blank or background counts in ROI of tracer [counts]
Pα Probability of α decay
Pγ Probability of γ decay
4
r0 Blank or background count rate in ROI of analyte [countss-1]
r0T Blank or background count rates in ROI of tracer [countss-1]
rcal Count rates during the calibration [countss-1]
rn Net count rates in ROI of analyte [countss-1]
rnT Net count rates in ROI of tracer [countss-1]
rg Gross count rates in ROI of analyte [countss-1]
rgT Gross count rates in ROI of tracer [countss-1]
rnTmax Maximum detectable count rate [countss-1]
r0A r0B Count rates in windows A and B of the blank spectrum [countss-1]
rgA rgB and u(rgA) u(rgB) Gross count rates in windows A and B of 210Pb spectrum [countss-1]
rnA rnB Net count rates in windows A and B of 210Pb spectrum [countss-1]
R Chemical recovery of the analyte
Rcal Chemical recovery of making the calibration source
RL Reproducibility limit [Bqkg-1]
rL Repeatability limit [Bqkg-1]
SR Standard deviation of reproducibility [Bqkg-1]
Sr Standard deviation of repeatability [Bqkg-1]
t Time interval between the sampling date and the measurement date [s]
t0 Counting time of the blank or background [s]
tTs Time interval between the reference date of the tracer standard and the separation date [s]
t1 Time interval between the sampling date and the separation date [s]
t2 Time interval between the separation date and the start of the measurement [s]
t3 Counting time of the sample [s]
tT Counting time of the tracer [s]
tAc-225 Time of build up of 225Ac [s]
ts Time of the separation noted [s]
tm Time of the starting of the measurement [s]
tem Time of the end of the measurement [s]
u(0) Uncertainty of non-negative measurand
X mean value of measurement results of the analyte in reference material [Bqkg-1]
δ Relative bias of the test result []
ε Counting efficiency of the detector
λ Decay constant of the isotope [countss-1]
λT Decay constant of the tracer [countss-1]
FWHM Full width at half maximum
5
LSC Liquid scintillation counting (spectrometry)
NNDC National Nuclear Data Center Brookhaven National Laboratory
ROI Region of interest
PSA Pulse shape analysis
T12 Half-life of any isotope
6 PRINCIPLE
The sample is digested in a microwave digestion system Polonium-210 210Pb U and Th isotopes and 226Ra are separated from interfering elements with a sequential chemical procedure using extraction chromatographic resins and Ba(Pb)SO4 co-precipitation The flow chart of the combined procedure is given in Appendix II The most important features of the resins are shown in Appendix III (Sr resin TEVA and UTEVA see Figs III 1ndashIII 7) U and Th are electrodeposited on a polished stainless steel plate The polonium source is prepared on a silver plate by auto-deposition The 226Ra source is prepared by Ba(Ra)SO4 microco-precipitation The 210Pb source is prepared with Pb-oxalate precipitation Polonium-210 U Th isotopes and 226Ra are determined by isotope dilution alpha-spectrometry and 210Pb is determined by liquid scintillation spectrometry
7 CHEMICAL REAGENTS AND EQUIPMENT
71Tracers
The two tracers commonly used for 210Po determination are 208Po and 209Po Polonium-209 has a clear advantage over 208Po in energy separation from the 210Po peak and is the preferred tracer if available It should also be noted that 208Po solutions normally contain traces of 209Po A typical alpha spectrum of 209Po and 210Po is shown in Fig IV 1 of Appendix IV
Naturally occurring thorium can be determined by the following tracers 228Th and 229Th Both of them have short lived daughters which emit alpha-particles but as the energies of all their daughters are higher than 568 MeV thus no spectral interference occurs from ingrowth of daughters either 228Th or 229Th The 228Th daughter of 232U can be used as a tracer for the determination of 230Th and 232Th In this case the natural 228Th content in phosphogypsum should be measured or estimated separately to allow for this [4] An alpha spectrum of Th isotopes and its progeny is depicted in Fig IV 2 of Appendix IV
Naturally occurring uranium can be determined by the following tracers 232U 233U or 236U Among them 232U (containing 228Th daughter in known ratio close to 1) is applied most frequently The amount of 232U tracer to be added to the sample should be carefully calculated because this is the highest-energy uranium peak in the uranium spectrum and hence its tailing might affects other peaks in low energy region if the added concentration is too high A typical alpha spectrum of uranium isotopes is shown in Fig IV 3 of Appendix IV
In the case of 226Ra analysis several tracers such as 133Ba 223Ra 224Ra 225Ra might be applied Barium-133 is a most commonly used tracer for the determination of 226Ra (can be measured by gamma-spectrometry) A disadvantage of this tracer is that although its chemical behavior is very similar to that of Ra their chemical behavior is not identical as they are different elements Alternative is 225Ra (daughter of 229Th) which does not exist in nature and its decay does not produce radon which might escape from the source Radium-225 is both a beta and
6
gamma emitter with a gamma line at 4009 keV (Pγ 0300) which is well measurable with an n-type HPGe detector with carbon-epoxi or Be window Alternatively its descendants 225Ac 221Fr 217At are alpha-emitters and the determination of chemical recovery is possible via 217At at 7066 7 MeV (Pα 0999 32) using ingrowth decay equations [4] (Fig IV 4 of Appendix IV)
72Carrier
If there is no suitable radioactive tracer available the chemical recovery can be checked by using an inactive carrier namely a stable isotope of the same element as the radioactive analyte In the present case 30 mg Pb2+ carrier is used as Pb(NO3)2 solution for checking the chemical recovery of 210Pb determination gravimetrically
73Equipments
bull Standard laboratory equipment well exhausted fume-hood bull Microwave oven bull Alpha spectrometer with Si semiconductor detector bull Vacuum pump bull Liquid scintillation spectrometer bull Auto-deposition system bull Silver disk fitted to the auto-deposition cell diameter is equal or less than the
diameter of the detector used for alpha spectrometry bull Electrodeposition apparatus (Pt wire anode) equipped with DC power supply to
provide up to 1 A of regulated current to the electrolytic cell bull Stainless steel disc diameter is equal or less than the diameter of the detector used for
alpha spectrometry bull Analytical balances with accuracies of 01 mg and 001 g bull Hot plate with magnetic stirrer bull Burner bull Centrifuge plastic centrifuge tube (minimum 20 mL volume) bull Water bath with temperature controller bull Filtering set with filter paper for fine precipitate bull Chromatography columns with stopper control valve and funnel (250 mL) and holder
for them bull pH meter or pH papers bull Teflon beakers with Teflon tops and clips bull Dispensers 5-50 mL and 10-100 mL bull Micropipettes with dispensable tips (100-5000 microL) bull Timer bull Liquid scintillation vial 20 mL plastic (polyethylene) inner surface coated with
Teflon
74Chemical reagents
bull 30 mgmL-1 Pb2+ solution (usually as Pb(NO3)2) bull 04 Bq of 209Po tracer as a certified solution bull 004 Bq of 232U tracer as a certified solution bull 005 Bq of 225Ra in equilibrium with its parent 229Th as a certified solution bull HNO3 (65) (nitric acid)
7
bull HF (40) (hydrogen fluoride) bull H3BO3 (boric acid) bull HCl (32) (hydrochloric acid) bull Ultra pure water bull DTPA (diethylenetriaminepentaacetic acid) bull Sr resin (100-150 microm) bull TEVA resin bull UTEVA resin bull Cation exchange resin (AG-50W-X8 or Dowex-50) bull Fine clean quartz crystals (analytical grade) bull C6H8O6 (Ascorbic acid) bull NH4SCN (ammonium thiocyanate) bull EDTA (ethylenediaminetetraacetic acid) bull NH3(aq) (ammonia) bull (NH4)2SO4 (10) (ammonium sulfate) bull C2O4H2middot2H2O (oxalic acid) bull Methyl red solution (025) bull Thymol blue solution (025) bull Ba seeding solution [6] Weigh between 0012 and 0016 g of BaCl2 2H2O into a tall
150 mL quartz beaker Add approximately 04 mL of ultra pure water to completely dissolve the BaCl2 2H2O In a fume hood add 10 mL of the 70 sodium hydrogen sulfate solution and 2 drops of 72 HClO4 Evaporate the solution on a hot plate or a burner at high heat with continuous swirling until most of the excess sulfuric acid has been expelled and a pyrosulfate fusion is obtained Cool the beaker while rolling the melt around the sides so that the cake is deposited on the sides as uniformly as possible to facilitate rapid dissolution Cool the beaker and contents to room temperature in a desiccating chamber Add a solution of 50 mL 20 Na2SO4 to the beaker Swirl continuously until the cake is completely dissolved (place it in an ultrasonic bath for 10 minutes before each use if a build up of particulate matter occurs then make a fresh solution)
bull Sodium sulfate wash solution dissolve 100 g of anhydrous Na2SO4 in 2 L of 05 H2SO4 Filter through a 045 microm pore size membrane filter
bull CH3CH2OH (ethyl alcohol) bull Filter paper (for example Whatman 41) bull Polypropylene filter (for example Pall 01 microm pore size 25 mm diameter) bull Scintillation cocktail which forms a gel (for example InstaGel Plus) or suitable for
alphabeta separation All the chemical reagents needed to carry out this procedure must be analytical grade
8 PRECAUTIONS
Do not ash the sample if 210Po determination is required gently drying is allowed but not higher than 80oC
During the handling of the ion exchange chromatography columns always keep several mm of liquid above the surface of resin do not allow it to become dry during the separation steps
Labeling of the different fraction is essential to avoiding mixing solutions this includes the different load solutions and chemicals
8
The complete separation of Po from U is important because 210Po (Eα 5263 MeV) can interfere with the alpha peak of 232U (Eα 5320 MeV) and its activity is much higher than of U in phosphogypsum In addition 209Po (Eα 4866 MeV) can interfere with the alpha peak of 234U (Eα 4766 MeV) These are shown in Fig IV 5 of Appendix IV
The complete separation of Th from U is also important because several peaks in the spectra overlap as it is shown on Fig IV 6 of Appendix IV
Applying 225Ra as a yield tracer for the determination of 226Ra the radiochemical procedure needs to include steps to guarantee the complete separation of the parentprogeny couples 229 Th225Ra and 225Ra225Ac
9 PROCEDURE
This procedure consists of the sample dissolution the sequential separation of 210Po 210Pb Th and U isotopes and 226Ra from interfering elements and the source preparation for alpha spectrometry and liquid scintillation spectrometry (see the flowchart in Appendix II)
91Sample dissolution using microwave digestion system
(a) Weigh 05 g of phosphogypsum into a microwave container
(b) Add about 30 mg of Pb2+ (usually as Pb(NO3)2 solution) about 04 Bq of 209Po and 004 Bq of 232U tracer and 005 Bq of 225Ra in equilibrium with its parent 229Th
(c) Add 15 mL 65 HNO3
(d) Consecutively digest the sample in the microwave oven at 120degC for 15 min and at 150degC for 25 min at 1000 W
(e) Transfer the sample solution into a plastic centrifuge tube and centrifuged for 10 min
(f) Transfer the supernatant into a Teflon beaker The residue is transferred back into the microwave container with 3 mL of 65 HNO3 and add 2 mL of 40 HF
(g) Digest the residue in the microwave oven using the same condition as mentioned above
(h) Combine the solution with the supernatant from step (f)
(i) Add 01 g H3BO3 and evaporate repeatedly to dryness with three portions of 5 mL of 65 HNO3 to remove HF
(j) Dissolve the residue in 30 mL of 2M HCl
92Chemical separation procedures
921 Polonium and lead separation
(a) Prepare the Sr resin column with volume of approximately 8 mL (diameter 10 mm length 100 mm) as follows soak the resin in ultra pure water for at least 1 hour before use then fill the column with resin and put a quartz crystal layer of approximately 10 mm on the top avoiding disturbance of the resin The elution steps should be finished on the same working day
(b) Load the sample solution onto the Sr resin column preconditioned in advance with
9
100 mL 2M HCl flow rate 5-6 dropmin rinse the baker several times with 1 mL of 2M HCl
(c) Wash the column with 100 mL of 2M HCl followed by 25 mL 6M HNO3 to remove the non-retained ions
(d) Combine the effluent and the washing solution into same beaker and use it for the analysis of uranium and thorium
(e) Strip Po with 60 mL 6M HNO3 flow rate 5-10 dropsmin
(f) Elute Pb with 60 mL 6M HCl into the centrifuge tube flow rate 5-10 dropsmin
(g) Sr resin columns can be reused several times Regenerate with 50 mL ultra pure water wash it with 10 mL 01M EDTA (pH adjusted to pH7 with NH3(aq)) then wash with 50 mL ultra pure water and before use load it with 100 mL 2M HCl
922 Thorium separation
(a) Prepare the TEVA column with a volume of 14 mL (diameter 8 mm length 28 mm) as follows soak the resin in ultra pure water for at least 1 hour before use then fill the column with resin and put a quartz crystal layer of approximately 3 mm on the top avoiding disturbance of the resin
(b) Evaporate the combined effluent and washing solutions from Sr resin column (921 step (d))
(c) Dissolve the residue in 20 mL 3M HNO3
(d) Load the sample on the TEVA column preconditioned in advance with 20 mL 3M HNO3
(e) Wash the column with 10 mL 3M HNO3
(f) Combine the effluent and the washing solution into the same baker and use it for analysis of uranium
(g) Additionally wash the column with 20 mL 3M HNO3 this fraction is discarded
(h) Elute Th with 20 mL 8M HCl
(i) Note the time of the separation of Th for recovery calculation of 226Ra
923 Uranium separation
(a) Prepare the UTEVA column with volume 14 mL (diameter 8 mm length 28 mm) as follows soak the resin in ultra pure water for at least 1 hour before use then fill the column with the resin and put a quartz crystal layer of approximately 3 mm on the top avoiding the disturbance of the resin
(b) Load the combined effluent and the washing solution from the TEVA column (922 step (f)) onto UTEVA column preconditioned in advance with 20 mL of 3M HNO3
(c) Wash the column with 20 mL 3M HNO3
(d) Combine the effluent and the washing solution into the same beaker and use it for Ra analysis
(e) Wash the column with 5 mL 9M HCl and 15 mL 6M HCl to remove small amounts of Po and Th remained on the column
10
(f) Elute U with 6 mL ultra pure water
924 Radium separation [6]
(a) Combine the effluent (20 mL 3M HNO3) and the washing solution (30 mL 3M HNO3) from the UTEVA column in a 200 mL volume of beaker (923 step (b) and (c))
(b) Add 4 mL concentrated H2SO4 and 20 mL 20 Na2SO4 to the solution
(c) Slowly add 5 mL Pb2+ carrier (10 mgmL-1) to form a Pb(RaBa)SO4 co-precipitate while stirring for 1ndash2 minutes
(d) Remove stirrer bars washing with a small amount of 01M HCl and ultra pure water
(e) Allow to sit for 3ndash4 hours
(f) Decant supernatant liquor to a volume as low as possible
(g) Transfer the precipitate into a 50 mL conical centrifuge tube using 80 ethanol and centrifuge at 3000 revolutionsmin for 10 minutes
(h) Wash the precipitate with 20 mL 80 ethanol and decant the supernatant
(i) Wash the sides of the centrifuge tube with 5ndash10 mL sodium sulfate wash solution and vortex to mix thoroughly then add a further 5ndash10 mL to wash down the walls and then re-centrifuge at 3000 revmin for 10 minutes
(j) Pour out supernatant then invert the tube and wash the walls with ultra pure water to remove excess acid and sulfate (take care not to disturb the precipitate)
(k) Add 10 mL 02M DTPA (diethylenetriaminepentaacetic acid) and 1 drop of 025 thymol blue The solution should turn deep blue if not add 10M NaOH dropwise until a deep blue color is reached (pHgt9)
(l) Vortex to dissolve the precipitate
93Source preparation
931 Polonium-210 source
(a) The Po solution is carefully evaporated to dryness at less than 150degC
(b) Dissolve the residue in 10 mL 05M HCl
(c) Clean a silver disc with acetone followed by cc NH3(aq) followed by ultra pure water
(d) Place the cleaned silver disc into the deposition cell (Teflon vial) with another disc placed underneath for support Check if the cell is watertight
(e) Add 005 g ascorbic acid into the sample solution to reduce Fe3+ to Fe2+ check the colour change after mixing one drop of sample solution and one drop of 01M NH4SCN Add ascorbic acid until the dark red colour disappears
(f) Transfer the solution to the deposition cell
(g) Rinse the beaker with 2 x 2 mL 05M HCl and adjust the pH of the solution in the deposition cell to pH2 with 6M NaOH
(h) Place the deposition cell into a water bath at 90oC for 90 min with mechanical stirring or air bubbling
11
(i) Remove the silver disc wash with acetone or ultra pure water and dry it at room temperature
932 Uranium and thorium sources
(a) The purified U or Th solution is evaporated to dryness three times with a few mL 65 HNO3 to destroy any existing organic matter
(b) Dissolve the residues in 10 mL 10 (NH4)2SO4 solution at pH2 (The pH of samples being deposited for thorium should be slightly more acidic pH15-pH2)
(c) Transfer the solution into an electrodeposition cell
(d) Electrodeposit U or Th onto polished stainless steel discs at 1 A for 90 minutes respectively
(e) At the end of the deposition time fill the cell with 15M NH4OH and continue deposition for 1 min then turn off the main power of deposition unit and disconnect the cathode
(f) Rinse the cell twice with 1 NH4OH then three times with ultra pure water
(g) Disassemble the cell rinse the disc with ultra pure water and dry it
933 Radium source (BaSO4 micro co-precipitation)
(a) Rapidly add 4 mL mixed solution of 5 parts of 20 Na2SO4 with 1 part of acetic acid to the solution from the step 924 (l)
(b) Add 04 ml Ba seeding solution as soon as possible (2ndash3 s)
(c) Adjust pH to 48 with diluted H2SO4 as indicated by the colour change to a bright red
(d) Allow to sit for at least 30 minutes
(e) Filter the colloidal suspension of Ba(Ra)SO4 through a pre-wetted (by 80 ethanol) polypropylene filter (for example 01 microm pore size 25 mm diameter Pall)
(f) Rinse the centrifuge tube walls with 4ndash5 mL sodium sulfate wash solution and filter
(g) Rinse the sides of the filter holder with 15ndash20 drops 80 ethanol
(h) Allow the filter to dry and place it into a 47 mm Petri dish The time is recorded which is considered as the time of 225Ra225Ac separation or start of 225Ac ingrowth
The source preparation must be completed on the same day
934 Lead-210 source
(a) Evaporate the Pb solution which obtained from the step of 921(f) and re-evaporate with three portion of 5 mL 65 HNO3
(b) Dissolve the residue in 10 mL 1M HNO3
(c) Add 40 mg oxalic acid to the solution and adjust pH2ndash3 with 25 NH4OH to prepare a Pb-oxalate precipitate
12
(d) Let the solution to cool down and filtrate the precipitate on a filter paper (for example Whatman 41 dried in a drying oven and weighed in advance) wash the filter 3 times with 1 mL water and 2 mL 80 ethanol
(e) Dry the precipitate (40ndash50oC) and cool down in a desiccator
(f) Weigh the dried precipitate and calculate the chemical recovery using the gravimetric method
(g) Quantitatively transfer the precipitate into a liquid scintillation vial together with the filter and add 1 mL of 6M HNO3 into the vial to dissolve the precipitate
(h) Mix the solution with 15 mL of scintillation cocktail
94Measurement
941 Alpha-spectrometry
(a) Introduce the source into the vacuum chamber and pump until a vacuum of about 05 Pa (5 x 10⁻³ mbar) is obtained Then switch on the bias voltage button of detector
(b) Record the file name sample information (unit code sample name sample volume as it is required by the actual quality management system) and measurement date in each detector log book and start the measurement A typical measuring time is about 1 day when using a 450 mm2 area detector
(c) Integrate the counts in the peaks corresponding to the alpha emitting tracers and analytes respectively The alpha spectra should be similar to the spectra illustrated in Fig IV 4 of Appendix IV The FWHM of alpha peaks should be in the range of 30ndash60 keV
(d) Spectrum analysis Integrate the channel counts in a region of interest (ROI) which has the width of about 4 x FWHM (about 3 x FWHM to the left and 1 x FWHM to the right when FWHM is about 30ndash60 keV) Integrate the channel counts in the same regions of interest (ROI) in the sample spectrum and in the blank spectrum then subtract them from the sample spectrum to give the net area of peaks for further calculation
Performing a reliable measurement knowing the background of the chamber and detector is essential moreover it is important to prepare a separate reagent blank Therefore the set of measurement always has to involve above the samples a background and a reagent blank If the quality of the determination has to be proved a reference material also should be part of the preparation series
942 Liquid scintillation spectrometry for determination of 210Pb
9421Source preparation for determination of counting efficiency of 210Pb
(a) Take 10 mL 2M HCl solution into a 50 mL beaker
(b) Add the 210Pb standard solution (10ndash15 Bq) and 30 mg Pb2+ carrier to the solution
(c) Load the solution onto a Sr resin column (3 g of Sr resin 100-150 microm) which has been preconditioned in advance with 100 mL 2M HCl
(d) Wash the column with 80 mL 2M HCl Combine the washing solution with the effluent to get a pure 210Bi fraction
13
(e) Rinse the column with 20 mL 2M HCl This last portion of 20 mL 2M HCl is discarded to avoid overlapping between the 210Bi and 210Po portions
(f) Wash the column with 25 mL 6M HNO3
(g) Elute Po with 60 mL 6M HNO3
(h) Elute Pb with 60 mL 6M HCl
(i) Evaporate the Bi Po and Pb fractions to dryness
(j) Dissolve each portion of 210Bi and 210Po in 1 mL 6M HNO3 and then transfer them into 20 mL polyethylene vials coated with PTFE (polytetrafluoroethylene)
(k) Mix the solution with 14 mL scintillation cocktail
(l) Evaporate Pb fraction three times with 2 mL 65 HNO3
(m) Dissolve the residue in 20 mL 1M HNO3
(n) Add 04 g oxalic acid while warming and stirring
(o) Adjust the pH to 3ndash5 with NH4OH to form a Pb-oxalate precipitate
(p) Filter the precipitate through a pre-weighed filter paper (diameter of 24 mm)
(q) Wash the precipitate three times with 1 mL water followed by 2 mL 80 ethanol
(r) Dry the precipitate in an oven at 40ndash50oC
(s) Cool and weigh the precipitate to determine the chemical recovery of lead
(t) Carefully transfer the Pb-oxalate precipitate into a 20 mL of liquid scintillation vial together with the filter
(u) Add 1 mL 6M HNO3 to the vial to dissolve the precipitate
(v) Mix with 14 mL of scintillation cocktail
(w) Set up windows for 210Pb and 210Bi and count the three vials (for 210Pb 210Bi and 210Po) in a liquid scintillation counter until the counting statistic uncertainty is less than 1
9422Optimum window setting for 210Pb
The activity concentration of 210Pb is determined by LSC adjusted to the low energy mode and low bias with double energetic window method [7] For the successful determination of this radionuclide two counting windows should be optimized because of the overlapping of the beta spectra of 210Pb and 210Bi The result of the optimization of counting region is shown in the Fig V 1 of Appendix V In this example the lower limit for the 210Pb energy (window A) is set at channel 115 to avoid the counts caused by chemiluminescence in the cocktail while the upper limit is set at channel 320 where the 210Pb peak ends The lower limit for the 210Bi energy region (window B) is set at channel 320 and the upper limit is set at channel 410 to avoid interference from the 210Po peak
9423 Counting efficiency of 210Pb
The efficiency of liquid scintillation for beta particles depends on the energy of the beta decay For most beta particles with a maximum beta-energy above 100 keV efficiency is high more than 90 For lower energy beta particles the efficiency is usually less and the real value depends on the degree of quenching in the sample
14
To determine the efficiency a known activity of 210Pb in equilibrium with its daughters has to be measured several times (it is practical to choose more than 10 times of counting for getting a good estimate of the uncertainty in the efficiency)
10 EXPRESSION OF RESULTS
101 Calculation of activities of relevant isotopes
1011 Calculation of the activity of 210Pb
10111 Calculation of the counting efficiency of 210Pb
The counting efficiency (ε) of 210Pb can be calculated by Eqs (1 2)
TsPb tPbTPbstdcal emaR
Z210
210210minusminus
minusminus
= λε ( 1 )
BAnBnA frrZ minus= ( 2 )
where
BBgBnAAgAn rrrrrr 00 minus=minus=
fAB Tailing factor (See Ch 10112)
Rcal Chemical recovery of making the calibration source (See Ch 10113)
10112 Calculation of the tailing factor
The 210Pb energy region (window A) is interfered with counts from ingrown 210Bi The interference is compensated for by using the ratio of counts in window A to those in window B in a pure 210Bi spectrum the so-called ldquotailing factorrdquo fAB The tailing factor is independent of the activity level of 210Bi in the sample but is dependent on the quenching level of the sample The quenching levels of the calibrant the sample and the reagent blank are necessary to keep constant within plusmn2 relative standard deviation The tailing factor can be calculated by the following formula
210
210
minus
minus=BistdBn
BistdAnBA r
rf (3)
where BBistdBgBistdBnABistdAgBistdAn rrrrrr 02102100210210 minus=minus= minusminusminusminus
10113 Chemical recoveries of Pb in calibration source and sample
The chemical recovery of lead in the calibration source preparation process is determined gravimetrically using Eq (4)
15
ccPb
calfcalofgcal mC
mmfR
minus
minus=
)( ( 4 )
When the amount of Pb in the sample is not negligible compared with that in the Pb carrier the sample Pb content should be allowed for in calculation of the chemical recovery of Pb The chemical recovery of Pb in the sample can be calculated by Eqs (5 6)
)(
)(
ssPbccPb
fofg
mCmC
mmfR
minusminus +minus
= ( 5 )
Mass ratio (fg) of atomic mass of Pb to molar mass of Pb-oxalate
oxalatePb
Pbg M
Mf
minus
= (6 )
10114 Calculation of the activity of 210Pb
The activity of 210Pb on the separation date can be calculated from the LSC measurement using the following equations
Rm
ffZa
s
PbPbsPb ε
minusminusminus = 32
210 (7)
22102
tPb
Pbef minusminusminus = λ ( 8 )
321013210
3 tPb
PbPbe
tf
minusminus= minus
minus λλ
(9 )
However if the time interval (t2) between the separation of 210Pb and the beginning of the measurement and the counting time of the sample (t3) are much smaller than the half life of 210Pb (222 y) f2-Pb f3-Pb u(f2-Pb) and u(f3-Pb) are negligible
1012 Calculation of the activity of 210Po
The activity of 210Po on the separation date is calculated according to the procedure detailed in IAEAAQ12 [8]
1013 Calculation of the activities of the U and Th isotopes
The ratio of the net counts of the tracer and analyte peak is used to calculate the activity of the analyte in the sample on the date of chemical separation taking into account the activity of the tracer solution the masses of the sample and the tracer used The activity of the analyte (as Bq(kg dry)-1) at the separation time is calculated by the following formula
16
TgT
g
s
TTTTT
nTs
nTs rr
rr
m
fmCfm
rm
rCa
0
0
minusminus
== (16)
The decay of the tracer between its reference date (from the certificate) and counting is taken into correction by fT as follows
sTT t
T ef λminus= (17)
The activity of analyte in the sample should be calculated back to the date of sample collection
teaa
λminus=0 (18)
The detector efficiency is not needed in isotope dilution alpha spectrometry for calculation of the activity of the analyte but is needed for calculation of the chemical recovery It is determined from the activity of the tracer added and the net counts in the corresponding peak as follows
sTT t
TT
nT emC
rR λ
εminus= (19)
The detector efficiency is determined by the calibration source prepared in a similar way as the analytes and using the same measurement conditions For analytes which are co-precipitated the calibration source also should be co-precipitated using the same conditions including filter diameter For analytes which are electrodeposited the calibration source should also be prepared by electrodeposition Efficiency determinations are typically performed and regularly checked in the frame of analytical quality control The efficiency can be calculated according to the following equation
cal
caln
A
r =ε (20)
Where
Rn cal net count rate of calibration source in respective ROI
Acal certified activity of the calibration source
1014 Calculation of the activity of 226Ra [9]
10141 Calculation of the chemical recovery of Ra
The chemical recovery is determined by using the peak of 217At at 70669 keV (Pα 0999 32) The ingrowth of 225Ac (T12 100 d) the daughter of 225Ra is directly associated with the short lived progenies 221Fr (T12 48 min) 217At (T12 323 ms) and 213Po (T12 37 micros) When the daughters are in equilibrium with 225Ra the 217At peak shows no overlap with descendants of natural isotopes of radium in the alpha spectrum (225Ac interferes with 224Ra 221Fr interferes with 220Rn) From the initial tracer activity AT (added 229Th225Ra) the maximum detectable count rate rnTmax is calculated by taking into account the decay of unsupported 225Ra after its separation from Th (tsTh-229) as well as the build-up of 225Ac (tsRa-225) in the following equation
17
225225
225)(max
229225225
minusminus
minusminusminus
minus= minusminusminus
RaAc
ActtTnT
sThsRaRaeArλλ
λε λ (21)
The chemical recovery R is calculated as ratio of the measured count rate rnT and theoretical value rnTmax
maxnT
nT
r
rR = (22)
10142 Calculation of activity of 226Ra
While AT is the activity of the 225Ra tracer after the separation from 229Th its activity at the beginning of the build-up of 225Ac is yielded as follows
)(225
225225 sAcRa ttTRa eAA minusminus
minusminusminus= λ
( 2 4 )
The activity of 225Ac in any time is given by
( )225225
)()(225225
225
225225225225
minusminus
minusminusminusminusminusminus
minus minusminus=
minusminusminusminus
RaAc
ttttRaAc
Ac
AcAcAcRa eeAA
λλλ λλ
(25)
Integrating over the counting period with tm as the start and tem as the end of the measurement results into the activity of 225Ac at tem
( )( )( ) ( )( )
minusminusminus
= minusminusminusminus minusminusminusminus
minusminusminus
minusminusminus
225225225225
225225225
225225225
1)( AcemRaAcmRa tttt
RamemRaAc
AcRaemmAc ee
ttAttA λλ
λλλλ
( ) ( )( )
minusminus minusminusminusminus minusminusminusminus
minus
225225225225
225
1AcemAcAcmAc tttt
Ac
ee λλ
λ (26)
Finally the activity concentration of 226Ra is the following
217
226225226 )(
minus
minusminusminus =
At
RaemmAcRa r
rttAA (27)
where
0
0226226226 t
n
tt
nr Ra
mem
RaRa
minusminusminus minus
minus= and
0
0217217217 t
n
tt
nr At
mem
AtAt
minusminusminus minus
minus=
102 Expression of combined uncertainties of relevant isotopes
According to the Guide to Expression of Uncertainty in Measurement [11 12] the combined uncertainty is described in detail and an example is calculated for each relevant radionuclide in Appendix VI
18
103 Decision threshold
In accordance with ISO 119292010 the decision threshold gives a decision on whether or not the physical effect quantified by the measurand is present
The decision threshold a is the non-negative measurand quantifying the physical effect of interest If the result a is below the decision threshold the result can not be attributed to the physical effect nevertheless it can not be concluded that it is absent If the physical effect is really absent the probability of taking the wrong decision that the effect is present is equal to the specified probability of α (the error of first kind often chosen 005 and moreover α=β where β is the error of second kind then k1-α=k1-β=165) Any of the determined primary measurement result is only significant for the true value of the measurand to differ from zero if it is larger than the decision threshold given here
a=k1-αu(0) where u(0) is the uncertainty associated to the non-negative measurand uncertainty of decision threshold itself (with other words it can be estimated as uncertainty associated to slightly higher values than background or reagent blank depending on the procedure) and can be quantified here as
20
0
03
01)0(
t
n
tt
n
Rmu
s
+=ε
(28)
104 Detection limit
In accordance with ISO 119292010 the detection limit indicates the smallest true value of the measurand which can be still detected with the applied procedure this gives a decision on whether or not the measurement procedure satisfies the requirements and is therefore suitable for the intended measurement purpose In order to find out whether a procedure is suitable for the purpose the detection limit is compared with the specified guideline value of the measurand
The detection limit a is the smallest true value of the measurand for which the probability of the wrong assumption that the physical effect is absent does not exceed the probability β (error of the second kind) The detection limit is obtained as the smallest solution of the following equation
a=a+k1-β(a) where a ge a (29)
Eq (29) is an implicit equation which can be calculated by iteration As a starting approximation a1=3a can be chosen in most cases the iteration converges and the linear interpolation with approximation of a=(k1-α+k1-β)u(a) leads to the approximation
)0()( 221
21
2 ukkqqa αβ minusminus minus++= (30)
with [ ]
minus+= minusminus )0()(
2
1)0( 2
12
1
21
1 uaua
kukq a
β (31)
If α=β than k1-α=k1-β=k a=2q follows
19
[ ])0()()0(2 21
2
1
2 uau
a
kuka minus+= (32)
Where α is the probability of the error of first kind the probability of rejecting a hypothesis if it is true and β is the probability of the error of second kind the probability of accepting a hypothesis if it is false
The detection threshold and limit of the isotopes in the applied procedure are described in Table VII 1 of Appendix VII
The difference between using the decision threshold and using the detection limit is that the measured values are to be compared with the decision threshold whereas the detection limit is to be compared with the guideline value (guideline value corresponds to scientific legal or other requirements for which the measuring procedure intended to assess)
11 VALIDATION OF THE PROCEDURE
The procedure was validated with an IAEA reference material IAEA-434 The material was initially characterized at IAEA Environment Laboratories in Seibersdorf during the feasibility study phase Then the characterization of the material took place within the interlaboratory comparison piloted by IAEA Environment Laboratories in Seibersdorf in cooperation with the Consultative Committee on Ionization Radiation (CCRI) of the International Bureau des Poids et Mesure (PIBM) The results reported in this comparison were used to derive the property values of the measurands of interest The IAEA-434 reference material [12] was collected from a processing plant located in Gdansk (Poland) in 2003 The matrix composition is CaSO4middot2H2O (96) P2O5 (1-2) F total (12) SiO2 (1) Al2O3 (02) The property values of all radionuclides of IAEA 434 were established on the basis of a robust approach proposed by DL Duewer [13] and the Mixture Model median (MM-median) of the analytical results reported by the expert laboratories was calculated To estimate the standard uncertainty associated with the property value the MM-median based standard deviation was calculated from the span of the central 50 of the MM probability density function The validation results of the procedure are shown in Tables VIII 1 and VIII 2 Figs VIII 1ndashVIII 7 of Appendix VIII 111 Trueness of the method
The relative bias of the method is calculated by the following formula
100() timesminus=C
CXδ (34)
112 Precision of the method
The precision index ( PI() ) is calculated according to the following formulas
100)()(
()2
2
2
2
times+=X
Xu
C
CuPI (35)
20
113 Repeatability limit
The repeatability limit is estimated by analyzing five subsamples from the same bottle of the IAEA-434 reference material for the relevant radionuclides investigating the repeatability conditions instrument analyst shortest time etc The repeatability limit is calculated by the following formula
rL Sr 82= (36)
114 Reproducibility limit
The reproducibility limit is also estimated by analyzing the IAEA-434 reference material from ten duplicates samples were taken from ten randomly selected packing unit with at least one parameter being changed in the analytical system (analyst analysis date instrument etc) The reproducibility limit is calculated by the following formula
RL SR 82= (37)
115 Outlier test
The presence of individual values that appear to be inconsistent with all other laboratories or values may cause some problems during the final evaluation of data According to ISO 5725-2 an outlier test should be performed before the calculation of repeatability and reproducibility The analysis includes a systematic application of a statistical test of outliers a great variety are available which could be used for the purposes of this part of ISOIEC 17025 Usually the graphical consistency technique or the numerical outlier test are applied Cohranrsquos test of variabilities should be applied first and then any necessary action should be taken Grubbrsquos test is primarily a test of in between laboratory variability
116 Acceptance criteria
The method can be accepted if
PI()lt 25
LRltδ ( 3 8 )
According to these criteria the method performs well as the Table VIII 1 of Appendix VIII shows
12 TEST REPORT
The test report shall conform to ISOIEC 17025 requirements and shall contain the following information
bull a title (test report calibration report reference material production etc)
bull the name and address of the laboratory and location where any part of the test or calibration or production of reference material etc were carried out
bull unique identification of the report on each page with numbering of pages
21
bull analysis request code
bull reference to the measurement method used
bull sampling date (if available)
bull sample description
bull sample code or identification number
bull date of the separation of analyte
bull applied tracers with their reference dates and activity values with the code of their certificate
bull the results with units of measurement and associated uncertainty value expressed in the same unit as the result
bull date to which the test result has been corrected (corrected to the sampling date or separation time dd-mm-yyyy)
bull responsible person (with accessibility)
22
REFERENCES
[1] FEDERAL REGISTER National emission standards for hazardous air pollutants 57 107 (1992) 23305-23320
[2] RUTHERFORD PM DUDAS MJ AROCENA JM Heterogeneous distribution of radionuclides barium and strontium in phosphogypsum by-product Sci Total Environ 180 (1996) 201-209
[3] NATIONAL COUNCIL ON RADIATION PROTECTION AND MEASUREMENTS Evaluation of Occupational and Environmental Exposures to Radon and Radon Daughters in the United States NCRP Report 78 (1984)
[4] MARTIN P HANCOCK GJ Routine analysis of naturally occurring radionuclides in environmental samples by alpha-particle spectrometry Supervising Scientist Report 180 (2004) httpwwwenvironmentgovaussdpublicationsssr180html
[5] INTERNATIONAL ATOMIC ENERGY AGENCY Reference Material IAEA-434 Naturally Occurring Radionuclides in Phosphogypsum IAEA Analytical Quality in Nuclear Applications Series No 17 IAEAAQ17 IAEA Vienna (2010)
[6] MEDLEY P BOLLHOumlFER A ILES M RYAN B MARTIN P Barium sulfate method for radium-226 analysis by alpha spectrometry Environmental Research Institute of the Supervising Scientist internal report 501 (2005)
[7] VAJDA N LAROSA J ZEISLER R DANESI P KIS-BENEDEK G A Novel Technique for the Simultaneous Determination of 210Pb and 210Po using a Crown Ether J Environ Radioactivity 37 (1997) 355-372
[8] INTERNATIONAL ATOMIC ENERGY AGENCY A Procedure for the Determination of Po-210 in Water Samples by Alpha Spectrometry IAEA Analytical Quality in Nuclear Applications Series No 12 IAEAAQ12 IAEA Vienna (2009)
[9] GUOGANG J TORRI G INNOCENZI P OZONE R Di LULLO A Determination of radium isotopes in mineral and environmental water samples by alpha-spectrometry J of Radioanalytical and Nuclear Chemistry 267 3 (2005) 505-514
[10] EURACHEMCITAC Guide Quantifying uncertainty in analytical measurement 2nd Ed(2000)
[11] INTERNATIONAL ATOMIC ENERGY AGENCY Quantifying Uncertainty in Nuclear Analytical Measurements IAEA-TECDOC-1401 IAEA Vienna (2004)
[12] SHAKHASHIRO A SANSONE U Technically Enhanced Naturally Occurring Radionuclides (TENORM) in Phosphogypsum The Interlaboratory Comparison CCRI(II)07-35 Metrologia (2009)
[13] DUEWER DL A Robust Approach for the Determination of CCQM Key Comparison Reference Values and Uncertainties Working document CCQM04-15 BIPM wwwbipminfoccCCQMAllowed10CCQM04-15pdf (2004)
23
[14] Monographie BIPM-5 Vol 1ndashMonographie BIPM-5 Vol 5
httpwwwnucleideorg Decay Data Evaluation Project (DDEP) accessed in October 2010
[15] NuDat 25 (Database at the US NNDC) httpwww-ndsiaeaorg accessed in October 2010
[16] HORWITZ et al A Novel Strontium-Selective Extraction Chromatographic Resin Solvent Extraction amp Ion Exchange 10 (1992) 313
[17] HORWITZ et al Extraction Chromatography of Actinides and Selected Fission Products Principles and Achievement of Selectivity presented at International Workshop on the Application of Extraction Chromatography in Radionuclide Measurement IRMM Geel 1998
[18] HORWITZ et al Separation and Preconcentration of Actinides by Extraction Chromatography Using a Supported Liquid Anion Exchanger Application to the Characterization of High-Level Nuclear Waste Solutions Analytica Chimica Acta 310 (1995) 63-78
[19] HORWITZ et al Separation and Preconcentration of Uranium from Acidic Media by Extraction Chromatography Analytica Chimica Acta 266 (1992) 25-37
[20] C-K KIM MARTIN P FAJGELJ A Quantification of measurement uncertainty in the sequential determination of 210Pb and 210Po by liquid scintillation counting and alpha particle spectrometry Accreditation and Quality Assurance 13 12 (2008) 691-702
[21] J KRAGTEN Calculating Standard Deviation and Confidence Intervals with a Universally Applicable Spreadsheet Technique Analyst 119 (1994) 2161ndash2165
24
APPENDIX I NUCLEAR DATA OF RELEVANT RADIONUCLIDES AND DECAY CHAINS OF U
AND Th SERIES
TABLE I 1 NUCLEAR DATA OF RELEVANT RADIONUCLIDES [14]
Radionuclide Half-life Disintegration modes
E (MeV) Probability ()
225Ac 100(1) d α 5580 5(14) 095(4)
α 5599 3(14) 0114(7)
α 5609 0(14) 109(5)
α 5637 3(14) 416(23)
α 5682 2(14) 131(4)
α 5686 4(14) 0021(14)
α 5723 1(14) 203(23)
α 5730 5(14) 16(3)
α 5731 6(14) 124(10)
α 5731 9(17) 90(5)
α 5797 7(14) 62(9)
α 5793 1(21) 189(20)
α 5804 2(14) 03
α 5829 6(14) 524(24)
217At 323(4) x 10-3 s α 6484 7(16) 0016 7(8)
α 6813 8(16) 0038 4(15)
α 7066 9(16) 99932(3)
133Ba 10540(6) y γ 0053 162 2(6) 214(3)
γ 0079 614 2(12) 265(5)
γ 0080 997 9(11) 329(3)
γ 0276 398 9(12) 716(5)
γ 0302 850 8(5) 1834(13)
γ 0356 012 9(7) 6205(19)
γ 0383 848 5(12) 894(6)
210Bi 5012(5) d β 1162 1(8) 99999 86(2)
212Bi 6054(6) min β 0633(2) 190(4)
β 0741(2) 145(29)
β 1527(2) 458(21)
β 2254(2) 5523(21)
α 6050 92(4) 251(1)
α 6090 02(4) 97(1)
221Fr 479(2) min α 6126 3(15) 151(2)
α 6243(2) 134(7)
α 6341 0(13) 828(2)
TABLE I 1 NUCLEAR DATA OF RELEVANT RADIONUCLIDES [14] (cont)
25
Radionuclide Half-life Disintegration modes
E (MeV) Probability ()
210Pb 2223(12) y β 0017 0(5) 802(13)
β 0063 5(5) 198(13)
γ 0046 539(1) 4252(40)
208Po 2898(2) y α 5114 9(14) 99995 8(4)
α 4220(15) 24(7)x10-4
209Po 115(13) y α 4885(2) 198(32)
α 4883(2) 792(32)
α 4622(5) 0548(7)
210Po 138376 3(17) d α 5304 33(7) 99998 76
α 4516 66(9) 0001 24(4)
213Po 370(5) x 10-6 s α 8375 9(25) 99995 0(5)
216Po 0150(5) s α 6778 6(5) 99998 1(3)
α 5988 6(10) 0001 9(3)
218Po 3094(6) min α 6002 35(9) 99976 9(32)
223Ra 1143(5) d α 5747 0(4) 900(20)
α 5716 23(29) 516(13)
α 5606 73(30) 252(5)
α 5539 80(90) 900(20)
224Ra 3627(7) d α 5448 81(16) 526(7)
α 5685 50(15) 9472(7)
γ 0240 986(6) 412(4)
225Ra 1482(19)d β 0316(5) 688(20)
β 0356(5) 312(20)
γ 0040 09(5) 300(7)
226Ra 1 600(7) y α 4601(1) 595(4)
α 4784 34(25) 94038(40)
228Ra 575(4) y β 00127(7) 30(10)
β 00256(7) 87(9)
β 00391(7) 49(10)
β 00395(7) 12(10)
220Rn 558(3) s α 5748 46(14) 0118(15)
α 6288 22(10) 99882(15)
222Rn 3823 2(8) d α 5489 48(30) 9992(1)
228 Th 69860(23) d α 5176 89(23) 020(2)
α 5211 08(22) 038(3)
α 5340 38(22) 262(2)
α 5423 28(22) 732(2)
TABEL I 1 NUCLEAR DATA OF RELEVANT RADIONUCLIDES [14] (cont)
26
Radionuclide Half-life Disintegration
modes E (MeV) Probability ()
229 Th 7 340(160) y α 5053(2) 660(10)
α 4978 5(12) 317(4)
α 4967 5(12) 597(6)
α 4901 0(12) 1020(8)
α 4845 3(12) 5620(20)
α 4814 6(12) 930(8)
230 Th 7538(30) x 104 y α 4687 0(15) 763(3)
α 4620 5(15) 234(10)
232 Th 1402(6) x 109 y α 3810 0(14) 0068(20)
α 3948 5(14) 210(13)
α 4011 2(14) 789(13)
234 Th 2410(3) d β 0105(10) 65(7)
β 0106(10) 141(12)
β 0198(10) 778(15)
γ 0063 30(2) 375(8)
232U 706(11) y α 5263 48(9) 306(6)
α 5320 24(9) 691(6)
233U 1592(2) x 105 y α 4824 2(12) 843(6)
α 4783 5(12) 132
234U 2455(6) x 105 y α 4603 5(7) 0210(2)
α 4722 4(7) 2842(2)
α 4774 6(7) 7137(2)
235U 704(1) x 106 y α 4322(4) 333(6)
α 4397 8(13) 5719(20)
α 4414 9(5) 301(16)
α 4502 4(7) 128(5)
α 4556 0(4) 379(6)
α 4596 4(13) 474(6)
236U 2343(6) x 107 y α 4445(5) 261(40)
α 4494(3) 738(40)
238U 4468(5) x 109 y α 4038(5) 013(3)
α 4151(5) 2233(50)
α 4198(3) 7754(50)
Emax for beta emitting radioisotopes
Data were taken from [15]
27
FIG I 1 Decay chain of 238U [4]
FIG I 2 Decay chain of 232Th [4]
28
APPENDIX II FLOW CHART FOR SEQUENTIAL SEPARATION OF 210Po 210Pb Th U AND 226Ra
IN PHOSPHOGYPSUM
29
APPENDIX III PROPERTIES OF RESINS
III1 Sr resin
FIG III 1 Structure of the Sr resin (wwweichromcom)
FIG III 2 Capacity factor of Sr resin in nitric acid (wwweichromcom) [16]
30
FIG III 3 Capacity factor of Sr resin in nitric acid (wwweichromcom) [17]
III2 TEVA resin
FIG III 4 Structure of the TEVA resin (wwweichromcom)
31
FIG III 5 Capacity factor of TEVA resin in nitric acid and hydrochloric acid (wwweichromcom) [18]
III3 UTEVA resin
FIG III 6 Structure of the UTEVA resin (wwweichromcom)
32
FIG III 7 Capacity factor of UTEVA resin in nitric acid and hydrochloric acid (wwweichromcom) [19]
33
APPENDIX IV ALPHA SPECTRA OF ANALYTES
FIG IV 1 Alpha spectrum of Po isotopes
FIG IV 2 Alpha spectrum of Th isotopes in phosphogypsum (with progeny)
228Th is resulted from 232U tracer spiked in the sample
34
FIG IV 3 Alpha spectrum of U isotopes
FIG IV 4 Alpha spectrum of 226Ra and its progeny (spiked with 225Ra)
35
FIG IV 5 Overlapping alpha spectra of U and Po isotopes
FIG IV 6 Overlapping alpha spectra of U and Th (with progeny) isotopes
36
APPENDIX V LIQUIDE SCINTILLATION SPECTRA
a)
b)
A window
(115-320 ch)
B window
(320 -410 ch)
210Po
210Pb
210Bi
210Bi
Co
unts
Ch
ann
elC
oun
tsC
han
nel
Channel number
a)
b)
A window
(115-320 ch)
B window
(320 -410 ch)
210Po
210Pb
210Bi
210Bi
Co
unts
Ch
ann
elC
oun
tsC
han
nel
Channel number
FIG V 1 Typical liquid scintillation spectra of beta-emitting 210Pb and 210Bi and alpha emitting 210Po (calibration sources) a) 210Pb 210Bi and 210Po spectra
b) pure 210Bi spectrum
37
APPENDIX VI CALCULATION OF THE COMBINED UNCERTAINTY
OF THE ACTIVITIES OF THE ANALYTES ON SAMPLING DATE
VI1 Uncertainty of the 210Pb result [20]
VI11 Uncertainty of counting efficiency of 210Pb
2
2
2
2
2210
2
210
2210
222
)()()()()()( )( PbTPbT
calcal
stdPbstdPb
Pbb mum
RuR
aua
utZuZ
u
minus+
minus+
minus++
= minusminus
minusεεελεεε (VI-1)
2
222
2 )()()()()( (Z) BABnBnBAAn furrufruu minus+minus+= (VI-2)
20
2 )()()( AAgAn rururu += (VI-3)
20
2 )()()( BBgBn rururu += (VI-4)
VI12 Uncertainty of the tailing factor fAB
The uncertainty of the tailing factor fAB is calculated according to following equations
2
210
210
2
210
210
)()()(
+
=
minus
minus
minus
minus
BicalnB
BicalnB
BicalAn
BicalAnBABA r
ru
r
ruffu (VI-5)
20
2210210 )()()( ABicalAgBicalAn rururu += minusminus (VI-6)
20
2210210 )()()( BBicalBgBicalBn rururu += minusminus (VI-7)
The uncertainty of counting efficiency for 210Pb can be calculated by Eq (VI-8)
2
2
2
2
2210
2
210
2210
222
)()()()()()( )( PbTPbT
calcal
stdPbstdPb
Pbb mum
RuR
aua
utZuZ
u
minus+
minus+
minus++
= minusminus
minusεεελεεε (VI-8)
2
222
2 )()()()()( (Z) BABnBnBAAn furrufruu minus+minus+= (VI-9)
20
2 )()()( AAgAn rururu += (VI-10)
20
2 )()()( BBgBn rururu += (VI-11)
38
VI13 Uncertainty of chemical recovery of Pb
Uncertainty of chemical recoveries of Pb in calibration source
minusminus+
minus+
= 2
2
2
2
2
2
cal )()(
)()(
)( )(R calfcalfcalof
calcalof
calfcalof
calg
g
cal mumm
Rmu
mm
Rfu
f
Ru
2
1
2
2
2
2
)()(
)()(
minus+
minus+
minus
minusminus
minusc
ccPb
cPbcalcPb
ccPb
ccal mumC
CRCu
mC
mR (VI-12)
The uncertainty of chemical recovery of Pb in the sample can be calculated
minusminus+
minus+
= 2
2
2
2
2
2
)()(
)()(
)( (R) ffof
offof
gg
mumm
Rmu
mm
Rfu
f
Ru
2
2
2
2
)()(
)()( c
ssPbccPb
cPbcPb
ssPbccPb
c mumCmC
CRCu
mCmC
mR
+minus+
+minus+
minusminus
minusminus
minusminus
2
1
2
2
2
2
)()(
)()(
+minus+
+minus+
minusminus
minusminus
minusminuss
ssPbccPb
sPbsPb
ssPbccPb
s mumCmC
CRCu
mCmC
mR (VI-13)
VI14 Uncertainty of mass ratio
The uncertainty of the mass ratio (fg) of atomic mass of Pb to molar mass of Pb-oxalate is calculated using the equations below
22
M Pb)(
+
=
minus
minus
oxalatePb
M
Pbgg M
u
M
uffu oxalatePb (VI-14)
The uncertainty of the molar mass of lead oxalate u(MPb-oxalate) can be derived by combining standard uncertainties in atomic masses of its constituents as shown in Table VI 1
39
TABLE VI 1 STANDARD UNCERTAINTIES OF ATOMIC WEIGHT AND THE GRAVIMETRIC FACTOR fg
Element Atomic weight
(gmol-1)
Quoted uncertainty (gmol-1)
Conversion factor
Standard uncertainty (gmol-1)
Mass ratio of atomic mass of Pb to
molar mass of Pb-oxalate
Uncertainty ofatomic mass
of Pb to molar mass of
Pb-oxalate
Pb 207215 2 0000 15 3 0000 087 0701 9 0000 002
C 12010 7 0000 8 3 0000 46
O 15999 4 0000 3 3 0000 17
VI15 Combined uncertainty of activity of 210Pb
The combined uncertainty of the 210Pb activity is calculated from Eq (VI-15)
minus+
minus+
minus+
= minusminusminusminus 2
2
2102
2
2102
2
210
2
2
2101 )()()()()( s
d
sPb
BA
sPb
nBnB
sPb
BAnA
sPb
Pbc mum
afu
Z
arru
Z
afru
Z
aau
2
1
23
2
3
21022
2
2
2102
2
2102
2
210 )()()()(
+
+
minus+
minus+ minus
minus
minusminus
minus
minusminusminusPb
Pb
sPbPb
Pb
sPbsPbsPb fuf
afu
f
aRu
R
au
aε
ε (VI-15)
)()( 210222 minusminusminus = PbPbPb utffu λ (VI-16)
210
210321033
)(
11)(
3210
3210
minus
minusminus
minus
minusminusminus
minusminus=
minus
minus
Pb
Pbt
t
PbPbPb
u
e
etffu
Pb
Pb
λλλ λ
λ
(VI-17)
However if the time interval (t2) between the separation of 210Pb and the beginning of the measurement and the counting time of the sample (t3) are much smaller than the half life of 210Pb f2-Pb f3-Pb u(f2-Pb) and u(f3-Pb) are negligible The uncertainties associated to components mentioned above can be calculated as follows
0
0
3
)(t
r
t
rru
Po
gn +=
minus
(VI-18)
0
0
3
)(t
r
t
rru t
Po
tgtn +=
minus
(VI-19)
minus+
+
= minusminusminus
minus2
2
2102
2
2102
2
210210 )()()( )( tn
tn
sPo
nn
sPo
TT
sPo
sPo rur
aru
r
aAu
A
aau
2
2
21022
2
2
2102
2
2102
2
210)()()()( T
T
sPo
PoPo
sPo
TT
sPo
ss
sPofu
f
afu
f
amu
m
amu
m
a
+
+
+
minus+ minus
minusminus
minusminusminus
40
2
1
3
2
3
210 )(
+ minus
minus
minusPo
Po
sPo fuf
a (VI-20)
)()( TTTt utffu λ= (VI-21)
)()( 210222 minusminusminusminus = PoPoPoPo utffu λ (VI-22)
210
210321033
)(
11)(
3210
3210
minus
minusminus
minus
minusminusminus
minusminus=
minus
minus
Po
Pot
t
PoPoPo
u
e
etffu
Po
Po
λλλ λ
λ (VI-23)
VI16 Combined uncertainty of activity of 210Po
The uncertainty of the activity of 210Po on the separation date is calculated according to IAEAAQ12 procedure [8]
VI2 Uncertainty of other alpha emitting isotopes
The same formulas are used to calculate the combined uncertainties as equations that are used for calculation of the activity of alpha emitting analytes at the separation time and the sampling date as well as the chemical recovery and counting efficiency These formulas have to be applied in the spreadsheet approach for calculating the combined uncertainties knowing the standard uncertainty of each component VI3 Spreadsheet approach
For the quantifying the uncertainties the spreadsheet technique [21] was used which could be summarised as follows and showed in the Fig VI 1
bull Calculate function y using parameter xj
y=f(x1x2xj xn) (VI-24)
bull recalculate the same function n times increasing xj to xj+dxj (dxj standard deviation) and keeping the remaining parameters constant
y=f(x1x2xj+dxj xn) (VI-25)
bull the uncertainty on the function dy is the square root of the sum of squares
( )sum minus=n
jyydy1
2 (VI-26)
bull The individual variance contribution fj is
( )( )sum minus
minus=
n
j
jj
yy
yyf
1
2
2
(VI-27)
41
FIG VI 1 Spreadsheet approach for quantifying the uncertainty of the measurement
The results are summarised for the individual isotopes in the Tables VI 2ndashVI 9 and the results of the individual analysis with their uncertainties are shown in the Figs VI 3ndashVI 9 The detailed study about the usual contributors of uncertainty in the nuclear analytical techniques could be found in the IAEA-TECDOC-1401 [11] TABLE VI 2 AN EXAMPLE OF QUANTIFYING UNCERTAINTIES OF 210Po RESULT
Symbol unit Value of variable
Uncertainty Conversion factor to standard uncertainty
Standard uncertainty
Contribution to combined
uncertainty ()
m g 0508 9 0007 3 3 0004 2 010
rgt s-1 0197 0075 1 0075 361
r0t s-1 0000 017 0000 034 1 0000 034 0000 014
rg s-1 0081 0029 1 0029 6352
r0 s-1 0000 034 0000 033 1 0000 033 0000 08
at Bq 0829 0019 1 0019 0252
λt d-1 0000 019 0000 013 1 0000 013 negligible
λPo d-1 0005 72 x 10-9 1 72x10-9 negligible
ft 0982 14 0000 43 1 0000 43 0000 091
f2-Po 1005 73 x 10-9 1 73x10-9 negligible
f3-Po 1005 5 18 x 10-8 1 18 x10-8 negligible
aPo1 Bqmiddotkg-1 672 94
contribution is less than 1 x 10⁻⁵
TABLE VI 3 AN EXAMPLE OF QUANTIFYING UNCERTAINTIES OF EFFICIENCY OF 210Pb
Symbol unit Value of variable
Uncertainty
Conversion factor to standard
uncertainty
Standard uncertainty
Contribution to combined
uncertainty ()
mvial g 14936 35 0000 1 3 0000 17 0004 8
42
Symbol unit Value of variable
Uncertainty
Conversion factor to standard
uncertainty
Standard uncertainty
Contribution to combined
uncertainty ()
mvial+carrsol g 16036 54 0000 1 3 0000 17 0004 8
cPb g g-1 0027 42 0000 021 1 0000 021 011
mvial g 16036 72 0000 10 3 0000 17 0004 8
mvial+std g 17132 6 0000 10 3 0000 17 0004 8
astd Bq 1245 0189 1 0189 805
fgravimetry 0701 85 0000 41 1 0000 41 0066
mfilter g 0036 54 0000 10 3 0000 17 42
mfilter+Pb-precipitate g 0073 77 0000 10 3 0000 17 41
rA s-1 7362 0041 1 0041 76
rA0 s-1 0029 5 0003 1 0002 7 0035
rB s-1 0416 0 0011 1 0011 060
rB0 s-1 0011 7 0002 1 0002 2 0024
fAB 1049 0023 1 0023 040
t12 Pb d 814508 7305 1 731 23
tmeas-ref d 4 532 -
ε 0859 7 0015 3
43
TABLE VI 4 AN EXAMPLE OF QUANTIFYING UNCERTAINTIES OF 210Pb RESULT
Symbol unit Value of variable
Uncertainty Conversion factor to standard uncertainty
Standard uncertainty
Contribution to combined
uncertainty ()
ms g 0508 9 0007 3 3 0004 2 03
rgA s-1 0283 0035 1 0035 883
r0A s-1 0011 7 0002 2 1 0002 2 03
rgB s-1 0031 0009 1 0009 58
r0B s-1 0005 6 0002 3 1 0002 3 04
Ζ s-1 0245 1 0032 7 1 0032 7 -
fAB 1015 3 0012 9 1 0012 9 001
ε 0859 7 0015 3 1 0015 3 13
R 0858 8 0025 3 1 0077 2 35
aPb1 Bqmiddotkg-1 652 12
TABLE VI 5 AN EXAMPLE OF QUANTIFYING UNCERTAINTIES OF 234U RESULT
Symbol unit Value of variable
Uncertainty Conversion factor to standard uncertainty
Standard uncertainty
Contribution to combined
uncertainty ()
ms g 0508 9 0007 3 3 0004 2 003
rgt s-1 0021 78 0008 01 1 0008 369
r0t s-1 0000 030 0000 022 1 0000 022 0000 5
rg s-1 0016 15 0005 90 1 0006 628
r0 s-1 0000 016 0000 022 1 0000 022 0000 1
at Bq 0088 35 0002 10 1 0002 01 029
aU-234_1 Bqmiddotkg-1 129 3
TABLE VI 6 AN EXAMPLE OF QUANTIFYING UNCERTAINTIES OF 238U RESULT
Symbol unit Value of variable
Uncertainty Conversion factor to standard uncertainty
Standard uncertainty
Contribution to combined
uncertainty ()
ms g 0508 9 0007 3 3 0004 2 003
rgt s-1 0021 78 0008 01 1 0008 353
r0t s-1 0000 030 0000 022 1 0000 022 0000 5
rg s-1 0015 61 0005 67 1 0006 644
r0 s-1 0000 009 0000 008 1 0000 008 0000 1
at Bq 0088 35 0002 10 1 0002 1 028
aU-238_1 Bqmiddotkg-1 124 3
44
TABLE VI 7 AN EXAMPLE OF QUANTIFYING UNCERTAINTIES OF 230Th RESULT
Symbol unit Value of variable
Uncertainty Conversion factor to standard uncertainty
Standard uncertainty
Contribution to combined
uncertainty ()
ms g 0508 9 0007 3 3 0004 2 005
rgt s-1 0022 63 0006 44 1 0006 387
r0t s-1 0000 077 0000 063 1 0000 063 0006 1
rg s-1 0028 38 0007 90 1 0008 608
r0 s-1 0000 012 0000 010 1 0000 010 0000 1
at Bq 0090 03 0002 30 1 0002 303 051
aTh-230_1 Bqmiddotkg-1 223 9
TABLE VI 8 AN EXAMPLE OF QUANTIFYING UNCERTAINTIES OF 232Th RESULT
Symbol unit Value of variable
Uncertainty Conversion factor to standard uncertainty
Standard uncertainty
Contribution to combined
uncertainty ()
ms g 0508 9 0007 3 3 0004 2 004
rgt s-1 0022 63 0006 44 1 0006 265
r0t s-1 0000 077 0000 063 1 0000 063 0004 2
rg s-1 0000 28 0000 10 1 0000 1 727
r0 s-1 0000 011 0000 008 1 0000 008 048
at Bq 0090 03 0002 30 1 0002 3 035
aTh-232_1 Bqmiddotkg-1 21 009
TABLE VI 9 AN EXAMPLE OF QUANTIFYING UNCERTAINTIES OF 226Ra RESULT
Symbol unit Value of variable
Uncertainty Conversion factor
to standard uncertainty
Standard uncertainty
Contribution to combined
uncertainty ()
ms g 0508 9 0007 3 3 0004 2 003
rgt s-1 0043 10 0025 05 1 0025 05 603
r0t s-1 0000 111 0000 128 1 0000 128 0004
rg s-1 0063 32 0018 78 1 0018 78 393
r0 s-1 0000 070 015 0000 070 013 1 0000 070 013 0000 5
at Ra-225 Bq 0779 50 0022 53 1 0022 53 04
λAc225 d-1 0069 315 0000 624 1 0000 624 0000 02
λRa225 d-1 0046 520 0000 693 1 0000 693 008
t1-t0 d 337
aRa-226_1 Bqmiddotkg-1 766 39
45
APPENDIX VII DETECTION THRESHOLD AND LIMIT OF THE APPLIED PROCEDURE
TABLE VII 1 TYPICAL DECISION THRESHOLD AND DETECTION LIMIT FOR RELEVANT ISOTOPES
Symbol unit 210Pb 210Po 234U 238U 230 Th 232 Th 226Ra
k 165 165 165 165 165 165 165
m kg 0000 5 0000 5 0000 5 0000 5 0000 5 0000 5 0000 5
ε 086 031 026 026 035 035 025
R 086 073 094 094 068 068 061
n0 52 16 4 4 6 6 28
Tg s 36 000 98 899 343 024 343 024 277 345 277 345 124 984
t0 s 35 542 548 190 512 901 512 901 559 286 559 286 446 755
a Bqmiddotkg-1 13 036 009 009 012 012 068
a1 Bqmiddotkg-1 38 11 028 028 036 036 205
u2(0) Bq2middotkg-2 29 015 0008 4 0008 4 0006 5 0004 7 078
u2(a1) Bq2middotkg-2 23 041 0059 0025 0028 0052 204
a Bqmiddotkg-1 24 12 052 019 018 019 43
46
APPENDIX VIII VALIDATION TEST RESULTS OF THE PROCEDURE
TABLE VIII 1 VALIDATION RESULTS FOR RELEVANT RADIONUCLIDES
Parameters 210Po 210Pb 234U 238U 230Th 226Ra
C Bq kg-1 680 680 120 120 211 780
X Bq kg-1 653 659 127 123 221 793
u(C) Bq kg-1 58 58 9 11 9 62
u(X ) Bq kg-1 23 22 5 5 10 35
δ() -40 -31 58 25 47 17
rL Bq kg-1 106 102 48 47 62 498
RL Bq kg-1 237 454 59 53 89 707
PI() 92 92 85 100 62 91
TABLE VIII 2 ANALYSIS OF VARIANCE (ANOVA) FOR 210Po 210Pb 238U 230Th AND 226Ra IN PHOSPHOGYPSUM
Nuclide SSwb SSbb MSwb MSbb Swb
(as CV)
Sbb
(as CV)
210Po 124 62 151 79 312 1687 271 254
210Pb 8385 197 54 210 2195 220 302
238U 314 386 785 429 227 215
230Th 2176 1598 544 178 334 225
226Ra 412 686 137 858 121 054
SSwb sum of squares within bottles
SSbb sum of squares between bottles
MSwb mean of squares within bottles
MSbb mean of squares between bottles
Swb standard deviation as percent of covalent variance within bottles
Sbb standard deviation as percent of covalent variance between bottles
47
550
600
650
700
750
0 10 20 30 40 50
Samples
Act
ivity
of
21
0 Pb
in th
e sa
mp
le (
Bq
kg
dry
)
Mean1σ
-2σ
-1σ
3σ
2σ
-3σ
FIG VIII 1 210Pb results with associated uncertainties
550
600
650
700
750
0 10 20 30 40 50Samples
Act
ivity
of
21
0 Po
in t
he s
ampl
e (B
qkg
dry
)
Mean
1σ
-1σ
3σ
2σ
-3σ-2σ
FIG VIII 2 210Po results with associated uncertainties
48
110
115
120
125
130
135
140
0 10 20 30 40 50
Samples
Act
ivity
of
238
U in
the
sam
ple
(B
qkg
dry
)
Mean
1σ
-1σ
3σ
2σ
-3σ
-2σ
FIG VIII 3 238U results with associated uncertainties
105
110
115
120
125
130
135
140
145
150
0 10 20 30 40 50
Samples
Act
ivity
of
23
4 U in
the
sa
mpl
e (B
qkg
dry
)
Mean1σ
-2σ-1σ
3σ2σ
-3σ
FIG VIII 4 234U results with associated uncertainties
49
190
200
210
220
230
240
250
0 5 10 15 20 25 30 35 40 45 50
Samples
Act
ivity
of
23
0 Th
in th
e s
am
ple
(B
qk
g d
ry)
2σ
3σ
1σ
-1σ
-2σ
-3σ
Mean
FIG VIII 5 230 Th results with associated uncertainties
05
10
15
20
25
30
35
40
0 10 20 30 40 50
Samples
Act
ivity
of
23
2 Th
in th
e sa
mp
le (
Bq
kg
dry
)
Mean
1σ
-2σ
-1σ
3σ
2σ
-3σ
FIG VIII 6 232 Th results with associated uncertainties
50
650
700
750
800
850
900
1 2 3 4 5 6 7 8 9 10 11 12 13 14 15 16 17 18 19 20
Sample
Act
ivity
of
226 R
a in
th
e sa
mp
le (
Bq
kg
dry
)
Mean
1σ
-1σ
3σ
2σ
-3σ
-2σ
FIG VIII 7 226Ra results with associated uncertainties
51
CONTRIBUTORS TO DRAFTING AND REVIEW
Hampe D Gaigl FA
Verein fuumlr Kernverfahrenstechnik und Analytik Rossendorf eV Dresden Germany IAEA Environment Laboratories Terrestrial Environment Laboratory Seibersdorf Austria
Kim C-K IAEA Environment Laboratories Terrestrial Environment Laboratory Seibersdorf Austria
Kis-Benedek Gy IAEA Environment Laboratories Terrestrial Environment Laboratory Seibersdorf Austria
Martin P IAEA Environment Laboratories Terrestrial Environment Laboratory Seibersdorf Austria
Mietelski J W The Henryk Niewodniczanski Institute of Nuclear Physics Polish Academy of Sciences Poland
Sansone U IAEA Environment Laboratories Terrestrial Environment Laboratory Seibersdorf Austria
Varga B Central Agricultural Office Food and Feed Safety Directorate Hungary
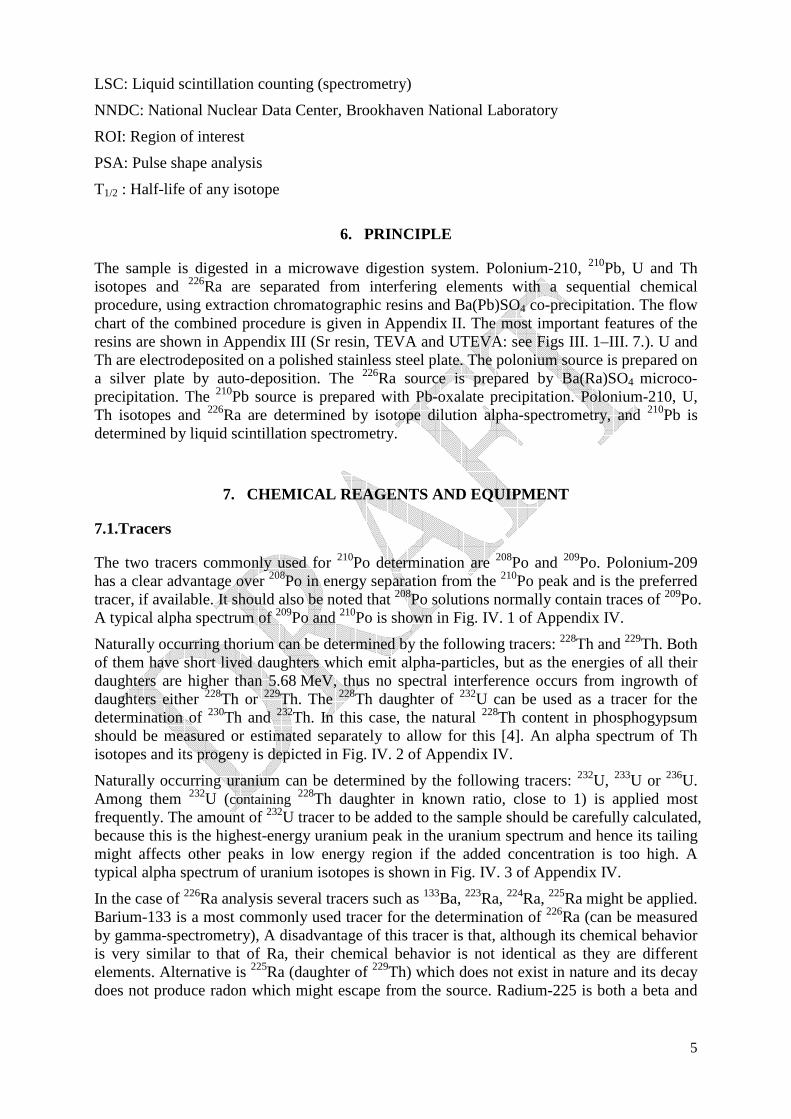
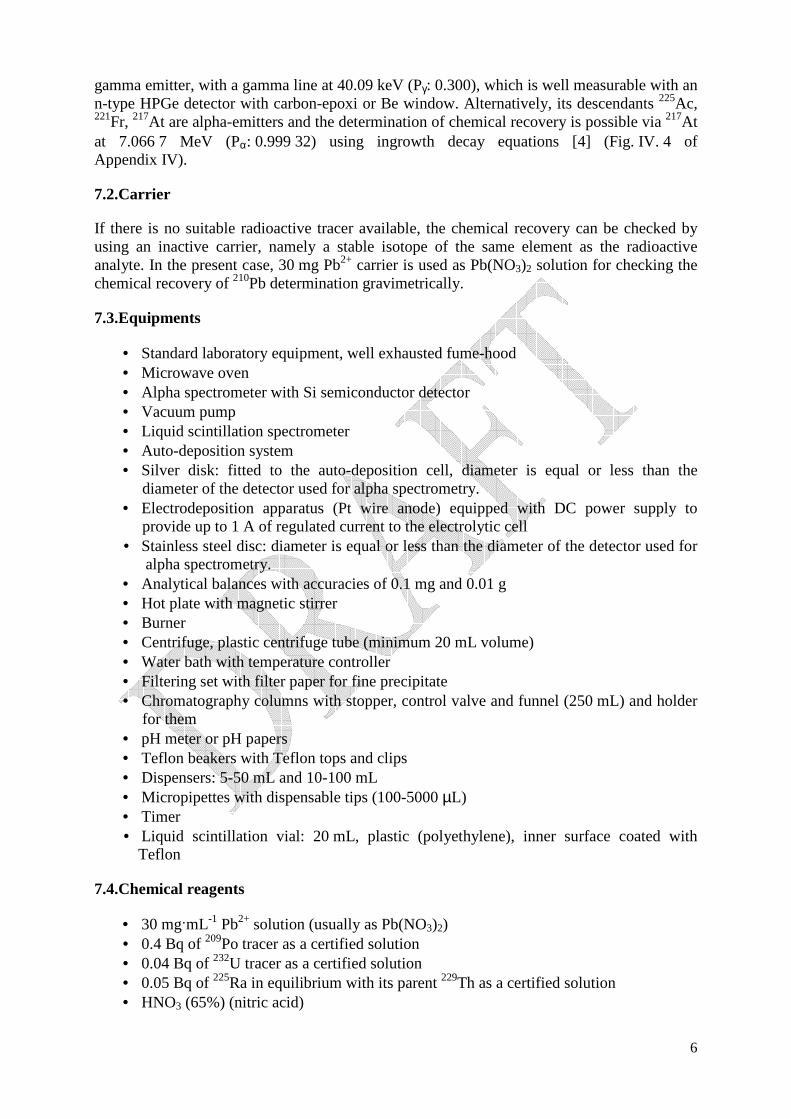
10
(f) Elute U with 6 mL ultra pure water
924 Radium separation [6]
(a) Combine the effluent (20 mL 3M HNO3) and the washing solution (30 mL 3M HNO3) from the UTEVA column in a 200 mL volume of beaker (923 step (b) and (c))
(b) Add 4 mL concentrated H2SO4 and 20 mL 20 Na2SO4 to the solution
(c) Slowly add 5 mL Pb2+ carrier (10 mgmL-1) to form a Pb(RaBa)SO4 co-precipitate while stirring for 1ndash2 minutes
(d) Remove stirrer bars washing with a small amount of 01M HCl and ultra pure water
(e) Allow to sit for 3ndash4 hours
(f) Decant supernatant liquor to a volume as low as possible
(g) Transfer the precipitate into a 50 mL conical centrifuge tube using 80 ethanol and centrifuge at 3000 revolutionsmin for 10 minutes
(h) Wash the precipitate with 20 mL 80 ethanol and decant the supernatant
(i) Wash the sides of the centrifuge tube with 5ndash10 mL sodium sulfate wash solution and vortex to mix thoroughly then add a further 5ndash10 mL to wash down the walls and then re-centrifuge at 3000 revmin for 10 minutes
(j) Pour out supernatant then invert the tube and wash the walls with ultra pure water to remove excess acid and sulfate (take care not to disturb the precipitate)
(k) Add 10 mL 02M DTPA (diethylenetriaminepentaacetic acid) and 1 drop of 025 thymol blue The solution should turn deep blue if not add 10M NaOH dropwise until a deep blue color is reached (pHgt9)
(l) Vortex to dissolve the precipitate
93Source preparation
931 Polonium-210 source
(a) The Po solution is carefully evaporated to dryness at less than 150degC
(b) Dissolve the residue in 10 mL 05M HCl
(c) Clean a silver disc with acetone followed by cc NH3(aq) followed by ultra pure water
(d) Place the cleaned silver disc into the deposition cell (Teflon vial) with another disc placed underneath for support Check if the cell is watertight
(e) Add 005 g ascorbic acid into the sample solution to reduce Fe3+ to Fe2+ check the colour change after mixing one drop of sample solution and one drop of 01M NH4SCN Add ascorbic acid until the dark red colour disappears
(f) Transfer the solution to the deposition cell
(g) Rinse the beaker with 2 x 2 mL 05M HCl and adjust the pH of the solution in the deposition cell to pH2 with 6M NaOH
(h) Place the deposition cell into a water bath at 90oC for 90 min with mechanical stirring or air bubbling
11
(i) Remove the silver disc wash with acetone or ultra pure water and dry it at room temperature
932 Uranium and thorium sources
(a) The purified U or Th solution is evaporated to dryness three times with a few mL 65 HNO3 to destroy any existing organic matter
(b) Dissolve the residues in 10 mL 10 (NH4)2SO4 solution at pH2 (The pH of samples being deposited for thorium should be slightly more acidic pH15-pH2)
(c) Transfer the solution into an electrodeposition cell
(d) Electrodeposit U or Th onto polished stainless steel discs at 1 A for 90 minutes respectively
(e) At the end of the deposition time fill the cell with 15M NH4OH and continue deposition for 1 min then turn off the main power of deposition unit and disconnect the cathode
(f) Rinse the cell twice with 1 NH4OH then three times with ultra pure water
(g) Disassemble the cell rinse the disc with ultra pure water and dry it
933 Radium source (BaSO4 micro co-precipitation)
(a) Rapidly add 4 mL mixed solution of 5 parts of 20 Na2SO4 with 1 part of acetic acid to the solution from the step 924 (l)
(b) Add 04 ml Ba seeding solution as soon as possible (2ndash3 s)
(c) Adjust pH to 48 with diluted H2SO4 as indicated by the colour change to a bright red
(d) Allow to sit for at least 30 minutes
(e) Filter the colloidal suspension of Ba(Ra)SO4 through a pre-wetted (by 80 ethanol) polypropylene filter (for example 01 microm pore size 25 mm diameter Pall)
(f) Rinse the centrifuge tube walls with 4ndash5 mL sodium sulfate wash solution and filter
(g) Rinse the sides of the filter holder with 15ndash20 drops 80 ethanol
(h) Allow the filter to dry and place it into a 47 mm Petri dish The time is recorded which is considered as the time of 225Ra225Ac separation or start of 225Ac ingrowth
The source preparation must be completed on the same day
934 Lead-210 source
(a) Evaporate the Pb solution which obtained from the step of 921(f) and re-evaporate with three portion of 5 mL 65 HNO3
(b) Dissolve the residue in 10 mL 1M HNO3
(c) Add 40 mg oxalic acid to the solution and adjust pH2ndash3 with 25 NH4OH to prepare a Pb-oxalate precipitate
12
(d) Let the solution to cool down and filtrate the precipitate on a filter paper (for example Whatman 41 dried in a drying oven and weighed in advance) wash the filter 3 times with 1 mL water and 2 mL 80 ethanol
(e) Dry the precipitate (40ndash50oC) and cool down in a desiccator
(f) Weigh the dried precipitate and calculate the chemical recovery using the gravimetric method
(g) Quantitatively transfer the precipitate into a liquid scintillation vial together with the filter and add 1 mL of 6M HNO3 into the vial to dissolve the precipitate
(h) Mix the solution with 15 mL of scintillation cocktail
94Measurement
941 Alpha-spectrometry
(a) Introduce the source into the vacuum chamber and pump until a vacuum of about 05 Pa (5 x 10⁻³ mbar) is obtained Then switch on the bias voltage button of detector
(b) Record the file name sample information (unit code sample name sample volume as it is required by the actual quality management system) and measurement date in each detector log book and start the measurement A typical measuring time is about 1 day when using a 450 mm2 area detector
(c) Integrate the counts in the peaks corresponding to the alpha emitting tracers and analytes respectively The alpha spectra should be similar to the spectra illustrated in Fig IV 4 of Appendix IV The FWHM of alpha peaks should be in the range of 30ndash60 keV
(d) Spectrum analysis Integrate the channel counts in a region of interest (ROI) which has the width of about 4 x FWHM (about 3 x FWHM to the left and 1 x FWHM to the right when FWHM is about 30ndash60 keV) Integrate the channel counts in the same regions of interest (ROI) in the sample spectrum and in the blank spectrum then subtract them from the sample spectrum to give the net area of peaks for further calculation
Performing a reliable measurement knowing the background of the chamber and detector is essential moreover it is important to prepare a separate reagent blank Therefore the set of measurement always has to involve above the samples a background and a reagent blank If the quality of the determination has to be proved a reference material also should be part of the preparation series
942 Liquid scintillation spectrometry for determination of 210Pb
9421Source preparation for determination of counting efficiency of 210Pb
(a) Take 10 mL 2M HCl solution into a 50 mL beaker
(b) Add the 210Pb standard solution (10ndash15 Bq) and 30 mg Pb2+ carrier to the solution
(c) Load the solution onto a Sr resin column (3 g of Sr resin 100-150 microm) which has been preconditioned in advance with 100 mL 2M HCl
(d) Wash the column with 80 mL 2M HCl Combine the washing solution with the effluent to get a pure 210Bi fraction
13
(e) Rinse the column with 20 mL 2M HCl This last portion of 20 mL 2M HCl is discarded to avoid overlapping between the 210Bi and 210Po portions
(f) Wash the column with 25 mL 6M HNO3
(g) Elute Po with 60 mL 6M HNO3
(h) Elute Pb with 60 mL 6M HCl
(i) Evaporate the Bi Po and Pb fractions to dryness
(j) Dissolve each portion of 210Bi and 210Po in 1 mL 6M HNO3 and then transfer them into 20 mL polyethylene vials coated with PTFE (polytetrafluoroethylene)
(k) Mix the solution with 14 mL scintillation cocktail
(l) Evaporate Pb fraction three times with 2 mL 65 HNO3
(m) Dissolve the residue in 20 mL 1M HNO3
(n) Add 04 g oxalic acid while warming and stirring
(o) Adjust the pH to 3ndash5 with NH4OH to form a Pb-oxalate precipitate
(p) Filter the precipitate through a pre-weighed filter paper (diameter of 24 mm)
(q) Wash the precipitate three times with 1 mL water followed by 2 mL 80 ethanol
(r) Dry the precipitate in an oven at 40ndash50oC
(s) Cool and weigh the precipitate to determine the chemical recovery of lead
(t) Carefully transfer the Pb-oxalate precipitate into a 20 mL of liquid scintillation vial together with the filter
(u) Add 1 mL 6M HNO3 to the vial to dissolve the precipitate
(v) Mix with 14 mL of scintillation cocktail
(w) Set up windows for 210Pb and 210Bi and count the three vials (for 210Pb 210Bi and 210Po) in a liquid scintillation counter until the counting statistic uncertainty is less than 1
9422Optimum window setting for 210Pb
The activity concentration of 210Pb is determined by LSC adjusted to the low energy mode and low bias with double energetic window method [7] For the successful determination of this radionuclide two counting windows should be optimized because of the overlapping of the beta spectra of 210Pb and 210Bi The result of the optimization of counting region is shown in the Fig V 1 of Appendix V In this example the lower limit for the 210Pb energy (window A) is set at channel 115 to avoid the counts caused by chemiluminescence in the cocktail while the upper limit is set at channel 320 where the 210Pb peak ends The lower limit for the 210Bi energy region (window B) is set at channel 320 and the upper limit is set at channel 410 to avoid interference from the 210Po peak
9423 Counting efficiency of 210Pb
The efficiency of liquid scintillation for beta particles depends on the energy of the beta decay For most beta particles with a maximum beta-energy above 100 keV efficiency is high more than 90 For lower energy beta particles the efficiency is usually less and the real value depends on the degree of quenching in the sample
14
To determine the efficiency a known activity of 210Pb in equilibrium with its daughters has to be measured several times (it is practical to choose more than 10 times of counting for getting a good estimate of the uncertainty in the efficiency)
10 EXPRESSION OF RESULTS
101 Calculation of activities of relevant isotopes
1011 Calculation of the activity of 210Pb
10111 Calculation of the counting efficiency of 210Pb
The counting efficiency (ε) of 210Pb can be calculated by Eqs (1 2)
TsPb tPbTPbstdcal emaR
Z210
210210minusminus
minusminus
= λε ( 1 )
BAnBnA frrZ minus= ( 2 )
where
BBgBnAAgAn rrrrrr 00 minus=minus=
fAB Tailing factor (See Ch 10112)
Rcal Chemical recovery of making the calibration source (See Ch 10113)
10112 Calculation of the tailing factor
The 210Pb energy region (window A) is interfered with counts from ingrown 210Bi The interference is compensated for by using the ratio of counts in window A to those in window B in a pure 210Bi spectrum the so-called ldquotailing factorrdquo fAB The tailing factor is independent of the activity level of 210Bi in the sample but is dependent on the quenching level of the sample The quenching levels of the calibrant the sample and the reagent blank are necessary to keep constant within plusmn2 relative standard deviation The tailing factor can be calculated by the following formula
210
210
minus
minus=BistdBn
BistdAnBA r
rf (3)
where BBistdBgBistdBnABistdAgBistdAn rrrrrr 02102100210210 minus=minus= minusminusminusminus
10113 Chemical recoveries of Pb in calibration source and sample
The chemical recovery of lead in the calibration source preparation process is determined gravimetrically using Eq (4)
15
ccPb
calfcalofgcal mC
mmfR
minus
minus=
)( ( 4 )
When the amount of Pb in the sample is not negligible compared with that in the Pb carrier the sample Pb content should be allowed for in calculation of the chemical recovery of Pb The chemical recovery of Pb in the sample can be calculated by Eqs (5 6)
)(
)(
ssPbccPb
fofg
mCmC
mmfR
minusminus +minus
= ( 5 )
Mass ratio (fg) of atomic mass of Pb to molar mass of Pb-oxalate
oxalatePb
Pbg M
Mf
minus
= (6 )
10114 Calculation of the activity of 210Pb
The activity of 210Pb on the separation date can be calculated from the LSC measurement using the following equations
Rm
ffZa
s
PbPbsPb ε
minusminusminus = 32
210 (7)
22102
tPb
Pbef minusminusminus = λ ( 8 )
321013210
3 tPb
PbPbe
tf
minusminus= minus
minus λλ
(9 )
However if the time interval (t2) between the separation of 210Pb and the beginning of the measurement and the counting time of the sample (t3) are much smaller than the half life of 210Pb (222 y) f2-Pb f3-Pb u(f2-Pb) and u(f3-Pb) are negligible
1012 Calculation of the activity of 210Po
The activity of 210Po on the separation date is calculated according to the procedure detailed in IAEAAQ12 [8]
1013 Calculation of the activities of the U and Th isotopes
The ratio of the net counts of the tracer and analyte peak is used to calculate the activity of the analyte in the sample on the date of chemical separation taking into account the activity of the tracer solution the masses of the sample and the tracer used The activity of the analyte (as Bq(kg dry)-1) at the separation time is calculated by the following formula
16
TgT
g
s
TTTTT
nTs
nTs rr
rr
m
fmCfm
rm
rCa
0
0
minusminus
== (16)
The decay of the tracer between its reference date (from the certificate) and counting is taken into correction by fT as follows
sTT t
T ef λminus= (17)
The activity of analyte in the sample should be calculated back to the date of sample collection
teaa
λminus=0 (18)
The detector efficiency is not needed in isotope dilution alpha spectrometry for calculation of the activity of the analyte but is needed for calculation of the chemical recovery It is determined from the activity of the tracer added and the net counts in the corresponding peak as follows
sTT t
TT
nT emC
rR λ
εminus= (19)
The detector efficiency is determined by the calibration source prepared in a similar way as the analytes and using the same measurement conditions For analytes which are co-precipitated the calibration source also should be co-precipitated using the same conditions including filter diameter For analytes which are electrodeposited the calibration source should also be prepared by electrodeposition Efficiency determinations are typically performed and regularly checked in the frame of analytical quality control The efficiency can be calculated according to the following equation
cal
caln
A
r =ε (20)
Where
Rn cal net count rate of calibration source in respective ROI
Acal certified activity of the calibration source
1014 Calculation of the activity of 226Ra [9]
10141 Calculation of the chemical recovery of Ra
The chemical recovery is determined by using the peak of 217At at 70669 keV (Pα 0999 32) The ingrowth of 225Ac (T12 100 d) the daughter of 225Ra is directly associated with the short lived progenies 221Fr (T12 48 min) 217At (T12 323 ms) and 213Po (T12 37 micros) When the daughters are in equilibrium with 225Ra the 217At peak shows no overlap with descendants of natural isotopes of radium in the alpha spectrum (225Ac interferes with 224Ra 221Fr interferes with 220Rn) From the initial tracer activity AT (added 229Th225Ra) the maximum detectable count rate rnTmax is calculated by taking into account the decay of unsupported 225Ra after its separation from Th (tsTh-229) as well as the build-up of 225Ac (tsRa-225) in the following equation
17
225225
225)(max
229225225
minusminus
minusminusminus
minus= minusminusminus
RaAc
ActtTnT
sThsRaRaeArλλ
λε λ (21)
The chemical recovery R is calculated as ratio of the measured count rate rnT and theoretical value rnTmax
maxnT
nT
r
rR = (22)
10142 Calculation of activity of 226Ra
While AT is the activity of the 225Ra tracer after the separation from 229Th its activity at the beginning of the build-up of 225Ac is yielded as follows
)(225
225225 sAcRa ttTRa eAA minusminus
minusminusminus= λ
( 2 4 )
The activity of 225Ac in any time is given by
( )225225
)()(225225
225
225225225225
minusminus
minusminusminusminusminusminus
minus minusminus=
minusminusminusminus
RaAc
ttttRaAc
Ac
AcAcAcRa eeAA
λλλ λλ
(25)
Integrating over the counting period with tm as the start and tem as the end of the measurement results into the activity of 225Ac at tem
( )( )( ) ( )( )
minusminusminus
= minusminusminusminus minusminusminusminus
minusminusminus
minusminusminus
225225225225
225225225
225225225
1)( AcemRaAcmRa tttt
RamemRaAc
AcRaemmAc ee
ttAttA λλ
λλλλ
( ) ( )( )
minusminus minusminusminusminus minusminusminusminus
minus
225225225225
225
1AcemAcAcmAc tttt
Ac
ee λλ
λ (26)
Finally the activity concentration of 226Ra is the following
217
226225226 )(
minus
minusminusminus =
At
RaemmAcRa r
rttAA (27)
where
0
0226226226 t
n
tt
nr Ra
mem
RaRa
minusminusminus minus
minus= and
0
0217217217 t
n
tt
nr At
mem
AtAt
minusminusminus minus
minus=
102 Expression of combined uncertainties of relevant isotopes
According to the Guide to Expression of Uncertainty in Measurement [11 12] the combined uncertainty is described in detail and an example is calculated for each relevant radionuclide in Appendix VI
18
103 Decision threshold
In accordance with ISO 119292010 the decision threshold gives a decision on whether or not the physical effect quantified by the measurand is present
The decision threshold a is the non-negative measurand quantifying the physical effect of interest If the result a is below the decision threshold the result can not be attributed to the physical effect nevertheless it can not be concluded that it is absent If the physical effect is really absent the probability of taking the wrong decision that the effect is present is equal to the specified probability of α (the error of first kind often chosen 005 and moreover α=β where β is the error of second kind then k1-α=k1-β=165) Any of the determined primary measurement result is only significant for the true value of the measurand to differ from zero if it is larger than the decision threshold given here
a=k1-αu(0) where u(0) is the uncertainty associated to the non-negative measurand uncertainty of decision threshold itself (with other words it can be estimated as uncertainty associated to slightly higher values than background or reagent blank depending on the procedure) and can be quantified here as
20
0
03
01)0(
t
n
tt
n
Rmu
s
+=ε
(28)
104 Detection limit
In accordance with ISO 119292010 the detection limit indicates the smallest true value of the measurand which can be still detected with the applied procedure this gives a decision on whether or not the measurement procedure satisfies the requirements and is therefore suitable for the intended measurement purpose In order to find out whether a procedure is suitable for the purpose the detection limit is compared with the specified guideline value of the measurand
The detection limit a is the smallest true value of the measurand for which the probability of the wrong assumption that the physical effect is absent does not exceed the probability β (error of the second kind) The detection limit is obtained as the smallest solution of the following equation
a=a+k1-β(a) where a ge a (29)
Eq (29) is an implicit equation which can be calculated by iteration As a starting approximation a1=3a can be chosen in most cases the iteration converges and the linear interpolation with approximation of a=(k1-α+k1-β)u(a) leads to the approximation
)0()( 221
21
2 ukkqqa αβ minusminus minus++= (30)
with [ ]
minus+= minusminus )0()(
2
1)0( 2
12
1
21
1 uaua
kukq a
β (31)
If α=β than k1-α=k1-β=k a=2q follows
19
[ ])0()()0(2 21
2
1
2 uau
a
kuka minus+= (32)
Where α is the probability of the error of first kind the probability of rejecting a hypothesis if it is true and β is the probability of the error of second kind the probability of accepting a hypothesis if it is false
The detection threshold and limit of the isotopes in the applied procedure are described in Table VII 1 of Appendix VII
The difference between using the decision threshold and using the detection limit is that the measured values are to be compared with the decision threshold whereas the detection limit is to be compared with the guideline value (guideline value corresponds to scientific legal or other requirements for which the measuring procedure intended to assess)
11 VALIDATION OF THE PROCEDURE
The procedure was validated with an IAEA reference material IAEA-434 The material was initially characterized at IAEA Environment Laboratories in Seibersdorf during the feasibility study phase Then the characterization of the material took place within the interlaboratory comparison piloted by IAEA Environment Laboratories in Seibersdorf in cooperation with the Consultative Committee on Ionization Radiation (CCRI) of the International Bureau des Poids et Mesure (PIBM) The results reported in this comparison were used to derive the property values of the measurands of interest The IAEA-434 reference material [12] was collected from a processing plant located in Gdansk (Poland) in 2003 The matrix composition is CaSO4middot2H2O (96) P2O5 (1-2) F total (12) SiO2 (1) Al2O3 (02) The property values of all radionuclides of IAEA 434 were established on the basis of a robust approach proposed by DL Duewer [13] and the Mixture Model median (MM-median) of the analytical results reported by the expert laboratories was calculated To estimate the standard uncertainty associated with the property value the MM-median based standard deviation was calculated from the span of the central 50 of the MM probability density function The validation results of the procedure are shown in Tables VIII 1 and VIII 2 Figs VIII 1ndashVIII 7 of Appendix VIII 111 Trueness of the method
The relative bias of the method is calculated by the following formula
100() timesminus=C
CXδ (34)
112 Precision of the method
The precision index ( PI() ) is calculated according to the following formulas
100)()(
()2
2
2
2
times+=X
Xu
C
CuPI (35)
20
113 Repeatability limit
The repeatability limit is estimated by analyzing five subsamples from the same bottle of the IAEA-434 reference material for the relevant radionuclides investigating the repeatability conditions instrument analyst shortest time etc The repeatability limit is calculated by the following formula
rL Sr 82= (36)
114 Reproducibility limit
The reproducibility limit is also estimated by analyzing the IAEA-434 reference material from ten duplicates samples were taken from ten randomly selected packing unit with at least one parameter being changed in the analytical system (analyst analysis date instrument etc) The reproducibility limit is calculated by the following formula
RL SR 82= (37)
115 Outlier test
The presence of individual values that appear to be inconsistent with all other laboratories or values may cause some problems during the final evaluation of data According to ISO 5725-2 an outlier test should be performed before the calculation of repeatability and reproducibility The analysis includes a systematic application of a statistical test of outliers a great variety are available which could be used for the purposes of this part of ISOIEC 17025 Usually the graphical consistency technique or the numerical outlier test are applied Cohranrsquos test of variabilities should be applied first and then any necessary action should be taken Grubbrsquos test is primarily a test of in between laboratory variability
116 Acceptance criteria
The method can be accepted if
PI()lt 25
LRltδ ( 3 8 )
According to these criteria the method performs well as the Table VIII 1 of Appendix VIII shows
12 TEST REPORT
The test report shall conform to ISOIEC 17025 requirements and shall contain the following information
bull a title (test report calibration report reference material production etc)
bull the name and address of the laboratory and location where any part of the test or calibration or production of reference material etc were carried out
bull unique identification of the report on each page with numbering of pages
21
bull analysis request code
bull reference to the measurement method used
bull sampling date (if available)
bull sample description
bull sample code or identification number
bull date of the separation of analyte
bull applied tracers with their reference dates and activity values with the code of their certificate
bull the results with units of measurement and associated uncertainty value expressed in the same unit as the result
bull date to which the test result has been corrected (corrected to the sampling date or separation time dd-mm-yyyy)
bull responsible person (with accessibility)
22
REFERENCES
[1] FEDERAL REGISTER National emission standards for hazardous air pollutants 57 107 (1992) 23305-23320
[2] RUTHERFORD PM DUDAS MJ AROCENA JM Heterogeneous distribution of radionuclides barium and strontium in phosphogypsum by-product Sci Total Environ 180 (1996) 201-209
[3] NATIONAL COUNCIL ON RADIATION PROTECTION AND MEASUREMENTS Evaluation of Occupational and Environmental Exposures to Radon and Radon Daughters in the United States NCRP Report 78 (1984)
[4] MARTIN P HANCOCK GJ Routine analysis of naturally occurring radionuclides in environmental samples by alpha-particle spectrometry Supervising Scientist Report 180 (2004) httpwwwenvironmentgovaussdpublicationsssr180html
[5] INTERNATIONAL ATOMIC ENERGY AGENCY Reference Material IAEA-434 Naturally Occurring Radionuclides in Phosphogypsum IAEA Analytical Quality in Nuclear Applications Series No 17 IAEAAQ17 IAEA Vienna (2010)
[6] MEDLEY P BOLLHOumlFER A ILES M RYAN B MARTIN P Barium sulfate method for radium-226 analysis by alpha spectrometry Environmental Research Institute of the Supervising Scientist internal report 501 (2005)
[7] VAJDA N LAROSA J ZEISLER R DANESI P KIS-BENEDEK G A Novel Technique for the Simultaneous Determination of 210Pb and 210Po using a Crown Ether J Environ Radioactivity 37 (1997) 355-372
[8] INTERNATIONAL ATOMIC ENERGY AGENCY A Procedure for the Determination of Po-210 in Water Samples by Alpha Spectrometry IAEA Analytical Quality in Nuclear Applications Series No 12 IAEAAQ12 IAEA Vienna (2009)
[9] GUOGANG J TORRI G INNOCENZI P OZONE R Di LULLO A Determination of radium isotopes in mineral and environmental water samples by alpha-spectrometry J of Radioanalytical and Nuclear Chemistry 267 3 (2005) 505-514
[10] EURACHEMCITAC Guide Quantifying uncertainty in analytical measurement 2nd Ed(2000)
[11] INTERNATIONAL ATOMIC ENERGY AGENCY Quantifying Uncertainty in Nuclear Analytical Measurements IAEA-TECDOC-1401 IAEA Vienna (2004)
[12] SHAKHASHIRO A SANSONE U Technically Enhanced Naturally Occurring Radionuclides (TENORM) in Phosphogypsum The Interlaboratory Comparison CCRI(II)07-35 Metrologia (2009)
[13] DUEWER DL A Robust Approach for the Determination of CCQM Key Comparison Reference Values and Uncertainties Working document CCQM04-15 BIPM wwwbipminfoccCCQMAllowed10CCQM04-15pdf (2004)
23
[14] Monographie BIPM-5 Vol 1ndashMonographie BIPM-5 Vol 5
httpwwwnucleideorg Decay Data Evaluation Project (DDEP) accessed in October 2010
[15] NuDat 25 (Database at the US NNDC) httpwww-ndsiaeaorg accessed in October 2010
[16] HORWITZ et al A Novel Strontium-Selective Extraction Chromatographic Resin Solvent Extraction amp Ion Exchange 10 (1992) 313
[17] HORWITZ et al Extraction Chromatography of Actinides and Selected Fission Products Principles and Achievement of Selectivity presented at International Workshop on the Application of Extraction Chromatography in Radionuclide Measurement IRMM Geel 1998
[18] HORWITZ et al Separation and Preconcentration of Actinides by Extraction Chromatography Using a Supported Liquid Anion Exchanger Application to the Characterization of High-Level Nuclear Waste Solutions Analytica Chimica Acta 310 (1995) 63-78
[19] HORWITZ et al Separation and Preconcentration of Uranium from Acidic Media by Extraction Chromatography Analytica Chimica Acta 266 (1992) 25-37
[20] C-K KIM MARTIN P FAJGELJ A Quantification of measurement uncertainty in the sequential determination of 210Pb and 210Po by liquid scintillation counting and alpha particle spectrometry Accreditation and Quality Assurance 13 12 (2008) 691-702
[21] J KRAGTEN Calculating Standard Deviation and Confidence Intervals with a Universally Applicable Spreadsheet Technique Analyst 119 (1994) 2161ndash2165
24
APPENDIX I NUCLEAR DATA OF RELEVANT RADIONUCLIDES AND DECAY CHAINS OF U
AND Th SERIES
TABLE I 1 NUCLEAR DATA OF RELEVANT RADIONUCLIDES [14]
Radionuclide Half-life Disintegration modes
E (MeV) Probability ()
225Ac 100(1) d α 5580 5(14) 095(4)
α 5599 3(14) 0114(7)
α 5609 0(14) 109(5)
α 5637 3(14) 416(23)
α 5682 2(14) 131(4)
α 5686 4(14) 0021(14)
α 5723 1(14) 203(23)
α 5730 5(14) 16(3)
α 5731 6(14) 124(10)
α 5731 9(17) 90(5)
α 5797 7(14) 62(9)
α 5793 1(21) 189(20)
α 5804 2(14) 03
α 5829 6(14) 524(24)
217At 323(4) x 10-3 s α 6484 7(16) 0016 7(8)
α 6813 8(16) 0038 4(15)
α 7066 9(16) 99932(3)
133Ba 10540(6) y γ 0053 162 2(6) 214(3)
γ 0079 614 2(12) 265(5)
γ 0080 997 9(11) 329(3)
γ 0276 398 9(12) 716(5)
γ 0302 850 8(5) 1834(13)
γ 0356 012 9(7) 6205(19)
γ 0383 848 5(12) 894(6)
210Bi 5012(5) d β 1162 1(8) 99999 86(2)
212Bi 6054(6) min β 0633(2) 190(4)
β 0741(2) 145(29)
β 1527(2) 458(21)
β 2254(2) 5523(21)
α 6050 92(4) 251(1)
α 6090 02(4) 97(1)
221Fr 479(2) min α 6126 3(15) 151(2)
α 6243(2) 134(7)
α 6341 0(13) 828(2)
TABLE I 1 NUCLEAR DATA OF RELEVANT RADIONUCLIDES [14] (cont)
25
Radionuclide Half-life Disintegration modes
E (MeV) Probability ()
210Pb 2223(12) y β 0017 0(5) 802(13)
β 0063 5(5) 198(13)
γ 0046 539(1) 4252(40)
208Po 2898(2) y α 5114 9(14) 99995 8(4)
α 4220(15) 24(7)x10-4
209Po 115(13) y α 4885(2) 198(32)
α 4883(2) 792(32)
α 4622(5) 0548(7)
210Po 138376 3(17) d α 5304 33(7) 99998 76
α 4516 66(9) 0001 24(4)
213Po 370(5) x 10-6 s α 8375 9(25) 99995 0(5)
216Po 0150(5) s α 6778 6(5) 99998 1(3)
α 5988 6(10) 0001 9(3)
218Po 3094(6) min α 6002 35(9) 99976 9(32)
223Ra 1143(5) d α 5747 0(4) 900(20)
α 5716 23(29) 516(13)
α 5606 73(30) 252(5)
α 5539 80(90) 900(20)
224Ra 3627(7) d α 5448 81(16) 526(7)
α 5685 50(15) 9472(7)
γ 0240 986(6) 412(4)
225Ra 1482(19)d β 0316(5) 688(20)
β 0356(5) 312(20)
γ 0040 09(5) 300(7)
226Ra 1 600(7) y α 4601(1) 595(4)
α 4784 34(25) 94038(40)
228Ra 575(4) y β 00127(7) 30(10)
β 00256(7) 87(9)
β 00391(7) 49(10)
β 00395(7) 12(10)
220Rn 558(3) s α 5748 46(14) 0118(15)
α 6288 22(10) 99882(15)
222Rn 3823 2(8) d α 5489 48(30) 9992(1)
228 Th 69860(23) d α 5176 89(23) 020(2)
α 5211 08(22) 038(3)
α 5340 38(22) 262(2)
α 5423 28(22) 732(2)
TABEL I 1 NUCLEAR DATA OF RELEVANT RADIONUCLIDES [14] (cont)
26
Radionuclide Half-life Disintegration
modes E (MeV) Probability ()
229 Th 7 340(160) y α 5053(2) 660(10)
α 4978 5(12) 317(4)
α 4967 5(12) 597(6)
α 4901 0(12) 1020(8)
α 4845 3(12) 5620(20)
α 4814 6(12) 930(8)
230 Th 7538(30) x 104 y α 4687 0(15) 763(3)
α 4620 5(15) 234(10)
232 Th 1402(6) x 109 y α 3810 0(14) 0068(20)
α 3948 5(14) 210(13)
α 4011 2(14) 789(13)
234 Th 2410(3) d β 0105(10) 65(7)
β 0106(10) 141(12)
β 0198(10) 778(15)
γ 0063 30(2) 375(8)
232U 706(11) y α 5263 48(9) 306(6)
α 5320 24(9) 691(6)
233U 1592(2) x 105 y α 4824 2(12) 843(6)
α 4783 5(12) 132
234U 2455(6) x 105 y α 4603 5(7) 0210(2)
α 4722 4(7) 2842(2)
α 4774 6(7) 7137(2)
235U 704(1) x 106 y α 4322(4) 333(6)
α 4397 8(13) 5719(20)
α 4414 9(5) 301(16)
α 4502 4(7) 128(5)
α 4556 0(4) 379(6)
α 4596 4(13) 474(6)
236U 2343(6) x 107 y α 4445(5) 261(40)
α 4494(3) 738(40)
238U 4468(5) x 109 y α 4038(5) 013(3)
α 4151(5) 2233(50)
α 4198(3) 7754(50)
Emax for beta emitting radioisotopes
Data were taken from [15]
27
FIG I 1 Decay chain of 238U [4]
FIG I 2 Decay chain of 232Th [4]
28
APPENDIX II FLOW CHART FOR SEQUENTIAL SEPARATION OF 210Po 210Pb Th U AND 226Ra
IN PHOSPHOGYPSUM
29
APPENDIX III PROPERTIES OF RESINS
III1 Sr resin
FIG III 1 Structure of the Sr resin (wwweichromcom)
FIG III 2 Capacity factor of Sr resin in nitric acid (wwweichromcom) [16]
30
FIG III 3 Capacity factor of Sr resin in nitric acid (wwweichromcom) [17]
III2 TEVA resin
FIG III 4 Structure of the TEVA resin (wwweichromcom)
31
FIG III 5 Capacity factor of TEVA resin in nitric acid and hydrochloric acid (wwweichromcom) [18]
III3 UTEVA resin
FIG III 6 Structure of the UTEVA resin (wwweichromcom)
32
FIG III 7 Capacity factor of UTEVA resin in nitric acid and hydrochloric acid (wwweichromcom) [19]
33
APPENDIX IV ALPHA SPECTRA OF ANALYTES
FIG IV 1 Alpha spectrum of Po isotopes
FIG IV 2 Alpha spectrum of Th isotopes in phosphogypsum (with progeny)
228Th is resulted from 232U tracer spiked in the sample
34
FIG IV 3 Alpha spectrum of U isotopes
FIG IV 4 Alpha spectrum of 226Ra and its progeny (spiked with 225Ra)
35
FIG IV 5 Overlapping alpha spectra of U and Po isotopes
FIG IV 6 Overlapping alpha spectra of U and Th (with progeny) isotopes
36
APPENDIX V LIQUIDE SCINTILLATION SPECTRA
a)
b)
A window
(115-320 ch)
B window
(320 -410 ch)
210Po
210Pb
210Bi
210Bi
Co
unts
Ch
ann
elC
oun
tsC
han
nel
Channel number
a)
b)
A window
(115-320 ch)
B window
(320 -410 ch)
210Po
210Pb
210Bi
210Bi
Co
unts
Ch
ann
elC
oun
tsC
han
nel
Channel number
FIG V 1 Typical liquid scintillation spectra of beta-emitting 210Pb and 210Bi and alpha emitting 210Po (calibration sources) a) 210Pb 210Bi and 210Po spectra
b) pure 210Bi spectrum
37
APPENDIX VI CALCULATION OF THE COMBINED UNCERTAINTY
OF THE ACTIVITIES OF THE ANALYTES ON SAMPLING DATE
VI1 Uncertainty of the 210Pb result [20]
VI11 Uncertainty of counting efficiency of 210Pb
2
2
2
2
2210
2
210
2210
222
)()()()()()( )( PbTPbT
calcal
stdPbstdPb
Pbb mum
RuR
aua
utZuZ
u
minus+
minus+
minus++
= minusminus
minusεεελεεε (VI-1)
2
222
2 )()()()()( (Z) BABnBnBAAn furrufruu minus+minus+= (VI-2)
20
2 )()()( AAgAn rururu += (VI-3)
20
2 )()()( BBgBn rururu += (VI-4)
VI12 Uncertainty of the tailing factor fAB
The uncertainty of the tailing factor fAB is calculated according to following equations
2
210
210
2
210
210
)()()(
+
=
minus
minus
minus
minus
BicalnB
BicalnB
BicalAn
BicalAnBABA r
ru
r
ruffu (VI-5)
20
2210210 )()()( ABicalAgBicalAn rururu += minusminus (VI-6)
20
2210210 )()()( BBicalBgBicalBn rururu += minusminus (VI-7)
The uncertainty of counting efficiency for 210Pb can be calculated by Eq (VI-8)
2
2
2
2
2210
2
210
2210
222
)()()()()()( )( PbTPbT
calcal
stdPbstdPb
Pbb mum
RuR
aua
utZuZ
u
minus+
minus+
minus++
= minusminus
minusεεελεεε (VI-8)
2
222
2 )()()()()( (Z) BABnBnBAAn furrufruu minus+minus+= (VI-9)
20
2 )()()( AAgAn rururu += (VI-10)
20
2 )()()( BBgBn rururu += (VI-11)
38
VI13 Uncertainty of chemical recovery of Pb
Uncertainty of chemical recoveries of Pb in calibration source
minusminus+
minus+
= 2
2
2
2
2
2
cal )()(
)()(
)( )(R calfcalfcalof
calcalof
calfcalof
calg
g
cal mumm
Rmu
mm
Rfu
f
Ru
2
1
2
2
2
2
)()(
)()(
minus+
minus+
minus
minusminus
minusc
ccPb
cPbcalcPb
ccPb
ccal mumC
CRCu
mC
mR (VI-12)
The uncertainty of chemical recovery of Pb in the sample can be calculated
minusminus+
minus+
= 2
2
2
2
2
2
)()(
)()(
)( (R) ffof
offof
gg
mumm
Rmu
mm
Rfu
f
Ru
2
2
2
2
)()(
)()( c
ssPbccPb
cPbcPb
ssPbccPb
c mumCmC
CRCu
mCmC
mR
+minus+
+minus+
minusminus
minusminus
minusminus
2
1
2
2
2
2
)()(
)()(
+minus+
+minus+
minusminus
minusminus
minusminuss
ssPbccPb
sPbsPb
ssPbccPb
s mumCmC
CRCu
mCmC
mR (VI-13)
VI14 Uncertainty of mass ratio
The uncertainty of the mass ratio (fg) of atomic mass of Pb to molar mass of Pb-oxalate is calculated using the equations below
22
M Pb)(
+
=
minus
minus
oxalatePb
M
Pbgg M
u
M
uffu oxalatePb (VI-14)
The uncertainty of the molar mass of lead oxalate u(MPb-oxalate) can be derived by combining standard uncertainties in atomic masses of its constituents as shown in Table VI 1
39
TABLE VI 1 STANDARD UNCERTAINTIES OF ATOMIC WEIGHT AND THE GRAVIMETRIC FACTOR fg
Element Atomic weight
(gmol-1)
Quoted uncertainty (gmol-1)
Conversion factor
Standard uncertainty (gmol-1)
Mass ratio of atomic mass of Pb to
molar mass of Pb-oxalate
Uncertainty ofatomic mass
of Pb to molar mass of
Pb-oxalate
Pb 207215 2 0000 15 3 0000 087 0701 9 0000 002
C 12010 7 0000 8 3 0000 46
O 15999 4 0000 3 3 0000 17
VI15 Combined uncertainty of activity of 210Pb
The combined uncertainty of the 210Pb activity is calculated from Eq (VI-15)
minus+
minus+
minus+
= minusminusminusminus 2
2
2102
2
2102
2
210
2
2
2101 )()()()()( s
d
sPb
BA
sPb
nBnB
sPb
BAnA
sPb
Pbc mum
afu
Z
arru
Z
afru
Z
aau
2
1
23
2
3
21022
2
2
2102
2
2102
2
210 )()()()(
+
+
minus+
minus+ minus
minus
minusminus
minus
minusminusminusPb
Pb
sPbPb
Pb
sPbsPbsPb fuf
afu
f
aRu
R
au
aε
ε (VI-15)
)()( 210222 minusminusminus = PbPbPb utffu λ (VI-16)
210
210321033
)(
11)(
3210
3210
minus
minusminus
minus
minusminusminus
minusminus=
minus
minus
Pb
Pbt
t
PbPbPb
u
e
etffu
Pb
Pb
λλλ λ
λ
(VI-17)
However if the time interval (t2) between the separation of 210Pb and the beginning of the measurement and the counting time of the sample (t3) are much smaller than the half life of 210Pb f2-Pb f3-Pb u(f2-Pb) and u(f3-Pb) are negligible The uncertainties associated to components mentioned above can be calculated as follows
0
0
3
)(t
r
t
rru
Po
gn +=
minus
(VI-18)
0
0
3
)(t
r
t
rru t
Po
tgtn +=
minus
(VI-19)
minus+
+
= minusminusminus
minus2
2
2102
2
2102
2
210210 )()()( )( tn
tn
sPo
nn
sPo
TT
sPo
sPo rur
aru
r
aAu
A
aau
2
2
21022
2
2
2102
2
2102
2
210)()()()( T
T
sPo
PoPo
sPo
TT
sPo
ss
sPofu
f
afu
f
amu
m
amu
m
a
+
+
+
minus+ minus
minusminus
minusminusminus
40
2
1
3
2
3
210 )(
+ minus
minus
minusPo
Po
sPo fuf
a (VI-20)
)()( TTTt utffu λ= (VI-21)
)()( 210222 minusminusminusminus = PoPoPoPo utffu λ (VI-22)
210
210321033
)(
11)(
3210
3210
minus
minusminus
minus
minusminusminus
minusminus=
minus
minus
Po
Pot
t
PoPoPo
u
e
etffu
Po
Po
λλλ λ
λ (VI-23)
VI16 Combined uncertainty of activity of 210Po
The uncertainty of the activity of 210Po on the separation date is calculated according to IAEAAQ12 procedure [8]
VI2 Uncertainty of other alpha emitting isotopes
The same formulas are used to calculate the combined uncertainties as equations that are used for calculation of the activity of alpha emitting analytes at the separation time and the sampling date as well as the chemical recovery and counting efficiency These formulas have to be applied in the spreadsheet approach for calculating the combined uncertainties knowing the standard uncertainty of each component VI3 Spreadsheet approach
For the quantifying the uncertainties the spreadsheet technique [21] was used which could be summarised as follows and showed in the Fig VI 1
bull Calculate function y using parameter xj
y=f(x1x2xj xn) (VI-24)
bull recalculate the same function n times increasing xj to xj+dxj (dxj standard deviation) and keeping the remaining parameters constant
y=f(x1x2xj+dxj xn) (VI-25)
bull the uncertainty on the function dy is the square root of the sum of squares
( )sum minus=n
jyydy1
2 (VI-26)
bull The individual variance contribution fj is
( )( )sum minus
minus=
n
j
jj
yy
yyf
1
2
2
(VI-27)
41
FIG VI 1 Spreadsheet approach for quantifying the uncertainty of the measurement
The results are summarised for the individual isotopes in the Tables VI 2ndashVI 9 and the results of the individual analysis with their uncertainties are shown in the Figs VI 3ndashVI 9 The detailed study about the usual contributors of uncertainty in the nuclear analytical techniques could be found in the IAEA-TECDOC-1401 [11] TABLE VI 2 AN EXAMPLE OF QUANTIFYING UNCERTAINTIES OF 210Po RESULT
Symbol unit Value of variable
Uncertainty Conversion factor to standard uncertainty
Standard uncertainty
Contribution to combined
uncertainty ()
m g 0508 9 0007 3 3 0004 2 010
rgt s-1 0197 0075 1 0075 361
r0t s-1 0000 017 0000 034 1 0000 034 0000 014
rg s-1 0081 0029 1 0029 6352
r0 s-1 0000 034 0000 033 1 0000 033 0000 08
at Bq 0829 0019 1 0019 0252
λt d-1 0000 019 0000 013 1 0000 013 negligible
λPo d-1 0005 72 x 10-9 1 72x10-9 negligible
ft 0982 14 0000 43 1 0000 43 0000 091
f2-Po 1005 73 x 10-9 1 73x10-9 negligible
f3-Po 1005 5 18 x 10-8 1 18 x10-8 negligible
aPo1 Bqmiddotkg-1 672 94
contribution is less than 1 x 10⁻⁵
TABLE VI 3 AN EXAMPLE OF QUANTIFYING UNCERTAINTIES OF EFFICIENCY OF 210Pb
Symbol unit Value of variable
Uncertainty
Conversion factor to standard
uncertainty
Standard uncertainty
Contribution to combined
uncertainty ()
mvial g 14936 35 0000 1 3 0000 17 0004 8
42
Symbol unit Value of variable
Uncertainty
Conversion factor to standard
uncertainty
Standard uncertainty
Contribution to combined
uncertainty ()
mvial+carrsol g 16036 54 0000 1 3 0000 17 0004 8
cPb g g-1 0027 42 0000 021 1 0000 021 011
mvial g 16036 72 0000 10 3 0000 17 0004 8
mvial+std g 17132 6 0000 10 3 0000 17 0004 8
astd Bq 1245 0189 1 0189 805
fgravimetry 0701 85 0000 41 1 0000 41 0066
mfilter g 0036 54 0000 10 3 0000 17 42
mfilter+Pb-precipitate g 0073 77 0000 10 3 0000 17 41
rA s-1 7362 0041 1 0041 76
rA0 s-1 0029 5 0003 1 0002 7 0035
rB s-1 0416 0 0011 1 0011 060
rB0 s-1 0011 7 0002 1 0002 2 0024
fAB 1049 0023 1 0023 040
t12 Pb d 814508 7305 1 731 23
tmeas-ref d 4 532 -
ε 0859 7 0015 3
43
TABLE VI 4 AN EXAMPLE OF QUANTIFYING UNCERTAINTIES OF 210Pb RESULT
Symbol unit Value of variable
Uncertainty Conversion factor to standard uncertainty
Standard uncertainty
Contribution to combined
uncertainty ()
ms g 0508 9 0007 3 3 0004 2 03
rgA s-1 0283 0035 1 0035 883
r0A s-1 0011 7 0002 2 1 0002 2 03
rgB s-1 0031 0009 1 0009 58
r0B s-1 0005 6 0002 3 1 0002 3 04
Ζ s-1 0245 1 0032 7 1 0032 7 -
fAB 1015 3 0012 9 1 0012 9 001
ε 0859 7 0015 3 1 0015 3 13
R 0858 8 0025 3 1 0077 2 35
aPb1 Bqmiddotkg-1 652 12
TABLE VI 5 AN EXAMPLE OF QUANTIFYING UNCERTAINTIES OF 234U RESULT
Symbol unit Value of variable
Uncertainty Conversion factor to standard uncertainty
Standard uncertainty
Contribution to combined
uncertainty ()
ms g 0508 9 0007 3 3 0004 2 003
rgt s-1 0021 78 0008 01 1 0008 369
r0t s-1 0000 030 0000 022 1 0000 022 0000 5
rg s-1 0016 15 0005 90 1 0006 628
r0 s-1 0000 016 0000 022 1 0000 022 0000 1
at Bq 0088 35 0002 10 1 0002 01 029
aU-234_1 Bqmiddotkg-1 129 3
TABLE VI 6 AN EXAMPLE OF QUANTIFYING UNCERTAINTIES OF 238U RESULT
Symbol unit Value of variable
Uncertainty Conversion factor to standard uncertainty
Standard uncertainty
Contribution to combined
uncertainty ()
ms g 0508 9 0007 3 3 0004 2 003
rgt s-1 0021 78 0008 01 1 0008 353
r0t s-1 0000 030 0000 022 1 0000 022 0000 5
rg s-1 0015 61 0005 67 1 0006 644
r0 s-1 0000 009 0000 008 1 0000 008 0000 1
at Bq 0088 35 0002 10 1 0002 1 028
aU-238_1 Bqmiddotkg-1 124 3
44
TABLE VI 7 AN EXAMPLE OF QUANTIFYING UNCERTAINTIES OF 230Th RESULT
Symbol unit Value of variable
Uncertainty Conversion factor to standard uncertainty
Standard uncertainty
Contribution to combined
uncertainty ()
ms g 0508 9 0007 3 3 0004 2 005
rgt s-1 0022 63 0006 44 1 0006 387
r0t s-1 0000 077 0000 063 1 0000 063 0006 1
rg s-1 0028 38 0007 90 1 0008 608
r0 s-1 0000 012 0000 010 1 0000 010 0000 1
at Bq 0090 03 0002 30 1 0002 303 051
aTh-230_1 Bqmiddotkg-1 223 9
TABLE VI 8 AN EXAMPLE OF QUANTIFYING UNCERTAINTIES OF 232Th RESULT
Symbol unit Value of variable
Uncertainty Conversion factor to standard uncertainty
Standard uncertainty
Contribution to combined
uncertainty ()
ms g 0508 9 0007 3 3 0004 2 004
rgt s-1 0022 63 0006 44 1 0006 265
r0t s-1 0000 077 0000 063 1 0000 063 0004 2
rg s-1 0000 28 0000 10 1 0000 1 727
r0 s-1 0000 011 0000 008 1 0000 008 048
at Bq 0090 03 0002 30 1 0002 3 035
aTh-232_1 Bqmiddotkg-1 21 009
TABLE VI 9 AN EXAMPLE OF QUANTIFYING UNCERTAINTIES OF 226Ra RESULT
Symbol unit Value of variable
Uncertainty Conversion factor
to standard uncertainty
Standard uncertainty
Contribution to combined
uncertainty ()
ms g 0508 9 0007 3 3 0004 2 003
rgt s-1 0043 10 0025 05 1 0025 05 603
r0t s-1 0000 111 0000 128 1 0000 128 0004
rg s-1 0063 32 0018 78 1 0018 78 393
r0 s-1 0000 070 015 0000 070 013 1 0000 070 013 0000 5
at Ra-225 Bq 0779 50 0022 53 1 0022 53 04
λAc225 d-1 0069 315 0000 624 1 0000 624 0000 02
λRa225 d-1 0046 520 0000 693 1 0000 693 008
t1-t0 d 337
aRa-226_1 Bqmiddotkg-1 766 39
45
APPENDIX VII DETECTION THRESHOLD AND LIMIT OF THE APPLIED PROCEDURE
TABLE VII 1 TYPICAL DECISION THRESHOLD AND DETECTION LIMIT FOR RELEVANT ISOTOPES
Symbol unit 210Pb 210Po 234U 238U 230 Th 232 Th 226Ra
k 165 165 165 165 165 165 165
m kg 0000 5 0000 5 0000 5 0000 5 0000 5 0000 5 0000 5
ε 086 031 026 026 035 035 025
R 086 073 094 094 068 068 061
n0 52 16 4 4 6 6 28
Tg s 36 000 98 899 343 024 343 024 277 345 277 345 124 984
t0 s 35 542 548 190 512 901 512 901 559 286 559 286 446 755
a Bqmiddotkg-1 13 036 009 009 012 012 068
a1 Bqmiddotkg-1 38 11 028 028 036 036 205
u2(0) Bq2middotkg-2 29 015 0008 4 0008 4 0006 5 0004 7 078
u2(a1) Bq2middotkg-2 23 041 0059 0025 0028 0052 204
a Bqmiddotkg-1 24 12 052 019 018 019 43
46
APPENDIX VIII VALIDATION TEST RESULTS OF THE PROCEDURE
TABLE VIII 1 VALIDATION RESULTS FOR RELEVANT RADIONUCLIDES
Parameters 210Po 210Pb 234U 238U 230Th 226Ra
C Bq kg-1 680 680 120 120 211 780
X Bq kg-1 653 659 127 123 221 793
u(C) Bq kg-1 58 58 9 11 9 62
u(X ) Bq kg-1 23 22 5 5 10 35
δ() -40 -31 58 25 47 17
rL Bq kg-1 106 102 48 47 62 498
RL Bq kg-1 237 454 59 53 89 707
PI() 92 92 85 100 62 91
TABLE VIII 2 ANALYSIS OF VARIANCE (ANOVA) FOR 210Po 210Pb 238U 230Th AND 226Ra IN PHOSPHOGYPSUM
Nuclide SSwb SSbb MSwb MSbb Swb
(as CV)
Sbb
(as CV)
210Po 124 62 151 79 312 1687 271 254
210Pb 8385 197 54 210 2195 220 302
238U 314 386 785 429 227 215
230Th 2176 1598 544 178 334 225
226Ra 412 686 137 858 121 054
SSwb sum of squares within bottles
SSbb sum of squares between bottles
MSwb mean of squares within bottles
MSbb mean of squares between bottles
Swb standard deviation as percent of covalent variance within bottles
Sbb standard deviation as percent of covalent variance between bottles
47
550
600
650
700
750
0 10 20 30 40 50
Samples
Act
ivity
of
21
0 Pb
in th
e sa
mp
le (
Bq
kg
dry
)
Mean1σ
-2σ
-1σ
3σ
2σ
-3σ
FIG VIII 1 210Pb results with associated uncertainties
550
600
650
700
750
0 10 20 30 40 50Samples
Act
ivity
of
21
0 Po
in t
he s
ampl
e (B
qkg
dry
)
Mean
1σ
-1σ
3σ
2σ
-3σ-2σ
FIG VIII 2 210Po results with associated uncertainties
48
110
115
120
125
130
135
140
0 10 20 30 40 50
Samples
Act
ivity
of
238
U in
the
sam
ple
(B
qkg
dry
)
Mean
1σ
-1σ
3σ
2σ
-3σ
-2σ
FIG VIII 3 238U results with associated uncertainties
105
110
115
120
125
130
135
140
145
150
0 10 20 30 40 50
Samples
Act
ivity
of
23
4 U in
the
sa
mpl
e (B
qkg
dry
)
Mean1σ
-2σ-1σ
3σ2σ
-3σ
FIG VIII 4 234U results with associated uncertainties
49
190
200
210
220
230
240
250
0 5 10 15 20 25 30 35 40 45 50
Samples
Act
ivity
of
23
0 Th
in th
e s
am
ple
(B
qk
g d
ry)
2σ
3σ
1σ
-1σ
-2σ
-3σ
Mean
FIG VIII 5 230 Th results with associated uncertainties
05
10
15
20
25
30
35
40
0 10 20 30 40 50
Samples
Act
ivity
of
23
2 Th
in th
e sa
mp
le (
Bq
kg
dry
)
Mean
1σ
-2σ
-1σ
3σ
2σ
-3σ
FIG VIII 6 232 Th results with associated uncertainties
50
650
700
750
800
850
900
1 2 3 4 5 6 7 8 9 10 11 12 13 14 15 16 17 18 19 20
Sample
Act
ivity
of
226 R
a in
th
e sa
mp
le (
Bq
kg
dry
)
Mean
1σ
-1σ
3σ
2σ
-3σ
-2σ
FIG VIII 7 226Ra results with associated uncertainties
51
CONTRIBUTORS TO DRAFTING AND REVIEW
Hampe D Gaigl FA
Verein fuumlr Kernverfahrenstechnik und Analytik Rossendorf eV Dresden Germany IAEA Environment Laboratories Terrestrial Environment Laboratory Seibersdorf Austria
Kim C-K IAEA Environment Laboratories Terrestrial Environment Laboratory Seibersdorf Austria
Kis-Benedek Gy IAEA Environment Laboratories Terrestrial Environment Laboratory Seibersdorf Austria
Martin P IAEA Environment Laboratories Terrestrial Environment Laboratory Seibersdorf Austria
Mietelski J W The Henryk Niewodniczanski Institute of Nuclear Physics Polish Academy of Sciences Poland
Sansone U IAEA Environment Laboratories Terrestrial Environment Laboratory Seibersdorf Austria
Varga B Central Agricultural Office Food and Feed Safety Directorate Hungary
12
(d) Let the solution to cool down and filtrate the precipitate on a filter paper (for example Whatman 41 dried in a drying oven and weighed in advance) wash the filter 3 times with 1 mL water and 2 mL 80 ethanol
(e) Dry the precipitate (40ndash50oC) and cool down in a desiccator
(f) Weigh the dried precipitate and calculate the chemical recovery using the gravimetric method
(g) Quantitatively transfer the precipitate into a liquid scintillation vial together with the filter and add 1 mL of 6M HNO3 into the vial to dissolve the precipitate
(h) Mix the solution with 15 mL of scintillation cocktail
94Measurement
941 Alpha-spectrometry
(a) Introduce the source into the vacuum chamber and pump until a vacuum of about 05 Pa (5 x 10⁻³ mbar) is obtained Then switch on the bias voltage button of detector
(b) Record the file name sample information (unit code sample name sample volume as it is required by the actual quality management system) and measurement date in each detector log book and start the measurement A typical measuring time is about 1 day when using a 450 mm2 area detector
(c) Integrate the counts in the peaks corresponding to the alpha emitting tracers and analytes respectively The alpha spectra should be similar to the spectra illustrated in Fig IV 4 of Appendix IV The FWHM of alpha peaks should be in the range of 30ndash60 keV
(d) Spectrum analysis Integrate the channel counts in a region of interest (ROI) which has the width of about 4 x FWHM (about 3 x FWHM to the left and 1 x FWHM to the right when FWHM is about 30ndash60 keV) Integrate the channel counts in the same regions of interest (ROI) in the sample spectrum and in the blank spectrum then subtract them from the sample spectrum to give the net area of peaks for further calculation
Performing a reliable measurement knowing the background of the chamber and detector is essential moreover it is important to prepare a separate reagent blank Therefore the set of measurement always has to involve above the samples a background and a reagent blank If the quality of the determination has to be proved a reference material also should be part of the preparation series
942 Liquid scintillation spectrometry for determination of 210Pb
9421Source preparation for determination of counting efficiency of 210Pb
(a) Take 10 mL 2M HCl solution into a 50 mL beaker
(b) Add the 210Pb standard solution (10ndash15 Bq) and 30 mg Pb2+ carrier to the solution
(c) Load the solution onto a Sr resin column (3 g of Sr resin 100-150 microm) which has been preconditioned in advance with 100 mL 2M HCl
(d) Wash the column with 80 mL 2M HCl Combine the washing solution with the effluent to get a pure 210Bi fraction
13
(e) Rinse the column with 20 mL 2M HCl This last portion of 20 mL 2M HCl is discarded to avoid overlapping between the 210Bi and 210Po portions
(f) Wash the column with 25 mL 6M HNO3
(g) Elute Po with 60 mL 6M HNO3
(h) Elute Pb with 60 mL 6M HCl
(i) Evaporate the Bi Po and Pb fractions to dryness
(j) Dissolve each portion of 210Bi and 210Po in 1 mL 6M HNO3 and then transfer them into 20 mL polyethylene vials coated with PTFE (polytetrafluoroethylene)
(k) Mix the solution with 14 mL scintillation cocktail
(l) Evaporate Pb fraction three times with 2 mL 65 HNO3
(m) Dissolve the residue in 20 mL 1M HNO3
(n) Add 04 g oxalic acid while warming and stirring
(o) Adjust the pH to 3ndash5 with NH4OH to form a Pb-oxalate precipitate
(p) Filter the precipitate through a pre-weighed filter paper (diameter of 24 mm)
(q) Wash the precipitate three times with 1 mL water followed by 2 mL 80 ethanol
(r) Dry the precipitate in an oven at 40ndash50oC
(s) Cool and weigh the precipitate to determine the chemical recovery of lead
(t) Carefully transfer the Pb-oxalate precipitate into a 20 mL of liquid scintillation vial together with the filter
(u) Add 1 mL 6M HNO3 to the vial to dissolve the precipitate
(v) Mix with 14 mL of scintillation cocktail
(w) Set up windows for 210Pb and 210Bi and count the three vials (for 210Pb 210Bi and 210Po) in a liquid scintillation counter until the counting statistic uncertainty is less than 1
9422Optimum window setting for 210Pb
The activity concentration of 210Pb is determined by LSC adjusted to the low energy mode and low bias with double energetic window method [7] For the successful determination of this radionuclide two counting windows should be optimized because of the overlapping of the beta spectra of 210Pb and 210Bi The result of the optimization of counting region is shown in the Fig V 1 of Appendix V In this example the lower limit for the 210Pb energy (window A) is set at channel 115 to avoid the counts caused by chemiluminescence in the cocktail while the upper limit is set at channel 320 where the 210Pb peak ends The lower limit for the 210Bi energy region (window B) is set at channel 320 and the upper limit is set at channel 410 to avoid interference from the 210Po peak
9423 Counting efficiency of 210Pb
The efficiency of liquid scintillation for beta particles depends on the energy of the beta decay For most beta particles with a maximum beta-energy above 100 keV efficiency is high more than 90 For lower energy beta particles the efficiency is usually less and the real value depends on the degree of quenching in the sample
14
To determine the efficiency a known activity of 210Pb in equilibrium with its daughters has to be measured several times (it is practical to choose more than 10 times of counting for getting a good estimate of the uncertainty in the efficiency)
10 EXPRESSION OF RESULTS
101 Calculation of activities of relevant isotopes
1011 Calculation of the activity of 210Pb
10111 Calculation of the counting efficiency of 210Pb
The counting efficiency (ε) of 210Pb can be calculated by Eqs (1 2)
TsPb tPbTPbstdcal emaR
Z210
210210minusminus
minusminus
= λε ( 1 )
BAnBnA frrZ minus= ( 2 )
where
BBgBnAAgAn rrrrrr 00 minus=minus=
fAB Tailing factor (See Ch 10112)
Rcal Chemical recovery of making the calibration source (See Ch 10113)
10112 Calculation of the tailing factor
The 210Pb energy region (window A) is interfered with counts from ingrown 210Bi The interference is compensated for by using the ratio of counts in window A to those in window B in a pure 210Bi spectrum the so-called ldquotailing factorrdquo fAB The tailing factor is independent of the activity level of 210Bi in the sample but is dependent on the quenching level of the sample The quenching levels of the calibrant the sample and the reagent blank are necessary to keep constant within plusmn2 relative standard deviation The tailing factor can be calculated by the following formula
210
210
minus
minus=BistdBn
BistdAnBA r
rf (3)
where BBistdBgBistdBnABistdAgBistdAn rrrrrr 02102100210210 minus=minus= minusminusminusminus
10113 Chemical recoveries of Pb in calibration source and sample
The chemical recovery of lead in the calibration source preparation process is determined gravimetrically using Eq (4)
15
ccPb
calfcalofgcal mC
mmfR
minus
minus=
)( ( 4 )
When the amount of Pb in the sample is not negligible compared with that in the Pb carrier the sample Pb content should be allowed for in calculation of the chemical recovery of Pb The chemical recovery of Pb in the sample can be calculated by Eqs (5 6)
)(
)(
ssPbccPb
fofg
mCmC
mmfR
minusminus +minus
= ( 5 )
Mass ratio (fg) of atomic mass of Pb to molar mass of Pb-oxalate
oxalatePb
Pbg M
Mf
minus
= (6 )
10114 Calculation of the activity of 210Pb
The activity of 210Pb on the separation date can be calculated from the LSC measurement using the following equations
Rm
ffZa
s
PbPbsPb ε
minusminusminus = 32
210 (7)
22102
tPb
Pbef minusminusminus = λ ( 8 )
321013210
3 tPb
PbPbe
tf
minusminus= minus
minus λλ
(9 )
However if the time interval (t2) between the separation of 210Pb and the beginning of the measurement and the counting time of the sample (t3) are much smaller than the half life of 210Pb (222 y) f2-Pb f3-Pb u(f2-Pb) and u(f3-Pb) are negligible
1012 Calculation of the activity of 210Po
The activity of 210Po on the separation date is calculated according to the procedure detailed in IAEAAQ12 [8]
1013 Calculation of the activities of the U and Th isotopes
The ratio of the net counts of the tracer and analyte peak is used to calculate the activity of the analyte in the sample on the date of chemical separation taking into account the activity of the tracer solution the masses of the sample and the tracer used The activity of the analyte (as Bq(kg dry)-1) at the separation time is calculated by the following formula
16
TgT
g
s
TTTTT
nTs
nTs rr
rr
m
fmCfm
rm
rCa
0
0
minusminus
== (16)
The decay of the tracer between its reference date (from the certificate) and counting is taken into correction by fT as follows
sTT t
T ef λminus= (17)
The activity of analyte in the sample should be calculated back to the date of sample collection
teaa
λminus=0 (18)
The detector efficiency is not needed in isotope dilution alpha spectrometry for calculation of the activity of the analyte but is needed for calculation of the chemical recovery It is determined from the activity of the tracer added and the net counts in the corresponding peak as follows
sTT t
TT
nT emC
rR λ
εminus= (19)
The detector efficiency is determined by the calibration source prepared in a similar way as the analytes and using the same measurement conditions For analytes which are co-precipitated the calibration source also should be co-precipitated using the same conditions including filter diameter For analytes which are electrodeposited the calibration source should also be prepared by electrodeposition Efficiency determinations are typically performed and regularly checked in the frame of analytical quality control The efficiency can be calculated according to the following equation
cal
caln
A
r =ε (20)
Where
Rn cal net count rate of calibration source in respective ROI
Acal certified activity of the calibration source
1014 Calculation of the activity of 226Ra [9]
10141 Calculation of the chemical recovery of Ra
The chemical recovery is determined by using the peak of 217At at 70669 keV (Pα 0999 32) The ingrowth of 225Ac (T12 100 d) the daughter of 225Ra is directly associated with the short lived progenies 221Fr (T12 48 min) 217At (T12 323 ms) and 213Po (T12 37 micros) When the daughters are in equilibrium with 225Ra the 217At peak shows no overlap with descendants of natural isotopes of radium in the alpha spectrum (225Ac interferes with 224Ra 221Fr interferes with 220Rn) From the initial tracer activity AT (added 229Th225Ra) the maximum detectable count rate rnTmax is calculated by taking into account the decay of unsupported 225Ra after its separation from Th (tsTh-229) as well as the build-up of 225Ac (tsRa-225) in the following equation
17
225225
225)(max
229225225
minusminus
minusminusminus
minus= minusminusminus
RaAc
ActtTnT
sThsRaRaeArλλ
λε λ (21)
The chemical recovery R is calculated as ratio of the measured count rate rnT and theoretical value rnTmax
maxnT
nT
r
rR = (22)
10142 Calculation of activity of 226Ra
While AT is the activity of the 225Ra tracer after the separation from 229Th its activity at the beginning of the build-up of 225Ac is yielded as follows
)(225
225225 sAcRa ttTRa eAA minusminus
minusminusminus= λ
( 2 4 )
The activity of 225Ac in any time is given by
( )225225
)()(225225
225
225225225225
minusminus
minusminusminusminusminusminus
minus minusminus=
minusminusminusminus
RaAc
ttttRaAc
Ac
AcAcAcRa eeAA
λλλ λλ
(25)
Integrating over the counting period with tm as the start and tem as the end of the measurement results into the activity of 225Ac at tem
( )( )( ) ( )( )
minusminusminus
= minusminusminusminus minusminusminusminus
minusminusminus
minusminusminus
225225225225
225225225
225225225
1)( AcemRaAcmRa tttt
RamemRaAc
AcRaemmAc ee
ttAttA λλ
λλλλ
( ) ( )( )
minusminus minusminusminusminus minusminusminusminus
minus
225225225225
225
1AcemAcAcmAc tttt
Ac
ee λλ
λ (26)
Finally the activity concentration of 226Ra is the following
217
226225226 )(
minus
minusminusminus =
At
RaemmAcRa r
rttAA (27)
where
0
0226226226 t
n
tt
nr Ra
mem
RaRa
minusminusminus minus
minus= and
0
0217217217 t
n
tt
nr At
mem
AtAt
minusminusminus minus
minus=
102 Expression of combined uncertainties of relevant isotopes
According to the Guide to Expression of Uncertainty in Measurement [11 12] the combined uncertainty is described in detail and an example is calculated for each relevant radionuclide in Appendix VI
18
103 Decision threshold
In accordance with ISO 119292010 the decision threshold gives a decision on whether or not the physical effect quantified by the measurand is present
The decision threshold a is the non-negative measurand quantifying the physical effect of interest If the result a is below the decision threshold the result can not be attributed to the physical effect nevertheless it can not be concluded that it is absent If the physical effect is really absent the probability of taking the wrong decision that the effect is present is equal to the specified probability of α (the error of first kind often chosen 005 and moreover α=β where β is the error of second kind then k1-α=k1-β=165) Any of the determined primary measurement result is only significant for the true value of the measurand to differ from zero if it is larger than the decision threshold given here
a=k1-αu(0) where u(0) is the uncertainty associated to the non-negative measurand uncertainty of decision threshold itself (with other words it can be estimated as uncertainty associated to slightly higher values than background or reagent blank depending on the procedure) and can be quantified here as
20
0
03
01)0(
t
n
tt
n
Rmu
s
+=ε
(28)
104 Detection limit
In accordance with ISO 119292010 the detection limit indicates the smallest true value of the measurand which can be still detected with the applied procedure this gives a decision on whether or not the measurement procedure satisfies the requirements and is therefore suitable for the intended measurement purpose In order to find out whether a procedure is suitable for the purpose the detection limit is compared with the specified guideline value of the measurand
The detection limit a is the smallest true value of the measurand for which the probability of the wrong assumption that the physical effect is absent does not exceed the probability β (error of the second kind) The detection limit is obtained as the smallest solution of the following equation
a=a+k1-β(a) where a ge a (29)
Eq (29) is an implicit equation which can be calculated by iteration As a starting approximation a1=3a can be chosen in most cases the iteration converges and the linear interpolation with approximation of a=(k1-α+k1-β)u(a) leads to the approximation
)0()( 221
21
2 ukkqqa αβ minusminus minus++= (30)
with [ ]
minus+= minusminus )0()(
2
1)0( 2
12
1
21
1 uaua
kukq a
β (31)
If α=β than k1-α=k1-β=k a=2q follows
19
[ ])0()()0(2 21
2
1
2 uau
a
kuka minus+= (32)
Where α is the probability of the error of first kind the probability of rejecting a hypothesis if it is true and β is the probability of the error of second kind the probability of accepting a hypothesis if it is false
The detection threshold and limit of the isotopes in the applied procedure are described in Table VII 1 of Appendix VII
The difference between using the decision threshold and using the detection limit is that the measured values are to be compared with the decision threshold whereas the detection limit is to be compared with the guideline value (guideline value corresponds to scientific legal or other requirements for which the measuring procedure intended to assess)
11 VALIDATION OF THE PROCEDURE
The procedure was validated with an IAEA reference material IAEA-434 The material was initially characterized at IAEA Environment Laboratories in Seibersdorf during the feasibility study phase Then the characterization of the material took place within the interlaboratory comparison piloted by IAEA Environment Laboratories in Seibersdorf in cooperation with the Consultative Committee on Ionization Radiation (CCRI) of the International Bureau des Poids et Mesure (PIBM) The results reported in this comparison were used to derive the property values of the measurands of interest The IAEA-434 reference material [12] was collected from a processing plant located in Gdansk (Poland) in 2003 The matrix composition is CaSO4middot2H2O (96) P2O5 (1-2) F total (12) SiO2 (1) Al2O3 (02) The property values of all radionuclides of IAEA 434 were established on the basis of a robust approach proposed by DL Duewer [13] and the Mixture Model median (MM-median) of the analytical results reported by the expert laboratories was calculated To estimate the standard uncertainty associated with the property value the MM-median based standard deviation was calculated from the span of the central 50 of the MM probability density function The validation results of the procedure are shown in Tables VIII 1 and VIII 2 Figs VIII 1ndashVIII 7 of Appendix VIII 111 Trueness of the method
The relative bias of the method is calculated by the following formula
100() timesminus=C
CXδ (34)
112 Precision of the method
The precision index ( PI() ) is calculated according to the following formulas
100)()(
()2
2
2
2
times+=X
Xu
C
CuPI (35)
20
113 Repeatability limit
The repeatability limit is estimated by analyzing five subsamples from the same bottle of the IAEA-434 reference material for the relevant radionuclides investigating the repeatability conditions instrument analyst shortest time etc The repeatability limit is calculated by the following formula
rL Sr 82= (36)
114 Reproducibility limit
The reproducibility limit is also estimated by analyzing the IAEA-434 reference material from ten duplicates samples were taken from ten randomly selected packing unit with at least one parameter being changed in the analytical system (analyst analysis date instrument etc) The reproducibility limit is calculated by the following formula
RL SR 82= (37)
115 Outlier test
The presence of individual values that appear to be inconsistent with all other laboratories or values may cause some problems during the final evaluation of data According to ISO 5725-2 an outlier test should be performed before the calculation of repeatability and reproducibility The analysis includes a systematic application of a statistical test of outliers a great variety are available which could be used for the purposes of this part of ISOIEC 17025 Usually the graphical consistency technique or the numerical outlier test are applied Cohranrsquos test of variabilities should be applied first and then any necessary action should be taken Grubbrsquos test is primarily a test of in between laboratory variability
116 Acceptance criteria
The method can be accepted if
PI()lt 25
LRltδ ( 3 8 )
According to these criteria the method performs well as the Table VIII 1 of Appendix VIII shows
12 TEST REPORT
The test report shall conform to ISOIEC 17025 requirements and shall contain the following information
bull a title (test report calibration report reference material production etc)
bull the name and address of the laboratory and location where any part of the test or calibration or production of reference material etc were carried out
bull unique identification of the report on each page with numbering of pages
21
bull analysis request code
bull reference to the measurement method used
bull sampling date (if available)
bull sample description
bull sample code or identification number
bull date of the separation of analyte
bull applied tracers with their reference dates and activity values with the code of their certificate
bull the results with units of measurement and associated uncertainty value expressed in the same unit as the result
bull date to which the test result has been corrected (corrected to the sampling date or separation time dd-mm-yyyy)
bull responsible person (with accessibility)
22
REFERENCES
[1] FEDERAL REGISTER National emission standards for hazardous air pollutants 57 107 (1992) 23305-23320
[2] RUTHERFORD PM DUDAS MJ AROCENA JM Heterogeneous distribution of radionuclides barium and strontium in phosphogypsum by-product Sci Total Environ 180 (1996) 201-209
[3] NATIONAL COUNCIL ON RADIATION PROTECTION AND MEASUREMENTS Evaluation of Occupational and Environmental Exposures to Radon and Radon Daughters in the United States NCRP Report 78 (1984)
[4] MARTIN P HANCOCK GJ Routine analysis of naturally occurring radionuclides in environmental samples by alpha-particle spectrometry Supervising Scientist Report 180 (2004) httpwwwenvironmentgovaussdpublicationsssr180html
[5] INTERNATIONAL ATOMIC ENERGY AGENCY Reference Material IAEA-434 Naturally Occurring Radionuclides in Phosphogypsum IAEA Analytical Quality in Nuclear Applications Series No 17 IAEAAQ17 IAEA Vienna (2010)
[6] MEDLEY P BOLLHOumlFER A ILES M RYAN B MARTIN P Barium sulfate method for radium-226 analysis by alpha spectrometry Environmental Research Institute of the Supervising Scientist internal report 501 (2005)
[7] VAJDA N LAROSA J ZEISLER R DANESI P KIS-BENEDEK G A Novel Technique for the Simultaneous Determination of 210Pb and 210Po using a Crown Ether J Environ Radioactivity 37 (1997) 355-372
[8] INTERNATIONAL ATOMIC ENERGY AGENCY A Procedure for the Determination of Po-210 in Water Samples by Alpha Spectrometry IAEA Analytical Quality in Nuclear Applications Series No 12 IAEAAQ12 IAEA Vienna (2009)
[9] GUOGANG J TORRI G INNOCENZI P OZONE R Di LULLO A Determination of radium isotopes in mineral and environmental water samples by alpha-spectrometry J of Radioanalytical and Nuclear Chemistry 267 3 (2005) 505-514
[10] EURACHEMCITAC Guide Quantifying uncertainty in analytical measurement 2nd Ed(2000)
[11] INTERNATIONAL ATOMIC ENERGY AGENCY Quantifying Uncertainty in Nuclear Analytical Measurements IAEA-TECDOC-1401 IAEA Vienna (2004)
[12] SHAKHASHIRO A SANSONE U Technically Enhanced Naturally Occurring Radionuclides (TENORM) in Phosphogypsum The Interlaboratory Comparison CCRI(II)07-35 Metrologia (2009)
[13] DUEWER DL A Robust Approach for the Determination of CCQM Key Comparison Reference Values and Uncertainties Working document CCQM04-15 BIPM wwwbipminfoccCCQMAllowed10CCQM04-15pdf (2004)
23
[14] Monographie BIPM-5 Vol 1ndashMonographie BIPM-5 Vol 5
httpwwwnucleideorg Decay Data Evaluation Project (DDEP) accessed in October 2010
[15] NuDat 25 (Database at the US NNDC) httpwww-ndsiaeaorg accessed in October 2010
[16] HORWITZ et al A Novel Strontium-Selective Extraction Chromatographic Resin Solvent Extraction amp Ion Exchange 10 (1992) 313
[17] HORWITZ et al Extraction Chromatography of Actinides and Selected Fission Products Principles and Achievement of Selectivity presented at International Workshop on the Application of Extraction Chromatography in Radionuclide Measurement IRMM Geel 1998
[18] HORWITZ et al Separation and Preconcentration of Actinides by Extraction Chromatography Using a Supported Liquid Anion Exchanger Application to the Characterization of High-Level Nuclear Waste Solutions Analytica Chimica Acta 310 (1995) 63-78
[19] HORWITZ et al Separation and Preconcentration of Uranium from Acidic Media by Extraction Chromatography Analytica Chimica Acta 266 (1992) 25-37
[20] C-K KIM MARTIN P FAJGELJ A Quantification of measurement uncertainty in the sequential determination of 210Pb and 210Po by liquid scintillation counting and alpha particle spectrometry Accreditation and Quality Assurance 13 12 (2008) 691-702
[21] J KRAGTEN Calculating Standard Deviation and Confidence Intervals with a Universally Applicable Spreadsheet Technique Analyst 119 (1994) 2161ndash2165
24
APPENDIX I NUCLEAR DATA OF RELEVANT RADIONUCLIDES AND DECAY CHAINS OF U
AND Th SERIES
TABLE I 1 NUCLEAR DATA OF RELEVANT RADIONUCLIDES [14]
Radionuclide Half-life Disintegration modes
E (MeV) Probability ()
225Ac 100(1) d α 5580 5(14) 095(4)
α 5599 3(14) 0114(7)
α 5609 0(14) 109(5)
α 5637 3(14) 416(23)
α 5682 2(14) 131(4)
α 5686 4(14) 0021(14)
α 5723 1(14) 203(23)
α 5730 5(14) 16(3)
α 5731 6(14) 124(10)
α 5731 9(17) 90(5)
α 5797 7(14) 62(9)
α 5793 1(21) 189(20)
α 5804 2(14) 03
α 5829 6(14) 524(24)
217At 323(4) x 10-3 s α 6484 7(16) 0016 7(8)
α 6813 8(16) 0038 4(15)
α 7066 9(16) 99932(3)
133Ba 10540(6) y γ 0053 162 2(6) 214(3)
γ 0079 614 2(12) 265(5)
γ 0080 997 9(11) 329(3)
γ 0276 398 9(12) 716(5)
γ 0302 850 8(5) 1834(13)
γ 0356 012 9(7) 6205(19)
γ 0383 848 5(12) 894(6)
210Bi 5012(5) d β 1162 1(8) 99999 86(2)
212Bi 6054(6) min β 0633(2) 190(4)
β 0741(2) 145(29)
β 1527(2) 458(21)
β 2254(2) 5523(21)
α 6050 92(4) 251(1)
α 6090 02(4) 97(1)
221Fr 479(2) min α 6126 3(15) 151(2)
α 6243(2) 134(7)
α 6341 0(13) 828(2)
TABLE I 1 NUCLEAR DATA OF RELEVANT RADIONUCLIDES [14] (cont)
25
Radionuclide Half-life Disintegration modes
E (MeV) Probability ()
210Pb 2223(12) y β 0017 0(5) 802(13)
β 0063 5(5) 198(13)
γ 0046 539(1) 4252(40)
208Po 2898(2) y α 5114 9(14) 99995 8(4)
α 4220(15) 24(7)x10-4
209Po 115(13) y α 4885(2) 198(32)
α 4883(2) 792(32)
α 4622(5) 0548(7)
210Po 138376 3(17) d α 5304 33(7) 99998 76
α 4516 66(9) 0001 24(4)
213Po 370(5) x 10-6 s α 8375 9(25) 99995 0(5)
216Po 0150(5) s α 6778 6(5) 99998 1(3)
α 5988 6(10) 0001 9(3)
218Po 3094(6) min α 6002 35(9) 99976 9(32)
223Ra 1143(5) d α 5747 0(4) 900(20)
α 5716 23(29) 516(13)
α 5606 73(30) 252(5)
α 5539 80(90) 900(20)
224Ra 3627(7) d α 5448 81(16) 526(7)
α 5685 50(15) 9472(7)
γ 0240 986(6) 412(4)
225Ra 1482(19)d β 0316(5) 688(20)
β 0356(5) 312(20)
γ 0040 09(5) 300(7)
226Ra 1 600(7) y α 4601(1) 595(4)
α 4784 34(25) 94038(40)
228Ra 575(4) y β 00127(7) 30(10)
β 00256(7) 87(9)
β 00391(7) 49(10)
β 00395(7) 12(10)
220Rn 558(3) s α 5748 46(14) 0118(15)
α 6288 22(10) 99882(15)
222Rn 3823 2(8) d α 5489 48(30) 9992(1)
228 Th 69860(23) d α 5176 89(23) 020(2)
α 5211 08(22) 038(3)
α 5340 38(22) 262(2)
α 5423 28(22) 732(2)
TABEL I 1 NUCLEAR DATA OF RELEVANT RADIONUCLIDES [14] (cont)
26
Radionuclide Half-life Disintegration
modes E (MeV) Probability ()
229 Th 7 340(160) y α 5053(2) 660(10)
α 4978 5(12) 317(4)
α 4967 5(12) 597(6)
α 4901 0(12) 1020(8)
α 4845 3(12) 5620(20)
α 4814 6(12) 930(8)
230 Th 7538(30) x 104 y α 4687 0(15) 763(3)
α 4620 5(15) 234(10)
232 Th 1402(6) x 109 y α 3810 0(14) 0068(20)
α 3948 5(14) 210(13)
α 4011 2(14) 789(13)
234 Th 2410(3) d β 0105(10) 65(7)
β 0106(10) 141(12)
β 0198(10) 778(15)
γ 0063 30(2) 375(8)
232U 706(11) y α 5263 48(9) 306(6)
α 5320 24(9) 691(6)
233U 1592(2) x 105 y α 4824 2(12) 843(6)
α 4783 5(12) 132
234U 2455(6) x 105 y α 4603 5(7) 0210(2)
α 4722 4(7) 2842(2)
α 4774 6(7) 7137(2)
235U 704(1) x 106 y α 4322(4) 333(6)
α 4397 8(13) 5719(20)
α 4414 9(5) 301(16)
α 4502 4(7) 128(5)
α 4556 0(4) 379(6)
α 4596 4(13) 474(6)
236U 2343(6) x 107 y α 4445(5) 261(40)
α 4494(3) 738(40)
238U 4468(5) x 109 y α 4038(5) 013(3)
α 4151(5) 2233(50)
α 4198(3) 7754(50)
Emax for beta emitting radioisotopes
Data were taken from [15]
27
FIG I 1 Decay chain of 238U [4]
FIG I 2 Decay chain of 232Th [4]
28
APPENDIX II FLOW CHART FOR SEQUENTIAL SEPARATION OF 210Po 210Pb Th U AND 226Ra
IN PHOSPHOGYPSUM
29
APPENDIX III PROPERTIES OF RESINS
III1 Sr resin
FIG III 1 Structure of the Sr resin (wwweichromcom)
FIG III 2 Capacity factor of Sr resin in nitric acid (wwweichromcom) [16]
30
FIG III 3 Capacity factor of Sr resin in nitric acid (wwweichromcom) [17]
III2 TEVA resin
FIG III 4 Structure of the TEVA resin (wwweichromcom)
31
FIG III 5 Capacity factor of TEVA resin in nitric acid and hydrochloric acid (wwweichromcom) [18]
III3 UTEVA resin
FIG III 6 Structure of the UTEVA resin (wwweichromcom)
32
FIG III 7 Capacity factor of UTEVA resin in nitric acid and hydrochloric acid (wwweichromcom) [19]
33
APPENDIX IV ALPHA SPECTRA OF ANALYTES
FIG IV 1 Alpha spectrum of Po isotopes
FIG IV 2 Alpha spectrum of Th isotopes in phosphogypsum (with progeny)
228Th is resulted from 232U tracer spiked in the sample
34
FIG IV 3 Alpha spectrum of U isotopes
FIG IV 4 Alpha spectrum of 226Ra and its progeny (spiked with 225Ra)
35
FIG IV 5 Overlapping alpha spectra of U and Po isotopes
FIG IV 6 Overlapping alpha spectra of U and Th (with progeny) isotopes
36
APPENDIX V LIQUIDE SCINTILLATION SPECTRA
a)
b)
A window
(115-320 ch)
B window
(320 -410 ch)
210Po
210Pb
210Bi
210Bi
Co
unts
Ch
ann
elC
oun
tsC
han
nel
Channel number
a)
b)
A window
(115-320 ch)
B window
(320 -410 ch)
210Po
210Pb
210Bi
210Bi
Co
unts
Ch
ann
elC
oun
tsC
han
nel
Channel number
FIG V 1 Typical liquid scintillation spectra of beta-emitting 210Pb and 210Bi and alpha emitting 210Po (calibration sources) a) 210Pb 210Bi and 210Po spectra
b) pure 210Bi spectrum
37
APPENDIX VI CALCULATION OF THE COMBINED UNCERTAINTY
OF THE ACTIVITIES OF THE ANALYTES ON SAMPLING DATE
VI1 Uncertainty of the 210Pb result [20]
VI11 Uncertainty of counting efficiency of 210Pb
2
2
2
2
2210
2
210
2210
222
)()()()()()( )( PbTPbT
calcal
stdPbstdPb
Pbb mum
RuR
aua
utZuZ
u
minus+
minus+
minus++
= minusminus
minusεεελεεε (VI-1)
2
222
2 )()()()()( (Z) BABnBnBAAn furrufruu minus+minus+= (VI-2)
20
2 )()()( AAgAn rururu += (VI-3)
20
2 )()()( BBgBn rururu += (VI-4)
VI12 Uncertainty of the tailing factor fAB
The uncertainty of the tailing factor fAB is calculated according to following equations
2
210
210
2
210
210
)()()(
+
=
minus
minus
minus
minus
BicalnB
BicalnB
BicalAn
BicalAnBABA r
ru
r
ruffu (VI-5)
20
2210210 )()()( ABicalAgBicalAn rururu += minusminus (VI-6)
20
2210210 )()()( BBicalBgBicalBn rururu += minusminus (VI-7)
The uncertainty of counting efficiency for 210Pb can be calculated by Eq (VI-8)
2
2
2
2
2210
2
210
2210
222
)()()()()()( )( PbTPbT
calcal
stdPbstdPb
Pbb mum
RuR
aua
utZuZ
u
minus+
minus+
minus++
= minusminus
minusεεελεεε (VI-8)
2
222
2 )()()()()( (Z) BABnBnBAAn furrufruu minus+minus+= (VI-9)
20
2 )()()( AAgAn rururu += (VI-10)
20
2 )()()( BBgBn rururu += (VI-11)
38
VI13 Uncertainty of chemical recovery of Pb
Uncertainty of chemical recoveries of Pb in calibration source
minusminus+
minus+
= 2
2
2
2
2
2
cal )()(
)()(
)( )(R calfcalfcalof
calcalof
calfcalof
calg
g
cal mumm
Rmu
mm
Rfu
f
Ru
2
1
2
2
2
2
)()(
)()(
minus+
minus+
minus
minusminus
minusc
ccPb
cPbcalcPb
ccPb
ccal mumC
CRCu
mC
mR (VI-12)
The uncertainty of chemical recovery of Pb in the sample can be calculated
minusminus+
minus+
= 2
2
2
2
2
2
)()(
)()(
)( (R) ffof
offof
gg
mumm
Rmu
mm
Rfu
f
Ru
2
2
2
2
)()(
)()( c
ssPbccPb
cPbcPb
ssPbccPb
c mumCmC
CRCu
mCmC
mR
+minus+
+minus+
minusminus
minusminus
minusminus
2
1
2
2
2
2
)()(
)()(
+minus+
+minus+
minusminus
minusminus
minusminuss
ssPbccPb
sPbsPb
ssPbccPb
s mumCmC
CRCu
mCmC
mR (VI-13)
VI14 Uncertainty of mass ratio
The uncertainty of the mass ratio (fg) of atomic mass of Pb to molar mass of Pb-oxalate is calculated using the equations below
22
M Pb)(
+
=
minus
minus
oxalatePb
M
Pbgg M
u
M
uffu oxalatePb (VI-14)
The uncertainty of the molar mass of lead oxalate u(MPb-oxalate) can be derived by combining standard uncertainties in atomic masses of its constituents as shown in Table VI 1
39
TABLE VI 1 STANDARD UNCERTAINTIES OF ATOMIC WEIGHT AND THE GRAVIMETRIC FACTOR fg
Element Atomic weight
(gmol-1)
Quoted uncertainty (gmol-1)
Conversion factor
Standard uncertainty (gmol-1)
Mass ratio of atomic mass of Pb to
molar mass of Pb-oxalate
Uncertainty ofatomic mass
of Pb to molar mass of
Pb-oxalate
Pb 207215 2 0000 15 3 0000 087 0701 9 0000 002
C 12010 7 0000 8 3 0000 46
O 15999 4 0000 3 3 0000 17
VI15 Combined uncertainty of activity of 210Pb
The combined uncertainty of the 210Pb activity is calculated from Eq (VI-15)
minus+
minus+
minus+
= minusminusminusminus 2
2
2102
2
2102
2
210
2
2
2101 )()()()()( s
d
sPb
BA
sPb
nBnB
sPb
BAnA
sPb
Pbc mum
afu
Z
arru
Z
afru
Z
aau
2
1
23
2
3
21022
2
2
2102
2
2102
2
210 )()()()(
+
+
minus+
minus+ minus
minus
minusminus
minus
minusminusminusPb
Pb
sPbPb
Pb
sPbsPbsPb fuf
afu
f
aRu
R
au
aε
ε (VI-15)
)()( 210222 minusminusminus = PbPbPb utffu λ (VI-16)
210
210321033
)(
11)(
3210
3210
minus
minusminus
minus
minusminusminus
minusminus=
minus
minus
Pb
Pbt
t
PbPbPb
u
e
etffu
Pb
Pb
λλλ λ
λ
(VI-17)
However if the time interval (t2) between the separation of 210Pb and the beginning of the measurement and the counting time of the sample (t3) are much smaller than the half life of 210Pb f2-Pb f3-Pb u(f2-Pb) and u(f3-Pb) are negligible The uncertainties associated to components mentioned above can be calculated as follows
0
0
3
)(t
r
t
rru
Po
gn +=
minus
(VI-18)
0
0
3
)(t
r
t
rru t
Po
tgtn +=
minus
(VI-19)
minus+
+
= minusminusminus
minus2
2
2102
2
2102
2
210210 )()()( )( tn
tn
sPo
nn
sPo
TT
sPo
sPo rur
aru
r
aAu
A
aau
2
2
21022
2
2
2102
2
2102
2
210)()()()( T
T
sPo
PoPo
sPo
TT
sPo
ss
sPofu
f
afu
f
amu
m
amu
m
a
+
+
+
minus+ minus
minusminus
minusminusminus
40
2
1
3
2
3
210 )(
+ minus
minus
minusPo
Po
sPo fuf
a (VI-20)
)()( TTTt utffu λ= (VI-21)
)()( 210222 minusminusminusminus = PoPoPoPo utffu λ (VI-22)
210
210321033
)(
11)(
3210
3210
minus
minusminus
minus
minusminusminus
minusminus=
minus
minus
Po
Pot
t
PoPoPo
u
e
etffu
Po
Po
λλλ λ
λ (VI-23)
VI16 Combined uncertainty of activity of 210Po
The uncertainty of the activity of 210Po on the separation date is calculated according to IAEAAQ12 procedure [8]
VI2 Uncertainty of other alpha emitting isotopes
The same formulas are used to calculate the combined uncertainties as equations that are used for calculation of the activity of alpha emitting analytes at the separation time and the sampling date as well as the chemical recovery and counting efficiency These formulas have to be applied in the spreadsheet approach for calculating the combined uncertainties knowing the standard uncertainty of each component VI3 Spreadsheet approach
For the quantifying the uncertainties the spreadsheet technique [21] was used which could be summarised as follows and showed in the Fig VI 1
bull Calculate function y using parameter xj
y=f(x1x2xj xn) (VI-24)
bull recalculate the same function n times increasing xj to xj+dxj (dxj standard deviation) and keeping the remaining parameters constant
y=f(x1x2xj+dxj xn) (VI-25)
bull the uncertainty on the function dy is the square root of the sum of squares
( )sum minus=n
jyydy1
2 (VI-26)
bull The individual variance contribution fj is
( )( )sum minus
minus=
n
j
jj
yy
yyf
1
2
2
(VI-27)
41
FIG VI 1 Spreadsheet approach for quantifying the uncertainty of the measurement
The results are summarised for the individual isotopes in the Tables VI 2ndashVI 9 and the results of the individual analysis with their uncertainties are shown in the Figs VI 3ndashVI 9 The detailed study about the usual contributors of uncertainty in the nuclear analytical techniques could be found in the IAEA-TECDOC-1401 [11] TABLE VI 2 AN EXAMPLE OF QUANTIFYING UNCERTAINTIES OF 210Po RESULT
Symbol unit Value of variable
Uncertainty Conversion factor to standard uncertainty
Standard uncertainty
Contribution to combined
uncertainty ()
m g 0508 9 0007 3 3 0004 2 010
rgt s-1 0197 0075 1 0075 361
r0t s-1 0000 017 0000 034 1 0000 034 0000 014
rg s-1 0081 0029 1 0029 6352
r0 s-1 0000 034 0000 033 1 0000 033 0000 08
at Bq 0829 0019 1 0019 0252
λt d-1 0000 019 0000 013 1 0000 013 negligible
λPo d-1 0005 72 x 10-9 1 72x10-9 negligible
ft 0982 14 0000 43 1 0000 43 0000 091
f2-Po 1005 73 x 10-9 1 73x10-9 negligible
f3-Po 1005 5 18 x 10-8 1 18 x10-8 negligible
aPo1 Bqmiddotkg-1 672 94
contribution is less than 1 x 10⁻⁵
TABLE VI 3 AN EXAMPLE OF QUANTIFYING UNCERTAINTIES OF EFFICIENCY OF 210Pb
Symbol unit Value of variable
Uncertainty
Conversion factor to standard
uncertainty
Standard uncertainty
Contribution to combined
uncertainty ()
mvial g 14936 35 0000 1 3 0000 17 0004 8
42
Symbol unit Value of variable
Uncertainty
Conversion factor to standard
uncertainty
Standard uncertainty
Contribution to combined
uncertainty ()
mvial+carrsol g 16036 54 0000 1 3 0000 17 0004 8
cPb g g-1 0027 42 0000 021 1 0000 021 011
mvial g 16036 72 0000 10 3 0000 17 0004 8
mvial+std g 17132 6 0000 10 3 0000 17 0004 8
astd Bq 1245 0189 1 0189 805
fgravimetry 0701 85 0000 41 1 0000 41 0066
mfilter g 0036 54 0000 10 3 0000 17 42
mfilter+Pb-precipitate g 0073 77 0000 10 3 0000 17 41
rA s-1 7362 0041 1 0041 76
rA0 s-1 0029 5 0003 1 0002 7 0035
rB s-1 0416 0 0011 1 0011 060
rB0 s-1 0011 7 0002 1 0002 2 0024
fAB 1049 0023 1 0023 040
t12 Pb d 814508 7305 1 731 23
tmeas-ref d 4 532 -
ε 0859 7 0015 3
43
TABLE VI 4 AN EXAMPLE OF QUANTIFYING UNCERTAINTIES OF 210Pb RESULT
Symbol unit Value of variable
Uncertainty Conversion factor to standard uncertainty
Standard uncertainty
Contribution to combined
uncertainty ()
ms g 0508 9 0007 3 3 0004 2 03
rgA s-1 0283 0035 1 0035 883
r0A s-1 0011 7 0002 2 1 0002 2 03
rgB s-1 0031 0009 1 0009 58
r0B s-1 0005 6 0002 3 1 0002 3 04
Ζ s-1 0245 1 0032 7 1 0032 7 -
fAB 1015 3 0012 9 1 0012 9 001
ε 0859 7 0015 3 1 0015 3 13
R 0858 8 0025 3 1 0077 2 35
aPb1 Bqmiddotkg-1 652 12
TABLE VI 5 AN EXAMPLE OF QUANTIFYING UNCERTAINTIES OF 234U RESULT
Symbol unit Value of variable
Uncertainty Conversion factor to standard uncertainty
Standard uncertainty
Contribution to combined
uncertainty ()
ms g 0508 9 0007 3 3 0004 2 003
rgt s-1 0021 78 0008 01 1 0008 369
r0t s-1 0000 030 0000 022 1 0000 022 0000 5
rg s-1 0016 15 0005 90 1 0006 628
r0 s-1 0000 016 0000 022 1 0000 022 0000 1
at Bq 0088 35 0002 10 1 0002 01 029
aU-234_1 Bqmiddotkg-1 129 3
TABLE VI 6 AN EXAMPLE OF QUANTIFYING UNCERTAINTIES OF 238U RESULT
Symbol unit Value of variable
Uncertainty Conversion factor to standard uncertainty
Standard uncertainty
Contribution to combined
uncertainty ()
ms g 0508 9 0007 3 3 0004 2 003
rgt s-1 0021 78 0008 01 1 0008 353
r0t s-1 0000 030 0000 022 1 0000 022 0000 5
rg s-1 0015 61 0005 67 1 0006 644
r0 s-1 0000 009 0000 008 1 0000 008 0000 1
at Bq 0088 35 0002 10 1 0002 1 028
aU-238_1 Bqmiddotkg-1 124 3
44
TABLE VI 7 AN EXAMPLE OF QUANTIFYING UNCERTAINTIES OF 230Th RESULT
Symbol unit Value of variable
Uncertainty Conversion factor to standard uncertainty
Standard uncertainty
Contribution to combined
uncertainty ()
ms g 0508 9 0007 3 3 0004 2 005
rgt s-1 0022 63 0006 44 1 0006 387
r0t s-1 0000 077 0000 063 1 0000 063 0006 1
rg s-1 0028 38 0007 90 1 0008 608
r0 s-1 0000 012 0000 010 1 0000 010 0000 1
at Bq 0090 03 0002 30 1 0002 303 051
aTh-230_1 Bqmiddotkg-1 223 9
TABLE VI 8 AN EXAMPLE OF QUANTIFYING UNCERTAINTIES OF 232Th RESULT
Symbol unit Value of variable
Uncertainty Conversion factor to standard uncertainty
Standard uncertainty
Contribution to combined
uncertainty ()
ms g 0508 9 0007 3 3 0004 2 004
rgt s-1 0022 63 0006 44 1 0006 265
r0t s-1 0000 077 0000 063 1 0000 063 0004 2
rg s-1 0000 28 0000 10 1 0000 1 727
r0 s-1 0000 011 0000 008 1 0000 008 048
at Bq 0090 03 0002 30 1 0002 3 035
aTh-232_1 Bqmiddotkg-1 21 009
TABLE VI 9 AN EXAMPLE OF QUANTIFYING UNCERTAINTIES OF 226Ra RESULT
Symbol unit Value of variable
Uncertainty Conversion factor
to standard uncertainty
Standard uncertainty
Contribution to combined
uncertainty ()
ms g 0508 9 0007 3 3 0004 2 003
rgt s-1 0043 10 0025 05 1 0025 05 603
r0t s-1 0000 111 0000 128 1 0000 128 0004
rg s-1 0063 32 0018 78 1 0018 78 393
r0 s-1 0000 070 015 0000 070 013 1 0000 070 013 0000 5
at Ra-225 Bq 0779 50 0022 53 1 0022 53 04
λAc225 d-1 0069 315 0000 624 1 0000 624 0000 02
λRa225 d-1 0046 520 0000 693 1 0000 693 008
t1-t0 d 337
aRa-226_1 Bqmiddotkg-1 766 39
45
APPENDIX VII DETECTION THRESHOLD AND LIMIT OF THE APPLIED PROCEDURE
TABLE VII 1 TYPICAL DECISION THRESHOLD AND DETECTION LIMIT FOR RELEVANT ISOTOPES
Symbol unit 210Pb 210Po 234U 238U 230 Th 232 Th 226Ra
k 165 165 165 165 165 165 165
m kg 0000 5 0000 5 0000 5 0000 5 0000 5 0000 5 0000 5
ε 086 031 026 026 035 035 025
R 086 073 094 094 068 068 061
n0 52 16 4 4 6 6 28
Tg s 36 000 98 899 343 024 343 024 277 345 277 345 124 984
t0 s 35 542 548 190 512 901 512 901 559 286 559 286 446 755
a Bqmiddotkg-1 13 036 009 009 012 012 068
a1 Bqmiddotkg-1 38 11 028 028 036 036 205
u2(0) Bq2middotkg-2 29 015 0008 4 0008 4 0006 5 0004 7 078
u2(a1) Bq2middotkg-2 23 041 0059 0025 0028 0052 204
a Bqmiddotkg-1 24 12 052 019 018 019 43
46
APPENDIX VIII VALIDATION TEST RESULTS OF THE PROCEDURE
TABLE VIII 1 VALIDATION RESULTS FOR RELEVANT RADIONUCLIDES
Parameters 210Po 210Pb 234U 238U 230Th 226Ra
C Bq kg-1 680 680 120 120 211 780
X Bq kg-1 653 659 127 123 221 793
u(C) Bq kg-1 58 58 9 11 9 62
u(X ) Bq kg-1 23 22 5 5 10 35
δ() -40 -31 58 25 47 17
rL Bq kg-1 106 102 48 47 62 498
RL Bq kg-1 237 454 59 53 89 707
PI() 92 92 85 100 62 91
TABLE VIII 2 ANALYSIS OF VARIANCE (ANOVA) FOR 210Po 210Pb 238U 230Th AND 226Ra IN PHOSPHOGYPSUM
Nuclide SSwb SSbb MSwb MSbb Swb
(as CV)
Sbb
(as CV)
210Po 124 62 151 79 312 1687 271 254
210Pb 8385 197 54 210 2195 220 302
238U 314 386 785 429 227 215
230Th 2176 1598 544 178 334 225
226Ra 412 686 137 858 121 054
SSwb sum of squares within bottles
SSbb sum of squares between bottles
MSwb mean of squares within bottles
MSbb mean of squares between bottles
Swb standard deviation as percent of covalent variance within bottles
Sbb standard deviation as percent of covalent variance between bottles
47
550
600
650
700
750
0 10 20 30 40 50
Samples
Act
ivity
of
21
0 Pb
in th
e sa
mp
le (
Bq
kg
dry
)
Mean1σ
-2σ
-1σ
3σ
2σ
-3σ
FIG VIII 1 210Pb results with associated uncertainties
550
600
650
700
750
0 10 20 30 40 50Samples
Act
ivity
of
21
0 Po
in t
he s
ampl
e (B
qkg
dry
)
Mean
1σ
-1σ
3σ
2σ
-3σ-2σ
FIG VIII 2 210Po results with associated uncertainties
48
110
115
120
125
130
135
140
0 10 20 30 40 50
Samples
Act
ivity
of
238
U in
the
sam
ple
(B
qkg
dry
)
Mean
1σ
-1σ
3σ
2σ
-3σ
-2σ
FIG VIII 3 238U results with associated uncertainties
105
110
115
120
125
130
135
140
145
150
0 10 20 30 40 50
Samples
Act
ivity
of
23
4 U in
the
sa
mpl
e (B
qkg
dry
)
Mean1σ
-2σ-1σ
3σ2σ
-3σ
FIG VIII 4 234U results with associated uncertainties
49
190
200
210
220
230
240
250
0 5 10 15 20 25 30 35 40 45 50
Samples
Act
ivity
of
23
0 Th
in th
e s
am
ple
(B
qk
g d
ry)
2σ
3σ
1σ
-1σ
-2σ
-3σ
Mean
FIG VIII 5 230 Th results with associated uncertainties
05
10
15
20
25
30
35
40
0 10 20 30 40 50
Samples
Act
ivity
of
23
2 Th
in th
e sa
mp
le (
Bq
kg
dry
)
Mean
1σ
-2σ
-1σ
3σ
2σ
-3σ
FIG VIII 6 232 Th results with associated uncertainties
50
650
700
750
800
850
900
1 2 3 4 5 6 7 8 9 10 11 12 13 14 15 16 17 18 19 20
Sample
Act
ivity
of
226 R
a in
th
e sa
mp
le (
Bq
kg
dry
)
Mean
1σ
-1σ
3σ
2σ
-3σ
-2σ
FIG VIII 7 226Ra results with associated uncertainties
51
CONTRIBUTORS TO DRAFTING AND REVIEW
Hampe D Gaigl FA
Verein fuumlr Kernverfahrenstechnik und Analytik Rossendorf eV Dresden Germany IAEA Environment Laboratories Terrestrial Environment Laboratory Seibersdorf Austria
Kim C-K IAEA Environment Laboratories Terrestrial Environment Laboratory Seibersdorf Austria
Kis-Benedek Gy IAEA Environment Laboratories Terrestrial Environment Laboratory Seibersdorf Austria
Martin P IAEA Environment Laboratories Terrestrial Environment Laboratory Seibersdorf Austria
Mietelski J W The Henryk Niewodniczanski Institute of Nuclear Physics Polish Academy of Sciences Poland
Sansone U IAEA Environment Laboratories Terrestrial Environment Laboratory Seibersdorf Austria
Varga B Central Agricultural Office Food and Feed Safety Directorate Hungary
15
ccPb
calfcalofgcal mC
mmfR
minus
minus=
)( ( 4 )
When the amount of Pb in the sample is not negligible compared with that in the Pb carrier the sample Pb content should be allowed for in calculation of the chemical recovery of Pb The chemical recovery of Pb in the sample can be calculated by Eqs (5 6)
)(
)(
ssPbccPb
fofg
mCmC
mmfR
minusminus +minus
= ( 5 )
Mass ratio (fg) of atomic mass of Pb to molar mass of Pb-oxalate
oxalatePb
Pbg M
Mf
minus
= (6 )
10114 Calculation of the activity of 210Pb
The activity of 210Pb on the separation date can be calculated from the LSC measurement using the following equations
Rm
ffZa
s
PbPbsPb ε
minusminusminus = 32
210 (7)
22102
tPb
Pbef minusminusminus = λ ( 8 )
321013210
3 tPb
PbPbe
tf
minusminus= minus
minus λλ
(9 )
However if the time interval (t2) between the separation of 210Pb and the beginning of the measurement and the counting time of the sample (t3) are much smaller than the half life of 210Pb (222 y) f2-Pb f3-Pb u(f2-Pb) and u(f3-Pb) are negligible
1012 Calculation of the activity of 210Po
The activity of 210Po on the separation date is calculated according to the procedure detailed in IAEAAQ12 [8]
1013 Calculation of the activities of the U and Th isotopes
The ratio of the net counts of the tracer and analyte peak is used to calculate the activity of the analyte in the sample on the date of chemical separation taking into account the activity of the tracer solution the masses of the sample and the tracer used The activity of the analyte (as Bq(kg dry)-1) at the separation time is calculated by the following formula
16
TgT
g
s
TTTTT
nTs
nTs rr
rr
m
fmCfm
rm
rCa
0
0
minusminus
== (16)
The decay of the tracer between its reference date (from the certificate) and counting is taken into correction by fT as follows
sTT t
T ef λminus= (17)
The activity of analyte in the sample should be calculated back to the date of sample collection
teaa
λminus=0 (18)
The detector efficiency is not needed in isotope dilution alpha spectrometry for calculation of the activity of the analyte but is needed for calculation of the chemical recovery It is determined from the activity of the tracer added and the net counts in the corresponding peak as follows
sTT t
TT
nT emC
rR λ
εminus= (19)
The detector efficiency is determined by the calibration source prepared in a similar way as the analytes and using the same measurement conditions For analytes which are co-precipitated the calibration source also should be co-precipitated using the same conditions including filter diameter For analytes which are electrodeposited the calibration source should also be prepared by electrodeposition Efficiency determinations are typically performed and regularly checked in the frame of analytical quality control The efficiency can be calculated according to the following equation
cal
caln
A
r =ε (20)
Where
Rn cal net count rate of calibration source in respective ROI
Acal certified activity of the calibration source
1014 Calculation of the activity of 226Ra [9]
10141 Calculation of the chemical recovery of Ra
The chemical recovery is determined by using the peak of 217At at 70669 keV (Pα 0999 32) The ingrowth of 225Ac (T12 100 d) the daughter of 225Ra is directly associated with the short lived progenies 221Fr (T12 48 min) 217At (T12 323 ms) and 213Po (T12 37 micros) When the daughters are in equilibrium with 225Ra the 217At peak shows no overlap with descendants of natural isotopes of radium in the alpha spectrum (225Ac interferes with 224Ra 221Fr interferes with 220Rn) From the initial tracer activity AT (added 229Th225Ra) the maximum detectable count rate rnTmax is calculated by taking into account the decay of unsupported 225Ra after its separation from Th (tsTh-229) as well as the build-up of 225Ac (tsRa-225) in the following equation
17
225225
225)(max
229225225
minusminus
minusminusminus
minus= minusminusminus
RaAc
ActtTnT
sThsRaRaeArλλ
λε λ (21)
The chemical recovery R is calculated as ratio of the measured count rate rnT and theoretical value rnTmax
maxnT
nT
r
rR = (22)
10142 Calculation of activity of 226Ra
While AT is the activity of the 225Ra tracer after the separation from 229Th its activity at the beginning of the build-up of 225Ac is yielded as follows
)(225
225225 sAcRa ttTRa eAA minusminus
minusminusminus= λ
( 2 4 )
The activity of 225Ac in any time is given by
( )225225
)()(225225
225
225225225225
minusminus
minusminusminusminusminusminus
minus minusminus=
minusminusminusminus
RaAc
ttttRaAc
Ac
AcAcAcRa eeAA
λλλ λλ
(25)
Integrating over the counting period with tm as the start and tem as the end of the measurement results into the activity of 225Ac at tem
( )( )( ) ( )( )
minusminusminus
= minusminusminusminus minusminusminusminus
minusminusminus
minusminusminus
225225225225
225225225
225225225
1)( AcemRaAcmRa tttt
RamemRaAc
AcRaemmAc ee
ttAttA λλ
λλλλ
( ) ( )( )
minusminus minusminusminusminus minusminusminusminus
minus
225225225225
225
1AcemAcAcmAc tttt
Ac
ee λλ
λ (26)
Finally the activity concentration of 226Ra is the following
217
226225226 )(
minus
minusminusminus =
At
RaemmAcRa r
rttAA (27)
where
0
0226226226 t
n
tt
nr Ra
mem
RaRa
minusminusminus minus
minus= and
0
0217217217 t
n
tt
nr At
mem
AtAt
minusminusminus minus
minus=
102 Expression of combined uncertainties of relevant isotopes
According to the Guide to Expression of Uncertainty in Measurement [11 12] the combined uncertainty is described in detail and an example is calculated for each relevant radionuclide in Appendix VI
18
103 Decision threshold
In accordance with ISO 119292010 the decision threshold gives a decision on whether or not the physical effect quantified by the measurand is present
The decision threshold a is the non-negative measurand quantifying the physical effect of interest If the result a is below the decision threshold the result can not be attributed to the physical effect nevertheless it can not be concluded that it is absent If the physical effect is really absent the probability of taking the wrong decision that the effect is present is equal to the specified probability of α (the error of first kind often chosen 005 and moreover α=β where β is the error of second kind then k1-α=k1-β=165) Any of the determined primary measurement result is only significant for the true value of the measurand to differ from zero if it is larger than the decision threshold given here
a=k1-αu(0) where u(0) is the uncertainty associated to the non-negative measurand uncertainty of decision threshold itself (with other words it can be estimated as uncertainty associated to slightly higher values than background or reagent blank depending on the procedure) and can be quantified here as
20
0
03
01)0(
t
n
tt
n
Rmu
s
+=ε
(28)
104 Detection limit
In accordance with ISO 119292010 the detection limit indicates the smallest true value of the measurand which can be still detected with the applied procedure this gives a decision on whether or not the measurement procedure satisfies the requirements and is therefore suitable for the intended measurement purpose In order to find out whether a procedure is suitable for the purpose the detection limit is compared with the specified guideline value of the measurand
The detection limit a is the smallest true value of the measurand for which the probability of the wrong assumption that the physical effect is absent does not exceed the probability β (error of the second kind) The detection limit is obtained as the smallest solution of the following equation
a=a+k1-β(a) where a ge a (29)
Eq (29) is an implicit equation which can be calculated by iteration As a starting approximation a1=3a can be chosen in most cases the iteration converges and the linear interpolation with approximation of a=(k1-α+k1-β)u(a) leads to the approximation
)0()( 221
21
2 ukkqqa αβ minusminus minus++= (30)
with [ ]
minus+= minusminus )0()(
2
1)0( 2
12
1
21
1 uaua
kukq a
β (31)
If α=β than k1-α=k1-β=k a=2q follows
19
[ ])0()()0(2 21
2
1
2 uau
a
kuka minus+= (32)
Where α is the probability of the error of first kind the probability of rejecting a hypothesis if it is true and β is the probability of the error of second kind the probability of accepting a hypothesis if it is false
The detection threshold and limit of the isotopes in the applied procedure are described in Table VII 1 of Appendix VII
The difference between using the decision threshold and using the detection limit is that the measured values are to be compared with the decision threshold whereas the detection limit is to be compared with the guideline value (guideline value corresponds to scientific legal or other requirements for which the measuring procedure intended to assess)
11 VALIDATION OF THE PROCEDURE
The procedure was validated with an IAEA reference material IAEA-434 The material was initially characterized at IAEA Environment Laboratories in Seibersdorf during the feasibility study phase Then the characterization of the material took place within the interlaboratory comparison piloted by IAEA Environment Laboratories in Seibersdorf in cooperation with the Consultative Committee on Ionization Radiation (CCRI) of the International Bureau des Poids et Mesure (PIBM) The results reported in this comparison were used to derive the property values of the measurands of interest The IAEA-434 reference material [12] was collected from a processing plant located in Gdansk (Poland) in 2003 The matrix composition is CaSO4middot2H2O (96) P2O5 (1-2) F total (12) SiO2 (1) Al2O3 (02) The property values of all radionuclides of IAEA 434 were established on the basis of a robust approach proposed by DL Duewer [13] and the Mixture Model median (MM-median) of the analytical results reported by the expert laboratories was calculated To estimate the standard uncertainty associated with the property value the MM-median based standard deviation was calculated from the span of the central 50 of the MM probability density function The validation results of the procedure are shown in Tables VIII 1 and VIII 2 Figs VIII 1ndashVIII 7 of Appendix VIII 111 Trueness of the method
The relative bias of the method is calculated by the following formula
100() timesminus=C
CXδ (34)
112 Precision of the method
The precision index ( PI() ) is calculated according to the following formulas
100)()(
()2
2
2
2
times+=X
Xu
C
CuPI (35)
20
113 Repeatability limit
The repeatability limit is estimated by analyzing five subsamples from the same bottle of the IAEA-434 reference material for the relevant radionuclides investigating the repeatability conditions instrument analyst shortest time etc The repeatability limit is calculated by the following formula
rL Sr 82= (36)
114 Reproducibility limit
The reproducibility limit is also estimated by analyzing the IAEA-434 reference material from ten duplicates samples were taken from ten randomly selected packing unit with at least one parameter being changed in the analytical system (analyst analysis date instrument etc) The reproducibility limit is calculated by the following formula
RL SR 82= (37)
115 Outlier test
The presence of individual values that appear to be inconsistent with all other laboratories or values may cause some problems during the final evaluation of data According to ISO 5725-2 an outlier test should be performed before the calculation of repeatability and reproducibility The analysis includes a systematic application of a statistical test of outliers a great variety are available which could be used for the purposes of this part of ISOIEC 17025 Usually the graphical consistency technique or the numerical outlier test are applied Cohranrsquos test of variabilities should be applied first and then any necessary action should be taken Grubbrsquos test is primarily a test of in between laboratory variability
116 Acceptance criteria
The method can be accepted if
PI()lt 25
LRltδ ( 3 8 )
According to these criteria the method performs well as the Table VIII 1 of Appendix VIII shows
12 TEST REPORT
The test report shall conform to ISOIEC 17025 requirements and shall contain the following information
bull a title (test report calibration report reference material production etc)
bull the name and address of the laboratory and location where any part of the test or calibration or production of reference material etc were carried out
bull unique identification of the report on each page with numbering of pages
21
bull analysis request code
bull reference to the measurement method used
bull sampling date (if available)
bull sample description
bull sample code or identification number
bull date of the separation of analyte
bull applied tracers with their reference dates and activity values with the code of their certificate
bull the results with units of measurement and associated uncertainty value expressed in the same unit as the result
bull date to which the test result has been corrected (corrected to the sampling date or separation time dd-mm-yyyy)
bull responsible person (with accessibility)
22
REFERENCES
[1] FEDERAL REGISTER National emission standards for hazardous air pollutants 57 107 (1992) 23305-23320
[2] RUTHERFORD PM DUDAS MJ AROCENA JM Heterogeneous distribution of radionuclides barium and strontium in phosphogypsum by-product Sci Total Environ 180 (1996) 201-209
[3] NATIONAL COUNCIL ON RADIATION PROTECTION AND MEASUREMENTS Evaluation of Occupational and Environmental Exposures to Radon and Radon Daughters in the United States NCRP Report 78 (1984)
[4] MARTIN P HANCOCK GJ Routine analysis of naturally occurring radionuclides in environmental samples by alpha-particle spectrometry Supervising Scientist Report 180 (2004) httpwwwenvironmentgovaussdpublicationsssr180html
[5] INTERNATIONAL ATOMIC ENERGY AGENCY Reference Material IAEA-434 Naturally Occurring Radionuclides in Phosphogypsum IAEA Analytical Quality in Nuclear Applications Series No 17 IAEAAQ17 IAEA Vienna (2010)
[6] MEDLEY P BOLLHOumlFER A ILES M RYAN B MARTIN P Barium sulfate method for radium-226 analysis by alpha spectrometry Environmental Research Institute of the Supervising Scientist internal report 501 (2005)
[7] VAJDA N LAROSA J ZEISLER R DANESI P KIS-BENEDEK G A Novel Technique for the Simultaneous Determination of 210Pb and 210Po using a Crown Ether J Environ Radioactivity 37 (1997) 355-372
[8] INTERNATIONAL ATOMIC ENERGY AGENCY A Procedure for the Determination of Po-210 in Water Samples by Alpha Spectrometry IAEA Analytical Quality in Nuclear Applications Series No 12 IAEAAQ12 IAEA Vienna (2009)
[9] GUOGANG J TORRI G INNOCENZI P OZONE R Di LULLO A Determination of radium isotopes in mineral and environmental water samples by alpha-spectrometry J of Radioanalytical and Nuclear Chemistry 267 3 (2005) 505-514
[10] EURACHEMCITAC Guide Quantifying uncertainty in analytical measurement 2nd Ed(2000)
[11] INTERNATIONAL ATOMIC ENERGY AGENCY Quantifying Uncertainty in Nuclear Analytical Measurements IAEA-TECDOC-1401 IAEA Vienna (2004)
[12] SHAKHASHIRO A SANSONE U Technically Enhanced Naturally Occurring Radionuclides (TENORM) in Phosphogypsum The Interlaboratory Comparison CCRI(II)07-35 Metrologia (2009)
[13] DUEWER DL A Robust Approach for the Determination of CCQM Key Comparison Reference Values and Uncertainties Working document CCQM04-15 BIPM wwwbipminfoccCCQMAllowed10CCQM04-15pdf (2004)
23
[14] Monographie BIPM-5 Vol 1ndashMonographie BIPM-5 Vol 5
httpwwwnucleideorg Decay Data Evaluation Project (DDEP) accessed in October 2010
[15] NuDat 25 (Database at the US NNDC) httpwww-ndsiaeaorg accessed in October 2010
[16] HORWITZ et al A Novel Strontium-Selective Extraction Chromatographic Resin Solvent Extraction amp Ion Exchange 10 (1992) 313
[17] HORWITZ et al Extraction Chromatography of Actinides and Selected Fission Products Principles and Achievement of Selectivity presented at International Workshop on the Application of Extraction Chromatography in Radionuclide Measurement IRMM Geel 1998
[18] HORWITZ et al Separation and Preconcentration of Actinides by Extraction Chromatography Using a Supported Liquid Anion Exchanger Application to the Characterization of High-Level Nuclear Waste Solutions Analytica Chimica Acta 310 (1995) 63-78
[19] HORWITZ et al Separation and Preconcentration of Uranium from Acidic Media by Extraction Chromatography Analytica Chimica Acta 266 (1992) 25-37
[20] C-K KIM MARTIN P FAJGELJ A Quantification of measurement uncertainty in the sequential determination of 210Pb and 210Po by liquid scintillation counting and alpha particle spectrometry Accreditation and Quality Assurance 13 12 (2008) 691-702
[21] J KRAGTEN Calculating Standard Deviation and Confidence Intervals with a Universally Applicable Spreadsheet Technique Analyst 119 (1994) 2161ndash2165
24
APPENDIX I NUCLEAR DATA OF RELEVANT RADIONUCLIDES AND DECAY CHAINS OF U
AND Th SERIES
TABLE I 1 NUCLEAR DATA OF RELEVANT RADIONUCLIDES [14]
Radionuclide Half-life Disintegration modes
E (MeV) Probability ()
225Ac 100(1) d α 5580 5(14) 095(4)
α 5599 3(14) 0114(7)
α 5609 0(14) 109(5)
α 5637 3(14) 416(23)
α 5682 2(14) 131(4)
α 5686 4(14) 0021(14)
α 5723 1(14) 203(23)
α 5730 5(14) 16(3)
α 5731 6(14) 124(10)
α 5731 9(17) 90(5)
α 5797 7(14) 62(9)
α 5793 1(21) 189(20)
α 5804 2(14) 03
α 5829 6(14) 524(24)
217At 323(4) x 10-3 s α 6484 7(16) 0016 7(8)
α 6813 8(16) 0038 4(15)
α 7066 9(16) 99932(3)
133Ba 10540(6) y γ 0053 162 2(6) 214(3)
γ 0079 614 2(12) 265(5)
γ 0080 997 9(11) 329(3)
γ 0276 398 9(12) 716(5)
γ 0302 850 8(5) 1834(13)
γ 0356 012 9(7) 6205(19)
γ 0383 848 5(12) 894(6)
210Bi 5012(5) d β 1162 1(8) 99999 86(2)
212Bi 6054(6) min β 0633(2) 190(4)
β 0741(2) 145(29)
β 1527(2) 458(21)
β 2254(2) 5523(21)
α 6050 92(4) 251(1)
α 6090 02(4) 97(1)
221Fr 479(2) min α 6126 3(15) 151(2)
α 6243(2) 134(7)
α 6341 0(13) 828(2)
TABLE I 1 NUCLEAR DATA OF RELEVANT RADIONUCLIDES [14] (cont)
25
Radionuclide Half-life Disintegration modes
E (MeV) Probability ()
210Pb 2223(12) y β 0017 0(5) 802(13)
β 0063 5(5) 198(13)
γ 0046 539(1) 4252(40)
208Po 2898(2) y α 5114 9(14) 99995 8(4)
α 4220(15) 24(7)x10-4
209Po 115(13) y α 4885(2) 198(32)
α 4883(2) 792(32)
α 4622(5) 0548(7)
210Po 138376 3(17) d α 5304 33(7) 99998 76
α 4516 66(9) 0001 24(4)
213Po 370(5) x 10-6 s α 8375 9(25) 99995 0(5)
216Po 0150(5) s α 6778 6(5) 99998 1(3)
α 5988 6(10) 0001 9(3)
218Po 3094(6) min α 6002 35(9) 99976 9(32)
223Ra 1143(5) d α 5747 0(4) 900(20)
α 5716 23(29) 516(13)
α 5606 73(30) 252(5)
α 5539 80(90) 900(20)
224Ra 3627(7) d α 5448 81(16) 526(7)
α 5685 50(15) 9472(7)
γ 0240 986(6) 412(4)
225Ra 1482(19)d β 0316(5) 688(20)
β 0356(5) 312(20)
γ 0040 09(5) 300(7)
226Ra 1 600(7) y α 4601(1) 595(4)
α 4784 34(25) 94038(40)
228Ra 575(4) y β 00127(7) 30(10)
β 00256(7) 87(9)
β 00391(7) 49(10)
β 00395(7) 12(10)
220Rn 558(3) s α 5748 46(14) 0118(15)
α 6288 22(10) 99882(15)
222Rn 3823 2(8) d α 5489 48(30) 9992(1)
228 Th 69860(23) d α 5176 89(23) 020(2)
α 5211 08(22) 038(3)
α 5340 38(22) 262(2)
α 5423 28(22) 732(2)
TABEL I 1 NUCLEAR DATA OF RELEVANT RADIONUCLIDES [14] (cont)
26
Radionuclide Half-life Disintegration
modes E (MeV) Probability ()
229 Th 7 340(160) y α 5053(2) 660(10)
α 4978 5(12) 317(4)
α 4967 5(12) 597(6)
α 4901 0(12) 1020(8)
α 4845 3(12) 5620(20)
α 4814 6(12) 930(8)
230 Th 7538(30) x 104 y α 4687 0(15) 763(3)
α 4620 5(15) 234(10)
232 Th 1402(6) x 109 y α 3810 0(14) 0068(20)
α 3948 5(14) 210(13)
α 4011 2(14) 789(13)
234 Th 2410(3) d β 0105(10) 65(7)
β 0106(10) 141(12)
β 0198(10) 778(15)
γ 0063 30(2) 375(8)
232U 706(11) y α 5263 48(9) 306(6)
α 5320 24(9) 691(6)
233U 1592(2) x 105 y α 4824 2(12) 843(6)
α 4783 5(12) 132
234U 2455(6) x 105 y α 4603 5(7) 0210(2)
α 4722 4(7) 2842(2)
α 4774 6(7) 7137(2)
235U 704(1) x 106 y α 4322(4) 333(6)
α 4397 8(13) 5719(20)
α 4414 9(5) 301(16)
α 4502 4(7) 128(5)
α 4556 0(4) 379(6)
α 4596 4(13) 474(6)
236U 2343(6) x 107 y α 4445(5) 261(40)
α 4494(3) 738(40)
238U 4468(5) x 109 y α 4038(5) 013(3)
α 4151(5) 2233(50)
α 4198(3) 7754(50)
Emax for beta emitting radioisotopes
Data were taken from [15]
27
FIG I 1 Decay chain of 238U [4]
FIG I 2 Decay chain of 232Th [4]
28
APPENDIX II FLOW CHART FOR SEQUENTIAL SEPARATION OF 210Po 210Pb Th U AND 226Ra
IN PHOSPHOGYPSUM
29
APPENDIX III PROPERTIES OF RESINS
III1 Sr resin
FIG III 1 Structure of the Sr resin (wwweichromcom)
FIG III 2 Capacity factor of Sr resin in nitric acid (wwweichromcom) [16]
30
FIG III 3 Capacity factor of Sr resin in nitric acid (wwweichromcom) [17]
III2 TEVA resin
FIG III 4 Structure of the TEVA resin (wwweichromcom)
31
FIG III 5 Capacity factor of TEVA resin in nitric acid and hydrochloric acid (wwweichromcom) [18]
III3 UTEVA resin
FIG III 6 Structure of the UTEVA resin (wwweichromcom)
32
FIG III 7 Capacity factor of UTEVA resin in nitric acid and hydrochloric acid (wwweichromcom) [19]
33
APPENDIX IV ALPHA SPECTRA OF ANALYTES
FIG IV 1 Alpha spectrum of Po isotopes
FIG IV 2 Alpha spectrum of Th isotopes in phosphogypsum (with progeny)
228Th is resulted from 232U tracer spiked in the sample
34
FIG IV 3 Alpha spectrum of U isotopes
FIG IV 4 Alpha spectrum of 226Ra and its progeny (spiked with 225Ra)
35
FIG IV 5 Overlapping alpha spectra of U and Po isotopes
FIG IV 6 Overlapping alpha spectra of U and Th (with progeny) isotopes
36
APPENDIX V LIQUIDE SCINTILLATION SPECTRA
a)
b)
A window
(115-320 ch)
B window
(320 -410 ch)
210Po
210Pb
210Bi
210Bi
Co
unts
Ch
ann
elC
oun
tsC
han
nel
Channel number
a)
b)
A window
(115-320 ch)
B window
(320 -410 ch)
210Po
210Pb
210Bi
210Bi
Co
unts
Ch
ann
elC
oun
tsC
han
nel
Channel number
FIG V 1 Typical liquid scintillation spectra of beta-emitting 210Pb and 210Bi and alpha emitting 210Po (calibration sources) a) 210Pb 210Bi and 210Po spectra
b) pure 210Bi spectrum
37
APPENDIX VI CALCULATION OF THE COMBINED UNCERTAINTY
OF THE ACTIVITIES OF THE ANALYTES ON SAMPLING DATE
VI1 Uncertainty of the 210Pb result [20]
VI11 Uncertainty of counting efficiency of 210Pb
2
2
2
2
2210
2
210
2210
222
)()()()()()( )( PbTPbT
calcal
stdPbstdPb
Pbb mum
RuR
aua
utZuZ
u
minus+
minus+
minus++
= minusminus
minusεεελεεε (VI-1)
2
222
2 )()()()()( (Z) BABnBnBAAn furrufruu minus+minus+= (VI-2)
20
2 )()()( AAgAn rururu += (VI-3)
20
2 )()()( BBgBn rururu += (VI-4)
VI12 Uncertainty of the tailing factor fAB
The uncertainty of the tailing factor fAB is calculated according to following equations
2
210
210
2
210
210
)()()(
+
=
minus
minus
minus
minus
BicalnB
BicalnB
BicalAn
BicalAnBABA r
ru
r
ruffu (VI-5)
20
2210210 )()()( ABicalAgBicalAn rururu += minusminus (VI-6)
20
2210210 )()()( BBicalBgBicalBn rururu += minusminus (VI-7)
The uncertainty of counting efficiency for 210Pb can be calculated by Eq (VI-8)
2
2
2
2
2210
2
210
2210
222
)()()()()()( )( PbTPbT
calcal
stdPbstdPb
Pbb mum
RuR
aua
utZuZ
u
minus+
minus+
minus++
= minusminus
minusεεελεεε (VI-8)
2
222
2 )()()()()( (Z) BABnBnBAAn furrufruu minus+minus+= (VI-9)
20
2 )()()( AAgAn rururu += (VI-10)
20
2 )()()( BBgBn rururu += (VI-11)
38
VI13 Uncertainty of chemical recovery of Pb
Uncertainty of chemical recoveries of Pb in calibration source
minusminus+
minus+
= 2
2
2
2
2
2
cal )()(
)()(
)( )(R calfcalfcalof
calcalof
calfcalof
calg
g
cal mumm
Rmu
mm
Rfu
f
Ru
2
1
2
2
2
2
)()(
)()(
minus+
minus+
minus
minusminus
minusc
ccPb
cPbcalcPb
ccPb
ccal mumC
CRCu
mC
mR (VI-12)
The uncertainty of chemical recovery of Pb in the sample can be calculated
minusminus+
minus+
= 2
2
2
2
2
2
)()(
)()(
)( (R) ffof
offof
gg
mumm
Rmu
mm
Rfu
f
Ru
2
2
2
2
)()(
)()( c
ssPbccPb
cPbcPb
ssPbccPb
c mumCmC
CRCu
mCmC
mR
+minus+
+minus+
minusminus
minusminus
minusminus
2
1
2
2
2
2
)()(
)()(
+minus+
+minus+
minusminus
minusminus
minusminuss
ssPbccPb
sPbsPb
ssPbccPb
s mumCmC
CRCu
mCmC
mR (VI-13)
VI14 Uncertainty of mass ratio
The uncertainty of the mass ratio (fg) of atomic mass of Pb to molar mass of Pb-oxalate is calculated using the equations below
22
M Pb)(
+
=
minus
minus
oxalatePb
M
Pbgg M
u
M
uffu oxalatePb (VI-14)
The uncertainty of the molar mass of lead oxalate u(MPb-oxalate) can be derived by combining standard uncertainties in atomic masses of its constituents as shown in Table VI 1
39
TABLE VI 1 STANDARD UNCERTAINTIES OF ATOMIC WEIGHT AND THE GRAVIMETRIC FACTOR fg
Element Atomic weight
(gmol-1)
Quoted uncertainty (gmol-1)
Conversion factor
Standard uncertainty (gmol-1)
Mass ratio of atomic mass of Pb to
molar mass of Pb-oxalate
Uncertainty ofatomic mass
of Pb to molar mass of
Pb-oxalate
Pb 207215 2 0000 15 3 0000 087 0701 9 0000 002
C 12010 7 0000 8 3 0000 46
O 15999 4 0000 3 3 0000 17
VI15 Combined uncertainty of activity of 210Pb
The combined uncertainty of the 210Pb activity is calculated from Eq (VI-15)
minus+
minus+
minus+
= minusminusminusminus 2
2
2102
2
2102
2
210
2
2
2101 )()()()()( s
d
sPb
BA
sPb
nBnB
sPb
BAnA
sPb
Pbc mum
afu
Z
arru
Z
afru
Z
aau
2
1
23
2
3
21022
2
2
2102
2
2102
2
210 )()()()(
+
+
minus+
minus+ minus
minus
minusminus
minus
minusminusminusPb
Pb
sPbPb
Pb
sPbsPbsPb fuf
afu
f
aRu
R
au
aε
ε (VI-15)
)()( 210222 minusminusminus = PbPbPb utffu λ (VI-16)
210
210321033
)(
11)(
3210
3210
minus
minusminus
minus
minusminusminus
minusminus=
minus
minus
Pb
Pbt
t
PbPbPb
u
e
etffu
Pb
Pb
λλλ λ
λ
(VI-17)
However if the time interval (t2) between the separation of 210Pb and the beginning of the measurement and the counting time of the sample (t3) are much smaller than the half life of 210Pb f2-Pb f3-Pb u(f2-Pb) and u(f3-Pb) are negligible The uncertainties associated to components mentioned above can be calculated as follows
0
0
3
)(t
r
t
rru
Po
gn +=
minus
(VI-18)
0
0
3
)(t
r
t
rru t
Po
tgtn +=
minus
(VI-19)
minus+
+
= minusminusminus
minus2
2
2102
2
2102
2
210210 )()()( )( tn
tn
sPo
nn
sPo
TT
sPo
sPo rur
aru
r
aAu
A
aau
2
2
21022
2
2
2102
2
2102
2
210)()()()( T
T
sPo
PoPo
sPo
TT
sPo
ss
sPofu
f
afu
f
amu
m
amu
m
a
+
+
+
minus+ minus
minusminus
minusminusminus
40
2
1
3
2
3
210 )(
+ minus
minus
minusPo
Po
sPo fuf
a (VI-20)
)()( TTTt utffu λ= (VI-21)
)()( 210222 minusminusminusminus = PoPoPoPo utffu λ (VI-22)
210
210321033
)(
11)(
3210
3210
minus
minusminus
minus
minusminusminus
minusminus=
minus
minus
Po
Pot
t
PoPoPo
u
e
etffu
Po
Po
λλλ λ
λ (VI-23)
VI16 Combined uncertainty of activity of 210Po
The uncertainty of the activity of 210Po on the separation date is calculated according to IAEAAQ12 procedure [8]
VI2 Uncertainty of other alpha emitting isotopes
The same formulas are used to calculate the combined uncertainties as equations that are used for calculation of the activity of alpha emitting analytes at the separation time and the sampling date as well as the chemical recovery and counting efficiency These formulas have to be applied in the spreadsheet approach for calculating the combined uncertainties knowing the standard uncertainty of each component VI3 Spreadsheet approach
For the quantifying the uncertainties the spreadsheet technique [21] was used which could be summarised as follows and showed in the Fig VI 1
bull Calculate function y using parameter xj
y=f(x1x2xj xn) (VI-24)
bull recalculate the same function n times increasing xj to xj+dxj (dxj standard deviation) and keeping the remaining parameters constant
y=f(x1x2xj+dxj xn) (VI-25)
bull the uncertainty on the function dy is the square root of the sum of squares
( )sum minus=n
jyydy1
2 (VI-26)
bull The individual variance contribution fj is
( )( )sum minus
minus=
n
j
jj
yy
yyf
1
2
2
(VI-27)
41
FIG VI 1 Spreadsheet approach for quantifying the uncertainty of the measurement
The results are summarised for the individual isotopes in the Tables VI 2ndashVI 9 and the results of the individual analysis with their uncertainties are shown in the Figs VI 3ndashVI 9 The detailed study about the usual contributors of uncertainty in the nuclear analytical techniques could be found in the IAEA-TECDOC-1401 [11] TABLE VI 2 AN EXAMPLE OF QUANTIFYING UNCERTAINTIES OF 210Po RESULT
Symbol unit Value of variable
Uncertainty Conversion factor to standard uncertainty
Standard uncertainty
Contribution to combined
uncertainty ()
m g 0508 9 0007 3 3 0004 2 010
rgt s-1 0197 0075 1 0075 361
r0t s-1 0000 017 0000 034 1 0000 034 0000 014
rg s-1 0081 0029 1 0029 6352
r0 s-1 0000 034 0000 033 1 0000 033 0000 08
at Bq 0829 0019 1 0019 0252
λt d-1 0000 019 0000 013 1 0000 013 negligible
λPo d-1 0005 72 x 10-9 1 72x10-9 negligible
ft 0982 14 0000 43 1 0000 43 0000 091
f2-Po 1005 73 x 10-9 1 73x10-9 negligible
f3-Po 1005 5 18 x 10-8 1 18 x10-8 negligible
aPo1 Bqmiddotkg-1 672 94
contribution is less than 1 x 10⁻⁵
TABLE VI 3 AN EXAMPLE OF QUANTIFYING UNCERTAINTIES OF EFFICIENCY OF 210Pb
Symbol unit Value of variable
Uncertainty
Conversion factor to standard
uncertainty
Standard uncertainty
Contribution to combined
uncertainty ()
mvial g 14936 35 0000 1 3 0000 17 0004 8
42
Symbol unit Value of variable
Uncertainty
Conversion factor to standard
uncertainty
Standard uncertainty
Contribution to combined
uncertainty ()
mvial+carrsol g 16036 54 0000 1 3 0000 17 0004 8
cPb g g-1 0027 42 0000 021 1 0000 021 011
mvial g 16036 72 0000 10 3 0000 17 0004 8
mvial+std g 17132 6 0000 10 3 0000 17 0004 8
astd Bq 1245 0189 1 0189 805
fgravimetry 0701 85 0000 41 1 0000 41 0066
mfilter g 0036 54 0000 10 3 0000 17 42
mfilter+Pb-precipitate g 0073 77 0000 10 3 0000 17 41
rA s-1 7362 0041 1 0041 76
rA0 s-1 0029 5 0003 1 0002 7 0035
rB s-1 0416 0 0011 1 0011 060
rB0 s-1 0011 7 0002 1 0002 2 0024
fAB 1049 0023 1 0023 040
t12 Pb d 814508 7305 1 731 23
tmeas-ref d 4 532 -
ε 0859 7 0015 3
43
TABLE VI 4 AN EXAMPLE OF QUANTIFYING UNCERTAINTIES OF 210Pb RESULT
Symbol unit Value of variable
Uncertainty Conversion factor to standard uncertainty
Standard uncertainty
Contribution to combined
uncertainty ()
ms g 0508 9 0007 3 3 0004 2 03
rgA s-1 0283 0035 1 0035 883
r0A s-1 0011 7 0002 2 1 0002 2 03
rgB s-1 0031 0009 1 0009 58
r0B s-1 0005 6 0002 3 1 0002 3 04
Ζ s-1 0245 1 0032 7 1 0032 7 -
fAB 1015 3 0012 9 1 0012 9 001
ε 0859 7 0015 3 1 0015 3 13
R 0858 8 0025 3 1 0077 2 35
aPb1 Bqmiddotkg-1 652 12
TABLE VI 5 AN EXAMPLE OF QUANTIFYING UNCERTAINTIES OF 234U RESULT
Symbol unit Value of variable
Uncertainty Conversion factor to standard uncertainty
Standard uncertainty
Contribution to combined
uncertainty ()
ms g 0508 9 0007 3 3 0004 2 003
rgt s-1 0021 78 0008 01 1 0008 369
r0t s-1 0000 030 0000 022 1 0000 022 0000 5
rg s-1 0016 15 0005 90 1 0006 628
r0 s-1 0000 016 0000 022 1 0000 022 0000 1
at Bq 0088 35 0002 10 1 0002 01 029
aU-234_1 Bqmiddotkg-1 129 3
TABLE VI 6 AN EXAMPLE OF QUANTIFYING UNCERTAINTIES OF 238U RESULT
Symbol unit Value of variable
Uncertainty Conversion factor to standard uncertainty
Standard uncertainty
Contribution to combined
uncertainty ()
ms g 0508 9 0007 3 3 0004 2 003
rgt s-1 0021 78 0008 01 1 0008 353
r0t s-1 0000 030 0000 022 1 0000 022 0000 5
rg s-1 0015 61 0005 67 1 0006 644
r0 s-1 0000 009 0000 008 1 0000 008 0000 1
at Bq 0088 35 0002 10 1 0002 1 028
aU-238_1 Bqmiddotkg-1 124 3
44
TABLE VI 7 AN EXAMPLE OF QUANTIFYING UNCERTAINTIES OF 230Th RESULT
Symbol unit Value of variable
Uncertainty Conversion factor to standard uncertainty
Standard uncertainty
Contribution to combined
uncertainty ()
ms g 0508 9 0007 3 3 0004 2 005
rgt s-1 0022 63 0006 44 1 0006 387
r0t s-1 0000 077 0000 063 1 0000 063 0006 1
rg s-1 0028 38 0007 90 1 0008 608
r0 s-1 0000 012 0000 010 1 0000 010 0000 1
at Bq 0090 03 0002 30 1 0002 303 051
aTh-230_1 Bqmiddotkg-1 223 9
TABLE VI 8 AN EXAMPLE OF QUANTIFYING UNCERTAINTIES OF 232Th RESULT
Symbol unit Value of variable
Uncertainty Conversion factor to standard uncertainty
Standard uncertainty
Contribution to combined
uncertainty ()
ms g 0508 9 0007 3 3 0004 2 004
rgt s-1 0022 63 0006 44 1 0006 265
r0t s-1 0000 077 0000 063 1 0000 063 0004 2
rg s-1 0000 28 0000 10 1 0000 1 727
r0 s-1 0000 011 0000 008 1 0000 008 048
at Bq 0090 03 0002 30 1 0002 3 035
aTh-232_1 Bqmiddotkg-1 21 009
TABLE VI 9 AN EXAMPLE OF QUANTIFYING UNCERTAINTIES OF 226Ra RESULT
Symbol unit Value of variable
Uncertainty Conversion factor
to standard uncertainty
Standard uncertainty
Contribution to combined
uncertainty ()
ms g 0508 9 0007 3 3 0004 2 003
rgt s-1 0043 10 0025 05 1 0025 05 603
r0t s-1 0000 111 0000 128 1 0000 128 0004
rg s-1 0063 32 0018 78 1 0018 78 393
r0 s-1 0000 070 015 0000 070 013 1 0000 070 013 0000 5
at Ra-225 Bq 0779 50 0022 53 1 0022 53 04
λAc225 d-1 0069 315 0000 624 1 0000 624 0000 02
λRa225 d-1 0046 520 0000 693 1 0000 693 008
t1-t0 d 337
aRa-226_1 Bqmiddotkg-1 766 39
45
APPENDIX VII DETECTION THRESHOLD AND LIMIT OF THE APPLIED PROCEDURE
TABLE VII 1 TYPICAL DECISION THRESHOLD AND DETECTION LIMIT FOR RELEVANT ISOTOPES
Symbol unit 210Pb 210Po 234U 238U 230 Th 232 Th 226Ra
k 165 165 165 165 165 165 165
m kg 0000 5 0000 5 0000 5 0000 5 0000 5 0000 5 0000 5
ε 086 031 026 026 035 035 025
R 086 073 094 094 068 068 061
n0 52 16 4 4 6 6 28
Tg s 36 000 98 899 343 024 343 024 277 345 277 345 124 984
t0 s 35 542 548 190 512 901 512 901 559 286 559 286 446 755
a Bqmiddotkg-1 13 036 009 009 012 012 068
a1 Bqmiddotkg-1 38 11 028 028 036 036 205
u2(0) Bq2middotkg-2 29 015 0008 4 0008 4 0006 5 0004 7 078
u2(a1) Bq2middotkg-2 23 041 0059 0025 0028 0052 204
a Bqmiddotkg-1 24 12 052 019 018 019 43
46
APPENDIX VIII VALIDATION TEST RESULTS OF THE PROCEDURE
TABLE VIII 1 VALIDATION RESULTS FOR RELEVANT RADIONUCLIDES
Parameters 210Po 210Pb 234U 238U 230Th 226Ra
C Bq kg-1 680 680 120 120 211 780
X Bq kg-1 653 659 127 123 221 793
u(C) Bq kg-1 58 58 9 11 9 62
u(X ) Bq kg-1 23 22 5 5 10 35
δ() -40 -31 58 25 47 17
rL Bq kg-1 106 102 48 47 62 498
RL Bq kg-1 237 454 59 53 89 707
PI() 92 92 85 100 62 91
TABLE VIII 2 ANALYSIS OF VARIANCE (ANOVA) FOR 210Po 210Pb 238U 230Th AND 226Ra IN PHOSPHOGYPSUM
Nuclide SSwb SSbb MSwb MSbb Swb
(as CV)
Sbb
(as CV)
210Po 124 62 151 79 312 1687 271 254
210Pb 8385 197 54 210 2195 220 302
238U 314 386 785 429 227 215
230Th 2176 1598 544 178 334 225
226Ra 412 686 137 858 121 054
SSwb sum of squares within bottles
SSbb sum of squares between bottles
MSwb mean of squares within bottles
MSbb mean of squares between bottles
Swb standard deviation as percent of covalent variance within bottles
Sbb standard deviation as percent of covalent variance between bottles
47
550
600
650
700
750
0 10 20 30 40 50
Samples
Act
ivity
of
21
0 Pb
in th
e sa
mp
le (
Bq
kg
dry
)
Mean1σ
-2σ
-1σ
3σ
2σ
-3σ
FIG VIII 1 210Pb results with associated uncertainties
550
600
650
700
750
0 10 20 30 40 50Samples
Act
ivity
of
21
0 Po
in t
he s
ampl
e (B
qkg
dry
)
Mean
1σ
-1σ
3σ
2σ
-3σ-2σ
FIG VIII 2 210Po results with associated uncertainties
48
110
115
120
125
130
135
140
0 10 20 30 40 50
Samples
Act
ivity
of
238
U in
the
sam
ple
(B
qkg
dry
)
Mean
1σ
-1σ
3σ
2σ
-3σ
-2σ
FIG VIII 3 238U results with associated uncertainties
105
110
115
120
125
130
135
140
145
150
0 10 20 30 40 50
Samples
Act
ivity
of
23
4 U in
the
sa
mpl
e (B
qkg
dry
)
Mean1σ
-2σ-1σ
3σ2σ
-3σ
FIG VIII 4 234U results with associated uncertainties
49
190
200
210
220
230
240
250
0 5 10 15 20 25 30 35 40 45 50
Samples
Act
ivity
of
23
0 Th
in th
e s
am
ple
(B
qk
g d
ry)
2σ
3σ
1σ
-1σ
-2σ
-3σ
Mean
FIG VIII 5 230 Th results with associated uncertainties
05
10
15
20
25
30
35
40
0 10 20 30 40 50
Samples
Act
ivity
of
23
2 Th
in th
e sa
mp
le (
Bq
kg
dry
)
Mean
1σ
-2σ
-1σ
3σ
2σ
-3σ
FIG VIII 6 232 Th results with associated uncertainties
50
650
700
750
800
850
900
1 2 3 4 5 6 7 8 9 10 11 12 13 14 15 16 17 18 19 20
Sample
Act
ivity
of
226 R
a in
th
e sa
mp
le (
Bq
kg
dry
)
Mean
1σ
-1σ
3σ
2σ
-3σ
-2σ
FIG VIII 7 226Ra results with associated uncertainties
51
CONTRIBUTORS TO DRAFTING AND REVIEW
Hampe D Gaigl FA
Verein fuumlr Kernverfahrenstechnik und Analytik Rossendorf eV Dresden Germany IAEA Environment Laboratories Terrestrial Environment Laboratory Seibersdorf Austria
Kim C-K IAEA Environment Laboratories Terrestrial Environment Laboratory Seibersdorf Austria
Kis-Benedek Gy IAEA Environment Laboratories Terrestrial Environment Laboratory Seibersdorf Austria
Martin P IAEA Environment Laboratories Terrestrial Environment Laboratory Seibersdorf Austria
Mietelski J W The Henryk Niewodniczanski Institute of Nuclear Physics Polish Academy of Sciences Poland
Sansone U IAEA Environment Laboratories Terrestrial Environment Laboratory Seibersdorf Austria
Varga B Central Agricultural Office Food and Feed Safety Directorate Hungary
20
113 Repeatability limit
The repeatability limit is estimated by analyzing five subsamples from the same bottle of the IAEA-434 reference material for the relevant radionuclides investigating the repeatability conditions instrument analyst shortest time etc The repeatability limit is calculated by the following formula
rL Sr 82= (36)
114 Reproducibility limit
The reproducibility limit is also estimated by analyzing the IAEA-434 reference material from ten duplicates samples were taken from ten randomly selected packing unit with at least one parameter being changed in the analytical system (analyst analysis date instrument etc) The reproducibility limit is calculated by the following formula
RL SR 82= (37)
115 Outlier test
The presence of individual values that appear to be inconsistent with all other laboratories or values may cause some problems during the final evaluation of data According to ISO 5725-2 an outlier test should be performed before the calculation of repeatability and reproducibility The analysis includes a systematic application of a statistical test of outliers a great variety are available which could be used for the purposes of this part of ISOIEC 17025 Usually the graphical consistency technique or the numerical outlier test are applied Cohranrsquos test of variabilities should be applied first and then any necessary action should be taken Grubbrsquos test is primarily a test of in between laboratory variability
116 Acceptance criteria
The method can be accepted if
PI()lt 25
LRltδ ( 3 8 )
According to these criteria the method performs well as the Table VIII 1 of Appendix VIII shows
12 TEST REPORT
The test report shall conform to ISOIEC 17025 requirements and shall contain the following information
bull a title (test report calibration report reference material production etc)
bull the name and address of the laboratory and location where any part of the test or calibration or production of reference material etc were carried out
bull unique identification of the report on each page with numbering of pages
21
bull analysis request code
bull reference to the measurement method used
bull sampling date (if available)
bull sample description
bull sample code or identification number
bull date of the separation of analyte
bull applied tracers with their reference dates and activity values with the code of their certificate
bull the results with units of measurement and associated uncertainty value expressed in the same unit as the result
bull date to which the test result has been corrected (corrected to the sampling date or separation time dd-mm-yyyy)
bull responsible person (with accessibility)
22
REFERENCES
[1] FEDERAL REGISTER National emission standards for hazardous air pollutants 57 107 (1992) 23305-23320
[2] RUTHERFORD PM DUDAS MJ AROCENA JM Heterogeneous distribution of radionuclides barium and strontium in phosphogypsum by-product Sci Total Environ 180 (1996) 201-209
[3] NATIONAL COUNCIL ON RADIATION PROTECTION AND MEASUREMENTS Evaluation of Occupational and Environmental Exposures to Radon and Radon Daughters in the United States NCRP Report 78 (1984)
[4] MARTIN P HANCOCK GJ Routine analysis of naturally occurring radionuclides in environmental samples by alpha-particle spectrometry Supervising Scientist Report 180 (2004) httpwwwenvironmentgovaussdpublicationsssr180html
[5] INTERNATIONAL ATOMIC ENERGY AGENCY Reference Material IAEA-434 Naturally Occurring Radionuclides in Phosphogypsum IAEA Analytical Quality in Nuclear Applications Series No 17 IAEAAQ17 IAEA Vienna (2010)
[6] MEDLEY P BOLLHOumlFER A ILES M RYAN B MARTIN P Barium sulfate method for radium-226 analysis by alpha spectrometry Environmental Research Institute of the Supervising Scientist internal report 501 (2005)
[7] VAJDA N LAROSA J ZEISLER R DANESI P KIS-BENEDEK G A Novel Technique for the Simultaneous Determination of 210Pb and 210Po using a Crown Ether J Environ Radioactivity 37 (1997) 355-372
[8] INTERNATIONAL ATOMIC ENERGY AGENCY A Procedure for the Determination of Po-210 in Water Samples by Alpha Spectrometry IAEA Analytical Quality in Nuclear Applications Series No 12 IAEAAQ12 IAEA Vienna (2009)
[9] GUOGANG J TORRI G INNOCENZI P OZONE R Di LULLO A Determination of radium isotopes in mineral and environmental water samples by alpha-spectrometry J of Radioanalytical and Nuclear Chemistry 267 3 (2005) 505-514
[10] EURACHEMCITAC Guide Quantifying uncertainty in analytical measurement 2nd Ed(2000)
[11] INTERNATIONAL ATOMIC ENERGY AGENCY Quantifying Uncertainty in Nuclear Analytical Measurements IAEA-TECDOC-1401 IAEA Vienna (2004)
[12] SHAKHASHIRO A SANSONE U Technically Enhanced Naturally Occurring Radionuclides (TENORM) in Phosphogypsum The Interlaboratory Comparison CCRI(II)07-35 Metrologia (2009)
[13] DUEWER DL A Robust Approach for the Determination of CCQM Key Comparison Reference Values and Uncertainties Working document CCQM04-15 BIPM wwwbipminfoccCCQMAllowed10CCQM04-15pdf (2004)
23
[14] Monographie BIPM-5 Vol 1ndashMonographie BIPM-5 Vol 5
httpwwwnucleideorg Decay Data Evaluation Project (DDEP) accessed in October 2010
[15] NuDat 25 (Database at the US NNDC) httpwww-ndsiaeaorg accessed in October 2010
[16] HORWITZ et al A Novel Strontium-Selective Extraction Chromatographic Resin Solvent Extraction amp Ion Exchange 10 (1992) 313
[17] HORWITZ et al Extraction Chromatography of Actinides and Selected Fission Products Principles and Achievement of Selectivity presented at International Workshop on the Application of Extraction Chromatography in Radionuclide Measurement IRMM Geel 1998
[18] HORWITZ et al Separation and Preconcentration of Actinides by Extraction Chromatography Using a Supported Liquid Anion Exchanger Application to the Characterization of High-Level Nuclear Waste Solutions Analytica Chimica Acta 310 (1995) 63-78
[19] HORWITZ et al Separation and Preconcentration of Uranium from Acidic Media by Extraction Chromatography Analytica Chimica Acta 266 (1992) 25-37
[20] C-K KIM MARTIN P FAJGELJ A Quantification of measurement uncertainty in the sequential determination of 210Pb and 210Po by liquid scintillation counting and alpha particle spectrometry Accreditation and Quality Assurance 13 12 (2008) 691-702
[21] J KRAGTEN Calculating Standard Deviation and Confidence Intervals with a Universally Applicable Spreadsheet Technique Analyst 119 (1994) 2161ndash2165
24
APPENDIX I NUCLEAR DATA OF RELEVANT RADIONUCLIDES AND DECAY CHAINS OF U
AND Th SERIES
TABLE I 1 NUCLEAR DATA OF RELEVANT RADIONUCLIDES [14]
Radionuclide Half-life Disintegration modes
E (MeV) Probability ()
225Ac 100(1) d α 5580 5(14) 095(4)
α 5599 3(14) 0114(7)
α 5609 0(14) 109(5)
α 5637 3(14) 416(23)
α 5682 2(14) 131(4)
α 5686 4(14) 0021(14)
α 5723 1(14) 203(23)
α 5730 5(14) 16(3)
α 5731 6(14) 124(10)
α 5731 9(17) 90(5)
α 5797 7(14) 62(9)
α 5793 1(21) 189(20)
α 5804 2(14) 03
α 5829 6(14) 524(24)
217At 323(4) x 10-3 s α 6484 7(16) 0016 7(8)
α 6813 8(16) 0038 4(15)
α 7066 9(16) 99932(3)
133Ba 10540(6) y γ 0053 162 2(6) 214(3)
γ 0079 614 2(12) 265(5)
γ 0080 997 9(11) 329(3)
γ 0276 398 9(12) 716(5)
γ 0302 850 8(5) 1834(13)
γ 0356 012 9(7) 6205(19)
γ 0383 848 5(12) 894(6)
210Bi 5012(5) d β 1162 1(8) 99999 86(2)
212Bi 6054(6) min β 0633(2) 190(4)
β 0741(2) 145(29)
β 1527(2) 458(21)
β 2254(2) 5523(21)
α 6050 92(4) 251(1)
α 6090 02(4) 97(1)
221Fr 479(2) min α 6126 3(15) 151(2)
α 6243(2) 134(7)
α 6341 0(13) 828(2)
TABLE I 1 NUCLEAR DATA OF RELEVANT RADIONUCLIDES [14] (cont)
25
Radionuclide Half-life Disintegration modes
E (MeV) Probability ()
210Pb 2223(12) y β 0017 0(5) 802(13)
β 0063 5(5) 198(13)
γ 0046 539(1) 4252(40)
208Po 2898(2) y α 5114 9(14) 99995 8(4)
α 4220(15) 24(7)x10-4
209Po 115(13) y α 4885(2) 198(32)
α 4883(2) 792(32)
α 4622(5) 0548(7)
210Po 138376 3(17) d α 5304 33(7) 99998 76
α 4516 66(9) 0001 24(4)
213Po 370(5) x 10-6 s α 8375 9(25) 99995 0(5)
216Po 0150(5) s α 6778 6(5) 99998 1(3)
α 5988 6(10) 0001 9(3)
218Po 3094(6) min α 6002 35(9) 99976 9(32)
223Ra 1143(5) d α 5747 0(4) 900(20)
α 5716 23(29) 516(13)
α 5606 73(30) 252(5)
α 5539 80(90) 900(20)
224Ra 3627(7) d α 5448 81(16) 526(7)
α 5685 50(15) 9472(7)
γ 0240 986(6) 412(4)
225Ra 1482(19)d β 0316(5) 688(20)
β 0356(5) 312(20)
γ 0040 09(5) 300(7)
226Ra 1 600(7) y α 4601(1) 595(4)
α 4784 34(25) 94038(40)
228Ra 575(4) y β 00127(7) 30(10)
β 00256(7) 87(9)
β 00391(7) 49(10)
β 00395(7) 12(10)
220Rn 558(3) s α 5748 46(14) 0118(15)
α 6288 22(10) 99882(15)
222Rn 3823 2(8) d α 5489 48(30) 9992(1)
228 Th 69860(23) d α 5176 89(23) 020(2)
α 5211 08(22) 038(3)
α 5340 38(22) 262(2)
α 5423 28(22) 732(2)
TABEL I 1 NUCLEAR DATA OF RELEVANT RADIONUCLIDES [14] (cont)
26
Radionuclide Half-life Disintegration
modes E (MeV) Probability ()
229 Th 7 340(160) y α 5053(2) 660(10)
α 4978 5(12) 317(4)
α 4967 5(12) 597(6)
α 4901 0(12) 1020(8)
α 4845 3(12) 5620(20)
α 4814 6(12) 930(8)
230 Th 7538(30) x 104 y α 4687 0(15) 763(3)
α 4620 5(15) 234(10)
232 Th 1402(6) x 109 y α 3810 0(14) 0068(20)
α 3948 5(14) 210(13)
α 4011 2(14) 789(13)
234 Th 2410(3) d β 0105(10) 65(7)
β 0106(10) 141(12)
β 0198(10) 778(15)
γ 0063 30(2) 375(8)
232U 706(11) y α 5263 48(9) 306(6)
α 5320 24(9) 691(6)
233U 1592(2) x 105 y α 4824 2(12) 843(6)
α 4783 5(12) 132
234U 2455(6) x 105 y α 4603 5(7) 0210(2)
α 4722 4(7) 2842(2)
α 4774 6(7) 7137(2)
235U 704(1) x 106 y α 4322(4) 333(6)
α 4397 8(13) 5719(20)
α 4414 9(5) 301(16)
α 4502 4(7) 128(5)
α 4556 0(4) 379(6)
α 4596 4(13) 474(6)
236U 2343(6) x 107 y α 4445(5) 261(40)
α 4494(3) 738(40)
238U 4468(5) x 109 y α 4038(5) 013(3)
α 4151(5) 2233(50)
α 4198(3) 7754(50)
Emax for beta emitting radioisotopes
Data were taken from [15]
27
FIG I 1 Decay chain of 238U [4]
FIG I 2 Decay chain of 232Th [4]
28
APPENDIX II FLOW CHART FOR SEQUENTIAL SEPARATION OF 210Po 210Pb Th U AND 226Ra
IN PHOSPHOGYPSUM
29
APPENDIX III PROPERTIES OF RESINS
III1 Sr resin
FIG III 1 Structure of the Sr resin (wwweichromcom)
FIG III 2 Capacity factor of Sr resin in nitric acid (wwweichromcom) [16]
30
FIG III 3 Capacity factor of Sr resin in nitric acid (wwweichromcom) [17]
III2 TEVA resin
FIG III 4 Structure of the TEVA resin (wwweichromcom)
31
FIG III 5 Capacity factor of TEVA resin in nitric acid and hydrochloric acid (wwweichromcom) [18]
III3 UTEVA resin
FIG III 6 Structure of the UTEVA resin (wwweichromcom)
32
FIG III 7 Capacity factor of UTEVA resin in nitric acid and hydrochloric acid (wwweichromcom) [19]
33
APPENDIX IV ALPHA SPECTRA OF ANALYTES
FIG IV 1 Alpha spectrum of Po isotopes
FIG IV 2 Alpha spectrum of Th isotopes in phosphogypsum (with progeny)
228Th is resulted from 232U tracer spiked in the sample
34
FIG IV 3 Alpha spectrum of U isotopes
FIG IV 4 Alpha spectrum of 226Ra and its progeny (spiked with 225Ra)
35
FIG IV 5 Overlapping alpha spectra of U and Po isotopes
FIG IV 6 Overlapping alpha spectra of U and Th (with progeny) isotopes
36
APPENDIX V LIQUIDE SCINTILLATION SPECTRA
a)
b)
A window
(115-320 ch)
B window
(320 -410 ch)
210Po
210Pb
210Bi
210Bi
Co
unts
Ch
ann
elC
oun
tsC
han
nel
Channel number
a)
b)
A window
(115-320 ch)
B window
(320 -410 ch)
210Po
210Pb
210Bi
210Bi
Co
unts
Ch
ann
elC
oun
tsC
han
nel
Channel number
FIG V 1 Typical liquid scintillation spectra of beta-emitting 210Pb and 210Bi and alpha emitting 210Po (calibration sources) a) 210Pb 210Bi and 210Po spectra
b) pure 210Bi spectrum
37
APPENDIX VI CALCULATION OF THE COMBINED UNCERTAINTY
OF THE ACTIVITIES OF THE ANALYTES ON SAMPLING DATE
VI1 Uncertainty of the 210Pb result [20]
VI11 Uncertainty of counting efficiency of 210Pb
2
2
2
2
2210
2
210
2210
222
)()()()()()( )( PbTPbT
calcal
stdPbstdPb
Pbb mum
RuR
aua
utZuZ
u
minus+
minus+
minus++
= minusminus
minusεεελεεε (VI-1)
2
222
2 )()()()()( (Z) BABnBnBAAn furrufruu minus+minus+= (VI-2)
20
2 )()()( AAgAn rururu += (VI-3)
20
2 )()()( BBgBn rururu += (VI-4)
VI12 Uncertainty of the tailing factor fAB
The uncertainty of the tailing factor fAB is calculated according to following equations
2
210
210
2
210
210
)()()(
+
=
minus
minus
minus
minus
BicalnB
BicalnB
BicalAn
BicalAnBABA r
ru
r
ruffu (VI-5)
20
2210210 )()()( ABicalAgBicalAn rururu += minusminus (VI-6)
20
2210210 )()()( BBicalBgBicalBn rururu += minusminus (VI-7)
The uncertainty of counting efficiency for 210Pb can be calculated by Eq (VI-8)
2
2
2
2
2210
2
210
2210
222
)()()()()()( )( PbTPbT
calcal
stdPbstdPb
Pbb mum
RuR
aua
utZuZ
u
minus+
minus+
minus++
= minusminus
minusεεελεεε (VI-8)
2
222
2 )()()()()( (Z) BABnBnBAAn furrufruu minus+minus+= (VI-9)
20
2 )()()( AAgAn rururu += (VI-10)
20
2 )()()( BBgBn rururu += (VI-11)
38
VI13 Uncertainty of chemical recovery of Pb
Uncertainty of chemical recoveries of Pb in calibration source
minusminus+
minus+
= 2
2
2
2
2
2
cal )()(
)()(
)( )(R calfcalfcalof
calcalof
calfcalof
calg
g
cal mumm
Rmu
mm
Rfu
f
Ru
2
1
2
2
2
2
)()(
)()(
minus+
minus+
minus
minusminus
minusc
ccPb
cPbcalcPb
ccPb
ccal mumC
CRCu
mC
mR (VI-12)
The uncertainty of chemical recovery of Pb in the sample can be calculated
minusminus+
minus+
= 2
2
2
2
2
2
)()(
)()(
)( (R) ffof
offof
gg
mumm
Rmu
mm
Rfu
f
Ru
2
2
2
2
)()(
)()( c
ssPbccPb
cPbcPb
ssPbccPb
c mumCmC
CRCu
mCmC
mR
+minus+
+minus+
minusminus
minusminus
minusminus
2
1
2
2
2
2
)()(
)()(
+minus+
+minus+
minusminus
minusminus
minusminuss
ssPbccPb
sPbsPb
ssPbccPb
s mumCmC
CRCu
mCmC
mR (VI-13)
VI14 Uncertainty of mass ratio
The uncertainty of the mass ratio (fg) of atomic mass of Pb to molar mass of Pb-oxalate is calculated using the equations below
22
M Pb)(
+
=
minus
minus
oxalatePb
M
Pbgg M
u
M
uffu oxalatePb (VI-14)
The uncertainty of the molar mass of lead oxalate u(MPb-oxalate) can be derived by combining standard uncertainties in atomic masses of its constituents as shown in Table VI 1
39
TABLE VI 1 STANDARD UNCERTAINTIES OF ATOMIC WEIGHT AND THE GRAVIMETRIC FACTOR fg
Element Atomic weight
(gmol-1)
Quoted uncertainty (gmol-1)
Conversion factor
Standard uncertainty (gmol-1)
Mass ratio of atomic mass of Pb to
molar mass of Pb-oxalate
Uncertainty ofatomic mass
of Pb to molar mass of
Pb-oxalate
Pb 207215 2 0000 15 3 0000 087 0701 9 0000 002
C 12010 7 0000 8 3 0000 46
O 15999 4 0000 3 3 0000 17
VI15 Combined uncertainty of activity of 210Pb
The combined uncertainty of the 210Pb activity is calculated from Eq (VI-15)
minus+
minus+
minus+
= minusminusminusminus 2
2
2102
2
2102
2
210
2
2
2101 )()()()()( s
d
sPb
BA
sPb
nBnB
sPb
BAnA
sPb
Pbc mum
afu
Z
arru
Z
afru
Z
aau
2
1
23
2
3
21022
2
2
2102
2
2102
2
210 )()()()(
+
+
minus+
minus+ minus
minus
minusminus
minus
minusminusminusPb
Pb
sPbPb
Pb
sPbsPbsPb fuf
afu
f
aRu
R
au
aε
ε (VI-15)
)()( 210222 minusminusminus = PbPbPb utffu λ (VI-16)
210
210321033
)(
11)(
3210
3210
minus
minusminus
minus
minusminusminus
minusminus=
minus
minus
Pb
Pbt
t
PbPbPb
u
e
etffu
Pb
Pb
λλλ λ
λ
(VI-17)
However if the time interval (t2) between the separation of 210Pb and the beginning of the measurement and the counting time of the sample (t3) are much smaller than the half life of 210Pb f2-Pb f3-Pb u(f2-Pb) and u(f3-Pb) are negligible The uncertainties associated to components mentioned above can be calculated as follows
0
0
3
)(t
r
t
rru
Po
gn +=
minus
(VI-18)
0
0
3
)(t
r
t
rru t
Po
tgtn +=
minus
(VI-19)
minus+
+
= minusminusminus
minus2
2
2102
2
2102
2
210210 )()()( )( tn
tn
sPo
nn
sPo
TT
sPo
sPo rur
aru
r
aAu
A
aau
2
2
21022
2
2
2102
2
2102
2
210)()()()( T
T
sPo
PoPo
sPo
TT
sPo
ss
sPofu
f
afu
f
amu
m
amu
m
a
+
+
+
minus+ minus
minusminus
minusminusminus
40
2
1
3
2
3
210 )(
+ minus
minus
minusPo
Po
sPo fuf
a (VI-20)
)()( TTTt utffu λ= (VI-21)
)()( 210222 minusminusminusminus = PoPoPoPo utffu λ (VI-22)
210
210321033
)(
11)(
3210
3210
minus
minusminus
minus
minusminusminus
minusminus=
minus
minus
Po
Pot
t
PoPoPo
u
e
etffu
Po
Po
λλλ λ
λ (VI-23)
VI16 Combined uncertainty of activity of 210Po
The uncertainty of the activity of 210Po on the separation date is calculated according to IAEAAQ12 procedure [8]
VI2 Uncertainty of other alpha emitting isotopes
The same formulas are used to calculate the combined uncertainties as equations that are used for calculation of the activity of alpha emitting analytes at the separation time and the sampling date as well as the chemical recovery and counting efficiency These formulas have to be applied in the spreadsheet approach for calculating the combined uncertainties knowing the standard uncertainty of each component VI3 Spreadsheet approach
For the quantifying the uncertainties the spreadsheet technique [21] was used which could be summarised as follows and showed in the Fig VI 1
bull Calculate function y using parameter xj
y=f(x1x2xj xn) (VI-24)
bull recalculate the same function n times increasing xj to xj+dxj (dxj standard deviation) and keeping the remaining parameters constant
y=f(x1x2xj+dxj xn) (VI-25)
bull the uncertainty on the function dy is the square root of the sum of squares
( )sum minus=n
jyydy1
2 (VI-26)
bull The individual variance contribution fj is
( )( )sum minus
minus=
n
j
jj
yy
yyf
1
2
2
(VI-27)
41
FIG VI 1 Spreadsheet approach for quantifying the uncertainty of the measurement
The results are summarised for the individual isotopes in the Tables VI 2ndashVI 9 and the results of the individual analysis with their uncertainties are shown in the Figs VI 3ndashVI 9 The detailed study about the usual contributors of uncertainty in the nuclear analytical techniques could be found in the IAEA-TECDOC-1401 [11] TABLE VI 2 AN EXAMPLE OF QUANTIFYING UNCERTAINTIES OF 210Po RESULT
Symbol unit Value of variable
Uncertainty Conversion factor to standard uncertainty
Standard uncertainty
Contribution to combined
uncertainty ()
m g 0508 9 0007 3 3 0004 2 010
rgt s-1 0197 0075 1 0075 361
r0t s-1 0000 017 0000 034 1 0000 034 0000 014
rg s-1 0081 0029 1 0029 6352
r0 s-1 0000 034 0000 033 1 0000 033 0000 08
at Bq 0829 0019 1 0019 0252
λt d-1 0000 019 0000 013 1 0000 013 negligible
λPo d-1 0005 72 x 10-9 1 72x10-9 negligible
ft 0982 14 0000 43 1 0000 43 0000 091
f2-Po 1005 73 x 10-9 1 73x10-9 negligible
f3-Po 1005 5 18 x 10-8 1 18 x10-8 negligible
aPo1 Bqmiddotkg-1 672 94
contribution is less than 1 x 10⁻⁵
TABLE VI 3 AN EXAMPLE OF QUANTIFYING UNCERTAINTIES OF EFFICIENCY OF 210Pb
Symbol unit Value of variable
Uncertainty
Conversion factor to standard
uncertainty
Standard uncertainty
Contribution to combined
uncertainty ()
mvial g 14936 35 0000 1 3 0000 17 0004 8
42
Symbol unit Value of variable
Uncertainty
Conversion factor to standard
uncertainty
Standard uncertainty
Contribution to combined
uncertainty ()
mvial+carrsol g 16036 54 0000 1 3 0000 17 0004 8
cPb g g-1 0027 42 0000 021 1 0000 021 011
mvial g 16036 72 0000 10 3 0000 17 0004 8
mvial+std g 17132 6 0000 10 3 0000 17 0004 8
astd Bq 1245 0189 1 0189 805
fgravimetry 0701 85 0000 41 1 0000 41 0066
mfilter g 0036 54 0000 10 3 0000 17 42
mfilter+Pb-precipitate g 0073 77 0000 10 3 0000 17 41
rA s-1 7362 0041 1 0041 76
rA0 s-1 0029 5 0003 1 0002 7 0035
rB s-1 0416 0 0011 1 0011 060
rB0 s-1 0011 7 0002 1 0002 2 0024
fAB 1049 0023 1 0023 040
t12 Pb d 814508 7305 1 731 23
tmeas-ref d 4 532 -
ε 0859 7 0015 3
43
TABLE VI 4 AN EXAMPLE OF QUANTIFYING UNCERTAINTIES OF 210Pb RESULT
Symbol unit Value of variable
Uncertainty Conversion factor to standard uncertainty
Standard uncertainty
Contribution to combined
uncertainty ()
ms g 0508 9 0007 3 3 0004 2 03
rgA s-1 0283 0035 1 0035 883
r0A s-1 0011 7 0002 2 1 0002 2 03
rgB s-1 0031 0009 1 0009 58
r0B s-1 0005 6 0002 3 1 0002 3 04
Ζ s-1 0245 1 0032 7 1 0032 7 -
fAB 1015 3 0012 9 1 0012 9 001
ε 0859 7 0015 3 1 0015 3 13
R 0858 8 0025 3 1 0077 2 35
aPb1 Bqmiddotkg-1 652 12
TABLE VI 5 AN EXAMPLE OF QUANTIFYING UNCERTAINTIES OF 234U RESULT
Symbol unit Value of variable
Uncertainty Conversion factor to standard uncertainty
Standard uncertainty
Contribution to combined
uncertainty ()
ms g 0508 9 0007 3 3 0004 2 003
rgt s-1 0021 78 0008 01 1 0008 369
r0t s-1 0000 030 0000 022 1 0000 022 0000 5
rg s-1 0016 15 0005 90 1 0006 628
r0 s-1 0000 016 0000 022 1 0000 022 0000 1
at Bq 0088 35 0002 10 1 0002 01 029
aU-234_1 Bqmiddotkg-1 129 3
TABLE VI 6 AN EXAMPLE OF QUANTIFYING UNCERTAINTIES OF 238U RESULT
Symbol unit Value of variable
Uncertainty Conversion factor to standard uncertainty
Standard uncertainty
Contribution to combined
uncertainty ()
ms g 0508 9 0007 3 3 0004 2 003
rgt s-1 0021 78 0008 01 1 0008 353
r0t s-1 0000 030 0000 022 1 0000 022 0000 5
rg s-1 0015 61 0005 67 1 0006 644
r0 s-1 0000 009 0000 008 1 0000 008 0000 1
at Bq 0088 35 0002 10 1 0002 1 028
aU-238_1 Bqmiddotkg-1 124 3
44
TABLE VI 7 AN EXAMPLE OF QUANTIFYING UNCERTAINTIES OF 230Th RESULT
Symbol unit Value of variable
Uncertainty Conversion factor to standard uncertainty
Standard uncertainty
Contribution to combined
uncertainty ()
ms g 0508 9 0007 3 3 0004 2 005
rgt s-1 0022 63 0006 44 1 0006 387
r0t s-1 0000 077 0000 063 1 0000 063 0006 1
rg s-1 0028 38 0007 90 1 0008 608
r0 s-1 0000 012 0000 010 1 0000 010 0000 1
at Bq 0090 03 0002 30 1 0002 303 051
aTh-230_1 Bqmiddotkg-1 223 9
TABLE VI 8 AN EXAMPLE OF QUANTIFYING UNCERTAINTIES OF 232Th RESULT
Symbol unit Value of variable
Uncertainty Conversion factor to standard uncertainty
Standard uncertainty
Contribution to combined
uncertainty ()
ms g 0508 9 0007 3 3 0004 2 004
rgt s-1 0022 63 0006 44 1 0006 265
r0t s-1 0000 077 0000 063 1 0000 063 0004 2
rg s-1 0000 28 0000 10 1 0000 1 727
r0 s-1 0000 011 0000 008 1 0000 008 048
at Bq 0090 03 0002 30 1 0002 3 035
aTh-232_1 Bqmiddotkg-1 21 009
TABLE VI 9 AN EXAMPLE OF QUANTIFYING UNCERTAINTIES OF 226Ra RESULT
Symbol unit Value of variable
Uncertainty Conversion factor
to standard uncertainty
Standard uncertainty
Contribution to combined
uncertainty ()
ms g 0508 9 0007 3 3 0004 2 003
rgt s-1 0043 10 0025 05 1 0025 05 603
r0t s-1 0000 111 0000 128 1 0000 128 0004
rg s-1 0063 32 0018 78 1 0018 78 393
r0 s-1 0000 070 015 0000 070 013 1 0000 070 013 0000 5
at Ra-225 Bq 0779 50 0022 53 1 0022 53 04
λAc225 d-1 0069 315 0000 624 1 0000 624 0000 02
λRa225 d-1 0046 520 0000 693 1 0000 693 008
t1-t0 d 337
aRa-226_1 Bqmiddotkg-1 766 39
45
APPENDIX VII DETECTION THRESHOLD AND LIMIT OF THE APPLIED PROCEDURE
TABLE VII 1 TYPICAL DECISION THRESHOLD AND DETECTION LIMIT FOR RELEVANT ISOTOPES
Symbol unit 210Pb 210Po 234U 238U 230 Th 232 Th 226Ra
k 165 165 165 165 165 165 165
m kg 0000 5 0000 5 0000 5 0000 5 0000 5 0000 5 0000 5
ε 086 031 026 026 035 035 025
R 086 073 094 094 068 068 061
n0 52 16 4 4 6 6 28
Tg s 36 000 98 899 343 024 343 024 277 345 277 345 124 984
t0 s 35 542 548 190 512 901 512 901 559 286 559 286 446 755
a Bqmiddotkg-1 13 036 009 009 012 012 068
a1 Bqmiddotkg-1 38 11 028 028 036 036 205
u2(0) Bq2middotkg-2 29 015 0008 4 0008 4 0006 5 0004 7 078
u2(a1) Bq2middotkg-2 23 041 0059 0025 0028 0052 204
a Bqmiddotkg-1 24 12 052 019 018 019 43
46
APPENDIX VIII VALIDATION TEST RESULTS OF THE PROCEDURE
TABLE VIII 1 VALIDATION RESULTS FOR RELEVANT RADIONUCLIDES
Parameters 210Po 210Pb 234U 238U 230Th 226Ra
C Bq kg-1 680 680 120 120 211 780
X Bq kg-1 653 659 127 123 221 793
u(C) Bq kg-1 58 58 9 11 9 62
u(X ) Bq kg-1 23 22 5 5 10 35
δ() -40 -31 58 25 47 17
rL Bq kg-1 106 102 48 47 62 498
RL Bq kg-1 237 454 59 53 89 707
PI() 92 92 85 100 62 91
TABLE VIII 2 ANALYSIS OF VARIANCE (ANOVA) FOR 210Po 210Pb 238U 230Th AND 226Ra IN PHOSPHOGYPSUM
Nuclide SSwb SSbb MSwb MSbb Swb
(as CV)
Sbb
(as CV)
210Po 124 62 151 79 312 1687 271 254
210Pb 8385 197 54 210 2195 220 302
238U 314 386 785 429 227 215
230Th 2176 1598 544 178 334 225
226Ra 412 686 137 858 121 054
SSwb sum of squares within bottles
SSbb sum of squares between bottles
MSwb mean of squares within bottles
MSbb mean of squares between bottles
Swb standard deviation as percent of covalent variance within bottles
Sbb standard deviation as percent of covalent variance between bottles
47
550
600
650
700
750
0 10 20 30 40 50
Samples
Act
ivity
of
21
0 Pb
in th
e sa
mp
le (
Bq
kg
dry
)
Mean1σ
-2σ
-1σ
3σ
2σ
-3σ
FIG VIII 1 210Pb results with associated uncertainties
550
600
650
700
750
0 10 20 30 40 50Samples
Act
ivity
of
21
0 Po
in t
he s
ampl
e (B
qkg
dry
)
Mean
1σ
-1σ
3σ
2σ
-3σ-2σ
FIG VIII 2 210Po results with associated uncertainties
48
110
115
120
125
130
135
140
0 10 20 30 40 50
Samples
Act
ivity
of
238
U in
the
sam
ple
(B
qkg
dry
)
Mean
1σ
-1σ
3σ
2σ
-3σ
-2σ
FIG VIII 3 238U results with associated uncertainties
105
110
115
120
125
130
135
140
145
150
0 10 20 30 40 50
Samples
Act
ivity
of
23
4 U in
the
sa
mpl
e (B
qkg
dry
)
Mean1σ
-2σ-1σ
3σ2σ
-3σ
FIG VIII 4 234U results with associated uncertainties
49
190
200
210
220
230
240
250
0 5 10 15 20 25 30 35 40 45 50
Samples
Act
ivity
of
23
0 Th
in th
e s
am
ple
(B
qk
g d
ry)
2σ
3σ
1σ
-1σ
-2σ
-3σ
Mean
FIG VIII 5 230 Th results with associated uncertainties
05
10
15
20
25
30
35
40
0 10 20 30 40 50
Samples
Act
ivity
of
23
2 Th
in th
e sa
mp
le (
Bq
kg
dry
)
Mean
1σ
-2σ
-1σ
3σ
2σ
-3σ
FIG VIII 6 232 Th results with associated uncertainties
50
650
700
750
800
850
900
1 2 3 4 5 6 7 8 9 10 11 12 13 14 15 16 17 18 19 20
Sample
Act
ivity
of
226 R
a in
th
e sa
mp
le (
Bq
kg
dry
)
Mean
1σ
-1σ
3σ
2σ
-3σ
-2σ
FIG VIII 7 226Ra results with associated uncertainties
51
CONTRIBUTORS TO DRAFTING AND REVIEW
Hampe D Gaigl FA
Verein fuumlr Kernverfahrenstechnik und Analytik Rossendorf eV Dresden Germany IAEA Environment Laboratories Terrestrial Environment Laboratory Seibersdorf Austria
Kim C-K IAEA Environment Laboratories Terrestrial Environment Laboratory Seibersdorf Austria
Kis-Benedek Gy IAEA Environment Laboratories Terrestrial Environment Laboratory Seibersdorf Austria
Martin P IAEA Environment Laboratories Terrestrial Environment Laboratory Seibersdorf Austria
Mietelski J W The Henryk Niewodniczanski Institute of Nuclear Physics Polish Academy of Sciences Poland
Sansone U IAEA Environment Laboratories Terrestrial Environment Laboratory Seibersdorf Austria
Varga B Central Agricultural Office Food and Feed Safety Directorate Hungary

21
bull analysis request code
bull reference to the measurement method used
bull sampling date (if available)
bull sample description
bull sample code or identification number
bull date of the separation of analyte
bull applied tracers with their reference dates and activity values with the code of their certificate
bull the results with units of measurement and associated uncertainty value expressed in the same unit as the result
bull date to which the test result has been corrected (corrected to the sampling date or separation time dd-mm-yyyy)
bull responsible person (with accessibility)
22
REFERENCES
[1] FEDERAL REGISTER National emission standards for hazardous air pollutants 57 107 (1992) 23305-23320
[2] RUTHERFORD PM DUDAS MJ AROCENA JM Heterogeneous distribution of radionuclides barium and strontium in phosphogypsum by-product Sci Total Environ 180 (1996) 201-209
[3] NATIONAL COUNCIL ON RADIATION PROTECTION AND MEASUREMENTS Evaluation of Occupational and Environmental Exposures to Radon and Radon Daughters in the United States NCRP Report 78 (1984)
[4] MARTIN P HANCOCK GJ Routine analysis of naturally occurring radionuclides in environmental samples by alpha-particle spectrometry Supervising Scientist Report 180 (2004) httpwwwenvironmentgovaussdpublicationsssr180html
[5] INTERNATIONAL ATOMIC ENERGY AGENCY Reference Material IAEA-434 Naturally Occurring Radionuclides in Phosphogypsum IAEA Analytical Quality in Nuclear Applications Series No 17 IAEAAQ17 IAEA Vienna (2010)
[6] MEDLEY P BOLLHOumlFER A ILES M RYAN B MARTIN P Barium sulfate method for radium-226 analysis by alpha spectrometry Environmental Research Institute of the Supervising Scientist internal report 501 (2005)
[7] VAJDA N LAROSA J ZEISLER R DANESI P KIS-BENEDEK G A Novel Technique for the Simultaneous Determination of 210Pb and 210Po using a Crown Ether J Environ Radioactivity 37 (1997) 355-372
[8] INTERNATIONAL ATOMIC ENERGY AGENCY A Procedure for the Determination of Po-210 in Water Samples by Alpha Spectrometry IAEA Analytical Quality in Nuclear Applications Series No 12 IAEAAQ12 IAEA Vienna (2009)
[9] GUOGANG J TORRI G INNOCENZI P OZONE R Di LULLO A Determination of radium isotopes in mineral and environmental water samples by alpha-spectrometry J of Radioanalytical and Nuclear Chemistry 267 3 (2005) 505-514
[10] EURACHEMCITAC Guide Quantifying uncertainty in analytical measurement 2nd Ed(2000)
[11] INTERNATIONAL ATOMIC ENERGY AGENCY Quantifying Uncertainty in Nuclear Analytical Measurements IAEA-TECDOC-1401 IAEA Vienna (2004)
[12] SHAKHASHIRO A SANSONE U Technically Enhanced Naturally Occurring Radionuclides (TENORM) in Phosphogypsum The Interlaboratory Comparison CCRI(II)07-35 Metrologia (2009)
[13] DUEWER DL A Robust Approach for the Determination of CCQM Key Comparison Reference Values and Uncertainties Working document CCQM04-15 BIPM wwwbipminfoccCCQMAllowed10CCQM04-15pdf (2004)
23
[14] Monographie BIPM-5 Vol 1ndashMonographie BIPM-5 Vol 5
httpwwwnucleideorg Decay Data Evaluation Project (DDEP) accessed in October 2010
[15] NuDat 25 (Database at the US NNDC) httpwww-ndsiaeaorg accessed in October 2010
[16] HORWITZ et al A Novel Strontium-Selective Extraction Chromatographic Resin Solvent Extraction amp Ion Exchange 10 (1992) 313
[17] HORWITZ et al Extraction Chromatography of Actinides and Selected Fission Products Principles and Achievement of Selectivity presented at International Workshop on the Application of Extraction Chromatography in Radionuclide Measurement IRMM Geel 1998
[18] HORWITZ et al Separation and Preconcentration of Actinides by Extraction Chromatography Using a Supported Liquid Anion Exchanger Application to the Characterization of High-Level Nuclear Waste Solutions Analytica Chimica Acta 310 (1995) 63-78
[19] HORWITZ et al Separation and Preconcentration of Uranium from Acidic Media by Extraction Chromatography Analytica Chimica Acta 266 (1992) 25-37
[20] C-K KIM MARTIN P FAJGELJ A Quantification of measurement uncertainty in the sequential determination of 210Pb and 210Po by liquid scintillation counting and alpha particle spectrometry Accreditation and Quality Assurance 13 12 (2008) 691-702
[21] J KRAGTEN Calculating Standard Deviation and Confidence Intervals with a Universally Applicable Spreadsheet Technique Analyst 119 (1994) 2161ndash2165
24
APPENDIX I NUCLEAR DATA OF RELEVANT RADIONUCLIDES AND DECAY CHAINS OF U
AND Th SERIES
TABLE I 1 NUCLEAR DATA OF RELEVANT RADIONUCLIDES [14]
Radionuclide Half-life Disintegration modes
E (MeV) Probability ()
225Ac 100(1) d α 5580 5(14) 095(4)
α 5599 3(14) 0114(7)
α 5609 0(14) 109(5)
α 5637 3(14) 416(23)
α 5682 2(14) 131(4)
α 5686 4(14) 0021(14)
α 5723 1(14) 203(23)
α 5730 5(14) 16(3)
α 5731 6(14) 124(10)
α 5731 9(17) 90(5)
α 5797 7(14) 62(9)
α 5793 1(21) 189(20)
α 5804 2(14) 03
α 5829 6(14) 524(24)
217At 323(4) x 10-3 s α 6484 7(16) 0016 7(8)
α 6813 8(16) 0038 4(15)
α 7066 9(16) 99932(3)
133Ba 10540(6) y γ 0053 162 2(6) 214(3)
γ 0079 614 2(12) 265(5)
γ 0080 997 9(11) 329(3)
γ 0276 398 9(12) 716(5)
γ 0302 850 8(5) 1834(13)
γ 0356 012 9(7) 6205(19)
γ 0383 848 5(12) 894(6)
210Bi 5012(5) d β 1162 1(8) 99999 86(2)
212Bi 6054(6) min β 0633(2) 190(4)
β 0741(2) 145(29)
β 1527(2) 458(21)
β 2254(2) 5523(21)
α 6050 92(4) 251(1)
α 6090 02(4) 97(1)
221Fr 479(2) min α 6126 3(15) 151(2)
α 6243(2) 134(7)
α 6341 0(13) 828(2)
TABLE I 1 NUCLEAR DATA OF RELEVANT RADIONUCLIDES [14] (cont)
25
Radionuclide Half-life Disintegration modes
E (MeV) Probability ()
210Pb 2223(12) y β 0017 0(5) 802(13)
β 0063 5(5) 198(13)
γ 0046 539(1) 4252(40)
208Po 2898(2) y α 5114 9(14) 99995 8(4)
α 4220(15) 24(7)x10-4
209Po 115(13) y α 4885(2) 198(32)
α 4883(2) 792(32)
α 4622(5) 0548(7)
210Po 138376 3(17) d α 5304 33(7) 99998 76
α 4516 66(9) 0001 24(4)
213Po 370(5) x 10-6 s α 8375 9(25) 99995 0(5)
216Po 0150(5) s α 6778 6(5) 99998 1(3)
α 5988 6(10) 0001 9(3)
218Po 3094(6) min α 6002 35(9) 99976 9(32)
223Ra 1143(5) d α 5747 0(4) 900(20)
α 5716 23(29) 516(13)
α 5606 73(30) 252(5)
α 5539 80(90) 900(20)
224Ra 3627(7) d α 5448 81(16) 526(7)
α 5685 50(15) 9472(7)
γ 0240 986(6) 412(4)
225Ra 1482(19)d β 0316(5) 688(20)
β 0356(5) 312(20)
γ 0040 09(5) 300(7)
226Ra 1 600(7) y α 4601(1) 595(4)
α 4784 34(25) 94038(40)
228Ra 575(4) y β 00127(7) 30(10)
β 00256(7) 87(9)
β 00391(7) 49(10)
β 00395(7) 12(10)
220Rn 558(3) s α 5748 46(14) 0118(15)
α 6288 22(10) 99882(15)
222Rn 3823 2(8) d α 5489 48(30) 9992(1)
228 Th 69860(23) d α 5176 89(23) 020(2)
α 5211 08(22) 038(3)
α 5340 38(22) 262(2)
α 5423 28(22) 732(2)
TABEL I 1 NUCLEAR DATA OF RELEVANT RADIONUCLIDES [14] (cont)
26
Radionuclide Half-life Disintegration
modes E (MeV) Probability ()
229 Th 7 340(160) y α 5053(2) 660(10)
α 4978 5(12) 317(4)
α 4967 5(12) 597(6)
α 4901 0(12) 1020(8)
α 4845 3(12) 5620(20)
α 4814 6(12) 930(8)
230 Th 7538(30) x 104 y α 4687 0(15) 763(3)
α 4620 5(15) 234(10)
232 Th 1402(6) x 109 y α 3810 0(14) 0068(20)
α 3948 5(14) 210(13)
α 4011 2(14) 789(13)
234 Th 2410(3) d β 0105(10) 65(7)
β 0106(10) 141(12)
β 0198(10) 778(15)
γ 0063 30(2) 375(8)
232U 706(11) y α 5263 48(9) 306(6)
α 5320 24(9) 691(6)
233U 1592(2) x 105 y α 4824 2(12) 843(6)
α 4783 5(12) 132
234U 2455(6) x 105 y α 4603 5(7) 0210(2)
α 4722 4(7) 2842(2)
α 4774 6(7) 7137(2)
235U 704(1) x 106 y α 4322(4) 333(6)
α 4397 8(13) 5719(20)
α 4414 9(5) 301(16)
α 4502 4(7) 128(5)
α 4556 0(4) 379(6)
α 4596 4(13) 474(6)
236U 2343(6) x 107 y α 4445(5) 261(40)
α 4494(3) 738(40)
238U 4468(5) x 109 y α 4038(5) 013(3)
α 4151(5) 2233(50)
α 4198(3) 7754(50)
Emax for beta emitting radioisotopes
Data were taken from [15]
27
FIG I 1 Decay chain of 238U [4]
FIG I 2 Decay chain of 232Th [4]
28
APPENDIX II FLOW CHART FOR SEQUENTIAL SEPARATION OF 210Po 210Pb Th U AND 226Ra
IN PHOSPHOGYPSUM
29
APPENDIX III PROPERTIES OF RESINS
III1 Sr resin
FIG III 1 Structure of the Sr resin (wwweichromcom)
FIG III 2 Capacity factor of Sr resin in nitric acid (wwweichromcom) [16]
30
FIG III 3 Capacity factor of Sr resin in nitric acid (wwweichromcom) [17]
III2 TEVA resin
FIG III 4 Structure of the TEVA resin (wwweichromcom)
31
FIG III 5 Capacity factor of TEVA resin in nitric acid and hydrochloric acid (wwweichromcom) [18]
III3 UTEVA resin
FIG III 6 Structure of the UTEVA resin (wwweichromcom)
32
FIG III 7 Capacity factor of UTEVA resin in nitric acid and hydrochloric acid (wwweichromcom) [19]
33
APPENDIX IV ALPHA SPECTRA OF ANALYTES
FIG IV 1 Alpha spectrum of Po isotopes
FIG IV 2 Alpha spectrum of Th isotopes in phosphogypsum (with progeny)
228Th is resulted from 232U tracer spiked in the sample
34
FIG IV 3 Alpha spectrum of U isotopes
FIG IV 4 Alpha spectrum of 226Ra and its progeny (spiked with 225Ra)
35
FIG IV 5 Overlapping alpha spectra of U and Po isotopes
FIG IV 6 Overlapping alpha spectra of U and Th (with progeny) isotopes
36
APPENDIX V LIQUIDE SCINTILLATION SPECTRA
a)
b)
A window
(115-320 ch)
B window
(320 -410 ch)
210Po
210Pb
210Bi
210Bi
Co
unts
Ch
ann
elC
oun
tsC
han
nel
Channel number
a)
b)
A window
(115-320 ch)
B window
(320 -410 ch)
210Po
210Pb
210Bi
210Bi
Co
unts
Ch
ann
elC
oun
tsC
han
nel
Channel number
FIG V 1 Typical liquid scintillation spectra of beta-emitting 210Pb and 210Bi and alpha emitting 210Po (calibration sources) a) 210Pb 210Bi and 210Po spectra
b) pure 210Bi spectrum
37
APPENDIX VI CALCULATION OF THE COMBINED UNCERTAINTY
OF THE ACTIVITIES OF THE ANALYTES ON SAMPLING DATE
VI1 Uncertainty of the 210Pb result [20]
VI11 Uncertainty of counting efficiency of 210Pb
2
2
2
2
2210
2
210
2210
222
)()()()()()( )( PbTPbT
calcal
stdPbstdPb
Pbb mum
RuR
aua
utZuZ
u
minus+
minus+
minus++
= minusminus
minusεεελεεε (VI-1)
2
222
2 )()()()()( (Z) BABnBnBAAn furrufruu minus+minus+= (VI-2)
20
2 )()()( AAgAn rururu += (VI-3)
20
2 )()()( BBgBn rururu += (VI-4)
VI12 Uncertainty of the tailing factor fAB
The uncertainty of the tailing factor fAB is calculated according to following equations
2
210
210
2
210
210
)()()(
+
=
minus
minus
minus
minus
BicalnB
BicalnB
BicalAn
BicalAnBABA r
ru
r
ruffu (VI-5)
20
2210210 )()()( ABicalAgBicalAn rururu += minusminus (VI-6)
20
2210210 )()()( BBicalBgBicalBn rururu += minusminus (VI-7)
The uncertainty of counting efficiency for 210Pb can be calculated by Eq (VI-8)
2
2
2
2
2210
2
210
2210
222
)()()()()()( )( PbTPbT
calcal
stdPbstdPb
Pbb mum
RuR
aua
utZuZ
u
minus+
minus+
minus++
= minusminus
minusεεελεεε (VI-8)
2
222
2 )()()()()( (Z) BABnBnBAAn furrufruu minus+minus+= (VI-9)
20
2 )()()( AAgAn rururu += (VI-10)
20
2 )()()( BBgBn rururu += (VI-11)
38
VI13 Uncertainty of chemical recovery of Pb
Uncertainty of chemical recoveries of Pb in calibration source
minusminus+
minus+
= 2
2
2
2
2
2
cal )()(
)()(
)( )(R calfcalfcalof
calcalof
calfcalof
calg
g
cal mumm
Rmu
mm
Rfu
f
Ru
2
1
2
2
2
2
)()(
)()(
minus+
minus+
minus
minusminus
minusc
ccPb
cPbcalcPb
ccPb
ccal mumC
CRCu
mC
mR (VI-12)
The uncertainty of chemical recovery of Pb in the sample can be calculated
minusminus+
minus+
= 2
2
2
2
2
2
)()(
)()(
)( (R) ffof
offof
gg
mumm
Rmu
mm
Rfu
f
Ru
2
2
2
2
)()(
)()( c
ssPbccPb
cPbcPb
ssPbccPb
c mumCmC
CRCu
mCmC
mR
+minus+
+minus+
minusminus
minusminus
minusminus
2
1
2
2
2
2
)()(
)()(
+minus+
+minus+
minusminus
minusminus
minusminuss
ssPbccPb
sPbsPb
ssPbccPb
s mumCmC
CRCu
mCmC
mR (VI-13)
VI14 Uncertainty of mass ratio
The uncertainty of the mass ratio (fg) of atomic mass of Pb to molar mass of Pb-oxalate is calculated using the equations below
22
M Pb)(
+
=
minus
minus
oxalatePb
M
Pbgg M
u
M
uffu oxalatePb (VI-14)
The uncertainty of the molar mass of lead oxalate u(MPb-oxalate) can be derived by combining standard uncertainties in atomic masses of its constituents as shown in Table VI 1
39
TABLE VI 1 STANDARD UNCERTAINTIES OF ATOMIC WEIGHT AND THE GRAVIMETRIC FACTOR fg
Element Atomic weight
(gmol-1)
Quoted uncertainty (gmol-1)
Conversion factor
Standard uncertainty (gmol-1)
Mass ratio of atomic mass of Pb to
molar mass of Pb-oxalate
Uncertainty ofatomic mass
of Pb to molar mass of
Pb-oxalate
Pb 207215 2 0000 15 3 0000 087 0701 9 0000 002
C 12010 7 0000 8 3 0000 46
O 15999 4 0000 3 3 0000 17
VI15 Combined uncertainty of activity of 210Pb
The combined uncertainty of the 210Pb activity is calculated from Eq (VI-15)
minus+
minus+
minus+
= minusminusminusminus 2
2
2102
2
2102
2
210
2
2
2101 )()()()()( s
d
sPb
BA
sPb
nBnB
sPb
BAnA
sPb
Pbc mum
afu
Z
arru
Z
afru
Z
aau
2
1
23
2
3
21022
2
2
2102
2
2102
2
210 )()()()(
+
+
minus+
minus+ minus
minus
minusminus
minus
minusminusminusPb
Pb
sPbPb
Pb
sPbsPbsPb fuf
afu
f
aRu
R
au
aε
ε (VI-15)
)()( 210222 minusminusminus = PbPbPb utffu λ (VI-16)
210
210321033
)(
11)(
3210
3210
minus
minusminus
minus
minusminusminus
minusminus=
minus
minus
Pb
Pbt
t
PbPbPb
u
e
etffu
Pb
Pb
λλλ λ
λ
(VI-17)
However if the time interval (t2) between the separation of 210Pb and the beginning of the measurement and the counting time of the sample (t3) are much smaller than the half life of 210Pb f2-Pb f3-Pb u(f2-Pb) and u(f3-Pb) are negligible The uncertainties associated to components mentioned above can be calculated as follows
0
0
3
)(t
r
t
rru
Po
gn +=
minus
(VI-18)
0
0
3
)(t
r
t
rru t
Po
tgtn +=
minus
(VI-19)
minus+
+
= minusminusminus
minus2
2
2102
2
2102
2
210210 )()()( )( tn
tn
sPo
nn
sPo
TT
sPo
sPo rur
aru
r
aAu
A
aau
2
2
21022
2
2
2102
2
2102
2
210)()()()( T
T
sPo
PoPo
sPo
TT
sPo
ss
sPofu
f
afu
f
amu
m
amu
m
a
+
+
+
minus+ minus
minusminus
minusminusminus
40
2
1
3
2
3
210 )(
+ minus
minus
minusPo
Po
sPo fuf
a (VI-20)
)()( TTTt utffu λ= (VI-21)
)()( 210222 minusminusminusminus = PoPoPoPo utffu λ (VI-22)
210
210321033
)(
11)(
3210
3210
minus
minusminus
minus
minusminusminus
minusminus=
minus
minus
Po
Pot
t
PoPoPo
u
e
etffu
Po
Po
λλλ λ
λ (VI-23)
VI16 Combined uncertainty of activity of 210Po
The uncertainty of the activity of 210Po on the separation date is calculated according to IAEAAQ12 procedure [8]
VI2 Uncertainty of other alpha emitting isotopes
The same formulas are used to calculate the combined uncertainties as equations that are used for calculation of the activity of alpha emitting analytes at the separation time and the sampling date as well as the chemical recovery and counting efficiency These formulas have to be applied in the spreadsheet approach for calculating the combined uncertainties knowing the standard uncertainty of each component VI3 Spreadsheet approach
For the quantifying the uncertainties the spreadsheet technique [21] was used which could be summarised as follows and showed in the Fig VI 1
bull Calculate function y using parameter xj
y=f(x1x2xj xn) (VI-24)
bull recalculate the same function n times increasing xj to xj+dxj (dxj standard deviation) and keeping the remaining parameters constant
y=f(x1x2xj+dxj xn) (VI-25)
bull the uncertainty on the function dy is the square root of the sum of squares
( )sum minus=n
jyydy1
2 (VI-26)
bull The individual variance contribution fj is
( )( )sum minus
minus=
n
j
jj
yy
yyf
1
2
2
(VI-27)
41
FIG VI 1 Spreadsheet approach for quantifying the uncertainty of the measurement
The results are summarised for the individual isotopes in the Tables VI 2ndashVI 9 and the results of the individual analysis with their uncertainties are shown in the Figs VI 3ndashVI 9 The detailed study about the usual contributors of uncertainty in the nuclear analytical techniques could be found in the IAEA-TECDOC-1401 [11] TABLE VI 2 AN EXAMPLE OF QUANTIFYING UNCERTAINTIES OF 210Po RESULT
Symbol unit Value of variable
Uncertainty Conversion factor to standard uncertainty
Standard uncertainty
Contribution to combined
uncertainty ()
m g 0508 9 0007 3 3 0004 2 010
rgt s-1 0197 0075 1 0075 361
r0t s-1 0000 017 0000 034 1 0000 034 0000 014
rg s-1 0081 0029 1 0029 6352
r0 s-1 0000 034 0000 033 1 0000 033 0000 08
at Bq 0829 0019 1 0019 0252
λt d-1 0000 019 0000 013 1 0000 013 negligible
λPo d-1 0005 72 x 10-9 1 72x10-9 negligible
ft 0982 14 0000 43 1 0000 43 0000 091
f2-Po 1005 73 x 10-9 1 73x10-9 negligible
f3-Po 1005 5 18 x 10-8 1 18 x10-8 negligible
aPo1 Bqmiddotkg-1 672 94
contribution is less than 1 x 10⁻⁵
TABLE VI 3 AN EXAMPLE OF QUANTIFYING UNCERTAINTIES OF EFFICIENCY OF 210Pb
Symbol unit Value of variable
Uncertainty
Conversion factor to standard
uncertainty
Standard uncertainty
Contribution to combined
uncertainty ()
mvial g 14936 35 0000 1 3 0000 17 0004 8
42
Symbol unit Value of variable
Uncertainty
Conversion factor to standard
uncertainty
Standard uncertainty
Contribution to combined
uncertainty ()
mvial+carrsol g 16036 54 0000 1 3 0000 17 0004 8
cPb g g-1 0027 42 0000 021 1 0000 021 011
mvial g 16036 72 0000 10 3 0000 17 0004 8
mvial+std g 17132 6 0000 10 3 0000 17 0004 8
astd Bq 1245 0189 1 0189 805
fgravimetry 0701 85 0000 41 1 0000 41 0066
mfilter g 0036 54 0000 10 3 0000 17 42
mfilter+Pb-precipitate g 0073 77 0000 10 3 0000 17 41
rA s-1 7362 0041 1 0041 76
rA0 s-1 0029 5 0003 1 0002 7 0035
rB s-1 0416 0 0011 1 0011 060
rB0 s-1 0011 7 0002 1 0002 2 0024
fAB 1049 0023 1 0023 040
t12 Pb d 814508 7305 1 731 23
tmeas-ref d 4 532 -
ε 0859 7 0015 3
43
TABLE VI 4 AN EXAMPLE OF QUANTIFYING UNCERTAINTIES OF 210Pb RESULT
Symbol unit Value of variable
Uncertainty Conversion factor to standard uncertainty
Standard uncertainty
Contribution to combined
uncertainty ()
ms g 0508 9 0007 3 3 0004 2 03
rgA s-1 0283 0035 1 0035 883
r0A s-1 0011 7 0002 2 1 0002 2 03
rgB s-1 0031 0009 1 0009 58
r0B s-1 0005 6 0002 3 1 0002 3 04
Ζ s-1 0245 1 0032 7 1 0032 7 -
fAB 1015 3 0012 9 1 0012 9 001
ε 0859 7 0015 3 1 0015 3 13
R 0858 8 0025 3 1 0077 2 35
aPb1 Bqmiddotkg-1 652 12
TABLE VI 5 AN EXAMPLE OF QUANTIFYING UNCERTAINTIES OF 234U RESULT
Symbol unit Value of variable
Uncertainty Conversion factor to standard uncertainty
Standard uncertainty
Contribution to combined
uncertainty ()
ms g 0508 9 0007 3 3 0004 2 003
rgt s-1 0021 78 0008 01 1 0008 369
r0t s-1 0000 030 0000 022 1 0000 022 0000 5
rg s-1 0016 15 0005 90 1 0006 628
r0 s-1 0000 016 0000 022 1 0000 022 0000 1
at Bq 0088 35 0002 10 1 0002 01 029
aU-234_1 Bqmiddotkg-1 129 3
TABLE VI 6 AN EXAMPLE OF QUANTIFYING UNCERTAINTIES OF 238U RESULT
Symbol unit Value of variable
Uncertainty Conversion factor to standard uncertainty
Standard uncertainty
Contribution to combined
uncertainty ()
ms g 0508 9 0007 3 3 0004 2 003
rgt s-1 0021 78 0008 01 1 0008 353
r0t s-1 0000 030 0000 022 1 0000 022 0000 5
rg s-1 0015 61 0005 67 1 0006 644
r0 s-1 0000 009 0000 008 1 0000 008 0000 1
at Bq 0088 35 0002 10 1 0002 1 028
aU-238_1 Bqmiddotkg-1 124 3
44
TABLE VI 7 AN EXAMPLE OF QUANTIFYING UNCERTAINTIES OF 230Th RESULT
Symbol unit Value of variable
Uncertainty Conversion factor to standard uncertainty
Standard uncertainty
Contribution to combined
uncertainty ()
ms g 0508 9 0007 3 3 0004 2 005
rgt s-1 0022 63 0006 44 1 0006 387
r0t s-1 0000 077 0000 063 1 0000 063 0006 1
rg s-1 0028 38 0007 90 1 0008 608
r0 s-1 0000 012 0000 010 1 0000 010 0000 1
at Bq 0090 03 0002 30 1 0002 303 051
aTh-230_1 Bqmiddotkg-1 223 9
TABLE VI 8 AN EXAMPLE OF QUANTIFYING UNCERTAINTIES OF 232Th RESULT
Symbol unit Value of variable
Uncertainty Conversion factor to standard uncertainty
Standard uncertainty
Contribution to combined
uncertainty ()
ms g 0508 9 0007 3 3 0004 2 004
rgt s-1 0022 63 0006 44 1 0006 265
r0t s-1 0000 077 0000 063 1 0000 063 0004 2
rg s-1 0000 28 0000 10 1 0000 1 727
r0 s-1 0000 011 0000 008 1 0000 008 048
at Bq 0090 03 0002 30 1 0002 3 035
aTh-232_1 Bqmiddotkg-1 21 009
TABLE VI 9 AN EXAMPLE OF QUANTIFYING UNCERTAINTIES OF 226Ra RESULT
Symbol unit Value of variable
Uncertainty Conversion factor
to standard uncertainty
Standard uncertainty
Contribution to combined
uncertainty ()
ms g 0508 9 0007 3 3 0004 2 003
rgt s-1 0043 10 0025 05 1 0025 05 603
r0t s-1 0000 111 0000 128 1 0000 128 0004
rg s-1 0063 32 0018 78 1 0018 78 393
r0 s-1 0000 070 015 0000 070 013 1 0000 070 013 0000 5
at Ra-225 Bq 0779 50 0022 53 1 0022 53 04
λAc225 d-1 0069 315 0000 624 1 0000 624 0000 02
λRa225 d-1 0046 520 0000 693 1 0000 693 008
t1-t0 d 337
aRa-226_1 Bqmiddotkg-1 766 39
45
APPENDIX VII DETECTION THRESHOLD AND LIMIT OF THE APPLIED PROCEDURE
TABLE VII 1 TYPICAL DECISION THRESHOLD AND DETECTION LIMIT FOR RELEVANT ISOTOPES
Symbol unit 210Pb 210Po 234U 238U 230 Th 232 Th 226Ra
k 165 165 165 165 165 165 165
m kg 0000 5 0000 5 0000 5 0000 5 0000 5 0000 5 0000 5
ε 086 031 026 026 035 035 025
R 086 073 094 094 068 068 061
n0 52 16 4 4 6 6 28
Tg s 36 000 98 899 343 024 343 024 277 345 277 345 124 984
t0 s 35 542 548 190 512 901 512 901 559 286 559 286 446 755
a Bqmiddotkg-1 13 036 009 009 012 012 068
a1 Bqmiddotkg-1 38 11 028 028 036 036 205
u2(0) Bq2middotkg-2 29 015 0008 4 0008 4 0006 5 0004 7 078
u2(a1) Bq2middotkg-2 23 041 0059 0025 0028 0052 204
a Bqmiddotkg-1 24 12 052 019 018 019 43
46
APPENDIX VIII VALIDATION TEST RESULTS OF THE PROCEDURE
TABLE VIII 1 VALIDATION RESULTS FOR RELEVANT RADIONUCLIDES
Parameters 210Po 210Pb 234U 238U 230Th 226Ra
C Bq kg-1 680 680 120 120 211 780
X Bq kg-1 653 659 127 123 221 793
u(C) Bq kg-1 58 58 9 11 9 62
u(X ) Bq kg-1 23 22 5 5 10 35
δ() -40 -31 58 25 47 17
rL Bq kg-1 106 102 48 47 62 498
RL Bq kg-1 237 454 59 53 89 707
PI() 92 92 85 100 62 91
TABLE VIII 2 ANALYSIS OF VARIANCE (ANOVA) FOR 210Po 210Pb 238U 230Th AND 226Ra IN PHOSPHOGYPSUM
Nuclide SSwb SSbb MSwb MSbb Swb
(as CV)
Sbb
(as CV)
210Po 124 62 151 79 312 1687 271 254
210Pb 8385 197 54 210 2195 220 302
238U 314 386 785 429 227 215
230Th 2176 1598 544 178 334 225
226Ra 412 686 137 858 121 054
SSwb sum of squares within bottles
SSbb sum of squares between bottles
MSwb mean of squares within bottles
MSbb mean of squares between bottles
Swb standard deviation as percent of covalent variance within bottles
Sbb standard deviation as percent of covalent variance between bottles
47
550
600
650
700
750
0 10 20 30 40 50
Samples
Act
ivity
of
21
0 Pb
in th
e sa
mp
le (
Bq
kg
dry
)
Mean1σ
-2σ
-1σ
3σ
2σ
-3σ
FIG VIII 1 210Pb results with associated uncertainties
550
600
650
700
750
0 10 20 30 40 50Samples
Act
ivity
of
21
0 Po
in t
he s
ampl
e (B
qkg
dry
)
Mean
1σ
-1σ
3σ
2σ
-3σ-2σ
FIG VIII 2 210Po results with associated uncertainties
48
110
115
120
125
130
135
140
0 10 20 30 40 50
Samples
Act
ivity
of
238
U in
the
sam
ple
(B
qkg
dry
)
Mean
1σ
-1σ
3σ
2σ
-3σ
-2σ
FIG VIII 3 238U results with associated uncertainties
105
110
115
120
125
130
135
140
145
150
0 10 20 30 40 50
Samples
Act
ivity
of
23
4 U in
the
sa
mpl
e (B
qkg
dry
)
Mean1σ
-2σ-1σ
3σ2σ
-3σ
FIG VIII 4 234U results with associated uncertainties
49
190
200
210
220
230
240
250
0 5 10 15 20 25 30 35 40 45 50
Samples
Act
ivity
of
23
0 Th
in th
e s
am
ple
(B
qk
g d
ry)
2σ
3σ
1σ
-1σ
-2σ
-3σ
Mean
FIG VIII 5 230 Th results with associated uncertainties
05
10
15
20
25
30
35
40
0 10 20 30 40 50
Samples
Act
ivity
of
23
2 Th
in th
e sa
mp
le (
Bq
kg
dry
)
Mean
1σ
-2σ
-1σ
3σ
2σ
-3σ
FIG VIII 6 232 Th results with associated uncertainties
50
650
700
750
800
850
900
1 2 3 4 5 6 7 8 9 10 11 12 13 14 15 16 17 18 19 20
Sample
Act
ivity
of
226 R
a in
th
e sa
mp
le (
Bq
kg
dry
)
Mean
1σ
-1σ
3σ
2σ
-3σ
-2σ
FIG VIII 7 226Ra results with associated uncertainties
51
CONTRIBUTORS TO DRAFTING AND REVIEW
Hampe D Gaigl FA
Verein fuumlr Kernverfahrenstechnik und Analytik Rossendorf eV Dresden Germany IAEA Environment Laboratories Terrestrial Environment Laboratory Seibersdorf Austria
Kim C-K IAEA Environment Laboratories Terrestrial Environment Laboratory Seibersdorf Austria
Kis-Benedek Gy IAEA Environment Laboratories Terrestrial Environment Laboratory Seibersdorf Austria
Martin P IAEA Environment Laboratories Terrestrial Environment Laboratory Seibersdorf Austria
Mietelski J W The Henryk Niewodniczanski Institute of Nuclear Physics Polish Academy of Sciences Poland
Sansone U IAEA Environment Laboratories Terrestrial Environment Laboratory Seibersdorf Austria
Varga B Central Agricultural Office Food and Feed Safety Directorate Hungary
22
REFERENCES
[1] FEDERAL REGISTER National emission standards for hazardous air pollutants 57 107 (1992) 23305-23320
[2] RUTHERFORD PM DUDAS MJ AROCENA JM Heterogeneous distribution of radionuclides barium and strontium in phosphogypsum by-product Sci Total Environ 180 (1996) 201-209
[3] NATIONAL COUNCIL ON RADIATION PROTECTION AND MEASUREMENTS Evaluation of Occupational and Environmental Exposures to Radon and Radon Daughters in the United States NCRP Report 78 (1984)
[4] MARTIN P HANCOCK GJ Routine analysis of naturally occurring radionuclides in environmental samples by alpha-particle spectrometry Supervising Scientist Report 180 (2004) httpwwwenvironmentgovaussdpublicationsssr180html
[5] INTERNATIONAL ATOMIC ENERGY AGENCY Reference Material IAEA-434 Naturally Occurring Radionuclides in Phosphogypsum IAEA Analytical Quality in Nuclear Applications Series No 17 IAEAAQ17 IAEA Vienna (2010)
[6] MEDLEY P BOLLHOumlFER A ILES M RYAN B MARTIN P Barium sulfate method for radium-226 analysis by alpha spectrometry Environmental Research Institute of the Supervising Scientist internal report 501 (2005)
[7] VAJDA N LAROSA J ZEISLER R DANESI P KIS-BENEDEK G A Novel Technique for the Simultaneous Determination of 210Pb and 210Po using a Crown Ether J Environ Radioactivity 37 (1997) 355-372
[8] INTERNATIONAL ATOMIC ENERGY AGENCY A Procedure for the Determination of Po-210 in Water Samples by Alpha Spectrometry IAEA Analytical Quality in Nuclear Applications Series No 12 IAEAAQ12 IAEA Vienna (2009)
[9] GUOGANG J TORRI G INNOCENZI P OZONE R Di LULLO A Determination of radium isotopes in mineral and environmental water samples by alpha-spectrometry J of Radioanalytical and Nuclear Chemistry 267 3 (2005) 505-514
[10] EURACHEMCITAC Guide Quantifying uncertainty in analytical measurement 2nd Ed(2000)
[11] INTERNATIONAL ATOMIC ENERGY AGENCY Quantifying Uncertainty in Nuclear Analytical Measurements IAEA-TECDOC-1401 IAEA Vienna (2004)
[12] SHAKHASHIRO A SANSONE U Technically Enhanced Naturally Occurring Radionuclides (TENORM) in Phosphogypsum The Interlaboratory Comparison CCRI(II)07-35 Metrologia (2009)
[13] DUEWER DL A Robust Approach for the Determination of CCQM Key Comparison Reference Values and Uncertainties Working document CCQM04-15 BIPM wwwbipminfoccCCQMAllowed10CCQM04-15pdf (2004)
23
[14] Monographie BIPM-5 Vol 1ndashMonographie BIPM-5 Vol 5
httpwwwnucleideorg Decay Data Evaluation Project (DDEP) accessed in October 2010
[15] NuDat 25 (Database at the US NNDC) httpwww-ndsiaeaorg accessed in October 2010
[16] HORWITZ et al A Novel Strontium-Selective Extraction Chromatographic Resin Solvent Extraction amp Ion Exchange 10 (1992) 313
[17] HORWITZ et al Extraction Chromatography of Actinides and Selected Fission Products Principles and Achievement of Selectivity presented at International Workshop on the Application of Extraction Chromatography in Radionuclide Measurement IRMM Geel 1998
[18] HORWITZ et al Separation and Preconcentration of Actinides by Extraction Chromatography Using a Supported Liquid Anion Exchanger Application to the Characterization of High-Level Nuclear Waste Solutions Analytica Chimica Acta 310 (1995) 63-78
[19] HORWITZ et al Separation and Preconcentration of Uranium from Acidic Media by Extraction Chromatography Analytica Chimica Acta 266 (1992) 25-37
[20] C-K KIM MARTIN P FAJGELJ A Quantification of measurement uncertainty in the sequential determination of 210Pb and 210Po by liquid scintillation counting and alpha particle spectrometry Accreditation and Quality Assurance 13 12 (2008) 691-702
[21] J KRAGTEN Calculating Standard Deviation and Confidence Intervals with a Universally Applicable Spreadsheet Technique Analyst 119 (1994) 2161ndash2165
24
APPENDIX I NUCLEAR DATA OF RELEVANT RADIONUCLIDES AND DECAY CHAINS OF U
AND Th SERIES
TABLE I 1 NUCLEAR DATA OF RELEVANT RADIONUCLIDES [14]
Radionuclide Half-life Disintegration modes
E (MeV) Probability ()
225Ac 100(1) d α 5580 5(14) 095(4)
α 5599 3(14) 0114(7)
α 5609 0(14) 109(5)
α 5637 3(14) 416(23)
α 5682 2(14) 131(4)
α 5686 4(14) 0021(14)
α 5723 1(14) 203(23)
α 5730 5(14) 16(3)
α 5731 6(14) 124(10)
α 5731 9(17) 90(5)
α 5797 7(14) 62(9)
α 5793 1(21) 189(20)
α 5804 2(14) 03
α 5829 6(14) 524(24)
217At 323(4) x 10-3 s α 6484 7(16) 0016 7(8)
α 6813 8(16) 0038 4(15)
α 7066 9(16) 99932(3)
133Ba 10540(6) y γ 0053 162 2(6) 214(3)
γ 0079 614 2(12) 265(5)
γ 0080 997 9(11) 329(3)
γ 0276 398 9(12) 716(5)
γ 0302 850 8(5) 1834(13)
γ 0356 012 9(7) 6205(19)
γ 0383 848 5(12) 894(6)
210Bi 5012(5) d β 1162 1(8) 99999 86(2)
212Bi 6054(6) min β 0633(2) 190(4)
β 0741(2) 145(29)
β 1527(2) 458(21)
β 2254(2) 5523(21)
α 6050 92(4) 251(1)
α 6090 02(4) 97(1)
221Fr 479(2) min α 6126 3(15) 151(2)
α 6243(2) 134(7)
α 6341 0(13) 828(2)
TABLE I 1 NUCLEAR DATA OF RELEVANT RADIONUCLIDES [14] (cont)
25
Radionuclide Half-life Disintegration modes
E (MeV) Probability ()
210Pb 2223(12) y β 0017 0(5) 802(13)
β 0063 5(5) 198(13)
γ 0046 539(1) 4252(40)
208Po 2898(2) y α 5114 9(14) 99995 8(4)
α 4220(15) 24(7)x10-4
209Po 115(13) y α 4885(2) 198(32)
α 4883(2) 792(32)
α 4622(5) 0548(7)
210Po 138376 3(17) d α 5304 33(7) 99998 76
α 4516 66(9) 0001 24(4)
213Po 370(5) x 10-6 s α 8375 9(25) 99995 0(5)
216Po 0150(5) s α 6778 6(5) 99998 1(3)
α 5988 6(10) 0001 9(3)
218Po 3094(6) min α 6002 35(9) 99976 9(32)
223Ra 1143(5) d α 5747 0(4) 900(20)
α 5716 23(29) 516(13)
α 5606 73(30) 252(5)
α 5539 80(90) 900(20)
224Ra 3627(7) d α 5448 81(16) 526(7)
α 5685 50(15) 9472(7)
γ 0240 986(6) 412(4)
225Ra 1482(19)d β 0316(5) 688(20)
β 0356(5) 312(20)
γ 0040 09(5) 300(7)
226Ra 1 600(7) y α 4601(1) 595(4)
α 4784 34(25) 94038(40)
228Ra 575(4) y β 00127(7) 30(10)
β 00256(7) 87(9)
β 00391(7) 49(10)
β 00395(7) 12(10)
220Rn 558(3) s α 5748 46(14) 0118(15)
α 6288 22(10) 99882(15)
222Rn 3823 2(8) d α 5489 48(30) 9992(1)
228 Th 69860(23) d α 5176 89(23) 020(2)
α 5211 08(22) 038(3)
α 5340 38(22) 262(2)
α 5423 28(22) 732(2)
TABEL I 1 NUCLEAR DATA OF RELEVANT RADIONUCLIDES [14] (cont)
26
Radionuclide Half-life Disintegration
modes E (MeV) Probability ()
229 Th 7 340(160) y α 5053(2) 660(10)
α 4978 5(12) 317(4)
α 4967 5(12) 597(6)
α 4901 0(12) 1020(8)
α 4845 3(12) 5620(20)
α 4814 6(12) 930(8)
230 Th 7538(30) x 104 y α 4687 0(15) 763(3)
α 4620 5(15) 234(10)
232 Th 1402(6) x 109 y α 3810 0(14) 0068(20)
α 3948 5(14) 210(13)
α 4011 2(14) 789(13)
234 Th 2410(3) d β 0105(10) 65(7)
β 0106(10) 141(12)
β 0198(10) 778(15)
γ 0063 30(2) 375(8)
232U 706(11) y α 5263 48(9) 306(6)
α 5320 24(9) 691(6)
233U 1592(2) x 105 y α 4824 2(12) 843(6)
α 4783 5(12) 132
234U 2455(6) x 105 y α 4603 5(7) 0210(2)
α 4722 4(7) 2842(2)
α 4774 6(7) 7137(2)
235U 704(1) x 106 y α 4322(4) 333(6)
α 4397 8(13) 5719(20)
α 4414 9(5) 301(16)
α 4502 4(7) 128(5)
α 4556 0(4) 379(6)
α 4596 4(13) 474(6)
236U 2343(6) x 107 y α 4445(5) 261(40)
α 4494(3) 738(40)
238U 4468(5) x 109 y α 4038(5) 013(3)
α 4151(5) 2233(50)
α 4198(3) 7754(50)
Emax for beta emitting radioisotopes
Data were taken from [15]
27
FIG I 1 Decay chain of 238U [4]
FIG I 2 Decay chain of 232Th [4]
28
APPENDIX II FLOW CHART FOR SEQUENTIAL SEPARATION OF 210Po 210Pb Th U AND 226Ra
IN PHOSPHOGYPSUM
29
APPENDIX III PROPERTIES OF RESINS
III1 Sr resin
FIG III 1 Structure of the Sr resin (wwweichromcom)
FIG III 2 Capacity factor of Sr resin in nitric acid (wwweichromcom) [16]
30
FIG III 3 Capacity factor of Sr resin in nitric acid (wwweichromcom) [17]
III2 TEVA resin
FIG III 4 Structure of the TEVA resin (wwweichromcom)
31
FIG III 5 Capacity factor of TEVA resin in nitric acid and hydrochloric acid (wwweichromcom) [18]
III3 UTEVA resin
FIG III 6 Structure of the UTEVA resin (wwweichromcom)
32
FIG III 7 Capacity factor of UTEVA resin in nitric acid and hydrochloric acid (wwweichromcom) [19]
33
APPENDIX IV ALPHA SPECTRA OF ANALYTES
FIG IV 1 Alpha spectrum of Po isotopes
FIG IV 2 Alpha spectrum of Th isotopes in phosphogypsum (with progeny)
228Th is resulted from 232U tracer spiked in the sample
34
FIG IV 3 Alpha spectrum of U isotopes
FIG IV 4 Alpha spectrum of 226Ra and its progeny (spiked with 225Ra)
35
FIG IV 5 Overlapping alpha spectra of U and Po isotopes
FIG IV 6 Overlapping alpha spectra of U and Th (with progeny) isotopes
36
APPENDIX V LIQUIDE SCINTILLATION SPECTRA
a)
b)
A window
(115-320 ch)
B window
(320 -410 ch)
210Po
210Pb
210Bi
210Bi
Co
unts
Ch
ann
elC
oun
tsC
han
nel
Channel number
a)
b)
A window
(115-320 ch)
B window
(320 -410 ch)
210Po
210Pb
210Bi
210Bi
Co
unts
Ch
ann
elC
oun
tsC
han
nel
Channel number
FIG V 1 Typical liquid scintillation spectra of beta-emitting 210Pb and 210Bi and alpha emitting 210Po (calibration sources) a) 210Pb 210Bi and 210Po spectra
b) pure 210Bi spectrum
37
APPENDIX VI CALCULATION OF THE COMBINED UNCERTAINTY
OF THE ACTIVITIES OF THE ANALYTES ON SAMPLING DATE
VI1 Uncertainty of the 210Pb result [20]
VI11 Uncertainty of counting efficiency of 210Pb
2
2
2
2
2210
2
210
2210
222
)()()()()()( )( PbTPbT
calcal
stdPbstdPb
Pbb mum
RuR
aua
utZuZ
u
minus+
minus+
minus++
= minusminus
minusεεελεεε (VI-1)
2
222
2 )()()()()( (Z) BABnBnBAAn furrufruu minus+minus+= (VI-2)
20
2 )()()( AAgAn rururu += (VI-3)
20
2 )()()( BBgBn rururu += (VI-4)
VI12 Uncertainty of the tailing factor fAB
The uncertainty of the tailing factor fAB is calculated according to following equations
2
210
210
2
210
210
)()()(
+
=
minus
minus
minus
minus
BicalnB
BicalnB
BicalAn
BicalAnBABA r
ru
r
ruffu (VI-5)
20
2210210 )()()( ABicalAgBicalAn rururu += minusminus (VI-6)
20
2210210 )()()( BBicalBgBicalBn rururu += minusminus (VI-7)
The uncertainty of counting efficiency for 210Pb can be calculated by Eq (VI-8)
2
2
2
2
2210
2
210
2210
222
)()()()()()( )( PbTPbT
calcal
stdPbstdPb
Pbb mum
RuR
aua
utZuZ
u
minus+
minus+
minus++
= minusminus
minusεεελεεε (VI-8)
2
222
2 )()()()()( (Z) BABnBnBAAn furrufruu minus+minus+= (VI-9)
20
2 )()()( AAgAn rururu += (VI-10)
20
2 )()()( BBgBn rururu += (VI-11)
38
VI13 Uncertainty of chemical recovery of Pb
Uncertainty of chemical recoveries of Pb in calibration source
minusminus+
minus+
= 2
2
2
2
2
2
cal )()(
)()(
)( )(R calfcalfcalof
calcalof
calfcalof
calg
g
cal mumm
Rmu
mm
Rfu
f
Ru
2
1
2
2
2
2
)()(
)()(
minus+
minus+
minus
minusminus
minusc
ccPb
cPbcalcPb
ccPb
ccal mumC
CRCu
mC
mR (VI-12)
The uncertainty of chemical recovery of Pb in the sample can be calculated
minusminus+
minus+
= 2
2
2
2
2
2
)()(
)()(
)( (R) ffof
offof
gg
mumm
Rmu
mm
Rfu
f
Ru
2
2
2
2
)()(
)()( c
ssPbccPb
cPbcPb
ssPbccPb
c mumCmC
CRCu
mCmC
mR
+minus+
+minus+
minusminus
minusminus
minusminus
2
1
2
2
2
2
)()(
)()(
+minus+
+minus+
minusminus
minusminus
minusminuss
ssPbccPb
sPbsPb
ssPbccPb
s mumCmC
CRCu
mCmC
mR (VI-13)
VI14 Uncertainty of mass ratio
The uncertainty of the mass ratio (fg) of atomic mass of Pb to molar mass of Pb-oxalate is calculated using the equations below
22
M Pb)(
+
=
minus
minus
oxalatePb
M
Pbgg M
u
M
uffu oxalatePb (VI-14)
The uncertainty of the molar mass of lead oxalate u(MPb-oxalate) can be derived by combining standard uncertainties in atomic masses of its constituents as shown in Table VI 1
39
TABLE VI 1 STANDARD UNCERTAINTIES OF ATOMIC WEIGHT AND THE GRAVIMETRIC FACTOR fg
Element Atomic weight
(gmol-1)
Quoted uncertainty (gmol-1)
Conversion factor
Standard uncertainty (gmol-1)
Mass ratio of atomic mass of Pb to
molar mass of Pb-oxalate
Uncertainty ofatomic mass
of Pb to molar mass of
Pb-oxalate
Pb 207215 2 0000 15 3 0000 087 0701 9 0000 002
C 12010 7 0000 8 3 0000 46
O 15999 4 0000 3 3 0000 17
VI15 Combined uncertainty of activity of 210Pb
The combined uncertainty of the 210Pb activity is calculated from Eq (VI-15)
minus+
minus+
minus+
= minusminusminusminus 2
2
2102
2
2102
2
210
2
2
2101 )()()()()( s
d
sPb
BA
sPb
nBnB
sPb
BAnA
sPb
Pbc mum
afu
Z
arru
Z
afru
Z
aau
2
1
23
2
3
21022
2
2
2102
2
2102
2
210 )()()()(
+
+
minus+
minus+ minus
minus
minusminus
minus
minusminusminusPb
Pb
sPbPb
Pb
sPbsPbsPb fuf
afu
f
aRu
R
au
aε
ε (VI-15)
)()( 210222 minusminusminus = PbPbPb utffu λ (VI-16)
210
210321033
)(
11)(
3210
3210
minus
minusminus
minus
minusminusminus
minusminus=
minus
minus
Pb
Pbt
t
PbPbPb
u
e
etffu
Pb
Pb
λλλ λ
λ
(VI-17)
However if the time interval (t2) between the separation of 210Pb and the beginning of the measurement and the counting time of the sample (t3) are much smaller than the half life of 210Pb f2-Pb f3-Pb u(f2-Pb) and u(f3-Pb) are negligible The uncertainties associated to components mentioned above can be calculated as follows
0
0
3
)(t
r
t
rru
Po
gn +=
minus
(VI-18)
0
0
3
)(t
r
t
rru t
Po
tgtn +=
minus
(VI-19)
minus+
+
= minusminusminus
minus2
2
2102
2
2102
2
210210 )()()( )( tn
tn
sPo
nn
sPo
TT
sPo
sPo rur
aru
r
aAu
A
aau
2
2
21022
2
2
2102
2
2102
2
210)()()()( T
T
sPo
PoPo
sPo
TT
sPo
ss
sPofu
f
afu
f
amu
m
amu
m
a
+
+
+
minus+ minus
minusminus
minusminusminus
40
2
1
3
2
3
210 )(
+ minus
minus
minusPo
Po
sPo fuf
a (VI-20)
)()( TTTt utffu λ= (VI-21)
)()( 210222 minusminusminusminus = PoPoPoPo utffu λ (VI-22)
210
210321033
)(
11)(
3210
3210
minus
minusminus
minus
minusminusminus
minusminus=
minus
minus
Po
Pot
t
PoPoPo
u
e
etffu
Po
Po
λλλ λ
λ (VI-23)
VI16 Combined uncertainty of activity of 210Po
The uncertainty of the activity of 210Po on the separation date is calculated according to IAEAAQ12 procedure [8]
VI2 Uncertainty of other alpha emitting isotopes
The same formulas are used to calculate the combined uncertainties as equations that are used for calculation of the activity of alpha emitting analytes at the separation time and the sampling date as well as the chemical recovery and counting efficiency These formulas have to be applied in the spreadsheet approach for calculating the combined uncertainties knowing the standard uncertainty of each component VI3 Spreadsheet approach
For the quantifying the uncertainties the spreadsheet technique [21] was used which could be summarised as follows and showed in the Fig VI 1
bull Calculate function y using parameter xj
y=f(x1x2xj xn) (VI-24)
bull recalculate the same function n times increasing xj to xj+dxj (dxj standard deviation) and keeping the remaining parameters constant
y=f(x1x2xj+dxj xn) (VI-25)
bull the uncertainty on the function dy is the square root of the sum of squares
( )sum minus=n
jyydy1
2 (VI-26)
bull The individual variance contribution fj is
( )( )sum minus
minus=
n
j
jj
yy
yyf
1
2
2
(VI-27)
41
FIG VI 1 Spreadsheet approach for quantifying the uncertainty of the measurement
The results are summarised for the individual isotopes in the Tables VI 2ndashVI 9 and the results of the individual analysis with their uncertainties are shown in the Figs VI 3ndashVI 9 The detailed study about the usual contributors of uncertainty in the nuclear analytical techniques could be found in the IAEA-TECDOC-1401 [11] TABLE VI 2 AN EXAMPLE OF QUANTIFYING UNCERTAINTIES OF 210Po RESULT
Symbol unit Value of variable
Uncertainty Conversion factor to standard uncertainty
Standard uncertainty
Contribution to combined
uncertainty ()
m g 0508 9 0007 3 3 0004 2 010
rgt s-1 0197 0075 1 0075 361
r0t s-1 0000 017 0000 034 1 0000 034 0000 014
rg s-1 0081 0029 1 0029 6352
r0 s-1 0000 034 0000 033 1 0000 033 0000 08
at Bq 0829 0019 1 0019 0252
λt d-1 0000 019 0000 013 1 0000 013 negligible
λPo d-1 0005 72 x 10-9 1 72x10-9 negligible
ft 0982 14 0000 43 1 0000 43 0000 091
f2-Po 1005 73 x 10-9 1 73x10-9 negligible
f3-Po 1005 5 18 x 10-8 1 18 x10-8 negligible
aPo1 Bqmiddotkg-1 672 94
contribution is less than 1 x 10⁻⁵
TABLE VI 3 AN EXAMPLE OF QUANTIFYING UNCERTAINTIES OF EFFICIENCY OF 210Pb
Symbol unit Value of variable
Uncertainty
Conversion factor to standard
uncertainty
Standard uncertainty
Contribution to combined
uncertainty ()
mvial g 14936 35 0000 1 3 0000 17 0004 8
42
Symbol unit Value of variable
Uncertainty
Conversion factor to standard
uncertainty
Standard uncertainty
Contribution to combined
uncertainty ()
mvial+carrsol g 16036 54 0000 1 3 0000 17 0004 8
cPb g g-1 0027 42 0000 021 1 0000 021 011
mvial g 16036 72 0000 10 3 0000 17 0004 8
mvial+std g 17132 6 0000 10 3 0000 17 0004 8
astd Bq 1245 0189 1 0189 805
fgravimetry 0701 85 0000 41 1 0000 41 0066
mfilter g 0036 54 0000 10 3 0000 17 42
mfilter+Pb-precipitate g 0073 77 0000 10 3 0000 17 41
rA s-1 7362 0041 1 0041 76
rA0 s-1 0029 5 0003 1 0002 7 0035
rB s-1 0416 0 0011 1 0011 060
rB0 s-1 0011 7 0002 1 0002 2 0024
fAB 1049 0023 1 0023 040
t12 Pb d 814508 7305 1 731 23
tmeas-ref d 4 532 -
ε 0859 7 0015 3
43
TABLE VI 4 AN EXAMPLE OF QUANTIFYING UNCERTAINTIES OF 210Pb RESULT
Symbol unit Value of variable
Uncertainty Conversion factor to standard uncertainty
Standard uncertainty
Contribution to combined
uncertainty ()
ms g 0508 9 0007 3 3 0004 2 03
rgA s-1 0283 0035 1 0035 883
r0A s-1 0011 7 0002 2 1 0002 2 03
rgB s-1 0031 0009 1 0009 58
r0B s-1 0005 6 0002 3 1 0002 3 04
Ζ s-1 0245 1 0032 7 1 0032 7 -
fAB 1015 3 0012 9 1 0012 9 001
ε 0859 7 0015 3 1 0015 3 13
R 0858 8 0025 3 1 0077 2 35
aPb1 Bqmiddotkg-1 652 12
TABLE VI 5 AN EXAMPLE OF QUANTIFYING UNCERTAINTIES OF 234U RESULT
Symbol unit Value of variable
Uncertainty Conversion factor to standard uncertainty
Standard uncertainty
Contribution to combined
uncertainty ()
ms g 0508 9 0007 3 3 0004 2 003
rgt s-1 0021 78 0008 01 1 0008 369
r0t s-1 0000 030 0000 022 1 0000 022 0000 5
rg s-1 0016 15 0005 90 1 0006 628
r0 s-1 0000 016 0000 022 1 0000 022 0000 1
at Bq 0088 35 0002 10 1 0002 01 029
aU-234_1 Bqmiddotkg-1 129 3
TABLE VI 6 AN EXAMPLE OF QUANTIFYING UNCERTAINTIES OF 238U RESULT
Symbol unit Value of variable
Uncertainty Conversion factor to standard uncertainty
Standard uncertainty
Contribution to combined
uncertainty ()
ms g 0508 9 0007 3 3 0004 2 003
rgt s-1 0021 78 0008 01 1 0008 353
r0t s-1 0000 030 0000 022 1 0000 022 0000 5
rg s-1 0015 61 0005 67 1 0006 644
r0 s-1 0000 009 0000 008 1 0000 008 0000 1
at Bq 0088 35 0002 10 1 0002 1 028
aU-238_1 Bqmiddotkg-1 124 3
44
TABLE VI 7 AN EXAMPLE OF QUANTIFYING UNCERTAINTIES OF 230Th RESULT
Symbol unit Value of variable
Uncertainty Conversion factor to standard uncertainty
Standard uncertainty
Contribution to combined
uncertainty ()
ms g 0508 9 0007 3 3 0004 2 005
rgt s-1 0022 63 0006 44 1 0006 387
r0t s-1 0000 077 0000 063 1 0000 063 0006 1
rg s-1 0028 38 0007 90 1 0008 608
r0 s-1 0000 012 0000 010 1 0000 010 0000 1
at Bq 0090 03 0002 30 1 0002 303 051
aTh-230_1 Bqmiddotkg-1 223 9
TABLE VI 8 AN EXAMPLE OF QUANTIFYING UNCERTAINTIES OF 232Th RESULT
Symbol unit Value of variable
Uncertainty Conversion factor to standard uncertainty
Standard uncertainty
Contribution to combined
uncertainty ()
ms g 0508 9 0007 3 3 0004 2 004
rgt s-1 0022 63 0006 44 1 0006 265
r0t s-1 0000 077 0000 063 1 0000 063 0004 2
rg s-1 0000 28 0000 10 1 0000 1 727
r0 s-1 0000 011 0000 008 1 0000 008 048
at Bq 0090 03 0002 30 1 0002 3 035
aTh-232_1 Bqmiddotkg-1 21 009
TABLE VI 9 AN EXAMPLE OF QUANTIFYING UNCERTAINTIES OF 226Ra RESULT
Symbol unit Value of variable
Uncertainty Conversion factor
to standard uncertainty
Standard uncertainty
Contribution to combined
uncertainty ()
ms g 0508 9 0007 3 3 0004 2 003
rgt s-1 0043 10 0025 05 1 0025 05 603
r0t s-1 0000 111 0000 128 1 0000 128 0004
rg s-1 0063 32 0018 78 1 0018 78 393
r0 s-1 0000 070 015 0000 070 013 1 0000 070 013 0000 5
at Ra-225 Bq 0779 50 0022 53 1 0022 53 04
λAc225 d-1 0069 315 0000 624 1 0000 624 0000 02
λRa225 d-1 0046 520 0000 693 1 0000 693 008
t1-t0 d 337
aRa-226_1 Bqmiddotkg-1 766 39
45
APPENDIX VII DETECTION THRESHOLD AND LIMIT OF THE APPLIED PROCEDURE
TABLE VII 1 TYPICAL DECISION THRESHOLD AND DETECTION LIMIT FOR RELEVANT ISOTOPES
Symbol unit 210Pb 210Po 234U 238U 230 Th 232 Th 226Ra
k 165 165 165 165 165 165 165
m kg 0000 5 0000 5 0000 5 0000 5 0000 5 0000 5 0000 5
ε 086 031 026 026 035 035 025
R 086 073 094 094 068 068 061
n0 52 16 4 4 6 6 28
Tg s 36 000 98 899 343 024 343 024 277 345 277 345 124 984
t0 s 35 542 548 190 512 901 512 901 559 286 559 286 446 755
a Bqmiddotkg-1 13 036 009 009 012 012 068
a1 Bqmiddotkg-1 38 11 028 028 036 036 205
u2(0) Bq2middotkg-2 29 015 0008 4 0008 4 0006 5 0004 7 078
u2(a1) Bq2middotkg-2 23 041 0059 0025 0028 0052 204
a Bqmiddotkg-1 24 12 052 019 018 019 43
46
APPENDIX VIII VALIDATION TEST RESULTS OF THE PROCEDURE
TABLE VIII 1 VALIDATION RESULTS FOR RELEVANT RADIONUCLIDES
Parameters 210Po 210Pb 234U 238U 230Th 226Ra
C Bq kg-1 680 680 120 120 211 780
X Bq kg-1 653 659 127 123 221 793
u(C) Bq kg-1 58 58 9 11 9 62
u(X ) Bq kg-1 23 22 5 5 10 35
δ() -40 -31 58 25 47 17
rL Bq kg-1 106 102 48 47 62 498
RL Bq kg-1 237 454 59 53 89 707
PI() 92 92 85 100 62 91
TABLE VIII 2 ANALYSIS OF VARIANCE (ANOVA) FOR 210Po 210Pb 238U 230Th AND 226Ra IN PHOSPHOGYPSUM
Nuclide SSwb SSbb MSwb MSbb Swb
(as CV)
Sbb
(as CV)
210Po 124 62 151 79 312 1687 271 254
210Pb 8385 197 54 210 2195 220 302
238U 314 386 785 429 227 215
230Th 2176 1598 544 178 334 225
226Ra 412 686 137 858 121 054
SSwb sum of squares within bottles
SSbb sum of squares between bottles
MSwb mean of squares within bottles
MSbb mean of squares between bottles
Swb standard deviation as percent of covalent variance within bottles
Sbb standard deviation as percent of covalent variance between bottles
47
550
600
650
700
750
0 10 20 30 40 50
Samples
Act
ivity
of
21
0 Pb
in th
e sa
mp
le (
Bq
kg
dry
)
Mean1σ
-2σ
-1σ
3σ
2σ
-3σ
FIG VIII 1 210Pb results with associated uncertainties
550
600
650
700
750
0 10 20 30 40 50Samples
Act
ivity
of
21
0 Po
in t
he s
ampl
e (B
qkg
dry
)
Mean
1σ
-1σ
3σ
2σ
-3σ-2σ
FIG VIII 2 210Po results with associated uncertainties
48
110
115
120
125
130
135
140
0 10 20 30 40 50
Samples
Act
ivity
of
238
U in
the
sam
ple
(B
qkg
dry
)
Mean
1σ
-1σ
3σ
2σ
-3σ
-2σ
FIG VIII 3 238U results with associated uncertainties
105
110
115
120
125
130
135
140
145
150
0 10 20 30 40 50
Samples
Act
ivity
of
23
4 U in
the
sa
mpl
e (B
qkg
dry
)
Mean1σ
-2σ-1σ
3σ2σ
-3σ
FIG VIII 4 234U results with associated uncertainties
49
190
200
210
220
230
240
250
0 5 10 15 20 25 30 35 40 45 50
Samples
Act
ivity
of
23
0 Th
in th
e s
am
ple
(B
qk
g d
ry)
2σ
3σ
1σ
-1σ
-2σ
-3σ
Mean
FIG VIII 5 230 Th results with associated uncertainties
05
10
15
20
25
30
35
40
0 10 20 30 40 50
Samples
Act
ivity
of
23
2 Th
in th
e sa
mp
le (
Bq
kg
dry
)
Mean
1σ
-2σ
-1σ
3σ
2σ
-3σ
FIG VIII 6 232 Th results with associated uncertainties
50
650
700
750
800
850
900
1 2 3 4 5 6 7 8 9 10 11 12 13 14 15 16 17 18 19 20
Sample
Act
ivity
of
226 R
a in
th
e sa
mp
le (
Bq
kg
dry
)
Mean
1σ
-1σ
3σ
2σ
-3σ
-2σ
FIG VIII 7 226Ra results with associated uncertainties
51
CONTRIBUTORS TO DRAFTING AND REVIEW
Hampe D Gaigl FA
Verein fuumlr Kernverfahrenstechnik und Analytik Rossendorf eV Dresden Germany IAEA Environment Laboratories Terrestrial Environment Laboratory Seibersdorf Austria
Kim C-K IAEA Environment Laboratories Terrestrial Environment Laboratory Seibersdorf Austria
Kis-Benedek Gy IAEA Environment Laboratories Terrestrial Environment Laboratory Seibersdorf Austria
Martin P IAEA Environment Laboratories Terrestrial Environment Laboratory Seibersdorf Austria
Mietelski J W The Henryk Niewodniczanski Institute of Nuclear Physics Polish Academy of Sciences Poland
Sansone U IAEA Environment Laboratories Terrestrial Environment Laboratory Seibersdorf Austria
Varga B Central Agricultural Office Food and Feed Safety Directorate Hungary
23
[14] Monographie BIPM-5 Vol 1ndashMonographie BIPM-5 Vol 5
httpwwwnucleideorg Decay Data Evaluation Project (DDEP) accessed in October 2010
[15] NuDat 25 (Database at the US NNDC) httpwww-ndsiaeaorg accessed in October 2010
[16] HORWITZ et al A Novel Strontium-Selective Extraction Chromatographic Resin Solvent Extraction amp Ion Exchange 10 (1992) 313
[17] HORWITZ et al Extraction Chromatography of Actinides and Selected Fission Products Principles and Achievement of Selectivity presented at International Workshop on the Application of Extraction Chromatography in Radionuclide Measurement IRMM Geel 1998
[18] HORWITZ et al Separation and Preconcentration of Actinides by Extraction Chromatography Using a Supported Liquid Anion Exchanger Application to the Characterization of High-Level Nuclear Waste Solutions Analytica Chimica Acta 310 (1995) 63-78
[19] HORWITZ et al Separation and Preconcentration of Uranium from Acidic Media by Extraction Chromatography Analytica Chimica Acta 266 (1992) 25-37
[20] C-K KIM MARTIN P FAJGELJ A Quantification of measurement uncertainty in the sequential determination of 210Pb and 210Po by liquid scintillation counting and alpha particle spectrometry Accreditation and Quality Assurance 13 12 (2008) 691-702
[21] J KRAGTEN Calculating Standard Deviation and Confidence Intervals with a Universally Applicable Spreadsheet Technique Analyst 119 (1994) 2161ndash2165
24
APPENDIX I NUCLEAR DATA OF RELEVANT RADIONUCLIDES AND DECAY CHAINS OF U
AND Th SERIES
TABLE I 1 NUCLEAR DATA OF RELEVANT RADIONUCLIDES [14]
Radionuclide Half-life Disintegration modes
E (MeV) Probability ()
225Ac 100(1) d α 5580 5(14) 095(4)
α 5599 3(14) 0114(7)
α 5609 0(14) 109(5)
α 5637 3(14) 416(23)
α 5682 2(14) 131(4)
α 5686 4(14) 0021(14)
α 5723 1(14) 203(23)
α 5730 5(14) 16(3)
α 5731 6(14) 124(10)
α 5731 9(17) 90(5)
α 5797 7(14) 62(9)
α 5793 1(21) 189(20)
α 5804 2(14) 03
α 5829 6(14) 524(24)
217At 323(4) x 10-3 s α 6484 7(16) 0016 7(8)
α 6813 8(16) 0038 4(15)
α 7066 9(16) 99932(3)
133Ba 10540(6) y γ 0053 162 2(6) 214(3)
γ 0079 614 2(12) 265(5)
γ 0080 997 9(11) 329(3)
γ 0276 398 9(12) 716(5)
γ 0302 850 8(5) 1834(13)
γ 0356 012 9(7) 6205(19)
γ 0383 848 5(12) 894(6)
210Bi 5012(5) d β 1162 1(8) 99999 86(2)
212Bi 6054(6) min β 0633(2) 190(4)
β 0741(2) 145(29)
β 1527(2) 458(21)
β 2254(2) 5523(21)
α 6050 92(4) 251(1)
α 6090 02(4) 97(1)
221Fr 479(2) min α 6126 3(15) 151(2)
α 6243(2) 134(7)
α 6341 0(13) 828(2)
TABLE I 1 NUCLEAR DATA OF RELEVANT RADIONUCLIDES [14] (cont)
25
Radionuclide Half-life Disintegration modes
E (MeV) Probability ()
210Pb 2223(12) y β 0017 0(5) 802(13)
β 0063 5(5) 198(13)
γ 0046 539(1) 4252(40)
208Po 2898(2) y α 5114 9(14) 99995 8(4)
α 4220(15) 24(7)x10-4
209Po 115(13) y α 4885(2) 198(32)
α 4883(2) 792(32)
α 4622(5) 0548(7)
210Po 138376 3(17) d α 5304 33(7) 99998 76
α 4516 66(9) 0001 24(4)
213Po 370(5) x 10-6 s α 8375 9(25) 99995 0(5)
216Po 0150(5) s α 6778 6(5) 99998 1(3)
α 5988 6(10) 0001 9(3)
218Po 3094(6) min α 6002 35(9) 99976 9(32)
223Ra 1143(5) d α 5747 0(4) 900(20)
α 5716 23(29) 516(13)
α 5606 73(30) 252(5)
α 5539 80(90) 900(20)
224Ra 3627(7) d α 5448 81(16) 526(7)
α 5685 50(15) 9472(7)
γ 0240 986(6) 412(4)
225Ra 1482(19)d β 0316(5) 688(20)
β 0356(5) 312(20)
γ 0040 09(5) 300(7)
226Ra 1 600(7) y α 4601(1) 595(4)
α 4784 34(25) 94038(40)
228Ra 575(4) y β 00127(7) 30(10)
β 00256(7) 87(9)
β 00391(7) 49(10)
β 00395(7) 12(10)
220Rn 558(3) s α 5748 46(14) 0118(15)
α 6288 22(10) 99882(15)
222Rn 3823 2(8) d α 5489 48(30) 9992(1)
228 Th 69860(23) d α 5176 89(23) 020(2)
α 5211 08(22) 038(3)
α 5340 38(22) 262(2)
α 5423 28(22) 732(2)
TABEL I 1 NUCLEAR DATA OF RELEVANT RADIONUCLIDES [14] (cont)
26
Radionuclide Half-life Disintegration
modes E (MeV) Probability ()
229 Th 7 340(160) y α 5053(2) 660(10)
α 4978 5(12) 317(4)
α 4967 5(12) 597(6)
α 4901 0(12) 1020(8)
α 4845 3(12) 5620(20)
α 4814 6(12) 930(8)
230 Th 7538(30) x 104 y α 4687 0(15) 763(3)
α 4620 5(15) 234(10)
232 Th 1402(6) x 109 y α 3810 0(14) 0068(20)
α 3948 5(14) 210(13)
α 4011 2(14) 789(13)
234 Th 2410(3) d β 0105(10) 65(7)
β 0106(10) 141(12)
β 0198(10) 778(15)
γ 0063 30(2) 375(8)
232U 706(11) y α 5263 48(9) 306(6)
α 5320 24(9) 691(6)
233U 1592(2) x 105 y α 4824 2(12) 843(6)
α 4783 5(12) 132
234U 2455(6) x 105 y α 4603 5(7) 0210(2)
α 4722 4(7) 2842(2)
α 4774 6(7) 7137(2)
235U 704(1) x 106 y α 4322(4) 333(6)
α 4397 8(13) 5719(20)
α 4414 9(5) 301(16)
α 4502 4(7) 128(5)
α 4556 0(4) 379(6)
α 4596 4(13) 474(6)
236U 2343(6) x 107 y α 4445(5) 261(40)
α 4494(3) 738(40)
238U 4468(5) x 109 y α 4038(5) 013(3)
α 4151(5) 2233(50)
α 4198(3) 7754(50)
Emax for beta emitting radioisotopes
Data were taken from [15]
27
FIG I 1 Decay chain of 238U [4]
FIG I 2 Decay chain of 232Th [4]
28
APPENDIX II FLOW CHART FOR SEQUENTIAL SEPARATION OF 210Po 210Pb Th U AND 226Ra
IN PHOSPHOGYPSUM
29
APPENDIX III PROPERTIES OF RESINS
III1 Sr resin
FIG III 1 Structure of the Sr resin (wwweichromcom)
FIG III 2 Capacity factor of Sr resin in nitric acid (wwweichromcom) [16]
30
FIG III 3 Capacity factor of Sr resin in nitric acid (wwweichromcom) [17]
III2 TEVA resin
FIG III 4 Structure of the TEVA resin (wwweichromcom)
31
FIG III 5 Capacity factor of TEVA resin in nitric acid and hydrochloric acid (wwweichromcom) [18]
III3 UTEVA resin
FIG III 6 Structure of the UTEVA resin (wwweichromcom)
32
FIG III 7 Capacity factor of UTEVA resin in nitric acid and hydrochloric acid (wwweichromcom) [19]
33
APPENDIX IV ALPHA SPECTRA OF ANALYTES
FIG IV 1 Alpha spectrum of Po isotopes
FIG IV 2 Alpha spectrum of Th isotopes in phosphogypsum (with progeny)
228Th is resulted from 232U tracer spiked in the sample
34
FIG IV 3 Alpha spectrum of U isotopes
FIG IV 4 Alpha spectrum of 226Ra and its progeny (spiked with 225Ra)
35
FIG IV 5 Overlapping alpha spectra of U and Po isotopes
FIG IV 6 Overlapping alpha spectra of U and Th (with progeny) isotopes
36
APPENDIX V LIQUIDE SCINTILLATION SPECTRA
a)
b)
A window
(115-320 ch)
B window
(320 -410 ch)
210Po
210Pb
210Bi
210Bi
Co
unts
Ch
ann
elC
oun
tsC
han
nel
Channel number
a)
b)
A window
(115-320 ch)
B window
(320 -410 ch)
210Po
210Pb
210Bi
210Bi
Co
unts
Ch
ann
elC
oun
tsC
han
nel
Channel number
FIG V 1 Typical liquid scintillation spectra of beta-emitting 210Pb and 210Bi and alpha emitting 210Po (calibration sources) a) 210Pb 210Bi and 210Po spectra
b) pure 210Bi spectrum
37
APPENDIX VI CALCULATION OF THE COMBINED UNCERTAINTY
OF THE ACTIVITIES OF THE ANALYTES ON SAMPLING DATE
VI1 Uncertainty of the 210Pb result [20]
VI11 Uncertainty of counting efficiency of 210Pb
2
2
2
2
2210
2
210
2210
222
)()()()()()( )( PbTPbT
calcal
stdPbstdPb
Pbb mum
RuR
aua
utZuZ
u
minus+
minus+
minus++
= minusminus
minusεεελεεε (VI-1)
2
222
2 )()()()()( (Z) BABnBnBAAn furrufruu minus+minus+= (VI-2)
20
2 )()()( AAgAn rururu += (VI-3)
20
2 )()()( BBgBn rururu += (VI-4)
VI12 Uncertainty of the tailing factor fAB
The uncertainty of the tailing factor fAB is calculated according to following equations
2
210
210
2
210
210
)()()(
+
=
minus
minus
minus
minus
BicalnB
BicalnB
BicalAn
BicalAnBABA r
ru
r
ruffu (VI-5)
20
2210210 )()()( ABicalAgBicalAn rururu += minusminus (VI-6)
20
2210210 )()()( BBicalBgBicalBn rururu += minusminus (VI-7)
The uncertainty of counting efficiency for 210Pb can be calculated by Eq (VI-8)
2
2
2
2
2210
2
210
2210
222
)()()()()()( )( PbTPbT
calcal
stdPbstdPb
Pbb mum
RuR
aua
utZuZ
u
minus+
minus+
minus++
= minusminus
minusεεελεεε (VI-8)
2
222
2 )()()()()( (Z) BABnBnBAAn furrufruu minus+minus+= (VI-9)
20
2 )()()( AAgAn rururu += (VI-10)
20
2 )()()( BBgBn rururu += (VI-11)
38
VI13 Uncertainty of chemical recovery of Pb
Uncertainty of chemical recoveries of Pb in calibration source
minusminus+
minus+
= 2
2
2
2
2
2
cal )()(
)()(
)( )(R calfcalfcalof
calcalof
calfcalof
calg
g
cal mumm
Rmu
mm
Rfu
f
Ru
2
1
2
2
2
2
)()(
)()(
minus+
minus+
minus
minusminus
minusc
ccPb
cPbcalcPb
ccPb
ccal mumC
CRCu
mC
mR (VI-12)
The uncertainty of chemical recovery of Pb in the sample can be calculated
minusminus+
minus+
= 2
2
2
2
2
2
)()(
)()(
)( (R) ffof
offof
gg
mumm
Rmu
mm
Rfu
f
Ru
2
2
2
2
)()(
)()( c
ssPbccPb
cPbcPb
ssPbccPb
c mumCmC
CRCu
mCmC
mR
+minus+
+minus+
minusminus
minusminus
minusminus
2
1
2
2
2
2
)()(
)()(
+minus+
+minus+
minusminus
minusminus
minusminuss
ssPbccPb
sPbsPb
ssPbccPb
s mumCmC
CRCu
mCmC
mR (VI-13)
VI14 Uncertainty of mass ratio
The uncertainty of the mass ratio (fg) of atomic mass of Pb to molar mass of Pb-oxalate is calculated using the equations below
22
M Pb)(
+
=
minus
minus
oxalatePb
M
Pbgg M
u
M
uffu oxalatePb (VI-14)
The uncertainty of the molar mass of lead oxalate u(MPb-oxalate) can be derived by combining standard uncertainties in atomic masses of its constituents as shown in Table VI 1
39
TABLE VI 1 STANDARD UNCERTAINTIES OF ATOMIC WEIGHT AND THE GRAVIMETRIC FACTOR fg
Element Atomic weight
(gmol-1)
Quoted uncertainty (gmol-1)
Conversion factor
Standard uncertainty (gmol-1)
Mass ratio of atomic mass of Pb to
molar mass of Pb-oxalate
Uncertainty ofatomic mass
of Pb to molar mass of
Pb-oxalate
Pb 207215 2 0000 15 3 0000 087 0701 9 0000 002
C 12010 7 0000 8 3 0000 46
O 15999 4 0000 3 3 0000 17
VI15 Combined uncertainty of activity of 210Pb
The combined uncertainty of the 210Pb activity is calculated from Eq (VI-15)
minus+
minus+
minus+
= minusminusminusminus 2
2
2102
2
2102
2
210
2
2
2101 )()()()()( s
d
sPb
BA
sPb
nBnB
sPb
BAnA
sPb
Pbc mum
afu
Z
arru
Z
afru
Z
aau
2
1
23
2
3
21022
2
2
2102
2
2102
2
210 )()()()(
+
+
minus+
minus+ minus
minus
minusminus
minus
minusminusminusPb
Pb
sPbPb
Pb
sPbsPbsPb fuf
afu
f
aRu
R
au
aε
ε (VI-15)
)()( 210222 minusminusminus = PbPbPb utffu λ (VI-16)
210
210321033
)(
11)(
3210
3210
minus
minusminus
minus
minusminusminus
minusminus=
minus
minus
Pb
Pbt
t
PbPbPb
u
e
etffu
Pb
Pb
λλλ λ
λ
(VI-17)
However if the time interval (t2) between the separation of 210Pb and the beginning of the measurement and the counting time of the sample (t3) are much smaller than the half life of 210Pb f2-Pb f3-Pb u(f2-Pb) and u(f3-Pb) are negligible The uncertainties associated to components mentioned above can be calculated as follows
0
0
3
)(t
r
t
rru
Po
gn +=
minus
(VI-18)
0
0
3
)(t
r
t
rru t
Po
tgtn +=
minus
(VI-19)
minus+
+
= minusminusminus
minus2
2
2102
2
2102
2
210210 )()()( )( tn
tn
sPo
nn
sPo
TT
sPo
sPo rur
aru
r
aAu
A
aau
2
2
21022
2
2
2102
2
2102
2
210)()()()( T
T
sPo
PoPo
sPo
TT
sPo
ss
sPofu
f
afu
f
amu
m
amu
m
a
+
+
+
minus+ minus
minusminus
minusminusminus
40
2
1
3
2
3
210 )(
+ minus
minus
minusPo
Po
sPo fuf
a (VI-20)
)()( TTTt utffu λ= (VI-21)
)()( 210222 minusminusminusminus = PoPoPoPo utffu λ (VI-22)
210
210321033
)(
11)(
3210
3210
minus
minusminus
minus
minusminusminus
minusminus=
minus
minus
Po
Pot
t
PoPoPo
u
e
etffu
Po
Po
λλλ λ
λ (VI-23)
VI16 Combined uncertainty of activity of 210Po
The uncertainty of the activity of 210Po on the separation date is calculated according to IAEAAQ12 procedure [8]
VI2 Uncertainty of other alpha emitting isotopes
The same formulas are used to calculate the combined uncertainties as equations that are used for calculation of the activity of alpha emitting analytes at the separation time and the sampling date as well as the chemical recovery and counting efficiency These formulas have to be applied in the spreadsheet approach for calculating the combined uncertainties knowing the standard uncertainty of each component VI3 Spreadsheet approach
For the quantifying the uncertainties the spreadsheet technique [21] was used which could be summarised as follows and showed in the Fig VI 1
bull Calculate function y using parameter xj
y=f(x1x2xj xn) (VI-24)
bull recalculate the same function n times increasing xj to xj+dxj (dxj standard deviation) and keeping the remaining parameters constant
y=f(x1x2xj+dxj xn) (VI-25)
bull the uncertainty on the function dy is the square root of the sum of squares
( )sum minus=n
jyydy1
2 (VI-26)
bull The individual variance contribution fj is
( )( )sum minus
minus=
n
j
jj
yy
yyf
1
2
2
(VI-27)
41
FIG VI 1 Spreadsheet approach for quantifying the uncertainty of the measurement
The results are summarised for the individual isotopes in the Tables VI 2ndashVI 9 and the results of the individual analysis with their uncertainties are shown in the Figs VI 3ndashVI 9 The detailed study about the usual contributors of uncertainty in the nuclear analytical techniques could be found in the IAEA-TECDOC-1401 [11] TABLE VI 2 AN EXAMPLE OF QUANTIFYING UNCERTAINTIES OF 210Po RESULT
Symbol unit Value of variable
Uncertainty Conversion factor to standard uncertainty
Standard uncertainty
Contribution to combined
uncertainty ()
m g 0508 9 0007 3 3 0004 2 010
rgt s-1 0197 0075 1 0075 361
r0t s-1 0000 017 0000 034 1 0000 034 0000 014
rg s-1 0081 0029 1 0029 6352
r0 s-1 0000 034 0000 033 1 0000 033 0000 08
at Bq 0829 0019 1 0019 0252
λt d-1 0000 019 0000 013 1 0000 013 negligible
λPo d-1 0005 72 x 10-9 1 72x10-9 negligible
ft 0982 14 0000 43 1 0000 43 0000 091
f2-Po 1005 73 x 10-9 1 73x10-9 negligible
f3-Po 1005 5 18 x 10-8 1 18 x10-8 negligible
aPo1 Bqmiddotkg-1 672 94
contribution is less than 1 x 10⁻⁵
TABLE VI 3 AN EXAMPLE OF QUANTIFYING UNCERTAINTIES OF EFFICIENCY OF 210Pb
Symbol unit Value of variable
Uncertainty
Conversion factor to standard
uncertainty
Standard uncertainty
Contribution to combined
uncertainty ()
mvial g 14936 35 0000 1 3 0000 17 0004 8
42
Symbol unit Value of variable
Uncertainty
Conversion factor to standard
uncertainty
Standard uncertainty
Contribution to combined
uncertainty ()
mvial+carrsol g 16036 54 0000 1 3 0000 17 0004 8
cPb g g-1 0027 42 0000 021 1 0000 021 011
mvial g 16036 72 0000 10 3 0000 17 0004 8
mvial+std g 17132 6 0000 10 3 0000 17 0004 8
astd Bq 1245 0189 1 0189 805
fgravimetry 0701 85 0000 41 1 0000 41 0066
mfilter g 0036 54 0000 10 3 0000 17 42
mfilter+Pb-precipitate g 0073 77 0000 10 3 0000 17 41
rA s-1 7362 0041 1 0041 76
rA0 s-1 0029 5 0003 1 0002 7 0035
rB s-1 0416 0 0011 1 0011 060
rB0 s-1 0011 7 0002 1 0002 2 0024
fAB 1049 0023 1 0023 040
t12 Pb d 814508 7305 1 731 23
tmeas-ref d 4 532 -
ε 0859 7 0015 3
43
TABLE VI 4 AN EXAMPLE OF QUANTIFYING UNCERTAINTIES OF 210Pb RESULT
Symbol unit Value of variable
Uncertainty Conversion factor to standard uncertainty
Standard uncertainty
Contribution to combined
uncertainty ()
ms g 0508 9 0007 3 3 0004 2 03
rgA s-1 0283 0035 1 0035 883
r0A s-1 0011 7 0002 2 1 0002 2 03
rgB s-1 0031 0009 1 0009 58
r0B s-1 0005 6 0002 3 1 0002 3 04
Ζ s-1 0245 1 0032 7 1 0032 7 -
fAB 1015 3 0012 9 1 0012 9 001
ε 0859 7 0015 3 1 0015 3 13
R 0858 8 0025 3 1 0077 2 35
aPb1 Bqmiddotkg-1 652 12
TABLE VI 5 AN EXAMPLE OF QUANTIFYING UNCERTAINTIES OF 234U RESULT
Symbol unit Value of variable
Uncertainty Conversion factor to standard uncertainty
Standard uncertainty
Contribution to combined
uncertainty ()
ms g 0508 9 0007 3 3 0004 2 003
rgt s-1 0021 78 0008 01 1 0008 369
r0t s-1 0000 030 0000 022 1 0000 022 0000 5
rg s-1 0016 15 0005 90 1 0006 628
r0 s-1 0000 016 0000 022 1 0000 022 0000 1
at Bq 0088 35 0002 10 1 0002 01 029
aU-234_1 Bqmiddotkg-1 129 3
TABLE VI 6 AN EXAMPLE OF QUANTIFYING UNCERTAINTIES OF 238U RESULT
Symbol unit Value of variable
Uncertainty Conversion factor to standard uncertainty
Standard uncertainty
Contribution to combined
uncertainty ()
ms g 0508 9 0007 3 3 0004 2 003
rgt s-1 0021 78 0008 01 1 0008 353
r0t s-1 0000 030 0000 022 1 0000 022 0000 5
rg s-1 0015 61 0005 67 1 0006 644
r0 s-1 0000 009 0000 008 1 0000 008 0000 1
at Bq 0088 35 0002 10 1 0002 1 028
aU-238_1 Bqmiddotkg-1 124 3
44
TABLE VI 7 AN EXAMPLE OF QUANTIFYING UNCERTAINTIES OF 230Th RESULT
Symbol unit Value of variable
Uncertainty Conversion factor to standard uncertainty
Standard uncertainty
Contribution to combined
uncertainty ()
ms g 0508 9 0007 3 3 0004 2 005
rgt s-1 0022 63 0006 44 1 0006 387
r0t s-1 0000 077 0000 063 1 0000 063 0006 1
rg s-1 0028 38 0007 90 1 0008 608
r0 s-1 0000 012 0000 010 1 0000 010 0000 1
at Bq 0090 03 0002 30 1 0002 303 051
aTh-230_1 Bqmiddotkg-1 223 9
TABLE VI 8 AN EXAMPLE OF QUANTIFYING UNCERTAINTIES OF 232Th RESULT
Symbol unit Value of variable
Uncertainty Conversion factor to standard uncertainty
Standard uncertainty
Contribution to combined
uncertainty ()
ms g 0508 9 0007 3 3 0004 2 004
rgt s-1 0022 63 0006 44 1 0006 265
r0t s-1 0000 077 0000 063 1 0000 063 0004 2
rg s-1 0000 28 0000 10 1 0000 1 727
r0 s-1 0000 011 0000 008 1 0000 008 048
at Bq 0090 03 0002 30 1 0002 3 035
aTh-232_1 Bqmiddotkg-1 21 009
TABLE VI 9 AN EXAMPLE OF QUANTIFYING UNCERTAINTIES OF 226Ra RESULT
Symbol unit Value of variable
Uncertainty Conversion factor
to standard uncertainty
Standard uncertainty
Contribution to combined
uncertainty ()
ms g 0508 9 0007 3 3 0004 2 003
rgt s-1 0043 10 0025 05 1 0025 05 603
r0t s-1 0000 111 0000 128 1 0000 128 0004
rg s-1 0063 32 0018 78 1 0018 78 393
r0 s-1 0000 070 015 0000 070 013 1 0000 070 013 0000 5
at Ra-225 Bq 0779 50 0022 53 1 0022 53 04
λAc225 d-1 0069 315 0000 624 1 0000 624 0000 02
λRa225 d-1 0046 520 0000 693 1 0000 693 008
t1-t0 d 337
aRa-226_1 Bqmiddotkg-1 766 39
45
APPENDIX VII DETECTION THRESHOLD AND LIMIT OF THE APPLIED PROCEDURE
TABLE VII 1 TYPICAL DECISION THRESHOLD AND DETECTION LIMIT FOR RELEVANT ISOTOPES
Symbol unit 210Pb 210Po 234U 238U 230 Th 232 Th 226Ra
k 165 165 165 165 165 165 165
m kg 0000 5 0000 5 0000 5 0000 5 0000 5 0000 5 0000 5
ε 086 031 026 026 035 035 025
R 086 073 094 094 068 068 061
n0 52 16 4 4 6 6 28
Tg s 36 000 98 899 343 024 343 024 277 345 277 345 124 984
t0 s 35 542 548 190 512 901 512 901 559 286 559 286 446 755
a Bqmiddotkg-1 13 036 009 009 012 012 068
a1 Bqmiddotkg-1 38 11 028 028 036 036 205
u2(0) Bq2middotkg-2 29 015 0008 4 0008 4 0006 5 0004 7 078
u2(a1) Bq2middotkg-2 23 041 0059 0025 0028 0052 204
a Bqmiddotkg-1 24 12 052 019 018 019 43
46
APPENDIX VIII VALIDATION TEST RESULTS OF THE PROCEDURE
TABLE VIII 1 VALIDATION RESULTS FOR RELEVANT RADIONUCLIDES
Parameters 210Po 210Pb 234U 238U 230Th 226Ra
C Bq kg-1 680 680 120 120 211 780
X Bq kg-1 653 659 127 123 221 793
u(C) Bq kg-1 58 58 9 11 9 62
u(X ) Bq kg-1 23 22 5 5 10 35
δ() -40 -31 58 25 47 17
rL Bq kg-1 106 102 48 47 62 498
RL Bq kg-1 237 454 59 53 89 707
PI() 92 92 85 100 62 91
TABLE VIII 2 ANALYSIS OF VARIANCE (ANOVA) FOR 210Po 210Pb 238U 230Th AND 226Ra IN PHOSPHOGYPSUM
Nuclide SSwb SSbb MSwb MSbb Swb
(as CV)
Sbb
(as CV)
210Po 124 62 151 79 312 1687 271 254
210Pb 8385 197 54 210 2195 220 302
238U 314 386 785 429 227 215
230Th 2176 1598 544 178 334 225
226Ra 412 686 137 858 121 054
SSwb sum of squares within bottles
SSbb sum of squares between bottles
MSwb mean of squares within bottles
MSbb mean of squares between bottles
Swb standard deviation as percent of covalent variance within bottles
Sbb standard deviation as percent of covalent variance between bottles
47
550
600
650
700
750
0 10 20 30 40 50
Samples
Act
ivity
of
21
0 Pb
in th
e sa
mp
le (
Bq
kg
dry
)
Mean1σ
-2σ
-1σ
3σ
2σ
-3σ
FIG VIII 1 210Pb results with associated uncertainties
550
600
650
700
750
0 10 20 30 40 50Samples
Act
ivity
of
21
0 Po
in t
he s
ampl
e (B
qkg
dry
)
Mean
1σ
-1σ
3σ
2σ
-3σ-2σ
FIG VIII 2 210Po results with associated uncertainties
48
110
115
120
125
130
135
140
0 10 20 30 40 50
Samples
Act
ivity
of
238
U in
the
sam
ple
(B
qkg
dry
)
Mean
1σ
-1σ
3σ
2σ
-3σ
-2σ
FIG VIII 3 238U results with associated uncertainties
105
110
115
120
125
130
135
140
145
150
0 10 20 30 40 50
Samples
Act
ivity
of
23
4 U in
the
sa
mpl
e (B
qkg
dry
)
Mean1σ
-2σ-1σ
3σ2σ
-3σ
FIG VIII 4 234U results with associated uncertainties
49
190
200
210
220
230
240
250
0 5 10 15 20 25 30 35 40 45 50
Samples
Act
ivity
of
23
0 Th
in th
e s
am
ple
(B
qk
g d
ry)
2σ
3σ
1σ
-1σ
-2σ
-3σ
Mean
FIG VIII 5 230 Th results with associated uncertainties
05
10
15
20
25
30
35
40
0 10 20 30 40 50
Samples
Act
ivity
of
23
2 Th
in th
e sa
mp
le (
Bq
kg
dry
)
Mean
1σ
-2σ
-1σ
3σ
2σ
-3σ
FIG VIII 6 232 Th results with associated uncertainties
50
650
700
750
800
850
900
1 2 3 4 5 6 7 8 9 10 11 12 13 14 15 16 17 18 19 20
Sample
Act
ivity
of
226 R
a in
th
e sa
mp
le (
Bq
kg
dry
)
Mean
1σ
-1σ
3σ
2σ
-3σ
-2σ
FIG VIII 7 226Ra results with associated uncertainties
51
CONTRIBUTORS TO DRAFTING AND REVIEW
Hampe D Gaigl FA
Verein fuumlr Kernverfahrenstechnik und Analytik Rossendorf eV Dresden Germany IAEA Environment Laboratories Terrestrial Environment Laboratory Seibersdorf Austria
Kim C-K IAEA Environment Laboratories Terrestrial Environment Laboratory Seibersdorf Austria
Kis-Benedek Gy IAEA Environment Laboratories Terrestrial Environment Laboratory Seibersdorf Austria
Martin P IAEA Environment Laboratories Terrestrial Environment Laboratory Seibersdorf Austria
Mietelski J W The Henryk Niewodniczanski Institute of Nuclear Physics Polish Academy of Sciences Poland
Sansone U IAEA Environment Laboratories Terrestrial Environment Laboratory Seibersdorf Austria
Varga B Central Agricultural Office Food and Feed Safety Directorate Hungary
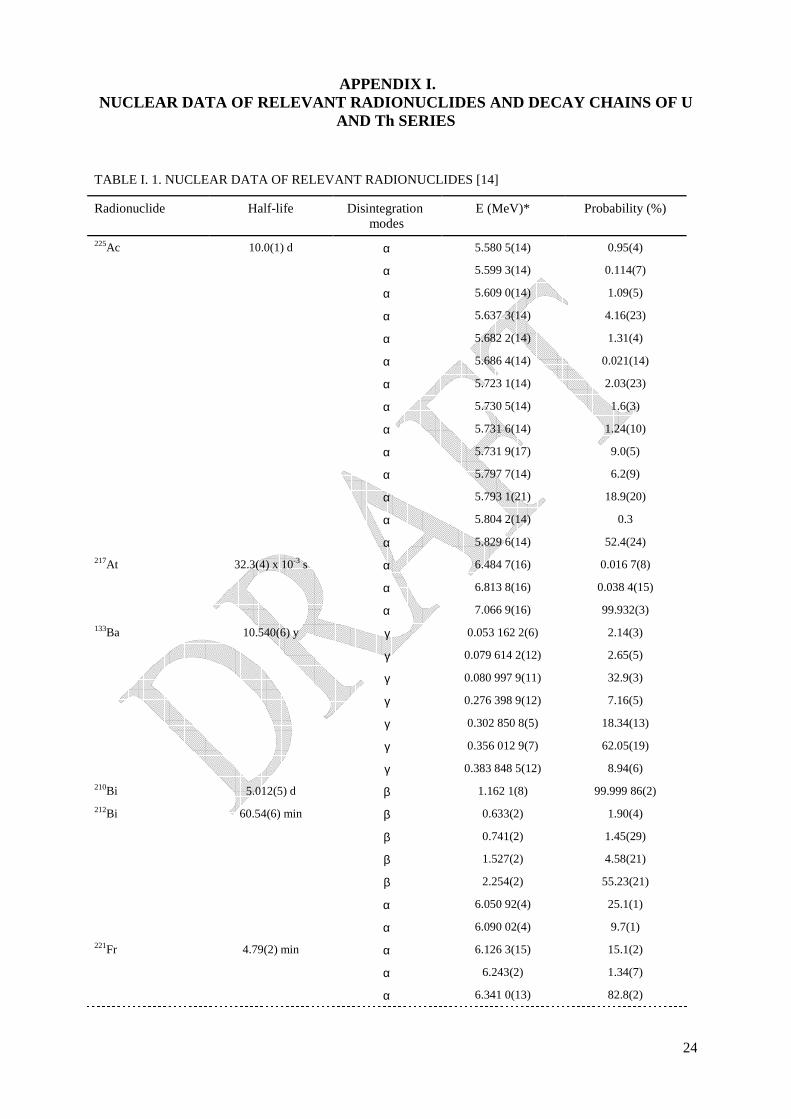
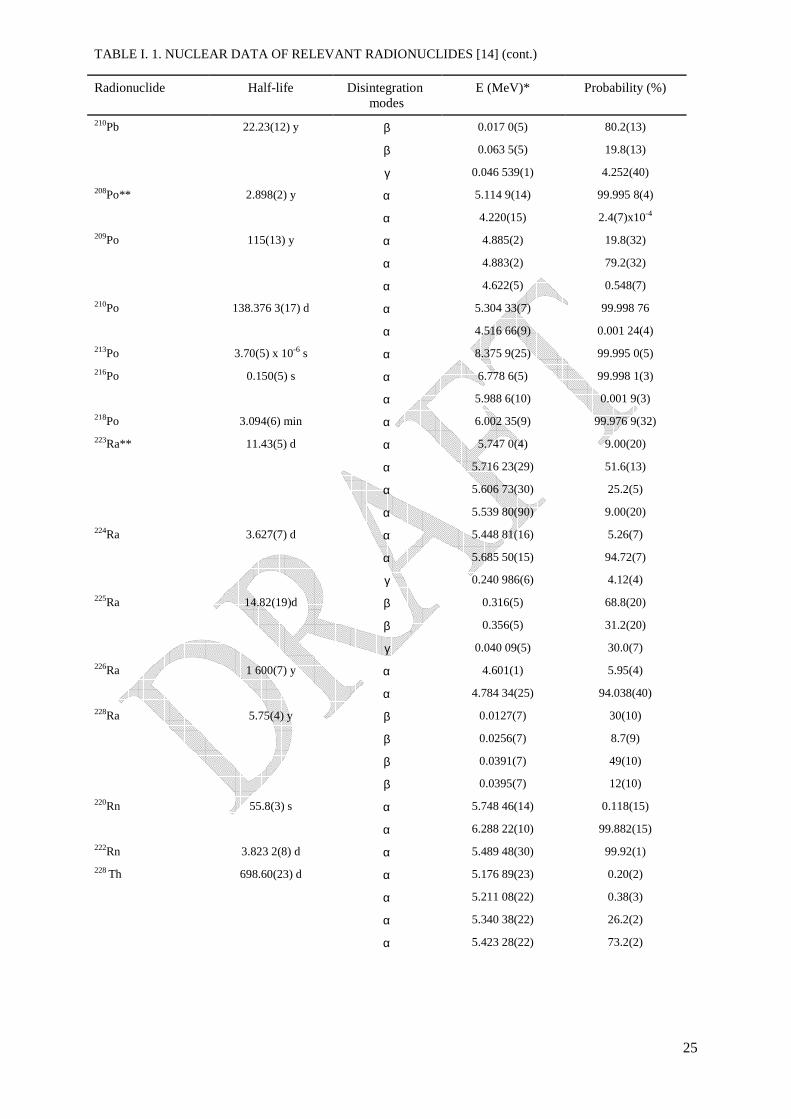
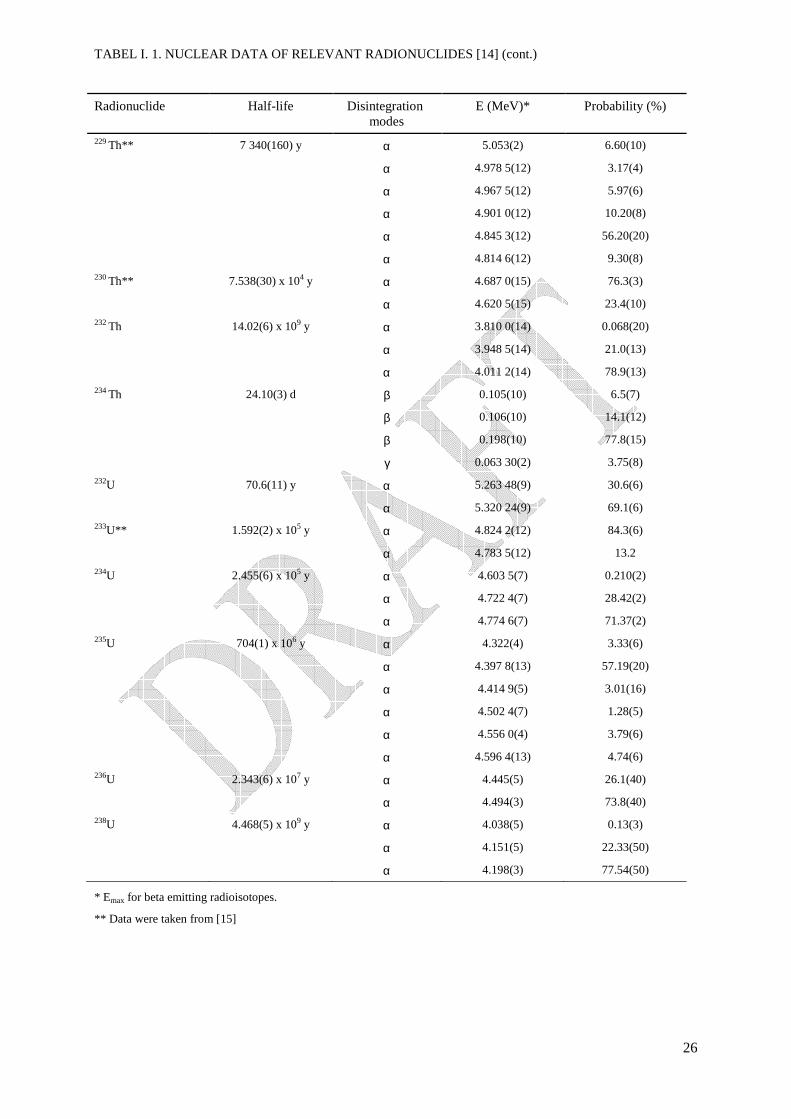
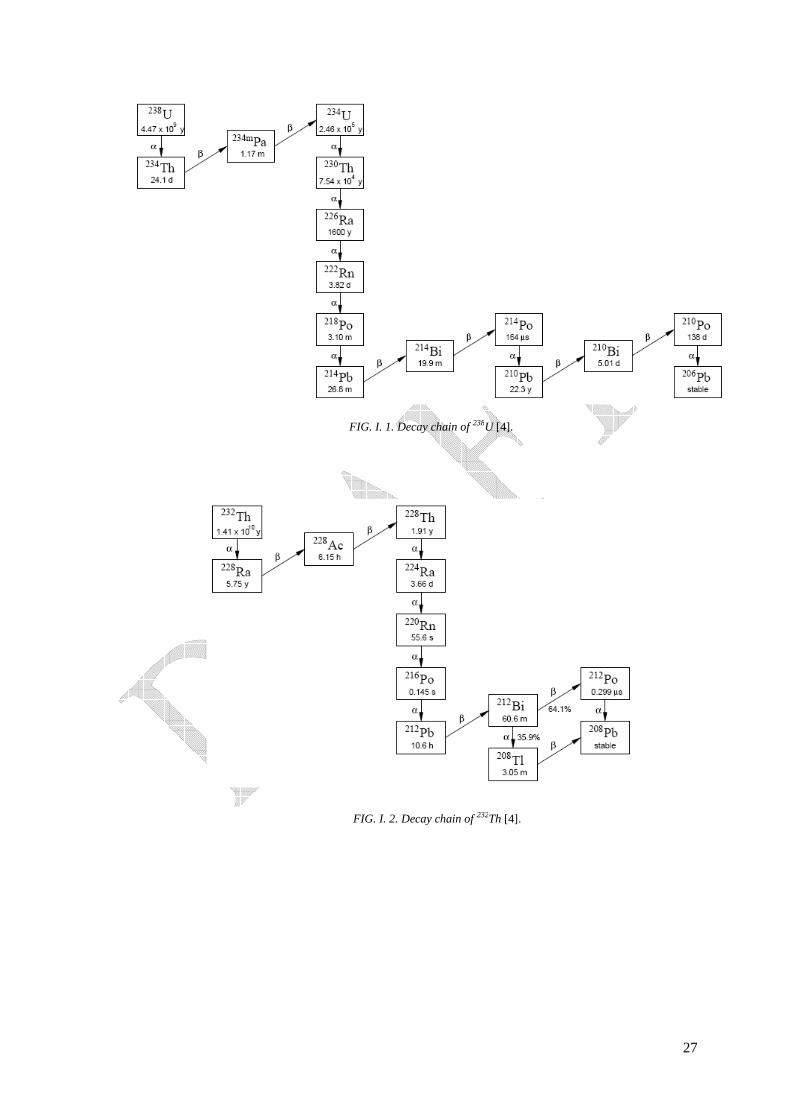
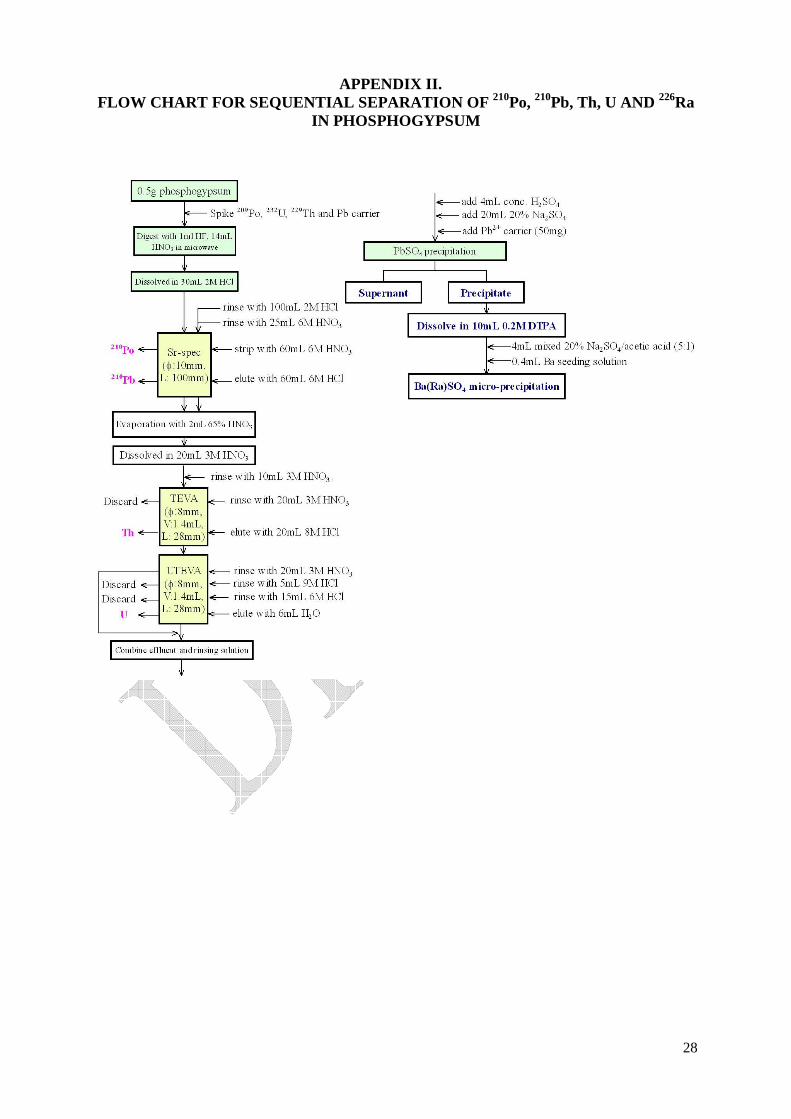
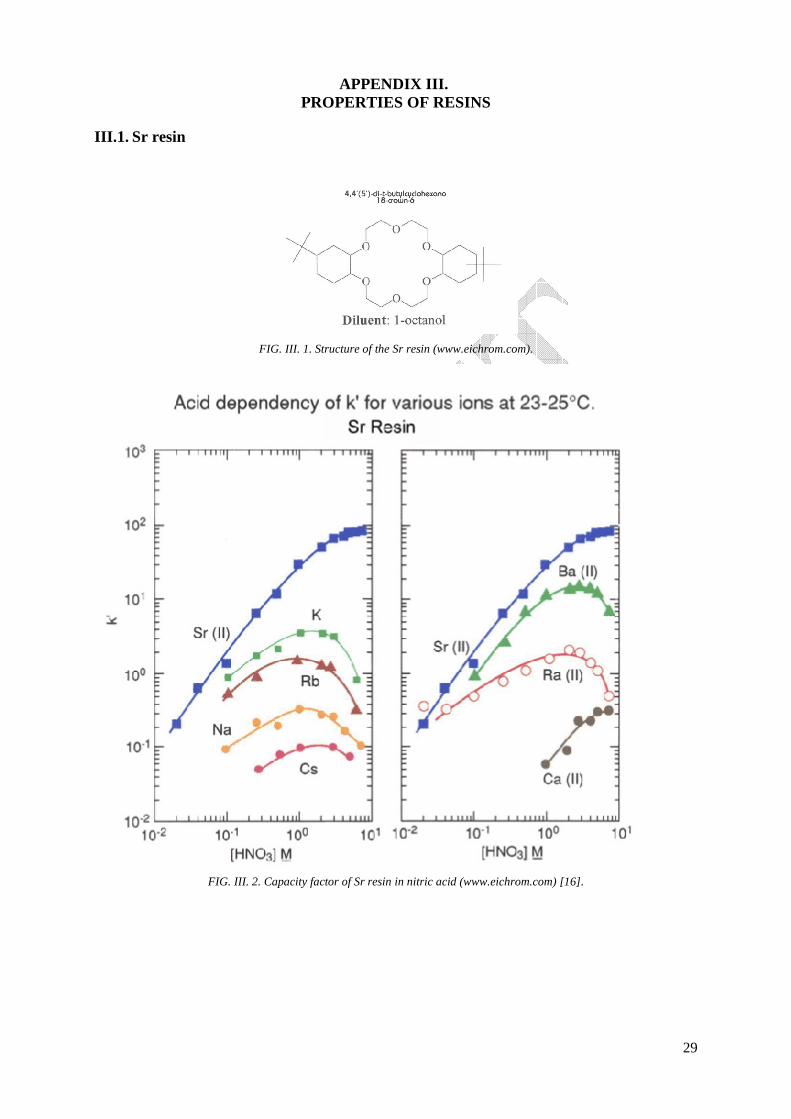
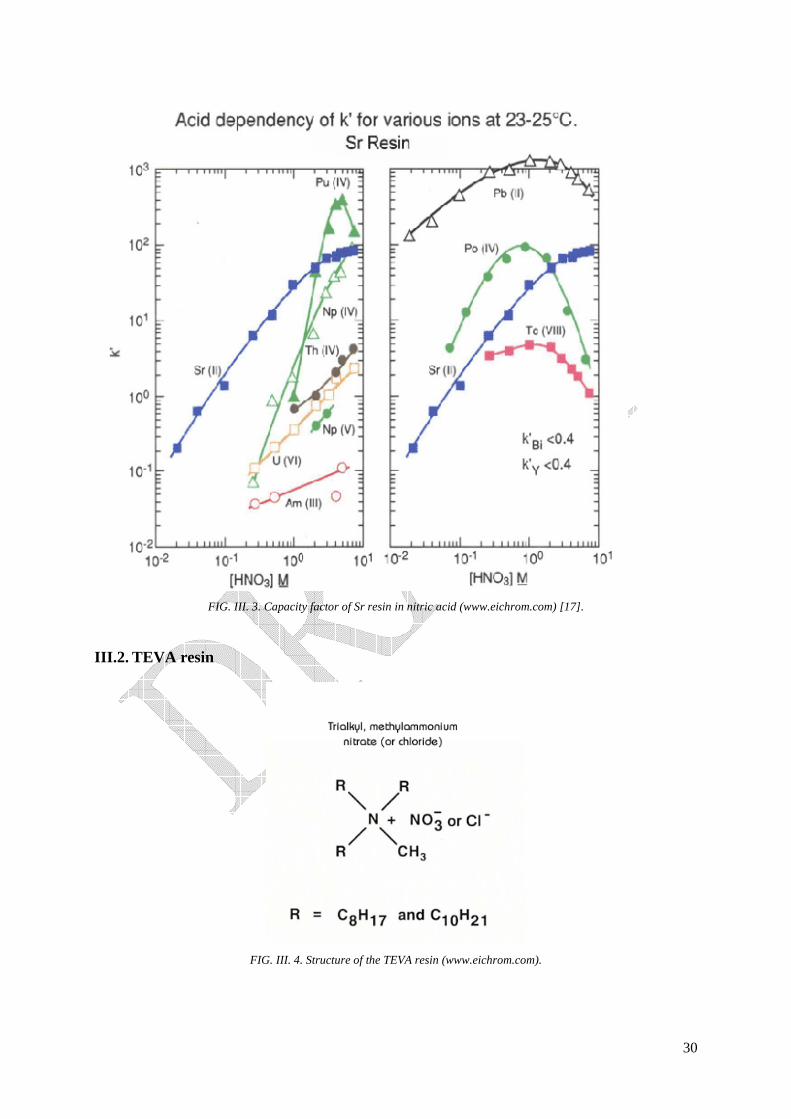
30
FIG III 3 Capacity factor of Sr resin in nitric acid (wwweichromcom) [17]
III2 TEVA resin
FIG III 4 Structure of the TEVA resin (wwweichromcom)
31
FIG III 5 Capacity factor of TEVA resin in nitric acid and hydrochloric acid (wwweichromcom) [18]
III3 UTEVA resin
FIG III 6 Structure of the UTEVA resin (wwweichromcom)
32
FIG III 7 Capacity factor of UTEVA resin in nitric acid and hydrochloric acid (wwweichromcom) [19]
33
APPENDIX IV ALPHA SPECTRA OF ANALYTES
FIG IV 1 Alpha spectrum of Po isotopes
FIG IV 2 Alpha spectrum of Th isotopes in phosphogypsum (with progeny)
228Th is resulted from 232U tracer spiked in the sample
34
FIG IV 3 Alpha spectrum of U isotopes
FIG IV 4 Alpha spectrum of 226Ra and its progeny (spiked with 225Ra)
35
FIG IV 5 Overlapping alpha spectra of U and Po isotopes
FIG IV 6 Overlapping alpha spectra of U and Th (with progeny) isotopes
36
APPENDIX V LIQUIDE SCINTILLATION SPECTRA
a)
b)
A window
(115-320 ch)
B window
(320 -410 ch)
210Po
210Pb
210Bi
210Bi
Co
unts
Ch
ann
elC
oun
tsC
han
nel
Channel number
a)
b)
A window
(115-320 ch)
B window
(320 -410 ch)
210Po
210Pb
210Bi
210Bi
Co
unts
Ch
ann
elC
oun
tsC
han
nel
Channel number
FIG V 1 Typical liquid scintillation spectra of beta-emitting 210Pb and 210Bi and alpha emitting 210Po (calibration sources) a) 210Pb 210Bi and 210Po spectra
b) pure 210Bi spectrum
37
APPENDIX VI CALCULATION OF THE COMBINED UNCERTAINTY
OF THE ACTIVITIES OF THE ANALYTES ON SAMPLING DATE
VI1 Uncertainty of the 210Pb result [20]
VI11 Uncertainty of counting efficiency of 210Pb
2
2
2
2
2210
2
210
2210
222
)()()()()()( )( PbTPbT
calcal
stdPbstdPb
Pbb mum
RuR
aua
utZuZ
u
minus+
minus+
minus++
= minusminus
minusεεελεεε (VI-1)
2
222
2 )()()()()( (Z) BABnBnBAAn furrufruu minus+minus+= (VI-2)
20
2 )()()( AAgAn rururu += (VI-3)
20
2 )()()( BBgBn rururu += (VI-4)
VI12 Uncertainty of the tailing factor fAB
The uncertainty of the tailing factor fAB is calculated according to following equations
2
210
210
2
210
210
)()()(
+
=
minus
minus
minus
minus
BicalnB
BicalnB
BicalAn
BicalAnBABA r
ru
r
ruffu (VI-5)
20
2210210 )()()( ABicalAgBicalAn rururu += minusminus (VI-6)
20
2210210 )()()( BBicalBgBicalBn rururu += minusminus (VI-7)
The uncertainty of counting efficiency for 210Pb can be calculated by Eq (VI-8)
2
2
2
2
2210
2
210
2210
222
)()()()()()( )( PbTPbT
calcal
stdPbstdPb
Pbb mum
RuR
aua
utZuZ
u
minus+
minus+
minus++
= minusminus
minusεεελεεε (VI-8)
2
222
2 )()()()()( (Z) BABnBnBAAn furrufruu minus+minus+= (VI-9)
20
2 )()()( AAgAn rururu += (VI-10)
20
2 )()()( BBgBn rururu += (VI-11)
38
VI13 Uncertainty of chemical recovery of Pb
Uncertainty of chemical recoveries of Pb in calibration source
minusminus+
minus+
= 2
2
2
2
2
2
cal )()(
)()(
)( )(R calfcalfcalof
calcalof
calfcalof
calg
g
cal mumm
Rmu
mm
Rfu
f
Ru
2
1
2
2
2
2
)()(
)()(
minus+
minus+
minus
minusminus
minusc
ccPb
cPbcalcPb
ccPb
ccal mumC
CRCu
mC
mR (VI-12)
The uncertainty of chemical recovery of Pb in the sample can be calculated
minusminus+
minus+
= 2
2
2
2
2
2
)()(
)()(
)( (R) ffof
offof
gg
mumm
Rmu
mm
Rfu
f
Ru
2
2
2
2
)()(
)()( c
ssPbccPb
cPbcPb
ssPbccPb
c mumCmC
CRCu
mCmC
mR
+minus+
+minus+
minusminus
minusminus
minusminus
2
1
2
2
2
2
)()(
)()(
+minus+
+minus+
minusminus
minusminus
minusminuss
ssPbccPb
sPbsPb
ssPbccPb
s mumCmC
CRCu
mCmC
mR (VI-13)
VI14 Uncertainty of mass ratio
The uncertainty of the mass ratio (fg) of atomic mass of Pb to molar mass of Pb-oxalate is calculated using the equations below
22
M Pb)(
+
=
minus
minus
oxalatePb
M
Pbgg M
u
M
uffu oxalatePb (VI-14)
The uncertainty of the molar mass of lead oxalate u(MPb-oxalate) can be derived by combining standard uncertainties in atomic masses of its constituents as shown in Table VI 1
39
TABLE VI 1 STANDARD UNCERTAINTIES OF ATOMIC WEIGHT AND THE GRAVIMETRIC FACTOR fg
Element Atomic weight
(gmol-1)
Quoted uncertainty (gmol-1)
Conversion factor
Standard uncertainty (gmol-1)
Mass ratio of atomic mass of Pb to
molar mass of Pb-oxalate
Uncertainty ofatomic mass
of Pb to molar mass of
Pb-oxalate
Pb 207215 2 0000 15 3 0000 087 0701 9 0000 002
C 12010 7 0000 8 3 0000 46
O 15999 4 0000 3 3 0000 17
VI15 Combined uncertainty of activity of 210Pb
The combined uncertainty of the 210Pb activity is calculated from Eq (VI-15)
minus+
minus+
minus+
= minusminusminusminus 2
2
2102
2
2102
2
210
2
2
2101 )()()()()( s
d
sPb
BA
sPb
nBnB
sPb
BAnA
sPb
Pbc mum
afu
Z
arru
Z
afru
Z
aau
2
1
23
2
3
21022
2
2
2102
2
2102
2
210 )()()()(
+
+
minus+
minus+ minus
minus
minusminus
minus
minusminusminusPb
Pb
sPbPb
Pb
sPbsPbsPb fuf
afu
f
aRu
R
au
aε
ε (VI-15)
)()( 210222 minusminusminus = PbPbPb utffu λ (VI-16)
210
210321033
)(
11)(
3210
3210
minus
minusminus
minus
minusminusminus
minusminus=
minus
minus
Pb
Pbt
t
PbPbPb
u
e
etffu
Pb
Pb
λλλ λ
λ
(VI-17)
However if the time interval (t2) between the separation of 210Pb and the beginning of the measurement and the counting time of the sample (t3) are much smaller than the half life of 210Pb f2-Pb f3-Pb u(f2-Pb) and u(f3-Pb) are negligible The uncertainties associated to components mentioned above can be calculated as follows
0
0
3
)(t
r
t
rru
Po
gn +=
minus
(VI-18)
0
0
3
)(t
r
t
rru t
Po
tgtn +=
minus
(VI-19)
minus+
+
= minusminusminus
minus2
2
2102
2
2102
2
210210 )()()( )( tn
tn
sPo
nn
sPo
TT
sPo
sPo rur
aru
r
aAu
A
aau
2
2
21022
2
2
2102
2
2102
2
210)()()()( T
T
sPo
PoPo
sPo
TT
sPo
ss
sPofu
f
afu
f
amu
m
amu
m
a
+
+
+
minus+ minus
minusminus
minusminusminus
40
2
1
3
2
3
210 )(
+ minus
minus
minusPo
Po
sPo fuf
a (VI-20)
)()( TTTt utffu λ= (VI-21)
)()( 210222 minusminusminusminus = PoPoPoPo utffu λ (VI-22)
210
210321033
)(
11)(
3210
3210
minus
minusminus
minus
minusminusminus
minusminus=
minus
minus
Po
Pot
t
PoPoPo
u
e
etffu
Po
Po
λλλ λ
λ (VI-23)
VI16 Combined uncertainty of activity of 210Po
The uncertainty of the activity of 210Po on the separation date is calculated according to IAEAAQ12 procedure [8]
VI2 Uncertainty of other alpha emitting isotopes
The same formulas are used to calculate the combined uncertainties as equations that are used for calculation of the activity of alpha emitting analytes at the separation time and the sampling date as well as the chemical recovery and counting efficiency These formulas have to be applied in the spreadsheet approach for calculating the combined uncertainties knowing the standard uncertainty of each component VI3 Spreadsheet approach
For the quantifying the uncertainties the spreadsheet technique [21] was used which could be summarised as follows and showed in the Fig VI 1
bull Calculate function y using parameter xj
y=f(x1x2xj xn) (VI-24)
bull recalculate the same function n times increasing xj to xj+dxj (dxj standard deviation) and keeping the remaining parameters constant
y=f(x1x2xj+dxj xn) (VI-25)
bull the uncertainty on the function dy is the square root of the sum of squares
( )sum minus=n
jyydy1
2 (VI-26)
bull The individual variance contribution fj is
( )( )sum minus
minus=
n
j
jj
yy
yyf
1
2
2
(VI-27)
41
FIG VI 1 Spreadsheet approach for quantifying the uncertainty of the measurement
The results are summarised for the individual isotopes in the Tables VI 2ndashVI 9 and the results of the individual analysis with their uncertainties are shown in the Figs VI 3ndashVI 9 The detailed study about the usual contributors of uncertainty in the nuclear analytical techniques could be found in the IAEA-TECDOC-1401 [11] TABLE VI 2 AN EXAMPLE OF QUANTIFYING UNCERTAINTIES OF 210Po RESULT
Symbol unit Value of variable
Uncertainty Conversion factor to standard uncertainty
Standard uncertainty
Contribution to combined
uncertainty ()
m g 0508 9 0007 3 3 0004 2 010
rgt s-1 0197 0075 1 0075 361
r0t s-1 0000 017 0000 034 1 0000 034 0000 014
rg s-1 0081 0029 1 0029 6352
r0 s-1 0000 034 0000 033 1 0000 033 0000 08
at Bq 0829 0019 1 0019 0252
λt d-1 0000 019 0000 013 1 0000 013 negligible
λPo d-1 0005 72 x 10-9 1 72x10-9 negligible
ft 0982 14 0000 43 1 0000 43 0000 091
f2-Po 1005 73 x 10-9 1 73x10-9 negligible
f3-Po 1005 5 18 x 10-8 1 18 x10-8 negligible
aPo1 Bqmiddotkg-1 672 94
contribution is less than 1 x 10⁻⁵
TABLE VI 3 AN EXAMPLE OF QUANTIFYING UNCERTAINTIES OF EFFICIENCY OF 210Pb
Symbol unit Value of variable
Uncertainty
Conversion factor to standard
uncertainty
Standard uncertainty
Contribution to combined
uncertainty ()
mvial g 14936 35 0000 1 3 0000 17 0004 8
42
Symbol unit Value of variable
Uncertainty
Conversion factor to standard
uncertainty
Standard uncertainty
Contribution to combined
uncertainty ()
mvial+carrsol g 16036 54 0000 1 3 0000 17 0004 8
cPb g g-1 0027 42 0000 021 1 0000 021 011
mvial g 16036 72 0000 10 3 0000 17 0004 8
mvial+std g 17132 6 0000 10 3 0000 17 0004 8
astd Bq 1245 0189 1 0189 805
fgravimetry 0701 85 0000 41 1 0000 41 0066
mfilter g 0036 54 0000 10 3 0000 17 42
mfilter+Pb-precipitate g 0073 77 0000 10 3 0000 17 41
rA s-1 7362 0041 1 0041 76
rA0 s-1 0029 5 0003 1 0002 7 0035
rB s-1 0416 0 0011 1 0011 060
rB0 s-1 0011 7 0002 1 0002 2 0024
fAB 1049 0023 1 0023 040
t12 Pb d 814508 7305 1 731 23
tmeas-ref d 4 532 -
ε 0859 7 0015 3
43
TABLE VI 4 AN EXAMPLE OF QUANTIFYING UNCERTAINTIES OF 210Pb RESULT
Symbol unit Value of variable
Uncertainty Conversion factor to standard uncertainty
Standard uncertainty
Contribution to combined
uncertainty ()
ms g 0508 9 0007 3 3 0004 2 03
rgA s-1 0283 0035 1 0035 883
r0A s-1 0011 7 0002 2 1 0002 2 03
rgB s-1 0031 0009 1 0009 58
r0B s-1 0005 6 0002 3 1 0002 3 04
Ζ s-1 0245 1 0032 7 1 0032 7 -
fAB 1015 3 0012 9 1 0012 9 001
ε 0859 7 0015 3 1 0015 3 13
R 0858 8 0025 3 1 0077 2 35
aPb1 Bqmiddotkg-1 652 12
TABLE VI 5 AN EXAMPLE OF QUANTIFYING UNCERTAINTIES OF 234U RESULT
Symbol unit Value of variable
Uncertainty Conversion factor to standard uncertainty
Standard uncertainty
Contribution to combined
uncertainty ()
ms g 0508 9 0007 3 3 0004 2 003
rgt s-1 0021 78 0008 01 1 0008 369
r0t s-1 0000 030 0000 022 1 0000 022 0000 5
rg s-1 0016 15 0005 90 1 0006 628
r0 s-1 0000 016 0000 022 1 0000 022 0000 1
at Bq 0088 35 0002 10 1 0002 01 029
aU-234_1 Bqmiddotkg-1 129 3
TABLE VI 6 AN EXAMPLE OF QUANTIFYING UNCERTAINTIES OF 238U RESULT
Symbol unit Value of variable
Uncertainty Conversion factor to standard uncertainty
Standard uncertainty
Contribution to combined
uncertainty ()
ms g 0508 9 0007 3 3 0004 2 003
rgt s-1 0021 78 0008 01 1 0008 353
r0t s-1 0000 030 0000 022 1 0000 022 0000 5
rg s-1 0015 61 0005 67 1 0006 644
r0 s-1 0000 009 0000 008 1 0000 008 0000 1
at Bq 0088 35 0002 10 1 0002 1 028
aU-238_1 Bqmiddotkg-1 124 3
44
TABLE VI 7 AN EXAMPLE OF QUANTIFYING UNCERTAINTIES OF 230Th RESULT
Symbol unit Value of variable
Uncertainty Conversion factor to standard uncertainty
Standard uncertainty
Contribution to combined
uncertainty ()
ms g 0508 9 0007 3 3 0004 2 005
rgt s-1 0022 63 0006 44 1 0006 387
r0t s-1 0000 077 0000 063 1 0000 063 0006 1
rg s-1 0028 38 0007 90 1 0008 608
r0 s-1 0000 012 0000 010 1 0000 010 0000 1
at Bq 0090 03 0002 30 1 0002 303 051
aTh-230_1 Bqmiddotkg-1 223 9
TABLE VI 8 AN EXAMPLE OF QUANTIFYING UNCERTAINTIES OF 232Th RESULT
Symbol unit Value of variable
Uncertainty Conversion factor to standard uncertainty
Standard uncertainty
Contribution to combined
uncertainty ()
ms g 0508 9 0007 3 3 0004 2 004
rgt s-1 0022 63 0006 44 1 0006 265
r0t s-1 0000 077 0000 063 1 0000 063 0004 2
rg s-1 0000 28 0000 10 1 0000 1 727
r0 s-1 0000 011 0000 008 1 0000 008 048
at Bq 0090 03 0002 30 1 0002 3 035
aTh-232_1 Bqmiddotkg-1 21 009
TABLE VI 9 AN EXAMPLE OF QUANTIFYING UNCERTAINTIES OF 226Ra RESULT
Symbol unit Value of variable
Uncertainty Conversion factor
to standard uncertainty
Standard uncertainty
Contribution to combined
uncertainty ()
ms g 0508 9 0007 3 3 0004 2 003
rgt s-1 0043 10 0025 05 1 0025 05 603
r0t s-1 0000 111 0000 128 1 0000 128 0004
rg s-1 0063 32 0018 78 1 0018 78 393
r0 s-1 0000 070 015 0000 070 013 1 0000 070 013 0000 5
at Ra-225 Bq 0779 50 0022 53 1 0022 53 04
λAc225 d-1 0069 315 0000 624 1 0000 624 0000 02
λRa225 d-1 0046 520 0000 693 1 0000 693 008
t1-t0 d 337
aRa-226_1 Bqmiddotkg-1 766 39
45
APPENDIX VII DETECTION THRESHOLD AND LIMIT OF THE APPLIED PROCEDURE
TABLE VII 1 TYPICAL DECISION THRESHOLD AND DETECTION LIMIT FOR RELEVANT ISOTOPES
Symbol unit 210Pb 210Po 234U 238U 230 Th 232 Th 226Ra
k 165 165 165 165 165 165 165
m kg 0000 5 0000 5 0000 5 0000 5 0000 5 0000 5 0000 5
ε 086 031 026 026 035 035 025
R 086 073 094 094 068 068 061
n0 52 16 4 4 6 6 28
Tg s 36 000 98 899 343 024 343 024 277 345 277 345 124 984
t0 s 35 542 548 190 512 901 512 901 559 286 559 286 446 755
a Bqmiddotkg-1 13 036 009 009 012 012 068
a1 Bqmiddotkg-1 38 11 028 028 036 036 205
u2(0) Bq2middotkg-2 29 015 0008 4 0008 4 0006 5 0004 7 078
u2(a1) Bq2middotkg-2 23 041 0059 0025 0028 0052 204
a Bqmiddotkg-1 24 12 052 019 018 019 43
46
APPENDIX VIII VALIDATION TEST RESULTS OF THE PROCEDURE
TABLE VIII 1 VALIDATION RESULTS FOR RELEVANT RADIONUCLIDES
Parameters 210Po 210Pb 234U 238U 230Th 226Ra
C Bq kg-1 680 680 120 120 211 780
X Bq kg-1 653 659 127 123 221 793
u(C) Bq kg-1 58 58 9 11 9 62
u(X ) Bq kg-1 23 22 5 5 10 35
δ() -40 -31 58 25 47 17
rL Bq kg-1 106 102 48 47 62 498
RL Bq kg-1 237 454 59 53 89 707
PI() 92 92 85 100 62 91
TABLE VIII 2 ANALYSIS OF VARIANCE (ANOVA) FOR 210Po 210Pb 238U 230Th AND 226Ra IN PHOSPHOGYPSUM
Nuclide SSwb SSbb MSwb MSbb Swb
(as CV)
Sbb
(as CV)
210Po 124 62 151 79 312 1687 271 254
210Pb 8385 197 54 210 2195 220 302
238U 314 386 785 429 227 215
230Th 2176 1598 544 178 334 225
226Ra 412 686 137 858 121 054
SSwb sum of squares within bottles
SSbb sum of squares between bottles
MSwb mean of squares within bottles
MSbb mean of squares between bottles
Swb standard deviation as percent of covalent variance within bottles
Sbb standard deviation as percent of covalent variance between bottles
47
550
600
650
700
750
0 10 20 30 40 50
Samples
Act
ivity
of
21
0 Pb
in th
e sa
mp
le (
Bq
kg
dry
)
Mean1σ
-2σ
-1σ
3σ
2σ
-3σ
FIG VIII 1 210Pb results with associated uncertainties
550
600
650
700
750
0 10 20 30 40 50Samples
Act
ivity
of
21
0 Po
in t
he s
ampl
e (B
qkg
dry
)
Mean
1σ
-1σ
3σ
2σ
-3σ-2σ
FIG VIII 2 210Po results with associated uncertainties
48
110
115
120
125
130
135
140
0 10 20 30 40 50
Samples
Act
ivity
of
238
U in
the
sam
ple
(B
qkg
dry
)
Mean
1σ
-1σ
3σ
2σ
-3σ
-2σ
FIG VIII 3 238U results with associated uncertainties
105
110
115
120
125
130
135
140
145
150
0 10 20 30 40 50
Samples
Act
ivity
of
23
4 U in
the
sa
mpl
e (B
qkg
dry
)
Mean1σ
-2σ-1σ
3σ2σ
-3σ
FIG VIII 4 234U results with associated uncertainties
49
190
200
210
220
230
240
250
0 5 10 15 20 25 30 35 40 45 50
Samples
Act
ivity
of
23
0 Th
in th
e s
am
ple
(B
qk
g d
ry)
2σ
3σ
1σ
-1σ
-2σ
-3σ
Mean
FIG VIII 5 230 Th results with associated uncertainties
05
10
15
20
25
30
35
40
0 10 20 30 40 50
Samples
Act
ivity
of
23
2 Th
in th
e sa
mp
le (
Bq
kg
dry
)
Mean
1σ
-2σ
-1σ
3σ
2σ
-3σ
FIG VIII 6 232 Th results with associated uncertainties
50
650
700
750
800
850
900
1 2 3 4 5 6 7 8 9 10 11 12 13 14 15 16 17 18 19 20
Sample
Act
ivity
of
226 R
a in
th
e sa
mp
le (
Bq
kg
dry
)
Mean
1σ
-1σ
3σ
2σ
-3σ
-2σ
FIG VIII 7 226Ra results with associated uncertainties
51
CONTRIBUTORS TO DRAFTING AND REVIEW
Hampe D Gaigl FA
Verein fuumlr Kernverfahrenstechnik und Analytik Rossendorf eV Dresden Germany IAEA Environment Laboratories Terrestrial Environment Laboratory Seibersdorf Austria
Kim C-K IAEA Environment Laboratories Terrestrial Environment Laboratory Seibersdorf Austria
Kis-Benedek Gy IAEA Environment Laboratories Terrestrial Environment Laboratory Seibersdorf Austria
Martin P IAEA Environment Laboratories Terrestrial Environment Laboratory Seibersdorf Austria
Mietelski J W The Henryk Niewodniczanski Institute of Nuclear Physics Polish Academy of Sciences Poland
Sansone U IAEA Environment Laboratories Terrestrial Environment Laboratory Seibersdorf Austria
Varga B Central Agricultural Office Food and Feed Safety Directorate Hungary
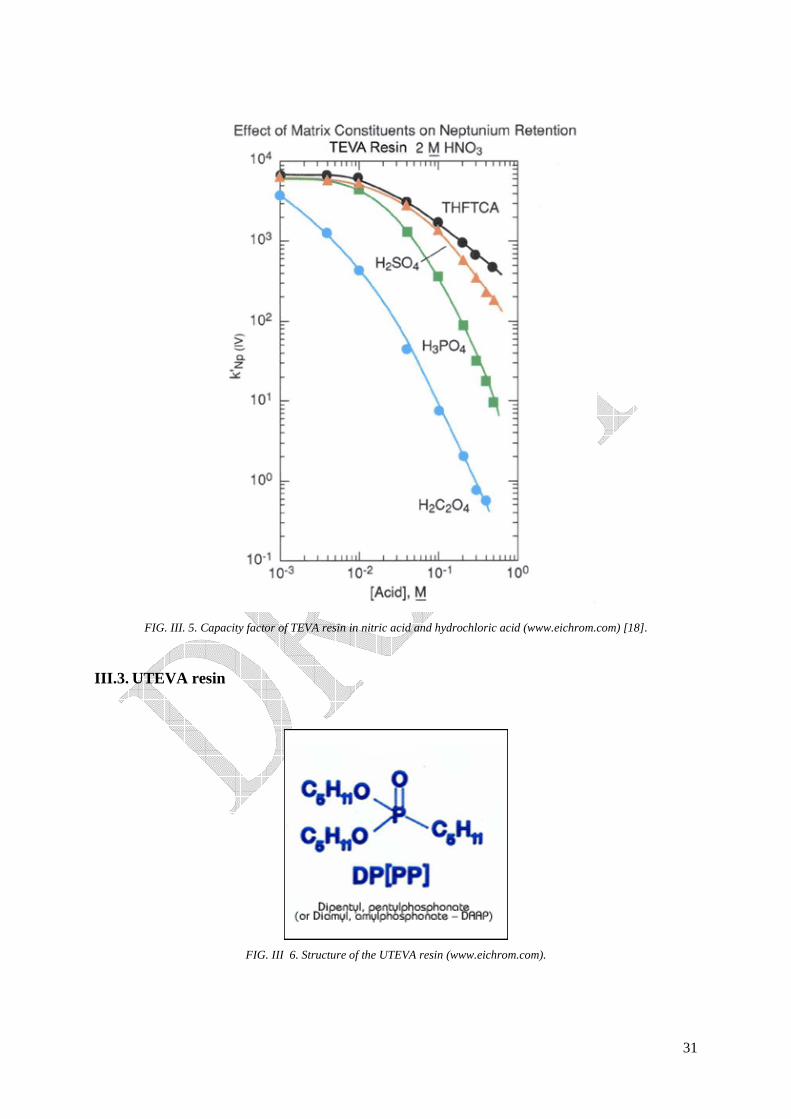
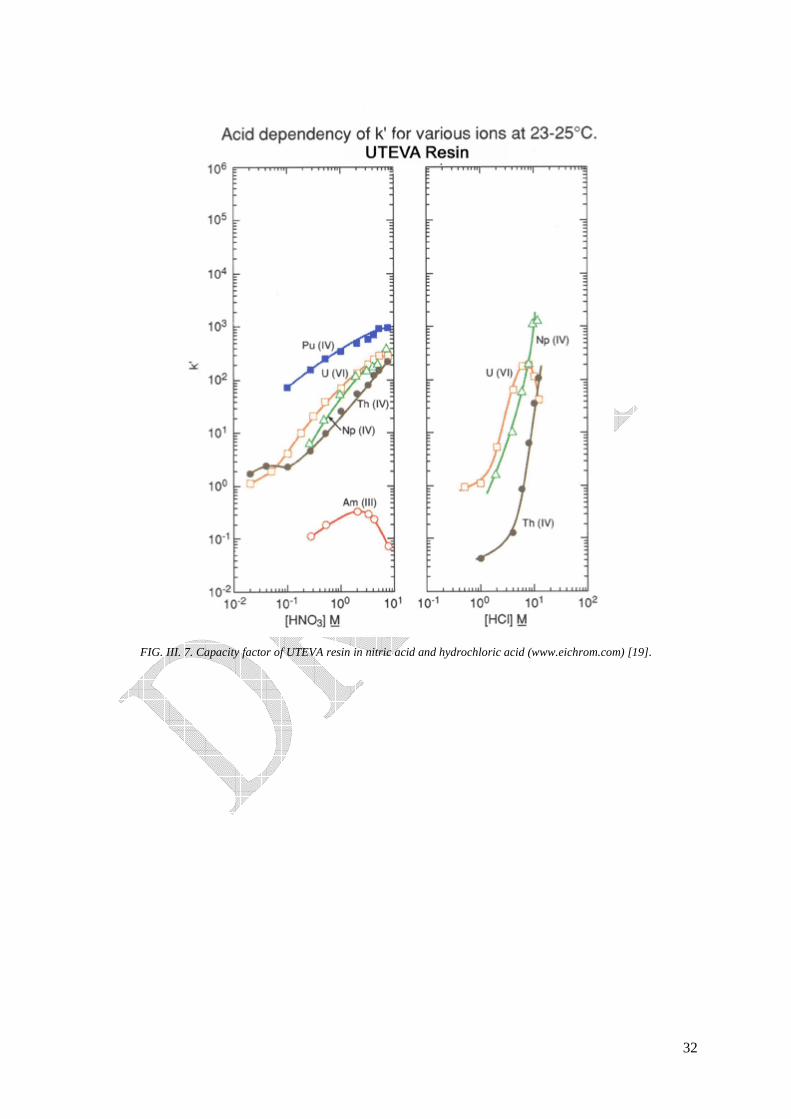
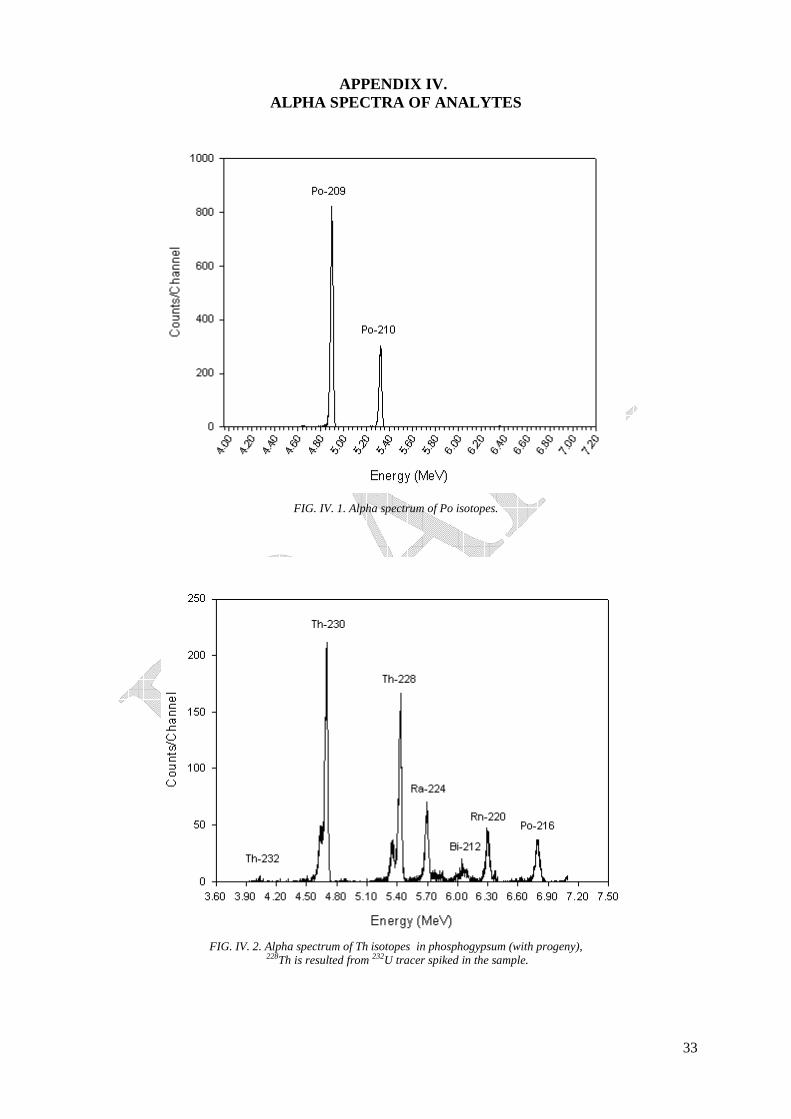
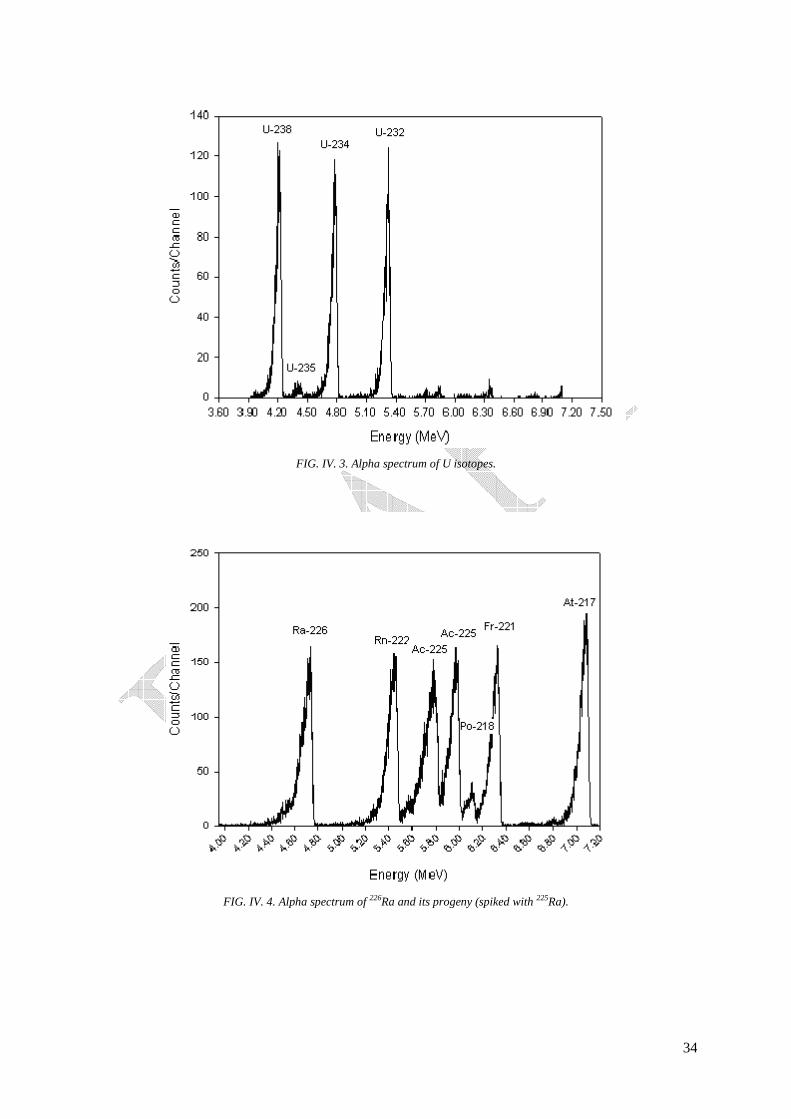
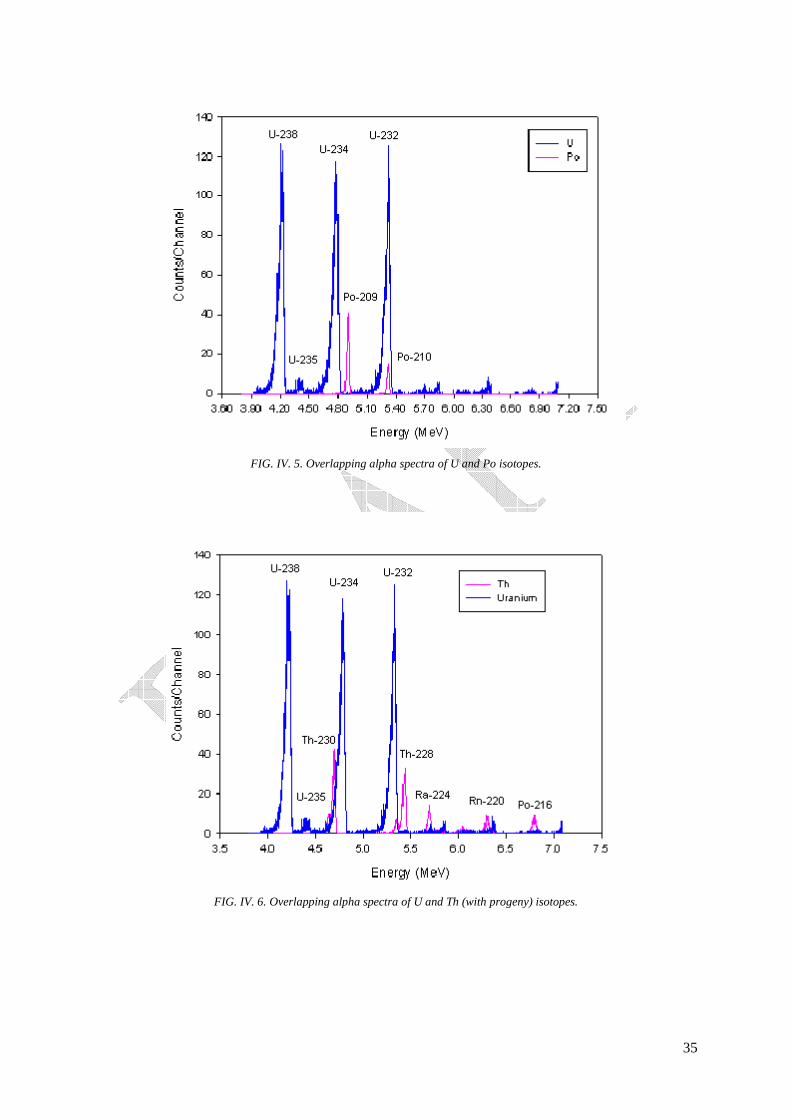
35
FIG IV 5 Overlapping alpha spectra of U and Po isotopes
FIG IV 6 Overlapping alpha spectra of U and Th (with progeny) isotopes
36
APPENDIX V LIQUIDE SCINTILLATION SPECTRA
a)
b)
A window
(115-320 ch)
B window
(320 -410 ch)
210Po
210Pb
210Bi
210Bi
Co
unts
Ch
ann
elC
oun
tsC
han
nel
Channel number
a)
b)
A window
(115-320 ch)
B window
(320 -410 ch)
210Po
210Pb
210Bi
210Bi
Co
unts
Ch
ann
elC
oun
tsC
han
nel
Channel number
FIG V 1 Typical liquid scintillation spectra of beta-emitting 210Pb and 210Bi and alpha emitting 210Po (calibration sources) a) 210Pb 210Bi and 210Po spectra
b) pure 210Bi spectrum
37
APPENDIX VI CALCULATION OF THE COMBINED UNCERTAINTY
OF THE ACTIVITIES OF THE ANALYTES ON SAMPLING DATE
VI1 Uncertainty of the 210Pb result [20]
VI11 Uncertainty of counting efficiency of 210Pb
2
2
2
2
2210
2
210
2210
222
)()()()()()( )( PbTPbT
calcal
stdPbstdPb
Pbb mum
RuR
aua
utZuZ
u
minus+
minus+
minus++
= minusminus
minusεεελεεε (VI-1)
2
222
2 )()()()()( (Z) BABnBnBAAn furrufruu minus+minus+= (VI-2)
20
2 )()()( AAgAn rururu += (VI-3)
20
2 )()()( BBgBn rururu += (VI-4)
VI12 Uncertainty of the tailing factor fAB
The uncertainty of the tailing factor fAB is calculated according to following equations
2
210
210
2
210
210
)()()(
+
=
minus
minus
minus
minus
BicalnB
BicalnB
BicalAn
BicalAnBABA r
ru
r
ruffu (VI-5)
20
2210210 )()()( ABicalAgBicalAn rururu += minusminus (VI-6)
20
2210210 )()()( BBicalBgBicalBn rururu += minusminus (VI-7)
The uncertainty of counting efficiency for 210Pb can be calculated by Eq (VI-8)
2
2
2
2
2210
2
210
2210
222
)()()()()()( )( PbTPbT
calcal
stdPbstdPb
Pbb mum
RuR
aua
utZuZ
u
minus+
minus+
minus++
= minusminus
minusεεελεεε (VI-8)
2
222
2 )()()()()( (Z) BABnBnBAAn furrufruu minus+minus+= (VI-9)
20
2 )()()( AAgAn rururu += (VI-10)
20
2 )()()( BBgBn rururu += (VI-11)
38
VI13 Uncertainty of chemical recovery of Pb
Uncertainty of chemical recoveries of Pb in calibration source
minusminus+
minus+
= 2
2
2
2
2
2
cal )()(
)()(
)( )(R calfcalfcalof
calcalof
calfcalof
calg
g
cal mumm
Rmu
mm
Rfu
f
Ru
2
1
2
2
2
2
)()(
)()(
minus+
minus+
minus
minusminus
minusc
ccPb
cPbcalcPb
ccPb
ccal mumC
CRCu
mC
mR (VI-12)
The uncertainty of chemical recovery of Pb in the sample can be calculated
minusminus+
minus+
= 2
2
2
2
2
2
)()(
)()(
)( (R) ffof
offof
gg
mumm
Rmu
mm
Rfu
f
Ru
2
2
2
2
)()(
)()( c
ssPbccPb
cPbcPb
ssPbccPb
c mumCmC
CRCu
mCmC
mR
+minus+
+minus+
minusminus
minusminus
minusminus
2
1
2
2
2
2
)()(
)()(
+minus+
+minus+
minusminus
minusminus
minusminuss
ssPbccPb
sPbsPb
ssPbccPb
s mumCmC
CRCu
mCmC
mR (VI-13)
VI14 Uncertainty of mass ratio
The uncertainty of the mass ratio (fg) of atomic mass of Pb to molar mass of Pb-oxalate is calculated using the equations below
22
M Pb)(
+
=
minus
minus
oxalatePb
M
Pbgg M
u
M
uffu oxalatePb (VI-14)
The uncertainty of the molar mass of lead oxalate u(MPb-oxalate) can be derived by combining standard uncertainties in atomic masses of its constituents as shown in Table VI 1
39
TABLE VI 1 STANDARD UNCERTAINTIES OF ATOMIC WEIGHT AND THE GRAVIMETRIC FACTOR fg
Element Atomic weight
(gmol-1)
Quoted uncertainty (gmol-1)
Conversion factor
Standard uncertainty (gmol-1)
Mass ratio of atomic mass of Pb to
molar mass of Pb-oxalate
Uncertainty ofatomic mass
of Pb to molar mass of
Pb-oxalate
Pb 207215 2 0000 15 3 0000 087 0701 9 0000 002
C 12010 7 0000 8 3 0000 46
O 15999 4 0000 3 3 0000 17
VI15 Combined uncertainty of activity of 210Pb
The combined uncertainty of the 210Pb activity is calculated from Eq (VI-15)
minus+
minus+
minus+
= minusminusminusminus 2
2
2102
2
2102
2
210
2
2
2101 )()()()()( s
d
sPb
BA
sPb
nBnB
sPb
BAnA
sPb
Pbc mum
afu
Z
arru
Z
afru
Z
aau
2
1
23
2
3
21022
2
2
2102
2
2102
2
210 )()()()(
+
+
minus+
minus+ minus
minus
minusminus
minus
minusminusminusPb
Pb
sPbPb
Pb
sPbsPbsPb fuf
afu
f
aRu
R
au
aε
ε (VI-15)
)()( 210222 minusminusminus = PbPbPb utffu λ (VI-16)
210
210321033
)(
11)(
3210
3210
minus
minusminus
minus
minusminusminus
minusminus=
minus
minus
Pb
Pbt
t
PbPbPb
u
e
etffu
Pb
Pb
λλλ λ
λ
(VI-17)
However if the time interval (t2) between the separation of 210Pb and the beginning of the measurement and the counting time of the sample (t3) are much smaller than the half life of 210Pb f2-Pb f3-Pb u(f2-Pb) and u(f3-Pb) are negligible The uncertainties associated to components mentioned above can be calculated as follows
0
0
3
)(t
r
t
rru
Po
gn +=
minus
(VI-18)
0
0
3
)(t
r
t
rru t
Po
tgtn +=
minus
(VI-19)
minus+
+
= minusminusminus
minus2
2
2102
2
2102
2
210210 )()()( )( tn
tn
sPo
nn
sPo
TT
sPo
sPo rur
aru
r
aAu
A
aau
2
2
21022
2
2
2102
2
2102
2
210)()()()( T
T
sPo
PoPo
sPo
TT
sPo
ss
sPofu
f
afu
f
amu
m
amu
m
a
+
+
+
minus+ minus
minusminus
minusminusminus
40
2
1
3
2
3
210 )(
+ minus
minus
minusPo
Po
sPo fuf
a (VI-20)
)()( TTTt utffu λ= (VI-21)
)()( 210222 minusminusminusminus = PoPoPoPo utffu λ (VI-22)
210
210321033
)(
11)(
3210
3210
minus
minusminus
minus
minusminusminus
minusminus=
minus
minus
Po
Pot
t
PoPoPo
u
e
etffu
Po
Po
λλλ λ
λ (VI-23)
VI16 Combined uncertainty of activity of 210Po
The uncertainty of the activity of 210Po on the separation date is calculated according to IAEAAQ12 procedure [8]
VI2 Uncertainty of other alpha emitting isotopes
The same formulas are used to calculate the combined uncertainties as equations that are used for calculation of the activity of alpha emitting analytes at the separation time and the sampling date as well as the chemical recovery and counting efficiency These formulas have to be applied in the spreadsheet approach for calculating the combined uncertainties knowing the standard uncertainty of each component VI3 Spreadsheet approach
For the quantifying the uncertainties the spreadsheet technique [21] was used which could be summarised as follows and showed in the Fig VI 1
bull Calculate function y using parameter xj
y=f(x1x2xj xn) (VI-24)
bull recalculate the same function n times increasing xj to xj+dxj (dxj standard deviation) and keeping the remaining parameters constant
y=f(x1x2xj+dxj xn) (VI-25)
bull the uncertainty on the function dy is the square root of the sum of squares
( )sum minus=n
jyydy1
2 (VI-26)
bull The individual variance contribution fj is
( )( )sum minus
minus=
n
j
jj
yy
yyf
1
2
2
(VI-27)
41
FIG VI 1 Spreadsheet approach for quantifying the uncertainty of the measurement
The results are summarised for the individual isotopes in the Tables VI 2ndashVI 9 and the results of the individual analysis with their uncertainties are shown in the Figs VI 3ndashVI 9 The detailed study about the usual contributors of uncertainty in the nuclear analytical techniques could be found in the IAEA-TECDOC-1401 [11] TABLE VI 2 AN EXAMPLE OF QUANTIFYING UNCERTAINTIES OF 210Po RESULT
Symbol unit Value of variable
Uncertainty Conversion factor to standard uncertainty
Standard uncertainty
Contribution to combined
uncertainty ()
m g 0508 9 0007 3 3 0004 2 010
rgt s-1 0197 0075 1 0075 361
r0t s-1 0000 017 0000 034 1 0000 034 0000 014
rg s-1 0081 0029 1 0029 6352
r0 s-1 0000 034 0000 033 1 0000 033 0000 08
at Bq 0829 0019 1 0019 0252
λt d-1 0000 019 0000 013 1 0000 013 negligible
λPo d-1 0005 72 x 10-9 1 72x10-9 negligible
ft 0982 14 0000 43 1 0000 43 0000 091
f2-Po 1005 73 x 10-9 1 73x10-9 negligible
f3-Po 1005 5 18 x 10-8 1 18 x10-8 negligible
aPo1 Bqmiddotkg-1 672 94
contribution is less than 1 x 10⁻⁵
TABLE VI 3 AN EXAMPLE OF QUANTIFYING UNCERTAINTIES OF EFFICIENCY OF 210Pb
Symbol unit Value of variable
Uncertainty
Conversion factor to standard
uncertainty
Standard uncertainty
Contribution to combined
uncertainty ()
mvial g 14936 35 0000 1 3 0000 17 0004 8
42
Symbol unit Value of variable
Uncertainty
Conversion factor to standard
uncertainty
Standard uncertainty
Contribution to combined
uncertainty ()
mvial+carrsol g 16036 54 0000 1 3 0000 17 0004 8
cPb g g-1 0027 42 0000 021 1 0000 021 011
mvial g 16036 72 0000 10 3 0000 17 0004 8
mvial+std g 17132 6 0000 10 3 0000 17 0004 8
astd Bq 1245 0189 1 0189 805
fgravimetry 0701 85 0000 41 1 0000 41 0066
mfilter g 0036 54 0000 10 3 0000 17 42
mfilter+Pb-precipitate g 0073 77 0000 10 3 0000 17 41
rA s-1 7362 0041 1 0041 76
rA0 s-1 0029 5 0003 1 0002 7 0035
rB s-1 0416 0 0011 1 0011 060
rB0 s-1 0011 7 0002 1 0002 2 0024
fAB 1049 0023 1 0023 040
t12 Pb d 814508 7305 1 731 23
tmeas-ref d 4 532 -
ε 0859 7 0015 3
43
TABLE VI 4 AN EXAMPLE OF QUANTIFYING UNCERTAINTIES OF 210Pb RESULT
Symbol unit Value of variable
Uncertainty Conversion factor to standard uncertainty
Standard uncertainty
Contribution to combined
uncertainty ()
ms g 0508 9 0007 3 3 0004 2 03
rgA s-1 0283 0035 1 0035 883
r0A s-1 0011 7 0002 2 1 0002 2 03
rgB s-1 0031 0009 1 0009 58
r0B s-1 0005 6 0002 3 1 0002 3 04
Ζ s-1 0245 1 0032 7 1 0032 7 -
fAB 1015 3 0012 9 1 0012 9 001
ε 0859 7 0015 3 1 0015 3 13
R 0858 8 0025 3 1 0077 2 35
aPb1 Bqmiddotkg-1 652 12
TABLE VI 5 AN EXAMPLE OF QUANTIFYING UNCERTAINTIES OF 234U RESULT
Symbol unit Value of variable
Uncertainty Conversion factor to standard uncertainty
Standard uncertainty
Contribution to combined
uncertainty ()
ms g 0508 9 0007 3 3 0004 2 003
rgt s-1 0021 78 0008 01 1 0008 369
r0t s-1 0000 030 0000 022 1 0000 022 0000 5
rg s-1 0016 15 0005 90 1 0006 628
r0 s-1 0000 016 0000 022 1 0000 022 0000 1
at Bq 0088 35 0002 10 1 0002 01 029
aU-234_1 Bqmiddotkg-1 129 3
TABLE VI 6 AN EXAMPLE OF QUANTIFYING UNCERTAINTIES OF 238U RESULT
Symbol unit Value of variable
Uncertainty Conversion factor to standard uncertainty
Standard uncertainty
Contribution to combined
uncertainty ()
ms g 0508 9 0007 3 3 0004 2 003
rgt s-1 0021 78 0008 01 1 0008 353
r0t s-1 0000 030 0000 022 1 0000 022 0000 5
rg s-1 0015 61 0005 67 1 0006 644
r0 s-1 0000 009 0000 008 1 0000 008 0000 1
at Bq 0088 35 0002 10 1 0002 1 028
aU-238_1 Bqmiddotkg-1 124 3
44
TABLE VI 7 AN EXAMPLE OF QUANTIFYING UNCERTAINTIES OF 230Th RESULT
Symbol unit Value of variable
Uncertainty Conversion factor to standard uncertainty
Standard uncertainty
Contribution to combined
uncertainty ()
ms g 0508 9 0007 3 3 0004 2 005
rgt s-1 0022 63 0006 44 1 0006 387
r0t s-1 0000 077 0000 063 1 0000 063 0006 1
rg s-1 0028 38 0007 90 1 0008 608
r0 s-1 0000 012 0000 010 1 0000 010 0000 1
at Bq 0090 03 0002 30 1 0002 303 051
aTh-230_1 Bqmiddotkg-1 223 9
TABLE VI 8 AN EXAMPLE OF QUANTIFYING UNCERTAINTIES OF 232Th RESULT
Symbol unit Value of variable
Uncertainty Conversion factor to standard uncertainty
Standard uncertainty
Contribution to combined
uncertainty ()
ms g 0508 9 0007 3 3 0004 2 004
rgt s-1 0022 63 0006 44 1 0006 265
r0t s-1 0000 077 0000 063 1 0000 063 0004 2
rg s-1 0000 28 0000 10 1 0000 1 727
r0 s-1 0000 011 0000 008 1 0000 008 048
at Bq 0090 03 0002 30 1 0002 3 035
aTh-232_1 Bqmiddotkg-1 21 009
TABLE VI 9 AN EXAMPLE OF QUANTIFYING UNCERTAINTIES OF 226Ra RESULT
Symbol unit Value of variable
Uncertainty Conversion factor
to standard uncertainty
Standard uncertainty
Contribution to combined
uncertainty ()
ms g 0508 9 0007 3 3 0004 2 003
rgt s-1 0043 10 0025 05 1 0025 05 603
r0t s-1 0000 111 0000 128 1 0000 128 0004
rg s-1 0063 32 0018 78 1 0018 78 393
r0 s-1 0000 070 015 0000 070 013 1 0000 070 013 0000 5
at Ra-225 Bq 0779 50 0022 53 1 0022 53 04
λAc225 d-1 0069 315 0000 624 1 0000 624 0000 02
λRa225 d-1 0046 520 0000 693 1 0000 693 008
t1-t0 d 337
aRa-226_1 Bqmiddotkg-1 766 39
45
APPENDIX VII DETECTION THRESHOLD AND LIMIT OF THE APPLIED PROCEDURE
TABLE VII 1 TYPICAL DECISION THRESHOLD AND DETECTION LIMIT FOR RELEVANT ISOTOPES
Symbol unit 210Pb 210Po 234U 238U 230 Th 232 Th 226Ra
k 165 165 165 165 165 165 165
m kg 0000 5 0000 5 0000 5 0000 5 0000 5 0000 5 0000 5
ε 086 031 026 026 035 035 025
R 086 073 094 094 068 068 061
n0 52 16 4 4 6 6 28
Tg s 36 000 98 899 343 024 343 024 277 345 277 345 124 984
t0 s 35 542 548 190 512 901 512 901 559 286 559 286 446 755
a Bqmiddotkg-1 13 036 009 009 012 012 068
a1 Bqmiddotkg-1 38 11 028 028 036 036 205
u2(0) Bq2middotkg-2 29 015 0008 4 0008 4 0006 5 0004 7 078
u2(a1) Bq2middotkg-2 23 041 0059 0025 0028 0052 204
a Bqmiddotkg-1 24 12 052 019 018 019 43
46
APPENDIX VIII VALIDATION TEST RESULTS OF THE PROCEDURE
TABLE VIII 1 VALIDATION RESULTS FOR RELEVANT RADIONUCLIDES
Parameters 210Po 210Pb 234U 238U 230Th 226Ra
C Bq kg-1 680 680 120 120 211 780
X Bq kg-1 653 659 127 123 221 793
u(C) Bq kg-1 58 58 9 11 9 62
u(X ) Bq kg-1 23 22 5 5 10 35
δ() -40 -31 58 25 47 17
rL Bq kg-1 106 102 48 47 62 498
RL Bq kg-1 237 454 59 53 89 707
PI() 92 92 85 100 62 91
TABLE VIII 2 ANALYSIS OF VARIANCE (ANOVA) FOR 210Po 210Pb 238U 230Th AND 226Ra IN PHOSPHOGYPSUM
Nuclide SSwb SSbb MSwb MSbb Swb
(as CV)
Sbb
(as CV)
210Po 124 62 151 79 312 1687 271 254
210Pb 8385 197 54 210 2195 220 302
238U 314 386 785 429 227 215
230Th 2176 1598 544 178 334 225
226Ra 412 686 137 858 121 054
SSwb sum of squares within bottles
SSbb sum of squares between bottles
MSwb mean of squares within bottles
MSbb mean of squares between bottles
Swb standard deviation as percent of covalent variance within bottles
Sbb standard deviation as percent of covalent variance between bottles
47
550
600
650
700
750
0 10 20 30 40 50
Samples
Act
ivity
of
21
0 Pb
in th
e sa
mp
le (
Bq
kg
dry
)
Mean1σ
-2σ
-1σ
3σ
2σ
-3σ
FIG VIII 1 210Pb results with associated uncertainties
550
600
650
700
750
0 10 20 30 40 50Samples
Act
ivity
of
21
0 Po
in t
he s
ampl
e (B
qkg
dry
)
Mean
1σ
-1σ
3σ
2σ
-3σ-2σ
FIG VIII 2 210Po results with associated uncertainties
48
110
115
120
125
130
135
140
0 10 20 30 40 50
Samples
Act
ivity
of
238
U in
the
sam
ple
(B
qkg
dry
)
Mean
1σ
-1σ
3σ
2σ
-3σ
-2σ
FIG VIII 3 238U results with associated uncertainties
105
110
115
120
125
130
135
140
145
150
0 10 20 30 40 50
Samples
Act
ivity
of
23
4 U in
the
sa
mpl
e (B
qkg
dry
)
Mean1σ
-2σ-1σ
3σ2σ
-3σ
FIG VIII 4 234U results with associated uncertainties
49
190
200
210
220
230
240
250
0 5 10 15 20 25 30 35 40 45 50
Samples
Act
ivity
of
23
0 Th
in th
e s
am
ple
(B
qk
g d
ry)
2σ
3σ
1σ
-1σ
-2σ
-3σ
Mean
FIG VIII 5 230 Th results with associated uncertainties
05
10
15
20
25
30
35
40
0 10 20 30 40 50
Samples
Act
ivity
of
23
2 Th
in th
e sa
mp
le (
Bq
kg
dry
)
Mean
1σ
-2σ
-1σ
3σ
2σ
-3σ
FIG VIII 6 232 Th results with associated uncertainties
50
650
700
750
800
850
900
1 2 3 4 5 6 7 8 9 10 11 12 13 14 15 16 17 18 19 20
Sample
Act
ivity
of
226 R
a in
th
e sa
mp
le (
Bq
kg
dry
)
Mean
1σ
-1σ
3σ
2σ
-3σ
-2σ
FIG VIII 7 226Ra results with associated uncertainties
51
CONTRIBUTORS TO DRAFTING AND REVIEW
Hampe D Gaigl FA
Verein fuumlr Kernverfahrenstechnik und Analytik Rossendorf eV Dresden Germany IAEA Environment Laboratories Terrestrial Environment Laboratory Seibersdorf Austria
Kim C-K IAEA Environment Laboratories Terrestrial Environment Laboratory Seibersdorf Austria
Kis-Benedek Gy IAEA Environment Laboratories Terrestrial Environment Laboratory Seibersdorf Austria
Martin P IAEA Environment Laboratories Terrestrial Environment Laboratory Seibersdorf Austria
Mietelski J W The Henryk Niewodniczanski Institute of Nuclear Physics Polish Academy of Sciences Poland
Sansone U IAEA Environment Laboratories Terrestrial Environment Laboratory Seibersdorf Austria
Varga B Central Agricultural Office Food and Feed Safety Directorate Hungary
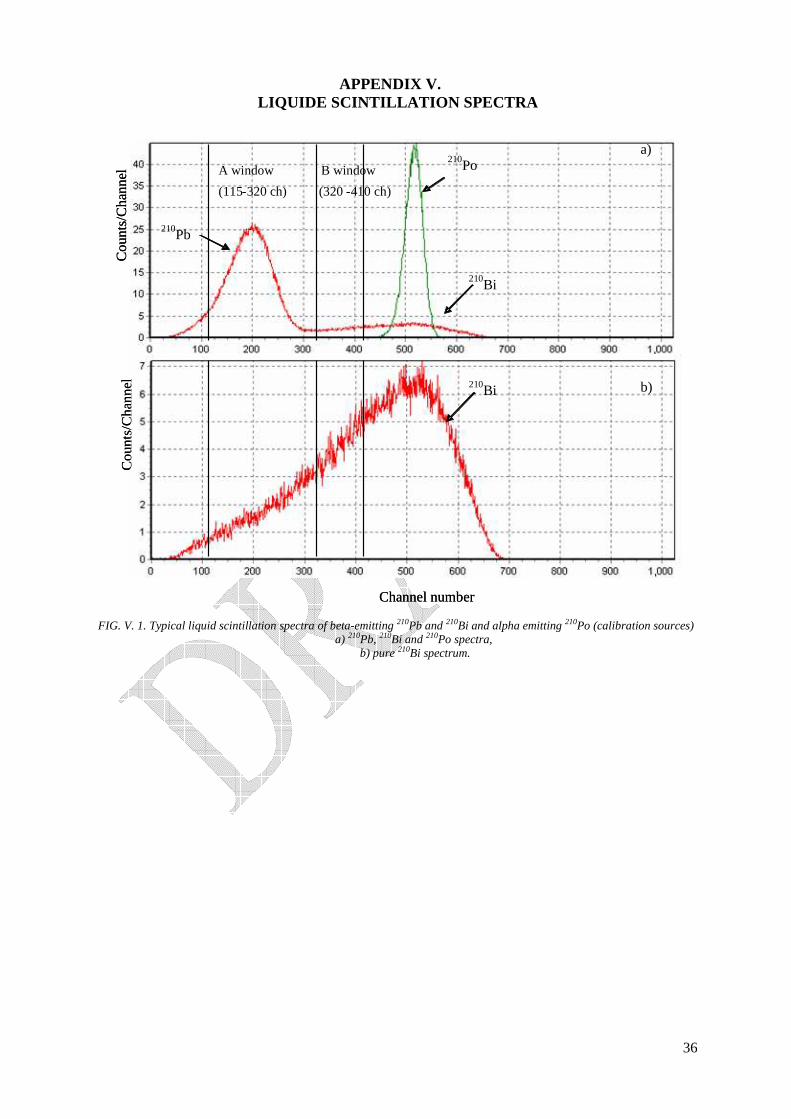
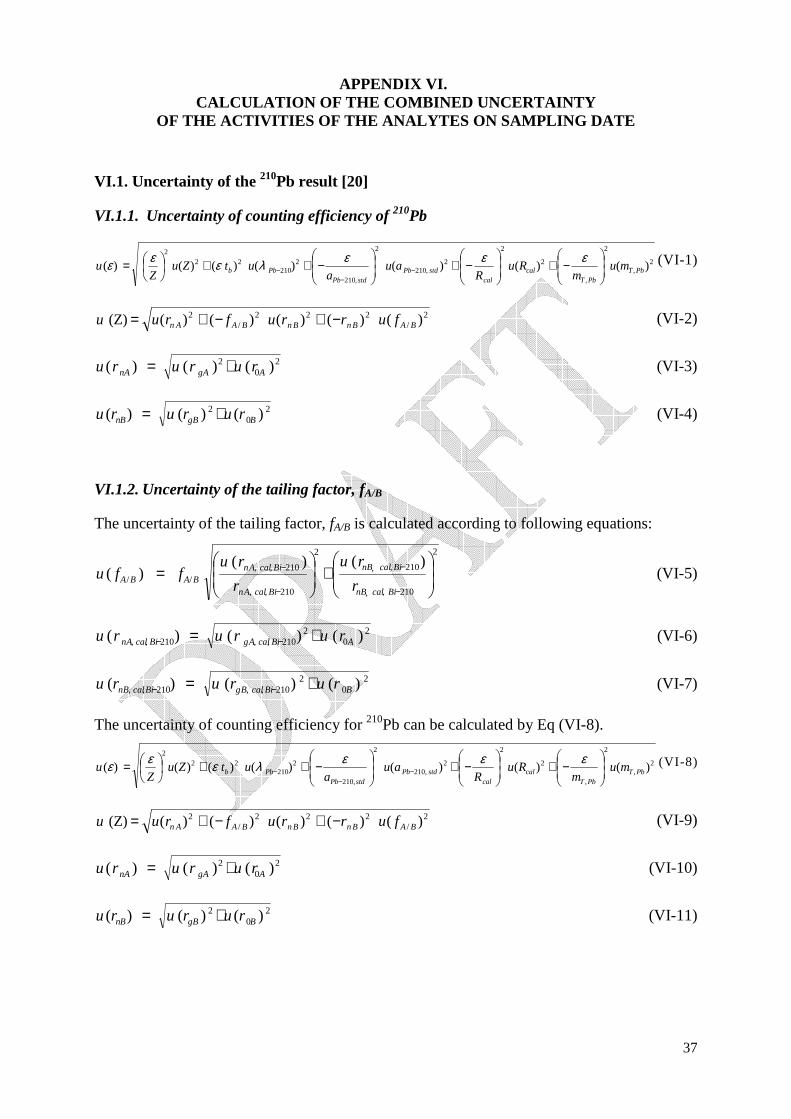
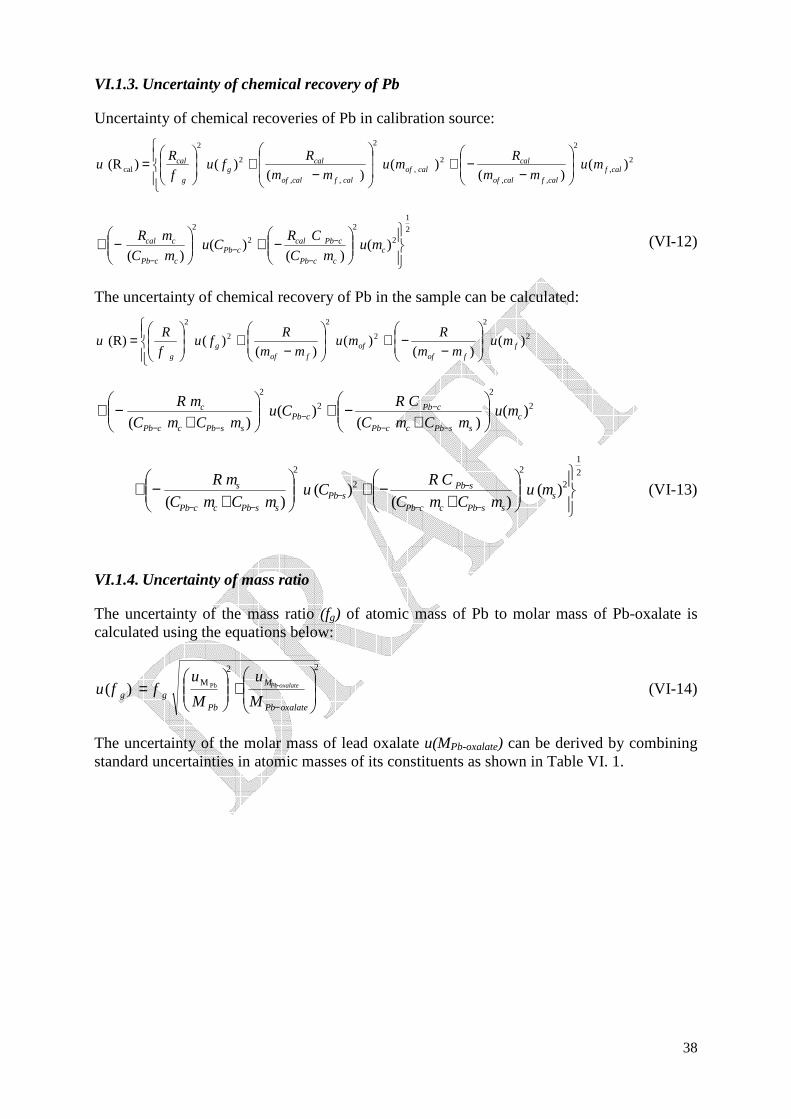
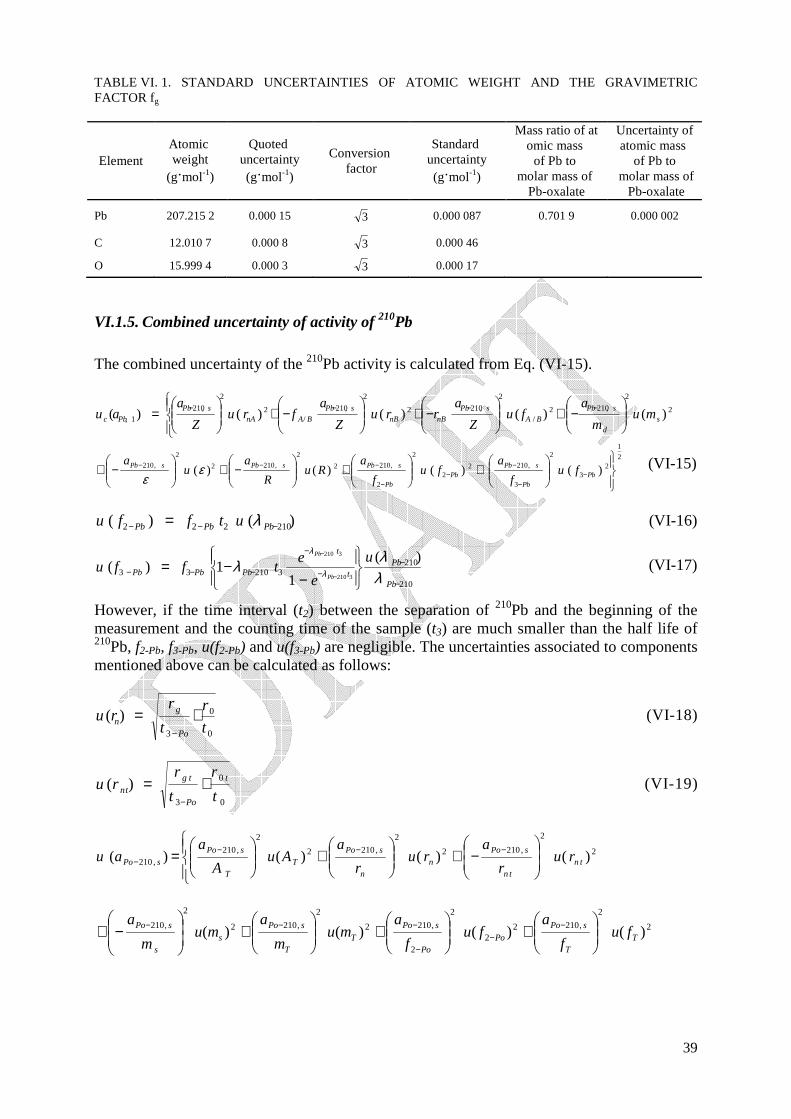
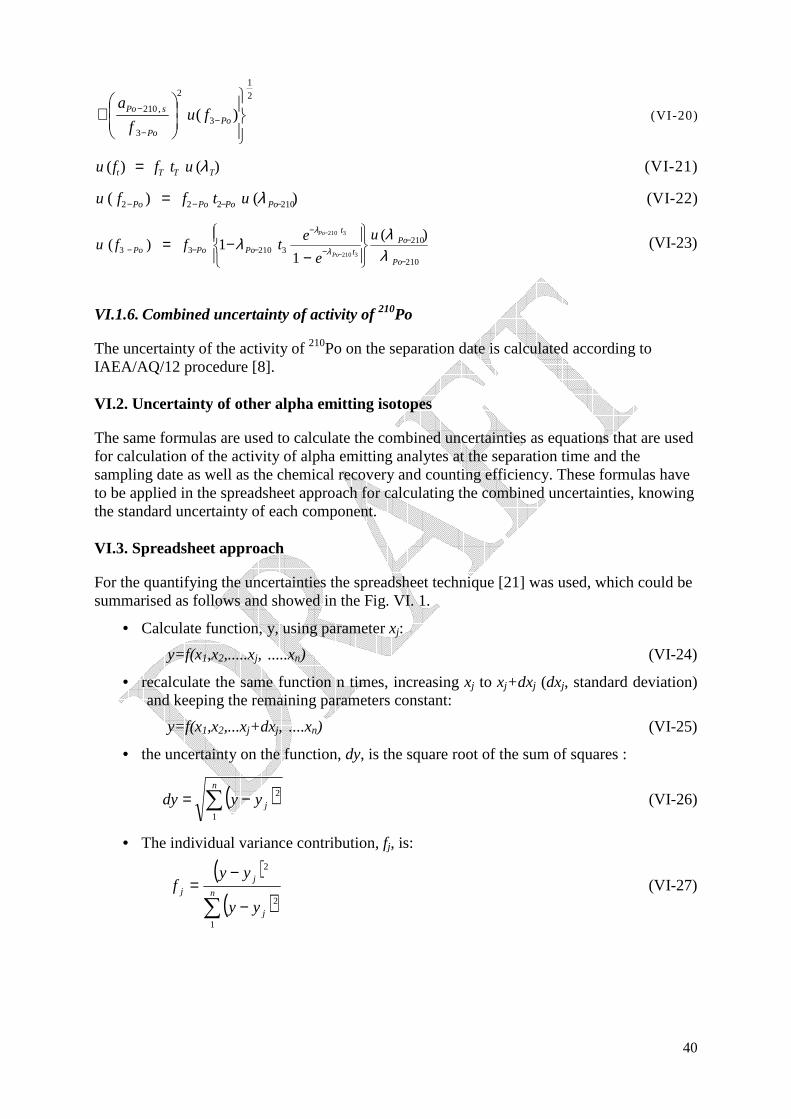
40
2
1
3
2
3
210 )(
+ minus
minus
minusPo
Po
sPo fuf
a (VI-20)
)()( TTTt utffu λ= (VI-21)
)()( 210222 minusminusminusminus = PoPoPoPo utffu λ (VI-22)
210
210321033
)(
11)(
3210
3210
minus
minusminus
minus
minusminusminus
minusminus=
minus
minus
Po
Pot
t
PoPoPo
u
e
etffu
Po
Po
λλλ λ
λ (VI-23)
VI16 Combined uncertainty of activity of 210Po
The uncertainty of the activity of 210Po on the separation date is calculated according to IAEAAQ12 procedure [8]
VI2 Uncertainty of other alpha emitting isotopes
The same formulas are used to calculate the combined uncertainties as equations that are used for calculation of the activity of alpha emitting analytes at the separation time and the sampling date as well as the chemical recovery and counting efficiency These formulas have to be applied in the spreadsheet approach for calculating the combined uncertainties knowing the standard uncertainty of each component VI3 Spreadsheet approach
For the quantifying the uncertainties the spreadsheet technique [21] was used which could be summarised as follows and showed in the Fig VI 1
bull Calculate function y using parameter xj
y=f(x1x2xj xn) (VI-24)
bull recalculate the same function n times increasing xj to xj+dxj (dxj standard deviation) and keeping the remaining parameters constant
y=f(x1x2xj+dxj xn) (VI-25)
bull the uncertainty on the function dy is the square root of the sum of squares
( )sum minus=n
jyydy1
2 (VI-26)
bull The individual variance contribution fj is
( )( )sum minus
minus=
n
j
jj
yy
yyf
1
2
2
(VI-27)
41
FIG VI 1 Spreadsheet approach for quantifying the uncertainty of the measurement
The results are summarised for the individual isotopes in the Tables VI 2ndashVI 9 and the results of the individual analysis with their uncertainties are shown in the Figs VI 3ndashVI 9 The detailed study about the usual contributors of uncertainty in the nuclear analytical techniques could be found in the IAEA-TECDOC-1401 [11] TABLE VI 2 AN EXAMPLE OF QUANTIFYING UNCERTAINTIES OF 210Po RESULT
Symbol unit Value of variable
Uncertainty Conversion factor to standard uncertainty
Standard uncertainty
Contribution to combined
uncertainty ()
m g 0508 9 0007 3 3 0004 2 010
rgt s-1 0197 0075 1 0075 361
r0t s-1 0000 017 0000 034 1 0000 034 0000 014
rg s-1 0081 0029 1 0029 6352
r0 s-1 0000 034 0000 033 1 0000 033 0000 08
at Bq 0829 0019 1 0019 0252
λt d-1 0000 019 0000 013 1 0000 013 negligible
λPo d-1 0005 72 x 10-9 1 72x10-9 negligible
ft 0982 14 0000 43 1 0000 43 0000 091
f2-Po 1005 73 x 10-9 1 73x10-9 negligible
f3-Po 1005 5 18 x 10-8 1 18 x10-8 negligible
aPo1 Bqmiddotkg-1 672 94
contribution is less than 1 x 10⁻⁵
TABLE VI 3 AN EXAMPLE OF QUANTIFYING UNCERTAINTIES OF EFFICIENCY OF 210Pb
Symbol unit Value of variable
Uncertainty
Conversion factor to standard
uncertainty
Standard uncertainty
Contribution to combined
uncertainty ()
mvial g 14936 35 0000 1 3 0000 17 0004 8
42
Symbol unit Value of variable
Uncertainty
Conversion factor to standard
uncertainty
Standard uncertainty
Contribution to combined
uncertainty ()
mvial+carrsol g 16036 54 0000 1 3 0000 17 0004 8
cPb g g-1 0027 42 0000 021 1 0000 021 011
mvial g 16036 72 0000 10 3 0000 17 0004 8
mvial+std g 17132 6 0000 10 3 0000 17 0004 8
astd Bq 1245 0189 1 0189 805
fgravimetry 0701 85 0000 41 1 0000 41 0066
mfilter g 0036 54 0000 10 3 0000 17 42
mfilter+Pb-precipitate g 0073 77 0000 10 3 0000 17 41
rA s-1 7362 0041 1 0041 76
rA0 s-1 0029 5 0003 1 0002 7 0035
rB s-1 0416 0 0011 1 0011 060
rB0 s-1 0011 7 0002 1 0002 2 0024
fAB 1049 0023 1 0023 040
t12 Pb d 814508 7305 1 731 23
tmeas-ref d 4 532 -
ε 0859 7 0015 3
43
TABLE VI 4 AN EXAMPLE OF QUANTIFYING UNCERTAINTIES OF 210Pb RESULT
Symbol unit Value of variable
Uncertainty Conversion factor to standard uncertainty
Standard uncertainty
Contribution to combined
uncertainty ()
ms g 0508 9 0007 3 3 0004 2 03
rgA s-1 0283 0035 1 0035 883
r0A s-1 0011 7 0002 2 1 0002 2 03
rgB s-1 0031 0009 1 0009 58
r0B s-1 0005 6 0002 3 1 0002 3 04
Ζ s-1 0245 1 0032 7 1 0032 7 -
fAB 1015 3 0012 9 1 0012 9 001
ε 0859 7 0015 3 1 0015 3 13
R 0858 8 0025 3 1 0077 2 35
aPb1 Bqmiddotkg-1 652 12
TABLE VI 5 AN EXAMPLE OF QUANTIFYING UNCERTAINTIES OF 234U RESULT
Symbol unit Value of variable
Uncertainty Conversion factor to standard uncertainty
Standard uncertainty
Contribution to combined
uncertainty ()
ms g 0508 9 0007 3 3 0004 2 003
rgt s-1 0021 78 0008 01 1 0008 369
r0t s-1 0000 030 0000 022 1 0000 022 0000 5
rg s-1 0016 15 0005 90 1 0006 628
r0 s-1 0000 016 0000 022 1 0000 022 0000 1
at Bq 0088 35 0002 10 1 0002 01 029
aU-234_1 Bqmiddotkg-1 129 3
TABLE VI 6 AN EXAMPLE OF QUANTIFYING UNCERTAINTIES OF 238U RESULT
Symbol unit Value of variable
Uncertainty Conversion factor to standard uncertainty
Standard uncertainty
Contribution to combined
uncertainty ()
ms g 0508 9 0007 3 3 0004 2 003
rgt s-1 0021 78 0008 01 1 0008 353
r0t s-1 0000 030 0000 022 1 0000 022 0000 5
rg s-1 0015 61 0005 67 1 0006 644
r0 s-1 0000 009 0000 008 1 0000 008 0000 1
at Bq 0088 35 0002 10 1 0002 1 028
aU-238_1 Bqmiddotkg-1 124 3
44
TABLE VI 7 AN EXAMPLE OF QUANTIFYING UNCERTAINTIES OF 230Th RESULT
Symbol unit Value of variable
Uncertainty Conversion factor to standard uncertainty
Standard uncertainty
Contribution to combined
uncertainty ()
ms g 0508 9 0007 3 3 0004 2 005
rgt s-1 0022 63 0006 44 1 0006 387
r0t s-1 0000 077 0000 063 1 0000 063 0006 1
rg s-1 0028 38 0007 90 1 0008 608
r0 s-1 0000 012 0000 010 1 0000 010 0000 1
at Bq 0090 03 0002 30 1 0002 303 051
aTh-230_1 Bqmiddotkg-1 223 9
TABLE VI 8 AN EXAMPLE OF QUANTIFYING UNCERTAINTIES OF 232Th RESULT
Symbol unit Value of variable
Uncertainty Conversion factor to standard uncertainty
Standard uncertainty
Contribution to combined
uncertainty ()
ms g 0508 9 0007 3 3 0004 2 004
rgt s-1 0022 63 0006 44 1 0006 265
r0t s-1 0000 077 0000 063 1 0000 063 0004 2
rg s-1 0000 28 0000 10 1 0000 1 727
r0 s-1 0000 011 0000 008 1 0000 008 048
at Bq 0090 03 0002 30 1 0002 3 035
aTh-232_1 Bqmiddotkg-1 21 009
TABLE VI 9 AN EXAMPLE OF QUANTIFYING UNCERTAINTIES OF 226Ra RESULT
Symbol unit Value of variable
Uncertainty Conversion factor
to standard uncertainty
Standard uncertainty
Contribution to combined
uncertainty ()
ms g 0508 9 0007 3 3 0004 2 003
rgt s-1 0043 10 0025 05 1 0025 05 603
r0t s-1 0000 111 0000 128 1 0000 128 0004
rg s-1 0063 32 0018 78 1 0018 78 393
r0 s-1 0000 070 015 0000 070 013 1 0000 070 013 0000 5
at Ra-225 Bq 0779 50 0022 53 1 0022 53 04
λAc225 d-1 0069 315 0000 624 1 0000 624 0000 02
λRa225 d-1 0046 520 0000 693 1 0000 693 008
t1-t0 d 337
aRa-226_1 Bqmiddotkg-1 766 39
45
APPENDIX VII DETECTION THRESHOLD AND LIMIT OF THE APPLIED PROCEDURE
TABLE VII 1 TYPICAL DECISION THRESHOLD AND DETECTION LIMIT FOR RELEVANT ISOTOPES
Symbol unit 210Pb 210Po 234U 238U 230 Th 232 Th 226Ra
k 165 165 165 165 165 165 165
m kg 0000 5 0000 5 0000 5 0000 5 0000 5 0000 5 0000 5
ε 086 031 026 026 035 035 025
R 086 073 094 094 068 068 061
n0 52 16 4 4 6 6 28
Tg s 36 000 98 899 343 024 343 024 277 345 277 345 124 984
t0 s 35 542 548 190 512 901 512 901 559 286 559 286 446 755
a Bqmiddotkg-1 13 036 009 009 012 012 068
a1 Bqmiddotkg-1 38 11 028 028 036 036 205
u2(0) Bq2middotkg-2 29 015 0008 4 0008 4 0006 5 0004 7 078
u2(a1) Bq2middotkg-2 23 041 0059 0025 0028 0052 204
a Bqmiddotkg-1 24 12 052 019 018 019 43
46
APPENDIX VIII VALIDATION TEST RESULTS OF THE PROCEDURE
TABLE VIII 1 VALIDATION RESULTS FOR RELEVANT RADIONUCLIDES
Parameters 210Po 210Pb 234U 238U 230Th 226Ra
C Bq kg-1 680 680 120 120 211 780
X Bq kg-1 653 659 127 123 221 793
u(C) Bq kg-1 58 58 9 11 9 62
u(X ) Bq kg-1 23 22 5 5 10 35
δ() -40 -31 58 25 47 17
rL Bq kg-1 106 102 48 47 62 498
RL Bq kg-1 237 454 59 53 89 707
PI() 92 92 85 100 62 91
TABLE VIII 2 ANALYSIS OF VARIANCE (ANOVA) FOR 210Po 210Pb 238U 230Th AND 226Ra IN PHOSPHOGYPSUM
Nuclide SSwb SSbb MSwb MSbb Swb
(as CV)
Sbb
(as CV)
210Po 124 62 151 79 312 1687 271 254
210Pb 8385 197 54 210 2195 220 302
238U 314 386 785 429 227 215
230Th 2176 1598 544 178 334 225
226Ra 412 686 137 858 121 054
SSwb sum of squares within bottles
SSbb sum of squares between bottles
MSwb mean of squares within bottles
MSbb mean of squares between bottles
Swb standard deviation as percent of covalent variance within bottles
Sbb standard deviation as percent of covalent variance between bottles
47
550
600
650
700
750
0 10 20 30 40 50
Samples
Act
ivity
of
21
0 Pb
in th
e sa
mp
le (
Bq
kg
dry
)
Mean1σ
-2σ
-1σ
3σ
2σ
-3σ
FIG VIII 1 210Pb results with associated uncertainties
550
600
650
700
750
0 10 20 30 40 50Samples
Act
ivity
of
21
0 Po
in t
he s
ampl
e (B
qkg
dry
)
Mean
1σ
-1σ
3σ
2σ
-3σ-2σ
FIG VIII 2 210Po results with associated uncertainties
48
110
115
120
125
130
135
140
0 10 20 30 40 50
Samples
Act
ivity
of
238
U in
the
sam
ple
(B
qkg
dry
)
Mean
1σ
-1σ
3σ
2σ
-3σ
-2σ
FIG VIII 3 238U results with associated uncertainties
105
110
115
120
125
130
135
140
145
150
0 10 20 30 40 50
Samples
Act
ivity
of
23
4 U in
the
sa
mpl
e (B
qkg
dry
)
Mean1σ
-2σ-1σ
3σ2σ
-3σ
FIG VIII 4 234U results with associated uncertainties
49
190
200
210
220
230
240
250
0 5 10 15 20 25 30 35 40 45 50
Samples
Act
ivity
of
23
0 Th
in th
e s
am
ple
(B
qk
g d
ry)
2σ
3σ
1σ
-1σ
-2σ
-3σ
Mean
FIG VIII 5 230 Th results with associated uncertainties
05
10
15
20
25
30
35
40
0 10 20 30 40 50
Samples
Act
ivity
of
23
2 Th
in th
e sa
mp
le (
Bq
kg
dry
)
Mean
1σ
-2σ
-1σ
3σ
2σ
-3σ
FIG VIII 6 232 Th results with associated uncertainties
50
650
700
750
800
850
900
1 2 3 4 5 6 7 8 9 10 11 12 13 14 15 16 17 18 19 20
Sample
Act
ivity
of
226 R
a in
th
e sa
mp
le (
Bq
kg
dry
)
Mean
1σ
-1σ
3σ
2σ
-3σ
-2σ
FIG VIII 7 226Ra results with associated uncertainties
51
CONTRIBUTORS TO DRAFTING AND REVIEW
Hampe D Gaigl FA
Verein fuumlr Kernverfahrenstechnik und Analytik Rossendorf eV Dresden Germany IAEA Environment Laboratories Terrestrial Environment Laboratory Seibersdorf Austria
Kim C-K IAEA Environment Laboratories Terrestrial Environment Laboratory Seibersdorf Austria
Kis-Benedek Gy IAEA Environment Laboratories Terrestrial Environment Laboratory Seibersdorf Austria
Martin P IAEA Environment Laboratories Terrestrial Environment Laboratory Seibersdorf Austria
Mietelski J W The Henryk Niewodniczanski Institute of Nuclear Physics Polish Academy of Sciences Poland
Sansone U IAEA Environment Laboratories Terrestrial Environment Laboratory Seibersdorf Austria
Varga B Central Agricultural Office Food and Feed Safety Directorate Hungary
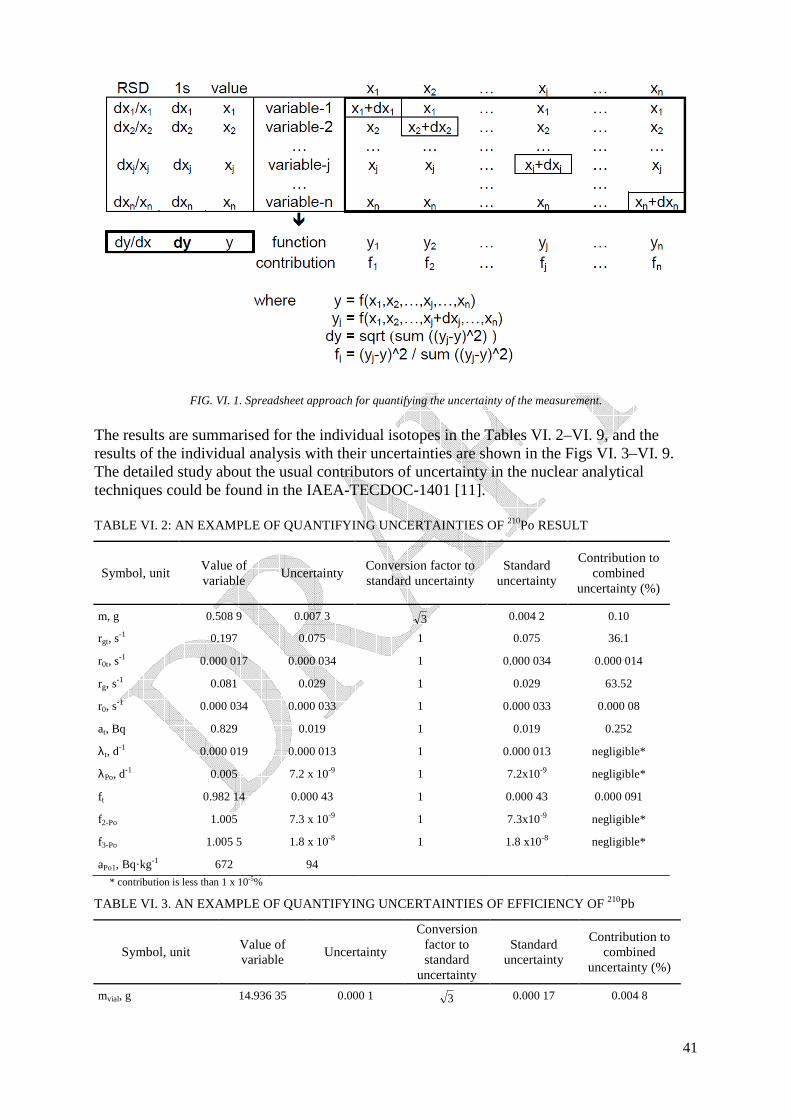
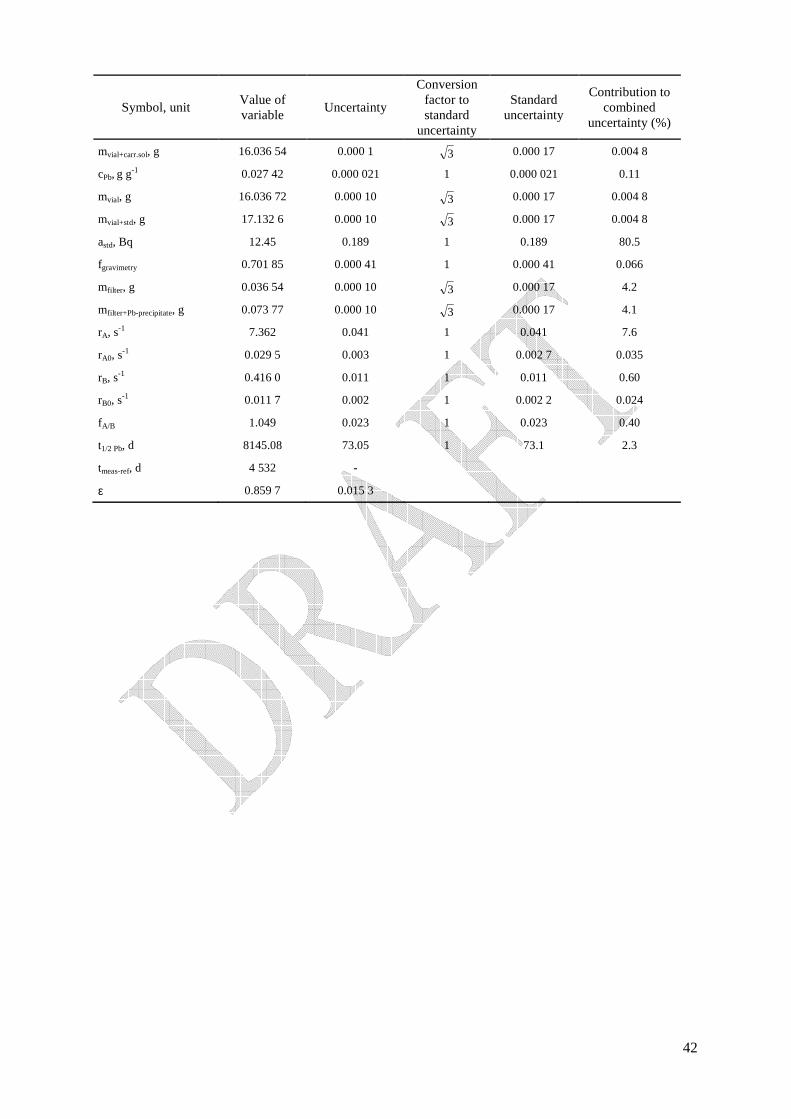
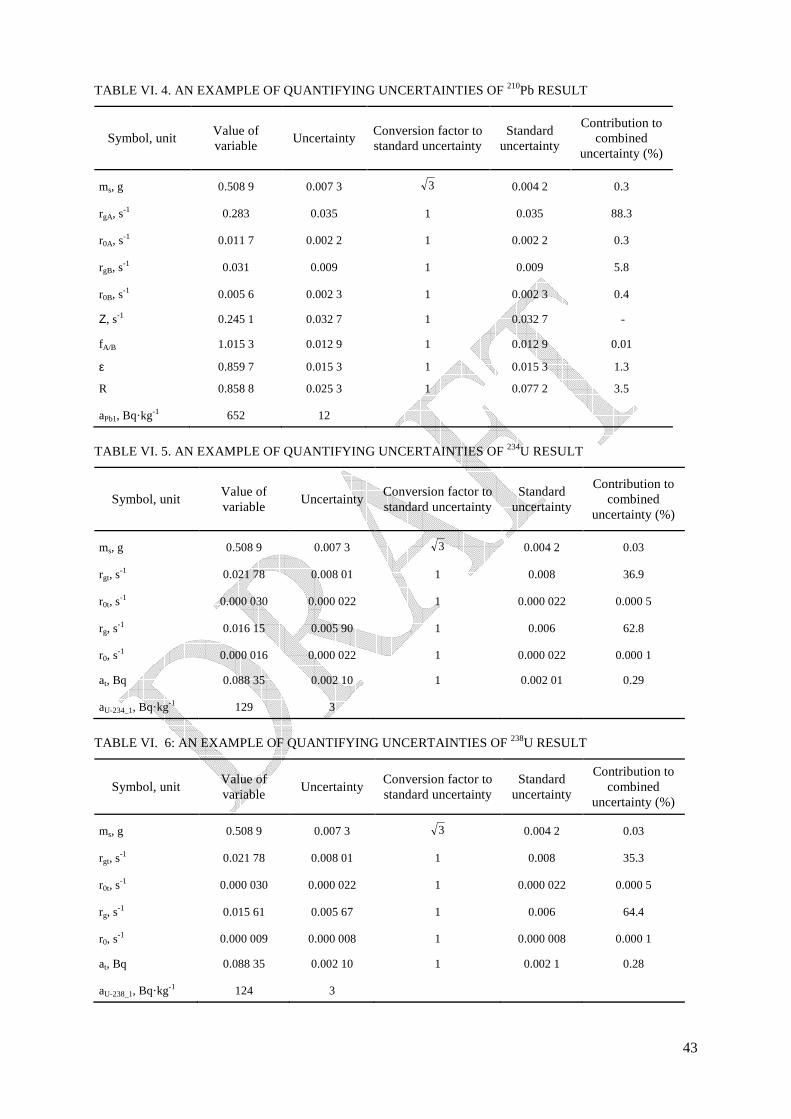
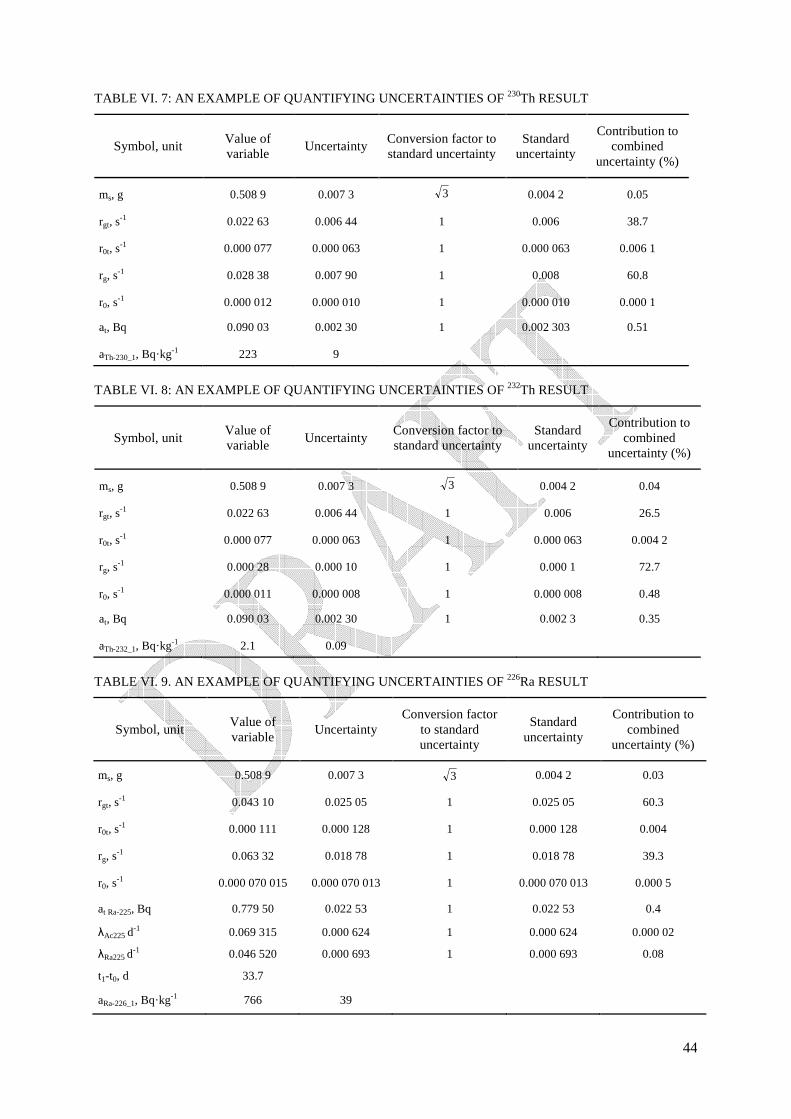
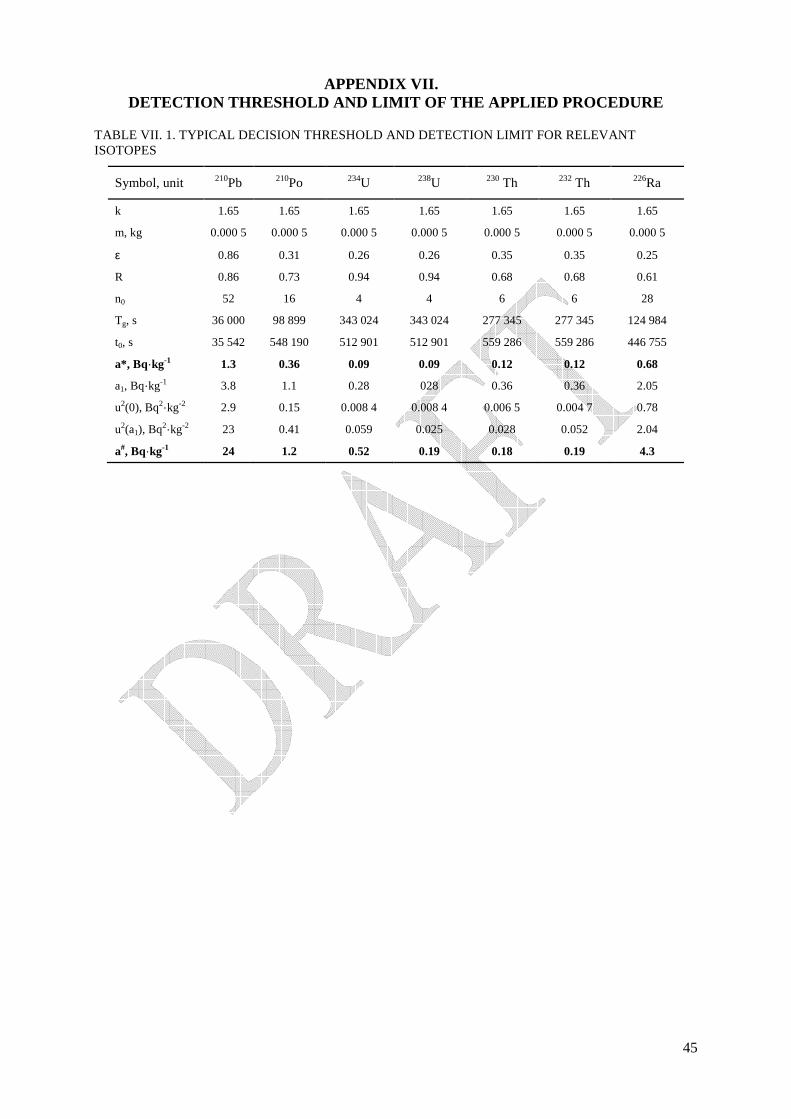
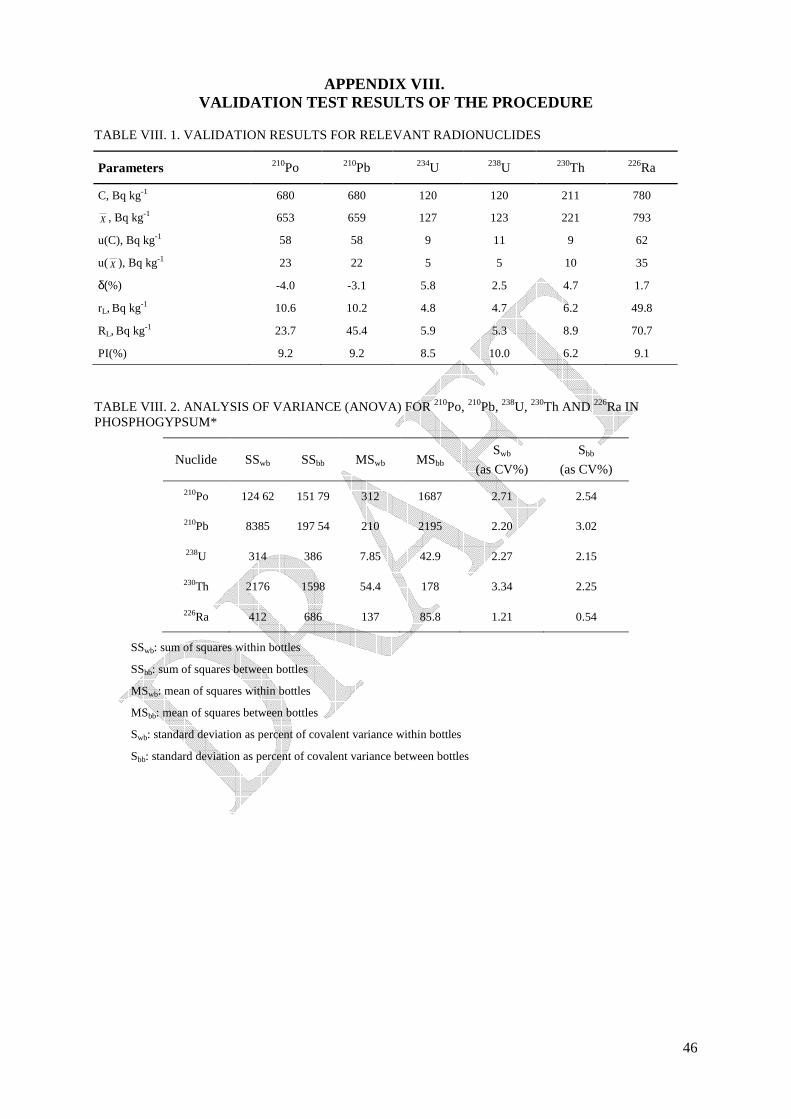
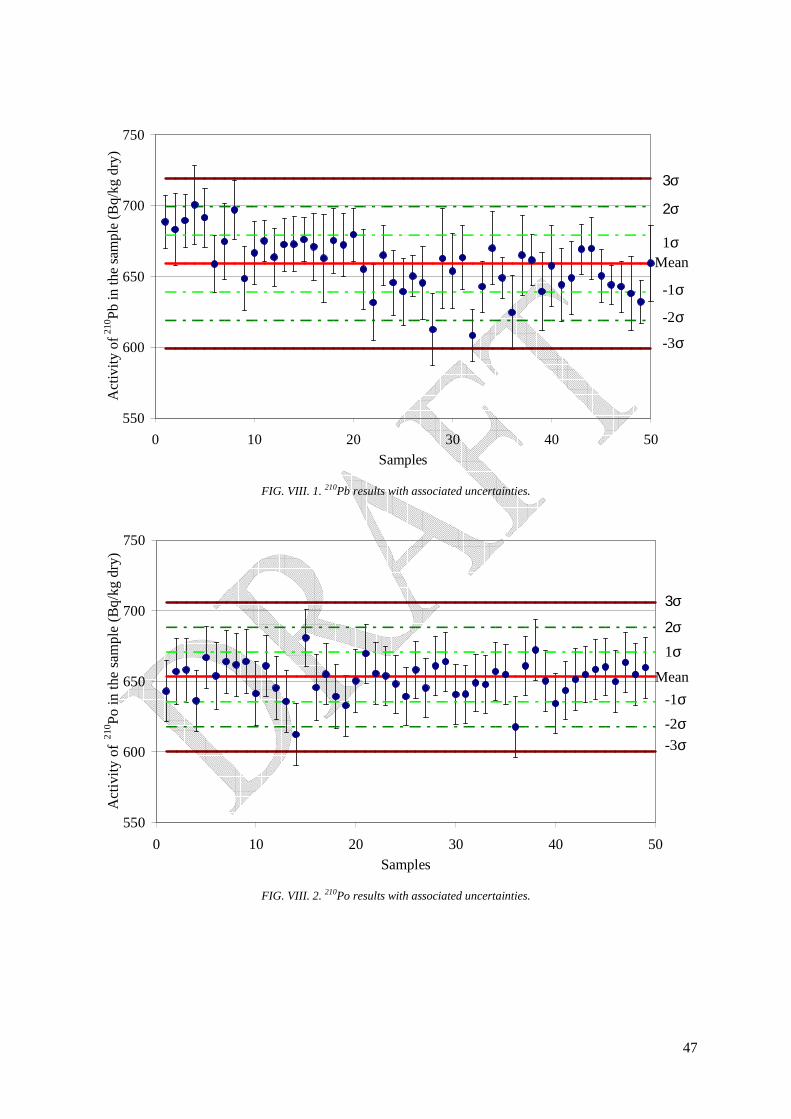
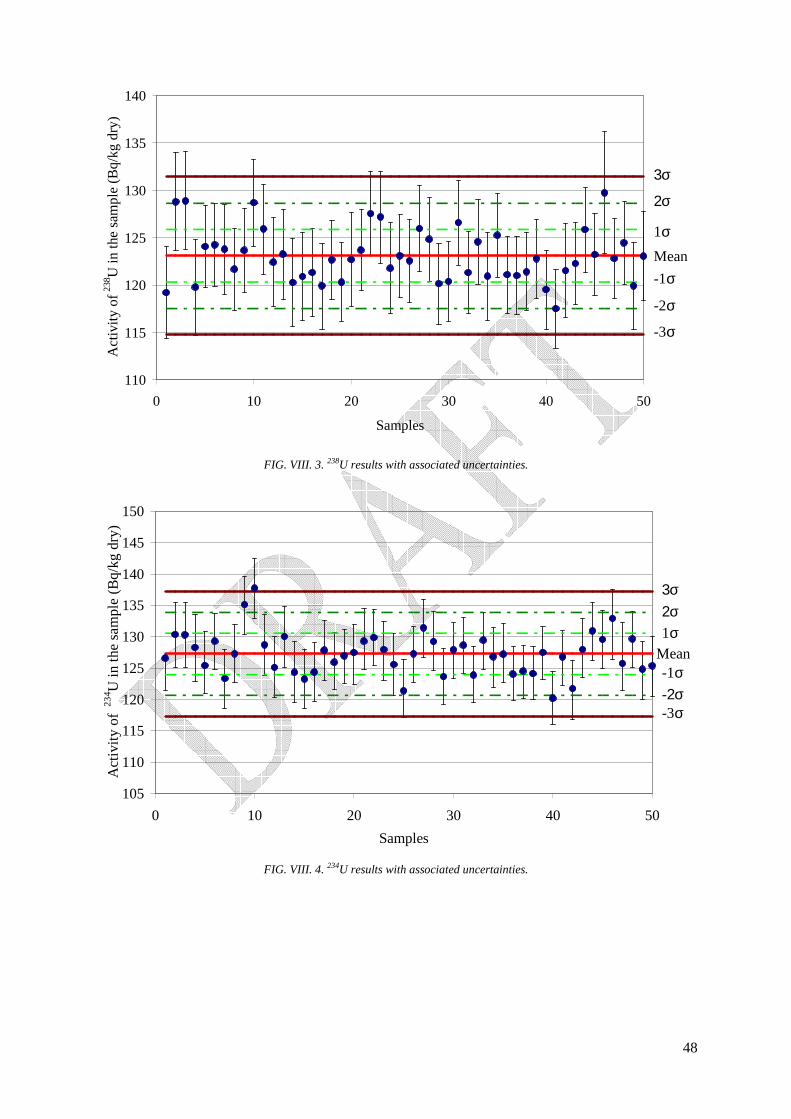
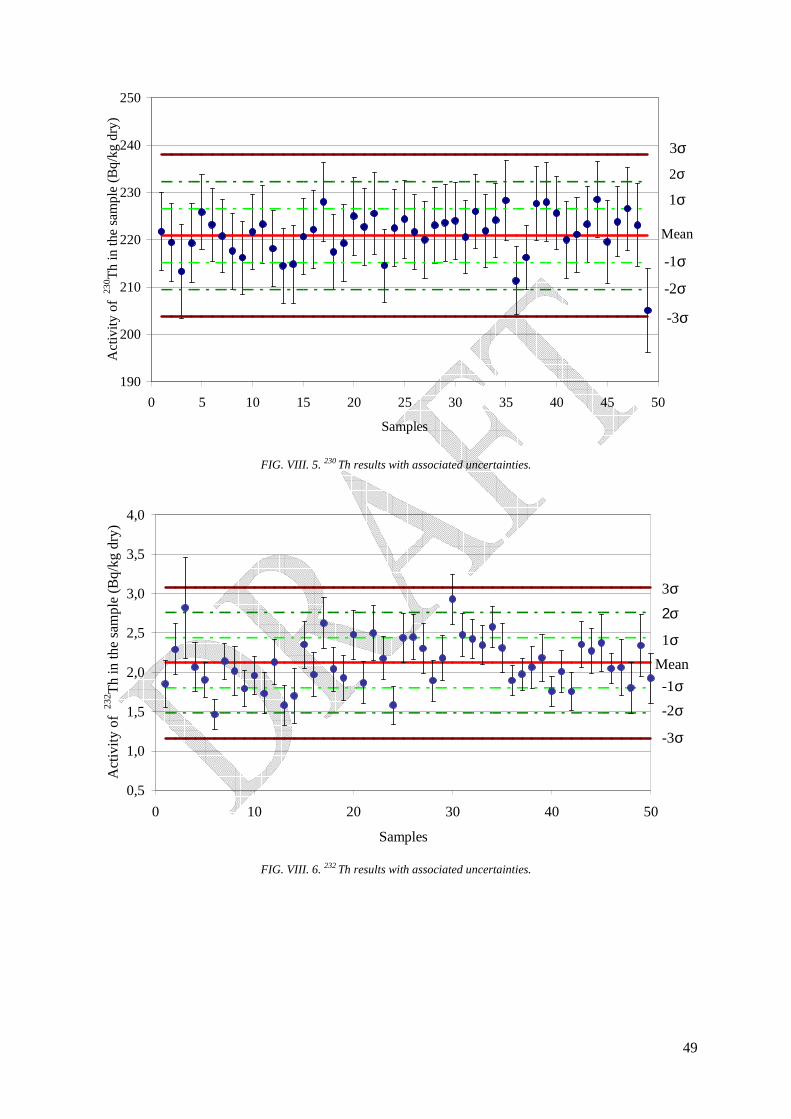
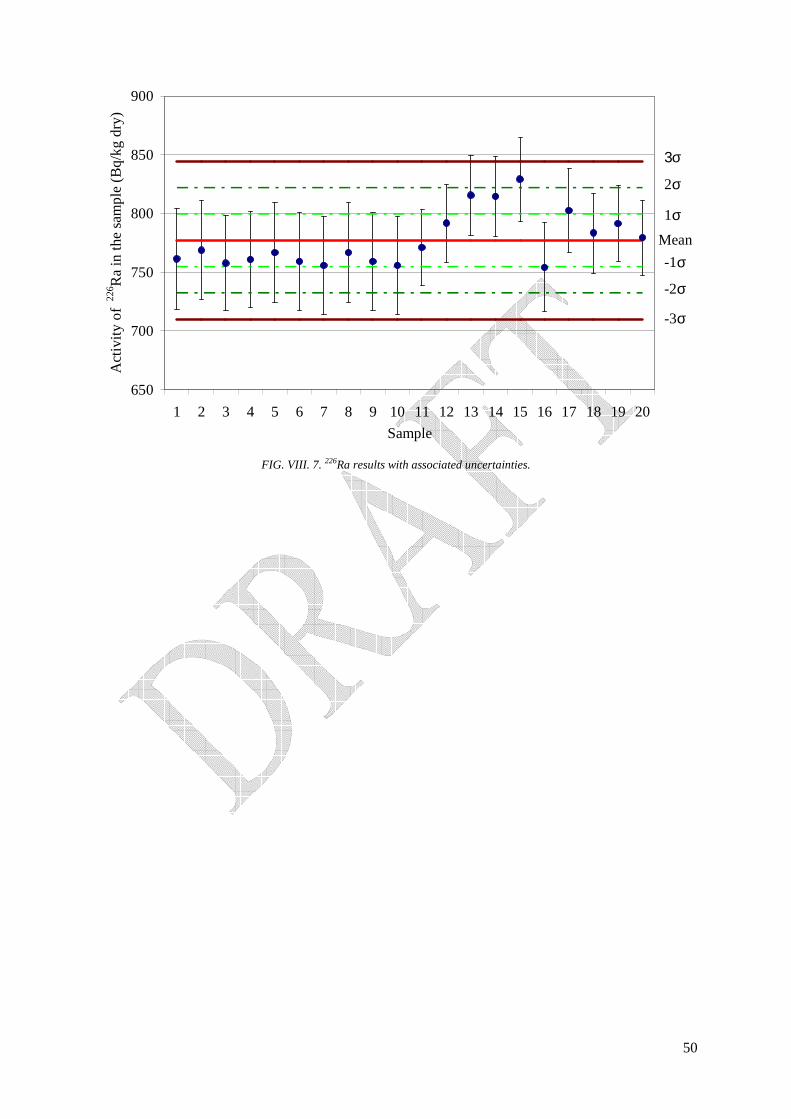


![Calorimetric determination of the half-life of polonium · polonium, probably the most accurate is that b} Beamer and Easton [1],2 who used a calorimetric method and observed a sample](https://img.pdfslide.us/doc/110x75/6068f01d685c5f6a453fc0b7/calorimetric-determination-of-the-half-life-of-polonium-polonium-probably-the-most.jpg)