Embed Size (px)
Citation preview

A Probabilistic Risk Assessment for Children Who Contact CCA-Treated Playsets and Decks
Draft Preliminary Report
November 10, 2003
Prepared by:
W. Dang, J. Chen
U. S. Environmental Protection AgencyOffice of Pesticide Programs, Antimicrobials Division
and
N. Mottl, L. Phillips, P. Wood, S. McCarthy, R. Lee, M. Helmke, M. Nelson, and K. Coon
Versar, Inc.
DISCLAIMERThis report has undergone internal EPA review through the Office of Research and Development (ORD) and the Office ofPesticide Programs (OPP). Some of the statutory provisions described in this report contain legally binding requirements. However, this report does not substitute for those provisions or regulations, nor is it regulation itself. Any decisions regardinga particular risk reduction process and remedy selection decision will be made based on the statute and regulation, and EPAdecision makers retain the discretion to adopt approaches on a case-by-case basis.
i
TABLE OF CONTENTS
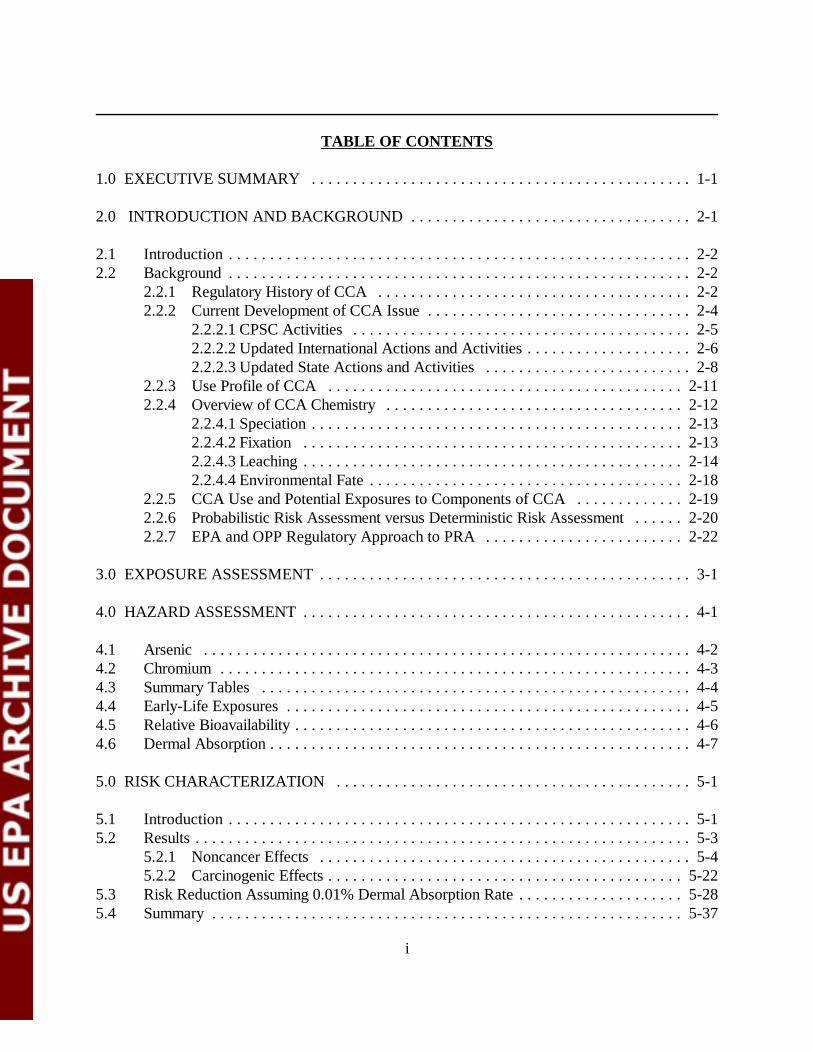
1.0 EXECUTIVE SUMMARY . . . . . . . . . . . . . . . . . . . . . . . . . . . . . . . . . . . . . . . . . . . . . . 1-1
2.0 INTRODUCTION AND BACKGROUND . . . . . . . . . . . . . . . . . . . . . . . . . . . . . . . . . . 2-1
2.1 Introduction . . . . . . . . . . . . . . . . . . . . . . . . . . . . . . . . . . . . . . . . . . . . . . . . . . . . . . . . 2-22.2 Background . . . . . . . . . . . . . . . . . . . . . . . . . . . . . . . . . . . . . . . . . . . . . . . . . . . . . . . . 2-2
2.2.1 Regulatory History of CCA . . . . . . . . . . . . . . . . . . . . . . . . . . . . . . . . . . . . . . 2-22.2.2 Current Development of CCA Issue . . . . . . . . . . . . . . . . . . . . . . . . . . . . . . . . 2-4
2.2.2.1 CPSC Activities . . . . . . . . . . . . . . . . . . . . . . . . . . . . . . . . . . . . . . . . . 2-52.2.2.2 Updated International Actions and Activities . . . . . . . . . . . . . . . . . . . . 2-62.2.2.3 Updated State Actions and Activities . . . . . . . . . . . . . . . . . . . . . . . . . 2-8
2.2.3 Use Profile of CCA . . . . . . . . . . . . . . . . . . . . . . . . . . . . . . . . . . . . . . . . . . . 2-112.2.4 Overview of CCA Chemistry . . . . . . . . . . . . . . . . . . . . . . . . . . . . . . . . . . . . 2-12
2.2.4.1 Speciation . . . . . . . . . . . . . . . . . . . . . . . . . . . . . . . . . . . . . . . . . . . . . 2-132.2.4.2 Fixation . . . . . . . . . . . . . . . . . . . . . . . . . . . . . . . . . . . . . . . . . . . . . . 2-132.2.4.3 Leaching . . . . . . . . . . . . . . . . . . . . . . . . . . . . . . . . . . . . . . . . . . . . . . 2-142.2.4.4 Environmental Fate . . . . . . . . . . . . . . . . . . . . . . . . . . . . . . . . . . . . . . 2-18
2.2.5 CCA Use and Potential Exposures to Components of CCA . . . . . . . . . . . . . 2-192.2.6 Probabilistic Risk Assessment versus Deterministic Risk Assessment . . . . . . 2-202.2.7 EPA and OPP Regulatory Approach to PRA . . . . . . . . . . . . . . . . . . . . . . . . 2-22
3.0 EXPOSURE ASSESSMENT . . . . . . . . . . . . . . . . . . . . . . . . . . . . . . . . . . . . . . . . . . . . . 3-1
4.0 HAZARD ASSESSMENT . . . . . . . . . . . . . . . . . . . . . . . . . . . . . . . . . . . . . . . . . . . . . . . 4-1
4.1 Arsenic . . . . . . . . . . . . . . . . . . . . . . . . . . . . . . . . . . . . . . . . . . . . . . . . . . . . . . . . . . . 4-24.2 Chromium . . . . . . . . . . . . . . . . . . . . . . . . . . . . . . . . . . . . . . . . . . . . . . . . . . . . . . . . . 4-34.3 Summary Tables . . . . . . . . . . . . . . . . . . . . . . . . . . . . . . . . . . . . . . . . . . . . . . . . . . . . 4-44.4 Early-Life Exposures . . . . . . . . . . . . . . . . . . . . . . . . . . . . . . . . . . . . . . . . . . . . . . . . . 4-54.5 Relative Bioavailability . . . . . . . . . . . . . . . . . . . . . . . . . . . . . . . . . . . . . . . . . . . . . . . . 4-64.6 Dermal Absorption . . . . . . . . . . . . . . . . . . . . . . . . . . . . . . . . . . . . . . . . . . . . . . . . . . . 4-7
5.0 RISK CHARACTERIZATION . . . . . . . . . . . . . . . . . . . . . . . . . . . . . . . . . . . . . . . . . . . 5-1
5.1 Introduction . . . . . . . . . . . . . . . . . . . . . . . . . . . . . . . . . . . . . . . . . . . . . . . . . . . . . . . . 5-15.2 Results . . . . . . . . . . . . . . . . . . . . . . . . . . . . . . . . . . . . . . . . . . . . . . . . . . . . . . . . . . . . 5-3
5.2.1 Noncancer Effects . . . . . . . . . . . . . . . . . . . . . . . . . . . . . . . . . . . . . . . . . . . . . 5-45.2.2 Carcinogenic Effects . . . . . . . . . . . . . . . . . . . . . . . . . . . . . . . . . . . . . . . . . . . 5-22
5.3 Risk Reduction Assuming 0.01% Dermal Absorption Rate . . . . . . . . . . . . . . . . . . . . 5-285.4 Summary . . . . . . . . . . . . . . . . . . . . . . . . . . . . . . . . . . . . . . . . . . . . . . . . . . . . . . . . . 5-37
ii
TABLE OF CONTENTS (CONTINUED)
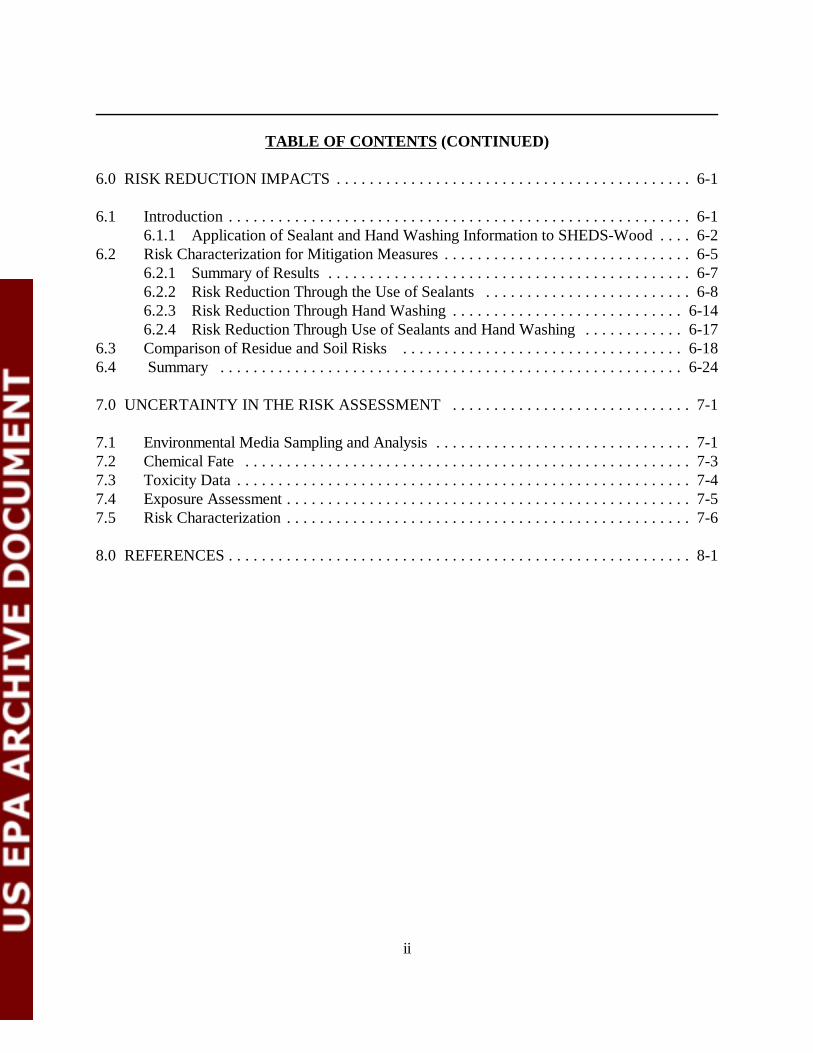
6.0 RISK REDUCTION IMPACTS . . . . . . . . . . . . . . . . . . . . . . . . . . . . . . . . . . . . . . . . . . . 6-1
6.1 Introduction . . . . . . . . . . . . . . . . . . . . . . . . . . . . . . . . . . . . . . . . . . . . . . . . . . . . . . . . 6-16.1.1 Application of Sealant and Hand Washing Information to SHEDS-Wood . . . . 6-2
6.2 Risk Characterization for Mitigation Measures . . . . . . . . . . . . . . . . . . . . . . . . . . . . . . 6-56.2.1 Summary of Results . . . . . . . . . . . . . . . . . . . . . . . . . . . . . . . . . . . . . . . . . . . . 6-76.2.2 Risk Reduction Through the Use of Sealants . . . . . . . . . . . . . . . . . . . . . . . . . 6-86.2.3 Risk Reduction Through Hand Washing . . . . . . . . . . . . . . . . . . . . . . . . . . . . 6-146.2.4 Risk Reduction Through Use of Sealants and Hand Washing . . . . . . . . . . . . 6-17
6.3 Comparison of Residue and Soil Risks . . . . . . . . . . . . . . . . . . . . . . . . . . . . . . . . . . 6-186.4 Summary . . . . . . . . . . . . . . . . . . . . . . . . . . . . . . . . . . . . . . . . . . . . . . . . . . . . . . . . 6-24
7.0 UNCERTAINTY IN THE RISK ASSESSMENT . . . . . . . . . . . . . . . . . . . . . . . . . . . . . 7-1
7.1 Environmental Media Sampling and Analysis . . . . . . . . . . . . . . . . . . . . . . . . . . . . . . . 7-17.2 Chemical Fate . . . . . . . . . . . . . . . . . . . . . . . . . . . . . . . . . . . . . . . . . . . . . . . . . . . . . . 7-37.3 Toxicity Data . . . . . . . . . . . . . . . . . . . . . . . . . . . . . . . . . . . . . . . . . . . . . . . . . . . . . . . 7-47.4 Exposure Assessment . . . . . . . . . . . . . . . . . . . . . . . . . . . . . . . . . . . . . . . . . . . . . . . . . 7-57.5 Risk Characterization . . . . . . . . . . . . . . . . . . . . . . . . . . . . . . . . . . . . . . . . . . . . . . . . . 7-6
8.0 REFERENCES . . . . . . . . . . . . . . . . . . . . . . . . . . . . . . . . . . . . . . . . . . . . . . . . . . . . . . . . 8-1
iii
LIST OF TABLES
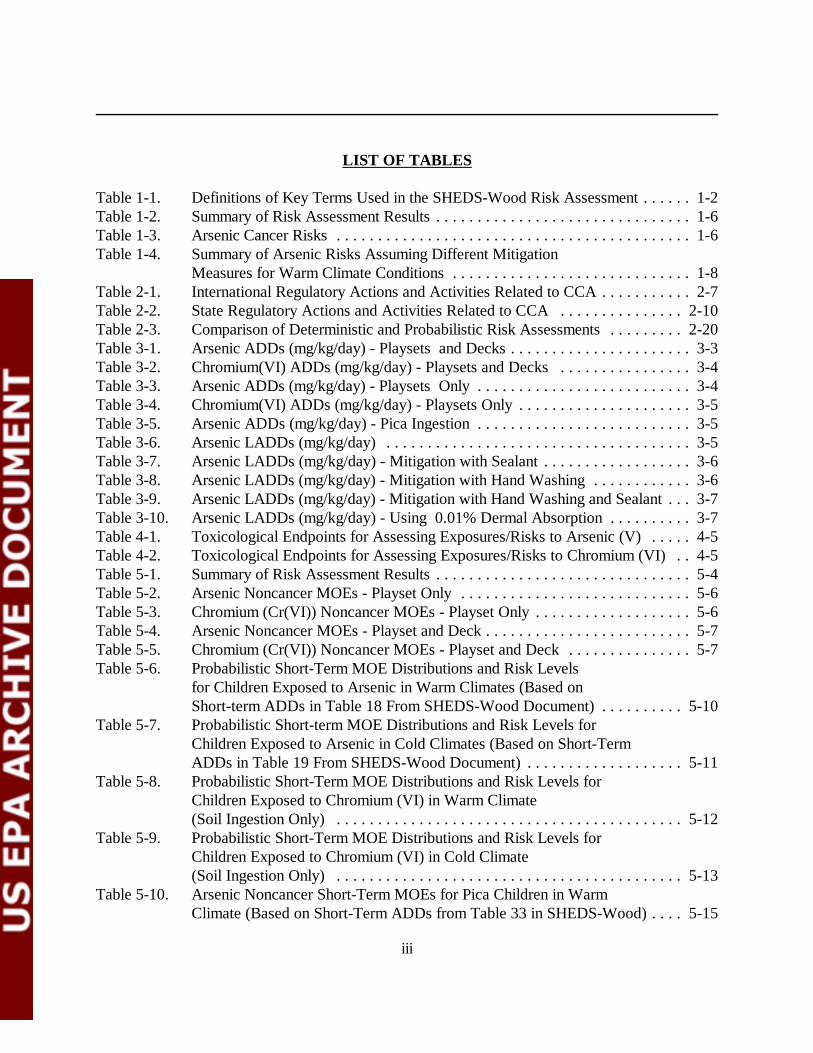
Table 1-1. Definitions of Key Terms Used in the SHEDS-Wood Risk Assessment . . . . . . 1-2Table 1-2. Summary of Risk Assessment Results . . . . . . . . . . . . . . . . . . . . . . . . . . . . . . . 1-6Table 1-3. Arsenic Cancer Risks . . . . . . . . . . . . . . . . . . . . . . . . . . . . . . . . . . . . . . . . . . . 1-6Table 1-4. Summary of Arsenic Risks Assuming Different Mitigation
Measures for Warm Climate Conditions . . . . . . . . . . . . . . . . . . . . . . . . . . . . . 1-8Table 2-1. International Regulatory Actions and Activities Related to CCA . . . . . . . . . . . 2-7Table 2-2. State Regulatory Actions and Activities Related to CCA . . . . . . . . . . . . . . . 2-10Table 2-3. Comparison of Deterministic and Probabilistic Risk Assessments . . . . . . . . . 2-20Table 3-1. Arsenic ADDs (mg/kg/day) - Playsets and Decks . . . . . . . . . . . . . . . . . . . . . . 3-3Table 3-2. Chromium(VI) ADDs (mg/kg/day) - Playsets and Decks . . . . . . . . . . . . . . . . 3-4Table 3-3. Arsenic ADDs (mg/kg/day) - Playsets Only . . . . . . . . . . . . . . . . . . . . . . . . . . 3-4Table 3-4. Chromium(VI) ADDs (mg/kg/day) - Playsets Only . . . . . . . . . . . . . . . . . . . . . 3-5Table 3-5. Arsenic ADDs (mg/kg/day) - Pica Ingestion . . . . . . . . . . . . . . . . . . . . . . . . . . 3-5Table 3-6. Arsenic LADDs (mg/kg/day) . . . . . . . . . . . . . . . . . . . . . . . . . . . . . . . . . . . . . 3-5Table 3-7. Arsenic LADDs (mg/kg/day) - Mitigation with Sealant . . . . . . . . . . . . . . . . . . 3-6Table 3-8. Arsenic LADDs (mg/kg/day) - Mitigation with Hand Washing . . . . . . . . . . . . 3-6Table 3-9. Arsenic LADDs (mg/kg/day) - Mitigation with Hand Washing and Sealant . . . 3-7Table 3-10. Arsenic LADDs (mg/kg/day) - Using 0.01% Dermal Absorption . . . . . . . . . . 3-7Table 4-1. Toxicological Endpoints for Assessing Exposures/Risks to Arsenic (V) . . . . . 4-5Table 4-2. Toxicological Endpoints for Assessing Exposures/Risks to Chromium (VI) . . 4-5Table 5-1. Summary of Risk Assessment Results . . . . . . . . . . . . . . . . . . . . . . . . . . . . . . . 5-4Table 5-2. Arsenic Noncancer MOEs - Playset Only . . . . . . . . . . . . . . . . . . . . . . . . . . . . 5-6Table 5-3. Chromium (Cr(VI)) Noncancer MOEs - Playset Only . . . . . . . . . . . . . . . . . . . 5-6Table 5-4. Arsenic Noncancer MOEs - Playset and Deck . . . . . . . . . . . . . . . . . . . . . . . . . 5-7Table 5-5. Chromium (Cr(VI)) Noncancer MOEs - Playset and Deck . . . . . . . . . . . . . . . 5-7Table 5-6. Probabilistic Short-Term MOE Distributions and Risk Levels
for Children Exposed to Arsenic in Warm Climates (Based on Short-term ADDs in Table 18 From SHEDS-Wood Document) . . . . . . . . . . 5-10
Table 5-7. Probabilistic Short-term MOE Distributions and Risk Levels for Children Exposed to Arsenic in Cold Climates (Based on Short-Term ADDs in Table 19 From SHEDS-Wood Document) . . . . . . . . . . . . . . . . . . . 5-11
Table 5-8. Probabilistic Short-Term MOE Distributions and Risk Levels for Children Exposed to Chromium (VI) in Warm Climate (Soil Ingestion Only) . . . . . . . . . . . . . . . . . . . . . . . . . . . . . . . . . . . . . . . . . . 5-12
Table 5-9. Probabilistic Short-Term MOE Distributions and Risk Levels for Children Exposed to Chromium (VI) in Cold Climate(Soil Ingestion Only) . . . . . . . . . . . . . . . . . . . . . . . . . . . . . . . . . . . . . . . . . . 5-13
Table 5-10. Arsenic Noncancer Short-Term MOEs for Pica Children in Warm Climate (Based on Short-Term ADDs from Table 33 in SHEDS-Wood) . . . . 5-15
iv
LIST OF TABLES (CONTINUED)
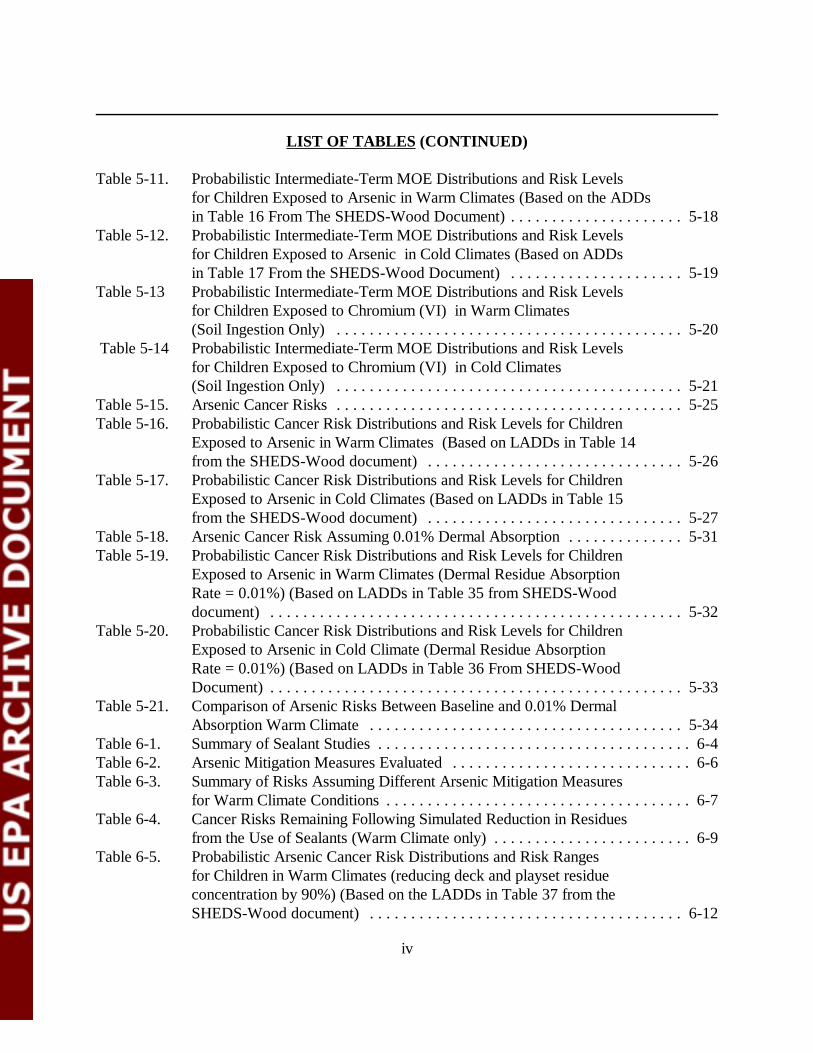
Table 5-11. Probabilistic Intermediate-Term MOE Distributions and Risk Levels for Children Exposed to Arsenic in Warm Climates (Based on the ADDs in Table 16 From The SHEDS-Wood Document) . . . . . . . . . . . . . . . . . . . . . 5-18
Table 5-12. Probabilistic Intermediate-Term MOE Distributions and Risk Levels for Children Exposed to Arsenic in Cold Climates (Based on ADDs in Table 17 From the SHEDS-Wood Document) . . . . . . . . . . . . . . . . . . . . . 5-19
Table 5-13 Probabilistic Intermediate-Term MOE Distributions and Risk Levels for Children Exposed to Chromium (VI) in Warm Climates (Soil Ingestion Only) . . . . . . . . . . . . . . . . . . . . . . . . . . . . . . . . . . . . . . . . . . 5-20
Table 5-14 Probabilistic Intermediate-Term MOE Distributions and Risk Levels for Children Exposed to Chromium (VI) in Cold Climates (Soil Ingestion Only) . . . . . . . . . . . . . . . . . . . . . . . . . . . . . . . . . . . . . . . . . . 5-21
Table 5-15. Arsenic Cancer Risks . . . . . . . . . . . . . . . . . . . . . . . . . . . . . . . . . . . . . . . . . . 5-25Table 5-16. Probabilistic Cancer Risk Distributions and Risk Levels for Children
Exposed to Arsenic in Warm Climates (Based on LADDs in Table 14 from the SHEDS-Wood document) . . . . . . . . . . . . . . . . . . . . . . . . . . . . . . . 5-26
Table 5-17. Probabilistic Cancer Risk Distributions and Risk Levels for Children Exposed to Arsenic in Cold Climates (Based on LADDs in Table 15 from the SHEDS-Wood document) . . . . . . . . . . . . . . . . . . . . . . . . . . . . . . . 5-27
Table 5-18. Arsenic Cancer Risk Assuming 0.01% Dermal Absorption . . . . . . . . . . . . . . 5-31Table 5-19. Probabilistic Cancer Risk Distributions and Risk Levels for Children
Exposed to Arsenic in Warm Climates (Dermal Residue Absorption Rate = 0.01%) (Based on LADDs in Table 35 from SHEDS-Wood document) . . . . . . . . . . . . . . . . . . . . . . . . . . . . . . . . . . . . . . . . . . . . . . . . . . 5-32
Table 5-20. Probabilistic Cancer Risk Distributions and Risk Levels for Children Exposed to Arsenic in Cold Climate (Dermal Residue Absorption Rate = 0.01%) (Based on LADDs in Table 36 From SHEDS-Wood Document) . . . . . . . . . . . . . . . . . . . . . . . . . . . . . . . . . . . . . . . . . . . . . . . . . . 5-33
Table 5-21. Comparison of Arsenic Risks Between Baseline and 0.01% Dermal Absorption Warm Climate . . . . . . . . . . . . . . . . . . . . . . . . . . . . . . . . . . . . . . 5-34
Table 6-1. Summary of Sealant Studies . . . . . . . . . . . . . . . . . . . . . . . . . . . . . . . . . . . . . . 6-4Table 6-2. Arsenic Mitigation Measures Evaluated . . . . . . . . . . . . . . . . . . . . . . . . . . . . . 6-6Table 6-3. Summary of Risks Assuming Different Arsenic Mitigation Measures
for Warm Climate Conditions . . . . . . . . . . . . . . . . . . . . . . . . . . . . . . . . . . . . . 6-7Table 6-4. Cancer Risks Remaining Following Simulated Reduction in Residues
from the Use of Sealants (Warm Climate only) . . . . . . . . . . . . . . . . . . . . . . . . 6-9Table 6-5. Probabilistic Arsenic Cancer Risk Distributions and Risk Ranges
for Children in Warm Climates (reducing deck and playset residue concentration by 90%) (Based on the LADDs in Table 37 from the SHEDS-Wood document) . . . . . . . . . . . . . . . . . . . . . . . . . . . . . . . . . . . . . . 6-12
v
LIST OF TABLES (CONTINUED)
Table 6-6. Probabilistic Arsenic Cancer Risk Distributions and Risk Ranges for Children (Reducing Deck and Playset Residue Concentration by 99.5% in Warm Climates (Based on LADDs in Table 38 from the SHEDS-Wood document) . . . . . . . . . . . . . . . . . . . . . . . . . . . . . . . . . . . . . . 6-13
Table 6-7. Cancer Risks Remaining Following Simulated Reductions from Hand Washing (Warm Climate Only) . . . . . . . . . . . . . . . . . . . . . . . . . . . . . . 6-14
Table 6-8. Probabilistic Arsenic Cancer Risk Distributions and Risk Ranges for Children in Warm Climates (Reducing Exposure by Washing Hands After Playing on Deck or Playset) (Based on LADDs in Table 39 from the SHEDS-Wood document) . . . . . . . . . . . . . . . . . . . . . . . . . . . . . . . 6-16
Table 6-9. Comparison of Cancer Risks from Combined Mitigation Measures at 10-6 and 10-5 Risk Levels . . . . . . . . . . . . . . . . . . . . . . . . . . . . . . . . . . . . . . 6-17
Table 6-10. Comparison of Total Risk to Residue Only Risk Under Different Mitigation Conditions (Playsets and Decks - Warm Climate) . . . . . . . . . . . . . 6-22
Table 6-11. Comparison of Mitigation Measures to Baseline at the 10-6 Risk Level (Warm Climate) . . . . . . . . . . . . . . . . . . . . . . . . . . . . . . . . . . . . . . . . . 6-25
vi
LIST OF FIGURES
Figure 1-1 Arsenic Cancer Risk at the 95% Percentile (Warm Climate) . . . . . . . . . . . . . . 1-9Figure 1-2 Arsenic Cancer Risk at the 50% Percentile (Warm Climate) . . . . . . . . . . . . . 1-10Figure 1-3 Comparison of Residue Only Risks for Playsets and Decks for
Warm Climate (Maximum Reduction, Moderate Reduction, Baseline) . . . . . 1-11Figure 5-1. A Cumulative Distribution Function (CDF) for Cancer Risk . . . . . . . . . . . . . . 5-2Figure 5-2. MOE of Short-term ADD for Children Exposed to Arsenic Dislodgeable
Residues and Contaminated Soil from Treated Wood Playsets and Residential Decks in Warm Climate (separated by children with and playset only) . . . . . . . . . . . . . . . . . . . . . . . . . . . . . . . . . . . . . . . . . . . . . . . . . . 5-8
Figure 5-3. MOE of Short-term ADD for Children Exposed to Arsenic Dislodgeable Residues and Contaminated Soil from Treated Wood Playsets and Residential Decks in Cold Climate (separated by children with and playset only) . . . . . . . . . . . . . . . . . . . . . . . . . . . . . . . . . . . . . . . . . . . . . . . . . . 5-9
Figure 5-4. MOE of Intermediate-term ADD for Children Exposed to Arsenic Dislodgeable Residues and Contaminated Soil from Treated Wood Playsets and Residential Decks in Warm Climate (separated by children with and playset only) . . . . . . . . . . . . . . . . . . . . . . . . . . . . . . . . . . . . . . . . . . 5-16
Figure 5-5. MOE of Intermediate-term ADD for Children Exposed to Arsenic Dislodgeable Residues and Contaminated Soil from Treated Wood Playsets and Residential Decks in Cold Climate (separated by children with and playset only) . . . . . . . . . . . . . . . . . . . . . . . . . . . . . . . . . . . . . . . . . . 5-17
Figure 5-6. Cancer Risk (Lifetime) for Children Exposed to Arsenic Dislodgeable Residues and Contaminated Soil from Treated Wood Playsets and Residential Decks in Warm Climate (separated by children with and playset only) . . . . . . . . . . . . . . . . . . . . . . . . . . . . . . . . . . . . . . . . . . . . . . 5-23
Figure 5-7. Cancer Risk (Lifetime) for Children Exposed to Arsenic Dislodgeable Residues and Contaminated Soil from Treated Wood Playsets and Residential Decks in Cold Climate (separated by children with and playset only) . . . . . . . . . . . . . . . . . . . . . . . . . . . . . . . . . . . . . . . . . . . . . . . . . 5-24
Figure 5-8. Comparison of Total Risks from Decks and Playsets for Warm Climate - No Mitigation . . . . . . . . . . . . . . . . . . . . . . . . . . . . . . . . . . . . . . . . 5-29
Figure 5-9. Comparison of Residue and Soil Total Exposures for Warm Climate - No Mitigation . . . . . . . . . . . . . . . . . . . . . . . . . . . . . . . . . . . . . . . . 5-30
Figure 5-10. Cancer Risk from Lifetime LADD for Children Exposed to Arsenic Dislodgeable Residues and Contaminated Soil from Treated Wood Playsets and Residential Decks in Warm Climate (Dermal Residue Absorption Rate = 0.01%) . . . . . . . . . . . . . . . . . . . . . . . . . . . . . . . . . . . . . . 5-35
vii
LIST OF FIGURES (CONTINUED)
Figure 5-11. Cancer Risk from Lifetime LADD for Children Exposed to Arsenic Dislodgeable Residues and Contaminated Soil from Treated Wood Playsets and Residential Decks in Cold Climate (Dermal Residue Absorption Rate = 0.01%) . . . . . . . . . . . . . . . . . . . . . . . . . . . . . . . . . . . . . . 5-36
Figure 6-1 Cancer Risk from Lifetime LADD for Children Exposed to Arsenic Dislodgeable Residues and Contaminated Soil from Treated Wood Playsets and Residential Decks in Warm Climate (Reducing Deck and Playset Residue Concentration by 90%) . . . . . . . . . . . . . . . . . . . . . . . . . 6-10
Figure 6-2 Cancer Risk from Lifetime LADD for Children Exposed to Arsenic Dislodgeable Residues and Contaminated Soil from Treated Wood Playsets and Residential Decks in Warm Climate (Reducing Deck and Playset Residue Concentration by 99.5%) . . . . . . . . . . . . . . . . . . . . . . . 6-11
Figure 6-3 Cancer Risk from Lifetime LADD for Children Exposed to Arsenic Dislodgeable Residues and Contaminated Soil from Treated Wood Playsets and Residential Decks in Warm Climate (Reducing Deck and Playset Residue Concentration by Washing Hands after Playing on Deck or Playset) . . . . . . . . . . . . . . . . . . . . . . . . . . . . . . . . . . . . . 6-15
Figure 6-4 Comparison of Residue & Soil Total Arsenic Risks for Warm Climate99.5% Reduction . . . . . . . . . . . . . . . . . . . . . . . . . . . . . . . . . . . . . . . . . . . . . 6-19
Figure 6-5 Comparison of Residue & Soil Total Arsenic Risks for Warm Climate90% Reduction . . . . . . . . . . . . . . . . . . . . . . . . . . . . . . . . . . . . . . . . . . . . . . . 6-20
Figure 6-6 Comparison of Residue and Soil Arsenic Risks for Warm Climate99.5% Reduction . . . . . . . . . . . . . . . . . . . . . . . . . . . . . . . . . . . . . . . . . . . . . 6-21
Figure 6-7 Comparison of Residue and Soil Arsenic Risks for Warm Climate90% Reduction . . . . . . . . . . . . . . . . . . . . . . . . . . . . . . . . . . . . . . . . . . . . . . . 6-23
viii
APPENDICES
Appendix A Hazard Identification and Toxicology Endpoint Selection for Inorganic Arsenic and Inorganic Chromium
Appendix B Risk SpreadsheetsAppendix C Comparison of Total Risks to Risk Reduction ImpactsAppendix D Comparison of Residue and Soil RiskAppendix E Summary of Relative Bioavailability StudiesAppendix F SAP Report No. 2001-12, FIFRA Scientific Advisory Panel MeetingAppendix G Effect of Hand Washing on Risks from Exposure to Residues
ix
AUTHORS, CONTRIBUTORS, AND REVIEWERS
The National Exposure Research Laboratory of Exposure Assessment and RiskAssessment, Office of Research and Development, and the Antimicrobials Division, Office ofPesticide Programs, was responsible for the preparation of this document. A number ofindividuals have reviewed and/or have been contributing authors of this report including:
The Probabilistic Exposure Assessment portion of this report was developed bythe following individuals:
V.G. Zartarian1, J. Xue1, H. Özkaynak1, W. Dang2
U.S. Environmental Protection Agency1 Office of Research and Development, National Exposure Research Laboratory2 Office of Pesticide Programs, Antimicrobials Division
G. Glen, L. Smith, C. StallingsManTech Environmental Technology, Inc.
The Probabilistic Risk Assessment portion of this report was developed by thefollowing individuals:
W. Dang, J. ChenU.S. Environmental Protection AgencyOffice of Pesticide Programs, Antimicrobials Division
N.Mottl, L.Phillips, P.Wood, S.McCarthy, R.Lee, M. Helmke, M. Nelson, and K.CoonVersar, Inc.
For General Information Related to this Document Contact:
W. DangU.S. Environmental Protection AgencyOffice of Pesticide Programs, Antimicrobials DivisionMailcode 7510C1200 Pennsylvania Avenue, N.W.Washington, D.C. 20460
x
Acknowledgments
We would like to thank Jack Housenger, William Jordan, Najm Shamin, Timothy Leighton, NormCook, Nancy Chiu, Doreen Aviado, Siroos Mostaghimi, Tim McMahon, David Miller, StevenNako, Greg Schweer, Brenda Foos, Andrew Schulman, Susan Griffin, Timothy Barry, HermanGibb, Valerie Zartarian, Jianping Xue, Haluk Özkaynak, Francis Suhre, Elizabeth Margosches,Deborah Smegal and Bart Suhre of the U.S. Environmental Protection Agency, for assisting withselection of model inputs and reviewing the preliminary draft report. We would also like to thankthe Consumer Product Safety Commission (CPSC), Michael Dong from CDPR of CaliforniaEPA, and Cathy Campbell, John Worgan, Connie Moase, from PMRA of Health Canada, GrahamGlen from ManTech Environmental Technology, Inc. for reviewing the preliminary drafts andproviding valuable comments.
We would also like to thank Doreen Aviado, Norm Cook, Najm Shamin, Steve Malish, andSiroos Mostaghimi of Antimicrobials Division and Debbie Edwards, Director of Registration ofOPP, US EPA for their support, drafting and reviewing the background documents in 2001.

xi
PREFACE
The National Exposure Research Laboratory, EPA’s Office of Research and Developmentand the Antimicrobials Division of EPA’s Office of Pesticide Program has prepared this documentto address exposures and risks to children from contact with Chromated Copper Arsenate (CCA)-treated wood in playsets and decks, and CCA-contaminated soil around these structures. InOctober 2001, OPP presented a proposed deterministic exposure assessment approach specific toCCA to the FIFRA (Federal Insecticide, Fungicide, and Rodenticide Act) Scientific AdvisoryPanel (SAP). One of the primary SAP recommendations was to use a probabilistic model topredict variability of absorbed doses for the population of interest. This document provides aprobabilistic risk assessment based on exposure results from the model as recommended by theSAP.
In general, a risk assessment should include hazard identification, hazard assessment,exposure assessment, and risk characterization. In this document, OPP collaborated with ORD todevelop comprehensive state-of-the-art techniques to complete a complex risk analysis of childrenexposed to CCA-treated wood at residential sites.
This report fulfills the following EPA basic guiding principles for assessing risk to CCA: (1) identifying the population (i.e., children) exposed to CCA-treated playsets and decks as part ofthe “problem formulation” phase, (2) gathering sufficient information to develop and model theexposures, (3) conducting sensitivity analysis, (4) discussing the correlation or dependenciesbetween the input variables, (5) detailing information for each input and output distribution,including information on the stability of central tendency and higher end values, (6) comparing theresults of deterministic and probabilistic assessments, and (7) using the best available toxicityinformation to combine with the exposure estimates to calculate risks. The current policy,Conditions for Acceptance and associated principles are not intended to apply to dose-responseevaluations for human health risk assessments until this application has been studied further(Agency Policy Document, 5/15/1997). Currently, OPP does not have the Guidance to performthe probabilistic analysis of toxicity endpoints.
Three steps were used by OPP to complete this document. The first step used adeterministic risk assessment approach. The second used a custom-designed probabilistic modelfor wood preservative use exposure scenarios. The third step was the risk analysis based on theexposure model outputs and the toxicity endpoints recommended by the SAP and other EPAoffices (OW, ORD, OCHP, Superfund and OPP).
This report provides the results of a study that used the output of (1) a probabilisticexposure assessment for children who come into contact with CCA-treated playsets and decksbased on the Stochastic Human Exposure and Dose Simulation Model for the Wood PreservativeExposure Scenario (SHEDS-Wood) developed by the ORD; and (2) the toxicity data for arsenic

xii
and chromium to develop probabilistic risk assessment for children who contact CCA-treatedplaysets and decks.
There are several other risk assessment reports related to children’s exposure from CCA-treated playsets and decks. These reports have been developed by researchers outside ofEPA/OPP. Additionally, research is ongoing that focuses on dislodgeable arsenic surface residuesand risk reduction options based on the application of sealants. However, this assessment usesstate-of-the-art analyses and is different from previous risk assessments in the available literature.

xiii
LIST OF ACRONYMS
ACC American Chemistry CouncilAD Antimicrobials DivisionADD Average Daily DoseAPVMA Australian Pesticides & Veterinary Medicines AuthorityAr (V) Arsenic (V)As ArsenicATSDR Agency for Toxics Substances and Disease RegistryAWPA American Wood-Preserver’s AssociationAWPI American Wood Preservers InstituteBF Bioavailability FactorCAP Consumer Awareness ProgramCCA Chromated Copper ArsenateCCA-C CCA Type CCDF Cumulative Density FunctionCDHS California Department of Health ServicesCE Cumulative ExposureCFA Consumer Federation of AmericaCHAD Consolidated Human Activity DatabaseCPSC Consumer Product Safety CommissionCr ChromiumCr(VI) Chromium (VI)Cr(III) Chromium (III)CSIS Consumer Safety Information SheetCu CopperDA Dislodgeable ArsenicDEC Department of Environmental ConservationE New ExposureEC European CommissionEFH Exposure Factors HandbookEMRA Environmental Risk Management AuthorityEPA Environmental Protection AgencyERDEM Exposure Related Dose Estimation ModelEWG Environmental Working GroupFIFRA Federal Insecticide, Fungicide, Rodenticide ActFR Federal RegisterFQPA Food Quality Protection Act of 1996GI GastrointestinalGM Geometric MeanGSD Geometric Standard DeviationHBN Healthy Building Network

xiv
HED Health Effects Division, OPPHIARC Hazard Identification Assessment Review CommitteeIPEMA International Play Equipment Manufacturers AssociationIRIS Integrated Risk Information SystemLADD Lifetime Average Daily DoseLD50 Lethal Dose, 50% KillLOAEL Lowest-Observed-Adverse-Effect LevelMCA Monte Carlo AnalysisMDEP Maine Department of Environmental ProtectionMOE Margin of ExposureMOEcalc Calculated MOENAS National Academy of SciencesNCEA National Center For Exposure AssessmentNCP National Contingency PlanNERL National Exposure Research LaboratoryNHANES National Health and Nutrition Examination SurveyNHAPS National Human Activity Pattern SurveyNOAEL No-Observed-Adverse-Effect LevelNOIC Notice of Intent to CancelNRC National Resource CouncilOPP Office of Pesticide ProgramsOPPTS Office of Prevention, Pesticides, and Toxic SubstancesORD Office of Research and DevelopmentPBPK Physiologically-Based Pharmacokineticpcf Pounds per cubic footPD Position DocumentPDF Probability Density FunctionPMRA Pest Management Regulatory AgencyPND Preliminary Notice of Determinationppm Parts per millionPr ProbabilityPRA Probabilistic Risk AssessmentQ1* Slope FactorRAG Risk Assessment GuidelineRB Relative BioavailabilityRED Reregistration Eligibility DecisionRME Reasonably Maximum Exposed IndividualRPAR Notice of Rebuttable Presumption Against Registration and Continued
RegistrationRTI Research Triangle InstituteSA Surface AreaSAP Science Advisory Panel
xv
SCS Soil Contact SurveySCTEE Scientific Committee on Toxicity, Ecotoxicity and the EnvironmentSF Slope FactorSHEDS Stochastic Human Exposure and Dose Simulation ModelSHEDS-Wood Stochastic Human Exposure and Dose Simulation Model for the Wood
Preservative ScenarioSOPs Standard Operating ProceduresTC (Dermal) Transfer CoefficientTE (Dermal) Transfer EfficiencyUSDA U.S. Department of AgricultureUSPIRG U.S. Public Interest Research Group
1-1
1.0 EXECUTIVE SUMMARY
The U.S. Environmental Protection Agency’s (EPA) Office of Pesticide Programs (OPP)is aware of increased concerns raised by the general public, municipal and state governments, andstate/federal regulatory agencies regarding the safety of young children contacting arsenic andchromium residues while playing on Chromated Copper Arsenate (CCA) treated wood playground structures and decks. Because of this concern, OPP’s Antimicrobials Division (AD),with the recommendation of the Federal Insecticide, Fungicide, Rodenticide Act (FIFRA)’sScientific Advisory Panel (SAP) and the assistance of the Office of Research and Development(ORD), has conducted a probabilistic exposure assessment entitled the Stochastic HumanExposure and Dose Simulation Model for the Wood Preservative Exposure Scenario (SHEDS-Wood). SHEDS-Wood provides exposures reported as average daily doses (ADDs) and lifetimeaverage daily doses (LADDs). Children’s exposures may occur through touching CCA-treatedwood and CCA-contaminated soil near treated wood structures, mouthing hands after touchingCCA-treated wood, and eating CCA-contaminated soil. Since EPA has determined that thearsenic and chromium components of CCA pose the most significant toxicity concerns incomparison to copper, which is not a recognized or suspected carcinogen, the Agency focused onevaluating potential adverse short-term (1-day to 1-month), intermediate-term (1 to 6 months)noncancer exposure doses for total arsenic and chromium as Cr(VI), and lifetime average cancerexposure doses from total arsenic. Some of the key terms used in the SHEDS-Wood exposurereport are summarized in Table 1-1.
OPP developed a preliminary deterministic risk assessment (Internal Draft Only) on May30, 2001 (U.S. EPA, 2001a). In this internal draft, OPP reported on a preliminary exposure andrisk assessment on the chromium and arsenic components of CCA to determine the potentialhealth risks to children from contact with CCA-treated wood playground structures and CCA-contaminated soil resulting from use of CCA on lumber used in the fabrication of playgroundequipment and related structures commonly found in residential settings. The U.S. EPA (2001a)internal draft report was later revised and incorporated as a preliminary exposure assessment onSeptember 27, 2001 (U.S. EPA, 2001b), which was later reviewed by the FIFRA SAP (U.S.EPA, 2001c). The exposure factors used in the U.S. EPA (2001a) assessment were primarilyconservative upper bound estimates for short- and intermediate-term noncancer risk. The mean,or central tendency exposure factors were used for cancer risk.. The results of the U.S. EPA(2001a) arsenic cancer risk assessment were comparable to the upper bound estimates in thisprobabilistic risk assessment. Using an initial oral arsenic cancer slope factor (Q1*) of 1.5(mg/kg/day)-1, U.S. EPA (2001a) reported a cancer risk of 2.0E-4 which would be equivalent to5.0E-4 using the Q1* of 3.67 (mg/kg/day) -1 identified in this report. The arsenic probabilisticcancer risks presented in this report were 1.4E-4 for the 95 th percentile, 2.3E-5 for the median,and 4.2E-5 for the mean. The results for the means in the probabilistic assessment are similar tothe 75th percentile for several exposure scenarios.

1-2
Table 1-1. Definitions of Key Terms Used in the SHEDS-Wood Risk Assessment
Key Term Definition
Population OPP’s primary population of interest for this assessment were children in the United States who frequently contact CCA-treated wood residuesand/or CCA-containing soil from public playsets (e.g., at a playground, a school, a daycare center). Children playing on residential playsetswere the secondary focus. SHEDS-Wood also examined a subset of these children who contact CCA-treated wood residues and/or CCA-containing soil from residential playsets and/or residential decks (i.e., at the child’s own home or at another home). Results from both groups ofchildren (those who contact public playsets only, and those who contact public and residential playsets) were presented in this report.
The focus of this assessment was on estimating the risk to children from contact with various sources of CCA-treated wood. The primarypopulation considered in this assessment was children with public playsets. EPA believes that more young children are exposed to CCA-treated public playsets than residential playsets because children spend more time on public playsets at schools and daycare centers. EPA alsobelieves that children playing on public playsets would affect a larger population of children. More data were available for public playsets thanresidential playsets. Further, CPSC and other groups have also focused their review on children exposed to public playsets.
Warm vs.Cold Scenarios
The SHEDS-Wood report referred to separate ‘warm climate’ and ‘cold climate’ scenarios. However, the Consolidated Human ActivityDatabase (CHAD) diaries that were used in SHEDS-Wood were missing specific state locator information. Instead of using geographicallocations, ‘warm climate’ and ‘cold climate’ were simulated by modifying inputs such as surface area of unclothed skin and time spent onplaysets and decks. See the text and tables (e.g., Table 12) of Zartarian et al. (2003) for more details regarding the assumptions for warm vs.cold climates.
With and WithoutDecks
With or without decks was used to indicate whether or not the population of children examined in the assessment had a residential deck or not.The term “with deck” was used to indicate that a child was exposed to a residential deck (i.e., at the child’s own home or at another home) anda playset. The term “without decks” was used to indicate that a child was exposed to a playset only (Zartarian et al., 2003).
Sealant (Moderateand MaximumReduction)
Exposure reductions from sealants was assessed in SHEDS-Wood using two assumed reduction levels: moderate (90% residue reduction) andmaximum (99.5% residue reduction). The use of the sealants reduced the arsenic residue concentrations which resulted in a correspondingreduction in arsenic exposure. EPA derived the assumed reduction estimates based upon the available literature on sealants and the commentsprovided by the FIFRA SAP in their review of sealant data (see Appendix F for more details).
Hand Washing Hand washing was considered for all the modeled scenarios in SHEDS-Wood. Several different input distributions were used for hand washingevents per day, hand washing removal, etc. In addition, a special analysis was simulated in SHEDS-Wood to estimate the exposure after achild washes his or her hands after playing on a playset or deck. In addition, exposures were modeled using hand washing in combination witha moderate reduction in residues because of the use of a sealant and hand washing in combination with a maximum reduction in residuesbecause of the use of a sealant.
Time Periods For the CCA assessment presented in this report, three exposure time periods were considered: short-term (represented in SHEDS-Wood by a15 day averaging time; 1 day to 1 month), intermediate-term (represented in SHEDS-Wood by a 90 day averaging time; 1 to 6 months), andlifetime (6 years exposure over a 75-year lifetime).
Exposure Pathways There were eight primary exposure pathways considered in SHEDS-Wood: dermal soil contact near decks; dermal residue contact from decks;soil ingestion near decks; residue ingestion from decks (via the wood-to-hand-to-mouth pathway); dermal soil contact near playsets; dermalresidue contact from playsets; soil ingestion near playsets; and residue ingestion from playsets (via the wood-to-hand-to-mouth pathway). Dermal exposure was also computed separately for hands and body, and results were aggregated for decks and playsets, aswell as over all pathways.
As pointed out by CPSC (2003a), it is possible in extreme cases that pre-schoolers may occasionally directly mouth portions of a wood playstructure, although this behavior is not likely to be frequent for most playground users. Inhalation exposure to particulates for children that arepresent during sandblasting of CCA-treated surfaces would also be another potential pathway. These less common pathways were not includedinto the CCA risk assessment. Other potential sources of exposure not included in this assessment or other related CCA risk assessmentsinclude child exposures to picnic tables, porch railings and uprights, contact with pets and objects that have contacted treated wood, and CCAresidues and soil that are brought indoors from outside.
Soil vs. ResidueExposure
SHEDS-Wood examined ingestion and dermal exposure routes for children from contact with CCA-contaminated soil and wood residues. Soilexposure refers to dermal contact with CCA-contaminated soil and soil ingestion. Residue exposure refers to dermal contact with CCA-treatedwood and ingestion for residues from CCA-treated wood via hand-to-mouth contact.
1-3
After review of the September 27, 2001 deterministic exposure assessment, SAPrecommended that a probabilistic assessment be developed to examine the exposure scenariosU.S. EPA (2001c). In 2002, SHEDS-Wood probabilistic model was presented to the SAP forreview and recommendations from the panel. After incorporation of comments from the SAP, adraft final report was prepared on September 25, 2003. The probabilistic exposure assessmentpresent results for absorbed doses (both ADD and LADDs). The results of the draft finalSHEDS-Wood probabilistic exposure assessment were used in this risk assessment. It should benoted, however, that the existing policy, Agency Policy Document (5/15/97), indicated that the“Conditions for acceptance and associated principles are not intended to apply to dose-responseevaluations for human health risk assessments until this application has been studied further”. Currently, OPP does not have the Guidance to perform the probabilistic analysis of toxicityendpoints. Some of the major findings from the probabilistic assessment include:
? Children who contact playsets only were found to have lower absorbed doses thanchildren who contact both playsets and decks by a factor of 2.
? Warm climate bounding scenarios yielded higher results than cold climatescenarios.
? For children who contact both playsets and decks, the mean arsenic LADDs werereduced by a factor of 14 and median arsenic LADDs were reduced by a factor of17 when residue concentrations were reduced by 99.5%.
? For children who contact both playsets and decks, the total mean and medianarsenic LADDs were both reduced by a factor of 1.3 when hand washing wasassumed to occur following exposure.
? Children with pica soil ingestion behavior had about 2-3 times higher absorbedmean doses (totaled over all pathways considered) of arsenic than non-picachildren from CCA-treated playsets and decks. The risks estimated for childrenwith pica soil ingestion behavior were higher than for non-pica children.
? Assuming a mean arsenic dermal absorption rate of 0.01% rather than 3% forchildren who contact playsets and decks in warm climates, the mean and medianarsenic LADDs were 30% and 26% lower, respectively.
? The most significant exposure route for the population of interest for mostscenarios was residue ingestion via hand-to-mouth contact, followed by dermalcontact, soil ingestion, and dermal soil contact.
Risks that arise from the predicted exposures were quantified in this risk assessment. Thisreport follows OPP guidance. This risk assessment includes a background chapter on issuesrelated to children’s exposure to CCA-treated wood and the reasons that EPA conducted a non-dietary probabilistic assessment (see Chapter 2.0); describes the arsenic and chromium exposuresgenerated by the SHEDS-Wood model (see Chapter 3.0); summarizes the arsenic and chromiumtoxicity endpoints in a hazard assessment (see Chapter 4.0); characterizes the risks for theexposures generated by the SHEDS-Wood model (see Chapter 5.0); characterizes the reduction
1 Exposure durations modeled were short-term (1 day to 1 month), intermediate-term (1to 6 months), and lifetime (6 years averaged over 75 years).
1-4
impacts for the exposures generated by the SHEDS-Wood model (see Chapter 6.0); and discussesthe uncertainty, strengths, and limitations associated with this risk assessment (see Chapter 7.0). In addition, the following appendices are provided:
Appendix A Hazard Identification and Toxicology Endpoint Selection for Inorganic Arsenicand Inorganic Chromium
Appendix B Risk SpreadsheetsAppendix C Comparison of Total Risks to Risk Reduction ImpactsAppendix D Comparison of Residue and Soil RiskAppendix E Summary of Relative Bioavailability StudiesAppendix F SAP Report No. 2001-12, FIFRA Scientific Advisory Panel MeetingAppendix G Effects of Hand Washing on Risks from Exposure to Residues
The goal of this risk assessment is to present the SAP with the calculated arsenic cancerrisks to children (age 1-6) exposed to CCA-treated playsets and decks using a probabilistic riskanalysis. It also identifies methods (e.g., sealants and hand washing) which can reduce the arseniccancer risks to children. However, there is no concluding statement regarding the percentiles ofthe distribution or point estimates (e.g., mean , 50th , 90th , 95th, etc) at which risk managementdecisions will be made. OPP intends to provide recommendations on how risk managers shouldinterpret the results of this risk assessment, after receiving technical comments from the FIFRASAP on evaluating probabilistic risk distributions. OPP will carefully consider the FIFRA SAP’scomments on this issue.
Noncancer Margins of Exposure (MOEs) and cancer risks to children exposed to CCA-treated playsets and decks and/or CCA-containing soil from these playsets and decks werecalculated from doses generated using OPP/ORD’s SHEDS-Wood model for chromium andarsenic. The exposure assessment considered children, ages 1 to 6 years old.1 Risks due topossible exposure to Cr(VI) for the soil ingestion route were estimated, conservatively, byassuming 10% of total chromium was present as Cr(VI). For chromium, as Cr(VI), the toxicityvalue used was 0.5 mg/kg/day (a NOAEL) for noncancer effects. The toxicity value for totalarsenic used in this assessment were 3.67 (mg/kg/day)-1 (slope factor) for cancer effects and 0.05mg/kg/day (a LOAEL) for noncancer effects. The Agency is currently consideringrecommendations by the National Research Council (NRC) and the arsenic slope factor maychange in the final version of this risk assessment. The arsenic carcinogenic risk is a conservativeestimate of the risk because the cancer slope factor is characterized as a upper-bound estimate. Therefore, the true risks to humans, while not identifiable, may not be likely to exceed the upper-bound estimates and in fact may be lower. Noncancer risks were evaluated against OPP’s
1-5
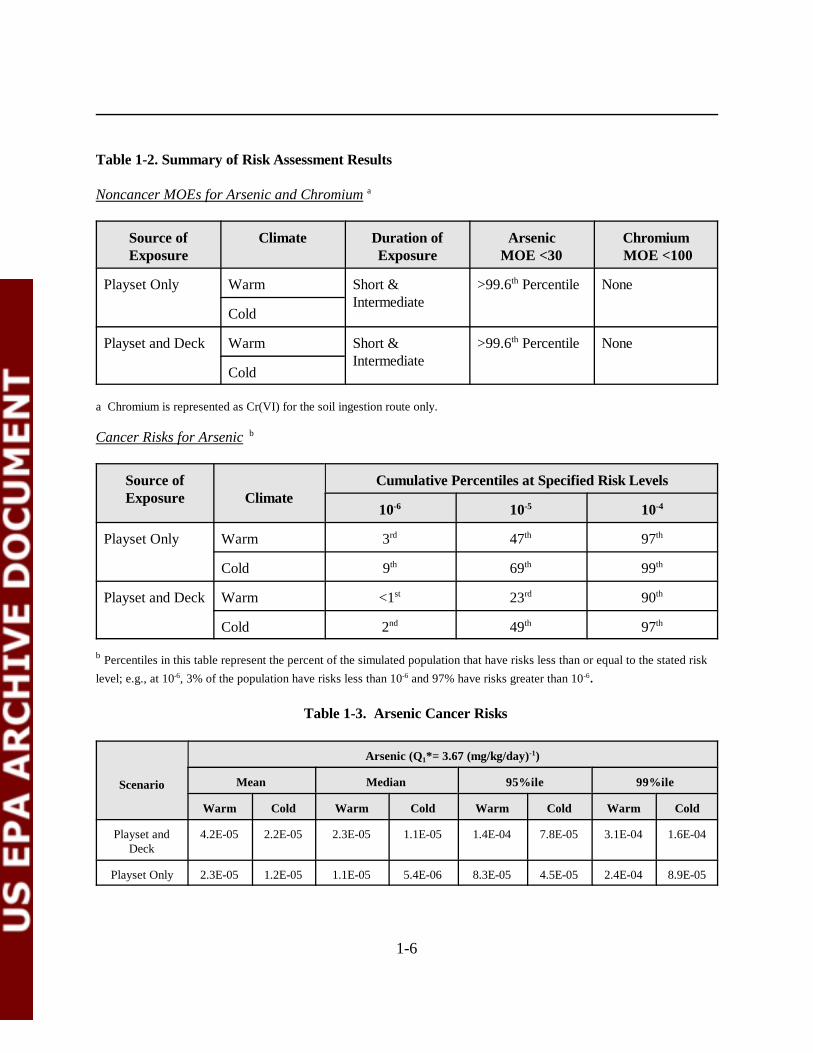
guidance for MOE values for arsenic and chromium for short-term and intermediate-termexposure durations. Lifetime cancer risks from arsenic exposure were compared to EPA/OPP’srisk range of 10-6 to 10-4. Risks were found to be greater under warm climate conditions thancold climate conditions (MOEs were lower for warm climates). Exposure to playsets and deckshad higher risks than exposure to playsets alone. Noncancer MOEs for arsenic were found to beabove EPA/OPP’s guidance MOE of 30 for all exposures, except at the extreme upper end of thedistribution. Cr(VI) risks were found to be above the guidance MOE of 100 for all doses. Thesenoncancer MOEs are summarized in the upper portion of Table 1-2. Cancer risks exceeded theupper bound of the risk range, 10 -4, at cumulative percentiles ranging from the 90th for warmclimate conditions and exposure to CCA-treated playsets and decks, to the 99th for cold climateconditions and exposure to playsets only. Across all exposure scenarios, carcinogenic risks werefound to be less than 10-6 at cumulative percentiles of the 9th and lower, meaning at least 91% ofthe simulated population had risks above 10-6. The lower portion of Table 1-2 presents thecumulative percentiles at the three levels of EPA’s risk range.
Table 1-3 presents the arsenic cancer risks from four points on the cumulative probabilitycurve: mean, median, 95th percentile, and 99th percentile. Risks at the mean and median werefound to be in the range of 10 -5 to 10-6. At the 95th percentile, the risk level for exposure to decksand playsets under warm climate conditions was at 10-4. Risk levels for other conditions ofexposure at this percentile ranged from approximately 4 x 10⁻⁵ to 8 x 10⁻⁵.
The influence of the dermal absorption factor was evaluated. Baseline risks weredetermined using a dermal absorption factor of 2 to 3%. Risk levels were also calculated usingthe lower arsenic dermal absorption factor of 0.01%. Changing the dermal absorption factor byapproximately two orders of magnitude reduced risk by 26% to 47%, depending on the exposurescenario and the cumulative percentile of interest.
An analysis comparing the arsenic risks from soil exposure versus residue exposure (i.e.,contact with CCA treated wood surfaces only) was conducted for both sources of exposure:playsets alone and playsets with decks. The estimated risks should be viewed as approximations,however, because residue and soil risks were summed across routes at the quartile level and thisincurs inaccuracies. Residue risks were found to be greater than soil risks. For contact withplaysets only, this difference ranged from a factor of approximately 7 at the 50th percentile to 10at the 99th percentile. Differences were larger for playsets and decks. At the 50th percentile,residue risk for playset and deck exposure was slightly greater than 10-5, and approximately 10-4 atthe 95th percentile. Soil only risk for both playset only exposure, and playset and deck exposureexceeded 10-5 at the 95th percentile.
1-6
Table 1-2. Summary of Risk Assessment Results
Noncancer MOEs for Arsenic and Chromium a
Source ofExposure
Climate Duration ofExposure
ArsenicMOE <30
Chromium MOE <100
Playset Only Warm Short &Intermediate
>99.6th Percentile None
Cold
Playset and Deck Warm Short &Intermediate
>99.6th Percentile None
Cold
a Chromium is represented as Cr(VI) for the soil ingestion route only.
Cancer Risks for Arsenic b
Source ofExposure Climate
Cumulative Percentiles at Specified Risk Levels
10-6 10-5 10-4
Playset Only Warm 3rd 47th 97th
Cold 9th 69th 99th
Playset and Deck Warm <1st 23rd 90th
Cold 2nd 49th 97th
b Percentiles in this table represent the percent of the simulated population that have risks less than or equal to the stated risklevel; e.g., at 10-6, 3% of the population have risks less than 10-6 and 97% have risks greater than 10-6.
Table 1-3. Arsenic Cancer Risks
Scenario
Arsenic (Q1*= 3.67 (mg/kg/day)-1)
Mean Median 95%ile 99%ile
Warm Cold Warm Cold Warm Cold Warm Cold
Playset andDeck
4.2E-05 2.2E-05 2.3E-05 1.1E-05 1.4E-04 7.8E-05 3.1E-04 1.6E-04
Playset Only 2.3E-05 1.2E-05 1.1E-05 5.4E-06 8.3E-05 4.5E-05 2.4E-04 8.9E-05

1-7
In 2001, the FIFRA SAP recommended that additional research was needed to evaluatethe performance and efficacy of different brands of coatings. EPA recently completed theprotocol to begin additional research on the effectiveness of sealants on weathered CCA-treatedwood. In the SHEDS-Wood exposure assessment, the concentration of wood surface residuewas considered as the key variable based on the sensitivity analysis in the SHEDS-Wood exposurereport. Therefore, using the existing data from Stilwell (1998) and CDHS (1987) (see Chapter6), EPA assumed two reduction levels: moderate (90% residue reduction) and maximum (99.5%residue reduction) to assess reductions in exposure, and thus risk, based on the use of sealants.
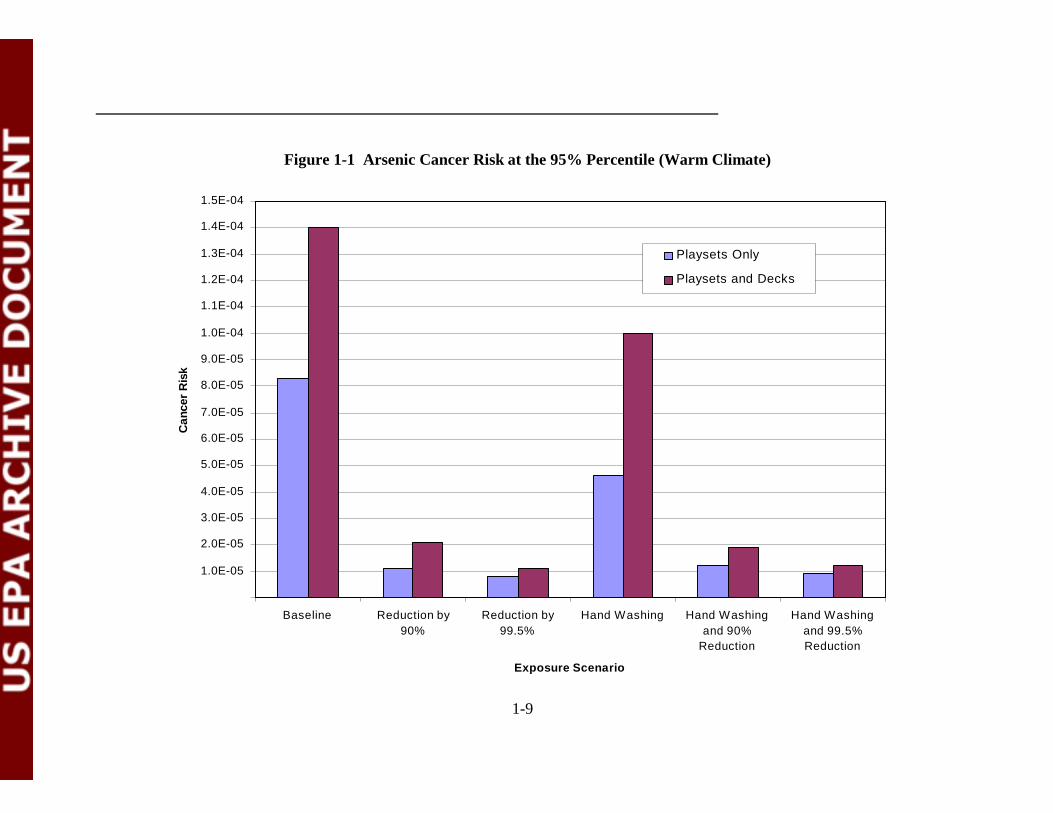
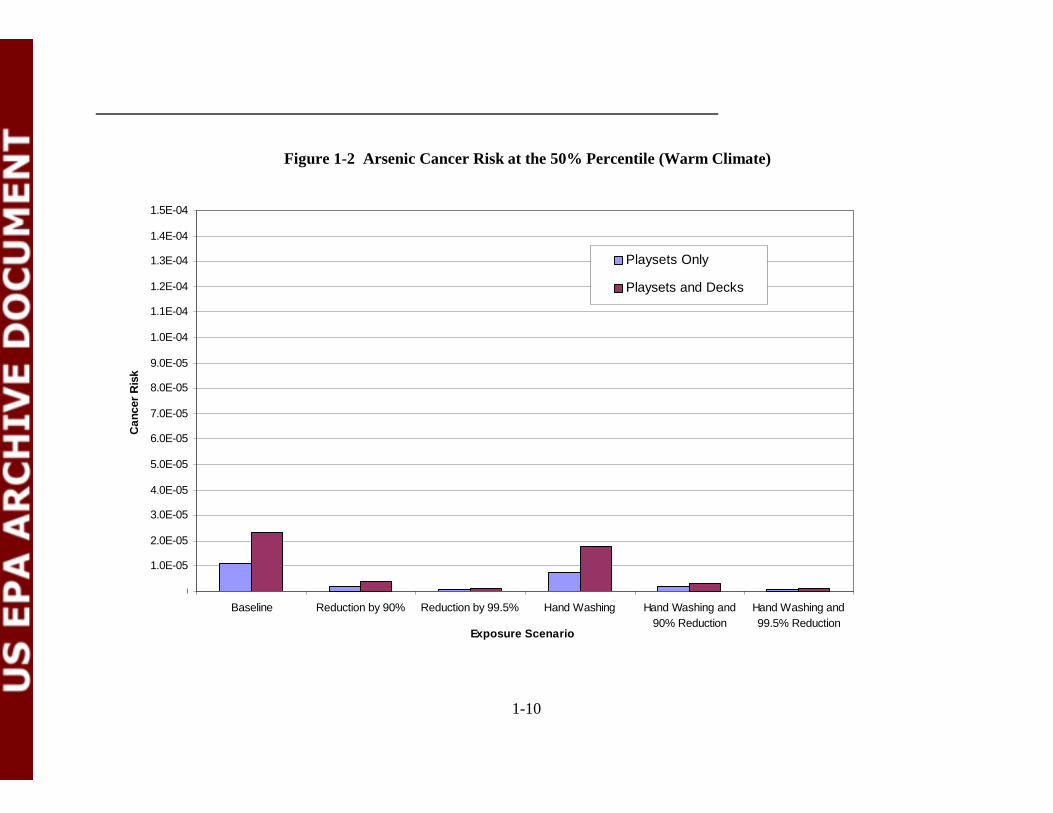
Different mitigation measures to reduce exposure to arsenic-containing residues and, thusrisk, were evaluated. Many of the recommendations to reduce arsenic concentrations are based onthe activities of the homeowner and can only be considered guidance. The SHEDS-Wood modelquantified exposures based on reduction in the residue concentration resulting from the use ofsealants and/or hand washing. No reduction in soil exposure was considered as part of thesemitigation simulations. Although soil concentrations may be reduced over time with the use ofsealants, it was conservatively assumed that soil concentrations were the same as under baselineconditions. Results of five different mitigation conditions are summarized in this report. Two ofthe mitigation conditions simulated the effect of a hypothetical sealant on reducing exposure todislodgeable residues. For moderately effective sealant conditions, the residue concentration wasassumed to be reduced by 90%; for maximally effective sealant conditions, residue concentrationwas assumed to be reduced by 99.5%. The other type of mitigation measure simulated wasincreasing the frequency of hand washing. This was considered alone and in combination with thesealant conditions. These different mitigation measures were evaluated for the warm climatecondition only, as that had the greater exposure and, thus, risk. The effect of reducing risk wasconsidered at the 10-6 risk level. Increasing the frequency of hand washing alone or incombination with sealants had a minimal effect compared to no mitigation on the cumulativepercentile at the 10-6 risk level. Note that although hand washing may not have had a significantimpact on total risk from both (i.e., from both soil and residues), it did have a significant impacton the dermal and oral routes from the surface residue pathways. The largest change was for themaximum reduction assumption for contact with playsets only under warm climate conditions,where the 10-6 risk level was at the 57th percentile compared to the 3rd percentile at baseline. Table 1-4 compares the cumulative percentiles at the three risk levels for the various mitigationmeasures considered. Figure 1-1 shows a comparison of carcinogenic risks at the 95th percentilefor baseline to the five different mitigation conditions described. Figure 1-2 shows the samecomparison across baseline and mitigation conditions, but for the 50th percentile.
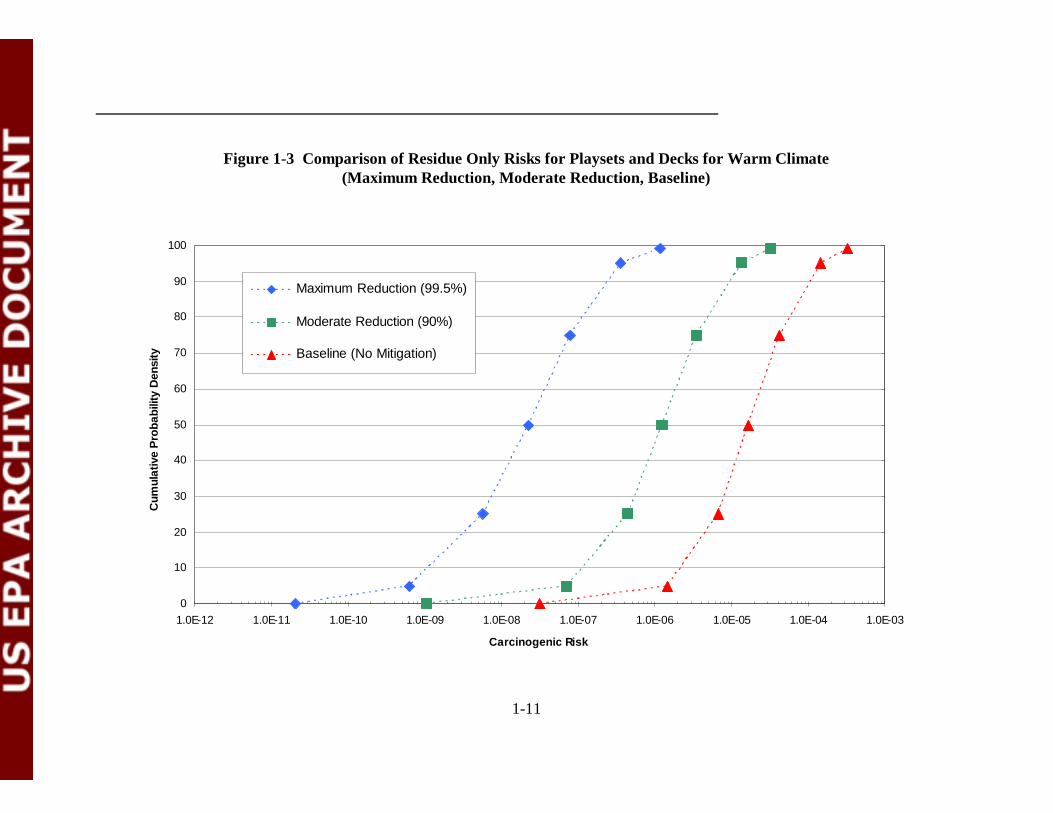
Figure 1-3 compares the effects of the residue mitigation measures to baseline conditionsfor playset and decks exposure. This plot shows the approximate residue only risk for themaximum and moderate reduction in residue concentration, and baseline conditions. Under themaximum reduction assumption, residue risks were decreased by over 2 orders of magnitude atthe 95th percentile and by approximately 3 orders of magnitude at the 50th percentile.

1-8
Table 1-4. Summary of Arsenic Risks Assuming Different Mitigation Measures for Warm Climate Conditions
Mitigation MeasureCumulative Percentiles at Specified Risk LevelsRisk Level of
10-6Risk Level of
10-5Risk Level of
10-4
Playset Only1. Sealant- moderate reduction 27th 94th >99th
2. Sealant – maximum reduction 57th 97th >99th
3. Hand washing 5th 59th >99th
4. Sealant-moderate + hand washing 28th 92nd >99th
5. Sealant-maximum + hand washing 58th 96th >99th
6. Baseline 3rd 47th 97th
Playset and Deck1. Sealant-moderate reduction 10th 80th >99th
2. Sealant-maximum reduction 42th 94th >99th
3. Hand washing <1st 28th 95th
4. Sealant-moderate + hand washing 10th 84th >99th
5. Sealant-maximum + hand washing 44th 93rd >99th
6. Baseline <1st 23rd 90th
Note: The baseline scenario includes a certain amount of hand washing. Hand washing, as a mitigation scenario, increases thefrequency of this activity over baseline. See Appendix G for more information on hand washing.
1-9
0.0E+00
1.0E-05
2.0E-05
3.0E-05
4.0E-05
5.0E-05
6.0E-05
7.0E-05
8.0E-05
9.0E-05
1.0E-04
1.1E-04
1.2E-04
1.3E-04
1.4E-04
1.5E-04
Baseline Reduction by90%
Reduction by99.5%
Hand Washing Hand Washingand 90%
Reduction
Hand Washingand 99.5%Reduction
Exposure Scenario
Can
cer
Ris
k
Playsets Only
Playsets and Decks
Figure 1-1 Arsenic Cancer Risk at the 95% Percentile (Warm Climate)
1-10
0.0E+00
1.0E-05
2.0E-05
3.0E-05
4.0E-05
5.0E-05
6.0E-05
7.0E-05
8.0E-05
9.0E-05
1.0E-04
1.1E-04
1.2E-04
1.3E-04
1.4E-04
1.5E-04
Baseline Reduction by 90% Reduction by 99.5% Hand Washing Hand Washing and90% Reduction
Hand Washing and99.5% Reduction
Exposure Scenario
Can
cer
Ris
k
Playsets Only
Playsets and Decks
Figure 1-2 Arsenic Cancer Risk at the 50% Percentile (Warm Climate)
1-11
0
10
20
30
40
50
60
70
80
90
100
1.0E-12 1.0E-11 1.0E-10 1.0E-09 1.0E-08 1.0E-07 1.0E-06 1.0E-05 1.0E-04 1.0E-03
Carcinogenic Risk
Cum
ulat
ive
Pro
babi
lity
Den
sity
Maximum Reduction (99.5%)
Moderate Reduction (90%)
Baseline (No Mitigation)
Figure 1-3 Comparison of Residue Only Risks for Playsets and Decks for Warm Climate (Maximum Reduction, Moderate Reduction, Baseline)
1-12
A qualitative assessment of uncertainty was conducted. Uncertainty in the riskcharacterization was a result of the combined uncertainty of the exposure assessment generated bySHEDS-Wood and the uncertainty in the toxicological factors. No quantitative evaluation of theuncertainty in the toxicity factors was conducted. A qualitative evaluation of the toxicity valuesshowed that they were at the upper end of the range of a theoretical distribution because theyincorporated several conservative assumptions. An in depth uncertainty and sensitivity analysesof the SHEDS-Wood exposure assessment was performed by Zartarian et al. (2003). Foruncertainty, the two (out of six listed) most critical inputs were: transfer efficiency and residueconcentration. Sensitivity analysis showed that the most influential variables were: transferefficiency, residue concentration, fraction of hand mouthed, and amount of hand washing. Totaluncertainty in the exposure assessment was estimated at a factor of 3-4.
Uncertainty was not modeled in this risk assessment. For carcinogenic risks, it is likelythat the uncertainty is asymmetrical around the factor of 3-4 because slope factor accounts forseveral conservative assumptions. There is a low probability that the risks are higher, and agreater probability the risks are lower. For noncancer effects, the uncertainty is alsoasymmetrical. The MOE’s are likely to be underestimated (i.e., they could be greater). Again,this is due to the LOAEL and NOAEL coming from the upper portion of the theoreticaldistribution. For chromium, there is the added conservative assumption that 10% of totalchromium is present as Cr(VI). Taken together with the NOAEL, there is a much greaterprobability that the Cr(VI) MOEs are larger than those reported, and far lower probability thatthey are less than reported.
2-1
2.0 INTRODUCTION AND BACKGROUND
2.1 Introduction
The U.S. Environmental Protection Agency’s (EPA) Office of Pesticide Programs (OPP)is aware of increased concerns raised by the general public, municipal and state governments, andstate/federal regulatory agencies regarding the safety of children contacting arsenic andchromium residues while playing on Chromated Copper Arsenate- (CCA-) treated wood playground structures and decks. Because of this concern, OPP’s Antimicrobials Division (AD),with the recommendation of the Science Advisory Panel (SAP) and the assistance of the Office ofResearch and Development (ORD), has conducted probabilistic assessments to evaluate potentialchildhood exposure to arsenic and chromium components of CCA-treated wood in decks, homeplaysets and public playground structures, and contaminated soils commonly found in thesesettings. This report focuses on the non-dietary assessment of CCA in treated wood.
OPP/AD’s preliminary approach was reviewed by the SAP in 2001, which used adeterministic exposure assessment methodology for CCA-treated wood. SAP’s primaryrecommendation to OPP was that a more comprehensive probabilistic assessment should bedeveloped to examine the exposure scenarios presented in the deterministic assessment in 2001.
OPP requested the assistance of ORD in developing a model to conduct a probabilisticexposure assessment for CCA-treated wood. The Stochastic Human Exposure and DoseSimulation Model for the Wood Preservative Exposure Scenario (SHEDS-Wood), a probabilisticexposure model developed by the National Exposure Research Laboratory (ORD/NERL), wasused to develop the exposure assessment for children exposed to CCA-treated playsets and decks. In 2002, SHEDS-Wood was presented to the SAP for model review and for recommendationsfrom the panel. After incorporation of comments from the SAP, a draft document prepared byOPP and ORD in 2003, entitled A Probabilistic Exposure Assessment for Children Who ContactCCA-treated Playsets and Decks Using the Stochastic Human Exposure and Dose SimulationModel for the Wood Preservative Exposure Scenario (SHEDS-Wood) (Zartarian et al., 2003),together with this draft risk assessment report, A Probabilistic Risk Assessment for Children WhoContact CCA-treated Playsets and Decks, are scheduled to be reviewed by the SAP in December2003. The SHEDS-Wood document provides exposures, reported as average daily doses(ADDs) and lifetime average daily doses (LADDs); it does not report risk estimates. Thepurpose of this report is to provide the results of a risk analysis, conducted by OPP, that uses theADDs and LADDs generated by SHEDS-Wood in combination with toxicological endpoints forCCA (i.e., based on chromium and arsenic) selected by OPP. This document reports onchildren’s risks to CCA using the multiple routes, multiple pathways, and dose estimatesdeveloped from the SHEDS-Wood draft document.
2-2
This OPP risk assessment provides background information on issues related to children’sexposure to CCA-treated wood and the reasons that EPA conducted a non-dietary probabilisticassessment (see below); describes the exposures generated by SHEDS-Wood (see Chapter 3.0);summarizes the arsenic and chromium toxicity endpoints for children used in this risk assessment(see Chapter 4.0); characterizes the risks for the exposures presented in the SHEDS-Wood model(see Chapter 5.0); characterizes risk reduction impacts for the exposures presented in theSHEDS-Wood model (see Chapter 6.0); and discusses the uncertainties, strengths, and limitationsof this risk assessment (see Chapter 7.0).
2.2 Background
Chromated Copper Arsenate (CCA) wood preservatives containing chromium (Cr),copper (Cu), and arsenic (As) as pesticidal compounds, protect wood from deterioration. Theyare predominantly used to pressure treat lumber intended for outdoor use in constructing a varietyof residential landscape and building structures, as well as home, school, and communityplayground equipment. Children may potentially be exposed to the pesticide residues remainingon the surfaces of the treated wood structures as well as the residues leached into the surroundingsoil. EPA is aware of increased concerns raised by the general public and state regulatoryagencies regarding the safety of CCA-treated wood for residential applications. The children’srisk assessment presented herein evaluates exposure routes and pathways anticipated as realistic,considering activity patterns and behavior of young children near residential playsets, publicplaysets, and residential decks. Children’s exposure may occur through touching CCA-treatedwood and CCA-contaminated soil near treated wood structures, mouthing hands after touchingCCA-treated wood, and eating CCA-contaminated soil. Since EPA has determined that thearsenic and chromium components of CCA pose the most significant toxicity concerns incomparison to copper, which is not a recognized or suspected carcinogen, the Agency focused onevaluating potential adverse short-term, intermediate-term, and lifetime exposures and non-cancer/cancer risks to children from arsenic and chromium as Cr(VI). The SHEDS-Wood modeldeveloped by ORD was selected by OPP to conduct the probabilistic children’s exposure anddose assessment for CCA (Zartarian et al., 2003). The exposure doses generated by SHEDS-Wood were used in conjunction with toxicity data for arsenic and chromium as Cr(VI) to estimatethe risks presented in this report.
2.2.1 Regulatory History of CCA
Regulatory actions involving inorganic arsenical wood preservatives, including CCA, began nearly 25 years ago. An administrative review process was initiated in 1978 to considerwhether the registration of certain wood preservative chemicals (pentachlorophenol; coal tar,creosote and coal tar neutral oil; and inorganic arsenicals) should be canceled or modified. Aseparate Notice of Rebuttable Presumption Against Registration and Continued Registration(RPAR) was issued for each heavy-duty wood preservative under consideration. A RPAR is
2-3
issued when the Agency determines that a pesticide meets or exceeds any of the risk criteriarelating to acute and chronic toxic effects, as set forth under the Federal Insecticide, Fungicide,and Rodenticide Act (FIFRA). Registrants then have the opportunity to submit evidence inrebuttal of the Agency’s risk presumptions. The RPAR for inorganic arsenicals (43 FR 202) waspublished on October 18, 1978, along with a supporting Position Document (PD 1). Accordingto that document, the risk criteria met or exceeded by inorganic arsenicals were: oncogenicity,mutagenicity, and fetotoxic/teratogenic effects. The RPAR generated substantial registrantcomments, but these risks remained unrebutted after the RPAR process.
The Agency issued a Preliminary Notice of Determination (PND), concluding the RPARprocess, which was published in the Federal Register of February 19, 1981 (46 FR 13020). Thisnotice, along with the supporting Position Document (PD 2/3), stated the Agency’s determinationthat the wood preservative chemicals continued to exceed the risk criteria which provided thebasis of the RPARs. To reduce the risks, the Agency proposed certain modifications to the termsand conditions of registration, including certain protective clothing requirements, classifying allinorganic aresenical wood preservatives as Restricted Use (available to certified applicators only),and a mandatory program to provide users of treated wood with handling, use and disposalprecautions.
The preliminary determinations described above were submitted to the FIFRA SAP andthe U.S. Department of Agriculture (USDA) for review. Comments were also solicited fromregistrants and any other interested persons. The Agency considered the comments received andmade modifications to the proposed decision announced in the PND. A public meeting wasconducted on April 14, 1983 to allow interested persons to comment on the proposed changes. Their comments were considered in the development of the final determination, which was aNotice of Intent to Cancel (NOIC), published in the Federal Register of July 13, 1984 (49 FR136), along with a supporting Position Document (PD 4).
Several trade associations and numerous registrants requested hearings to challenge theAgency’s determinations in the July 13 NOIC. The Agency published a Federal Register Noticeon October 31, 1984 (49 FR 43772), postponing the effective date of the labeling modificationsfor those registrants who filed applications for amended registration in response to the NOIC. On January 30, 1985, the Agency published an additional Federal Register Notice (50 FR 4269)announcing that persons other than registrants could continue to sell and distribute existing stocksof wood preservative products with existing labeling until further notice. Pre-hearing meetingswere held between the Agency and some of the major parties who had requested hearings, duringwhich alternative, mutually acceptable, mechanisms for achieving the regulatory goals set forth inthe NOIC were discussed. After careful consideration of some of those alternatives, the Agencyconcluded that certain changes to the July 13, 1984 NOIC were appropriate and consistent withthe Agency’s goal of protecting the public from unreasonable adverse effects resulting frompesticide use. An amended NOIC, announcing these changes, was published in the Federal
2-4
Register of January 10, 1986 (51 FR 7). The modifications were mostly minor in scope, with theexception that the previous mandatory Consumer Awareness Program (CAP) was deleted fromthe labeling requirements. The wood preservative industry agreed to a voluntary CAP to educateconsumers on the proper use and precautionary practices for treated wood.
Arsenic, chromium, and chromated arsenical compounds, used as wood preservatives,were evaluated under the Registration Standards Program in 1988. This program was establishedin order to provide a mechanism for pesticide products having the same active ingredient to bereviewed and brought into compliance with FIFRA. The outcome of the Registration Standardfor arsenic, chromium, and chromated arsenical wood preservatives was as follows:
• Classification of inorganic arsenic and hexavalent chromium as Group Acarcinogens;
• Acknowledgment that both arsenic and chromium have demonstrated the potentialto cause teratogenic/fetotoxic effects through peritoneal exposure;
• Requirement of a reproduction study using a formulated chromated arsenicalproduct to address the teratogenic/fetotoxic effects unless a metabolism studydemonstrated that blood levels of chromium and arsenic are not increased abovebackground levels;
• Requirement of metabolism data to assess the bioavailability of chromium andarsenic after exposure to a formulated product;
• Requirement of additional ecological effects and environmental fate data; and• Reiteration of label restrictions set forth in the prior NOICs.
Currently, the only remaining use of arsenic acid is for wood preservation. The lastremaining agricultural use of arsenic acid, as a desiccant on cotton, was voluntarily canceled in1993 (58 FR 86, May 6, 1993). The voluntary cancellation was enacted following a NOIC issuedfor the cotton desiccant use of arsenic acid (56 FR 50576, October 7, 1991) due to the cancerrisks to workers. The voluntary cancellation allowed the sale of existing stocks until December31, 1993, after which they could be lawfully disposed of or sold to the wood preservative industryfor reformulation or repackaging into registered wood preservative products.
2.2.2 Current Development of CCA Issue
On March 17, 2003 EPA granted the voluntary cancellation and use termination requestsaffecting virtually all residential uses of CCA-treated wood. Under this action, affected CCAproducts cannot be used after December 30, 2003 to treat lumber intended for use in mostresidential settings. This transition affects virtually all residential uses of wood treated with CCA,including play structures, decks, picnic tables, landscaping timbers, residential fencing, patios, andwalkways/boardwalks. This action was proposed in February 2002 by the registrants of CCApesticide products that are used to treat wood. Phase-out of the residential uses will reduce the
2-5
potential exposures and risks from arsenic, a known human carcinogen, thereby protecting humanhealth, especially children's health, and the environment. The current action follows the February2002 publication of a notice of receipt of voluntary cancellation/use termination requests, whichalso provided an opportunity for public comments to be submitted to EPA. A notice of thecancellation order was published in the Federal Register on April 9, 2003. Consumers maycontinue to buy and use the treated CCA wood for as long as it is available, but the transition tousing the new generation treatment products is well underway. The Agency is deferring anyaction on two uses involved in the termination requests: (1) wood used in permanent woodfoundations; and (2) wood used in fence posts for agricultural uses. Therefore, these twoproducts may continue to be treated with CCA at this time. EPA is working with the registrantcommunity and other stakeholders to ensure that safer, comparable alternatives will be available.EPA is continuing its work on an ongoing comprehensive reevaluation of CCA-treated wood thathas been underway as part of the Agency's effort to re-evaluate older pesticides to ensure thatthey meet current health and safety standards. More information on CCA-treated wood isavailable at the following EPA website: http://www.epa.gov/pesticides/factsheets/chemicals/1file.htm
The Agency is evaluating CCA under the reregistration process within OPP. Once OPPcompletes the reregistration review for CCA, the Reregistration Eligibility Decision (RED)document for Chromated Arsenicals will be released. The RED will include a comprehensiveassessment of the potential human impacts (preliminary focus on occupational and environmentalexposures/risks attributed to the use of CCA-treated wood and related inorganic chromatedarsenical pesticides at the workplace) as well as potential impacts on the environment.
2.2.2.1 CPSC Activities
On March 17, 2003, the U.S. Consumer Product Safety Commission (CPSC) staff held aCommission Briefing to respond to the petition from the Environmental Working Group (EWG)and the Healthy Building Network (HBN) to ban the CCA-treated wood being used inplayground equipment and to review the safety of CCA-treated wood for general use (CPSC,2003a). After briefing the Commissioners and the public on CPSC’s deterministic riskassessment, CPSC staff recommended denial of the petition based on the actions of EPA (CPSC,2003a). On November 4, 2003, CPSC voted unanimously that a ban was not necessary becausethe wood industry no longer uses CCA-treated wood for playsets. CPSC’s decision was based onan agreement between CCA manufacturers and the Environmental Protection Agency (EPA) tophase out CCA treatment of wood for most consumer uses by the end of 2003. More informationon CPSC’s briefing on CCA-treated wood is available at the following website: http://www.cpsc.gov/cpscpub/prerel/prhtml04/04026.html
2-6
2.2.2.2 Updated International Actions and Activities
The European Commission (EC) has banned the sale of CCA-treated wood for mostresidential uses, effective June, 2004 (CPSC, 2003b; APVMA, 2003; EMRA, 2003a). However,none of the countries banned CCA-treated wood that is already in use (EMRA, 2003a). ECcountries include Germany, Belgium, Luxembourg, France, Portugal, Spain, Italy, Greece,Austria, the United Kingdom, Ireland, Finland, Sweden, Denmark and The Netherlands (EMRA,2003a).
The EC published a Marketing and Use Directive on January 6, 2003 stating “labelingrequirements for CCA-treated wood, and banning the sale of CCA-treated wood unless structuralintegrity of the wood is needed for human or livestock safety and skin contact by the public isunlikely. The directive is to take effect by 30 June 2004 and applies only to CCA Type Cpreservatives. Situations in which CCA preservatives may not be used include residential ordomestic constructions, where there is a risk of repeated skin contact, and where the wood maycome into contact with intermediate or finished products intended for human consumption. Thedirective does not apply to CCA-treated wood already in use” (EMRA, 2003a).
“Restrictions on use of CCA already exist in a number of member states. Germany,Sweden, Austria, Finland, the Netherlands and Denmark had already initiated voluntaryagreements or regulations restricting the use and marketing of CCA and CCA-treated wood.”(EMRA, 2003a). However, for the United Kingdom, the Health and Safety Executive recommended to the government in 1999 to continue using CCA-treated wood with certainenvironmental data and occupational requirements (EMRA, 2003a).
Canada’s Pest Management Regulatory Agency (PMRA) has reached an agreement withindustry on the proposed transition away from the use of CCA-treated wood at residential sites. The PMRA agreement is identical to the voluntary label changes for CCA-treated wood that wereproposed by EPA. Canada’s Consumer Safety Information Sheet can be found athttp://www.ccasafetyinfo.ca. and Fact Sheet information can be found athttp://www.hc-sc.gc.ca/pmra-arla/english/pdf/fact/fs_cca-june2003-e.pdf
In Australia, the Australian Pesticides and Veterinary Medicines Authority (APVMA) hasinitiated reconsideration of the registration and associated label approval of products containingarsenic. It is anticipated that a draft report of APVMA’s review of arsenic will be available forpublic comment in mid-2004 (APVMA, 2003).
2-7
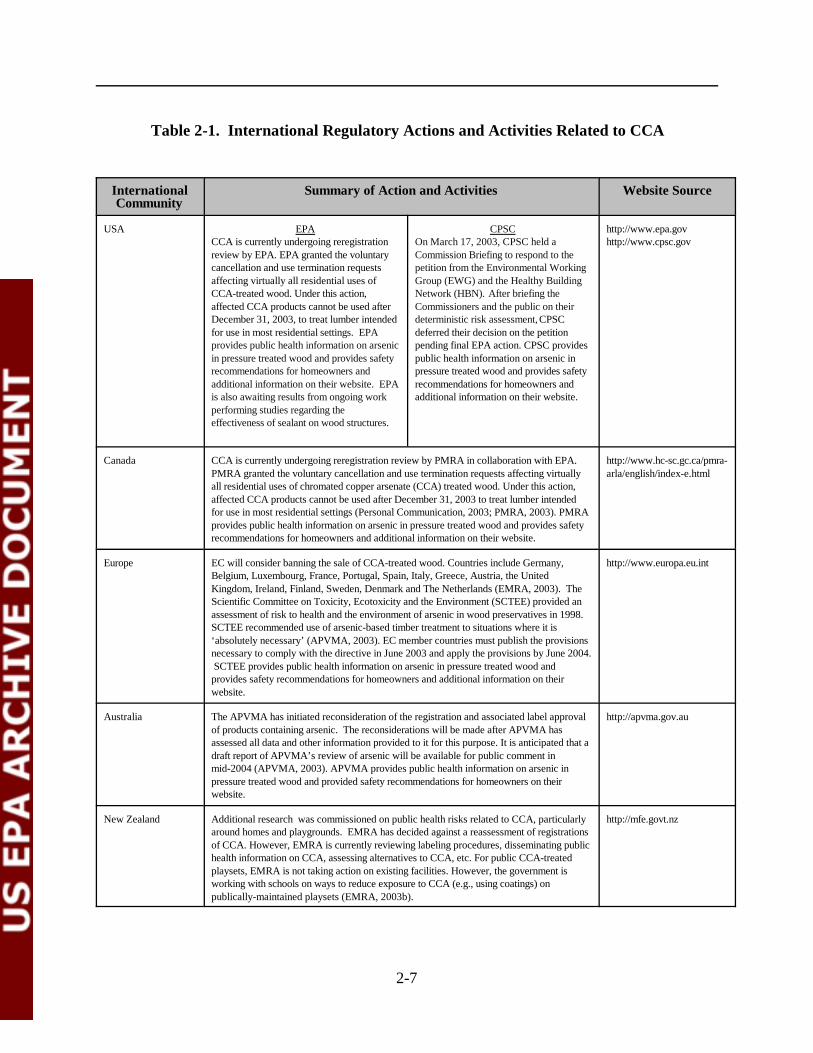
Table 2-1. International Regulatory Actions and Activities Related to CCA
InternationalCommunity
Summary of Action and Activities Website Source
USA EPACCA is currently undergoing reregistrationreview by EPA. EPA granted the voluntarycancellation and use termination requestsaffecting virtually all residential uses ofCCA-treated wood. Under this action,affected CCA products cannot be used afterDecember 31, 2003, to treat lumber intendedfor use in most residential settings. EPAprovides public health information on arsenicin pressure treated wood and provides safetyrecommendations for homeowners andadditional information on their website. EPAis also awaiting results from ongoing workperforming studies regarding theeffectiveness of sealant on wood structures.
CPSCOn March 17, 2003, CPSC held aCommission Briefing to respond to thepetition from the Environmental WorkingGroup (EWG) and the Healthy BuildingNetwork (HBN). After briefing theCommissioners and the public on theirdeterministic risk assessment, CPSCdeferred their decision on the petitionpending final EPA action. CPSC providespublic health information on arsenic inpressure treated wood and provides safetyrecommendations for homeowners andadditional information on their website.
http://www.epa.govhttp://www.cpsc.gov
Canada CCA is currently undergoing reregistration review by PMRA in collaboration with EPA.PMRA granted the voluntary cancellation and use termination requests affecting virtuallyall residential uses of chromated copper arsenate (CCA) treated wood. Under this action,affected CCA products cannot be used after December 31, 2003 to treat lumber intendedfor use in most residential settings (Personal Communication, 2003; PMRA, 2003). PMRAprovides public health information on arsenic in pressure treated wood and provides safetyrecommendations for homeowners and additional information on their website.
http://www.hc-sc.gc.ca/pmra-arla/english/index-e.html
Europe EC will consider banning the sale of CCA-treated wood. Countries include Germany,Belgium, Luxembourg, France, Portugal, Spain, Italy, Greece, Austria, the UnitedKingdom, Ireland, Finland, Sweden, Denmark and The Netherlands (EMRA, 2003). TheScientific Committee on Toxicity, Ecotoxicity and the Environment (SCTEE) provided anassessment of risk to health and the environment of arsenic in wood preservatives in 1998.SCTEE recommended use of arsenic-based timber treatment to situations where it is‘absolutely necessary’ (APVMA, 2003). EC member countries must publish the provisionsnecessary to comply with the directive in June 2003 and apply the provisions by June 2004. SCTEE provides public health information on arsenic in pressure treated wood andprovides safety recommendations for homeowners and additional information on theirwebsite.
http://www.europa.eu.int
Australia The APVMA has initiated reconsideration of the registration and associated label approvalof products containing arsenic. The reconsiderations will be made after APVMA hasassessed all data and other information provided to it for this purpose. It is anticipated that adraft report of APVMA’s review of arsenic will be available for public comment inmid-2004 (APVMA, 2003). APVMA provides public health information on arsenic inpressure treated wood and provided safety recommendations for homeowners on theirwebsite.
http://apvma.gov.au
New Zealand Additional research was commissioned on public health risks related to CCA, particularlyaround homes and playgrounds. EMRA has decided against a reassessment of registrationsof CCA. However, EMRA is currently reviewing labeling procedures, disseminating publichealth information on CCA, assessing alternatives to CCA, etc. For public CCA-treatedplaysets, EMRA is not taking action on existing facilities. However, the government isworking with schools on ways to reduce exposure to CCA (e.g., using coatings) onpublically-maintained playsets (EMRA, 2003b).
http://mfe.govt.nz
2-8
New Zealand has also commissioned additional research on public health risks related toCCA, particularly around homes and playgrounds (EMRA, 2003a; APVMA, 2003). Based on aninternal review of public health risks, Environmental Risk Management Authority (EMRA) hasdecided against a reassessment of registrations of CCA. However, EMRA is currently reviewinglabeling procedures, disseminating public health information on CCA, assessing alternatives toCCA, etc. For public CCA-treated playsets, EMRA is not taking action on existing facilities. However, the government is working with schools on ways to reduce exposure to CCA (e.g.,using coatings) on publically-maintained playsets (EMRA, 2003b). Table 2-1 summarizesinternational regulatory actions and activities related to CCA.
2.2.2.3 Updated State Actions and Activities
In 1987, the California Department of Health Services (CDHS), Health and WelfareAgency, conducted a research study entitled, Evaluation of Hazards Posed by the Use of WoodPreservatives on Playground Equipment, and made recommendations to the Legislator in theState of California (CDHS, 1987). As a result of the findings and recommendations of thatreport, a new law was signed into effect in September 1987 (Div. 20 of the California Health andSafety Code, §25930.10.7) (Spease, 2002). The law stated that:
• State funds could not be used to purchase wooden playground or recreationalequipment that may have been treated with arsenic (unless treated in accordancewith AWPA standard C-17), pentachlorophenol or creosote;
• State funds may not be used for maintenance of the wooden playground orrecreational equipment in question; and
• People installing any such structures must seal the structures with a non-toxic,non-slip sealer at the time of installation, and reseal the structure every two years.
Maine legislators approved the Nation’s first ban on the sale of wood treated with arsenicon June 4, 2003. The bill states “that beginning April 1, 2004, Maine lumber dealers can nolonger sell arsenic-treated lumber for use in residential construction” (Edgecomb, 2003).Additionally, retailers are prohibited from purchasing arsenic-treated wood for most residentialuses (mid-September 2003). The Maine Department of Environmental Protection (MDEP) mustcomplete a market evaluation of remaining uses. The Maine Bureau of Health must developinformational brochures to educate consumers by January 1, 2004, on what homeowners shouldknow about hazards, and methods for reducing exposures with sealants. By January 1, 2005, theMDEP must develop plans to restrict the disposal of arsenic-treated wood (Our Stolen Future,2003).
In New York, Section 37-0109 of the New York State Environmental Conservation Lawmakes it illegal for schools and public playgrounds to have playground equipment constructedfrom pressure treated lumber that contains CCA. The law requires that existing playground

2-9
equipment be sealed to stop CCA from leaching or escaping from the wood, and to cover theground to protect children from arsenic that may have leached to the soil. The Department ofEnvironmental Conservation (DEC) is to publish information on the dangers and hazards to publichealth and the environment from the use of CCA-treated lumber. The DEC is to compile andpublish a list of less toxic materials that may be used on playgrounds as an alternative to CCA-treated lumber. The DEC will also compile and publish information on non-toxic methods andmaterials that are available to seal playground structures with CCA wood and to cover the ground(Healthy Schools Network, 2003).
Other state agencies such as the Connecticut Department of Public Health, theMassachusetts Department of Public Health, the Florida Department of Environmental Protection,and the Minnesota Department of Health have been actively investigating issues related topressure-treated playground equipment. They have provided public health information on arsenicin pressure-treated wood, as well as safety recommendations for homeowners (see websites listedin Table 2-2). These recommendations include:
• Sealing CCA-treated structures (decks and playsets) every two years withoil-based stain;
• Preventing exposure to pressure-treated wood and dust; • Washing hands after playing on wooden playground equipment;• Inspecting structures for decay;• Suggesting alternatives to CCA-treated pressure treated wood;• Not placing food, drink or paper products on pressure treated wood;• Never burning treated wood;• Limiting use of under deck areas where arsenic may have accumulated in the soil;• Not using treated wood on indoor surfaces; and• Not using CCA-treated wood for wood chips or mulch.
Table 2-2 presents a summary of state regulatory activities and actions related to CCA.
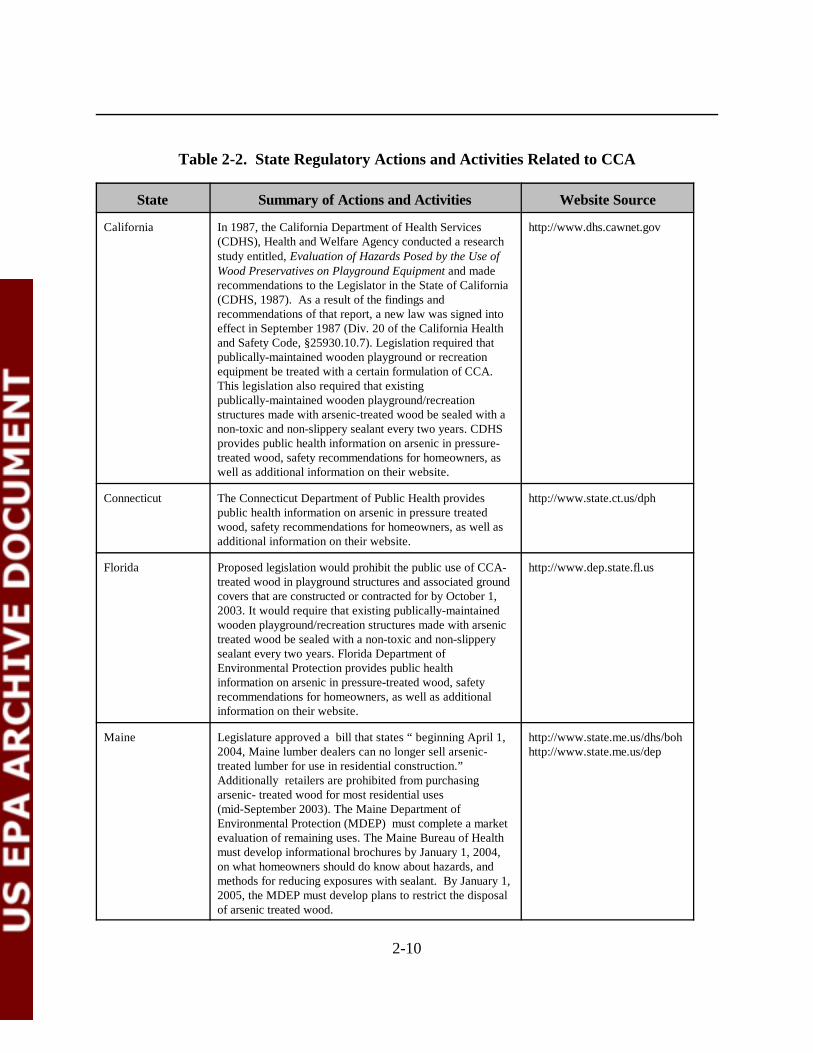
2-10
Table 2-2. State Regulatory Actions and Activities Related to CCA
State Summary of Actions and Activities Website Source
California In 1987, the California Department of Health Services(CDHS), Health and Welfare Agency conducted a researchstudy entitled, Evaluation of Hazards Posed by the Use ofWood Preservatives on Playground Equipment and maderecommendations to the Legislator in the State of California(CDHS, 1987). As a result of the findings andrecommendations of that report, a new law was signed intoeffect in September 1987 (Div. 20 of the California Healthand Safety Code, §25930.10.7). Legislation required thatpublically-maintained wooden playground or recreationequipment be treated with a certain formulation of CCA. This legislation also required that existingpublically-maintained wooden playground/recreationstructures made with arsenic-treated wood be sealed with anon-toxic and non-slippery sealant every two years. CDHSprovides public health information on arsenic in pressure-treated wood, safety recommendations for homeowners, aswell as additional information on their website.
http://www.dhs.cawnet.gov
Connecticut The Connecticut Department of Public Health providespublic health information on arsenic in pressure treatedwood, safety recommendations for homeowners, as well asadditional information on their website.
http://www.state.ct.us/dph
Florida Proposed legislation would prohibit the public use of CCA-treated wood in playground structures and associated groundcovers that are constructed or contracted for by October 1,2003. It would require that existing publically-maintainedwooden playground/recreation structures made with arsenictreated wood be sealed with a non-toxic and non-slipperysealant every two years. Florida Department ofEnvironmental Protection provides public healthinformation on arsenic in pressure-treated wood, safetyrecommendations for homeowners, as well as additionalinformation on their website.
http://www.dep.state.fl.us
Maine Legislature approved a bill that states “ beginning April 1,2004, Maine lumber dealers can no longer sell arsenic-treated lumber for use in residential construction.”Additionally retailers are prohibited from purchasingarsenic- treated wood for most residential uses(mid-September 2003). The Maine Department ofEnvironmental Protection (MDEP) must complete a marketevaluation of remaining uses. The Maine Bureau of Healthmust develop informational brochures by January 1, 2004,on what homeowners should do know about hazards, andmethods for reducing exposures with sealant. By January 1,2005, the MDEP must develop plans to restrict the disposalof arsenic treated wood.
http://www.state.me.us/dhs/bohhttp://www.state.me.us/dep
Table 2-2. State Regulatory Actions and Activities Related to CCA (Continued)
State Summary of Actions and Activities Website Source
2-11
Massachusetts The Massachusetts Department of Public Health providespublic health information on arsenic in pressure-treatedwood and safety recommendations for homeowners on theirwebsite.
http//:www.state.ma.us/dph
Minnesota In Minnesota, a bill has been introduced that would ban theuse and sale of CCA in the state. A second Minnesota billwould require that schools that use CCA-treated productsseal the wood every two years (Environmental HealthPerspectives, 2001). Minnesota Department of Healthprovides public health information on arsenic in pressuretreated wood, safety recommendations for homeowners, aswell as additional information on their website.
http//:www.health.state.mn.us
New York In New York, Section 37-0109 of the New York StateEnvironmental Conservation Law makes it illegal forschools and public playgrounds to construct playgroundequipment from pressure-treated lumber that contains CCA.The law requires that playgrounds be sealed to stop CCAfrom leaching or escaping from the wood, and to cover theground to protect children from arsenic that may haveleached to the soil. The New York Department ofEnvironmental Conservation provides public healthinformation on arsenic in pressure-treated wood, safetyrecommendations for homeowners, as well as additionalinformation on their website.
http//:www.dec.ny.us
2.2.3 Use Profile of CCA
CCA preservatives protect wood from deterioration from a variety of insects, fungi, androt organisms. There are currently 26 CCA-containing wood preservative products registeredwith the EPA. CCA is used for pressure-treated lumber intended for outdoor use in constructinga variety of residential landscape and building structures, as well as home, school, and communityplayground equipment. However, it should be noted that EPA granted the voluntary cancellationand use termination requests of CCA-treated wood. The labels for the three CCA-containingpreservatives that contained the non-pressure treatment uses were effectively canceled via a 6(f)notice on May 16, 2003. A final cancellation order was issued on May 28, 2003 for OsmoseSpecial K-33 Preservative (EPA Registration 3008-21), Hollow Heart Concentrate (EPARegistration 75341-1) and Osmoplastic SD Wood Preserving Compound (EPA Registration75341-7). The cancellation of these three products resulted in pressure treatment being the onlyallowable use for CCA-containing preservatives. CCA is used for pressure-treated lumber intended for outdoor use in constructing a variety of residential landscape and building structures,as well as home, school, and community playground equipment. However, it should be noted,EPA granted the voluntary cancellation and use termination requests affecting virtually allresidential uses of CCA-treated wood. CCA-treated wood, predominantly of Southern yellow

2-12
pine, represents the majority of pressure-treated dimensional lumber marketed to the generalconsumer via lumberyards/hardware stores and other retailers. In some cases, CCA-treatedlumber is recycled into wood chips which are stained, then sold to consumers as landscape mulch. Major commercial installations include utility poles, highway railings, roadway posts/barriers,bridges, bulkheads, and pilings. Industry cites advantages of CCA-treated wood over otherpressure-treated wood, including superior durability, low-odor, and dry “non-oily” surfaces whichcan be painted or sealed.
There are three formulations of CCA, each containing varying ratios of arsenic pentoxide,chromic acid, and cupric oxide. CCA treatment solutions are typically classified by the AmericanWood-Preservers’ Association (AWPA) as either type A, B, or C, with CCA type C (CCA-C)being the formulation most commonly used for pressure treating dimensional lumber forresidential applications. AWPA’s P5 Preservative Standard requires CCA-C composition to be34.0% arsenic pentoxide (As2O5), 47.5% chromic acid (CrO3), and 18.5% cupric oxide (CuO)(AWPA, 1998).
After pressure treatment and fixation, arsenic and chromium can be retained in the woodfrom 0.25 to 2.50 pounds per cubic foot (pcf), based on the retention of CCA-C in woodfollowing AWPA treatment standards. Typical retention levels achieved depend on the intendedapplications of the treated lumber. Lower retention values are required for plywood, lumber, andtimbers used for above-ground applications (0.25 pcf ), and for ground or freshwater contact uses(0.40 pcf). Higher retention levels are required for load bearing wood components, such aspilings, structural poles, and columns (0.60 - 0.80 pcf). The highest levels are required for woodfoundations and saltwater applications (up to 2.50 pcf).
Nationwide, approximately 70% of single family homes have existing pressure-treateddecks and porches, and approximately 14% of public playground equipment is made with treatedwood. Based on current data from the American Chemistry Council (ACC), approximately 34%of CCA was used for decks and less than 1% was used in playground equipment (Zartarian et al.,2003; CPSC, 2003b). The potential for exposure to pesticide residues remaining on the surfacesof the existing aged treated wood structures as well as to the residues leached into thesurrounding soil, may pose child health hazard concerns.
2.2.4 Overview of CCA Chemistry
CCA contains chromium (Cr), copper (Cu), and arsenic (As), each of which contributes tothe wood-preservative properties of the compound. Copper acts as a fungicide in the CCAformulation and the arsenic protects against insect damage. Chromium, in the form of chromicacid, acts as a fixative (binding agent), whereby the Cr, Cu, and As metal ions present in the woodare fixed to the wood fibers. Most of the information presented in this overview is from U.S.EPA (2001b).

2-13
Metals go through various changes in environmental compartments such as soil, water,plants, and animals. The speciation of metals depends on sorption, desorption, redox reactions insoil and water, precipitation reactions, complexation reactions, etc. (Lebow, 1996). The differentspecies of arsenic and chromium vary in their ability to be absorbed into the body and metabolizedwithin the body, and differ in their toxicological profiles. Therefore, it is important to consider thespecies of arsenic or chromium present in soils surrounding CCA-treated wood and on the surfaceof the treated wood itself when assessing the exposure to these chemicals.
2.2.4.1 Speciation
The FIFRA SAP (U.S. EPA, 2001c) noted that there is no reliable evidence on either thepresence or absence of Cr(VI) in dislogeable residues on treated wood surfaces. However, sincethat meeting, more studies have indicated that Cr(III) is the primary component on treated woodsurfaces. The FIFRA SAP also noted that some measurable Cr(VI) probably exists in certainsoils, but it is unlikely to be 100 percent of the total chromium present. One approachrecommended by FIFRA SAP in evaluating the hazards of chromium in the soil would be to usean estimate of 5 to 10 percent (or more conservatively 25 to 50 percent) Cr(VI).
More recent studies indicated that Cr(III) is the primary component in CCA pressure-treated wood surfaces of existing decks and playground structures (RTI International, 2003 (citedas ACC, 2003b in SHEDS-Wood Report); Cooper, 2003; Nico et al., 2003) and in the air oftreatment plants (ACC, 2002). In fact, RTI International (2003) found that Cr(VI) was notdetected in 142 of 145 wood surface dislogeable residue samples taken; Cr(VI) was not detectedin any of the samples from existing aged decks, and only trace amounts were detected in thenewly treated woods in the remaining samples. The registrants of CCA conducted a CCAtreatment plant worker exposure study in 1999 (ACC, 2002). This study also indicated that theCr(VI) in the air was undetectable (based on the sensitivity of the limit of detection of Cr(VI)used in that study). Nico et al. (2003) found that chromium and arsenic in CCA-treated woodwere consistent between samples of fresh treated wood and aged wood, and between treatedwood and dislogeable residue. The Nico et al. (2003) report indicated that a “chemical complex”type of matrix was formed between As-Cr-Wood. However, the Nico et al. (2003) report did notquantify the matrix type of CCA-treated wood and the free metal forms of arsenic and chromium.
2.2.4.2 Fixation
After undergoing pressure treatment with CCA wood preservative, the chromium, copper and arsenic penetrate into the wood and become bound or fixated in the wood. The term,fixation, refers to the series of chemical reactions that take place after the wood has been pressuretreated with CCA. These reactions render the CCA less likely to leach from the wood duringservice. The use of metal oxides in CCA formulations has been shown to aid in the fixationprocess. Fixation precedes the actual action of CCA to act as a wood preservative. The CCApenetration/fixation process preserves and protects the wood from pest attack. The absorptionand fixation of CCA apparently occur in the cellulosic and lignin components of the wood (Kartal
2-14
and Lebow, 2000). Since lignin is thought to be a primary binding site for chromium to formchromium-lignin complexes, the use of woods with an increased lignin content may result inimproved treatment. Softwood species, which have a high lignin content often perform better thanhardwoods in terms of preservative treatment. Studies have shown that all of the three metals arefixed into the wood structure.
The initial reaction of fixation is the absorption of the CCA preservative into the cellulosicand lignin components of the wood. A second reaction occurs which converts Cr(VI) to Cr(III). This second reaction continues for a period of several hours to a few days. The reduction ofCr(VI) to Cr(III) is important in the formation of insoluble complexes in CCA-treated wood.Additionally, Cr(III) is less toxic than Cr(VI). The third reaction is the conversion of copperarsenate in the wood to basic copper arsenate with an arsenic valence state of +5. The completefixation reaction may even take several months. Studies with treated pine have indicated that thecopper and arsenic components of the CCA metals are “fixed” more rapidly than chromium.Some researchers have concluded that the fixation process is complete when the presence ofCr(VI) is no longer detected in the leachate or compensate of the treated wood. Cooper (2003)conducted research on CCA fixation using existing data and noted that virtually all of thechromium injected into the wood during the treating process is eventually reduced to low toxicityCr(III) and there is no evidence that Cr(VI) is produced as a result of the oxidation of Cr(III) inthe wood. The completion of the fixation process can be from a few days to a several months,depending on the ambient temperature of treatment plants.
2.2.4.3 Leaching
The fixation process binds much of the chromium, copper, and arsenic into the woodfibers; however, some of the metals will not be “fixed” and will remain “free” on the surface of thetreated wood. These will be susceptible to dislodging through washing off or by physical contactwith other objects, including humans who have physical contact with the wood. The fixatedmetals can also slowly be leached from the treated wood by water.
Playground equipment constructed with treated wood can be in the form of many differenttypes of items including swing sets, climbing bars, etc. The chromium, copper, and arsenic in/onthe treated wood can be leached from the wood so that the metals fall vertically onto the soilunder the equipment and leach laterally into the soil from the vertical pieces of treated wood thathave contact with the playground soil. Metals also leach from ground-contact horizontal pieces ofCCA-treated wood fabricated into playsets and related structures. Playground equipment mayalso have mulch placed under the equipment, and the mulch will receive leachate from the treatedequipment pieces. Children playing on such equipment can be exposed to the CCA leachateseither through contact with the CCA-treated wood or through contact with soil or mulch eitherunder the equipment or immediately adjacent to the equipment.

2-15
A large amount of data are available regarding the leaching of chromium, copper, andarsenic from treated wood (Lebow, 1996). Much of the data are from studies that are not directlyapplicable to leaching from playground equipment. Some of the available data that are mostapplicable to playground equipment and decks constructed of CCA-treated wood are summarizedbelow.
Leaching of chromium, copper, and arsenic from treated wood in an aqueous medium,which is most likely to simulate the playground use (where rainfall occurs), appears to be mostrapid from freshly treated wood and is in the order of Cu > As > Cr. The release rate is alsohigher under acidic conditions; this would mean that leaching would be faster in the areas of theUnited States that have acid rain, such as the northeastern states. One study has shown that theleaching process from treated wood is aided by slow or drizzling rain rather than heavy showers.Leaching rates are generally lowest in wood that has been kiln-dried at high temperatures.
Most of the leaching from treated wood appears to take place in the first few days aftertreatment, but continues slowly over time (Lebow, 1996). Leaching rates depend on the size ofthe wood, type of wood, and on the fixation process. CCA leaches from hardwood more than softwood. Pressure treated red pine leaches more than lodgepole pine and Douglas fir. A scheme hasbeen proposed in the literature for the long-term leaching mechanism of CCA from wood:reversible disassociation of ion-exchanged metals and their redistribution to the wood surface andtheir loss; and physical or biological decay of the wood.
No leaching information was found to address the question of whether CCA metals leachfrom treated wood as copper or copper arsenate, or as complexes with inorganic or organicligands, or as derivatives of wood-metal moieties or as water soluble extracts. Water mobility forthe metal ions from CCA depend on many factors which give rise to a number of pathways. Themetals can diffuse through the soils as complexes, simple salts or free ions, or can percolatethrough soils as insoluble substances.
Little data were found to estimate the level of CCA residues in soil or mulch underplayground equipment constructed of treated wood. A Canadian study evaluated wooden playstructures consisting mostly of CCA-treated lumber of various dimensions constructed in a rangeof designs (Riedel et al., 1991). The structural elements were comprised of beams and planksfastened together. Poles were cut and used to form rungs, ramps and ladders. Treated woodpieces were used to construct tower-like structures and to connect to swings, slides, ladders orhorizontal monkey bars. Some structures incorporated hut-like shelters. Treated wood pieceswere placed in vertical, horizontal and angled positions. Some structures were coated with an oil-based stain which had worn off in some areas. The structures were up to ten years old. Theground under the structures and surrounding the structures usually consisted of a layer of sand atleast 25 centimeters deep which is replaced or replenished from time to time. The sand is carriedonto the structures and contributes to the abrasion and wear on the treated wood pieces.
2-16
Sand and soil samples were taken from under each of the treated playground structuresand a control soil sample was taken at a distance of ten meters (33 feet) from the treatedplayground structure. The sand samples were taken at similar locations under each structure; atthe bottom of a slide, next to a support post, at the bottom of a support post holding the mainstructure, and underneath a wooden platform or underneath a structure approximately one meterfrom the wooden post. The samples were all taken in late fall and on a cloudy day. The soilsamples were stored in plastic bags and taken to the laboratory for analyses. The samples wereoven dried and analyzed using inductively coupled plasma mass spectrophotometry for total nitricacid soluble arsenic (not speciated). Neither chromium nor copper were analyzed in the sand andsoil samples. The background levels of arsenic present in the control sand samples were generallyless than 0.3 parts per million (ppm). The authors of the paper reported that the average arsenicresidue level from samples taken from below the treated structures was 3.0 ppm with a range of0.032 - 9.6 ppm. However, sand samples taken from other areas around the playgroundstructures showed arsenic residues ranging from 0.13 ppm to 113.5 ppm under a structure next toa post. It should be noted that arsenic residues in sand sampled next to a treated post were lessthan 10 ppm except in the one playground with the high 113 ppm value. That study showedsignificantly higher sand residues than the other playground studies. There is no explanation forthis difference, but could be due to reasons such as samples being taken near newly treated andreplaced wood posts. Additionally, sand had been placed under the structures and leaching fromwood posts into the sand may be more rapid and spread further from the post than would be thecase for arsenic leaching into a clay soil. It could also be argued that if wood mulch rather thansand had been placed under the playground structures that, because of the surface area to weightrelationship for this organic material, any arsenic residues leaching from treated wood could resultin even higher arsenic residues in the mulch under the playground equipment.
The playground where arsenic residues were highest was ten years old and constructed ofwood that had been stained, but on which the stain had been worn off. There did not appear to bea correlation between residue levels in the sand under and around the playground structures and whether the equipment had been stained or painted, or was left unsealed.
There are also data available showing soil residue levels that occur under wooden decksthat have been constructed from CCA-treated wood. Children can play in the soil under andaround a treated deck. While the deck data may exaggerate residue levels in soil compared towhat would be expected under playground equipment, the data show that the level of CCA metalsin soil under treated wood structures was greater than the background level of the metals in soilfrom the study location and show residue levels in soil where children could play.
In one study conducted by Stilwell and Gorny (1997), soil from under seven decksconstructed from CCA-treated wood were analyzed. Chromium levels ranged as high as 154 ppmunder the treated decks and averaged 43 ppm, whereas, the control soils had an average of 20ppm of chromium. Arsenic levels ranged as high as 350 ppm under the treated decks and averaged76 ppm, whereas, the control soils had an average of 3.7 ppm of arsenic. No data are available formulch under the treated deck, but residues in mulch may even be higher because of the surface

2-17
area weight relationship of mulch. The same study showed that those decks that had been coatedtended to show a lesser degree of leaching of CCA metals. However, the degree of leaching froma deck that had been coated or sealed would most likely be dependent on the coating productused and on the age of the coating. The same study also showed that the age of the deck was afactor in the leachate residues found under the treated deck, with the older deck showing highersoil residues under the treated deck. This study does not reflect the soil CCA residue levels thatcould occur under treated playground equipment, but the generalization can be made that CCAresidues in soil under treated playground equipment will be higher than soil background levels ofthe CCA metals in the surrounding area. The residue data from this study do not speciate themetals but determine total copper, chromium, and arsenic.
Lateral and vertical migration of CCA metal residues can also occur from vertical piecesof the playground equipment that have contact with the soil. In a study conducted by DeGroot etal. (1979), treated southern pine wooden stakes were placed in sandy soil, and the lateral andvertical migration of CCA metal residues were measured after 30 years. Both arsenic andchromium residues leached into the top six inches of a soil core, arsenic as high as 108 ppm andchromium as high as 25 ppm. Some increase in arsenic levels, but not chromium levels, was seenin the six- to twelve-inch core. In the twelve- to eighteen-inch core, there did not appear to be anyincrease in the arsenic and chromium level. In soils which have a high clay or organic content,metal leaching would be expected to be lower because of the metal binding to the soil particles.Lateral movement of residues in the soil surrounding the stakes appeared to be limited to thezero- to three-inch area surrounding the treated stakes. Based on the findings in this and otherstudies, CCA metal residues are not likely to leach from vertically-placed wood structures placedin contact with the soil to depths greater than twelve inches or to lateral distances from thesetreated wood pieces of greater than three inches.
In another study conducted in Florida with CCA-treated decks (Townsend et al., 2001),nine decks were studied (one deck could not be confirmed as treated with CCA). The decks werelocated in Gainesville, Miami, and Tallahassee and sampling was conducted in 1999. The decksvaried in age from two to nineteen years old. A grid was set up under each deck before samplingwhere soil samples were collected. Surface samples, from the top inch of soil, and soil coresamples, of approximately seven inches in depth, were taken. Soil control samples were also takenat locations away from the grid. The soil samples were digested and analyzed for total arsenic,copper, and chromium. Analyses were performed using an atomic absorption spectrophotometer.This method determines the total metal residue level and does not speciate the metals.
Arsenic residues were found in the soil beneath all of the CCA-treated decks. The averagesurface arsenic level was 39 ppm and the maximum level under one deck was 217 ppm. Themaximum arsenic residue found under any of the other decks was 88 ppm. The maximum arsenicresidues present in soil core samples were in the top two inches, but were present at levels ofapproximately 2-20 ppm over the depth range of two to eight inches. Control arsenic valuesaverage 1.5 ppm.
2-18
The average surface copper residues found in the soil beneath all of the CCA-treateddecks was 40 ppm and the maximum level under one deck was 216 ppm (soil from the same deckreported high arsenic levels). The maximum copper residue found in soil under any of the otherdecks was 156 ppm. The maximum residues present in soil core samples were generally higher inthe top few inches of soil, and were higher than those levels in control samples.
The average surface chromium residues found in the soil beneath all of the treated deckswas 34 ppm and the maximum level under one deck was 198 ppm (soil from the same deck thatreported high arsenic levels). The maximum chromium residue found in soil under any of the otherdecks was 114 ppm. The average control level was 9.8 ppm. Average chromium levels of up to11.7 ppm were reported at depths of 4.5 inches.
The soils under the CCA-treated decks are described as ranging from beach sand to beingdark in color with a sponge-like consistency and with a high percentage of volatiles given offduring analysis. This latter observation seems to indicate a soil with high organic content. The sitewith the highest arsenic level was characterized as having relatively high volatile solids, and thiscorrelation can be found in five of the nine deck sites. The lowest arsenic residues were found atsites with low volatile solids content (Townsend et al., 2001). This study indicates that CCA-treated decks increase arsenic, copper, and chromium levels in soil beneath treated decks.
Based on the available information from both CCA-treated playground equipment anddecks, it appears that the primary source of soil exposure to children from playing on playgroundequipment constructed of CCA-treated wood or playing under treated decks would occur fromthe leaching of CCA metal residues from horizontal pieces of treated wood in the playgroundequipment and deck wood onto the soil. Maximum residue levels would likely be less than 200ppm arsenic, copper, and chromium, and, on the average, would be less than 50 ppm for each ofthe metals. Maximum residues of arsenic would likely occur in sandy soil under treated wood.However, if an organic material such as wood mulch with a high surface to weight relationshipwere placed under CCA-treated playground equipment, residues of the metals could be absorbedand retained in the material with slow leaching from the mulch. All three of the leaching studiesdescribed above are suitable to show that residues of copper, chromium, and arsenic leach fromtreated wood onto the soil under playground equipment and decks constructed of treated wood.Additional studies would be desirable, which reflect the use of CCA-treated wood in playgroundequipment, specifically, studies designed to sample soils beneath/adjacent to CCA-treatedplayground structures from different (representative) geographic regions of the United States.
2.2.4.4 Environmental Fate
Many studies in the recent literature (Lebow, 1996; Stilwell and Gorny, 1997; Stilwell,1998; Townsend et al., 2001; Osmose, 2000) report on leaching into soils. These studies haveshown that none of the three metals migrate large distances (twelve inches vertically and threeinches laterally) from the treated wood structure. Some studies have shown that thecontamination level is elevated in the soil compared to the natural background levels of these

2-19
metals. Such studies indicate that metals can be persistent in the soils, particularly on the soilsurfaces, and can result in environmental exposure. The metals show various speciationcharacteristics in soils, depending on the types of soil.
The metals migrating into water bodies can result in aqueous contamination. Metals alsoshow a tendency to speciate in water, and various species will be present in water depending onthe pH of water as well as the salinity. If water is highly acidic, the leaching rates and amounts ofleachates increase. Generally, in soil and water, the amounts of metals released are in the order ofCu > As > Cr. In some recent cases it has been shown that the order of release rates are: As > Cu > Cr. In all cases, the amounts of chromium released is least of the three metals.
Numerous studies on bioaccumulation in various aquatic organisms have also been carriedout over a period of time. A number of these aquatic species have shown a degree ofbioaccumulation, and toxic effects have been observed. The studies were conducted under varyingconditions and very few studies reported depuration rates.
An overall robust fate assessment cannot be made at this time, as the studies wereconducted under different laboratory or field conditions, which were not standardized. Hence,while one can determine the exposure and hazards of these metals on humans, plants, and aquaticorganisms, a complete fate assessment is not possible.
2.2.5 CCA Use and Potential Exposures to Components of CCA
The Agency is aware of potential exposure concerns to arsenic and chromium componentsof CCA-treated wood in decks and playground structures, and contaminated soils commonlyfound in these settings. During the pressure treatment of wood, CCA undergoes a fixation processwhere it initially is absorbed into the cellulosic and lignin structures of the wood. Chromium inthe form of Cr(VI) attaches itself to the ‘carboxylic groups’ of the cellulosic structure andconverts into Cr(III). Copper arsenate converts into basic copper arsenate. In pressure-treatedwood, arsenic leaches to the surface of the wood mostly as As(V), but there may be some As(III). Chromium leaches mostly as Cr(III); however, trace amounts of Cr(VI) may also be present.Copper is present as Cu(II) (U.S. EPA, 2001b).
Of the components in CCA, copper does not pose significant toxicity concerns comparedto arsenic and chromium. Copper is an essential nutrient that functions as a component of severalenzymes in humans, and the toxicity of copper in humans involves consumption of watercontaminated with high levels of copper (U.S. EPA, 2001b). Because of the relatively low toxicityof copper, the Agency did not conduct an exposure/risk assessment for copper. For chromium,hazard data clearly show that Cr(VI) demonstrates more significant toxicity than Cr(III)(Zartarian et al., 2003). Thus, the Agency felt that it would not be credible to apply Cr(VI)toxicity endpoints to Cr(total) residue results to assess incidental ingestion and dermal exposuresin children. Since the Agency has not identified any endpoints of concern for Cr(III), the short-term intermediate-term and lifetime risks to Cr(III) are not presented.
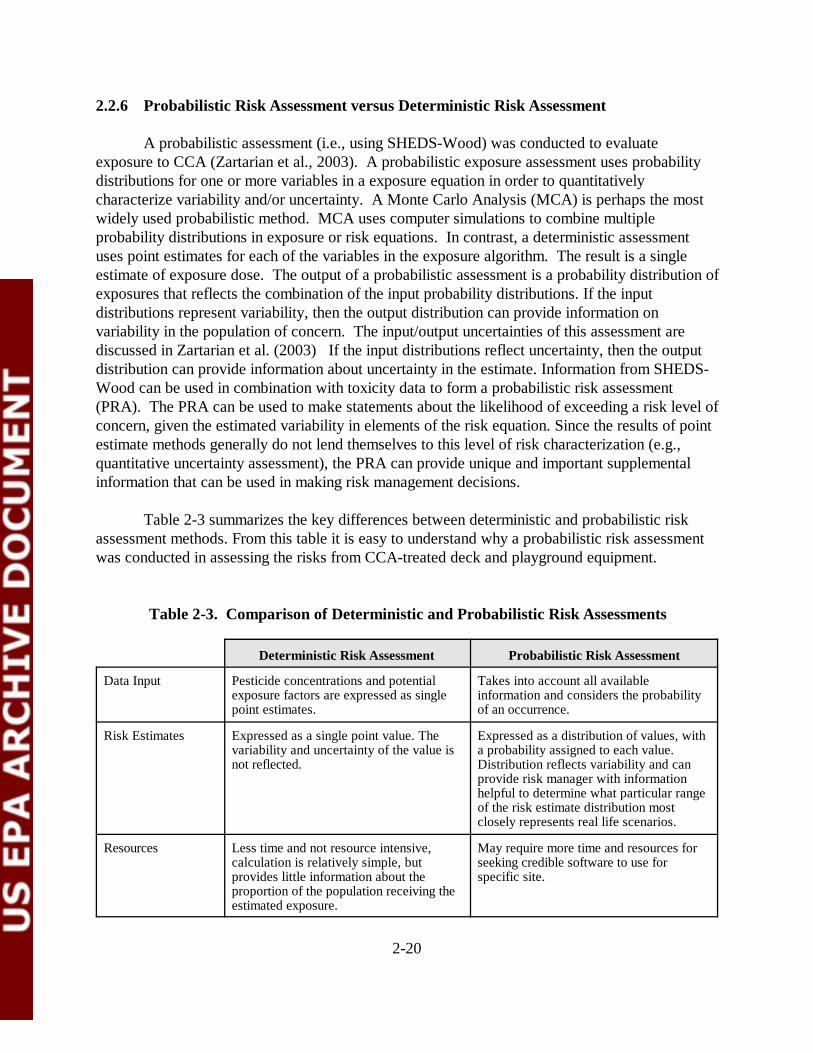
2-20
2.2.6 Probabilistic Risk Assessment versus Deterministic Risk Assessment
A probabilistic assessment (i.e., using SHEDS-Wood) was conducted to evaluateexposure to CCA (Zartarian et al., 2003). A probabilistic exposure assessment uses probabilitydistributions for one or more variables in a exposure equation in order to quantitativelycharacterize variability and/or uncertainty. A Monte Carlo Analysis (MCA) is perhaps the mostwidely used probabilistic method. MCA uses computer simulations to combine multipleprobability distributions in exposure or risk equations. In contrast, a deterministic assessmentuses point estimates for each of the variables in the exposure algorithm. The result is a singleestimate of exposure dose. The output of a probabilistic assessment is a probability distribution ofexposures that reflects the combination of the input probability distributions. If the inputdistributions represent variability, then the output distribution can provide information onvariability in the population of concern. The input/output uncertainties of this assessment arediscussed in Zartarian et al. (2003) If the input distributions reflect uncertainty, then the outputdistribution can provide information about uncertainty in the estimate. Information from SHEDS-Wood can be used in combination with toxicity data to form a probabilistic risk assessment(PRA). The PRA can be used to make statements about the likelihood of exceeding a risk level ofconcern, given the estimated variability in elements of the risk equation. Since the results of pointestimate methods generally do not lend themselves to this level of risk characterization (e.g.,quantitative uncertainty assessment), the PRA can provide unique and important supplementalinformation that can be used in making risk management decisions.
Table 2-3 summarizes the key differences between deterministic and probabilistic riskassessment methods. From this table it is easy to understand why a probabilistic risk assessmentwas conducted in assessing the risks from CCA-treated deck and playground equipment.
Table 2-3. Comparison of Deterministic and Probabilistic Risk Assessments
Deterministic Risk Assessment Probabilistic Risk Assessment
Data Input Pesticide concentrations and potentialexposure factors are expressed as singlepoint estimates.
Takes into account all availableinformation and considers the probabilityof an occurrence.
Risk Estimates Expressed as a single point value. Thevariability and uncertainty of the value isnot reflected.
Expressed as a distribution of values, witha probability assigned to each value. Distribution reflects variability and canprovide risk manager with informationhelpful to determine what particular rangeof the risk estimate distribution mostclosely represents real life scenarios.
Resources Less time and not resource intensive,calculation is relatively simple, butprovides little information about theproportion of the population receiving theestimated exposure.
May require more time and resources forseeking credible software to use forspecific site.
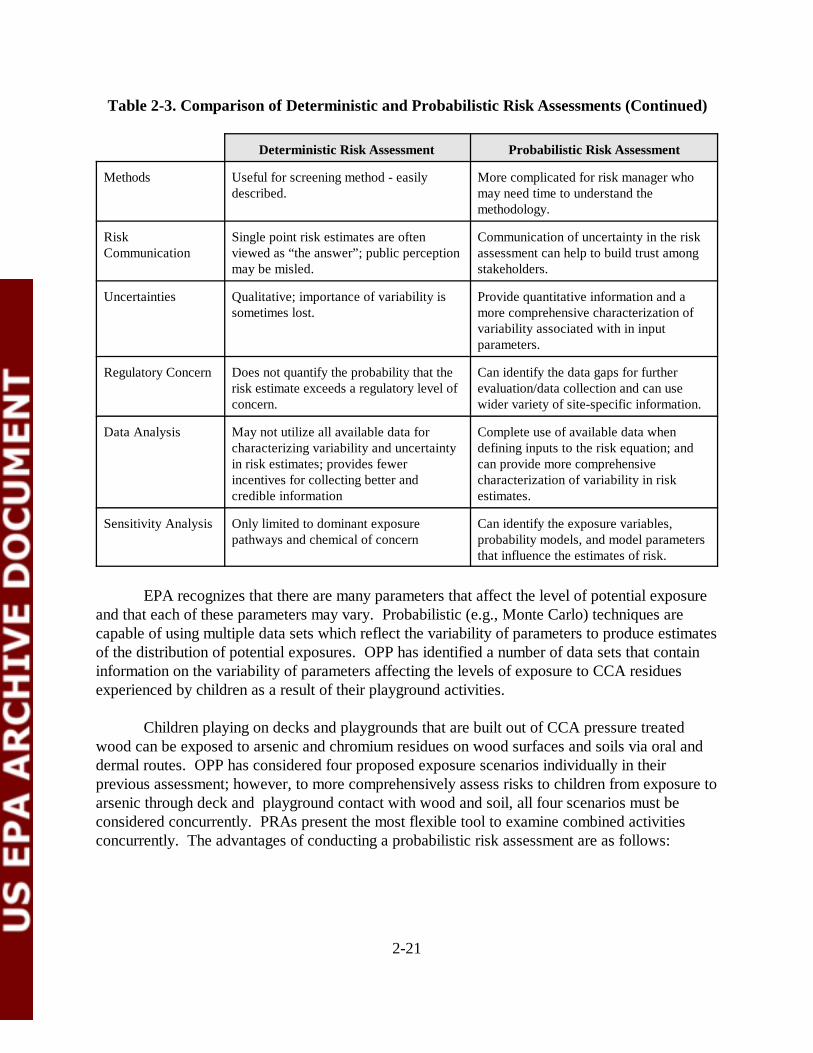
2-21
Table 2-3. Comparison of Deterministic and Probabilistic Risk Assessments (Continued)
Deterministic Risk Assessment Probabilistic Risk Assessment
Methods Useful for screening method - easilydescribed.
More complicated for risk manager whomay need time to understand themethodology.
RiskCommunication
Single point risk estimates are oftenviewed as “the answer”; public perceptionmay be misled.
Communication of uncertainty in the riskassessment can help to build trust amongstakeholders.
Uncertainties Qualitative; importance of variability issometimes lost.
Provide quantitative information and amore comprehensive characterization ofvariability associated with in inputparameters.
Regulatory Concern Does not quantify the probability that therisk estimate exceeds a regulatory level ofconcern.
Can identify the data gaps for furtherevaluation/data collection and can usewider variety of site-specific information.
Data Analysis May not utilize all available data forcharacterizing variability and uncertaintyin risk estimates; provides fewerincentives for collecting better andcredible information
Complete use of available data whendefining inputs to the risk equation; andcan provide more comprehensivecharacterization of variability in riskestimates.
Sensitivity Analysis Only limited to dominant exposurepathways and chemical of concern
Can identify the exposure variables,probability models, and model parametersthat influence the estimates of risk.
EPA recognizes that there are many parameters that affect the level of potential exposureand that each of these parameters may vary. Probabilistic (e.g., Monte Carlo) techniques arecapable of using multiple data sets which reflect the variability of parameters to produce estimatesof the distribution of potential exposures. OPP has identified a number of data sets that containinformation on the variability of parameters affecting the levels of exposure to CCA residuesexperienced by children as a result of their playground activities.
Children playing on decks and playgrounds that are built out of CCA pressure treatedwood can be exposed to arsenic and chromium residues on wood surfaces and soils via oral anddermal routes. OPP has considered four proposed exposure scenarios individually in theirprevious assessment; however, to more comprehensively assess risks to children from exposure toarsenic through deck and playground contact with wood and soil, all four scenarios must beconsidered concurrently. PRAs present the most flexible tool to examine combined activitiesconcurrently. The advantages of conducting a probabilistic risk assessment are as follows:
2-22
? PRAs more comprehensively address the distributions and variabilities of multiplesets of data in both inputs and outputs;
? PRAs offer more in depth analysis of uncertainty for both inputs and outputs;? PRAs present the most flexible tool to examine combined activities concurrently;
For residential exposure, children may be exposed to residues from playsets, decks,and soil concurrently;
? PRAs allow for more subsets of data (e.g., warm or cold environments, handwashing, bathing, etc.) and allow the user to separate the data and considerdifferent exposure considerations;
? PRAs characterize more of the statistical uncertainties and special sensitivities forcertain population groups (e.g., pica children);
? PRAs may show the actual shape of the composite distribution. For example, theactual distributions of the data may be lognormal instead of normal distribution;
? PRAs account for covariance between variables. The variance of the product couldbe inflated if there is a positive correlation between the variables;
? PRAs show the influence of a particular data set on the exposure, and graphicallydepict the data;
? PRAs show the distributional quartiles;? PRAs use sophisticated software that can reproduce the calculation quickly and
accurately;? PRAs allow for a comprehensive sensitivity analysis that can identify the exposure
variables, probability models, and model parameters that influence risk; and? PRAs more accurately quantify the upper bound high-end percentile of total risk to
more accurately help the risk managers make decisions based on the data.
2.2.7 EPA and OPP Regulatory Approach to PRA
Agency policy is that risk assessments should be conducted in a tiered approach,proceeding from simple to more complex analyses as the risk management situation requires(Agency Policy Document, 5/15/97)(U.S. EPA, 1998a). More complex analyses require greaterresources, and probabilistic assessments can represent high levels of complexity. In adeterministic assessment, exposure is expressed as a single value, which could represent an upper-bound scenario or a central tendency. If a deterministic analysis, based on conservativeassumptions, leads to risk estimates that are below levels of concern, then there is no need torefine risk assessments with more complex techniques (U.S. EPA, 1998a). However, if aconservative deterministic assessment leads to estimates above the level of concern, moresophisticated risk assessments may be warranted.
Probabilistic techniques offer a higher level of sophistication. In contrast to deterministictechniques, probabilistic risk assessments more fully consider ranges of values regarding potentialexposure, and then weights possible values by their probability of occurrence. Individual inputvalues used to generate a point estimate are replaced by a distribution reflecting a range ofpotential values; a computer simulation then repeatedly selects individual values from each
2-23
distribution to generate a range and frequency of potential exposures. In accordance with Agencypolicy at the current time, such techniques will not be considered for dose-response evaluations oftoxicological data (U.S. EPA,1998a), but are limited to exposure assessments.
3-1
3.0 EXPOSURE ASSESSMENT
Note: This chapter only provides a summary of the SHEDS-Wood exposure doses used forthe risk assessment. For the detailed probabilistic SHEDS-Wood exposureassessment please refer to Zartarian et al. (2003), A Probabilistic ExposureAssessment for Children Who Contact CCA-Treated Playsets and Decks, Draft FinalReport, September 25, 2003.
SHEDS-Wood, a probabilistic exposure model developed by ORD, was used to developthe exposure assessment for CCA. The exposure assumptions, pathways, exposure routes,algorithms, and methodologies for this model are explained in detail in a separate exposure report,Zartarian et al. (2003), prepared by ORD and OPP entitled, A Probabilistic Exposure Assessmentfor Children Who Contact CCA-Treated Playsets and Decks. The SHEDS-Wood documentprovides exposure doses as ADD and LADDs; it does not provide a risk analysis. A generaldescription of the exposure assessment approach for this model and a brief description of how theprobabilistic exposure assessment data were used in the risk analysis are described in the narrativebelow.
The SHEDS-Wood probabilistic exposure model evaluated exposure of children for twochemicals (arsenic and chromium) in two environmental media (soil and surface residues). Arsenic exposures were generated as both noncancer exposure doses (ADDs) and cancerexposure doses (LADDs). For chromium, only noncancer exposure doses (ADDs) werenecessary (refer to Chapter 4 for a discussion of chromium carcinogenicity). Thus, the Zartarianet al. (2003) probabilistic exposure assessment provided only chromium total ADDs for bothresidues and soil (i.e., LADDs were not generated). However for chromium, OPP made adecision to assess noncancer risks using soil ingestion ADDs only, because of the lack ofdetectable surface residues for Cr(VI) (see Chapter 2) and because of no specific dermal toxicityend-point exists for Cr(VI) (see Chapter 4). In addition, OPP and the FIFRA SAP wereconcerned that combining total chromium doses with Cr(VI) toxicity endpoints wouldoverestimate chromium risks. Because of this concern, ADDs for soil ingestion were developedspecifically for Cr(VI) in this assessment. The Cr(VI) soil ingestion ADDs were derived based onthe SAP Panel recommendations for chromium speciation (see Chapter 2). In summary, the totalchromium soil ingestion ADDs originally provided in the SHEDS-Wood data files were adjustedby multiplying the data by 0.10 (10%) to account for the portion of total chromium that isassumed to be present as Cr(VI) because of speciation.
Because there are two routes of exposure (dermal and oral) and two environmental media(soil and surface residues), SHEDS-Wood evaluates exposure based on four scenarios. Thesescenarios are: dermal contact with CCA-treated wood, dermal contact from CCA-contaminatedsoil near treated wood structures, mouthing hands after touching CCA-treated wood, andingesting CCA-contaminated soil. SHEDS-Wood was used to evaluate three exposure durations
3-2
short-term, intermediate-term, and average lifetime exposures (only for arsenic). The potentiallyexposed populations for this assessment are (1) children in the United States who contact CCA-treated wood (from decks and/or playsets) and/or (2) children in the United States who contactCCA-containing soil from public playsets (e.g., at a playground, a school, a daycare center). Asubset of these children was also assumed to contact CCA-treated wood residues and/or CCA-containing soil from residential playsets (i.e., at the child's own home or at another home) and/orresidential decks (i.e., at the child's own home or another home). This population was selectedbecause of the particular focus by CPSC and other groups on playground playsets in conjunctionwith EPA's focus on estimating the risk to children from various primary sources of CCA-treatedwood that children may contact (Zartarian et al., 2003).
Two bounding estimate climate scenarios (warm throughout the year and cold throughoutthe year) were considered, as well as three exposure time periods: short-term (one day to onemonth), intermediate-term (one month to six months), and average lifetime exposure (6 years overa 75 year lifetime). SHEDS-Wood calculated the predicted exposure (and dose) to arsenic andchromium using age and gender representative time-location activity data for children ages 1-6years old (Zartarian et al., 2003).
It should be noted that this risk assessment report does not address certain high riskgroups (e.g., children with autism, Down’s syndrome). This issue is, however, addressedqualitatively in the probabilistic exposure assessment (Zartarian et al., 2003). Exposures toarsenic for children with pica soil ingestion behavior were assessed. In addition, it should benoted that the probabilistic exposure assessment developed by Zartarian et al. (2003) containsadditional exposure scenarios (e.g., Tables 32 and 34) that were not included in this riskassessment.
The ADDs and LADDs derived from the SHEDS-Wood report (Zartarian et al., 2003) aresummarized in Tables 3-1 to 3-10. Tables 3-1 through 3-10 summarize the means, medians, 95percentiles, and 99 percentiles for arsenic ADDs/LADDs and Cr(VI) ADDs. These exposuredoses were used to generate MOEs and cancer risks for the risk characterization (see Chapter5.0) and risk reduction impact (see Chapter 6.0) chapters. The ADDs and LADDs are alsopresented later in probabilistic risk tables in Chapters 5 and 6 along with the corresponding MOEsand cancer risks. With the exception of the Cr(VI) ADDs, Zartarian et al. (2003) presented all ofthe exposure doses used to generate these tables, and the footnotes in Tables 3-1 to 3-10 indicatewhich corresponding table from Zartarian et al. (2003) was referenced. For Cr(VI), the footnotesreference the ADDs that are presented later in Chapter 5.
Tables 3-1 to 3-2 present ADDs for arsenic and chromium for short- and intermediate-term exposures. These tables attempt to capture the population of children that play on bothplaysets and decks in warm and cold climate settings. Tables 3-3 to 3-4 present ADDs forchildren exposed to playsets only. Table 3-5 presents arsenic ADDs for children with a special
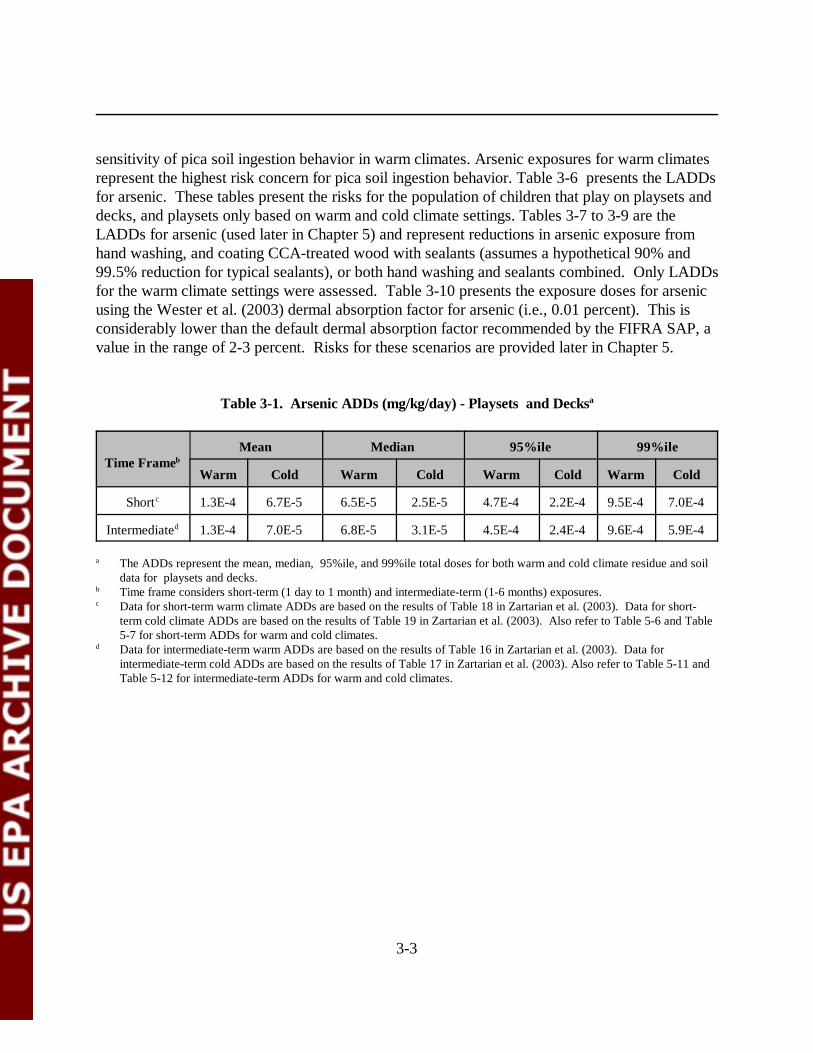
3-3
sensitivity of pica soil ingestion behavior in warm climates. Arsenic exposures for warm climatesrepresent the highest risk concern for pica soil ingestion behavior. Table 3-6 presents the LADDsfor arsenic. These tables present the risks for the population of children that play on playsets anddecks, and playsets only based on warm and cold climate settings. Tables 3-7 to 3-9 are theLADDs for arsenic (used later in Chapter 5) and represent reductions in arsenic exposure fromhand washing, and coating CCA-treated wood with sealants (assumes a hypothetical 90% and99.5% reduction for typical sealants), or both hand washing and sealants combined. Only LADDsfor the warm climate settings were assessed. Table 3-10 presents the exposure doses for arsenic using the Wester et al. (2003) dermal absorption factor for arsenic (i.e., 0.01 percent). This isconsiderably lower than the default dermal absorption factor recommended by the FIFRA SAP, avalue in the range of 2-3 percent. Risks for these scenarios are provided later in Chapter 5.
Table 3-1. Arsenic ADDs (mg/kg/day) - Playsets and Decksa
Time FramebMean Median 95%ile 99%ile
Warm Cold Warm Cold Warm Cold Warm Cold
Shortc 1.3E-4 6.7E-5 6.5E-5 2.5E-5 4.7E-4 2.2E-4 9.5E-4 7.0E-4
Intermediated 1.3E-4 7.0E-5 6.8E-5 3.1E-5 4.5E-4 2.4E-4 9.6E-4 5.9E-4
a The ADDs represent the mean, median, 95%ile, and 99%ile total doses for both warm and cold climate residue and soildata for playsets and decks.
b Time frame considers short-term (1 day to 1 month) and intermediate-term (1-6 months) exposures.c Data for short-term warm climate ADDs are based on the results of Table 18 in Zartarian et al. (2003). Data for short-
term cold climate ADDs are based on the results of Table 19 in Zartarian et al. (2003). Also refer to Table 5-6 and Table5-7 for short-term ADDs for warm and cold climates.
d Data for intermediate-term warm ADDs are based on the results of Table 16 in Zartarian et al. (2003). Data forintermediate-term cold ADDs are based on the results of Table 17 in Zartarian et al. (2003). Also refer to Table 5-11 andTable 5-12 for intermediate-term ADDs for warm and cold climates.
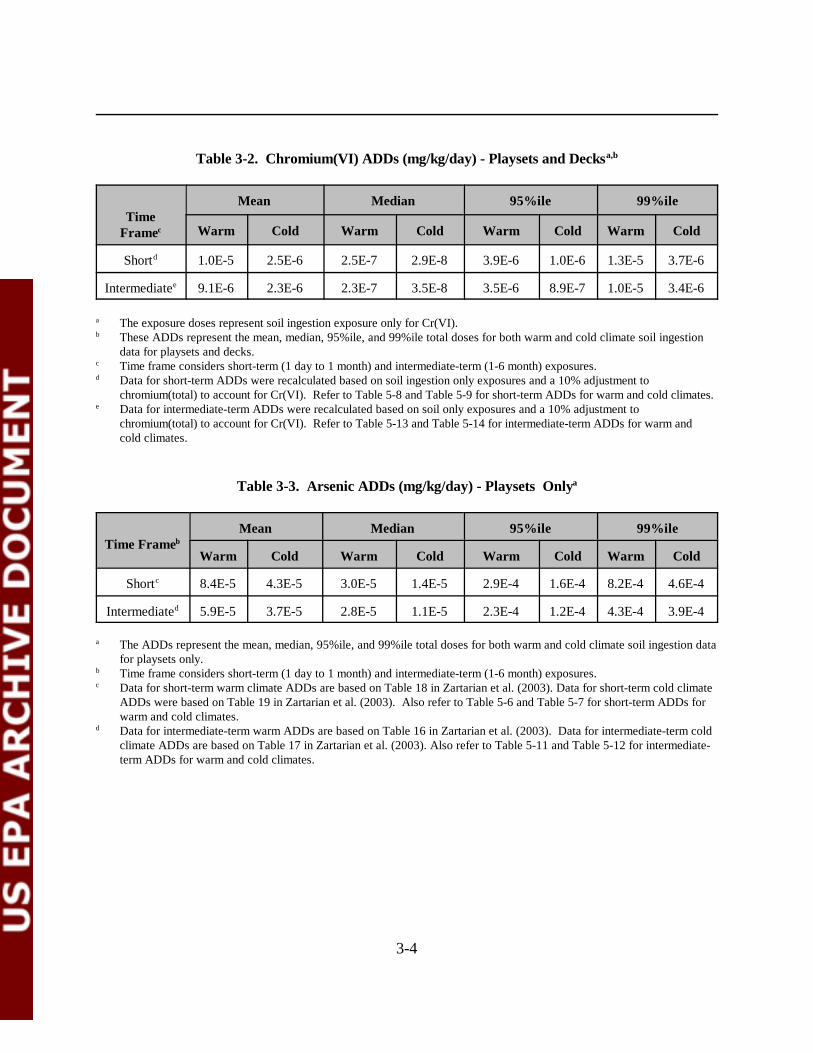
3-4
Table 3-2. Chromium(VI) ADDs (mg/kg/day) - Playsets and Decksa,b
TimeFramec
Mean Median 95%ile 99%ile
Warm Cold Warm Cold Warm Cold Warm Cold
Shortd 1.0E-5 2.5E-6 2.5E-7 2.9E-8 3.9E-6 1.0E-6 1.3E-5 3.7E-6
Intermediatee 9.1E-6 2.3E-6 2.3E-7 3.5E-8 3.5E-6 8.9E-7 1.0E-5 3.4E-6
a The exposure doses represent soil ingestion exposure only for Cr(VI). b These ADDs represent the mean, median, 95%ile, and 99%ile total doses for both warm and cold climate soil ingestion
data for playsets and decks.c Time frame considers short-term (1 day to 1 month) and intermediate-term (1-6 month) exposures.d Data for short-term ADDs were recalculated based on soil ingestion only exposures and a 10% adjustment to
chromium(total) to account for Cr(VI). Refer to Table 5-8 and Table 5-9 for short-term ADDs for warm and cold climates.e Data for intermediate-term ADDs were recalculated based on soil only exposures and a 10% adjustment to
chromium(total) to account for Cr(VI). Refer to Table 5-13 and Table 5-14 for intermediate-term ADDs for warm andcold climates.
Table 3-3. Arsenic ADDs (mg/kg/day) - Playsets Onlya
Time FramebMean Median 95%ile 99%ile
Warm Cold Warm Cold Warm Cold Warm Cold
Shortc 8.4E-5 4.3E-5 3.0E-5 1.4E-5 2.9E-4 1.6E-4 8.2E-4 4.6E-4
Intermediated 5.9E-5 3.7E-5 2.8E-5 1.1E-5 2.3E-4 1.2E-4 4.3E-4 3.9E-4
a The ADDs represent the mean, median, 95%ile, and 99%ile total doses for both warm and cold climate soil ingestion datafor playsets only.
b Time frame considers short-term (1 day to 1 month) and intermediate-term (1-6 month) exposures.c Data for short-term warm climate ADDs are based on Table 18 in Zartarian et al. (2003). Data for short-term cold climate
ADDs were based on Table 19 in Zartarian et al. (2003). Also refer to Table 5-6 and Table 5-7 for short-term ADDs forwarm and cold climates.
d Data for intermediate-term warm ADDs are based on Table 16 in Zartarian et al. (2003). Data for intermediate-term coldclimate ADDs are based on Table 17 in Zartarian et al. (2003). Also refer to Table 5-11 and Table 5-12 for intermediate-term ADDs for warm and cold climates.
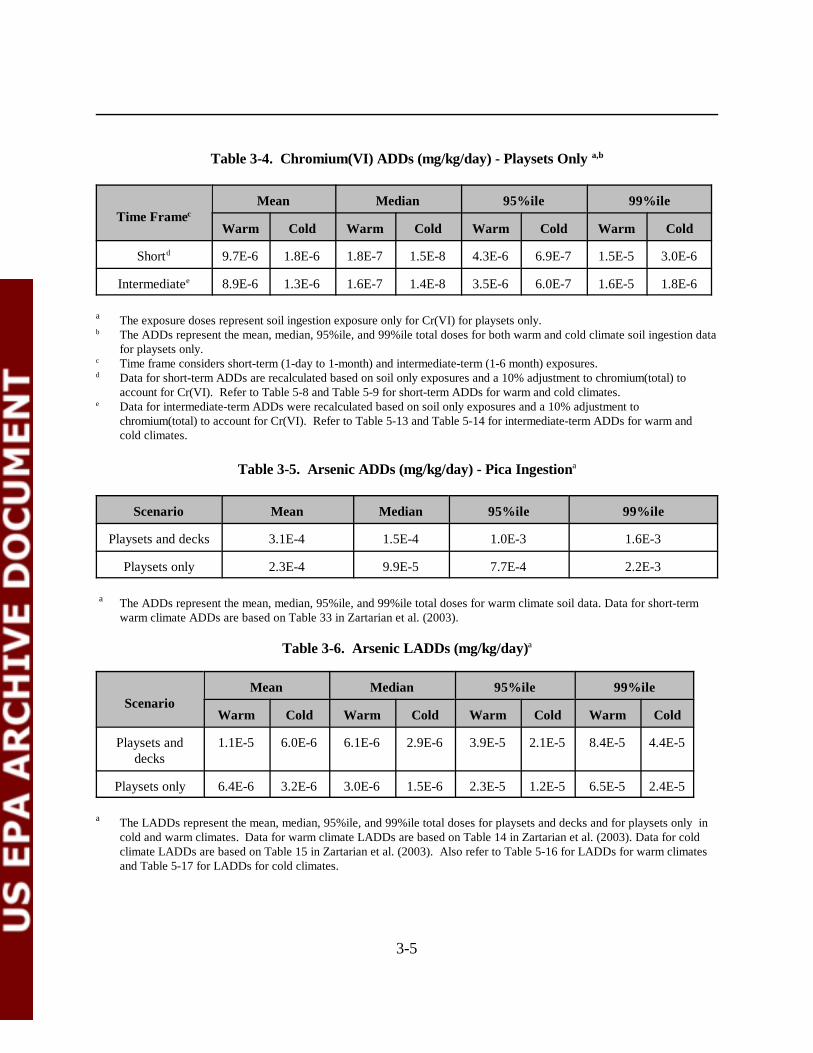
3-5
Table 3-4. Chromium(VI) ADDs (mg/kg/day) - Playsets Only a,b
Time FramecMean Median 95%ile 99%ile
Warm Cold Warm Cold Warm Cold Warm Cold
Shortd 9.7E-6 1.8E-6 1.8E-7 1.5E-8 4.3E-6 6.9E-7 1.5E-5 3.0E-6
Intermediatee 8.9E-6 1.3E-6 1.6E-7 1.4E-8 3.5E-6 6.0E-7 1.6E-5 1.8E-6
a The exposure doses represent soil ingestion exposure only for Cr(VI) for playsets only.b The ADDs represent the mean, median, 95%ile, and 99%ile total doses for both warm and cold climate soil ingestion data
for playsets only.c Time frame considers short-term (1-day to 1-month) and intermediate-term (1-6 month) exposures.d Data for short-term ADDs are recalculated based on soil only exposures and a 10% adjustment to chromium(total) to
account for Cr(VI). Refer to Table 5-8 and Table 5-9 for short-term ADDs for warm and cold climates.e Data for intermediate-term ADDs were recalculated based on soil only exposures and a 10% adjustment to
chromium(total) to account for Cr(VI). Refer to Table 5-13 and Table 5-14 for intermediate-term ADDs for warm andcold climates.
Table 3-5. Arsenic ADDs (mg/kg/day) - Pica Ingestiona
Scenario Mean Median 95%ile 99%ile
Playsets and decks 3.1E-4 1.5E-4 1.0E-3 1.6E-3
Playsets only 2.3E-4 9.9E-5 7.7E-4 2.2E-3
a The ADDs represent the mean, median, 95%ile, and 99%ile total doses for warm climate soil data. Data for short-termwarm climate ADDs are based on Table 33 in Zartarian et al. (2003).
Table 3-6. Arsenic LADDs (mg/kg/day)a
ScenarioMean Median 95%ile 99%ile
Warm Cold Warm Cold Warm Cold Warm Cold
Playsets anddecks
1.1E-5 6.0E-6 6.1E-6 2.9E-6 3.9E-5 2.1E-5 8.4E-5 4.4E-5
Playsets only 6.4E-6 3.2E-6 3.0E-6 1.5E-6 2.3E-5 1.2E-5 6.5E-5 2.4E-5
a The LADDs represent the mean, median, 95%ile, and 99%ile total doses for playsets and decks and for playsets only incold and warm climates. Data for warm climate LADDs are based on Table 14 in Zartarian et al. (2003). Data for coldclimate LADDs are based on Table 15 in Zartarian et al. (2003). Also refer to Table 5-16 for LADDs for warm climatesand Table 5-17 for LADDs for cold climates.
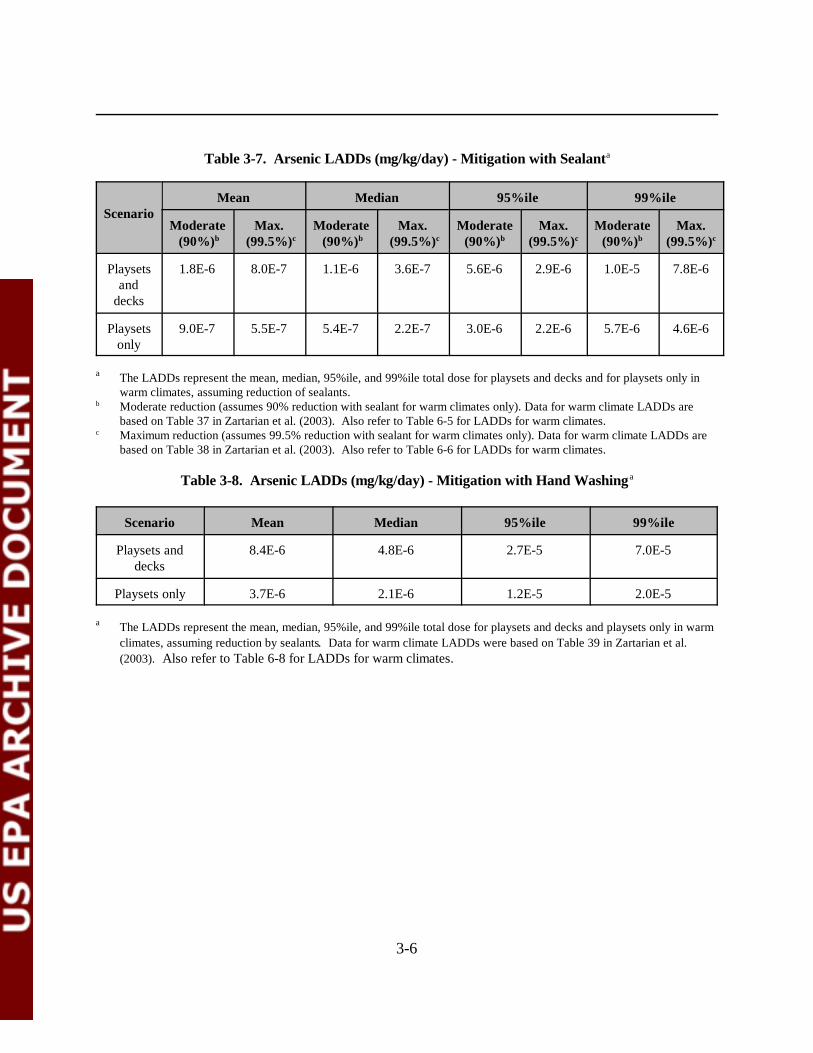
3-6
Table 3-7. Arsenic LADDs (mg/kg/day) - Mitigation with Sealanta
ScenarioMean Median 95%ile 99%ile
Moderate (90%)b
Max. (99.5%)c
Moderate (90%)b
Max. (99.5%)c
Moderate(90%)b
Max.(99.5%)c
Moderate(90%)b
Max.(99.5%)c
Playsetsand
decks
1.8E-6 8.0E-7 1.1E-6 3.6E-7 5.6E-6 2.9E-6 1.0E-5 7.8E-6
Playsetsonly
9.0E-7 5.5E-7 5.4E-7 2.2E-7 3.0E-6 2.2E-6 5.7E-6 4.6E-6
a The LADDs represent the mean, median, 95%ile, and 99%ile total dose for playsets and decks and for playsets only inwarm climates, assuming reduction of sealants.
b Moderate reduction (assumes 90% reduction with sealant for warm climates only). Data for warm climate LADDs arebased on Table 37 in Zartarian et al. (2003). Also refer to Table 6-5 for LADDs for warm climates.
c Maximum reduction (assumes 99.5% reduction with sealant for warm climates only). Data for warm climate LADDs arebased on Table 38 in Zartarian et al. (2003). Also refer to Table 6-6 for LADDs for warm climates.
Table 3-8. Arsenic LADDs (mg/kg/day) - Mitigation with Hand Washinga
Scenario Mean Median 95%ile 99%ile
Playsets anddecks
8.4E-6 4.8E-6 2.7E-5 7.0E-5
Playsets only 3.7E-6 2.1E-6 1.2E-5 2.0E-5
a The LADDs represent the mean, median, 95%ile, and 99%ile total dose for playsets and decks and playsets only in warmclimates, assuming reduction by sealants. Data for warm climate LADDs were based on Table 39 in Zartarian et al.(2003). Also refer to Table 6-8 for LADDs for warm climates.
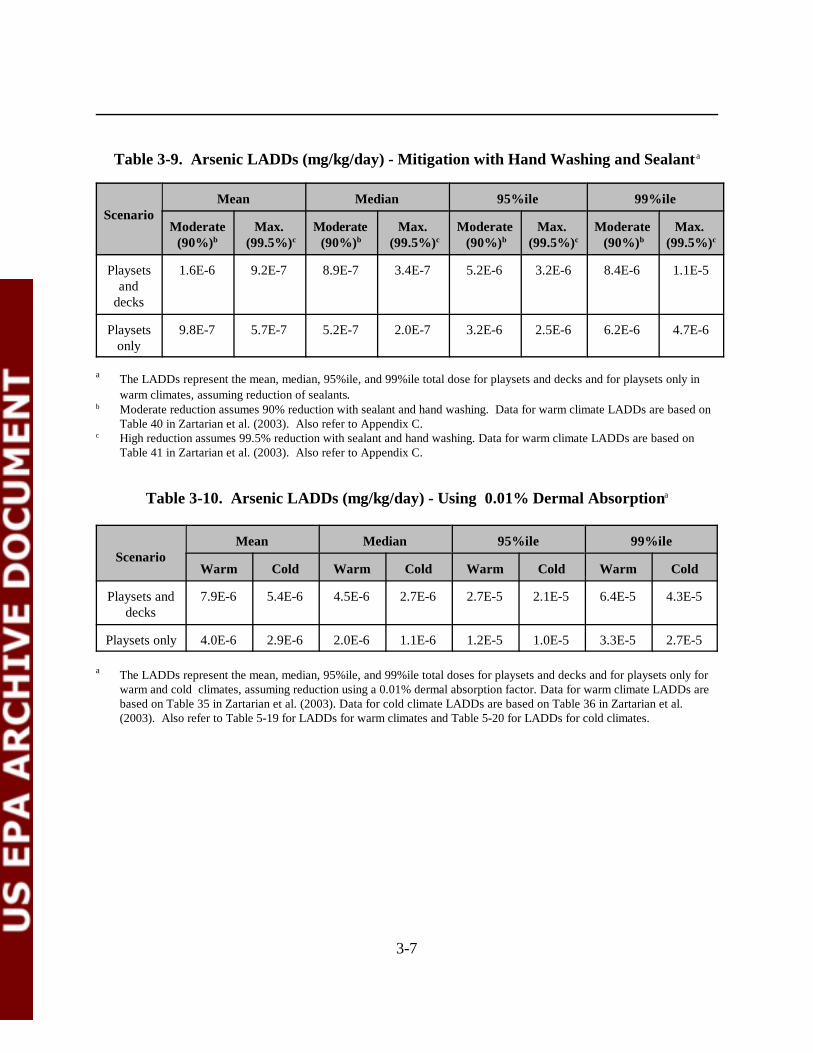
3-7
Table 3-9. Arsenic LADDs (mg/kg/day) - Mitigation with Hand Washing and Sealant a
ScenarioMean Median 95%ile 99%ile
Moderate(90%)b
Max. (99.5%)c
Moderate (90%)b
Max. (99.5%)c
Moderate (90%)b
Max. (99.5%)c
Moderate (90%)b
Max. (99.5%)c
Playsetsand
decks
1.6E-6 9.2E-7 8.9E-7 3.4E-7 5.2E-6 3.2E-6 8.4E-6 1.1E-5
Playsetsonly
9.8E-7 5.7E-7 5.2E-7 2.0E-7 3.2E-6 2.5E-6 6.2E-6 4.7E-6
a The LADDs represent the mean, median, 95%ile, and 99%ile total dose for playsets and decks and for playsets only inwarm climates, assuming reduction of sealants.
b Moderate reduction assumes 90% reduction with sealant and hand washing. Data for warm climate LADDs are based onTable 40 in Zartarian et al. (2003). Also refer to Appendix C.
c High reduction assumes 99.5% reduction with sealant and hand washing. Data for warm climate LADDs are based onTable 41 in Zartarian et al. (2003). Also refer to Appendix C.
Table 3-10. Arsenic LADDs (mg/kg/day) - Using 0.01% Dermal Absorptiona
ScenarioMean Median 95%ile 99%ile
Warm Cold Warm Cold Warm Cold Warm Cold
Playsets anddecks
7.9E-6 5.4E-6 4.5E-6 2.7E-6 2.7E-5 2.1E-5 6.4E-5 4.3E-5
Playsets only 4.0E-6 2.9E-6 2.0E-6 1.1E-6 1.2E-5 1.0E-5 3.3E-5 2.7E-5
a The LADDs represent the mean, median, 95%ile, and 99%ile total doses for playsets and decks and for playsets only forwarm and cold climates, assuming reduction using a 0.01% dermal absorption factor. Data for warm climate LADDs arebased on Table 35 in Zartarian et al. (2003). Data for cold climate LADDs are based on Table 36 in Zartarian et al.(2003). Also refer to Table 5-19 for LADDs for warm climates and Table 5-20 for LADDs for cold climates.
4-1
4.0 HAZARD ASSESSMENT
The purpose of the hazard assessment is to identify available evidence regarding thepotential for the chemical of concern to cause adverse effects to the potential receptor (individual)and to provide, where possible, an estimate of the relationship between the extent of exposure tothe chemical of concern and increased likelihood and/or severity of the adverse effects.
For noncancer toxic effects, available toxicology data are reviewed and no-observedadverse effect levels (NOAELs) and lowest observed adverse effect levels (LOAELs) aredeveloped for each study. Subsequently, the reviewed data for the chemical of concern arepresented to a committee of scientists within OPP who reach concurrence on toxicologyendpoints that best represent the toxic effects expected from various routes of exposure anddurations of exposure. Endpoints are selected for non-dietary exposures to represent short-term(1-30 days), intermediate-term (30-180 days), and long-term exposure scenarios, as needed. Inaddition, incidental oral exposure endpoints are selected for short-term and intermediate-termexposure durations to represent ingestion of the chemical of concern residues that may occur fromhand-to-mouth behaviors. In general, toxicity endpoint selection should, to the extent possible,match the temporal and spatial characteristics of the exposure scenarios selected for use in the riskassessment. These endpoints are then used in conjunction with exposure values to calculate risksassociated with various types of exposure, depending upon the uses of the chemical of concern(McMahon and Chen, 2003).
For carcinogenic effects of a chemical, a slope factor (SF), also know as potency factor, isderived. Slope factors are developed based on a dose-response curve for carcinogenicity of thespecific chemicals. The slope factors are developed from human and animal studies and aredesigned to be health protective. The SF is used to estimate an upper-bound probability of anindividual developing cancer as a result of exposure to a potential carcinogen. Carcinogens withEPA-derived slope factors are also given an EPA weight-of-evidence classification, whereby,potential carcinogens are grouped according to the likelihood that the chemical is a humancarcinogen, depending on the quality and quantity of carcinogenic potency data for a givenchemical.
For the current CCA risk assessment, arsenic and chromium were considered as theprimary chemicals of concern. The current policy, Conditions for Acceptance and associatedprinciples are not intended to apply to dose-response evaluations for human health riskassessments until this application has been studied further (Agency Policy Document, 5/15/1997)(U.S. EPA, 1997a). Currently, OPP does not have the Guidance to perform the probabilisticanalysis of toxicity endpoints. For this risk assessment, OPP used the endpoints developed byU.S. EPA, (McMahon and Chen, 2003), which are provided in Appendix A. These endpoints were developed using guidance provided by the FIFRA SAP (U.S., EPA, 2001c). As stated inthe Agency Policy Document, 5/15/97 (U.S. EPA, 1998), “For human health risk assessments, the

4-2
application of Monte Carlo and other probabilistic techniques has been limited to exposureassessments in the majority of cases. The current policy, Conditions for Acceptance andassociated guiding principles are not intended to apply to dose-response evaluations for humanhealth risks assessment until this application of probabilistic analysis has been studied further.” Currently, OPP does not have guidance available to perform the probabilistic analysis of toxicityendpoints. According to Agency policy, endpoints used in assessments should be consistent withthe exposure of concern (acute, subchronic, chronic), and should be those selected by the HEDHazard Identification Assessment Review Committee (HIARC), or selected in accordance withthe Draft Toxicology Endpoint Selection Process: A Guidance Document, presented to the SAPin February 1997. Thus, point estimates have been used to characterize toxicity for the CCA riskassessment. Toxicology endpoints for both inorganic arsenic and chromium have been selected forthe residential exposure assessment and are presented in Sections 4.1 and 4.2, respectively.Summary tables are provided in Section 4.3.
It also should be noted that the studies from Ginsberg (2003) and other researchers, andthe recent work on early-life exposures by ORD in the Draft Final Guidelines for CarcinogenicRisk Assessment (U.S. EPA, 2003a) and Supplemental Guidance for Assessing Cancer forEnvironment Assessment (U.S. EPA, 2003b), discussed the criteria for assessing early-lifeexposure. A discussion of early-life exposures to arsenic is presented in Section 4.4. In addition,a brief discussion of the relative bioavailabilities and dermal absorption values of arsenic andchromium in surface residues and soil are presented in Sections 4.5 and 4.6, respectively.
4.1 Arsenic
Based on the registered use of CCA-treated lumber for fencing and decking materials inresidential settings, both incidental oral and dermal exposures are expected. The studies selectedfor short- and intermediate-term incidental oral exposure were the human case reports ofFranzblau and Lilis (1989) and Mizuta et al. (1956) (see Appendix A). The oral LOAEL of 0.05mg/kg/day was selected, based on facial edema, gastrointestinal symptoms, neuropathy, and skinlesions observed at this dose level (see Appendix A). A Margin of Exposure (MOE) of 30 shouldbe applied to the oral LOAEL. This value consists of a 10x factor for intraspecies variation and a3x factor for extrapolating from a LOAEL to a NOAEL observed at the LOAEL of 0.05mg/kg/day.
Since there were no appropriate dermal studies, the same studies selected for short- andintermediate-term incidental oral exposure were selected for short- (1-30 days ) and intermediate-(30-180 days) term dermal exposure scenarios (see Appendix A). OPP did not develop anexposure assessment for long-term exposures (see Zartarian et al., 2003). Thus, the oral LOAELof 0.05 mg/kg/day was selected for dermal exposures, based on facial edema, gastrointestinalsymptoms, neuropathy, and skin lesions observed at this dose level. The dermal absorption factorapproach used in this assessment does not use a point estimate but uses a range of reported values
4-3
from the Wester et al. (1993) study which was recommended by the FIFRA Scientific AdvisoryPanel (U.S. EPA, 2001c). The same MOE of 30 was also selected for dermal exposure. No long-term incidental oral or dermal exposures are expected from residential exposure to arsenic inCCA-treated lumber. At the advice of the SAP, EPA decided not to quantify inhalation exposureto metals since such exposure would be minimal (U.S. EPA, 2001c).
For this risk assessment, an oral cancer slope factor of 3.67 (mg/kg/day)-1 was used. Thisvalue is based on the Agency’s risk assessment associated with inorganic arsenic in drinking waterpresented in 2000 (U.S. EPA, 2001e, personal communication with Andrew Schulman). It isconsistent with the slope factor used by the Office of Water for the arsenic MCL. See AppendixA for more details regarding the carcinogenic slope factor used. Following the risk assessmentassociated with inorganic arsenic in drinking water, which was presented in 2000, EPA asked theNational Research Council (NRC) to meet again to: (1) review EPA’s characterization ofpotential human health risks from ingestion of inorganic arsenic in drinking water; (2) review theavailable data on the carcinogenic and noncancer effects of inorganic arsenic; (3) review the dataon the metabolism, kinetics and mechanism(s)/mode(s) of action of inorganic arsenic; and (4)identify research needs to fill data gaps. In 2001, NRC published an update to the 1999 NRCreport (NRC, 1999) and concluded that: (1) arsenic-induced bladder and lung cancers still shouldbe the focus of arsenic-related cancer risk assessment; (2) southwestern Taiwan data are still themost appropriate for arsenic-related cancer risk assessment; and (3) present modes of action dataare not sufficient to depart from the default assumption of linearity. However, the 2001 NRCupdate made specific recommendations with respect to the overall cancer risk estimates. TheAgency is currently considering these recommendations and their potential impact on the cancerpotency estimate. Based on the Agency’s considerations of these recommendations, the currentproposed cancer potency number may change in the final version of this risk assessment.
4.2 Chromium
For chromium, hazard data clearly show that Cr(VI) demonstrates more significanttoxicity than Cr(III). During pressure treatment of wood, CCA undergoes a fixation processwhere it is initially absorbed into the cellulosic and lignin structures of the wood. Chromium, inthe form of Cr(VI), attaches itself to the ‘carboxylic groups’ of the cellulosic structure andconverts into Cr(III) (U.S. EPA, 2001c). More recent studies by the ACC and RTI Internationalindicate that Cr(III) is the main component in CCA pressure-treated wood (RTI International,2003; Nico et al., 2003; Cooper, 2003). Based on the non-detectable results of Cr(VI) in theCCA-treated wood in the Cooper (2003) and RTI International (2003) studies, the Agency feltthat it was not credible to assign Cr(VI) toxicity endpoints to total Cr surface residue results,since evidence indicates most of the Cr wood surface residues in wood are primarily Cr(III). Therefore, OPP did not assess the risks from incidental ingestion exposures in wood surfaceresidues for children in this assessment. However, the Agency felt that it would be appropriate toassess soil ingestion exposure to Cr(VI) (dermal toxicity endpoints were not identified for
4-4
Cr(VI)). Therefore, toxicity information to assess soil ingestion exposures to Cr(VI) wasrequired. As discussed in the Exposure Chapter (3.0), the total chromium doses from SHEDS-Wood for soil ingestion were multiplied by 0.10 (10%) to estimate a Cr(VI) equivalent dose. This was done for both short- and intermediate-term chromium doses. Toxicity endpoints forCr(VI) were then applied to the Cr(VI) equivalent doses to evaluate Cr(VI) risks.
Based on the registered use of CCA-treated lumber for fencing and decking materials inresidential settings, incidental oral exposure to chromium is expected, based on potential ingestionof soil contaminated with chromium as a result of leaching from wood. The study selected forshort- and intermediate-term incidental oral exposure was a developmental toxicity study in therabbit conducted by Tyl et al. (1991) and submitted to the Agency under MRID #42171201 (see Appendix A for details regarding this study). Based on the Tyl et al.(1991) study, a maternal NOAEL of 0.5 mg/kg/day and a LOAEL of 2.0 mg/kg/day wereselected as the short- and intermediate-term toxicity endpoints, based on the increased incidenceof maternal mortality and decreased body weight gain (see Appendix A for more description ofthe studies used to develop the toxicity endpoints). An MOE of 100 was assigned by OPP for thisendpoint (McMahon and Chen, 2003).
The U.S. EPA (1998b) IRIS document on Cr(VI) states that “chromium is one of themost common contact sensitizer in males in industrialized countries and is associated withoccupational exposures to numerous materials and processes.” In addition, it further states that“dermal exposure to chromium has been demonstrated to produce irritant and allergic contactdermatitis.” It was determined by the OPP HIARC that quantification of hazard from dermalexposure is not possible for chromium, due to the significant dermal irritation and sensitizationobserved. Therefore, no endpoints were determined by HIARC for Cr(VI) from dermalexposures. Dermal irritation and dermal sensitization are the primary concern for the dermalexposure route.
The members in the October 23-25, 2001, FIFRA SAP meeting agreed that the Agencyshould not consider the inhalation route of exposure for chromium in the risk assessment.
4.3 Summary Tables
All the selected non-cancer toxicological endpoints used for arsenic are summarized inTable 4-1. Table 4-2 presents the toxicological endpoints for Cr(VI). For child exposures in thisassessment, only the incidental ingestion and dermal exposure pathways were considered.
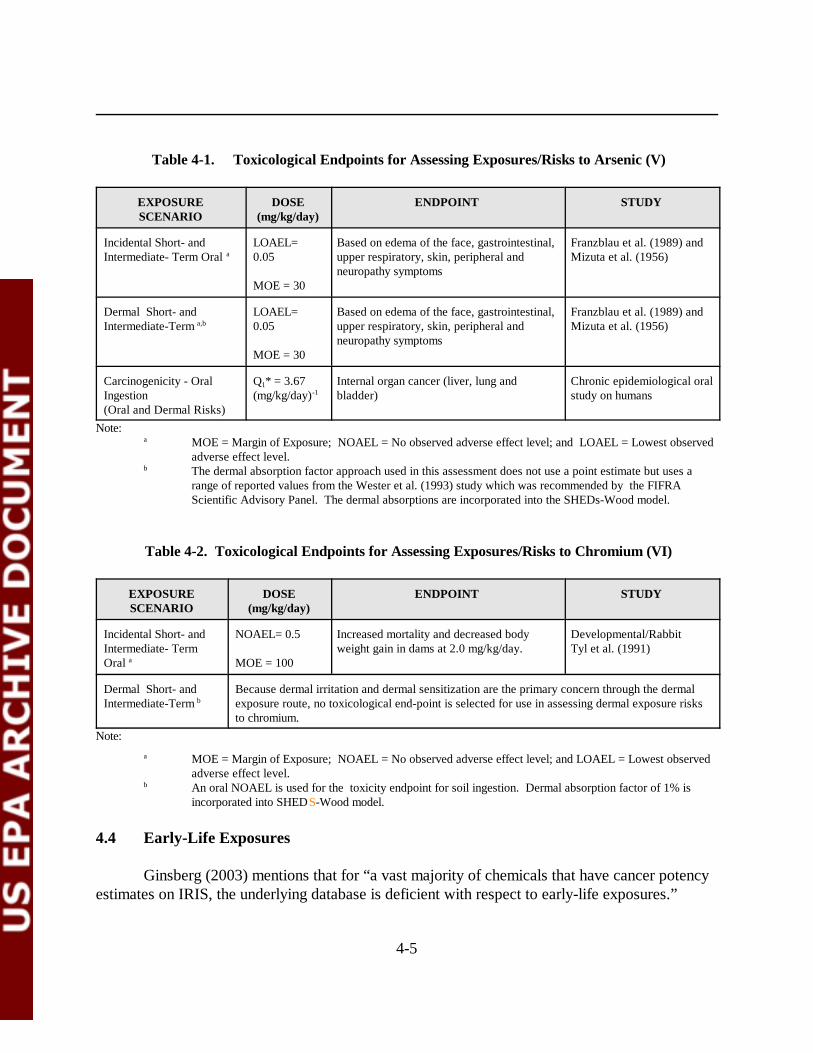
4-5
Table 4-1. Toxicological Endpoints for Assessing Exposures/Risks to Arsenic (V)
EXPOSURESCENARIO
DOSE(mg/kg/day)
ENDPOINT STUDY
Incidental Short- andIntermediate- Term Oral a
LOAEL=0.05
MOE = 30
Based on edema of the face, gastrointestinal,upper respiratory, skin, peripheral andneuropathy symptoms
Franzblau et al. (1989) andMizuta et al. (1956)
Dermal Short- andIntermediate-Term a,b
LOAEL=0.05
MOE = 30
Based on edema of the face, gastrointestinal,upper respiratory, skin, peripheral andneuropathy symptoms
Franzblau et al. (1989) andMizuta et al. (1956)
Carcinogenicity - OralIngestion(Oral and Dermal Risks)
Q1* = 3.67(mg/kg/day)-1
Internal organ cancer (liver, lung andbladder)
Chronic epidemiological oralstudy on humans
Note:a MOE = Margin of Exposure; NOAEL = No observed adverse effect level; and LOAEL = Lowest observed
adverse effect level.b The dermal absorption factor approach used in this assessment does not use a point estimate but uses a
range of reported values from the Wester et al. (1993) study which was recommended by the FIFRAScientific Advisory Panel. The dermal absorptions are incorporated into the SHEDs-Wood model.
Table 4-2. Toxicological Endpoints for Assessing Exposures/Risks to Chromium (VI)
EXPOSURESCENARIO
DOSE(mg/kg/day)
ENDPOINT STUDY
Incidental Short- andIntermediate- TermOral a
NOAEL= 0.5
MOE = 100
Increased mortality and decreased bodyweight gain in dams at 2.0 mg/kg/day.
Developmental/RabbitTyl et al. (1991)
Dermal Short- andIntermediate-Term b
Because dermal irritation and dermal sensitization are the primary concern through the dermalexposure route, no toxicological end-point is selected for use in assessing dermal exposure risksto chromium.
Note:a MOE = Margin of Exposure; NOAEL = No observed adverse effect level; and LOAEL = Lowest observed
adverse effect level.b An oral NOAEL is used for the toxicity endpoint for soil ingestion. Dermal absorption factor of 1% is
incorporated into SHEDS-Wood model.
4.4 Early-Life Exposures
Ginsberg (2003) mentions that for “a vast majority of chemicals that have cancer potencyestimates on IRIS, the underlying database is deficient with respect to early-life exposures.”

4-6
Ginsberg (2003) concluded that based on the results of his study “short-term exposures in earlylife are likely to yield a greater tumor response than short-term exposures in adults, but similartumor response when compared to long-term exposures in adults.” The risk attributable to early-life exposure often appears modest compared with the risk from lifetime exposure. It can be about10-fold higher than the risk from an exposure of similar duration occurring later in life (Ginsberg,2003).
ORD has recently published Draft Final Guidelines for Carcinogen Risk Assessment(U.S. EPA, 2003a) This document mentions the need to address early-life exposures fromcarcinogens. In addition, ORD has also published an external review draft document entitled the Supplemental Guidance for Assessing Cancer Susceptibility from Early Life Exposure toCarcinogens (U.S. EPA, 2003b). U.S. EPA (2003b) presents an approach for assessing cancersusceptibility from early-life exposure to carcinogens.
Much toxicity are available on arsenic; however, the data needed to account for anaccurate representation of early-life exposure to arsenic appears to be insufficient. For example,the arsenic, the National Resource Council (NRC, 2001) reports that “few studies of the effects ofarsenic on reproduction and development had been published” (NRC, 2001). NRC alsoconcluded “that although a large amount of research is available on arsenic’s mode of action, theexact nature of the carcinogenic action is not clear” (NRC, 2001). Finally, NRC concluded thatinorganic arsenic and its metabolites have been shown to induce chromosomal alterations andlarge deletion of mutations, but not point mutations.
Although there is some new evidence indicating that exposure to arsenic from drinkingwater during pregnancy may be associated with decreased birth weights of newborns (Hopenhayn,2003) and may increase the cancer incidence of the child in the later stage of life (Waalkes, 2003),the data needed to account for an accurate representation of early-life exposure of arsenic appearsto be insufficient (NRC, 2001). However, because the cancer slope factor used in this cancer riskassessment is derived from the epidemiology study using the Southwestern Taiwan data, it isgenerally believed that the sensitive population exposed to inorganic arsenic through drinkingwater during the most sensitive period of time is already included in the exposed population. Therefore, an adjustment factor does not appear to be appropriate in the cancer risk assessmentassociated with arsenic exposure.
4.5 Relative Bioavailability
The absorption of a chemical of concern is dependent on the matrix to which it is exposed. It is generally assumed that the absorption of the chemical of concern from the gastrointestinaltract is nearly complete. The toxicological endpoints were selected based on the administereddose, not the absorbed dose. However, when the chemical is in a different matrix, it may have adifferent absorption rate because it may be present in water-insoluble forms or interact with other
4-7
constituents in the matrix. The relative bioavailability of the chemical of concern, after it isexposed (water vs. soil), was defined as the percentage of the chemical of concern absorbed intothe body of a soil-dosed animal compared to that of an animal receiving a single dose of thechemical of concern in an aqueous solution.
The issue of arsenic and chromium relative bioavailability has already been discussed in theOctober 23-25, 2001, FIFRA SAP Meeting (see comments in Appendix F). Therecommendations of the FIFRA SAP for both arsenic and chromium have been incorporated intothe SHEDS-WOOD document to develop ADDs and LADDs (Zartanian et al., 2003). Asummary of relative bioavailability studies for arsenic is presented in Appendix E.
Arsenic
Zartarian et al. (2003) used data from ACC (2003a; 2003b) to determine the relativebioavailability for arsenic in the matrix of concern (either CCA-treated wood surface residue orsoil collected from areas around CCA-treated wood) vs. arsenic in water. According to Zartarianet al. (2003), the ACC data were fitted in SHEDS-Wood to a beta distribution, with a meanrelative bioavailability of 0.273 (27.3%) for CCA-treated wood surface residue vs. arsenic inwater. For arsenic in soil collected from an area close to CCA-treated wood, Zartarian et al.(2003) fitted the ACC (2003a) data to a beta distribution, with a mean relative bioavailability of0.476 (47.6%).
Chromium
Zartarian et al. (2003), per FIFRA SAP (U.S. EPA, 2001c) recommendations, assumed arelative bioavailability of 100% for both chromium surface residues and soil vs. chromium inwater.
4.6 Dermal Absorption
Arsenic
Although OPP reported a point estimate for dermal absorption from Wester et al. (1993)in the hazard assessment (see Appendix A), the dermal absorption factor approach used in theZartarian et al. (2003) probabilistic exposure assessment, and in this risk assessment, used a rangeof reported values from Wester et al. (1993). The distribution of values selected from SHEDS-Wood is described in more detail in the SHEDS-Wood probabilistic assessment (Zartarian et al.,2003). It should be noted that the approach used in SHEDS-Wood was consistent with therecommendations of the FIFRA Scientific Advisory Panel (U.S. EPA, 2001c). Wester et al.(1993) in vivo results with monkeys ranged from 2.0% to 6.4%. In the OPP 2001 deterministicassessment, OPP used 6.4% and later also used this for the occupational risk assessment in the
4-8
reregistration document. The 2001 SAP recommended a value in the range of 3%.” For theSHEDS-Wood assessment, ORD fit a triangular distribution to the Wester et al. (1993) data(Zartarian et al., 2003). Zartarain et al. (2003) also went on to say that “It was important to notethat because of dermal removal processes (hand washing, bathing, and hand mouthing), themodeled daily absorption rate is lower than the user-specified value. For a 3% per day input, theactual amount absorbed is predicted at about 1% per day. This is consistent with the SAP2001(U.S. EPA, 2001c) comment that the 2%-3% from the monkey studies may be too highbecause of real-world removal processes from skin noted above” (Zartarian et al., 2003).
Chromium
As noted in Section 4.2, dermal irritation and dermal sensitization are still the primaryconcern for the dermal exposure route. The FIFRA SAP noted that “it is unlikely that sufficientchromium could penetrate the skin and enter the circulation to cause systemic effects from dermalexposure. Skin penetration for chromium is estimated to be 1%. It is usually assumed that thecontribution to systemic effects from dermal exposure is not likely to be significant relative to oralexposure.”
5-1
5.0 RISK CHARACTERIZATION
5.1 Introduction
The objective of the risk characterization was to integrate toxicity data (see Chapter 4.0)with the results of the exposure assessment (Chapter 3.0) to evaluate potential human healthimpacts to children who are exposed to arsenic and chromium residues while playing on or nearCCA-treated wood playgrounds and decks. Children can be exposed to arsenic and chromiumresidues via hand-to-mouth ingestion and dermal absorption of residues in wood and soil. Thischapter presents the incremental risks from exposure to CCA-treated wood and does not addressrisks from exposure to all sources of arsenic and chromium in the environment. The probabilisticexposure assessment (Zartarian et al., 2003) used for this risk assessment was specific forexposure to surface residues from treated wood and surrounding soils.
This chapter presents a probabilistic risk characterization. Distributions were used forinput variables of the exposure dose algorithm, and the output of the exposure assessment was adistribution of risks across all members of the population. This exposure distribution wascombined with toxicity data to provide a risk distribution for members of the exposed population. A hypothetical example of a cumulative distribution function for cancer risk is shown inFigure 5-1. The x-axis of Figure 5-1 represents the excess lifetime cancer risk level and the y-axisrepresents the cumulative probability of the cancer risk level within the hypothetical population. The figure also shows various landmarks along the distribution curve, such as the 50th, 90th, 95thpercentiles, etc. For example, in Figure 5-1, the 95th percentile corresponds to a cancer risk of1.2E-06 and the 50th percentile corresponds to a cancer risk of 4.1E-07 (U.S. EPA, 2001d).
Risks due to exposure to CCA-treated wood were evaluated for noncancer and cancereffects. Cancer risk refers to the probability of increased cancer incidence resulting from exposureto proven or suspected carcinogenic chemicals. Cancer risk is generally expressed in scientificnotation (e.g., an individual excess lifetime risk of 1 in 10,000 is represented as 1 x 10⁻⁴ or 1E-04).The impact of carcinogenic chemicals was assessed by combining chemical-specific estimates ofdoses and toxicity values (slope factors) and comparing the estimated risks to specified risk levels. Noncancer effects were evaluated by calculating the ratio of the NOAEL or the LOAEL to theprojected or estimated intake (i.e., dose). The resulting value is termed the MOE. The larger theMOE, the more unlikely it is that a noncancer adverse effect would occur. EPA established aguidance MOE value of 30 for arsenic and 100 for chromium (Cr(VI)) to account for theuncertainties associated with the toxicity data and other factors. Some of the 2001 SAP Panelmembers cautioned that when the calculated MOE is below the acceptable MOE, it does notnecessarily mean that health effects will occur. The presence or absence of health effects shouldnot be drawn solely on whether there calculated MOEs exceed the acceptable MOEs (U.S. EPA,
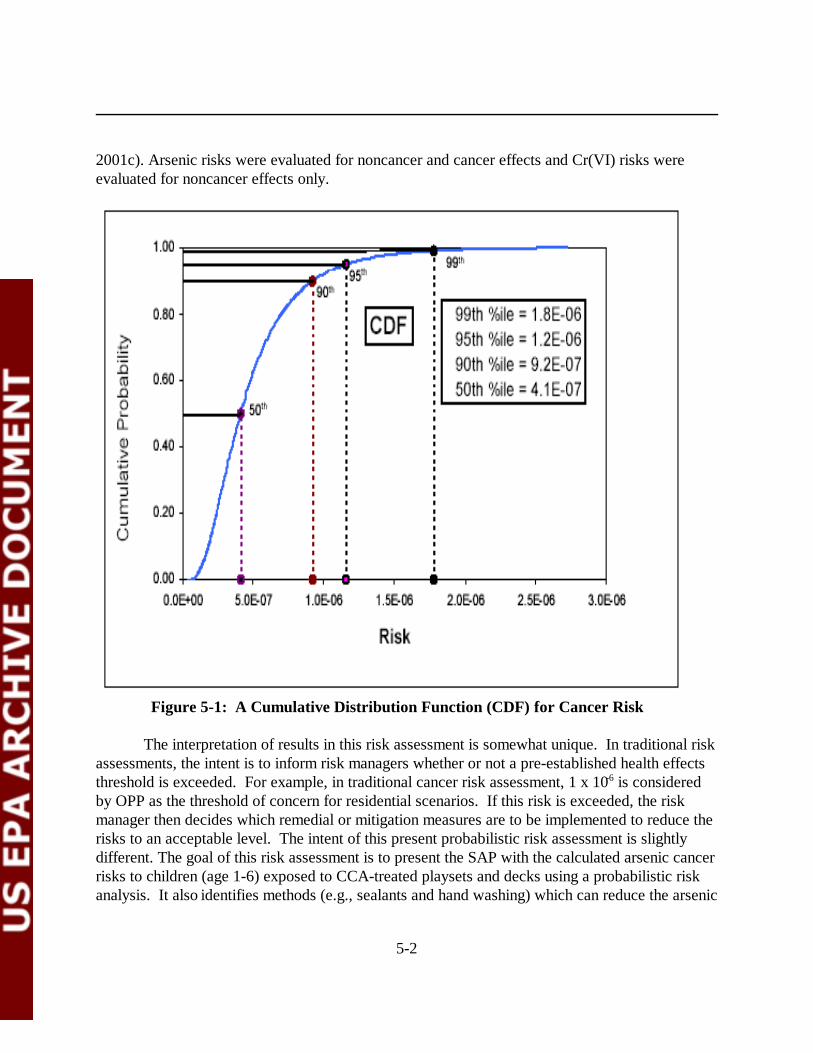
5-2
2001c). Arsenic risks were evaluated for noncancer and cancer effects and Cr(VI) risks wereevaluated for noncancer effects only.
Figure 5-1: A Cumulative Distribution Function (CDF) for Cancer Risk
The interpretation of results in this risk assessment is somewhat unique. In traditional riskassessments, the intent is to inform risk managers whether or not a pre-established health effectsthreshold is exceeded. For example, in traditional cancer risk assessment, 1 x 10⁻⁶ is consideredby OPP as the threshold of concern for residential scenarios. If this risk is exceeded, the riskmanager then decides which remedial or mitigation measures are to be implemented to reduce therisks to an acceptable level. The intent of this present probabilistic risk assessment is slightlydifferent. The goal of this risk assessment is to present the SAP with the calculated arsenic cancerrisks to children (age 1-6) exposed to CCA-treated playsets and decks using a probabilistic riskanalysis. It also identifies methods (e.g., sealants and hand washing) which can reduce the arsenic
5-3
cancer risks to children. However, there is no concluding statement regarding the percentiles ofthe distribution or point estimates (e.g., mean , 50th , 90th , 95th, etc) at which risk managementdecisions will be made. OPP intends to provide recommendations on how risk managers shouldinterpret the results of this risk assessment, after receiving technical comments from the FIFRASAP on evaluating probabilistic risk distributions. OPP will carefully consider the FIFRA SAP’scomments on this issue.
5.2 Results
Noncancer MOEs and cancer risks were generated based on the exposure doses calculatedby the SHEDS-Wood model (Zartarian et al., 2003), as summarized in Chapter 3 of thisdocument, and the selected toxicological endpoint doses described in Chapter 4 of this document. Exposure doses were generated for the following:
• Two exposure routes - dermal and oral;• Three durations - short, intermediate, and lifetime;• Two sources of exposure - playset only, and playset and deck;• Two climates - warm and cold; and• Two chemicals - arsenic and chromium.
The exposed population of interest was children; ages 1 to 6 years. The durations of exposurewere defined as short (1 day to 1 month); intermediate (1-6 months); and lifetime (6 yearsaveraged over 75 years).
Table 5-1 presents a summary of the risk assessment results for noncancer and cancerrisks. This table indicates which exposure conditions exceed specified risk levels. The summaryis presented according to exposure scenario (i.e., source of exposure, climate, and duration ofexposure for noncarcinogens). For the noncancer effects of arsenic, estimated MOEs were foundto be greater than the guidance MOE of 30 for all exposures at the 99.6th percentile. For thenoncancer effects of chromium, none of the exposure scenarios evaluated had estimated MOEsthat fell below the target MOE of 100.
Cancer risks from arsenic were compared to the three levels of risk: 10-6, 10-5, and 10-4. Values reported in Table 5-1 are the cumulative probabilities above which the respectiverisk level has been exceeded. For example, for exposure to playsets only in a warm climate, therisk level of 10-6 was exceeded at the 3rd percentile; 97% of the SHEDS-Wood simulatedpopulation had risks that exceeded 10-6. Cancer risks were found to be higher for the warmclimate scenario than the cold climate scenario, reflecting the increased exposure in a warmclimate. The 10-6 risk level was exceeded across all exposure scenarios at the very low end (i.e.,less than 10th percentile) of the cumulative probability distribution. The 10-4 risk level was
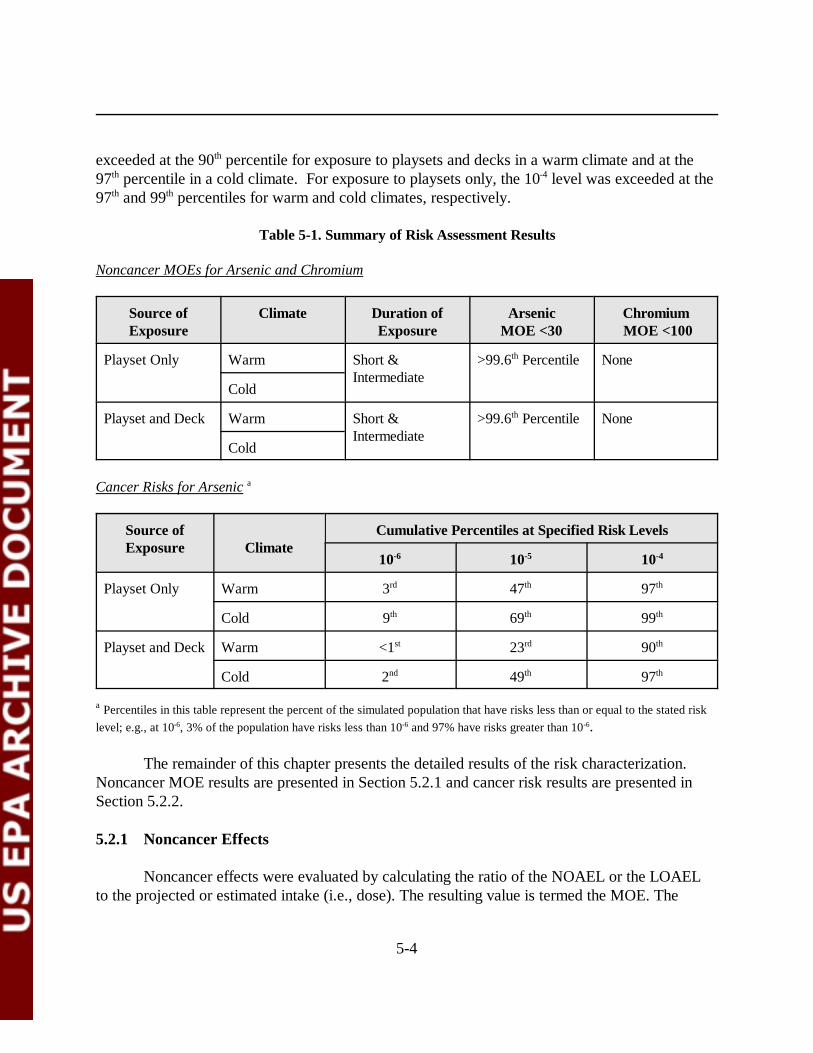
5-4
exceeded at the 90th percentile for exposure to playsets and decks in a warm climate and at the97th percentile in a cold climate. For exposure to playsets only, the 10-4 level was exceeded at the97th and 99th percentiles for warm and cold climates, respectively.
Table 5-1. Summary of Risk Assessment Results
Noncancer MOEs for Arsenic and Chromium
Source ofExposure
Climate Duration ofExposure
ArsenicMOE <30
Chromium MOE <100
Playset Only Warm Short &Intermediate
>99.6th Percentile None
Cold
Playset and Deck Warm Short &Intermediate
>99.6th Percentile None
Cold
Cancer Risks for Arsenic a
Source ofExposure Climate
Cumulative Percentiles at Specified Risk Levels
10-6 10-5 10-4
Playset Only Warm 3rd 47th 97th
Cold 9th 69th 99th
Playset and Deck Warm <1st 23rd 90th
Cold 2nd 49th 97th
a Percentiles in this table represent the percent of the simulated population that have risks less than or equal to the stated risklevel; e.g., at 10-6, 3% of the population have risks less than 10-6 and 97% have risks greater than 10-6.
The remainder of this chapter presents the detailed results of the risk characterization. Noncancer MOE results are presented in Section 5.2.1 and cancer risk results are presented inSection 5.2.2.
5.2.1 Noncancer Effects
Noncancer effects were evaluated by calculating the ratio of the NOAEL or the LOAELto the projected or estimated intake (i.e., dose). The resulting value is termed the MOE. The
1 Cr(VI) exposures/risks from soil ingestion were calculated by assuming 10 percent ofthe chromium in soil was present as Cr(VI).
5-5
larger the MOE, the more unlikely it is that a noncancer adverse effect would occur. EPAestablished an acceptable MOE value of 30 for arsenic and 100 for chromium (Cr(VI)) to accountfor the uncertainties associated with the toxicity data and other factors. When the calculated MOEis below the acceptable MOE, it does not necessary mean that health effects will occur. EPA usesthe MOE approach in a screening level capacity only. That is, firm conclusions on the presence orabsence of health effects should not be drawn solely on whether the calculated MOEs exceed theacceptable MOEs. For arsenic, the LOAEL used was 0.05 mg/kg/day and the target MOE was30. For Cr(VI), the NOAEL used was 0.5 mg/kg/day and the guidance MOE was 100. Theequation used for this calculation was:
MOE = NOAEL or LOAEL / ADD
Where:
NOAEL = No-Observed-Adverse-Effect Level (mg/kg/day);LOAEL = Lowest-Observed-Adverse-Effect Level (mg/kg/day); andADD = Average Daily Dose (mg/kg/day).
Results are first presented for general population exposure and then for children with picabehavior.
Tables 5-2 and 5-3 present the MOEs for children who play on outdoor CCA-treatedplaysets only. The MOEs were calculated based on different exposure durations (short-term andintermediate) and climates (warm and cold). Data were generated, and are presented in thissection, for the mean, median, 95th percentile, and 99th percentile of the distributions. Table 5-2presents the arsenic MOEs for exposure to playsets only. The cold climate conditions were foundto have a larger MOE than for the warm climate conditions. For all conditions, the MOEs werefound to be substantially greater (minimum factor of 2) than the guidance MOE of 30. Table 5-3presents the MOEs for Cr(VI) for the same scenarios.1 All the chromium MOEs were found to beat least two orders of magnitude above the target MOE of 100.
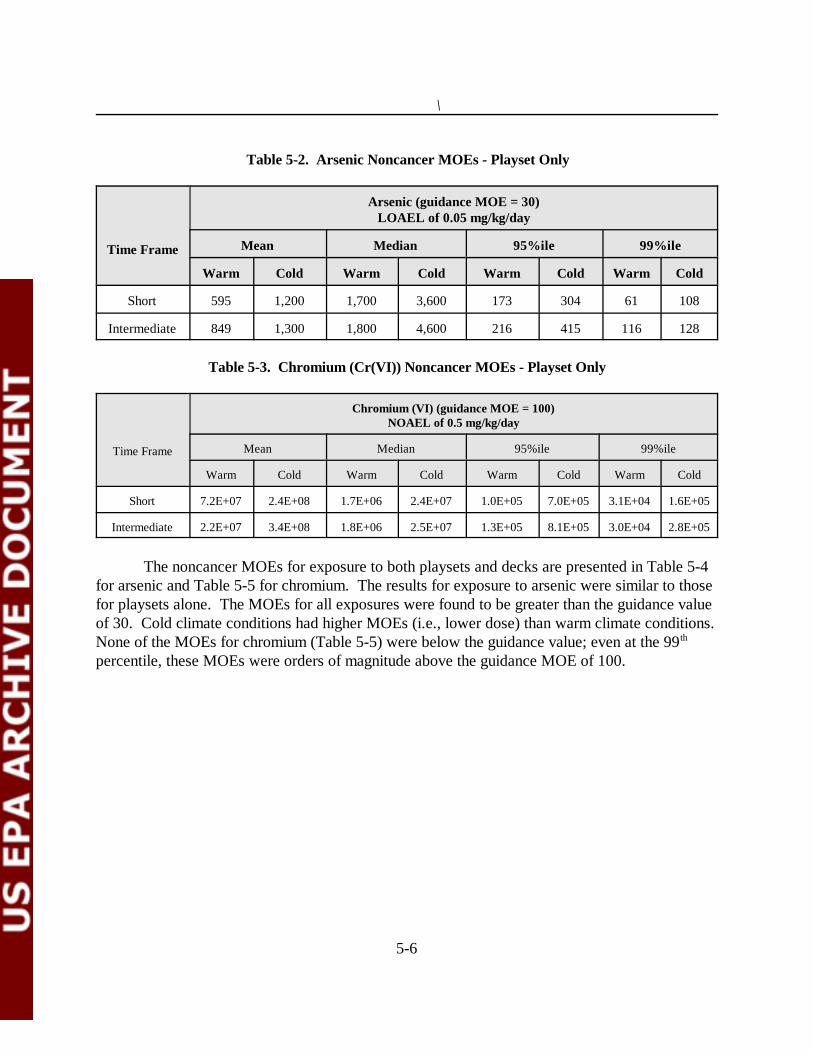
\
5-6
Table 5-2. Arsenic Noncancer MOEs - Playset Only
Time Frame
Arsenic (guidance MOE = 30)LOAEL of 0.05 mg/kg/day
Mean Median 95%ile 99%ile
Warm Cold Warm Cold Warm Cold Warm Cold
Short 595 1,200 1,700 3,600 173 304 61 108
Intermediate 849 1,300 1,800 4,600 216 415 116 128
Table 5-3. Chromium (Cr(VI)) Noncancer MOEs - Playset Only
Time Frame
Chromium (VI) (guidance MOE = 100)NOAEL of 0.5 mg/kg/day
Mean Median 95%ile 99%ile
Warm Cold Warm Cold Warm Cold Warm Cold
Short 7.2E+07 2.4E+08 1.7E+06 2.4E+07 1.0E+05 7.0E+05 3.1E+04 1.6E+05
Intermediate 2.2E+07 3.4E+08 1.8E+06 2.5E+07 1.3E+05 8.1E+05 3.0E+04 2.8E+05
The noncancer MOEs for exposure to both playsets and decks are presented in Table 5-4for arsenic and Table 5-5 for chromium. The results for exposure to arsenic were similar to thosefor playsets alone. The MOEs for all exposures were found to be greater than the guidance valueof 30. Cold climate conditions had higher MOEs (i.e., lower dose) than warm climate conditions. None of the MOEs for chromium (Table 5-5) were below the guidance value; even at the 99th
percentile, these MOEs were orders of magnitude above the guidance MOE of 100.
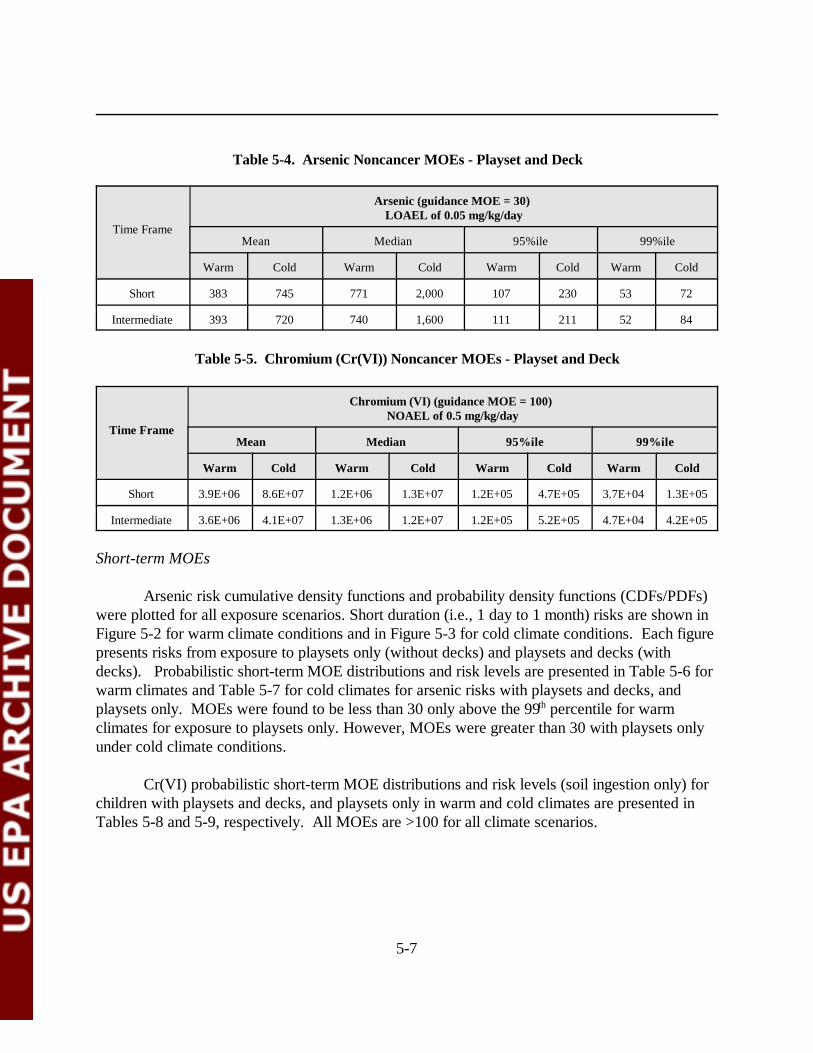
5-7
Table 5-4. Arsenic Noncancer MOEs - Playset and Deck
Time Frame
Arsenic (guidance MOE = 30) LOAEL of 0.05 mg/kg/day
Mean Median 95%ile 99%ile
Warm Cold Warm Cold Warm Cold Warm Cold
Short 383 745 771 2,000 107 230 53 72
Intermediate 393 720 740 1,600 111 211 52 84
Table 5-5. Chromium (Cr(VI)) Noncancer MOEs - Playset and Deck
Time Frame
Chromium (VI) (guidance MOE = 100) NOAEL of 0.5 mg/kg/day
Mean Median 95%ile 99%ile
Warm Cold Warm Cold Warm Cold Warm Cold
Short 3.9E+06 8.6E+07 1.2E+06 1.3E+07 1.2E+05 4.7E+05 3.7E+04 1.3E+05
Intermediate 3.6E+06 4.1E+07 1.3E+06 1.2E+07 1.2E+05 5.2E+05 4.7E+04 4.2E+05
Short-term MOEs
Arsenic risk cumulative density functions and probability density functions (CDFs/PDFs)were plotted for all exposure scenarios. Short duration (i.e., 1 day to 1 month) risks are shown inFigure 5-2 for warm climate conditions and in Figure 5-3 for cold climate conditions. Each figurepresents risks from exposure to playsets only (without decks) and playsets and decks (withdecks). Probabilistic short-term MOE distributions and risk levels are presented in Table 5-6 forwarm climates and Table 5-7 for cold climates for arsenic risks with playsets and decks, andplaysets only. MOEs were found to be less than 30 only above the 99th percentile for warmclimates for exposure to playsets only. However, MOEs were greater than 30 with playsets onlyunder cold climate conditions.
Cr(VI) probabilistic short-term MOE distributions and risk levels (soil ingestion only) forchildren with playsets and decks, and playsets only in warm and cold climates are presented inTables 5-8 and 5-9, respectively. All MOEs are >100 for all climate scenarios.

5-8
Histogram (E5 (table 18).sta) y = 746 * 1004.83 * lognorm (x, 7.428197, 1.466526)
(N for MOE > 10,000 = 7)MOE (Truncated at 10,000)
Pro
babi
lity
Den
sity
0%
10%
20%
30%
40%
50%
60%
70%
80%
90%
100%
0
1000
2000
3000
4000
5000
6000
7000
8000
9000
1000
0
Histogram (E5 (table 18).sta) y = 710 * 1002.237 * lognorm (x, 6.71147, 1.302973)
(N for MOE > 10,000 = 22)MOE (Truncated at 10,000)
Pro
bilit
y D
ensi
ty
0%
10%
20%
30%
40%
50%
60%
70%
80%
90%
100%
0
1000
2000
3000
4000
5000
6000
7000
8000
9000
1000
0
Without Decks With Decks
MOE of Short-Term ADD for Children Exposed to ArsenicDislodgeable Residues and Contaminated Soil from Treated Wood
Playsets and Residential Decks in Warm Climate(separated by children with and without decks)
Scatterplot (E5 (table 18).sta)
MOE
Cum
ulat
ive
Pro
babi
lity
Den
sity
0.0
0.1
0.2
0.3
0.4
0.5
0.6
0.7
0.8
0.9
1.0
1.0e
1
1.0e
2
1.0e
3
1.0e
4
1.0e
5
1.0e
6
1.0e
7
hmdeck=0hmdeck=1
Without Decks99% = 6195% = 17350% = 1667mean = 595With Decks99% = 5395% = 10750% = 771mean = 383
Note: MOE was not calculated for cases where dose = 0.0. As a result, the n for deck = 0 was reduced from 755 to 753.
With Decks
Without Decks
Figure 5-2

DO NOT CITE, QUOTE, OR DISTRIBUTE
5-9
Histogram (E6 (table 19).sta) y = 708 * 9990.2 * lognorm (x, 8.17327, 1.62748)
(N for MOE > 100,000 = 48)MOE (Trucated at 100,000)
Pro
babi
lity
Den
sity
0%
10%
20%
30%
40%
50%
60%
70%
80%
90%
100%
0
1000
0
2000
0
3000
0
4000
0
5000
0
6000
0
7000
0
8000
0
9000
0
1e5
Histogram (E6 (table 19).sta) y = 714 * 5047.705 * lognorm (x, 7.58521, 1.43615)
(N for MOE > 50,000 = 22)MOE (Truncated at 50,000)
Pro
babi
lity
Den
sity
0%
10%
20%
30%
40%
50%
60%
70%
80%
90%
100%
0
5000
1000
0
1500
0
2000
0
2500
0
3000
0
3500
0
4000
0
4500
0
5000
0
Without Decks With Decks
MOE of Short-Term ADD for Children Exposed to ArsenicDislodgeable Residues and Contaminated Soil from Treated Wood
Playsets and Residential Decks in Cold Climate(separated by children with and without decks)
Scatterplot (E6 (table 19).sta)
MOE
Cum
ulat
ive
Pro
babi
lity
Den
sity
0.0
0.1
0.2
0.3
0.4
0.5
0.6
0.7
0.8
0.9
1.0
1.0e
1
1.0e
2
1.0e
3
1.0e
4
1.0e
5
1.0e
6
1.0e
7
hmdeck=0hmdeck=1
With Decks Without Decks
Without Decks99% = 10895% = 30450% = 3.6x10 3
mean = 1.2x10 3
With Decks99% = 7295% = 23050% = 2023mean = 745
Note: MOE was not calculated for cases where dose = 0.0. As a result, n for deck = 0 was reduced from 742 to 709 andn for deck = 1 was reduced from 720 to 714.
Figure 5-3

5-10
Table 5-6. Probabilistic Short-Term MOE Distributions and Risk Levels for ChildrenExposed to Arsenic in Warm Climates (Based on Short-term ADDs in Table 18 from the
SHEDS-Wood Document)
Playset Only
Percentile ofExposure
Average Daily Dose (ADD)mg/kg/day
MOE Risk Level
MOE = 30
maximum dose 4.1E-03 1299 8.2E-04 6195 2.9E-04 17390 1.8E-04 27450 3.0E-05 1.7E+0310 3.7E-06 1.3E+045 1.9E-06 2.6E+041 4.2E-07 1.2E+05
minimum dose 0.0E+00 N/A99.6 1.6E-03 30
Note: Percentiles include cases where dose = 0
Playset andDeck
Percentile ofExposure
Average Daily Dose (ADD)mg/kg/day
MOE Risk Level
MOE = 30
maximum dose 1.5E-03 3299 9.5E-04 5395 4.7E-04 10790 3.1E-04 16350 6.5E-05 77110 9.7E-06 5.1E+035 6.6E-06 7.5E+031 3.0E-06 1.7E+04
minimum dose 8.2E-07 6.1E+04>99.9 N/A 30
Note: Shaded area indicates all the percentiles of the population that meet the risk level set by the Agency.
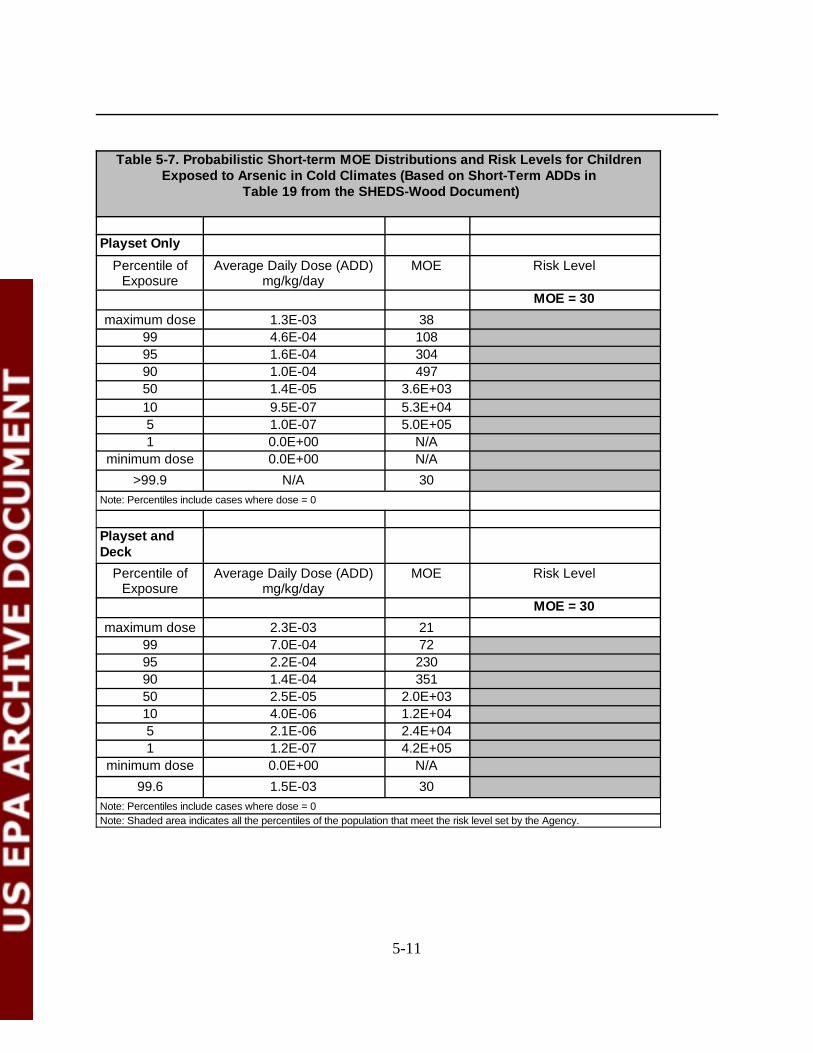
5-11
Table 5-7. Probabilistic Short-term MOE Distributions and Risk Levels for ChildrenExposed to Arsenic in Cold Climates (Based on Short-Term ADDs in
Table 19 from the SHEDS-Wood Document)
Playset Only
Percentile ofExposure
Average Daily Dose (ADD)mg/kg/day
MOE Risk Level
MOE = 30
maximum dose 1.3E-03 3899 4.6E-04 10895 1.6E-04 30490 1.0E-04 49750 1.4E-05 3.6E+0310 9.5E-07 5.3E+045 1.0E-07 5.0E+051 0.0E+00 N/A
minimum dose 0.0E+00 N/A>99.9 N/A 30
Note: Percentiles include cases where dose = 0
Playset andDeck
Percentile ofExposure
Average Daily Dose (ADD)mg/kg/day
MOE Risk Level
MOE = 30
maximum dose 2.3E-03 2199 7.0E-04 7295 2.2E-04 23090 1.4E-04 35150 2.5E-05 2.0E+0310 4.0E-06 1.2E+045 2.1E-06 2.4E+041 1.2E-07 4.2E+05
minimum dose 0.0E+00 N/A99.6 1.5E-03 30
Note: Percentiles include cases where dose = 0Note: Shaded area indicates all the percentiles of the population that meet the risk level set by the Agency.
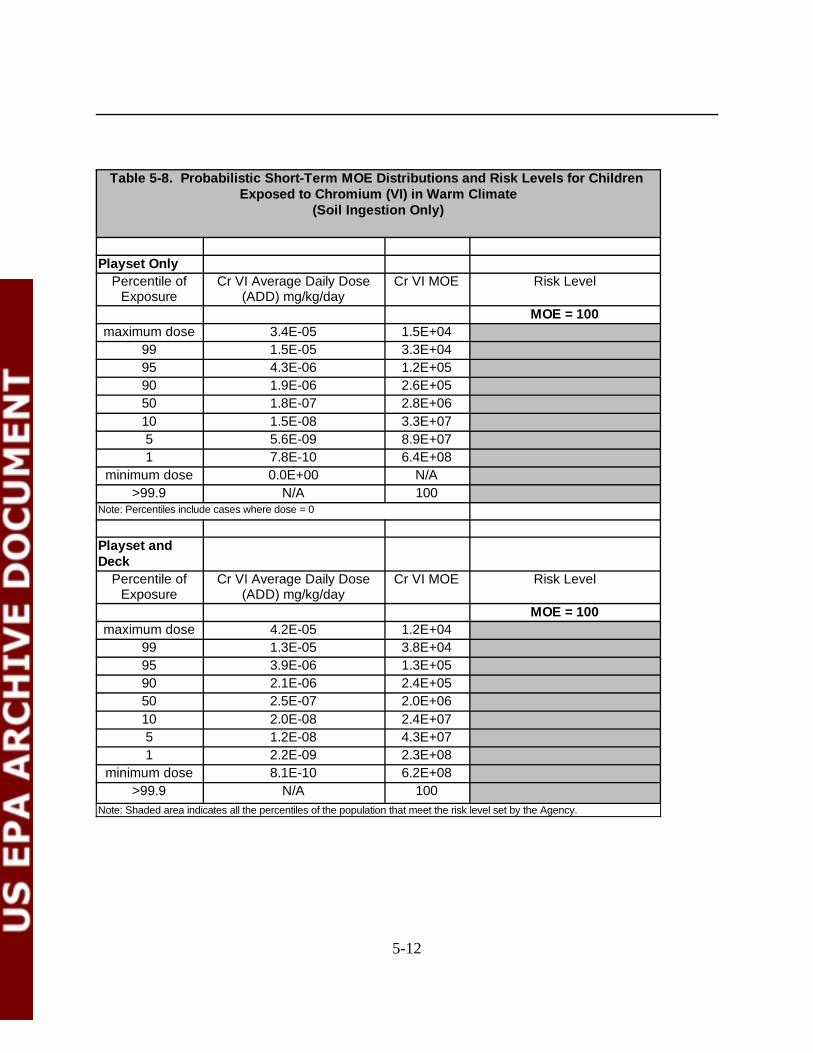
5-12
Table 5-8. Probabilistic Short-Term MOE Distributions and Risk Levels for Children Exposed to Chromium (VI) in Warm Climate
(Soil Ingestion Only)
Playset OnlyPercentile of
ExposureCr VI Average Daily Dose
(ADD) mg/kg/dayCr VI MOE Risk Level
MOE = 100maximum dose 3.4E-05 1.5E+04
99 1.5E-05 3.3E+0495 4.3E-06 1.2E+0590 1.9E-06 2.6E+0550 1.8E-07 2.8E+0610 1.5E-08 3.3E+075 5.6E-09 8.9E+071 7.8E-10 6.4E+08
minimum dose 0.0E+00 N/A>99.9 N/A 100
Note: Percentiles include cases where dose = 0
Playset andDeck
Percentile ofExposure
Cr VI Average Daily Dose(ADD) mg/kg/day
Cr VI MOE Risk Level
MOE = 100maximum dose 4.2E-05 1.2E+04
99 1.3E-05 3.8E+0495 3.9E-06 1.3E+0590 2.1E-06 2.4E+0550 2.5E-07 2.0E+0610 2.0E-08 2.4E+075 1.2E-08 4.3E+071 2.2E-09 2.3E+08
minimum dose 8.1E-10 6.2E+08>99.9 N/A 100
Note: Shaded area indicates all the percentiles of the population that meet the risk level set by the Agency.

5-13
Table 5-9. Probabilistic Short-Term MOE Distributions and Risk Levels for Children Exposed to Chromium (VI) in Cold Climate
(Soil Ingestion Only)
Playset OnlyPercentile of
ExposureCr VI Average Daily Dose
(ADD) mg/kg/dayCr VI MOE Risk Level
MOE = 100maximum dose 1.9E-05 2.7E+04
99 3.0E-06 1.6E+0595 6.9E-07 7.2E+0590 3.0E-07 1.7E+0650 1.5E-08 3.4E+0710 3.8E-10 1.3E+095 6.4E-11 7.8E+091 0.0E+00 N/A
minimum dose 0.0E+00 N/A>99.9 N/A 100
Note: Percentiles include cases where dose = 0
Playset andDeck
Percentile ofExposure
Cr VI Average Daily Dose(ADD) mg/kg/day
Cr VI MOE Risk Level
MOE = 100maximum dose 1.5E-05 3.4E+04
99 3.7E-06 1.3E+0595 1.0E-06 4.9E+0590 5.2E-07 9.6E+0550 2.9E-08 1.7E+0710 2.0E-09 2.5E+085 8.0E-10 6.2E+081 0.0E+00 N/A
minimum dose 0.0E+00 N/A>99.9 N/A 100
Note: Percentiles include cases where dose = 0
Note: Shaded area indicates all the percentiles of the population that meet the risk level set by the Agency.

5-14
Arsenic PDFs/CDFs and risk levels are not presented for pica children. However, short-term MOEs for arsenic for pica children and playsets only in warm climates are presented inTable 5-10. For all scenarios evaluated, the arsenic short-term MOEs were greater than 30 at the95th percentile. For playset only exposure, the MOE was less than 30 near the 99th percentile. Fordeck and playset exposure, the MOE was slightly greater than 30 at the 99th percentile. Thisreversal of deck and playset and playset only risks was due to the exposure model’s instability atthis extreme dose levels. The SHEDS-Wood assessment did not calculate short-term MOEs forchromium for pica children. See Appendix B for additional short-term MOEs.
Intermediate-term MOEs
Arsenic risk PDFs/CDFs were plotted for all exposure scenarios. Intermediate duration(i.e., 1 to 6 months) risks are shown in Figure 5-4 for warm climate conditions and Figure 5-5 forcold climate conditions. Each figure presents risks from exposure to playsets only, and playsetsand decks. Probabilistic intermediate-term MOE distributions and risk levels are presented inTable 5-11 for warm climates and Table 5-12 for cold climates for arsenic risks with playsets anddecks, and playsets only. MOEs were shown to be less than 30 at the 99th percentile for bothwarm and cold climate conditions for exposure to playsets and decks and playsets only.
Chromium intermediate-term MOEs and risk levels (soil ingestion only) for children withplaysets and decks, and playsets only at warm and cold climates are presented in Tables 5-13 and5-14, respectively. All MOEs were found to be greater than 100 for exposure to playsets anddecks, and playsets only for both climate scenarios.
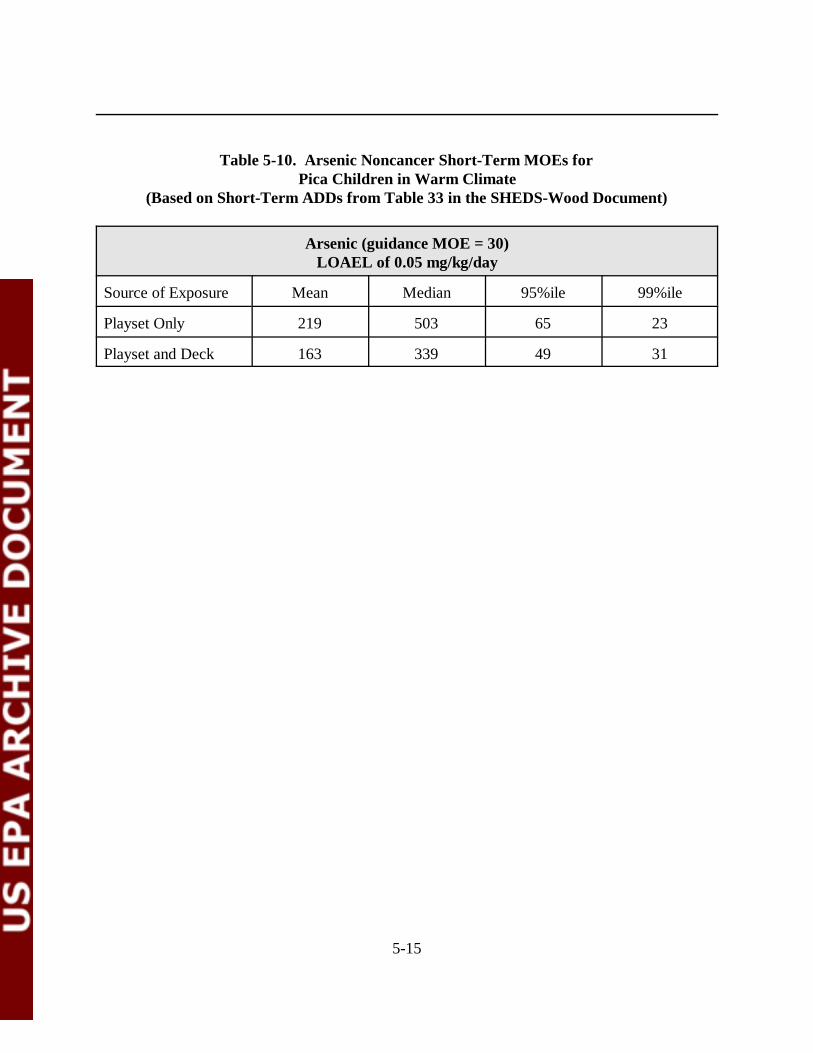
5-15
Table 5-10. Arsenic Noncancer Short-Term MOEs for Pica Children in Warm Climate
(Based on Short-Term ADDs from Table 33 in the SHEDS-Wood Document)
Arsenic (guidance MOE = 30)LOAEL of 0.05 mg/kg/day
Source of Exposure Mean Median 95%ile 99%ile
Playset Only 219 503 65 23
Playset and Deck 163 339 49 31
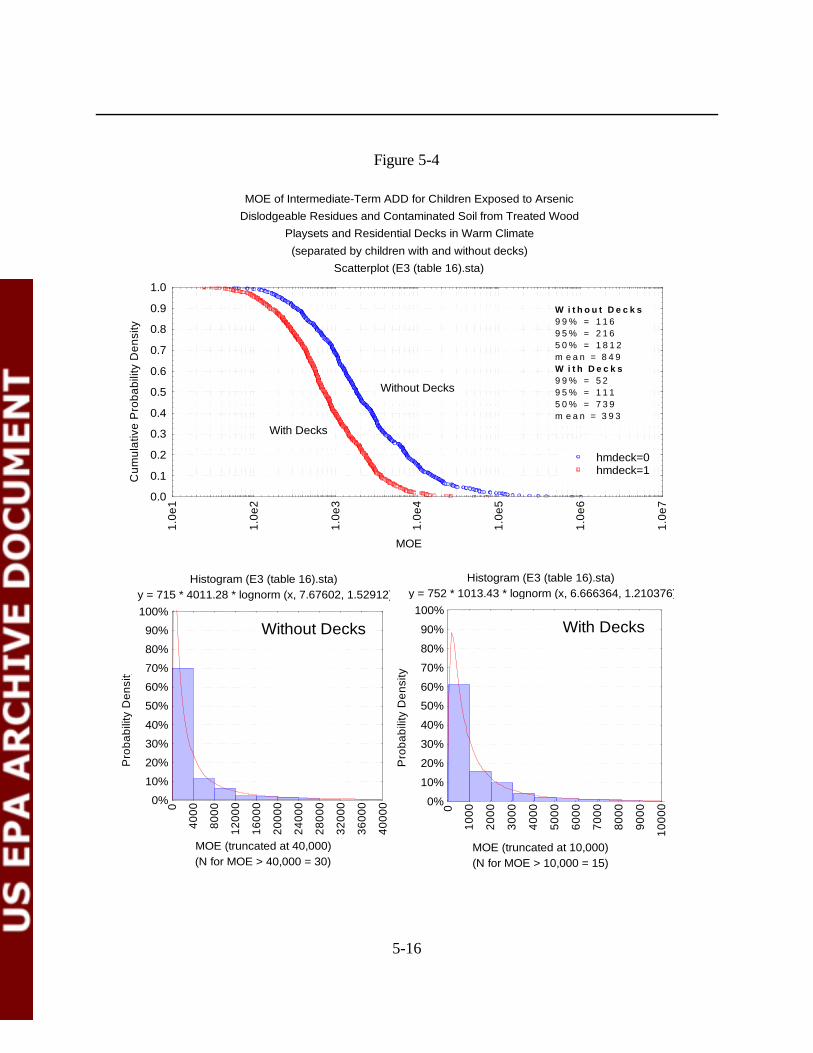
5-16
Histogram (E3 (table 16).sta) y = 715 * 4011.28 * lognorm (x, 7.67602, 1.52912)
(N for MOE > 40,000 = 30)MOE (truncated at 40,000)
Pro
babi
lity
Den
sity
0%
10%
20%
30%
40%
50%
60%
70%
80%
90%
100%
0
4000
8000
1200
0
1600
0
2000
0
2400
0
2800
0
3200
0
3600
0
4000
0
Histogram (E3 (table 16).sta) y = 752 * 1013.43 * lognorm (x, 6.666364, 1.210376)
(N for MOE > 10,000 = 15)MOE (truncated at 10,000)
Pro
babi
lity
Den
sity
0%
10%
20%
30%
40%
50%
60%
70%
80%
90%
100%
0
1000
2000
3000
4000
5000
6000
7000
8000
9000
1000
0
Without Decks With Decks
MOE of Intermediate-Term ADD for Children Exposed to ArsenicDislodgeable Residues and Contaminated Soil from Treated Wood
Playsets and Residential Decks in Warm Climate(separated by children with and without decks)
Scatterplot (E3 (table 16).sta)
MOE
Cum
ulat
ive
Pro
babi
lity
Den
sity
0.0
0.1
0.2
0.3
0.4
0.5
0.6
0.7
0.8
0.9
1.0
1.0e
1
1.0e
2
1.0e
3
1.0e
4
1.0e
5
1.0e
6
1.0e
7
hmdeck=0hmdeck=1
W i t h o u t D e c k s9 9 % = 1 1 69 5 % = 2 1 65 0 % = 1 8 1 2m e a n = 8 4 9W i t h D e c k s9 9 % = 5 29 5 % = 1 1 15 0 % = 7 3 9m e a n = 3 9 3
With Decks
Without Decks
Figure 5-4
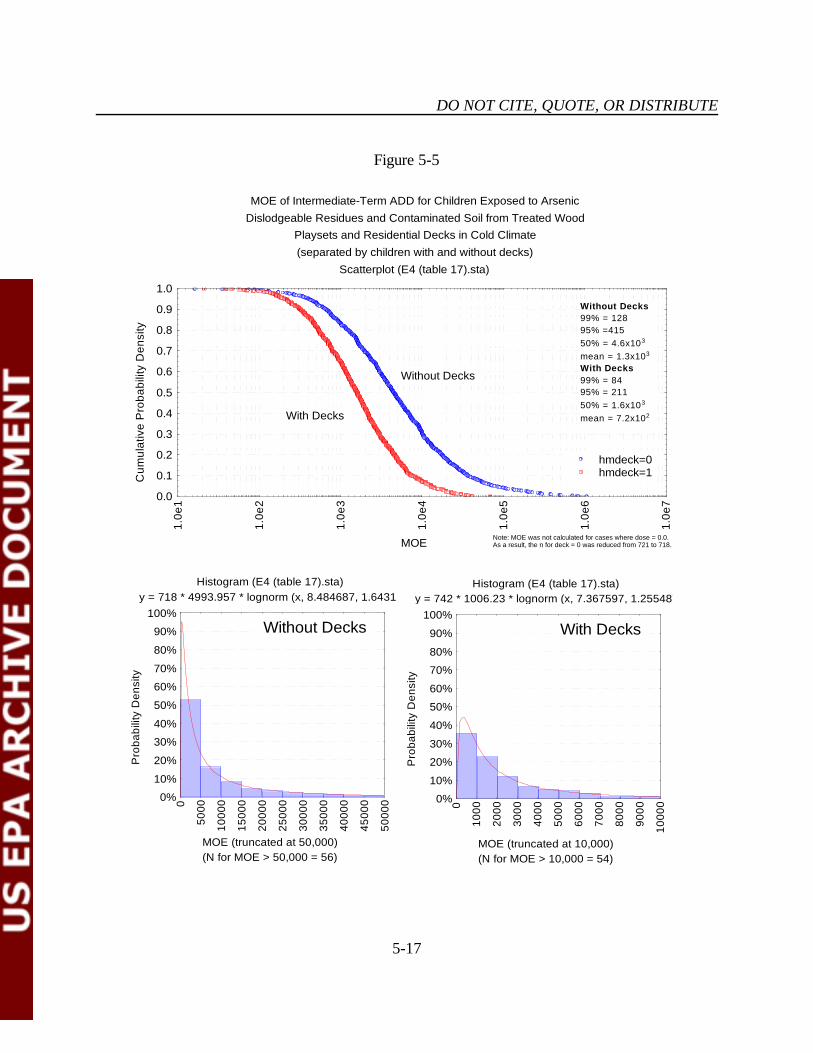
DO NOT CITE, QUOTE, OR DISTRIBUTE
5-17
Histogram (E4 (table 17).sta) y = 718 * 4993.957 * lognorm (x, 8.484687, 1.64317)
(N for MOE > 50,000 = 56)MOE (truncated at 50,000)
Pro
babi
lity
Den
sity
0%
10%
20%
30%
40%
50%
60%
70%
80%
90%
100%
0
5000
1000
0
1500
0
2000
0
2500
0
3000
0
3500
0
4000
0
4500
0
5000
0
Histogram (E4 (table 17).sta) y = 742 * 1006.23 * lognorm (x, 7.367597, 1.255487)
(N for MOE > 10,000 = 54)MOE (truncated at 10,000)
Pro
babi
lity
Den
sity
0%
10%
20%
30%
40%
50%
60%
70%
80%
90%
100%
0
1000
2000
3000
4000
5000
6000
7000
8000
9000
1000
0
Without Decks With Decks
MOE of Intermediate-Term ADD for Children Exposed to ArsenicDislodgeable Residues and Contaminated Soil from Treated Wood
Playsets and Residential Decks in Cold Climate(separated by children with and without decks)
Scatterplot (E4 (table 17).sta)
MOE
Cum
ulat
ive
Pro
babi
lity
Den
sity
0.0
0.1
0.2
0.3
0.4
0.5
0.6
0.7
0.8
0.9
1.0
1.0e
1
1.0e
2
1.0e
3
1.0e
4
1.0e
5
1.0e
6
1.0e
7
hmdeck=0hmdeck=1
Without Decks99% = 12895% =41550% = 4.6x10³
mean = 1.3x10³
With Decks99% = 8495% = 21150% = 1.6x10³
mean = 7.2x10²With Decks
Without Decks
Note: MOE was not calculated for cases where dose = 0.0. As a result, the n for deck = 0 was reduced from 721 to 718.
Figure 5-5
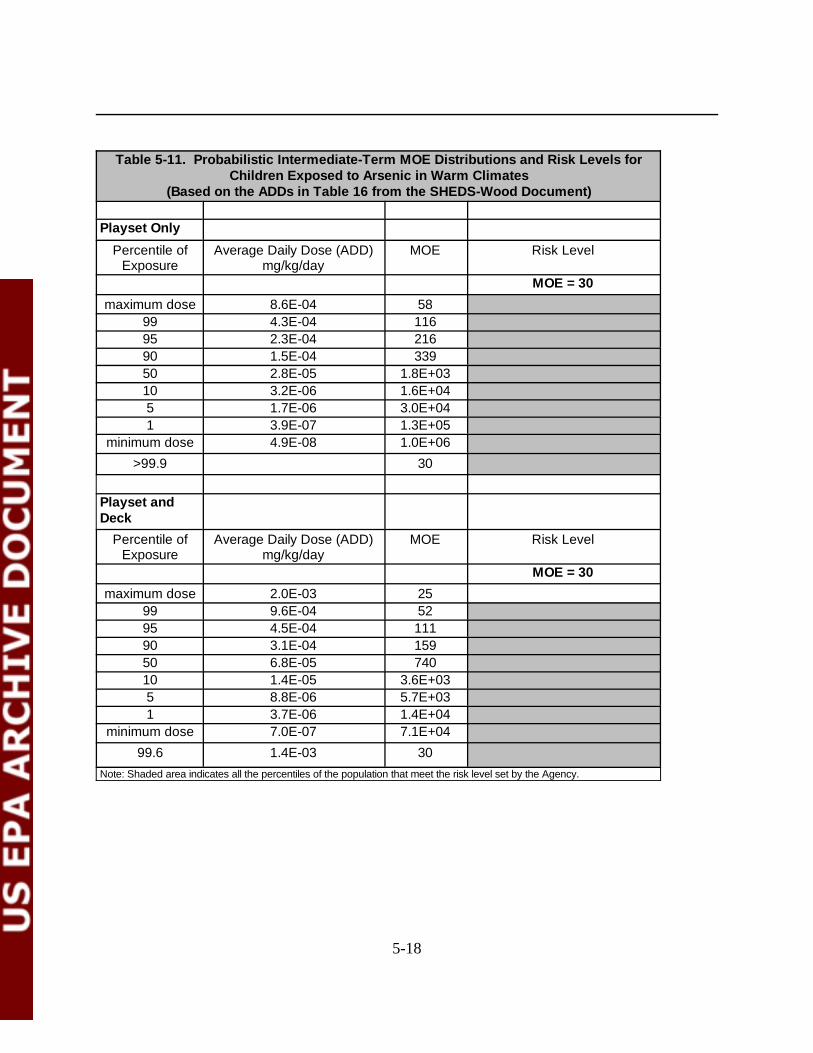
5-18
Table 5-11. Probabilistic Intermediate-Term MOE Distributions and Risk Levels forChildren Exposed to Arsenic in Warm Climates
(Based on the ADDs in Table 16 from the SHEDS-Wood Document)
Playset Only
Percentile ofExposure
Average Daily Dose (ADD)mg/kg/day
MOE Risk Level
MOE = 30
maximum dose 8.6E-04 5899 4.3E-04 11695 2.3E-04 21690 1.5E-04 33950 2.8E-05 1.8E+0310 3.2E-06 1.6E+045 1.7E-06 3.0E+041 3.9E-07 1.3E+05
minimum dose 4.9E-08 1.0E+06>99.9 30
Playset andDeck
Percentile ofExposure
Average Daily Dose (ADD)mg/kg/day
MOE Risk Level
MOE = 30
maximum dose 2.0E-03 2599 9.6E-04 5295 4.5E-04 11190 3.1E-04 15950 6.8E-05 74010 1.4E-05 3.6E+035 8.8E-06 5.7E+031 3.7E-06 1.4E+04
minimum dose 7.0E-07 7.1E+0499.6 1.4E-03 30
Note: Shaded area indicates all the percentiles of the population that meet the risk level set by the Agency.

5-19
Table 5-12. Probabilistic Intermediate-Term MOE Distributions and Risk Levels forChildren Exposed to Arsenic in Cold Climates
(Based on ADDs in Table 17 from the SHEDS-Wood Document)
Playset Only
Percentile ofExposure
Average Daily Dose (ADD)mg/kg/day
MOE Risk Level
MOE = 30
maximum dose 3.1E-03 1699 3.9E-04 12895 1.2E-04 41590 7.5E-05 66450 1.1E-05 4.6E+0310 1.3E-06 3.8E+045 5.7E-07 8.8E+041 9.8E-08 5.1E+05
minimum dose 0.0E+00 N/A99.7 1.4E-03 30
Note: Percentiles include cases where dose = 0
Playset andDeck
Percentile ofExposure
Average Daily Dose (ADD)mg/kg/day
MOE Risk Level
MOE = 30
maximum dose 2.4E-03 2199 5.9E-04 8495 2.4E-04 21190 1.5E-04 32550 3.1E-05 1.6E+0310 6.7E-06 7.4E+035 3.9E-06 1.3E+041 1.5E-06 3.4E+04
minimum dose 7.2E-07 6.9E+0499.7 1.3E-03 30
Note: Shaded area indicates all the percentiles of the population that meet the risk level set by the Agency.

5-20
Table 5-13. Probabilistic Intermediate-Term MOE Distributions and Risk Levels for Children Exposed to Chromium (VI) in Warm Climate
(Soil Ingestion Only)
Playset OnlyPercentile of
ExposureCr VI Average Daily Dose
(ADD) mg/kg/dayCr VI MOE Risk Level
MOE = 100maximum dose 3.6E-05 1.4E+04
99 1.6E-05 3.0E+0495 3.5E-06 1.4E+0590 1.6E-06 3.0E+0550 1.6E-07 3.1E+0610 1.1E-08 4.6E+075 5.0E-09 9.9E+071 6.6E-10 7.6E+08
minimum dose 1.0E-11 5.0E+10>99.9 N/A 100
Playset andDeck
Percentile ofExposure
Cr VI Average Daily Dose(ADD) mg/kg/day
Cr VI MOE Risk Level
MOE = 100maximum dose 6.6E-05 7.5E+03
99 1.0E-05 4.9E+0495 3.5E-06 1.4E+0590 1.8E-06 2.8E+0550 2.3E-07 2.2E+0610 2.2E-08 2.2E+075 9.4E-09 5.3E+071 3.4E-09 1.5E+08
minimum dose 6.1E-10 8.2E+08>99.9 N/A 100
Note: Shaded area indicates all the percentiles of the population that meet the risk level set by the Agency.
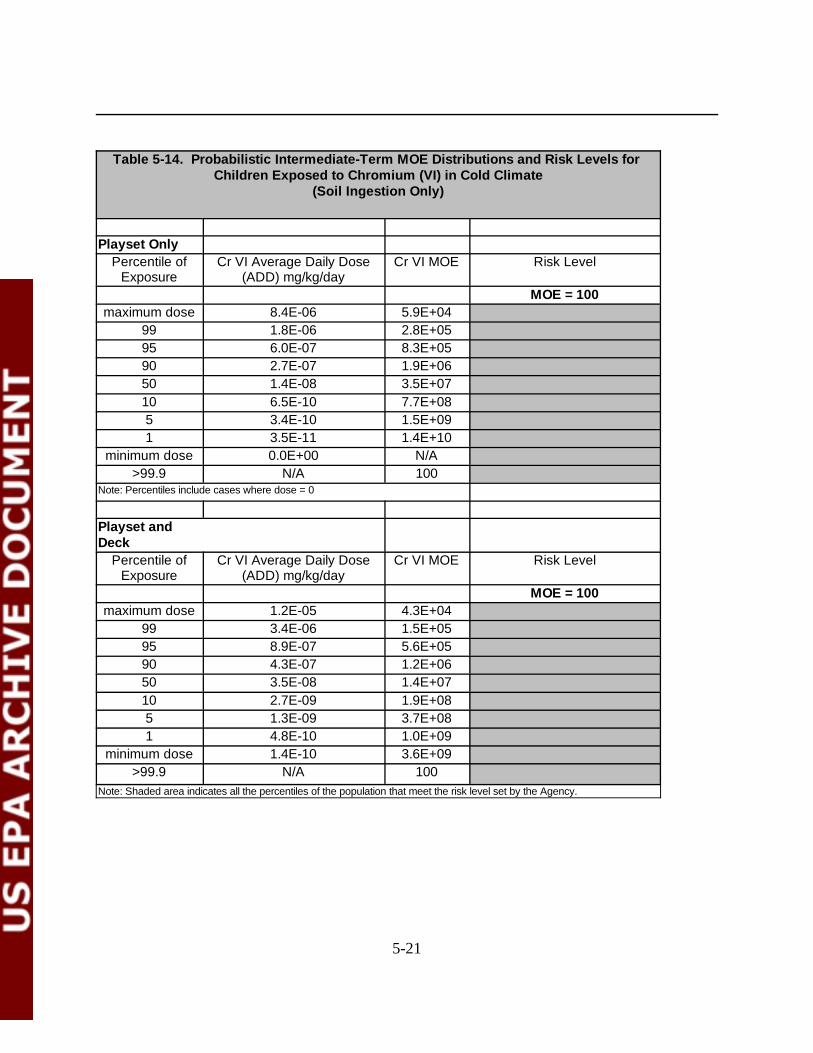
5-21
Table 5-14. Probabilistic Intermediate-Term MOE Distributions and Risk Levels for Children Exposed to Chromium (VI) in Cold Climate
(Soil Ingestion Only)
Playset OnlyPercentile of
ExposureCr VI Average Daily Dose
(ADD) mg/kg/dayCr VI MOE Risk Level
MOE = 100maximum dose 8.4E-06 5.9E+04
99 1.8E-06 2.8E+0595 6.0E-07 8.3E+0590 2.7E-07 1.9E+0650 1.4E-08 3.5E+0710 6.5E-10 7.7E+085 3.4E-10 1.5E+091 3.5E-11 1.4E+10
minimum dose 0.0E+00 N/A>99.9 N/A 100
Note: Percentiles include cases where dose = 0
Playset andDeck
Percentile ofExposure
Cr VI Average Daily Dose(ADD) mg/kg/day
Cr VI MOE Risk Level
MOE = 100maximum dose 1.2E-05 4.3E+04
99 3.4E-06 1.5E+0595 8.9E-07 5.6E+0590 4.3E-07 1.2E+0650 3.5E-08 1.4E+0710 2.7E-09 1.9E+085 1.3E-09 3.7E+081 4.8E-10 1.0E+09
minimum dose 1.4E-10 3.6E+09>99.9 N/A 100
Note: Shaded area indicates all the percentiles of the population that meet the risk level set by the Agency.
5-22
5.2.2 Carcinogenic Effects
For carcinogens, risks were estimated as the probability of increased cancer incidence orexcess lifetime cancer risk. The carcinogenic slope factor or Q1* represents the 95 percent upperconfidence limit (UCL) of the probability of response per unit intake of a chemical over a lifetime,and converts estimated intakes directly to incremental risk (U.S. EPA, 1990). Cancer risk wascomputed as follows:
Risk = LADD x Q1*
Where:
LADD = Lifetime Average Daily Dose (mg/kg/day)Q1* = Carcinogenic slope factor [1/(mg/kg/-day)]
Doses (i.e., LADDs) corresponding to all risks calculated here are presented in Zartarian et al.(2003). The lifetime risk was based on a 6 year duration of exposure (ages 1-6 years) andaveraged over a lifetime of 75 years.
Cancer risk results are presented in this section from four different perspectives. First,risks are presented in the same manner as the noncancer effects; namely, the four differentexposure points (i.e., mean, median, 95th percentile, and 99th percentile) are presented. Second,risks are shown in cumulative probability density and probability density plots. Third, percentilesfrom the cumulative distribution that correspond to the three levels of EPA’s risk range (10 -6,10-5, and 10-4) are presented. And fourth, total risk is shown for two broad sources of exposure:soils and residues. The risk data for exposure to residues and soil in warm and cold climates areshown in line plots (Figures 5-6 and 5-7) for the different exposure scenarios (i.e., playset onlyand playset and deck) .
Table 5-15 summarizes the arsenic cancer risks for children who contact CCA-treatedplaysets and decks in warm and cold climates at the three exposure points of interest. Warmclimate exposures were greater than cold climate exposures. Thus, cancer risks werecorrespondingly greater. Exposure at the mean and median were in the range 10 -6 to10-5. Thisrange was exceeded with exposure to decks and playsets in warm climates at approximately the95th percentile (1.4 x10⁻⁴). At the 99 th percentile, the 10-4 risk level was exceeded for playsets anddecks exposure for cold climate conditions.

5-23
Cancer Risk (Lifetime Term) for Children Exposed to ArsenicDislodgeable Residues and Contaminated Soil from Treated Wood
Playsets and Residential Decks in Warm Climate(separated by children with and without decks)
Scatterplot (E1 (table 14).sta)
Cancer Risk
Cum
ulat
ive
Pro
babi
lity
Den
sity
0.0
0.1
0.2
0.3
0.4
0.5
0.6
0.7
0.8
0.9
1.0
1.0e
-8
1.0e
-7
1.0e
-6
1.0e
-5
1.0e
-4
1.0e
-3
Without Decks
With Decks
deck=0deck=1
Without Decks99% = 2.4x10⁻⁴
95% = 8.3x10⁻⁵
50% = 1.1x10⁻⁵
mean = 2.3x10⁻⁵
With Decks99% = 3.1x10⁻⁴
95% = 1.4x10⁻⁴
50% = 2.3x10⁻⁵
mean = 4.2x10⁻⁵
Histogram (E1 (table 14).sta) y = 728 * 0.000012 * lognorm (x, -11.42044, 1.2201)
(N for risks > 1.5e-4 = 16)Cancer Risk (truncated at 1.5e-4)
Pro
babi
lity
Den
sity
0%
10%
20%
30%
40%
50%
60%
70%
80%
90%
100%
01e
-52e
-53e
-54e
-55e
-56e
-57e
-58e
-59e
-51e
-41.
1e-4
1.2e
-41.
3e-4
1.4e
-41.
5e-4
Without Decks
Histogram (E1 (table 14).sta) y = 738 * 0.00001 * lognorm (x, -10.689, 1.098477)
(N for risks > 1.5e-4 = 31)Cancer Risk (truncated at 1.5e-4)
Pro
babi
lity
Den
sity
0%
10%
20%
30%
40%
50%
60%
70%
80%
90%
100%
01e
-52e
-53e
-54e
-55e
-56e
-57e
-58e
-59e
-51e
-41.
1e-4
1.2e
-41.
3e-4
1.4e
-41.
5e-4
With Decks
Figure 5-6
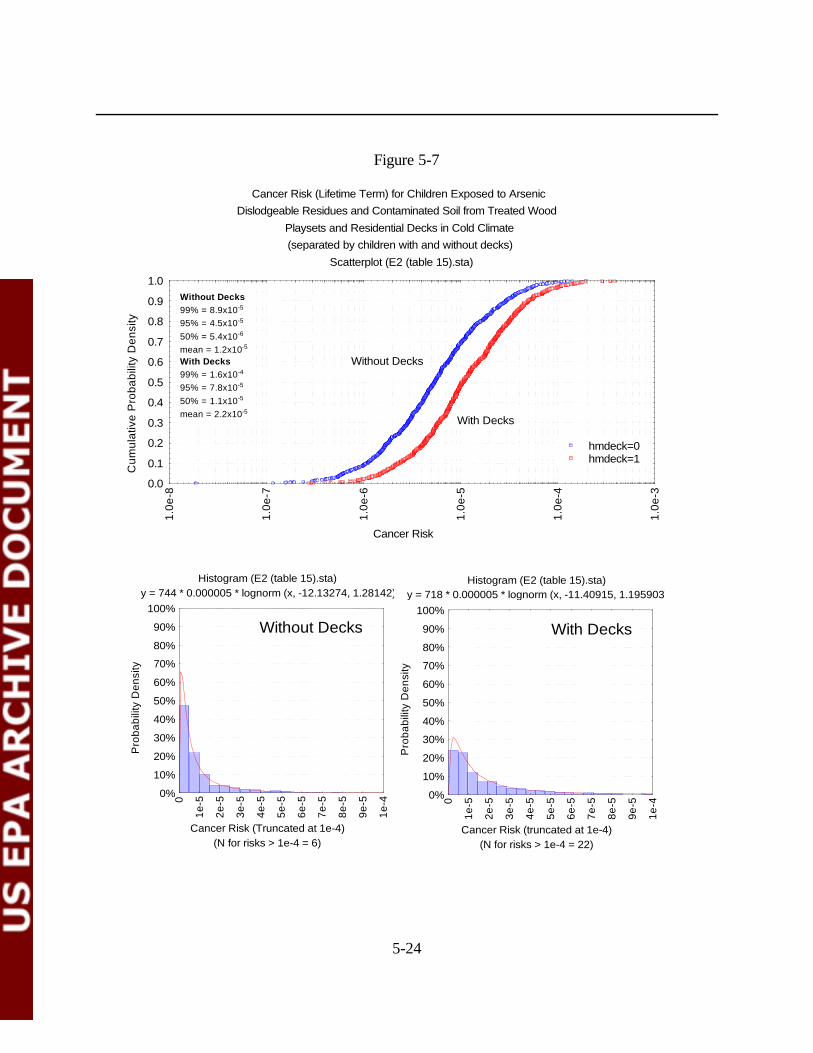
5-24
Cancer Risk (Lifetime Term) for Children Exposed to ArsenicDislodgeable Residues and Contaminated Soil from Treated Wood
Playsets and Residential Decks in Cold Climate(separated by children with and without decks)
Scatterplot (E2 (table 15).sta)
Cancer Risk
Cum
ulat
ive
Pro
babi
lity
Den
sity
0.0
0.1
0.2
0.3
0.4
0.5
0.6
0.7
0.8
0.9
1.0
1.0e
-8
1.0e
-7
1.0e
-6
1.0e
-5
1.0e
-4
1.0e
-3
Without Decks
With Decks
hmdeck=0hmdeck=1
Without Decks99% = 8.9x10⁻⁵
95% = 4.5x10⁻⁵
50% = 5.4x10⁻⁶
mean = 1.2x10⁻⁵
With Decks99% = 1.6x10⁻⁴
95% = 7.8x10⁻⁵
50% = 1.1x10⁻⁵
mean = 2.2x10⁻⁵
Histogram (E2 (table 15).sta) y = 744 * 0.000005 * lognorm (x, -12.13274, 1.28142)
(N for risks > 1e-4 = 6)Cancer Risk (Truncated at 1e-4)
Pro
babi
lity
Den
sity
0%
10%
20%
30%
40%
50%
60%
70%
80%
90%
100%
0
1e-5
2e-5
3e-5
4e-5
5e-5
6e-5
7e-5
8e-5
9e-5
1e-4
Histogram (E2 (table 15).sta) y = 718 * 0.000005 * lognorm (x, -11.40915, 1.195903)
(N for risks > 1e-4 = 22)Cancer Risk (truncated at 1e-4)
Pro
babi
lity
Den
sity
0%
10%
20%
30%
40%
50%
60%
70%
80%
90%
100%
0
1e-5
2e-5
3e-5
4e-5
5e-5
6e-5
7e-5
8e-5
9e-5
1e-4
Without Decks With Decks
Figure 5-7
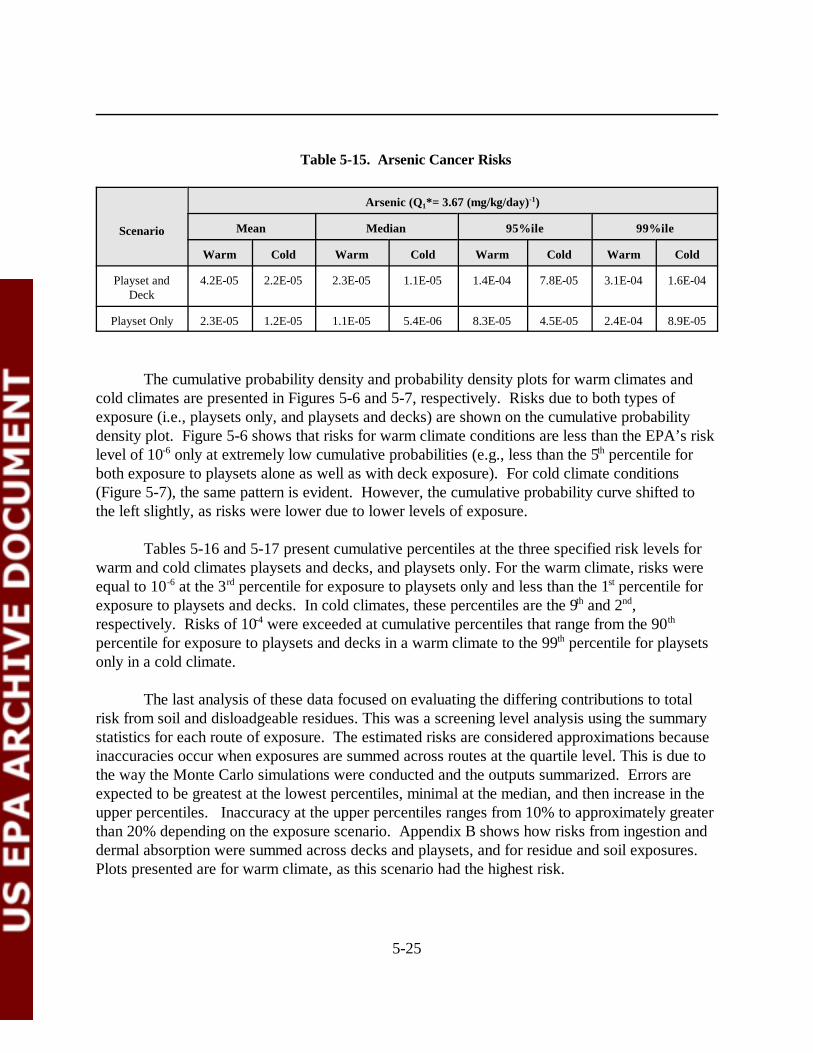
5-25
Table 5-15. Arsenic Cancer Risks
Scenario
Arsenic (Q1*= 3.67 (mg/kg/day)-1)
Mean Median 95%ile 99%ile
Warm Cold Warm Cold Warm Cold Warm Cold
Playset andDeck
4.2E-05 2.2E-05 2.3E-05 1.1E-05 1.4E-04 7.8E-05 3.1E-04 1.6E-04
Playset Only 2.3E-05 1.2E-05 1.1E-05 5.4E-06 8.3E-05 4.5E-05 2.4E-04 8.9E-05
The cumulative probability density and probability density plots for warm climates andcold climates are presented in Figures 5-6 and 5-7, respectively. Risks due to both types ofexposure (i.e., playsets only, and playsets and decks) are shown on the cumulative probabilitydensity plot. Figure 5-6 shows that risks for warm climate conditions are less than the EPA’s risklevel of 10-6 only at extremely low cumulative probabilities (e.g., less than the 5th percentile forboth exposure to playsets alone as well as with deck exposure). For cold climate conditions(Figure 5-7), the same pattern is evident. However, the cumulative probability curve shifted tothe left slightly, as risks were lower due to lower levels of exposure.
Tables 5-16 and 5-17 present cumulative percentiles at the three specified risk levels forwarm and cold climates playsets and decks, and playsets only. For the warm climate, risks wereequal to 10-6 at the 3rd percentile for exposure to playsets only and less than the 1st percentile forexposure to playsets and decks. In cold climates, these percentiles are the 9th and 2nd,respectively. Risks of 10-4 were exceeded at cumulative percentiles that range from the 90th
percentile for exposure to playsets and decks in a warm climate to the 99th percentile for playsetsonly in a cold climate.
The last analysis of these data focused on evaluating the differing contributions to totalrisk from soil and disloadgeable residues. This was a screening level analysis using the summarystatistics for each route of exposure. The estimated risks are considered approximations becauseinaccuracies occur when exposures are summed across routes at the quartile level. This is due tothe way the Monte Carlo simulations were conducted and the outputs summarized. Errors areexpected to be greatest at the lowest percentiles, minimal at the median, and then increase in theupper percentiles. Inaccuracy at the upper percentiles ranges from 10% to approximately greaterthan 20% depending on the exposure scenario. Appendix B shows how risks from ingestion anddermal absorption were summed across decks and playsets, and for residue and soil exposures. Plots presented are for warm climate, as this scenario had the highest risk.
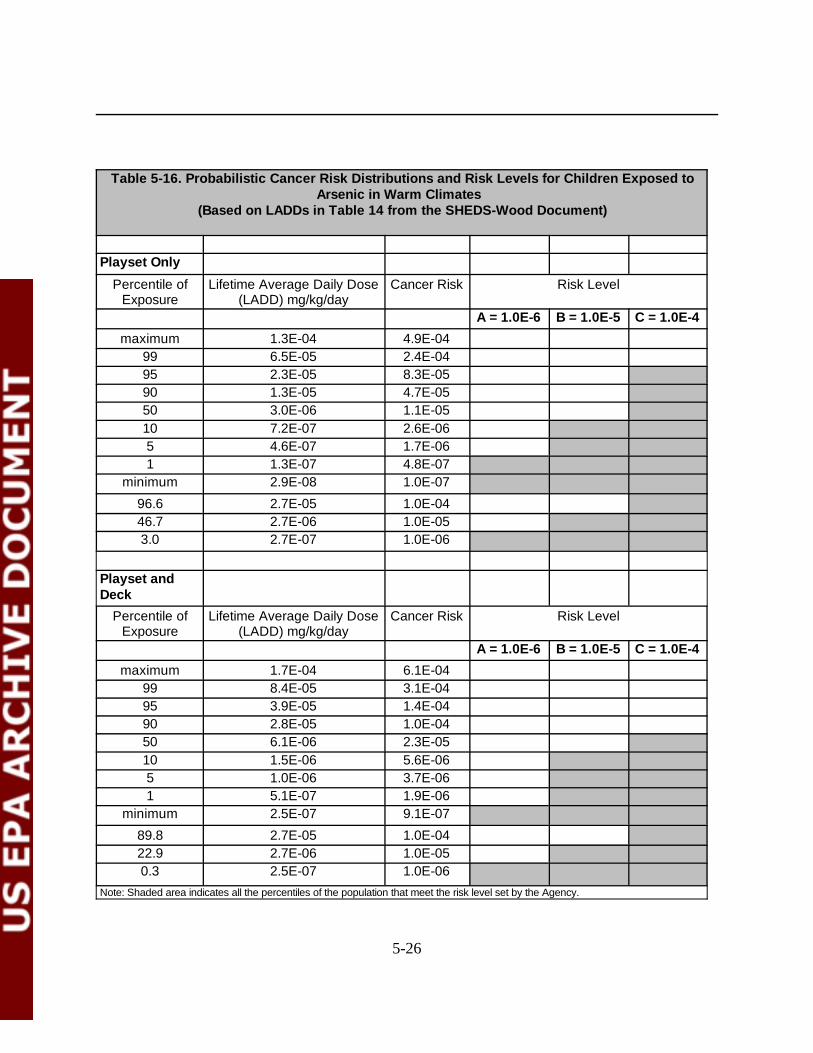
5-26
Table 5-16. Probabilistic Cancer Risk Distributions and Risk Levels for Children Exposed toArsenic in Warm Climates
(Based on LADDs in Table 14 from the SHEDS-Wood Document)
Playset Only
Percentile ofExposure
Lifetime Average Daily Dose(LADD) mg/kg/day
Cancer Risk Risk Level
A = 1.0E-6 B = 1.0E-5 C = 1.0E-4
maximum 1.3E-04 4.9E-0499 6.5E-05 2.4E-0495 2.3E-05 8.3E-0590 1.3E-05 4.7E-0550 3.0E-06 1.1E-0510 7.2E-07 2.6E-065 4.6E-07 1.7E-061 1.3E-07 4.8E-07
minimum 2.9E-08 1.0E-07
96.6 2.7E-05 1.0E-0446.7 2.7E-06 1.0E-053.0 2.7E-07 1.0E-06
Playset andDeck
Percentile ofExposure
Lifetime Average Daily Dose(LADD) mg/kg/day
Cancer Risk Risk Level
A = 1.0E-6 B = 1.0E-5 C = 1.0E-4
maximum 1.7E-04 6.1E-0499 8.4E-05 3.1E-0495 3.9E-05 1.4E-0490 2.8E-05 1.0E-0450 6.1E-06 2.3E-0510 1.5E-06 5.6E-065 1.0E-06 3.7E-061 5.1E-07 1.9E-06
minimum 2.5E-07 9.1E-07
89.8 2.7E-05 1.0E-0422.9 2.7E-06 1.0E-050.3 2.5E-07 1.0E-06
Note: Shaded area indicates all the percentiles of the population that meet the risk level set by the Agency.

5-27
Table 5-17. Probabilistic Cancer Risk Distributions and Risk Levels for Children Exposed toArsenic in Cold Climates
(Based on LADDs in Table 15 from the SHEDS-Wood Document)
Playset Only
Percentile ofExposure
Lifetime Average Daily Dose(LADD) mg/kg/day
Cancer Risk Risk Level
A = 1.0E-6 B = 1.0E-5 C = 1.0E-4
maximum 5.4E-05 2.0E-0499 2.4E-05 8.9E-0595 1.2E-05 4.5E-0590 8.0E-06 2.9E-0550 1.5E-06 5.4E-0610 2.9E-07 1.1E-065 1.7E-07 6.2E-071 8.0E-08 2.9E-07
minimum 5.1E-09 1.9E-08
99.2 2.6E-05 1.0E-0469.1 2.7E-06 1.0E-059.0 2.7E-07 1.0E-06
Playset andDeck
Percentile ofExposure
Lifetime Average Daily Dose(LADD) mg/kg/day
Cancer Risk Risk Level
A = 1.0E-6 B = 1.0E-5 C = 1.0E-4
maximum 1.0E-04 3.8E-0499 4.4E-05 1.6E-0495 2.1E-05 7.8E-0590 1.4E-05 5.0E-0550 2.9E-06 1.1E-0510 6.2E-07 2.3E-065 4.1E-07 1.5E-061 2.0E-07 7.4E-07
minimum 7.5E-08 2.7E-07
96.8 2.7E-05 1.0E-0448.5 2.7E-06 1.0E-052.4 2.7E-07 1.0E-06
Note: Shaded area indicates all the percentiles of the population that meet the risk level set by the Agency.
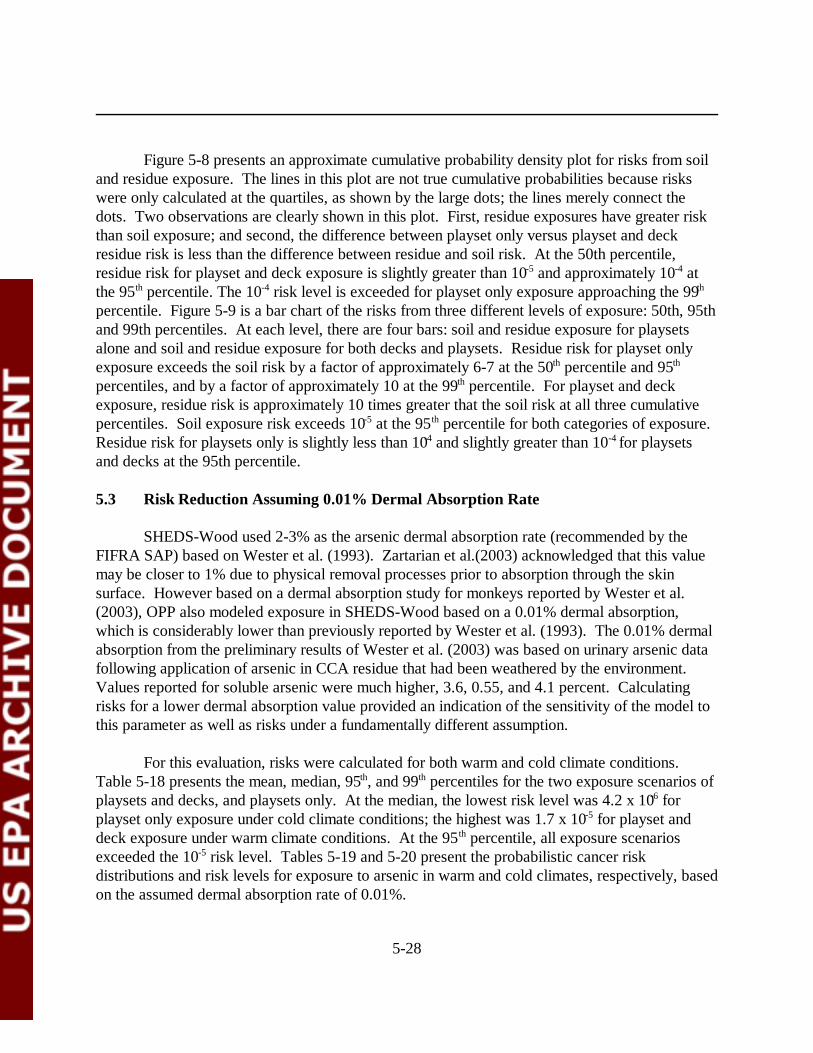
5-28
Figure 5-8 presents an approximate cumulative probability density plot for risks from soiland residue exposure. The lines in this plot are not true cumulative probabilities because riskswere only calculated at the quartiles, as shown by the large dots; the lines merely connect thedots. Two observations are clearly shown in this plot. First, residue exposures have greater riskthan soil exposure; and second, the difference between playset only versus playset and deckresidue risk is less than the difference between residue and soil risk. At the 50th percentile,residue risk for playset and deck exposure is slightly greater than 10-5 and approximately 10-4 atthe 95th percentile. The 10-4 risk level is exceeded for playset only exposure approaching the 99th
percentile. Figure 5-9 is a bar chart of the risks from three different levels of exposure: 50th, 95thand 99th percentiles. At each level, there are four bars: soil and residue exposure for playsetsalone and soil and residue exposure for both decks and playsets. Residue risk for playset onlyexposure exceeds the soil risk by a factor of approximately 6-7 at the 50th percentile and 95th
percentiles, and by a factor of approximately 10 at the 99th percentile. For playset and deckexposure, residue risk is approximately 10 times greater that the soil risk at all three cumulativepercentiles. Soil exposure risk exceeds 10-5 at the 95th percentile for both categories of exposure. Residue risk for playsets only is slightly less than 10-4 and slightly greater than 10-4 for playsetsand decks at the 95th percentile.
5.3 Risk Reduction Assuming 0.01% Dermal Absorption Rate
SHEDS-Wood used 2-3% as the arsenic dermal absorption rate (recommended by theFIFRA SAP) based on Wester et al. (1993). Zartarian et al.(2003) acknowledged that this valuemay be closer to 1% due to physical removal processes prior to absorption through the skinsurface. However based on a dermal absorption study for monkeys reported by Wester et al.(2003), OPP also modeled exposure in SHEDS-Wood based on a 0.01% dermal absorption,which is considerably lower than previously reported by Wester et al. (1993). The 0.01% dermalabsorption from the preliminary results of Wester et al. (2003) was based on urinary arsenic datafollowing application of arsenic in CCA residue that had been weathered by the environment.Values reported for soluble arsenic were much higher, 3.6, 0.55, and 4.1 percent. Calculatingrisks for a lower dermal absorption value provided an indication of the sensitivity of the model tothis parameter as well as risks under a fundamentally different assumption.
For this evaluation, risks were calculated for both warm and cold climate conditions. Table 5-18 presents the mean, median, 95th, and 99th percentiles for the two exposure scenarios ofplaysets and decks, and playsets only. At the median, the lowest risk level was 4.2 x 10⁻⁶ forplayset only exposure under cold climate conditions; the highest was 1.7 x 10⁻⁵ for playset anddeck exposure under warm climate conditions. At the 95th percentile, all exposure scenariosexceeded the 10-5 risk level. Tables 5-19 and 5-20 present the probabilistic cancer riskdistributions and risk levels for exposure to arsenic in warm and cold climates, respectively, basedon the assumed dermal absorption rate of 0.01%.
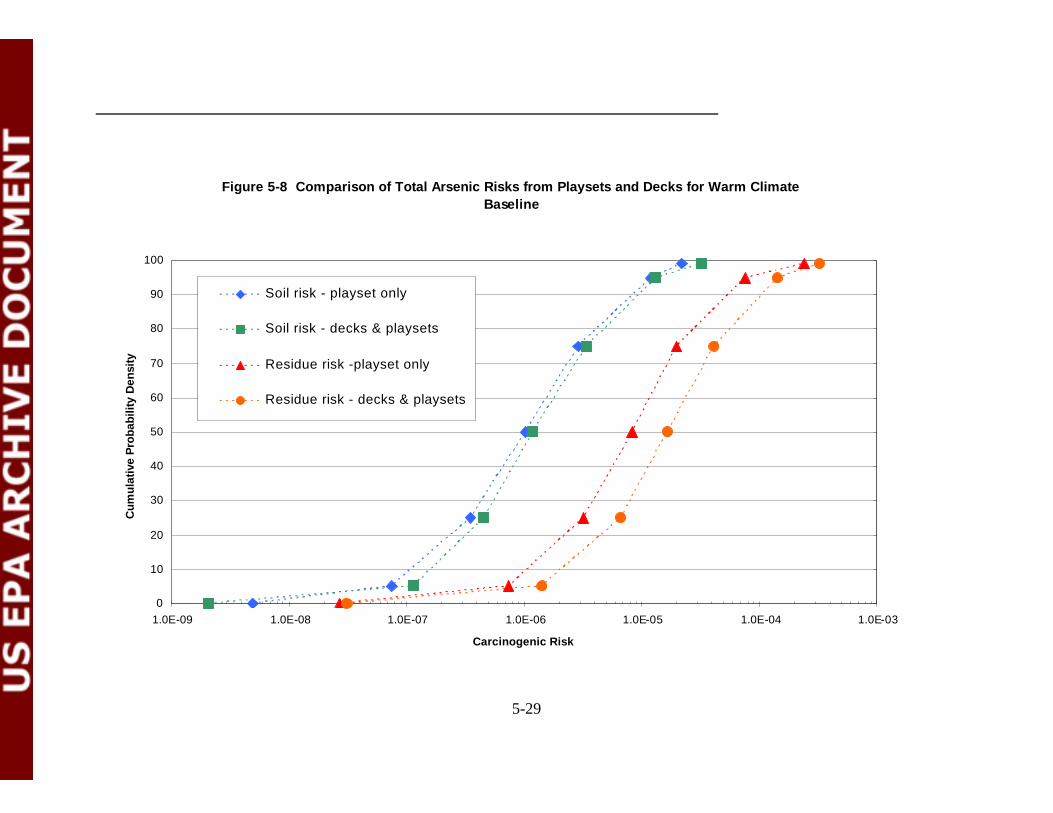
5-29
Figure 5-8 Comparison of Total Arsenic Risks from Playsets and Decks for Warm ClimateBaseline
0
10
20
30
40
50
60
70
80
90
100
1.0E-09 1.0E-08 1.0E-07 1.0E-06 1.0E-05 1.0E-04 1.0E-03
Carcinogenic Risk
Cum
ulat
ive
Pro
babi
lity
Den
sity
Soil risk - playset only
Soil risk - decks & playsets
Residue risk -playset only
Residue risk - decks & playsets
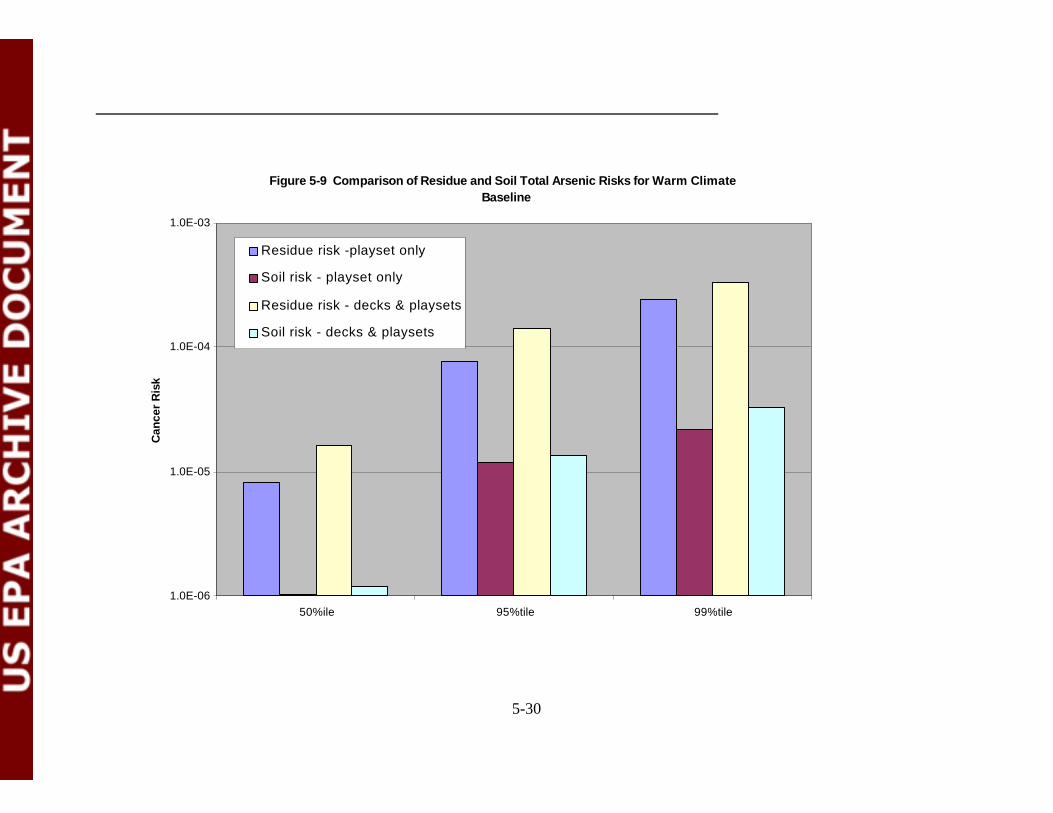
5-30
Figure 5-9 Comparison of Residue and Soil Total Arsenic Risks for Warm ClimateBaseline
1.0E-06
1.0E-05
1.0E-04
1.0E-03
50%ile 95%tile 99%tile
Can
cer
Ris
k
Residue risk -playset only
Soil risk - playset only
Residue risk - decks & playsets
Soil risk - decks & playsets
5-31
Table 5-18. Arsenic Cancer Risk Assuming 0.01% Dermal Absorption
Scenario Arsenic (Q1*= 3.67 (mg/kg/day)-1)
Mean Median 95%ile 99%ile
Warm Cold Warm Cold Warm Cold Warm Cold
Playset andDeck
2.9E-05 2.0E-05 1.7E-05 9.8E-06 9.8E-05 7.7E-05 2.3E-04 1.6E-04
Playset Only 1.5E-05 1.1E-05 7.3E-06 4.2E-06 4.4E-05 3.8E-05 1.2E-04 9.9E-05

5-32
Table 5-19. Probabilistic Cancer Risk Distributions and Risk Levels for Children Exposed toArsenic in Warm Climates (Dermal Residue Absorption Rate = 0.01%)
(Based on LADDs in Table 35 from the SHEDS-Wood Document)
Playset Only
Percentile ofExposure
Lifetime Average Daily Dose(LADD) mg/kg/day
Cancer Risk Risk Level
A = 1.0E-6 B = 1.0E-5 C = 1.0E-4
maximum 1.9E-04 7.1E-0499 3.3E-05 1.2E-0495 1.2E-05 4.4E-0590 7.8E-06 2.9E-0550 2.0E-06 7.3E-0610 4.3E-07 1.6E-065 2.8E-07 1.0E-061 6.1E-08 2.2E-07
minimum 3.4E-09 1.2E-08
98.2 2.4E-05 1.0E-0461.3 2.7E-06 1.0E-054.7 2.6E-07 1.0E-06
Playset andDeck
Percentile ofExposure
Lifetime Average Daily Dose(LADD) mg/kg/day
Cancer Risk Risk Level
A = 1.0E-6 B = 1.0E-5 C = 1.0E-4
maximum 2.3E-04 8.6E-0499 6.4E-05 2.3E-0495 2.7E-05 9.8E-0590 1.6E-05 6.0E-0550 4.5E-06 1.7E-0510 9.1E-07 3.3E-065 6.3E-07 2.3E-061 2.8E-07 1.0E-06
minimum 1.1E-07 4.1E-07
95.1 2.7E-05 1.0E-0433.8 2.7E-06 1.0E-050.9 2.5E-07 1.0E-06
Note: Shaded area indicates all the percentiles of the population that meet the risk level set by the Agency.
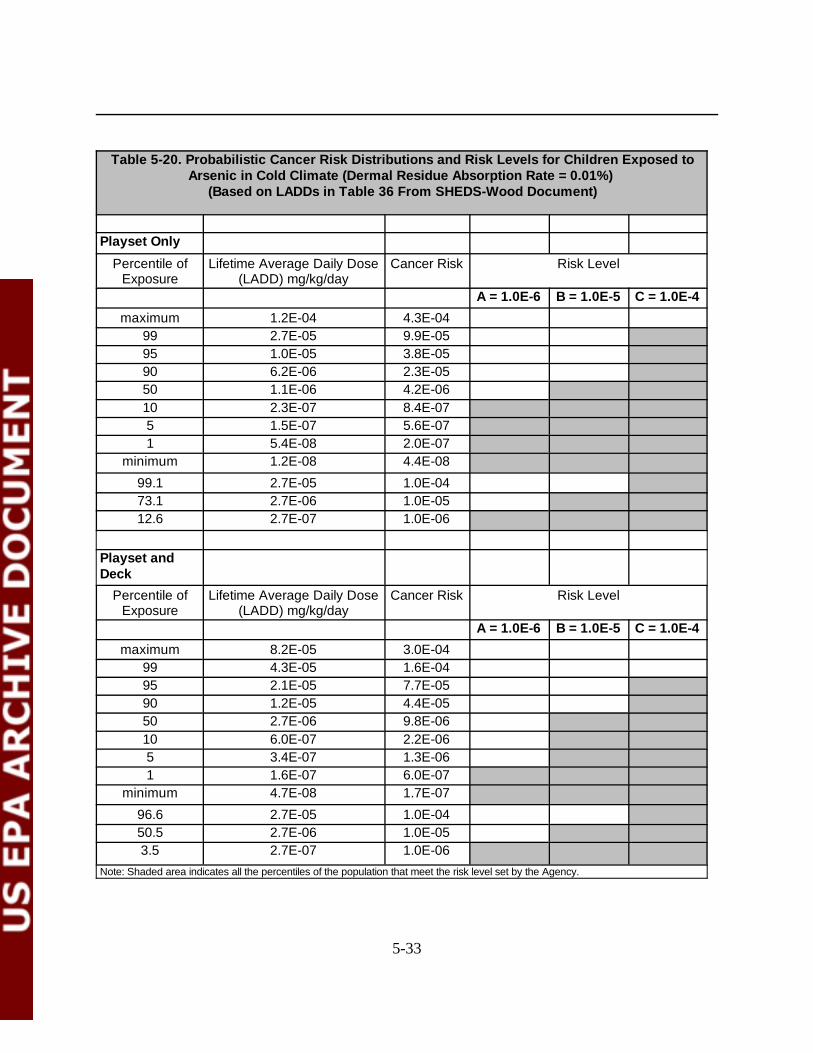
5-33
Table 5-20. Probabilistic Cancer Risk Distributions and Risk Levels for Children Exposed toArsenic in Cold Climate (Dermal Residue Absorption Rate = 0.01%)
(Based on LADDs in Table 36 From SHEDS-Wood Document)
Playset Only
Percentile ofExposure
Lifetime Average Daily Dose(LADD) mg/kg/day
Cancer Risk Risk Level
A = 1.0E-6 B = 1.0E-5 C = 1.0E-4
maximum 1.2E-04 4.3E-0499 2.7E-05 9.9E-0595 1.0E-05 3.8E-0590 6.2E-06 2.3E-0550 1.1E-06 4.2E-0610 2.3E-07 8.4E-075 1.5E-07 5.6E-071 5.4E-08 2.0E-07
minimum 1.2E-08 4.4E-08
99.1 2.7E-05 1.0E-0473.1 2.7E-06 1.0E-0512.6 2.7E-07 1.0E-06
Playset andDeck
Percentile ofExposure
Lifetime Average Daily Dose(LADD) mg/kg/day
Cancer Risk Risk Level
A = 1.0E-6 B = 1.0E-5 C = 1.0E-4
maximum 8.2E-05 3.0E-0499 4.3E-05 1.6E-0495 2.1E-05 7.7E-0590 1.2E-05 4.4E-0550 2.7E-06 9.8E-0610 6.0E-07 2.2E-065 3.4E-07 1.3E-061 1.6E-07 6.0E-07
minimum 4.7E-08 1.7E-07
96.6 2.7E-05 1.0E-0450.5 2.7E-06 1.0E-053.5 2.7E-07 1.0E-06
Note: Shaded area indicates all the percentiles of the population that meet the risk level set by the Agency.
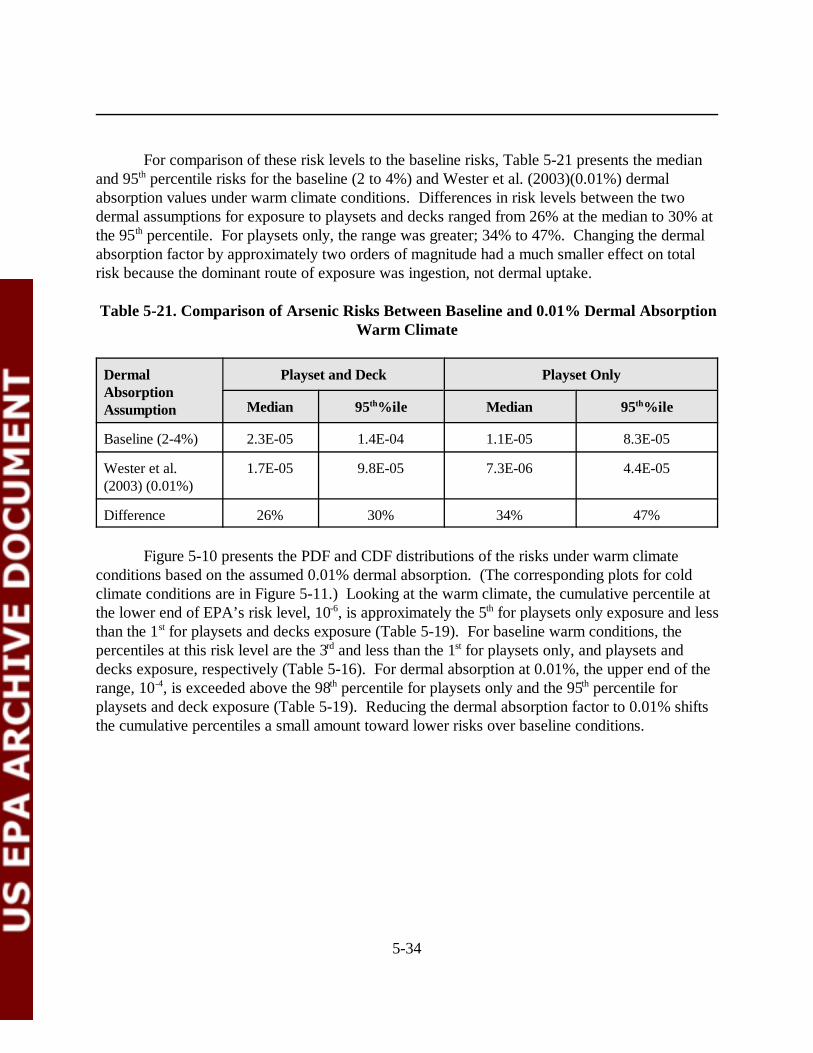
5-34
For comparison of these risk levels to the baseline risks, Table 5-21 presents the medianand 95th percentile risks for the baseline (2 to 4%) and Wester et al. (2003)(0.01%) dermalabsorption values under warm climate conditions. Differences in risk levels between the twodermal assumptions for exposure to playsets and decks ranged from 26% at the median to 30% atthe 95th percentile. For playsets only, the range was greater; 34% to 47%. Changing the dermalabsorption factor by approximately two orders of magnitude had a much smaller effect on totalrisk because the dominant route of exposure was ingestion, not dermal uptake.
Table 5-21. Comparison of Arsenic Risks Between Baseline and 0.01% Dermal AbsorptionWarm Climate
DermalAbsorptionAssumption
Playset and Deck Playset Only
Median 95th%ile Median 95th%ile
Baseline (2-4%) 2.3E-05 1.4E-04 1.1E-05 8.3E-05
Wester et al.(2003) (0.01%)
1.7E-05 9.8E-05 7.3E-06 4.4E-05
Difference 26% 30% 34% 47%
Figure 5-10 presents the PDF and CDF distributions of the risks under warm climateconditions based on the assumed 0.01% dermal absorption. (The corresponding plots for coldclimate conditions are in Figure 5-11.) Looking at the warm climate, the cumulative percentile atthe lower end of EPA’s risk level, 10-6, is approximately the 5th for playsets only exposure and lessthan the 1st for playsets and decks exposure (Table 5-19). For baseline warm conditions, thepercentiles at this risk level are the 3rd and less than the 1st for playsets only, and playsets anddecks exposure, respectively (Table 5-16). For dermal absorption at 0.01%, the upper end of therange, 10-4, is exceeded above the 98th percentile for playsets only and the 95th percentile forplaysets and deck exposure (Table 5-19). Reducing the dermal absorption factor to 0.01% shiftsthe cumulative percentiles a small amount toward lower risks over baseline conditions.
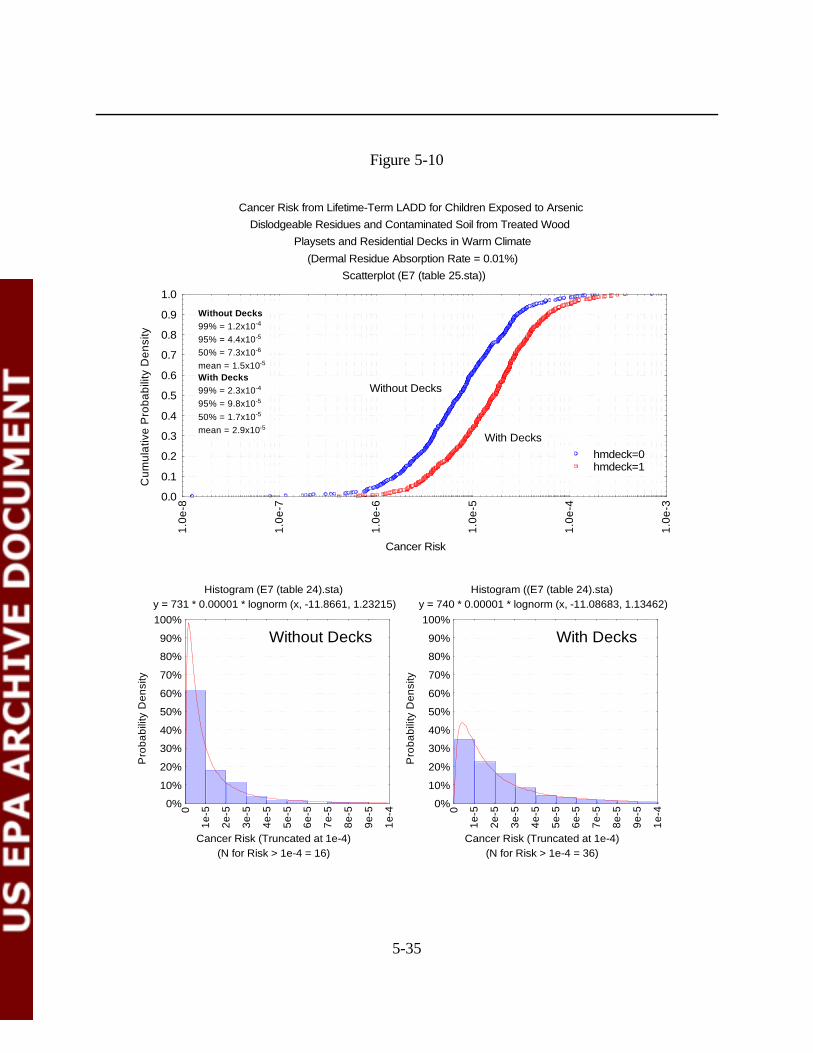
5-35
Cancer Risk from Lifetime-Term LADD for Children Exposed to ArsenicDislodgeable Residues and Contaminated Soil from Treated Wood
Playsets and Residential Decks in Warm Climate(Dermal Residue Absorption Rate = 0.01%)
Scatterplot (E7 (table 25.sta))
Cancer Risk
Cum
ulat
ive
Pro
babi
lity
Den
sity
0.0
0.1
0.2
0.3
0.4
0.5
0.6
0.7
0.8
0.9
1.0
1.0e
-8
1.0e
-7
1.0e
-6
1.0e
-5
1.0e
-4
1.0e
-3
Without Decks
With Deckshmdeck=0hmdeck=1
Without Decks99% = 1.2x10⁻⁴
95% = 4.4x10⁻⁵
50% = 7.3x10⁻⁶
mean = 1.5x10⁻⁵
With Decks99% = 2.3x10⁻⁴
95% = 9.8x10⁻⁵
50% = 1.7x10⁻⁵
mean = 2.9x10⁻⁵
Histogram (E7 (table 24).sta) y = 731 * 0.00001 * lognorm (x, -11.8661, 1.23215)
(N for Risk > 1e-4 = 16)Cancer Risk (Truncated at 1e-4)
Pro
babi
lity
Den
sity
0%
10%
20%
30%
40%
50%
60%
70%
80%
90%
100%
0
1e-5
2e-5
3e-5
4e-5
5e-5
6e-5
7e-5
8e-5
9e-5
1e-4
Histogram ((E7 (table 24).sta) y = 740 * 0.00001 * lognorm (x, -11.08683, 1.13462)
(N for Risk > 1e-4 = 36)Cancer Risk (Truncated at 1e-4)
Pro
babi
lity
Den
sity
0%
10%
20%
30%
40%
50%
60%
70%
80%
90%
100%
0
1e-5
2e-5
3e-5
4e-5
5e-5
6e-5
7e-5
8e-5
9e-5
1e-4
Without Decks With Decks
Figure 5-10

5-36
Cancer Risk from Lifetime-Term LADD for Children Exposed to ArsenicDislodgeable Residues and Contaminated Soil from Treated Wood
Playsets and Residential Decks in Cold Climate(Dermal Residue Absorption Rate = 0.01%)
Scatterplot (E8 (table 36).sta)
Cancer Risk
Cum
ulat
ive
Pro
babi
lity
Den
sity
0.0
0.1
0.2
0.3
0.4
0.5
0.6
0.7
0.8
0.9
1.0
1.0e
-8
1.0e
-7
1.0e
-6
1.0e
-5
1.0e
-4
1.0e
-3
Without Decks
With Decks
hmdeck=0hmdeck=1
Without Decks99% = 9.9x10⁻⁵
95% = 3.8x10⁻⁵
50% = 4.2x10⁻⁶
mean = 1.1x10⁻⁵
With Decks99% = 1.6x10⁻⁴
95% = 7.7x10⁻⁵
50% = 9.8x10⁻⁶
mean = 2.0x10⁻⁵
Histogram (E8 (table 36).sta) y = 761 * 0.000009 * lognorm (x, -12.33735, 1.30935)
(N for Risk > 1e-4 = 7)Cancer Risk (Truncated at N > 1e-4)
Pro
babi
lity
Den
sity
0%
10%
20%
30%
40%
50%
60%
70%
80%
90%
100%
0
1e-5
2e-5
3e-5
4e-5
5e-5
6e-5
7e-5
8e-5
9e-5
1e-4
Histogram (E8 (table 36).sta) y = 713 * 0.00001 * lognorm (x, -11.54723, 1.21188)
(N for Risk > 1e-4 = 24)Cancer Risk (Truncated at 1e-4)
Pro
babi
lity
Den
sity
0%
10%
20%
30%
40%
50%
60%
70%
80%
90%
100%
0
1e-5
2e-5
3e-5
4e-5
5e-5
6e-5
7e-5
8e-5
9e-5
1e-4
Without Decks With Decks
Figure 5-11
5-37
5.4 Summary
The potentially exposed population for this assessment was assumed to be children (ages1-6 years) in the United States who contact CCA-treated wood and/or CCA-containing soil frompublic playsets (e.g., at a playground, a school, a daycare center). A subset of these children wasalso assumed to contact CCA-treated wood residues and/or CCA-containing soil from residentialplaysets (i.e., at the child's own home or at another home) and/or residential decks (i.e., at thechild's own home or another home). This population was selected because of the particular focusby CPSC and other groups on playground playsets in conjunction with EPA's focus on estimatingthe risk to children from various primary sources of CCA-treated wood (Zartarian et al., 2003).
Noncancer and cancer risks to children exposed to CCA-treated playsets and decks werecalculated from doses generated using the SHEDS-Wood model. Noncancer risks were evaluatedagainst OPP’s guidance MOE values for arsenic and Cr(VI) for short- (1 day to 1 month) andintermediate-term (1 to 6 months) exposure duration. Lifetime (6 years of exposure averagedover 75 years) cancer risk from arsenic exposure was compared to risks ranging from 10-6 to 10-4. Noncancer risk for arsenic was above the guidance MOE of 30 for all exposure scenarios, up tothe 99th percentile. Cr(VI) risks were above the guidance MOE of 100 for all doses. Cancer riskexceeded the upper bound of the risk range, 10-4, at cumulative percentiles ranging from the 90th
for warm climate conditions and exposure to decks and playsets to the 99th for cold climateconditions and exposure to playsets only. Across all exposure scenarios, cancer risks were lessthan 10-6 at cumulative percentiles of the 9th and lower. Conversely, approximately 91% of thesimulated exposures had risks exceeding 10-6.
A screening level analysis comparing the risks from soil exposure versus residue exposurewas conducted. Residue risk was greater than soil risk for both categories of exposure. Forplayset and deck exposure, residue risks were approximately an order of magnitude greater;slightly lesser differences were seen for playset only exposure. At the 95th percentile, soil risksexceeded 10-5 for both categories of exposure and residue risks were slightly greater than 10-4 forplayset and deck exposure.
Cancer risk was also evaluated using a lower dermal absorption factor for arsenic. Whenthis factor was reduced by approximately two orders of magnitude, risks were reduced by up to30% at the 95 th percentile for exposure to playsets and decks. Lesser risk reduction was seen atthe 50th percentile.
6-1
6.0 RISK REDUCTION IMPACTS
6.1 Introduction
The Agency describes risk reduction impacts in this chapter to aid the risk manager inidentifying techniques to reduce risk, given the potential concerns based on cancer risk (seeChapter 5.0) from contact with CCA-treated wood. The effect of the mitigation strategies wasonly assessed for carcinogenic risks from arsenic, because the noncancer MOEs for arsenic andchromium were above OPP’s guideline values. This Section presents background informationregarding factors that may influence arsenic and chromium levels on or near CCA-treated wood. The impact of the various mitigation strategies considered are presented in Section 6.2.
There are many variables that can influence the amount of dislodgeable arsenic andchromium levels present in CCA-treated wood surfaces and in the soil residues from chromatedarsenical wood products. These variables include:
• Level of retention of arsenic and chromium in the wood;• Different types of CCA (e.g., CCA type A, B, or C);• Different types of pressure treated wood (douglas fir, southern pine, western
cedar, red oak, etc.);• Variables in pressure treatment process (e.g., temperature and pH, air seasoning
time, removal of water, oven drying, etc.) influence the retention of CCA in thewood;
• Use of a salt or an oxide formulation of CCA;• Weather conditions (e.g, acid rain, wet wood can greatly increase the amount of
dislodgeable residues);• Different uses of wood (wood decks, construction or utility poles, marine timbers,
fence posts, wood foundation lumber, plywood, and wood for playgroundstructures, etc.);
• Age of the wood;• Physical condition of the wood (e.g., sanding, surface dirt, or sawing); and• Application of sealant (with oil-based or water-based).
Some of these variables, such as the pressure treatment, level of retention, the type ofwood, age of wood, weather conditions, and formulation of CCA, are variables that are notcontrolled by the typical homeowner. However, there may be things that a homeowner can do tocontrol or reduce the risks from CCA-treated wood in playsets and decks. The Introduction andBackground Chapter (Chapter 2.0) summarized some of the state regulatory agencyrecommendations for homeowners to reduce risks to CCA-treated wood. Theserecommendations include:
6-2
• Sealing CCA-treated structures (decks and playsets) every two years withoil-based stain;
• Preventing exposure to pressure-treated wood and dust; • Washing hands after playing on wooden playground equipment;• Inspecting structures for decay;• Using alternatives to CCA-treated pressure treated wood;• Not placing food, drink or paper products on pressure treated wood;• Never burning treated wood;• Limiting use of under deck areas where arsenic may have accumulated in soil;• Not using treated wood on indoor surfaces; and• Not using CCA-treated wood for wood chips or mulch.
In addition, to providing recommendations to homeowners on how to reduce risks toCCA-treated wood, some states also have codified laws designed to reduce exposure andeliminate some types of CCA-treated wood. States such as California, Florida, Maine, Minnesota,and New York either have laws or are introducing legislation that eliminate the supply of certaintypes of CCA-treated wood or require the application of sealants to playground/recreationequipment made with CCA-treated wood (See Chapter 2.0).
Because of the potential concerns based on arsenic cancer risk (see Chapter 5.0) fromcontact with CCA-treated wood, the Agency is considering risk reduction impacts in this chapterto aid risk managers in identifying techniques to reduce risk. Obviously many of therecommendations to reduce arsenic are based on the activities of the homeowner that are notreadily quantified. In 2001, the FIFRA SAP identified the need for information on theperformance and efficacy of different types and brands of coatings (U.S. EPA, 1991c). EPAcompleted the protocol for ongoing research on the effectiveness of sealants on weathered CCA-treated wood. For the purposes of this risk assessment, assumptions were made with regard tothe effectiveness of sealants. These assumptions were based on data such as Stilwell (1998) whoreported over a 95% reduction for oil-based alkyl resins for samples tested one year after a sealantwas applied. CDHS (1987) reported 96%, and 82% reduction from stained treated woodsurfaces after one month and 2 years, respectively. Based on these two existing data sources,OPP assumed a 90% reduction in residues for a moderate reduction scenario, and a 99.5%reduction in residues for a maximum reduction scenario. These reductions in residueconcentration were assumed to be constant over time. SHEDS-Wood estimated exposures basedon residue reduction resulting from the use of sealants and/or hand washing. The risks associatedwith these reduced exposures are presented in Section 6.2.
6.1.1 Application of Sealant and Hand Washing Information to SHEDS-Wood
The FIFRA SAP recommended that “EPA inform the public of the ability of certaincoatings to substantially reduce leachable and dislodgeable CCA chemicals and thus reduce
6-3
potential exposures to arsenic and chromium.” While the Panel made recommendations regardingthe need for additional studies in this area, it felt that the current evidence was sufficient to beginadvising the public about the use of coatings. The Panel made the following observations.
• The weight-of-evidence from available studies indicated that certain coatings cansubstantially reduce dislodgeable and leachable CCA chemicals.
• Reductions of 70 to 95% or greater in dislodgeable arsenic were seen in all studiesthat subjected CCA wood to natural weathering. (U.S. EPA, 2001c).
Table 6-1 presents the results of the SAP’s analysis of the available sealant studies. ThePanel indicated that “there is no evidence that water repellents added directly to the treatmentsolution are effective in reducing leachable/dislodgeable CCA chemicals; current data are notadequate for identifying a particular coating as being clearly superior or inferior to reducingleachable/dislodgeable CCA chemicals. However, confidence is highest for polyurethane, as thiscoating was shown to result in substantial (70 to >95%) reduction in dislodgeable arsenic in a wellcontrolled field study (a “real-world” application allowing for effects of use, and a short-termcontrolled laboratory study)” (U.S. EPA, 2001c).
Based on the results of the FIFRA SAP, EPA assumed a moderate reduction (90%reduction in residue concentrations with sealant for warm climates only) and a maximum feasiblereduction (99.5% reduction in residue concentration with sealant for warm climates only) andincorporated this into the SHEDs-Wood model.
Hand washing was modeled in SHEDS-Wood. The SHEDS-Wood report (see Zartarianet al., 2003) specifically described how hand washing was estimated (Zartarian et al., 2003).Below is an excerpt from the text that describes the SHEDs-Wood modeling:
“SHEDS–Wood is essentially a mass balance model that involves simulating themovement and fate of the pollutant of interest after it has come into contact with theexposed individual. The SHEDS-Wood model follows simulated individuals through time,keeping track of the additions and subtractions to the cumulative exposure loading. An‘exposure’ is a new contact with the target chemical; hence ‘exposure’ can only occur atplaces where the chemical is present (in this case, decks or playsets). Once exposureoccurs, the chemical remains present on or in an individual until it is removed. Thecumulative exposure loading is the total amount of the chemical currently in contact withthe person; this can be non-zero even when away from decks and playsets. It is analogousto a bank balance, with new exposures corresponding to deposits and removal processesto withdrawals. In the equations below, a distinction is made between the amount ofnew exposure E from a single macroactivity event, and the current loading or cumulativeexposure CE . The size of CE cannot be determined solely from the record of exposures,but depends on the frequency and size of the removal terms (the withdrawals in the bankaccount analogy).
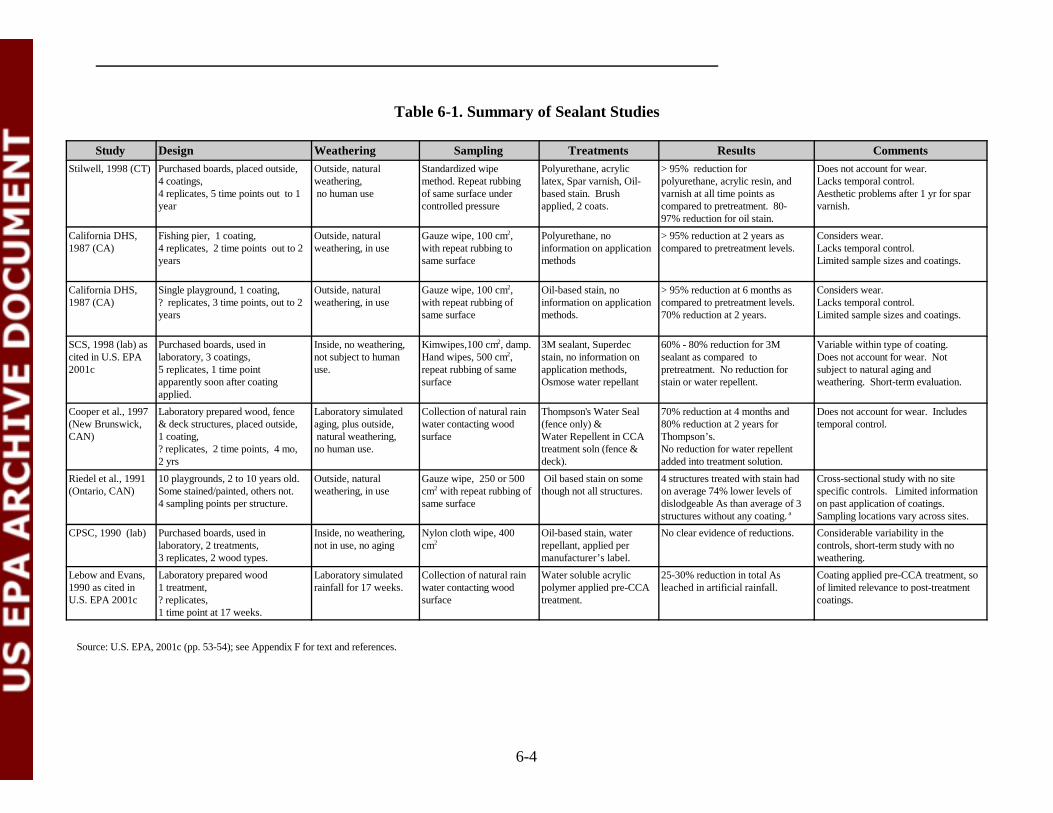
6-4
Table 6-1. Summary of Sealant Studies
Study Design Weathering Sampling Treatments Results CommentsStilwell, 1998 (CT) Purchased boards, placed outside,
4 coatings, 4 replicates, 5 time points out to 1 year
Outside, naturalweathering, no human use
Standardized wipemethod. Repeat rubbingof same surface undercontrolled pressure
Polyurethane, acryliclatex, Spar varnish, Oil-based stain. Brushapplied, 2 coats.
> 95% reduction forpolyurethane, acrylic resin, andvarnish at all time points ascompared to pretreatment. 80-97% reduction for oil stain.
Does not account for wear. Lacks temporal control.Aesthetic problems after 1 yr for sparvarnish.
California DHS,1987 (CA)
Fishing pier, 1 coating, 4 replicates, 2 time points out to 2 years
Outside, naturalweathering, in use
Gauze wipe, 100 cm2, with repeat rubbing tosame surface
Polyurethane, noinformation on applicationmethods
> 95% reduction at 2 years ascompared to pretreatment levels.
Considers wear. Lacks temporal control.Limited sample sizes and coatings.
California DHS,1987 (CA)
Single playground, 1 coating, ? replicates, 3 time points, out to 2years
Outside, naturalweathering, in use
Gauze wipe, 100 cm2,with repeat rubbing ofsame surface
Oil-based stain, noinformation on applicationmethods.
> 95% reduction at 6 months ascompared to pretreatment levels. 70% reduction at 2 years.
Considers wear. Lacks temporal control.Limited sample sizes and coatings.
SCS, 1998 (lab) ascited in U.S. EPA2001c
Purchased boards, used inlaboratory, 3 coatings,5 replicates, 1 time pointapparently soon after coatingapplied.
Inside, no weathering,not subject to humanuse.
Kimwipes,100 cm2, damp.Hand wipes, 500 cm2,repeat rubbing of samesurface
3M sealant, Superdecstain, no information onapplication methods,Osmose water repellant
60% - 80% reduction for 3Msealant as compared topretreatment. No reduction forstain or water repellent.
Variable within type of coating.Does not account for wear. Notsubject to natural aging andweathering. Short-term evaluation.
Cooper et al., 1997 (New Brunswick, CAN)
Laboratory prepared wood, fence& deck structures, placed outside,1 coating, ? replicates, 2 time points, 4 mo,2 yrs
Laboratory simulatedaging, plus outside, natural weathering,no human use.
Collection of natural rainwater contacting woodsurface
Thompson's Water Seal(fence only) &Water Repellent in CCAtreatment soln (fence &deck).
70% reduction at 4 months and 80% reduction at 2 years forThompson’s. No reduction for water repellentadded into treatment solution.
Does not account for wear. Includestemporal control.
Riedel et al., 1991(Ontario, CAN)
10 playgrounds, 2 to 10 years old. Some stained/painted, others not. 4 sampling points per structure.
Outside, naturalweathering, in use
Gauze wipe, 250 or 500cm2 with repeat rubbing ofsame surface
Oil based stain on somethough not all structures.
4 structures treated with stain hadon average 74% lower levels ofdislodgeable As than average of 3structures without any coating. a
Cross-sectional study with no sitespecific controls. Limited informationon past application of coatings. Sampling locations vary across sites.
CPSC, 1990 (lab) Purchased boards, used inlaboratory, 2 treatments, 3 replicates, 2 wood types.
Inside, no weathering,not in use, no aging
Nylon cloth wipe, 400cm2
Oil-based stain, waterrepellant, applied permanufacturer’s label.
No clear evidence of reductions. Considerable variability in thecontrols, short-term study with noweathering.
Lebow and Evans,1990 as cited inU.S. EPA 2001c
Laboratory prepared wood1 treatment, ? replicates, 1 time point at 17 weeks.
Laboratory simulatedrainfall for 17 weeks.
Collection of natural rainwater contacting woodsurface
Water soluble acrylicpolymer applied pre-CCAtreatment.
25-30% reduction in total Asleached in artificial rainfall.
Coating applied pre-CCA treatment, soof limited relevance to post-treatmentcoatings.
Source: U.S. EPA, 2001c (pp. 53-54); see Appendix F for text and references.
6-5
New dermal exposure, once contacted, remains on the skin until removed by one of acompeting set of processes. These include washing and bathing, hand-to-mouth transfer,physical removal when load limits are exceeded, and dermal absorption. Because theseprocesses compete, an increase in the frequency of hand washing will produce deceases inthe amounts that can be removed by the other processes. Thus, the impact of washing onthe absorbed dose can be estimated directly. For ingested (GI tract) exposures, theremoval processes are gastrointestinal absorption and daily voiding of the GI tract.
The basis for the changes to the cumulative exposure loading is the macroactivity timestep, or event. Within a single time step, the SHEDS-Wood model does not modelprocesses as continuous changes in time, but instead treats them as a sequence ofinstantaneous adjustments or changes to the cumulative loading, one for each processunder consideration. The order of the adjustments is: first, new exposure contact (if any)is added; second, the cumulative loadings are compared to the maximum dermal loadinglimits and reduced if necessary; third, the effects of absorption are determined; fourth,hand-to-mouth transfer occurs; fifth, hand washing (if present); and sixth, bathing (ifpresent). The presence and the size of each adjustment is based on the activity eventsreported in the human activity diaries taken from the CHAD database and on the settingsof several of the input variables” (Zartarian et al., 2003).
OPP was able to use the exposures of SHEDS-Wood to evaluate the effect of handwashing on cancer risks.
6.2 Risk Characterization for Mitigation Measures
Many of the methods to reduce arsenic exposure are based on the activities of thehomeowner that are not readily quantified. SHEDS-Wood simulated reduced exposure dosesresulting from two mitigation measures: the use of sealants and/or hand washing. Thesemitigation measures only apply to residue exposure and not to soil exposure. Although soilexposure may potentially be reduced through removal of contaminated soil, this was not modeledin SHEDS-Wood. The use of sealants may also reduce the rate of transfer of CCA to theadjacent soil over time, however, there are no available studies documenting this effect. Theapproach taken in SHEDS-Wood was conservative: exposures were most likely overestimatedbecause soil concentrations were held constant while wood residue concentrations were reduced. Another issue is how SHEDS-Wood treated soil exposure. Residue exposures were assumed tobe transferred to the gastrointestinal tract via hand-to-mouth behavior, but this was not the casefor soils. Instead, soil ingestion was treated as a single term that included both direct eating ofsoil as well as soil-hand-mouth transfers.
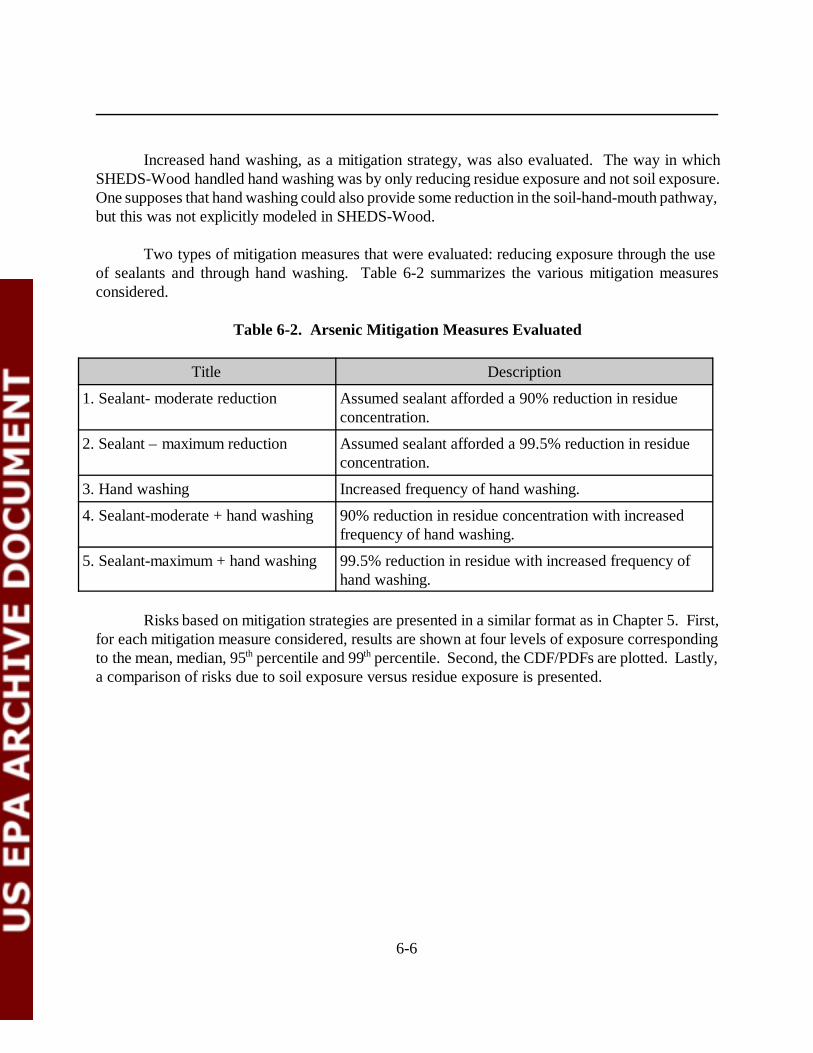
6-6
Increased hand washing, as a mitigation strategy, was also evaluated. The way in whichSHEDS-Wood handled hand washing was by only reducing residue exposure and not soil exposure.One supposes that hand washing could also provide some reduction in the soil-hand-mouth pathway,but this was not explicitly modeled in SHEDS-Wood.
Two types of mitigation measures that were evaluated: reducing exposure through the useof sealants and through hand washing. Table 6-2 summarizes the various mitigation measuresconsidered.
Table 6-2. Arsenic Mitigation Measures Evaluated
Title Description
1. Sealant- moderate reduction Assumed sealant afforded a 90% reduction in residueconcentration.
2. Sealant – maximum reduction Assumed sealant afforded a 99.5% reduction in residueconcentration.
3. Hand washing Increased frequency of hand washing.
4. Sealant-moderate + hand washing 90% reduction in residue concentration with increasedfrequency of hand washing.
5. Sealant-maximum + hand washing 99.5% reduction in residue with increased frequency ofhand washing.
Risks based on mitigation strategies are presented in a similar format as in Chapter 5. First,for each mitigation measure considered, results are shown at four levels of exposure correspondingto the mean, median, 95th percentile and 99th percentile. Second, the CDF/PDFs are plotted. Lastly,a comparison of risks due to soil exposure versus residue exposure is presented.
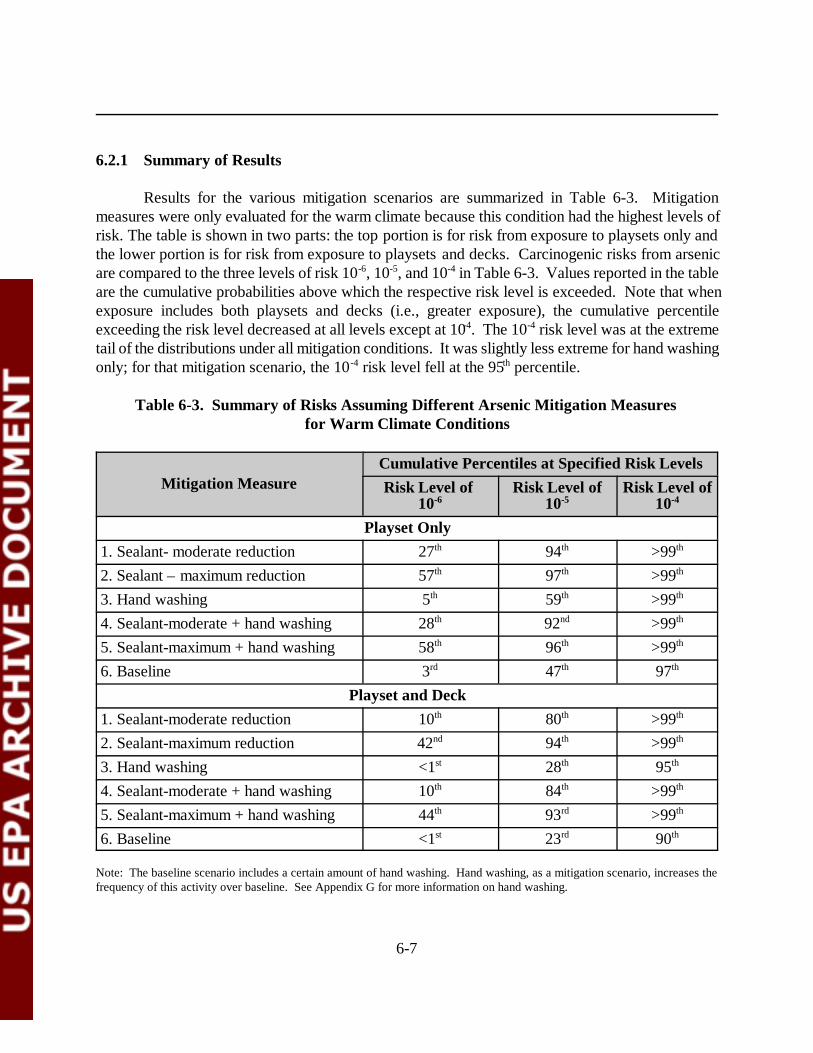
6-7
6.2.1 Summary of Results
Results for the various mitigation scenarios are summarized in Table 6-3. Mitigationmeasures were only evaluated for the warm climate because this condition had the highest levels ofrisk. The table is shown in two parts: the top portion is for risk from exposure to playsets only andthe lower portion is for risk from exposure to playsets and decks. Carcinogenic risks from arsenicare compared to the three levels of risk 10-6, 10-5, and 10-4 in Table 6-3. Values reported in the tableare the cumulative probabilities above which the respective risk level is exceeded. Note that whenexposure includes both playsets and decks (i.e., greater exposure), the cumulative percentileexceeding the risk level decreased at all levels except at 10-4. The 10-4 risk level was at the extremetail of the distributions under all mitigation conditions. It was slightly less extreme for hand washingonly; for that mitigation scenario, the 10-4 risk level fell at the 95th percentile.
Table 6-3. Summary of Risks Assuming Different Arsenic Mitigation Measures for Warm Climate Conditions
Mitigation MeasureCumulative Percentiles at Specified Risk LevelsRisk Level of
10-6Risk Level of
10-5Risk Level of
10-4
Playset Only1. Sealant- moderate reduction 27th 94th >99th
2. Sealant – maximum reduction 57th 97th >99th
3. Hand washing 5th 59th >99th
4. Sealant-moderate + hand washing 28th 92nd >99th
5. Sealant-maximum + hand washing 58th 96th >99th
6. Baseline 3rd 47th 97th
Playset and Deck1. Sealant-moderate reduction 10th 80th >99th
2. Sealant-maximum reduction 42nd 94th >99th
3. Hand washing <1st 28th 95th
4. Sealant-moderate + hand washing 10th 84th >99th
5. Sealant-maximum + hand washing 44th 93rd >99th
6. Baseline <1st 23rd 90th
Note: The baseline scenario includes a certain amount of hand washing. Hand washing, as a mitigation scenario, increases thefrequency of this activity over baseline. See Appendix G for more information on hand washing.
1 This may be due to the way SHEDS-Wood simulated the effect of hand washing, asnoted in Section 6.2.
6-8
The evaluation of risk remaining after the simulated mitigation measure was considered inreference to the baseline risk (i.e., no mitigation) discussed in Chapter 5. The following discussionfocuses on the 10-6 risk level for comparison among the mitigation measures to baseline. Forreference, the baseline percentiles at the 10-6 level (see Table 5-1) for warm climate conditionswere the 3rd for playset only exposure and less than the 1st for exposure to playsets and decks.Several observations were made regarding the risks remaining following simulated mitigationmeasures. First, as would be expected, the greatest risk reduction occurred with the sealant undermaximum residue reduction (99.5%). For example, for playset only exposure, the 10 -6 risk leveloccurred at the 57 th percentile with this mitigation as compared to the 3rd percentile for thebaseline condition. For exposure to decks and playsets, the comparable percentile was the 42th.Second, hand washing provided the least reduction of risk; for playsets alone, the 10-6 risk leveloccurred at the 5 th percentile and less than the 1st percentile for decks and playset exposure. Third, the simulation of combining sealant mitigation with hand washing had minimal impacts onthe percentiles for the 10-6 risk level.1
6.2.2 Risk Reduction Through the Use of Sealants
Cancer risks for arsenic for children in warm climates were assessed for a moderatereduction in residue concentration (90% reduction in residue concentration) and a maximumreduction in residue concentration (99.5% reduction in residue concentration) to simulate the useof sealants. Table 6-4 presents the risks under the assumption of moderate and maximumreduction of exposure for the mean, median, and 95 th percentile, and 99th percentile. For themaximum reduction simulation, risks were found to be within EPA’s risk range for the fourexposure levels shown here. Comparing risks from exposure to playsets and decks to exposure toplaysets only, shows that the playset only risks were approximately 2 times less than the combinedexposure. For the moderate reduction simulation, risks were still found to be within EPA’s riskrange for the four exposure levels shown here. Risk from exposure to playsets and decks wereagain approximately 2 times greater than risks from exposure to playsets alone. For comparison,baseline risks at the 95th percentile were 1.4 x 10⁻⁴ for playset and deck exposure and 8.3 x 10⁻⁵
for playsets only. At the 95th percentile, under the maximum reduction simulation, risks werereduced by approximately an order of magnitude over baseline.
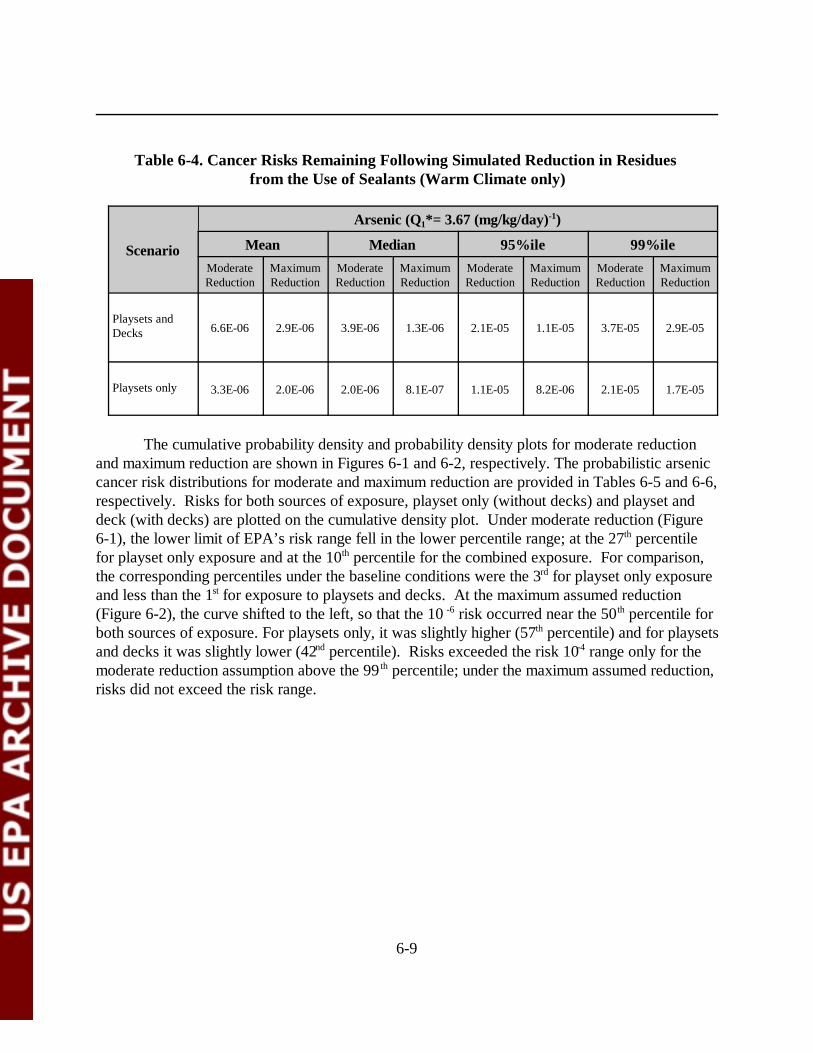
6-9
Table 6-4. Cancer Risks Remaining Following Simulated Reduction in Residues from the Use of Sealants (Warm Climate only)
Scenario
Arsenic (Q1*= 3.67 (mg/kg/day)-1)
Mean Median 95%ile 99%ileModerateReduction
MaximumReduction
ModerateReduction
MaximumReduction
ModerateReduction
MaximumReduction
ModerateReduction
MaximumReduction
Playsets andDecks 6.6E-06 2.9E-06 3.9E-06 1.3E-06 2.1E-05 1.1E-05 3.7E-05 2.9E-05
Playsets only 3.3E-06 2.0E-06 2.0E-06 8.1E-07 1.1E-05 8.2E-06 2.1E-05 1.7E-05
The cumulative probability density and probability density plots for moderate reductionand maximum reduction are shown in Figures 6-1 and 6-2, respectively. The probabilistic arseniccancer risk distributions for moderate and maximum reduction are provided in Tables 6-5 and 6-6,respectively. Risks for both sources of exposure, playset only (without decks) and playset anddeck (with decks) are plotted on the cumulative density plot. Under moderate reduction (Figure6-1), the lower limit of EPA’s risk range fell in the lower percentile range; at the 27th percentilefor playset only exposure and at the 10th percentile for the combined exposure. For comparison,the corresponding percentiles under the baseline conditions were the 3rd for playset only exposureand less than the 1st for exposure to playsets and decks. At the maximum assumed reduction(Figure 6-2), the curve shifted to the left, so that the 10 -6 risk occurred near the 50th percentile forboth sources of exposure. For playsets only, it was slightly higher (57th percentile) and for playsetsand decks it was slightly lower (42nd percentile). Risks exceeded the risk 10-4 range only for themoderate reduction assumption above the 99 th percentile; under the maximum assumed reduction,risks did not exceed the risk range.
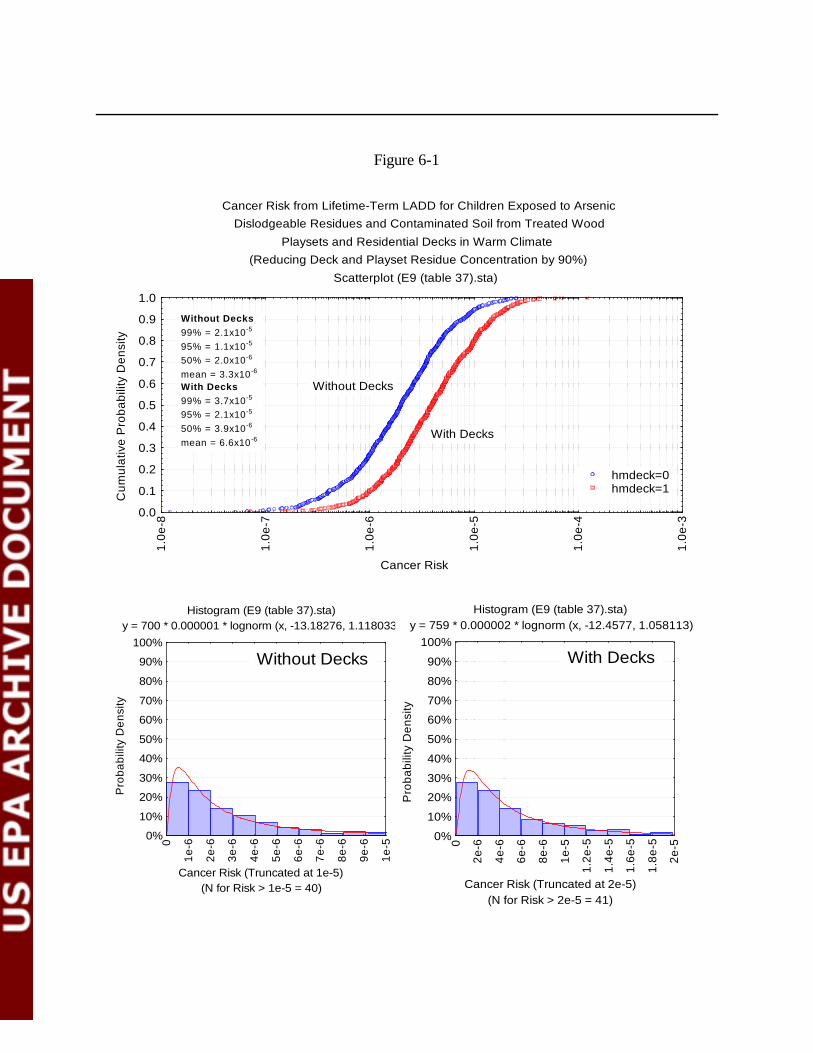
6-10
Cancer Risk from Lifetime-Term LADD for Children Exposed to ArsenicDislodgeable Residues and Contaminated Soil from Treated Wood
Playsets and Residential Decks in Warm Climate(Reducing Deck and Playset Residue Concentration by 90%)
Scatterplot (E9 (table 37).sta)
Cancer Risk
Cum
ulat
ive
Pro
babi
lity
Den
sity
0.0
0.1
0.2
0.3
0.4
0.5
0.6
0.7
0.8
0.9
1.0
1.0e
-8
1.0e
-7
1.0e
-6
1.0e
-5
1.0e
-4
1.0e
-3
Without Decks
With Decks
hmdeck=0hmdeck=1
Without Decks99% = 2.1x10⁻⁵
95% = 1.1x10⁻⁵
50% = 2.0x10⁻⁶
mean = 3.3x10⁻⁶
With Decks99% = 3.7x10⁻⁵
95% = 2.1x10⁻⁵
50% = 3.9x10⁻⁶
mean = 6.6x10⁻⁶
Histogram (E9 (table 37).sta) y = 700 * 0.000001 * lognorm (x, -13.18276, 1.118033)
(N for Risk > 1e-5 = 40)Cancer Risk (Truncated at 1e-5)
Pro
babi
lity
Den
sity
0%
10%
20%
30%
40%
50%
60%
70%
80%
90%
100%
0
1e-6
2e-6
3e-6
4e-6
5e-6
6e-6
7e-6
8e-6
9e-6
1e-5
Histogram (E9 (table 37).sta) y = 759 * 0.000002 * lognorm (x, -12.4577, 1.058113)
(N for Risk > 2e-5 = 41)Cancer Risk (Truncated at 2e-5)
Pro
babi
lity
Den
sity
0%
10%
20%
30%
40%
50%
60%
70%
80%
90%
100%
0
2e-6
4e-6
6e-6
8e-6
1e-5
1.2e
-5
1.4e
-5
1.6e
-5
1.8e
-5
2e-5
Without Decks With Decks
Figure 6-1
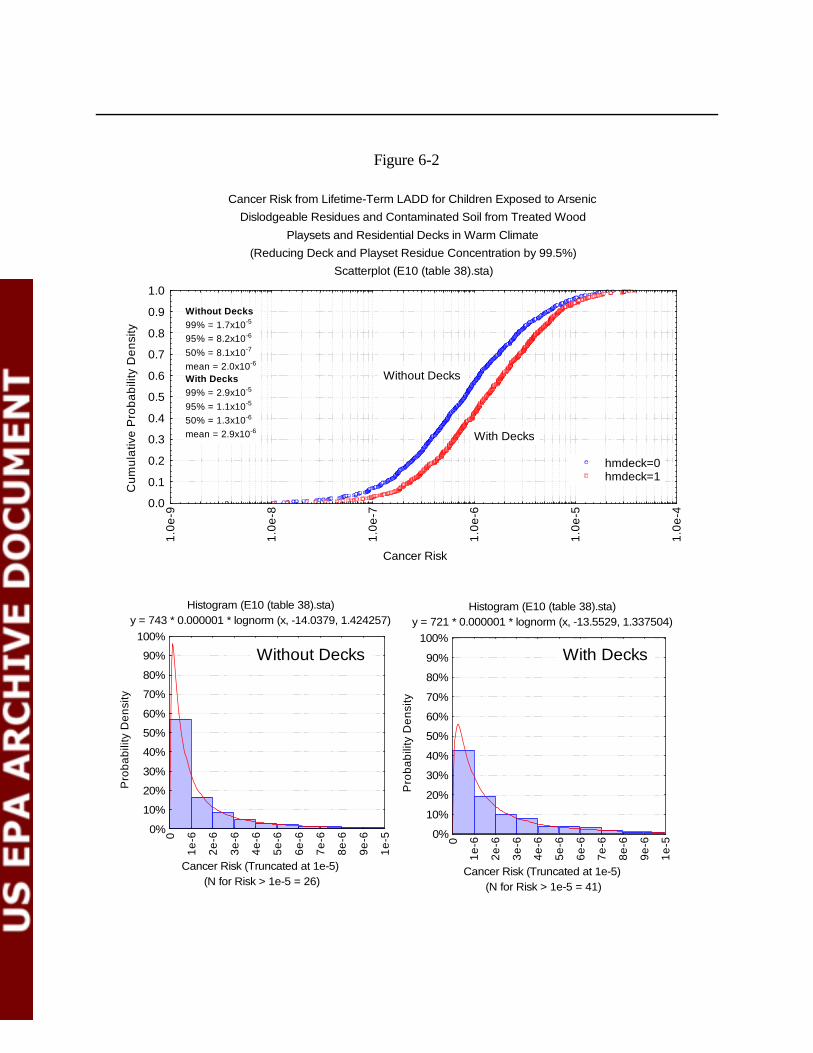
6-11
Cancer Risk from Lifetime-Term LADD for Children Exposed to ArsenicDislodgeable Residues and Contaminated Soil from Treated Wood
Playsets and Residential Decks in Warm Climate(Reducing Deck and Playset Residue Concentration by 99.5%)
Scatterplot (E10 (table 38).sta)
Cancer Risk
Cum
ulat
ive
Pro
babi
lity
Den
sity
0.0
0.1
0.2
0.3
0.4
0.5
0.6
0.7
0.8
0.9
1.0
1.0e
-9
1.0e
-8
1.0e
-7
1.0e
-6
1.0e
-5
1.0e
-4
Without Decks
With Decks
hmdeck=0hmdeck=1
Without Decks99% = 1.7x10⁻⁵
95% = 8.2x10⁻⁶
50% = 8.1x10⁻⁷
mean = 2.0x10⁻⁶
With Decks99% = 2.9x10⁻⁵
95% = 1.1x10⁻⁵
50% = 1.3x10⁻⁶
mean = 2.9x10⁻⁶
Histogram (E10 (table 38).sta) y = 743 * 0.000001 * lognorm (x, -14.0379, 1.424257)
(N for Risk > 1e-5 = 26)Cancer Risk (Truncated at 1e-5)
Pro
babi
lity
Den
sity
0%
10%
20%
30%
40%
50%
60%
70%
80%
90%
100%
0
1e-6
2e-6
3e-6
4e-6
5e-6
6e-6
7e-6
8e-6
9e-6
1e-5
Histogram (E10 (table 38).sta) y = 721 * 0.000001 * lognorm (x, -13.5529, 1.337504)
(N for Risk > 1e-5 = 41)Cancer Risk (Truncated at 1e-5)
Pro
babi
lity
Den
sity
0%
10%
20%
30%
40%
50%
60%
70%
80%
90%
100%
0
1e-6
2e-6
3e-6
4e-6
5e-6
6e-6
7e-6
8e-6
9e-6
1e-5
Without Decks With Decks
Figure 6-2
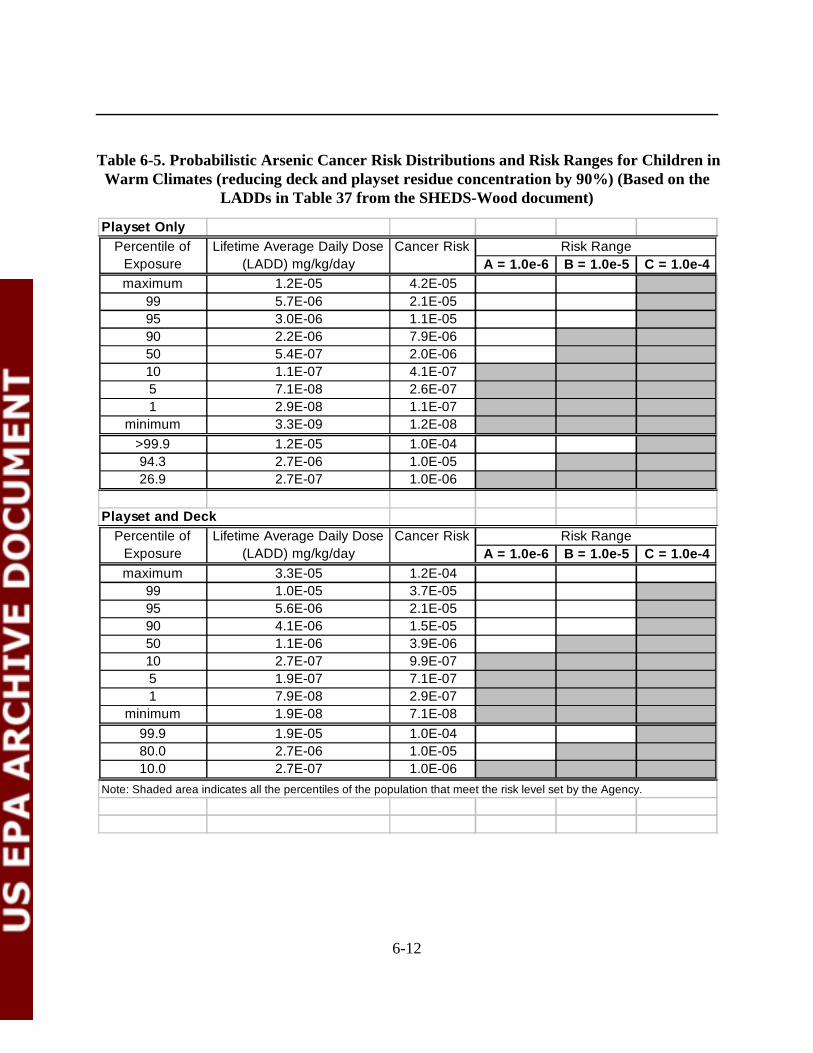
6-12
Playset Only
A = 1.0e-6 B = 1.0e-5 C = 1.0e-4maximum 1.2E-05 4.2E-05
99 5.7E-06 2.1E-0595 3.0E-06 1.1E-0590 2.2E-06 7.9E-0650 5.4E-07 2.0E-0610 1.1E-07 4.1E-075 7.1E-08 2.6E-071 2.9E-08 1.1E-07
minimum 3.3E-09 1.2E-08>99.9 1.2E-05 1.0E-0494.3 2.7E-06 1.0E-0526.9 2.7E-07 1.0E-06
Playset and Deck
A = 1.0e-6 B = 1.0e-5 C = 1.0e-4maximum 3.3E-05 1.2E-04
99 1.0E-05 3.7E-0595 5.6E-06 2.1E-0590 4.1E-06 1.5E-0550 1.1E-06 3.9E-0610 2.7E-07 9.9E-075 1.9E-07 7.1E-071 7.9E-08 2.9E-07
minimum 1.9E-08 7.1E-0899.9 1.9E-05 1.0E-0480.0 2.7E-06 1.0E-0510.0 2.7E-07 1.0E-06
Note: Shaded area indicates all the percentiles of the population that meet the risk level set by the Agency.
Percentile of Exposure
Lifetime Average Daily Dose (LADD) mg/kg/day
Cancer Risk Risk Range
Percentile of Exposure
Lifetime Average Daily Dose (LADD) mg/kg/day
Cancer Risk Risk Range
Table 6-5. Probabilistic Arsenic Cancer Risk Distributions and Risk Ranges for Children inWarm Climates (reducing deck and playset residue concentration by 90%) (Based on the
LADDs in Table 37 from the SHEDS-Wood document)
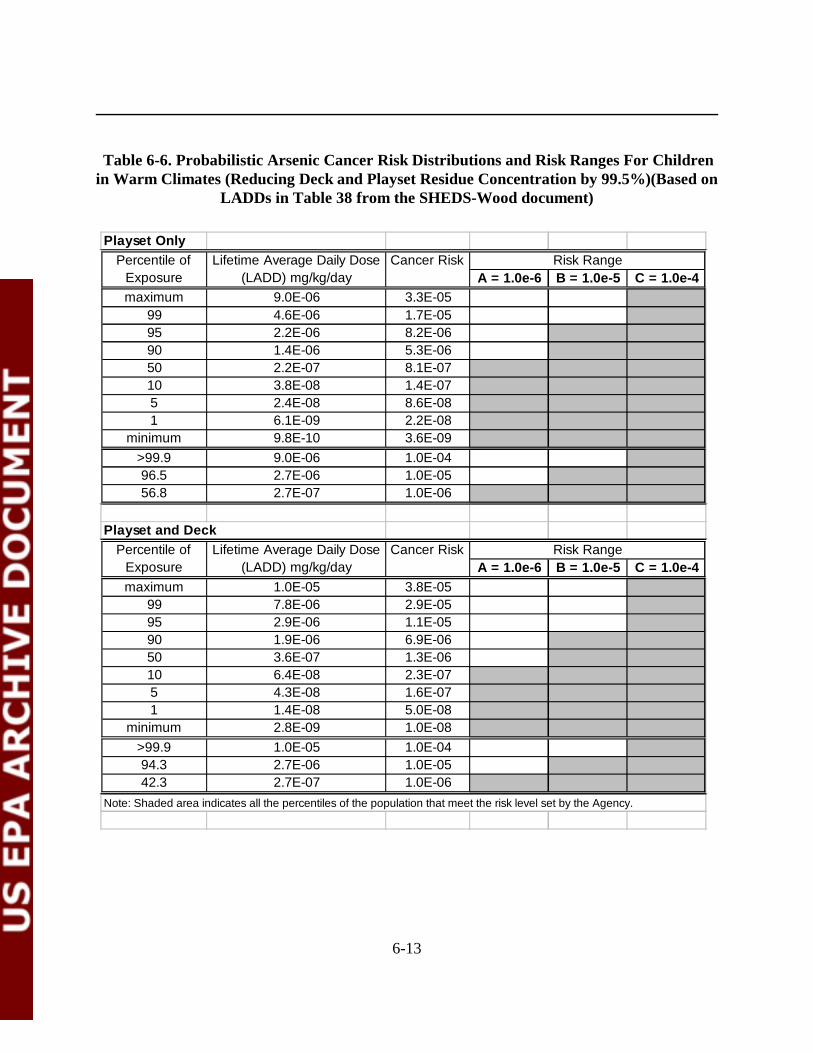
6-13
Playset Only
A = 1.0e-6 B = 1.0e-5 C = 1.0e-4maximum 9.0E-06 3.3E-05
99 4.6E-06 1.7E-0595 2.2E-06 8.2E-0690 1.4E-06 5.3E-0650 2.2E-07 8.1E-0710 3.8E-08 1.4E-075 2.4E-08 8.6E-081 6.1E-09 2.2E-08
minimum 9.8E-10 3.6E-09>99.9 9.0E-06 1.0E-0496.5 2.7E-06 1.0E-0556.8 2.7E-07 1.0E-06
Playset and Deck
A = 1.0e-6 B = 1.0e-5 C = 1.0e-4maximum 1.0E-05 3.8E-05
99 7.8E-06 2.9E-0595 2.9E-06 1.1E-0590 1.9E-06 6.9E-0650 3.6E-07 1.3E-0610 6.4E-08 2.3E-075 4.3E-08 1.6E-071 1.4E-08 5.0E-08
minimum 2.8E-09 1.0E-08>99.9 1.0E-05 1.0E-0494.3 2.7E-06 1.0E-0542.3 2.7E-07 1.0E-06
Note: Shaded area indicates all the percentiles of the population that meet the risk level set by the Agency.
Percentile of Exposure
Lifetime Average Daily Dose (LADD) mg/kg/day
Cancer Risk Risk Range
Percentile of Exposure
Lifetime Average Daily Dose (LADD) mg/kg/day
Cancer Risk Risk Range
Table 6-6. Probabilistic Arsenic Cancer Risk Distributions and Risk Ranges For Childrenin Warm Climates (Reducing Deck and Playset Residue Concentration by 99.5%)(Based on
LADDs in Table 38 from the SHEDS-Wood document)
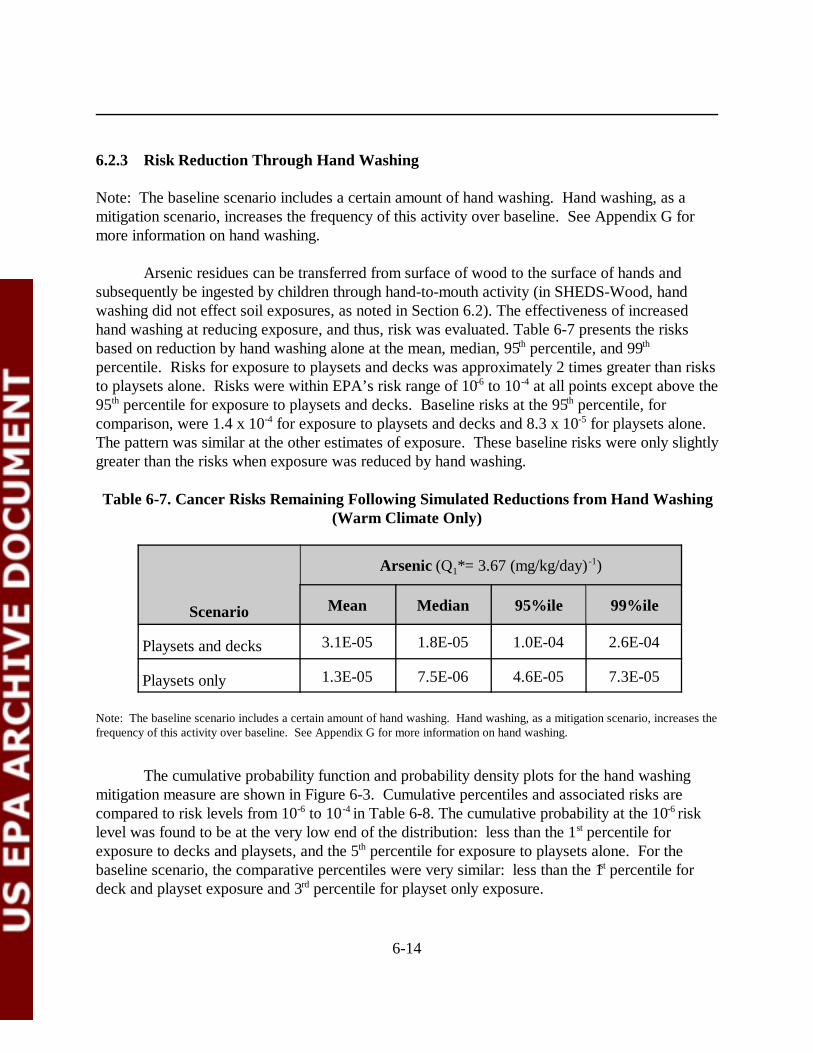
6-14
6.2.3 Risk Reduction Through Hand Washing
Note: The baseline scenario includes a certain amount of hand washing. Hand washing, as amitigation scenario, increases the frequency of this activity over baseline. See Appendix G formore information on hand washing.
Arsenic residues can be transferred from surface of wood to the surface of hands andsubsequently be ingested by children through hand-to-mouth activity (in SHEDS-Wood, handwashing did not effect soil exposures, as noted in Section 6.2). The effectiveness of increasedhand washing at reducing exposure, and thus, risk was evaluated. Table 6-7 presents the risksbased on reduction by hand washing alone at the mean, median, 95th percentile, and 99th
percentile. Risks for exposure to playsets and decks was approximately 2 times greater than risksto playsets alone. Risks were within EPA’s risk range of 10-6 to 10-4 at all points except above the95th percentile for exposure to playsets and decks. Baseline risks at the 95th percentile, forcomparison, were 1.4 x 10⁻⁴ for exposure to playsets and decks and 8.3 x 10⁻⁵ for playsets alone. The pattern was similar at the other estimates of exposure. These baseline risks were only slightlygreater than the risks when exposure was reduced by hand washing.
Table 6-7. Cancer Risks Remaining Following Simulated Reductions from Hand Washing(Warm Climate Only)
Scenario
Arsenic (Q1*= 3.67 (mg/kg/day) -1)
Mean Median 95%ile 99%ile
Playsets and decks 3.1E-05 1.8E-05 1.0E-04 2.6E-04
Playsets only 1.3E-05 7.5E-06 4.6E-05 7.3E-05
Note: The baseline scenario includes a certain amount of hand washing. Hand washing, as a mitigation scenario, increases thefrequency of this activity over baseline. See Appendix G for more information on hand washing.
The cumulative probability function and probability density plots for the hand washingmitigation measure are shown in Figure 6-3. Cumulative percentiles and associated risks arecompared to risk levels from 10-6 to 10-4 in Table 6-8. The cumulative probability at the 10-6 risklevel was found to be at the very low end of the distribution: less than the 1st percentile forexposure to decks and playsets, and the 5th percentile for exposure to playsets alone. For thebaseline scenario, the comparative percentiles were very similar: less than the 1st percentile fordeck and playset exposure and 3rd percentile for playset only exposure.

6-15
Cancer Risk from Lifetime-Term LADD for Children Exposed to ArsenicDislodgeable Residues and Contaminated Soil from Treated Wood
Playsets and Residential Decks in Warm Climate(Reducing Exposure by Washing Hands after Playing on Deck or Playset)
Scatterplot (E11 (table 39).sta)
Cancer Risk
Cum
ulat
ive
Pro
babi
lity
Den
sity
0.0
0.1
0.2
0.3
0.4
0.5
0.6
0.7
0.8
0.9
1.0
1.0e
-8
1.0e
-7
1.0e
-6
1.0e
-5
1.0e
-4
1.0e
-3
Without Decks
With Decks
hmdeck=0hmdeck=1
Without Decks99% = 7.3x10⁻⁵
95% = 4.6x10⁻⁵
50% = 7.5x10⁻⁶
mean = 1.3x10⁻⁵
With Decks99% = 2.6x10⁻⁴
95% = 1.0x10⁻⁴
50% = 1.8x10⁻⁵
mean = 3.1x10⁻⁵
Histogram (E11 (table 39).sta) y = 747 * 0.00001 * lognorm (x, -11.8072, 1.17881)
(N for Risk > 1e-4 = 3)Cancer Risk (Truncated at 1e-4)
Pro
babi
lity
Den
sity
0%
10%
20%
30%
40%
50%
60%
70%
80%
90%
100%
0
1e-5
2e-5
3e-5
4e-5
5e-5
6e-5
7e-5
8e-5
9e-5
1e-4
Histogram (E11 (table 39).sta) y = 704 * 0.00001 * lognorm (x, -10.94873, 1.041763)
(N for Risk > 1e-4 = 36)Cancer Risk (Truncated at 1e-4)
Pro
babi
lity
Den
sity
0%
10%
20%
30%
40%
50%
60%
70%
80%
90%
100%
0
1e-5
2e-5
3e-5
4e-5
5e-5
6e-5
7e-5
8e-5
9e-5
1e-4
Without Decks With Decks
Figure 6-3
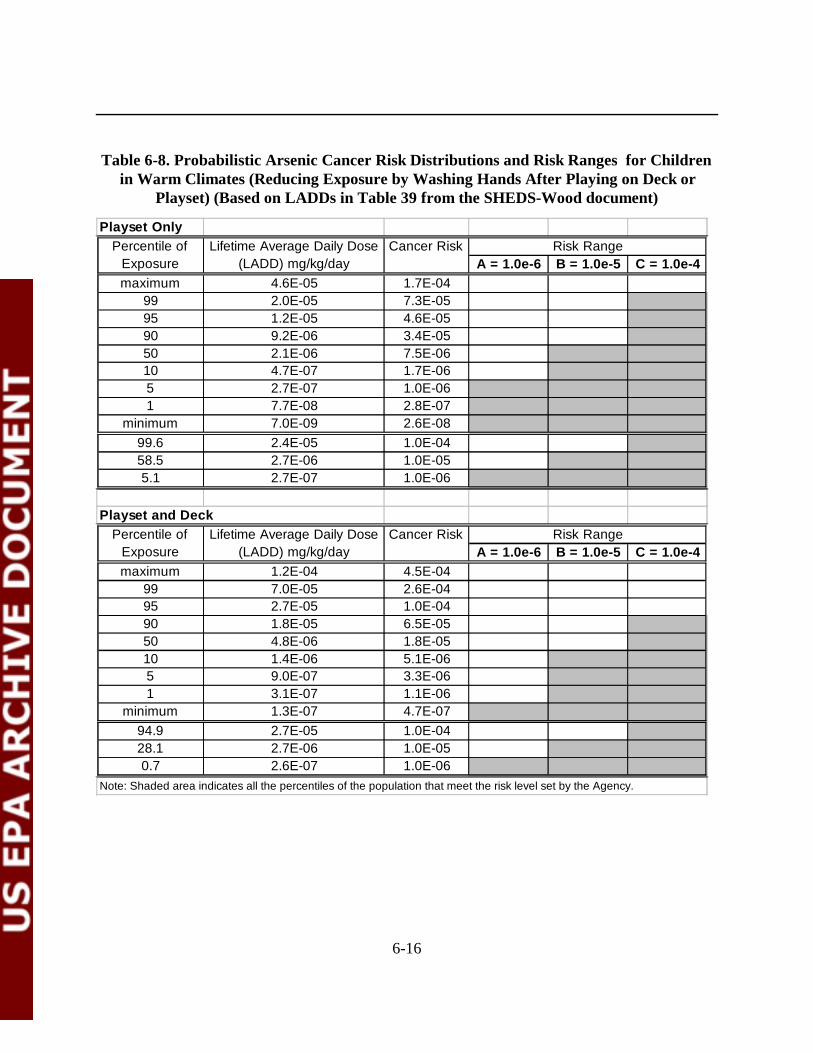
6-16
Playset Only
A = 1.0e-6 B = 1.0e-5 C = 1.0e-4maximum 4.6E-05 1.7E-04
99 2.0E-05 7.3E-0595 1.2E-05 4.6E-0590 9.2E-06 3.4E-0550 2.1E-06 7.5E-0610 4.7E-07 1.7E-065 2.7E-07 1.0E-061 7.7E-08 2.8E-07
minimum 7.0E-09 2.6E-0899.6 2.4E-05 1.0E-0458.5 2.7E-06 1.0E-055.1 2.7E-07 1.0E-06
Playset and Deck
A = 1.0e-6 B = 1.0e-5 C = 1.0e-4maximum 1.2E-04 4.5E-04
99 7.0E-05 2.6E-0495 2.7E-05 1.0E-0490 1.8E-05 6.5E-0550 4.8E-06 1.8E-0510 1.4E-06 5.1E-065 9.0E-07 3.3E-061 3.1E-07 1.1E-06
minimum 1.3E-07 4.7E-0794.9 2.7E-05 1.0E-0428.1 2.7E-06 1.0E-050.7 2.6E-07 1.0E-06
Note: Shaded area indicates all the percentiles of the population that meet the risk level set by the Agency.
Percentile of Exposure
Lifetime Average Daily Dose (LADD) mg/kg/day
Cancer Risk Risk Range
Percentile of Exposure
Lifetime Average Daily Dose (LADD) mg/kg/day
Cancer Risk Risk Range
Table 6-8. Probabilistic Arsenic Cancer Risk Distributions and Risk Ranges for Children in Warm Climates (Reducing Exposure by Washing Hands After Playing on Deck or
Playset) (Based on LADDs in Table 39 from the SHEDS-Wood document)
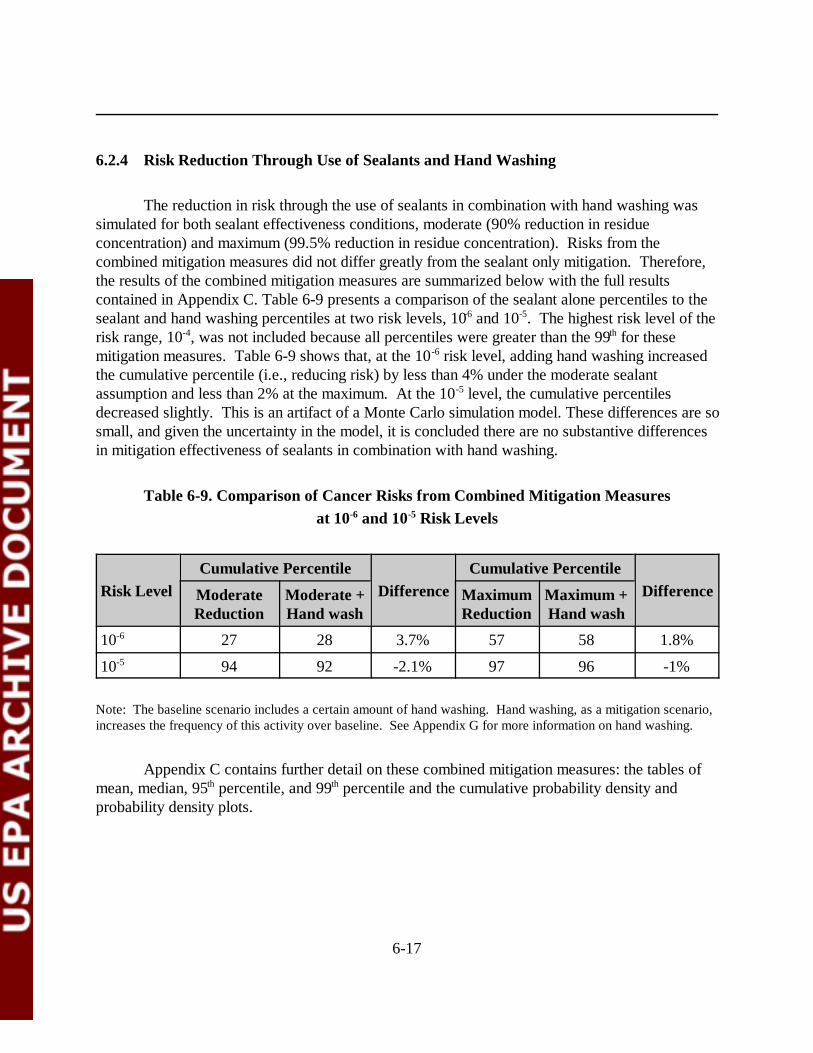
6-17
6.2.4 Risk Reduction Through Use of Sealants and Hand Washing
The reduction in risk through the use of sealants in combination with hand washing wassimulated for both sealant effectiveness conditions, moderate (90% reduction in residueconcentration) and maximum (99.5% reduction in residue concentration). Risks from thecombined mitigation measures did not differ greatly from the sealant only mitigation. Therefore,the results of the combined mitigation measures are summarized below with the full resultscontained in Appendix C. Table 6-9 presents a comparison of the sealant alone percentiles to thesealant and hand washing percentiles at two risk levels, 10-6 and 10-5. The highest risk level of therisk range, 10-4, was not included because all percentiles were greater than the 99th for thesemitigation measures. Table 6-9 shows that, at the 10-6 risk level, adding hand washing increasedthe cumulative percentile (i.e., reducing risk) by less than 4% under the moderate sealantassumption and less than 2% at the maximum. At the 10-5 level, the cumulative percentilesdecreased slightly. This is an artifact of a Monte Carlo simulation model. These differences are sosmall, and given the uncertainty in the model, it is concluded there are no substantive differencesin mitigation effectiveness of sealants in combination with hand washing.
Table 6-9. Comparison of Cancer Risks from Combined Mitigation Measures at 10-6 and 10-5 Risk Levels
Risk LevelCumulative Percentile
DifferenceCumulative Percentile
DifferenceModerateReduction
Moderate +Hand wash
MaximumReduction
Maximum +Hand wash
10-6 27 28 3.7% 57 58 1.8%
10-5 94 92 -2.1% 97 96 -1%
Note: The baseline scenario includes a certain amount of hand washing. Hand washing, as a mitigation scenario,increases the frequency of this activity over baseline. See Appendix G for more information on hand washing.
Appendix C contains further detail on these combined mitigation measures: the tables ofmean, median, 95th percentile, and 99th percentile and the cumulative probability density andprobability density plots.
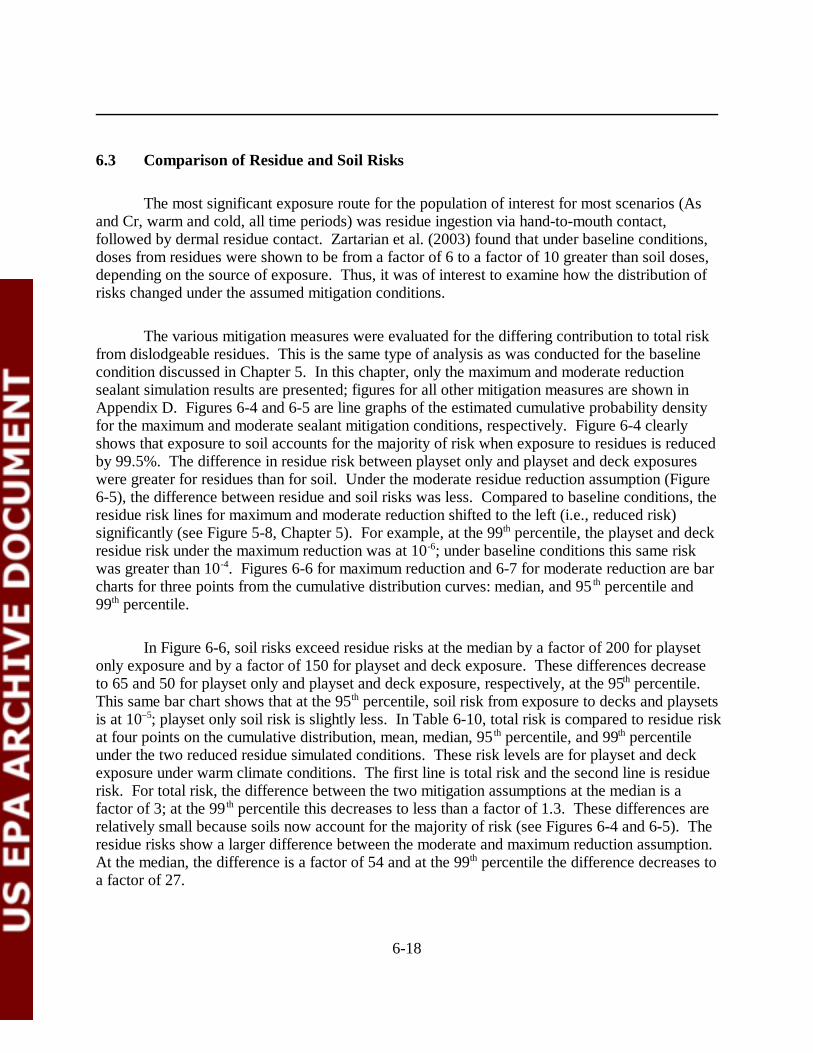
6-18
6.3 Comparison of Residue and Soil Risks
The most significant exposure route for the population of interest for most scenarios (Asand Cr, warm and cold, all time periods) was residue ingestion via hand-to-mouth contact,followed by dermal residue contact. Zartarian et al. (2003) found that under baseline conditions,doses from residues were shown to be from a factor of 6 to a factor of 10 greater than soil doses,depending on the source of exposure. Thus, it was of interest to examine how the distribution ofrisks changed under the assumed mitigation conditions.
The various mitigation measures were evaluated for the differing contribution to total riskfrom dislodgeable residues. This is the same type of analysis as was conducted for the baselinecondition discussed in Chapter 5. In this chapter, only the maximum and moderate reductionsealant simulation results are presented; figures for all other mitigation measures are shown inAppendix D. Figures 6-4 and 6-5 are line graphs of the estimated cumulative probability densityfor the maximum and moderate sealant mitigation conditions, respectively. Figure 6-4 clearlyshows that exposure to soil accounts for the majority of risk when exposure to residues is reducedby 99.5%. The difference in residue risk between playset only and playset and deck exposureswere greater for residues than for soil. Under the moderate residue reduction assumption (Figure6-5), the difference between residue and soil risks was less. Compared to baseline conditions, theresidue risk lines for maximum and moderate reduction shifted to the left (i.e., reduced risk)significantly (see Figure 5-8, Chapter 5). For example, at the 99th percentile, the playset and deckresidue risk under the maximum reduction was at 10-6; under baseline conditions this same riskwas greater than 10-4. Figures 6-6 for maximum reduction and 6-7 for moderate reduction are barcharts for three points from the cumulative distribution curves: median, and 95 th percentile and99th percentile.
In Figure 6-6, soil risks exceed residue risks at the median by a factor of 200 for playsetonly exposure and by a factor of 150 for playset and deck exposure. These differences decreaseto 65 and 50 for playset only and playset and deck exposure, respectively, at the 95th percentile. This same bar chart shows that at the 95th percentile, soil risk from exposure to decks and playsetsis at 10–5; playset only soil risk is slightly less. In Table 6-10, total risk is compared to residue riskat four points on the cumulative distribution, mean, median, 95 th percentile, and 99th percentileunder the two reduced residue simulated conditions. These risk levels are for playset and deckexposure under warm climate conditions. The first line is total risk and the second line is residuerisk. For total risk, the difference between the two mitigation assumptions at the median is afactor of 3; at the 99 th percentile this decreases to less than a factor of 1.3. These differences arerelatively small because soils now account for the majority of risk (see Figures 6-4 and 6-5). Theresidue risks show a larger difference between the moderate and maximum reduction assumption. At the median, the difference is a factor of 54 and at the 99th percentile the difference decreases toa factor of 27.
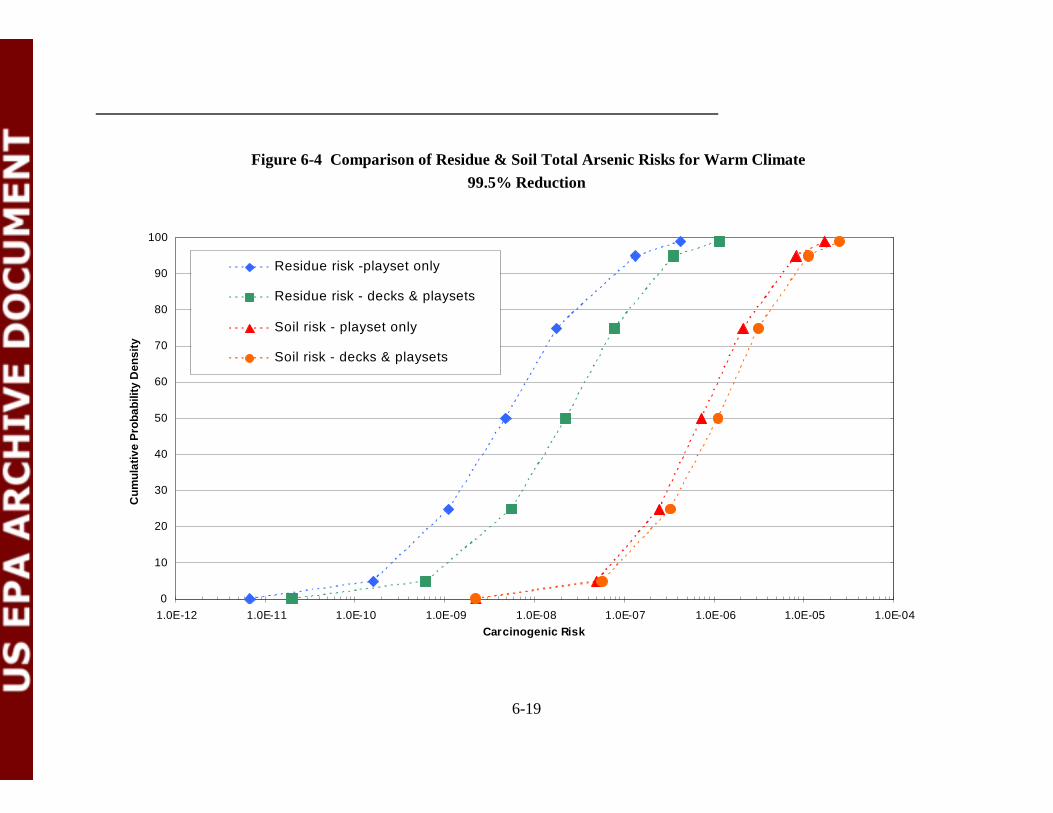
6-19
0
10
20
30
40
50
60
70
80
90
100
1.0E-12 1.0E-11 1.0E-10 1.0E-09 1.0E-08 1.0E-07 1.0E-06 1.0E-05 1.0E-04Carcinogenic Risk
Cum
ulat
ive
Pro
babi
lity
Den
sity
Residue risk -playset only
Residue risk - decks & playsets
Soil risk - playset only
Soil risk - decks & playsets
Figure 6-4 Comparison of Residue & Soil Total Arsenic Risks for Warm Climate99.5% Reduction
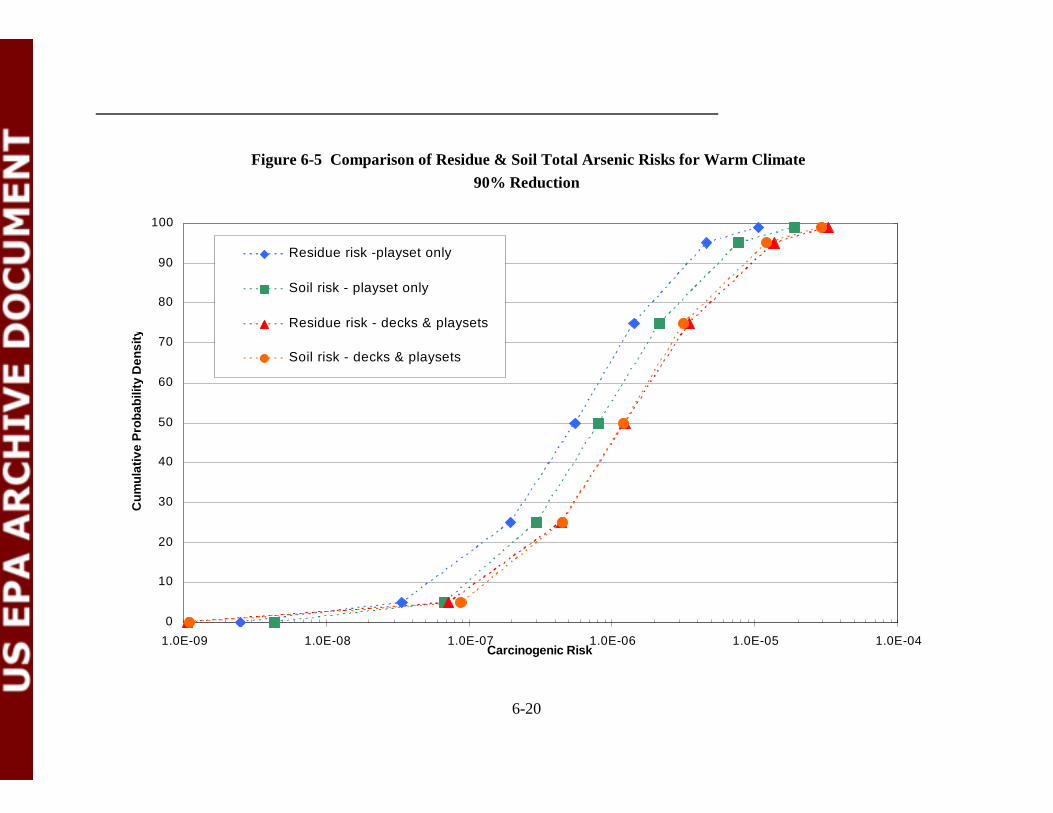
6-20
0
10
20
30
40
50
60
70
80
90
100
1.0E-09 1.0E-08 1.0E-07 1.0E-06 1.0E-05 1.0E-04Carcinogenic Risk
Cum
ulat
ive
Pro
babi
lity
Den
sity
Residue risk -playset only
Soil risk - playset only
Residue risk - decks & playsets
Soil risk - decks & playsets
Figure 6-5 Comparison of Residue & Soil Total Arsenic Risks for Warm Climate90% Reduction
6-21
1.0E-09
1.0E-08
1.0E-07
1.0E-06
1.0E-05
1.0E-04
50%ile 95%tile 99%tile
Can
cer
Ris
k
Residue risk -playset only
Soil risk - playset onlyResidue risk - decks & playsets
Soil risk - decks & playsets
Figure 6-6 Comparison of Residue and Soil Arsenic Risks for Warm Climate99.5% Reduction
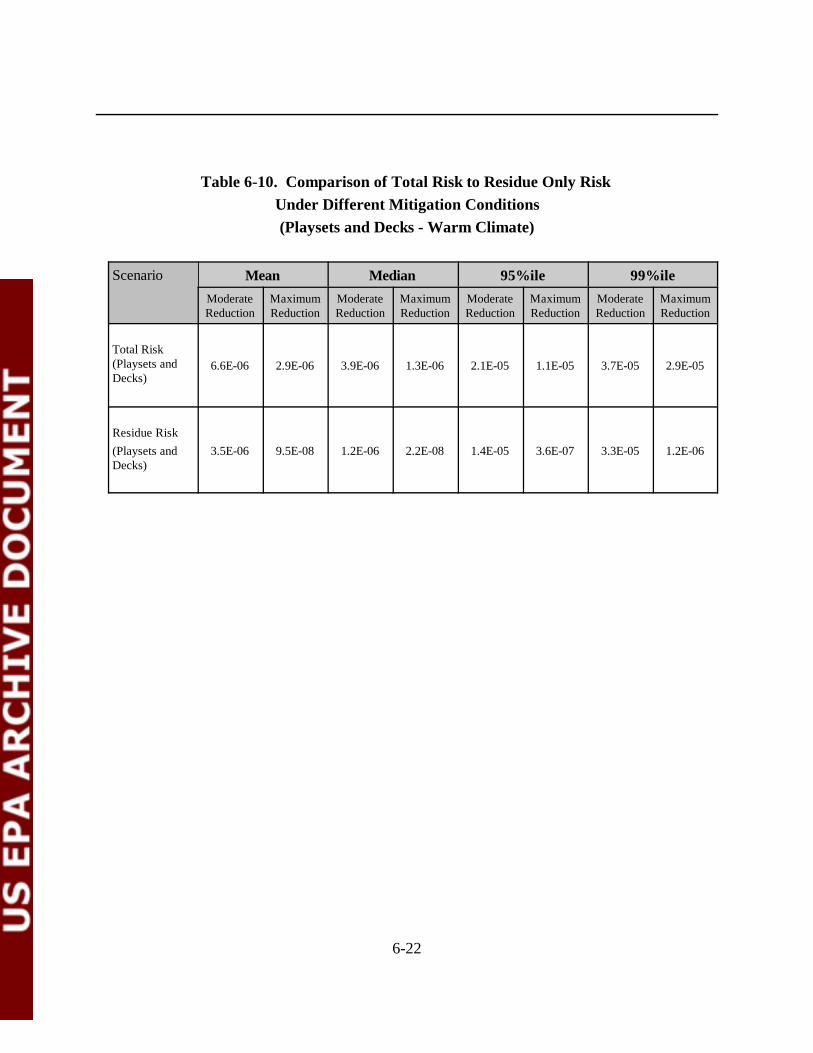
6-22
Table 6-10. Comparison of Total Risk to Residue Only Risk Under Different Mitigation Conditions(Playsets and Decks - Warm Climate)
Scenario Mean Median 95%ile 99%ileModerateReduction
MaximumReduction
ModerateReduction
MaximumReduction
ModerateReduction
MaximumReduction
ModerateReduction
MaximumReduction
Total Risk(Playsets andDecks)
6.6E-06 2.9E-06 3.9E-06 1.3E-06 2.1E-05 1.1E-05 3.7E-05 2.9E-05
Residue Risk(Playsets andDecks)
3.5E-06 9.5E-08 1.2E-06 2.2E-08 1.4E-05 3.6E-07 3.3E-05 1.2E-06
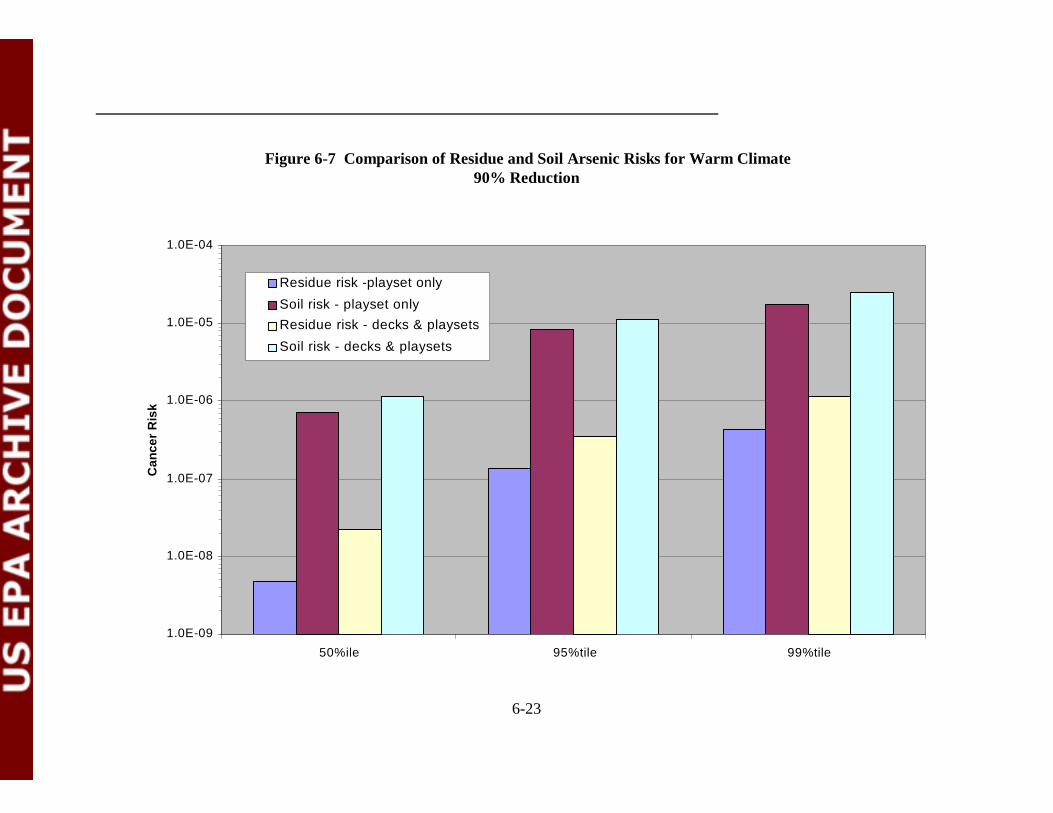
6-23
1.0E-09
1.0E-08
1.0E-07
1.0E-06
1.0E-05
1.0E-04
50%ile 95%tile 99%tile
Can
cer
Ris
k
Residue risk -playset only
Soil risk - playset onlyResidue risk - decks & playsets
Soil risk - decks & playsets
Figure 6-7 Comparison of Residue and Soil Arsenic Risks for Warm Climate90% Reduction
6-24
6.4 Summary
In this chapter, the results from five different mitigation conditions are summarized. Twoof the mitigation conditions simulated the effect of a sealant on reducing exposure to dislodgeableresidues. For moderately effective sealant conditions, residues were assumed to be reduced by90%; for maximally effective sealant conditions, residues assumed to be reduced by 99.5%. Theother type of mitigation measure simulated was hand washing. In SHEDS-Wood, simulated handwashing only was applicable to residue exposure and not to soil exposure. Hand washing wasconsidered alone and in combination with the sealant conditions. These different mitigationmeasures were evaluated for the warm climate condition only, as that has the greater exposure,and associated risk. Soil exposures were assumed to be the same as under baseline (i.e., noreduction in exposure due to the use of sealants).
In probabilistic risk assessments, risk reduction is seen as a shifting of the cumulativeprobability curve towards lower risks (i.e. to the left). Because it is difficult to discuss an entirecurve, the cumulative percentiles were compared at the 10-6 risk level. Table 6-11 presents thecumulative percentiles at the 10-6 risk level for baseline and each mitigation measure. Increase thefrequency of hand washing alone was the least effective mitigation measure. For the sealant onlymitigation condition, maximum reduction in exposure shifted the cumulative percentile to the 57 th
percentile for playsets alone and the 42nd percentile for playset and deck exposure. There was amuch similar shift for the moderate reduction measure. Hand washing combined with eithersealant mitigation simulation had a minimal effect on the cumulative percentile at the 10-6 risklevel. The differences between baseline conditions and any of the mitigation measures wasconsistently less for exposure to both playsets and decks than it was for playsets only.
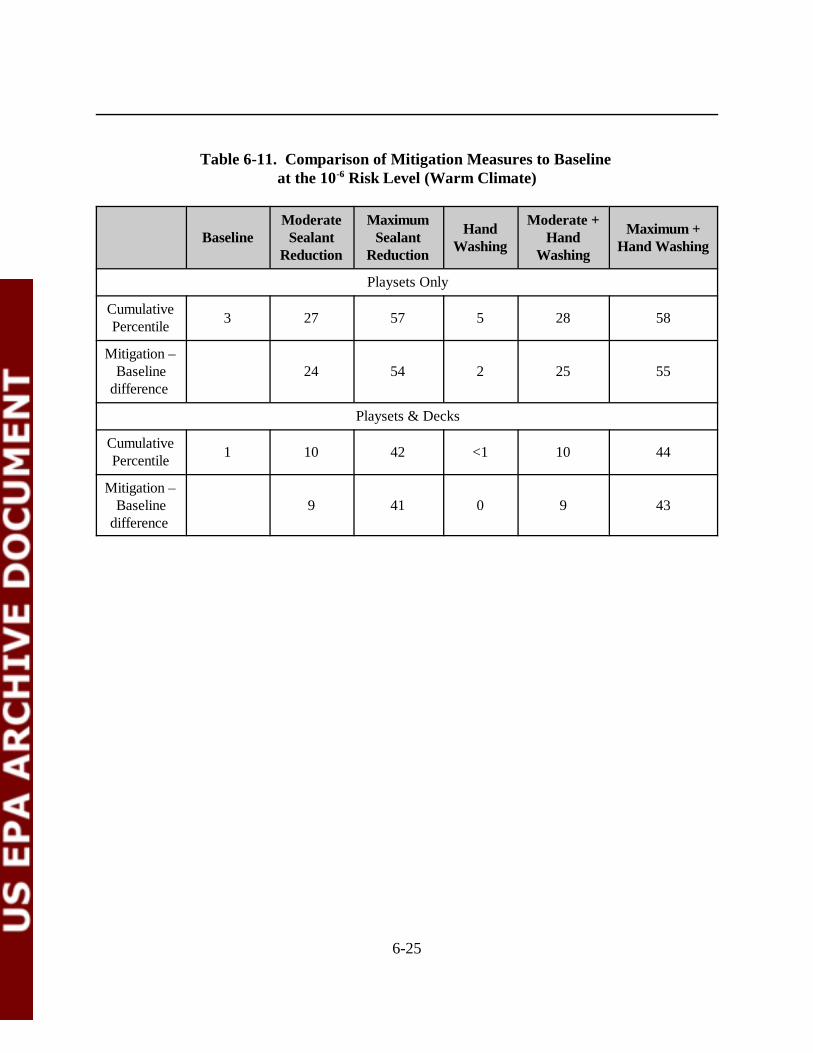
6-25
Table 6-11. Comparison of Mitigation Measures to Baseline at the 10-6 Risk Level (Warm Climate)
BaselineModerate
SealantReduction
MaximumSealant
Reduction
HandWashing
Moderate +Hand
Washing
Maximum +Hand Washing
Playsets Only
CumulativePercentile 3 27 57 5 28 58
Mitigation –Baseline
difference 24 54 2 25 55
Playsets & Decks
CumulativePercentile 1 10 42 <1 10 44
Mitigation –Baseline
difference 9 41 0 9 43
7-1
7.0 UNCERTAINTY IN THE RISK ASSESSMENT
In risk assessment, uncertainty refers to a lack of knowledge in the underlying science,while variability considers that some individuals in a population have more or less risk than othersbecause of differences in exposure, dose-response relationship or both. Uncertainties are inherentin the risk assessment process. In order to appreciate the limitation and significance of the riskestimates, it is important to have an understanding of the sources and magnitudes of theseuncertainties. Sources of uncertainty in this risk assessment, include:
• Environmental media sampling and analysis;• Chemical fate;• Toxicity data;• Exposure assessment modeling; and• Risk characterization.
Over the course of EPA’s evaluation of risks from exposure to CCA, the FIFRA SAP hasmade recommendations regarding input data and default assumptions used in risk assessment. These recommendations included criteria to evaluate the quality of data included in the modelingeffort and appropriate decisions to be made in the absence of adequate data. The SAP providedthe Agency with clear criteria to judge data quality in 1999, and these were recognized in supportdocuments provided to the panel. Under conditions of moderate or high uncertainty (absence ofsufficient data to fully capture the variability in exposure from these sources), the SAP suggestedthat the Agency should develop clear default assumptions to be employed until sufficient data aresecured. They also recommended that these assumptions should err on the side of overestimationof exposure, or factors that contribute to exposure (U.S. EPA, 2001c).
The uncertainty in a risk assessment reflects the combined uncertainty of all the inputvariables that are used to estimate an exposure dose combined with the uncertainty of thetoxicological parameters. Zartarian et al. (2003) conducted a thorough uncertainty analysis,evaluating model sensitivity and uncertainty through hundreds of iterations of the SHEDS-Woodmodel. Toxicological parameters have only been evaluated in a qualitative manner due toconstraints of time and resources. Therefore, this uncertainty analysis is considered semi-quantitative.
7.1 Environmental Media Sampling and Analysis
Analytical data for chromium and arsenic residues on CCA-treated surfaces, as used in theSHEDS-Wood model, were taken from several literature sources, as described in Zartarian et al.(2003). The variability distributions for arsenic and chromium residues and soil concentrationsare shown in Table 7 of Zartarian et al. (2003). Summaries of the sources of data used to develop
7-2
residue and soil concentrations are presented in Table 8 of Zartarian et al. (2003). Likewise, datafor arsenic and chromium residues in CCA-treated decks, as used by SHEDS-Wood to estimateexposure doses, are described in Zartarian et al. (2003). The data sets used to generate theexposure point concentrations are described in the SHEDS-Wood exposure report andsummarized in Table 12 of that report. Uncertainty in the exposure point concentration arisesfrom how accurately these various data sets characterize the soil and dislodgeable residueconcentrations in the underlying population of treated playsets and decks.
There are many significant variables that can affect the measurement of dislodgeablearsenic and chromium in CCA-treated wood surfaces and in the soil surrounding the treated woodproducts. Some of these variables include the following:
• The fraction of arsenic and chromium retained in the wood (retentions of CCAtype C in wood can range anywhere from 0.25-2.50 pounds per cubic foot (pcf)depending on the different AWPA standards;
• The type of CCA formulation used to treat the wood (CCA treatment solutions aretypically classified as either type A, B, or C since they vary in the proportion ofarsenic to chromium compounds; however, CCA type C is most commonly used totreat dimensional lumber for above-ground residential applications). Data fromtype C was most often used in the study data used in this assessment;
• The type of pressure-treated wood (e.g., Douglas fir, southern pine, western cedar,red oak, etc.) can affect leaching and/or transfer of residues;
• The end use of wood (e.g., wood decks, construction or utility poles, marinetimbers, fence posts, wood foundation lumber, plywood, and wood for playgroundstructures or decks) determines the amount of CCA used for treatment;
• The degree that the wood has been sanded can affect residue levels;• Variables in the pressure treatment process can influence the retention of CCA in
wood (e.g., temperature and pH, too short of air seasoning time, rapid removal ofwater, rapid oven drying, etc.);
• The moisture content of the wood can affect CCA content and leaching; and• The age of the CCA-treated wood can affect residue levels and leaching of CCA to
surrounding soil.
To the extent that the data sets used in SHEDS-Wood represent these variables, thenthese sources of variability are accounted for. However, it is not known how these factors aredistributed across the underlying population of decks and playsets and if they are represented inthe input data sets.
In addition to the variables mentioned above, wood finishes such as oil stain, varnish, paintor sealant (e.g., polyurethane, acrylic or spar varnish) applied to pressure-treated wood maydecrease the amounts of dislodgeable residues in CCA pressure-treated wood surfaces. For
7-3
mitigation, this study assumed that sealants can reduce overall residue concentration by 90% and99.5%. This assumption is based on the results of various studies listed in Chapter 6.0. Thefollowing uncertainties regarding coatings should be considered.
• The weight-of-evidence from available studies indicates that certain coatings cansubstantially reduce dislodgeable and leachable CCA chemicals;
• Reductions of 70 to 95% in dislodgeable arsenic were seen in all studies thatsubjected CCA wood to natural weathering;
• There is no evidence that water repellents added directly to the CCA treatmentsolution are effective in reducing leachable/dislodgeable CCA chemicals;
• Current data are not adequate for identifying a particular coating as being clearlysuperior or inferior to reducing leachable/dislodgeable CCA chemicals; and
• Confidence is highest for polyurethane as this coating has been shown to result insubstantial 70 to >95% reduction in dislodgeable arsenic in a well controlled fieldstudy, a “real-world” application allowing for effects of use, and a short-termcontrolled laboratory study.
There is considerable uncertainty regarding the representativeness of the assumedexposure reduction based on the use of sealants. The assumed reductions were selected toevaluate different mitigation control measures. They are reasonable scientific judgements;however, they are not based on a study that would allow extrapolation to the underlyingpopulation of decks and playsets implied in this study. Therefore, there is higher uncertaintyassociated with the dislodgeable residue exposure point concentrations for the mitigationscenarios than with the residue exposure point concentrations used in the baseline risk assessment.
7.2 Chemical Fate
Conservative assumptions were made regarding the fate of arsenic and chromium in theenvironment. For arsenic, it was assumed that concentrations are relatively persistent andimmobile. Thus, individuals were assumed to be exposed to the same concentration for the entireduration of exposure (i.e., 6 years). For chromium, all studies used to develop the probabilitydensity functions for exposure point concentrations reported total chromium, Cr(III) and Cr(VI).There was concern that assessing chromium(total) doses would overestimate the exposure. Therefore, an attempt was made to determine the speciation of chromium in soil. One study (RTIInternational, 2003) analyzed Cr(VI) concentrations for a limited subset of samples. All of thesesamples were below the detection limit of the method. Due to the lack of data on Cr(VI), theAgency decided to make a conservative assumption about speciation in soil. OPP adjusted theADDs by multiplying by 0.10 (10%) to approximate Cr(VI) speciation. This conservativeassumption most likely overestimates exposure to Cr(VI). This overestimation means thatuncertainties around the Cr(VI) values are asymmetrical; the probability that concentrations arelower is much greater than the probability that concentrations are higher.

7-4
Migration, dispersion, dilution, retardation, degradation, and other attenuation ortransformation processes may occur over time that could change the chemical concentrations inresidues or soil. It has been conservatively assumed that the concentrations of arsenic arerelatively persistent and immobile in both media. With reference to soil, this is an important factorto consider when evaluating the mitigation measures presented in Chapter 6.0. In calculating theexposure doses for these mitigation conditions, SHEDS-Wood used the same soil inputdistributions as were used for the baseline condition; only exposure to residue concentrationswere reduced. Conceptually, a sealant would limit the migration of CCA to surrounding soils,however, there are no data available describing the change in soil concentrations due to the use ofsealants. Thus, the approach to estimating overall risk to surrounding soils may be conservative(i.e., risks are overestimated).
7.3 Toxicity Data
Varying degrees of uncertainty surround the assessment of adverse health effects inpotentially exposed populations to arsenic. Some sources of uncertainty for toxic effects inhumans may include:
• Extrapolating from a LOAEL to a NOAEL;• Extrapolation of data due to intraspecies variation; and• Extrapolation of epidemiological data from adult populations to children.
In general, cancer risk is a conservative estimate of the risk because the cancer slopefactor is characterized as a upper-bound estimate. Therefore, the true risks to humans, while notidentifiable, may likely not exceed the upper-bound estimates and in fact may be lower.
For inorganic arsenic, in this assessment, the slope factor used was 3.67 (mg/kg/day)-1.This is the mean slope factor derived from the higher risk approach for both lung and bladdercancers. This slope factor was used by the EPA s Office of Water when it established the MCLfor arsenic in drinking water (US EPA, 2001e). In 2001, NRC published an update to the 1999NRC report and made some specific recommendations with respect to the EPA’s Office of Watercancer risk estimate.
The Agency is currently considering NRC’s recommendations and their potential impacton the cancer potency estimate. Based on the Agency’s considerations of theserecommendations, the current proposed cancer potency number may change in the final version ofthis risk assessment. The slope factor published by EPA’s Integrated Risk Information System(IRIS), 1.5 (mg/kg/day) -1 is also being revisited in FY2003 due to the recommendation by theNRC in 2001. The uncertainties in the hazard assessment are discussed in detail in Appendix A.
7-5
For noncancer effects, OPP assessed exposure using the MOE approach. This approachshows how many times the NOAEL or LOAEL exceed the predicted exposure. The MOE is aratio of the LOAEL or NOAEL to the predicted exposure, thus, the uncertainties derive from thetoxicity value and the manner in which exposure is estimated. Several conservative assumptionsare considered in setting the acceptable amount by which the predicted exposure should exceedthe LOAEL or NOAEL. Given the conservative assumptions used to generate the LOAEL andNOAEL, it is likely that the total uncertainty of the MOE is assymetrical. There is a greaterprobability that the true MOE is higher, and a lesser probability that the true MOE is lower.
7.4 Exposure Assessment
Exposure assessment is perhaps the most critical step in achieving a reliable estimate ofhealth risks to humans. Little direct data exist to measure arsenic and chromium exposure inchildren. The exposure estimates used in this assessment were based on absorbed dosescalculated by the SHEDS-Wood model (see Zartarian et al., 2003). This model predictedexposure and dose to arsenic and chromium using age and gender time-location-activity diariesfor children 1-6 years old. All the data from SHEDS-Wood have been either recommended fromthe SAP or from the survey of studies in the EPA’s Exposure Factor’s Handbook (US EPA,1997b). This information is used by several Agencies to estimate children’s exposure durations atoutdoor playsets and decks.
The SHEDS-Wood results showed that the significant exposure routes, in order ofdescending importance, were: residue ingestion via hand-to-mouth contact, dermal residuecontact, soil ingestion, and dermal soil contact. The variability and uncertainty in the ADDs andLADDs from SHEDS-Wood were evaluated. Sensitivity of the model to the various inputparameters was also evaluated. The following discussion summarizes these results; the full textcan be found in Zartarian et al. (2003) (see Section 5).
Variability: Generally, there were several orders of magnitude difference in absorbed dosebetween the low end and high end percentiles for the various population estimates. Thiswas due to differences in activity patterns, soil and residue concentrations, and exposurefactors.Uncertainty: Uncertainty was modeled using a non-parametric bootstrap approach forADDs. The estimated uncertainty was indicated by a factor of 3 at the median and 4 atthe 95th percentile.Sensitivity: The most critical input variables to the model results were: wood surfaceresidue-to-skin transfer efficiency, deck wood surface residue concentration, fraction ofhand surface area mouthed, and hand washing events per day.
The estimated uncertainty of a factor of 3 to 4 appeared to be approximately symmetricalaround the predicted absorbed dose.

7-6
7.5 Risk Characterization
There are various sources of uncertainty in each step of the risk assessment process. Inthe final estimate of risk, the uncertainty in the toxicity value is combined with the uncertainty inthe absorbed dose estimate. This combined uncertainty is greater than the uncertainty in theexposure estimate, however, the question is - how much greater? This is not a simple question toanswer. It is beyond the scope of this risk assessment to address that question in a quantitativemanner. Thus, it is addressed in conceptual manner. Further limitations of this discussion are thatit applies to the carcinogenic risk from exposure to arsenic, as that is the most critical and it ismore appropriate to the baseline risk results (Chapter 5.0) and less so the mitigation risks(Chapter 6.0). (This is due to the lack of any information on the uncertainty of the assumedeffectiveness of the mitigation measures.)
Uncertainty can be considered a cloud surrounding a value. If risks are presented as aCDF, then there is a cloud surrounding the entire curve. The shape of this cloud is determined bythe uncertainty of the input variables and how these uncertainties are combined mathematically. There are standard approaches for estimating the combined uncertainty for the simple case of twoinput variables where the uncertainty of each has been quantified and it is symmetrical around thea central value of the variable. More sophisticated approaches are required when either of theuncertainties are asymmetrical.
In this risk assessment, only the uncertainty in the absorbed dose was characterized; theuncertainties in the toxicity values were not characterized. To generate an uncertainty estimate forthe risk characterization, similar to the absorbed dose uncertainty estimate, would require: (1)knowledge of the uncertainty in the slope factor and NOAEL/LOAEL, and (2) running a MonteCarlo simulation to calculate risk that included a distribution function for the slope factor. Thus,the uncertainty of the risk characterization step can not be quantified.
What is known about the uncertainty around the input variables is very different. Theslope factor in this assessment is not a mean value. It is at the high end of the distribution, basedon the various conservative factors that are included in the formulation of the final value (e.g., lowdose extrapolation and extrapolation from adults to children). Therefore, the “uncertainty cloud”around the slope factor is asymmetrical. How asymmetrical is not known; however, it is likelythat the vast majority of the cloud is below the slope factor value and very little is above it. Bycontrast, uncertainty in the absorbed dose estimate appears to be symmetrical based on theanalysis presented in the SHEDS-Wood report (Zartarian et al., 2003).
The uncertainty in the risk estimate is a combination of the symmetrical uncertainty in theabsorbed dose and the asymmetrical uncertainty in the slope factor. It is beyond the scope of thisassessment to mathematically combine those uncertainties. However, a relative estimate of theshape and location of the uncertainty cloud is possible. The first order estimate is based on the

7-7
absorbed dose uncertainty. Combining the slope factor uncertainty would increase the size(dispersion) of the cloud and shift it so that it was asymmetrical around the risk estimate (i.e., more of the cloud is below the risk estimate than above it).
Therefore, it is concluded that the arsenic carcinogenic risk, (especially under the assumedmitigation measures) are conservative estimates of risk. The Cr(VI) noncancer MOEs are alsoconsidered to be conservative (i.e., MOEs are most likely higher) due to the assumption that 10%of total chromium was assumed to be present as Cr(VI). The noncancer arsenic MOEs are alsoconsidered to be conservative estimates, given the assumptions for the LOAEL.
8-1
8.0 REFERENCES*
ACC, 2002. Assessment of Potential Inhalation and Dermal Exposure Associated with PressureTreatment of Wood with Arsenical Products. MRID 455021-01.
ACC, 2003a. CCA Workgroup, Relative Bioavailability of Dislodgeable Arsenic from CCA-Treated Wood, Prepared by Veterinary Medical Diagnostic Laboratory Medicine. University ofMissouri, Syracuse Research Corporation, Denver, Colorado.
ACC, 2003b. CCA Workgroup, Relative Bioavailability of Arsenic in Soil Affected by CCA-Treated Wood. Prepared by Veterinary Medical Diagnostic Laboratory College of VeterinaryMedicine. University of Missouri, Syracuse Research Corporation, Denver, Colorado.
APVMA, 2003. Arsenic Timber Treatments (CCA and Arsenic Trioxide) Review ScopeDocument. March, 2003. http://www.apvma.gov.au/chemrev/arsenic_scope.pdfAccessed September 17, 2003.
AWPA, 1998. Book of Standards. P5-P98 Standard for Waterbourne Preservatives.
CDHS, 1987. Condensed Report to the Legislature: Evaluation of Hazards Posed By the Use ofWood Preservatives on Playground Equipment. State of California. Office of EnvironmentalHealth Hazard Assessment, Department of Health Services, Health and Welfare Agency.
Cooper, P. and Y.T. Ung 1997. Effect of water repellents on leaching of CCA from treated fenceand deck units. An update presented at the 28th Annual Meeting of the International ResearchGroup on Wood.
CPSC, 1990. Estimation of Hand-to-Mouth Activity by Children Based on Soil Ingestion forDislodgeable Arsenic Exposure Assessment. Memorandum from B. Lee to E.A. Tyrell.
CPSC, 2003a. Briefing Package. Petition to Ban Chromated Copper Arsenate (CCA)-TreatedWood in Playground Equipment (Petition HP 01-3). February 2003.
CPSC, 2003b. Briefing Package. Staff Recommendation to Ban Use of Chromated CopperArsenate (CCA)-Treated Wood in Playground Equipment (Petition HP 01-3) October 2003.
Cooper, P.A., 2003. CCA Fixation and its Implications on Availability of Hexavalent Chromium(Cr VI) for Dislodgeability and Leaching. Prepared for the American Chemistry CouncilArsenicals Wood Preservative Task Force. August 20, 2003.
8-2
DeGroot, R.C., T.W. Popham, L.R. Gjovik, and T. Forehand, 1979. Distribution Gradients ofArsenic, Copper, and Chromium Around Preservative-treated Wooden Stakes. J. Environ. Qual.,8(1):39-41.
Edgecomb, M, 2003. Bangor News. Legislators Ban Lumber Treated With Arsenic. June 4,2003. http://www.bangornews.com/editorialnews/article.cfm/ID/402406/cfid/9206765/cftoken/3105964Accessed September 17, 2003.
EMRA, 2003a. Report on Copper, Chromium and Arsenic (CCA) Treated Timber. Reportprepared by Deborah Read, Public Health Physician, EMRA. April. ISBN 0-478-21521-5.
EMRA, 2003b. Copper Chromium Arsenic (CCA) Treatment of Timber. Report from theEnvironmental Risk Management Authority. Niel Walter, Chair. May.
Environmental Health Perspectives, 2001. Volume 109, Number 6, June 2001. http:\\Ehpnet1.niehs.nih.gov/docs/2001/109-6/focus.pdf. Accessed September 18, 2003.
Franzblau, A. and Lilis, R., 1989. Acute Arsenic Intoxication from Environmental ArsenicExposure. Archives of Envir. Health 44(6). 385-390.
Ginsberg, G., 2003. Assessing Cancer Risks from Short-term Exposures in Children. RiskAnalysis, Vol 23, No. 1. Society for Risk Analysis.
Healthy Schools Network, 2003. The Guide to Playgrounds and Arsenic Wood. Undatedhttp://www.healthyschools.or/documents/CCA_Guide.pdfAccessed September 15, 2003.
Hopenhayn,C.; Ferreccio, C.; Browning, S.R.; Huang, B. Peralta, C.; Gibb, H.; and Hertz-Picciotto, I. 2003. Arsenic Exposure from Drinking Water and Birth Weight. Epidemiology. 14:593-602.
Kartal, S. and Lebow, S., 2000. Effect of Compression Wood on Leaching of Chromium, Copper,and Arsenic From CCA-C Treated Red Pine (Pinus resinosa Ait.) USDA Forest Service, ForestProducts Laboratory, Madison, WI, USA.

8-3
Lebow, S., 1996. Leaching of Wood Preservative Components and their Mobility in theEnvironment- Summary of Pertinent Literature. Gen. Tech. Rep. FPL-GTR-93. Madison,WI: U.S. Department of Agriculture, Forest Service, Forest Products Laboratory, 36 p.
McMahon and Chen, 2003. Hazard Identification and Toxicology Endpoint Selection forInorganic Arsenic and Inorganic Chromium. Prepared by the Office of Pesticide ProgramsAntimicrobial Division. Draft Version, November 4, 2003.
Mizuta, N, Mizuta, et al., 1956. An Outbreak of Acute Arsenic Poisoning Caused by Arsenic-Containing Soy-Sauce (Shoyu). A Clinical Report of 220 Cases. Bull Yamaguchi MedSch 4(2-3):131-149.
Nico, P., Fendorf, S., Lownery, Y., Holm, S. and Ruby, M., 2003. Chemical Structure of Arsenicand Chromium in CCA-Treated Wood: Implications of Environmental Weathering. Draft VersionAugust 2003, Unpublished.
NRC (National Research Council), 2001. Arsenic in Drinking Water. 2001 update. NationalAcademy Press, Washington, D.C.
NRC (National Research Council), 1999. Arsenic in Drinking Water. National Academy Press,Washington, D.C.
Osmose, 2000. Metal Removal from CCA-treated Lumber Under Simulated Normal UseConditions. Osmose Research Division. Osmose Wood Preserving Company. Buffalo, NewYork.
Our Stolen Future, 2003. Arsenic Treated Wood Banned in Maine. June 4, 2003.http://www.ourstolenfuture.org/Commentary/News/2003/2003-0604-BDN-arsenicban.htm.Accessed September 15, 2003.
Personal Communication, 2003. Email from Cathy Campbell, PMRA to Winston Dang, U.S.EPA.9/16/2003. Re: Canada’s Action on CCA.
PMRA, 2003. Re-evaluation Note- Chormated Copper Arsenate (CCA). April 3, 2002.http://www.hc-sc.gc.ca/pmra-arla/english/pdf/rev/rev2002-030e.pdfAccessed on September 17, 2003.
Riedel, D., D. Galarneau, J. Harrison, D.C. Gregoire and N. Bertrand. February, 1991. Residues of Arsenic, Chromium and Copper On and Near Playground Structures Built of WoodPressure-treated with CCA Type Preservatives. Health and Welfare Canada. (Unpublished).
8-4
RTI International, 2003. Assessment of Exposure to Metals in CCA-Preserved Wood: FullStudy. Prepared for American Chemistry Council CCA Task Force. Prepared by RTIInternational. Research Triangle Park, North Carolina. June 20, 2003. (This reference is same asACC 2003a in SHEDS-Wood document)
Spease, 2002. CA Playground Safety Regulation. July 13, 2002. http://www.spease.com/Wood%20Preservatives.html. Accessed September 15, 2003.
Stilwell, DE and Gorny, KD, 1997. Contamination of Soil with Copper, Chromium, and ArsenicUnder Decks Built from Pressure Treated Wood. Bulletin of Environmental Contamination andToxicology 58:22-29. Springer Verlag New York, Inc.
Stilwell, D., 1998. Arsenic From CCA-treated Wood Can be Reduced by Coating. Frontiers ofPlant Science 51(1):6-8.
Townsend, T.G., K. Stook, T.M. Tolaymat, J.K. Song, H. Solo-Gabriele, N. Hosein, and B.Khan, 2001. New lines of CCA-treated wood research: In-service and disposal issues - FinalTechnical Report #00-12. Submitted to the Florida Center for Solid and Hazardous Waste,Gainesville, Florida.
Tyl, R.W., Marr, M., and Meyers, C.B., 1991. Developmental Toxicity Evaluation of ChromicAcid Administered by Gavage to New Zealand White Rabbits. Research Triangle Institute,Reserch Triangle Park, NC Study No. 60C-4808-30/40. Unpublished.
U.S. EPA, 2003a. Draft Final Guidelines for Carcinogenic Risk Assessment. Risk AssessmentForum. National Center for Environmental Assessment. Washington D.C. EPA/630/P-03/001A.
U.S. EPA, 2003b. Supplemental Guidance for Assessing Cancer Susceptibility from Early-LifeExposure to Carcinogens. Risk Assessment Forum. National Center for EnvironmentalAssessment. Washington D.C. EPA/630/R-03/003.
U.S. EPA, 2001a. An Evaluation of the Non-Dietary Exposures and Risks to Children fromContact with CCA-Treated Wood Playground Structures and CCA-Contaminated Soil (InternalDraft Only). Prepared by the Office of Pesticide Programs Antimicrobial Division. Internal DraftVersion, May 30, 2001.
U.S. EPA, 2001b. Children’s Exposure to CCA-Treated Wood Playground Equipment and CCA-Contaminated Soil (Final Report to SAP 9/27/01). Prepared by the Office of Pesticide ProgramsAntimicrobial Division. Draft Version, September 27, 2001.

8-5
U.S. EPA, 2001c. Memorandum: Transmittal of the Final Report for the FIFRA ScientificAdvisory Panel (SAP) Meeting Held October 23-25, 2001. From Olga Odiott and Larry Dorsey,Office of Science Coordination and Policy to Marcia Mulkey, Director Office of PesticidePrograms. October 25, 2001.
U.S. EPA, 2001d. Process for Conducting Probabilistic Risk Assessment. Risk AssessmentGuidance for Superfund. Volume 3. Part A. December 31, 2001.
U.S. EPA, 2001e. National Primary Drinking Water Regulations: Arsenic and Clarifications toCompliance and New Source Contaminants Monitoring; Final Rule. 40CFR Parts 9, 141, and142. EPA-815-Z-01-001.
U.S. EPA, 1990. National Oil and Hazardous Substances Pollution Contingency Plan. FinalRule. 40 CFR 300: 55 Federal Register, 8666-8865, March 8.
U.S. EPA, 1998a. Guidance for Submission of Probabilistic Exposure Assessments to the Officeof Pesticide Programs' Health Effects Division. Prepared by the Office of Pesticide ProgramsHealth Effects Division. Draft Version, February 6, 1998.
U.S. EPA 1998b. IRIS, Chromium (VI), 1998; CASRN 18540-29-9, September 3, 1998.
U.S. EPA, 1997a. Policy for Use of Probabilistic Analysis in Risk Assessment. Prepared by theScience Policy Council. http://epa.gov/esp/osp/spc/probpd.htm.
U.S. EPA, 1997b. Exposure Factors Handbook. Volume I. Prepared by the Office of Researchand Development. Washington D.C., 20460. EPA/600/P-95/002Fa.
Waalkes, M.P.; Ward, J.M.; Liu, J. and Diwan, B.A. 2003. Transplacental carcinogenicity ofinorganic arsenic in the drinking water: induction of hepatic, ovarian, pulmonary, and adrenaltumors in mice. Toxicology and Applied Pharmacology: 186:7-17
Wester, R.C., Hui, X., Barbadillo, S., Maibach, MI., Lowney, Y.W., Schoof, R.A., Holm, S.E.,and Ruby, M.V., 2003. In Vivo Percutaneous Absorption of Arsenic from Water and CCA-treated Wood Residue Draft. August 2003.
Wester, R.C., Maibach, H.I., Sedik, L. Melendres, J., and Wader, M., 1993. In Vivo and in VitroPercutaneous Absorption and Skin Decontamination of Arsenic From Water and Soil.Fundamental and Applied Toxicology 20:336-340
8-6
Waalkes, M.P.; Ward, J.M.; Liu, J. and Diwan, B.A. 2003. Transplacental carcinogenicity ofinorganic arsenic in the drinking water: induction of hepatic, ovarian, pulmonary, and adrenaltumors in mice. Toxicology and Applied Pharmacology: 186:7-17
Zartarian, V.G., Xue, J., Özkaynak, H., Dang, W., Glen, G. and Stallings C., 2003. AProbabilistic Exposure Assessment for Children Who Contact CCA-Treated Playsets and DecksUsing the Stochastic Human Exposure and Dose Simulation Model for the Wood PreservativeExposure Scenario (SHEDS-Wood). Prepared by Office of Research and Development, NationalExposure Research Laboratory and Office of Pesticide Programs, Antimicrobial Division. DraftReport September 25, 2003.
*Additional references used to develop exposures and toxicity can be found in Zartarian et al.(2003) and Appendix A, respectively.
APPENDICES
A Probabilistic Exposure and Risk Assessment for Children WhoContact CCA-Treated Playsets and Decks
Draft Final Report
November 10, 2003
Prepared by
U. S. Environmental Protection AgencyOffice of Pesticide Programs, Antimicrobials Division
and Office of Research and Development
National Exposure Research Laboratory
DISCLAIMERThis report has undergone internal EPA review through the Office of Research and Development (ORD) and theOffice of Pesticide Programs (OPP). It is currently undergoing additional external review through OPP. Thus, thisreport should not be considered final until it has been submitted to OPP's Scientific Advisory Panel. Some of thestatutory provisions described in this report contain legally binding requirements. However, this report does notsubstitute for those provisions or regulations, nor is it regulation itself. Any decisions regarding a particular riskreduction process and remedy selection decision will be made based on the statute and regulation, and EPAdecision makers retain the discretion to adopt approaches on a case-by-case basis.
Appendix A
Hazard Identification and Toxicology Endpoint Selection forInorganic Arsenic and Inorganic Chromium
November 10, 2003
1
Hazard Identification and Toxicology Endpoint Selection forInorganic Arsenic and Inorganic Chromium
November 10, 2003
Timothy F. McMahon, Ph.D. and Jonathan Chen, Ph.D.U.S. Environmental Protection Agency
Office of Pesticide ProgramsAntimicrobials Division
2
TABLE OF CONTENTS
0.0 INTRODUCTION . . . . . . . . . . . . . . . . . . . . . . . . . . . . . . . . . . . . . . . . . . . . . . . . . . . .. 3
1.0 HAZARD CHARACTERIZATION . . . . . . . . . . . . . . . . . . . . . . . . . . . . . . . . . . . . . .. 41.1 Hazard Characterization - Arsenic . . . . . . . . . . . . . . . . . . . . . . . . . . . . . . . . . .. 4
1.1.1 Acute Toxicity . . . . . . . . . . . . . . . . . . . . . . . . . . . . . . . . . . . . . . . . . . . . .. 41.1.2 Non-Acute Toxicity . . . . . . . . . . . . . . . . . . . . . . . . . . . . . . . . . . . . . . .. 51.1.3 Metabolism . . . . . . . . . . . . . . . . . . . . . . . . . . . . . . . . . . . . . . . . . . . . . .. 9
1.2 Hazard Characterization - Chromiu m . . . . . . . . . . . . . . . . . . . . . . . . . . . . . . . . 101.2.1 Acute Toxicity . . . . . . . . . . . . . . . . . . . . . . . . . . . . . . . . . . . . . . . . . . . .. 111.2.2 Non-Acute Toxicity . . . . . . . . . . . . . . . . . . . . . . . . . . . . . . . . . . . . . .. 131.2.3 Metabolism . . . . . . . . . . . . . . . . . . . . . . . . . . . . . . . . . . . . . . . . . . . . .. 19
2.0 DOSE-RESPONSE ASSESSMENT . . . . . . . . . . . . . . . . . . . . . . . . . . . . . . . . . . . . .. 202.1 Inorganic Arsenic-Endpoint Selectio n . . . . . . . . . . . . . . . . . . . . . . . . . . . . . . .. 22
2.1.1 Acute Reference Dose (RfD) . . . . . . . . . . . . . . . . . . . . . . . . . . . . . . .. 222.1.2 Chronic Reference Dose (RfD) . . . . . . . . . . . . . . . . . . . . . . . . . . . . . .. 222.1.3 Short (1-30 days ) and Intermediate (30-180 days) Incidental Oral
Exposure. . . . . . . . . . . . . . . . . . . . . . . . . . . . . . . . . . . . . . . . . . . . . . . . . . . . . .. 24
2.1.4 Dermal Absorption . . . . . . . . . . . . . . . . . . . . . . . . . . . . . . . . . . . . . . .. 242.1.5 Short (1-30 days ) and Intermediate (30-180 days) Dermal Exposure
. . . . . . . . . . . . . . . . . . . . . . . . . . . . . . . . . . . . . . . . . . . . . . . . . . . . . .. 252.1.6 Long-Term Dermal Exposure . . . . . . . . . . . . . . . . . . . . . . . . . . . . . . .. 252.1.7 Short-, Intermediate-, and Long-term Inhalation Exposure
. . . . . . . . . . . . . . . . . . . . . . . . . . . . . . . . . . . . . . . . . . . . . . . . . . . . . .. 252.1.8 Carcinogenicity . . . . . . . . . . . . . . . . . . . . . . . . . . . . . . . . . . . . . . . . .. 26
2.2 Inorganic Chromium Endpoint Selection . . . . . . . . . . . . . . . . . . . . . . . . . . . . . . . . . . . . . . . . . . . . . . . . . . . . . . . . . . .. 31
2.2.1 Acute Reference Dose (RfD) . . . . . . . . . . . . . . . . . . . . . . . . . . . . . . .. 312.2.2 Chronic Reference Dose (RfD) . . . . . . . . . . . . . . . . . . . . . . . . . . . . . .. 312.2.3 Short-Term (1-30 days) and Intemediate-Term (30-180 days) Incidental
Oral Exposure . . . . . . . . . . . . . . . . . . . . . . . . . . . . . . . . . . . . . . . . . . . . . . . . . . . . . .. 31
2.2.4 Dermal Absorption . . . . . . . . . . . . . . . . . . . . . . . . . . . . . . . . . . . . . . .. 322.2.5 Short-, Intermediate-, and Long- term Dermal Exposure
. . . . . . . . . . . . . . . . . . . . . . . . . . . . . . . . . . . . . . . . . . . . . . . . . . . . . .. 332.2.6 Inhalation Exposure (all durations) . . . . . . . . . . . . . . . . . . . . . . . . . . .. 332.2.7 Carcinogenicity . . . . . . . . . . . . . . . . . . . . . . . . . . . . . . . . . . . . . . . . . .. 34
3.0 REFERENCES . . . . . . . . . . . . . . . . . . . . . . . . . . . . . . . . . . . . . . . . . . . . . . . . . . . . .. 36
3
0.0 INTRODUCTION
The Agency has become aware in recent years of concerns raised by the public regarding thepotential hazards associated with the continued use of CCA-treated lumber, especially the use ofthis material in playground equipment to which infants and children may be exposed throughdirect dermal contact with the treated wood and/or soil around the treated wood structure, orthrough oral ingestion of chemical residue from touching of wood and/or soil and subsequenthand-to-mouth behaviors. As a result of these concerns, the Agency has embarked upon a processto assess the exposures and risks associated with the current uses of CCA-treated lumber,including exposures and risks associated with use of this wood in playground structures. In anysuch assessment, the toxicity of the pesticide chemical must first be adequately described, eitherthrough submission of guideline toxicology studies that are reviewed by the Agency, or throughcitation of scientific studies in the peer-reviewed literature. For the present assessment, theAgency recognizes that inorganic arsenic and inorganic chromium are the compounds oftoxicological concern with respect to exposure to CCA-treated wood. The following sectionscharacterize the hazards of inorganic arsenic and inorganic chromium. Information wassummarized from submitted toxicology studies, the open scientific literature, and from publisheddocuments by the USEPA and the Agency for Toxic Substances and Disease Registry (ATSDR).It is noted for inorganic arsenic that in most cases, human data (in the form of epidemiologystudies and case reports) provide the basis for the hazard identification, as most laboratory animalmodels appear to be substantially less susceptible to arsenic toxicity than humans.
For chromium, hazard data show clearly that Cr(VI) demonstrates more significant toxicity thanCr (III). The Agency has not identified any endpoints of concern for Cr(III). For exposure toCr(VI), the Agency has identified toxicological endpoints of concern and has used these endpointsin conjunction with exposure to Cr(VI) for evaluating risks associated with Cr (VI).
Copper as a component of CCA-treated wood is not considered in this document. Copper is anessential nutrient which functions as a component of several enzymes in humans, and toxicity ofcopper in humans involves consumption of water contaminated with high levels of copper, suicideattempts using copper sulfate, or genetic disorders such as Wilson’s disease.
4
1.0 HAZARD CHARACTERIZATION
1.1 Hazard Characterization - Arsenic
Arsenic is a naturally occurring element present in soil, water, and food. In the environment,arsenic exists in many different forms. In water, for example, arsenic exists primarily as theinorganic forms As +3 (arsenite) and As +5 (arsenate), while in food, arsenic exists primarily inorganic forms (seafood, for example, contains arsenic as arsenobetaine, a form which is absorbedbut rapidly excreted unchanged). Human activities also result in the release of arsenic into theenvironment, such as residual arsenic from former pesticidal use, smelter emissions, and the useof chromated copper arsenicals (CCA) in the pressure-treatment of wood for construction ofdecks, fences, playgrounds, and other structural uses.
Inorganic arsenic, prior to 1991, was used as an agricultural pesticide. In 1991, the Agencyproposed cancellation of the sole remaining agricultural use of arsenic acid (As+5) on cotton.Subsequently, this registration was voluntarily canceled by the sponsor and made immediatelyeffective by the Agency (Federal Register, 1993). However, inorganic arsenic contained withinCCA-treated wood continues to be widely used for decking and fencing lumber as well asplayground equipment.
1.1.1 Acute Toxicity
The acute toxicity summary of inorganic arsenic (arsenic acid 7.5%) is summarized in Table 1. Humans are very sensitive to arsenic toxicity when compared with other experimental animals. Inorganic arsenic is acutely toxic, and ingestion of large doses leads to gastrointestinal symptoms,disturbances of cardiovascular and nervous system functions, and eventually death. The effectsseen after short-term arsenic exposure (appearance of edema, gastrointestinal or upper respiratorysymptoms) differ from those after longer exposure (symptoms of skin and neuropathy). Some ofthe effects after short-term exposure tended to subside gradually from the 5th day of the illness,despite continuous intakes of the poison. In contrast, symptoms of peripheral neuropathyappeared in some individuals even after the cessation of arsenical intakes
The acute oral toxicity of inorganic arsenic in humans shows lethal effects in the range of 22-121mg/kg, which is consistent with results of animal studies showing lethality in the range of 15-175mg/kg. There are no studies reporting death in humans after dermal exposure to inorganicarsenic, which is consistent with results of animals studies showing no mortality at dermal dosesup to 1000 mg/kg. Mortality in humans from short-term inhalation exposure to inorganic arsenichas not been observed in occupational settings at air levels up to 100 mg/m3. One study inpregnant rats reported lethality of inorganic arsenic at a concentration of 20 mg/m 3. Arsenic hasbeen shown to result in contact dermatitis in humans exposed occupationally, and animal studiesare also suggestive of mild to severe dermal irritation after application of arsenic to skin. Severeocular irritation was observed in an acute eye irritation study (MRID # 00026356). Arsenic doesnot produce skin sensitization in a guinea pig model (MRID # 40646201).
5
1.1.2 Non-Acute Toxicity
Subchronic studies with arsenic in experimental animal models have produced only generalizedtoxicity, i.e., weight loss, and decreased survival, while data from human exposures have shownmore specific toxic effects, such as neurotoxicity and hyperkeratoses of the skin of the hands andfeet (ATSDR, 2000a).
Chronic toxicity studies with inorganic arsenic in experimental animals also show a lack of specifictoxic effects, whereas the scientific literature that describes chronic human exposure shows a clearrelationship between chronic exposure to inorganic arsenic and the development of skin cancer aswell as cancers of the lung, liver, and bladder (ATSDR, 2000; NRC, 1999). The most notable example of this is the data of Tseng, (1968, 1977) who conducted epidemiological studies of chronic oral exposure of humans to arsenic contained in food andwater. From these studies it was noted that hyperpigmentation, keratosis and possible vascularcomplications [Blackfoot disease] occurred at a dose of 0.17 mg arsenic per liter of water,equivalent of 0.014 mg/kg/ day. Several follow-up studies of the Taiwanese population exposedto inorganic arsenic in drinking water showed an increase in fatal internal organ cancers as well asan increase in skin cancer. Other investigators found that the standard mortality ratios (SMR) andcumulative mortality rates for cancers of the bladder, kidney, skin, lung, and liver weresignificantly greater in the Blackfoot disease endemic area of Taiwan when compared with the ageadjusted rates for the general population of Taiwan.
Data on the developmental and reproductive toxicity of inorganic arsenic in humans is notextensive. One study conducted in Sweden among copper smelter workers showed significantlyreduced live birth weights in offspring of women employed at the copper smelter and increasedincidence of spontaneous abortion among those who worked at the smelter or lived i n proximityto it. However, effects from exposure to lead or copper in this study could not be ruled out.Hopenhayn-Rich (2000) conducted a retrospective study of late fetal, neonatal and postnatalmortality in Antofagasta, Chile for the years 1950 to 1996. The data from this study indicated anelevation in late fetal, neonatal and postnatal mortality compared to a comparison group inValparaiso, Chile during the period when drinking water in Antofagasta was contaminated [860ug/L] with arsenic (1958 to 1970). There was a decline in late fetal, neonatal and postnatalmortality when the concentration of arsenic in the drinking water declined due to installation of awater treatment plant. After installation of the plant, the mortality rates in Antofagasta wereindistinguishable from those in Valparaiso. It was noted that the mothers involved in this incidenthad characteristic arsenic-induced skin lesions. A prospective cohort study was conducted in thesetwo cities during the period in the period when drinking water arsenic levels in Antofagasta is40µg/L and in Valparaiso is less than 1µg/L. By comparing the preganancy and birth
6
Table 1. Acute Toxicity Summary of Arsenic Acid (75%)
GuidelineReference No.
Study Type MRID/Data Accession No.
Results ToxicityCategory
81-1
(OPPTS 870.1100)
Acute Oral 404090-01 MouseLD50 = ? 141 mg/kg = ? 160 mg/kg M+F = 150 mg/kg
II
26356RatLD50 = ? 76 mg/kg = ? 37 mg/kg M+F = 52 mg/kg
I
81-2
(OPPTS 870.1200)
Acute Dermal 26356 RabbitLD50 = ? 1750 mg/kg = ? 2300 mg/kg
II
81-3
(OPPTS 870.1300)
Acute Inhalation 404639-02 MouseLC50 = ? 1.153 mg/L = ? 0.79 mg/L M+F = 1.040 mg/L
II
81-4
(OPPTS 870.2400)
Primary EyeIrritation
26356 Rabbit3/6 animals died by day 7. The 3surviving animals weresacrificed on day 9 because ofsevere ocular irritation andcorrosion.
I
81-5
(OPPTS 870.2500)
Primary SkinIrritation
26356 RabbitAt 30 minutes, all animals showed moderate to severe erythema and slight to severe edema. All animals died prior tothe 24 hour observation.
I
81-6
(OPPTS 870.2600)
DermalSensitization
406462-01 Guinea PigNot a Sensitizer

7
information form these two cities, the results suggests that moderate arsenic exposure (<50µg/L)durign preganancy may associated with reduction in birth weight (Hopenhayn et al., 2003).
In laboratory animals, the major teratogenic effect induced by inorganic arsenic is neural tubedefect, characterized by exencephaly and encephalocele. However, this effect has not beenobserved in humans (IPCS, 2001). In addition, data on the developmental and reproductivetoxicity of inorganic arsenic submitted to the Agency show effects on offspring only at doses thatare maternally toxic.
In a developmental toxicity study (Nemac, 1968b), pregnant Crl:CD-1(ICR)BR mice (25 per dosegroup) received a single daily gavage of aqueous Arsenic Acid (75%) from day 6 through 15 ofgestation. Doses were 0, 10, 32 and 64 mg/kg/day. Controls received deionized water. Bodyweights were recorded at six hour periods. Cesarean section was on day 18. Fetuses wereweighed, sexed and examined for external skeletal and soft tissue malformations and variations.At the high dose, two dams died. Signs included lethargy, decreased urination and defecation, softstool or mucoid feces. Brown urogenital matting, and red material around the eyes. Necropsyshowed bilateral reddening of cortico-medullary junction (kidneys) and a red areas in thestomach. At mid and (especially) top dose, the dams showed weight loss and an elevatedincidence of total litter resorption. An increase in exencephaly occurred in the both the low(1/231 fetuses per 1 litter) and the high (2/146 fetuses per 1 litter) doses, but statisticalsignificance was not seen. The Maternal Toxicity NOAEL was determined to be 32 mg/kg/day,and the Maternal toxicity LOAEL was determined to be 64 mg/kg/day, based on increased totallitter resorption, reduced body weight, and increased maternal mortality. The DevelopmentalToxicity NOAEL was determined to be 32 mg/kg/day and the Developmental Toxicity LOAELwas determined to be 64 mg/kg/day, based on reduced mean viable fetuses, reduced fetal weights,increased post implantation loss and increased incidence of exencephaly (not statisticallysignificant).
In a prenatal developmental toxicity study (Nemec, 1988a), artificially inseminated New ZealandWhite rabbits (20/dose) received aqueous arsenic acid (75%) by gavage from days 6 through 18of gestation inclusive at doses of 0, 0.25, 1, and 4 mg/kg/ day. At the 4 mg/kg/day dose level,seven dams died or were sacrificed in extremis. Reduced body weight gain, clinical signs oftoxicity (prostration, ataxia, decreased defacation and urination, mucoid feces), and histo-logicalalterations in dams sacrificed or dead at the high dose (pale, soft, or mottled kidneys; pale and softliver; dark red areas of the stomach; dark red lungs) were observed. Fetal data showed increasedpost-implantation loss at the 4 mg/kg/day dose (1.8 vs. 0.5 in control) and reduced mean viablefetuses (4.9 vs. 6.7 in control). There was no evidence from the data of increased incidence offetal alterations (variations, malformations) related to treatment with test article. The MaternalNOAEL was determined to be 1 mg/kg/day, and the Maternal LOAEL was determined to be 4mg/kg/day, based on increased mortality, decreased body weight gain, clinical signs, andhistological alterations of the kidney and liver. The Developmental NOAEL was determined to be1 mg/kg/day, and the Developmental LOAEL was determined to be 4 mg/kg/day, based onincreased post-implantation loss and decreased viable fetuses.

8
With regard to the susceptibility of offspring to the toxicity of inorganic arsenic, DeSesso, (1998)in a review paper exploring the reproductive and developmental toxicity of arsenic acid (As+5)noted that in three repeated oral dose studies carried out under EPA guidelines for assayingdevelopmental toxicity, arsenic acid was not teratogenic in: mice by oral gavage (10 to 64mg/kg/day), rabbits by oral gavage (1 to 4 mg/kg/day) and in a mouse two-generation feedingstudy (20 to 500 ppm). Other animal developmental and reproductive toxicity data based on thepublished literature also showed no increased sensitivity to arsenic (+5) when given orally byrepeated doses.
In a tranplacental carcinoginicity study (Waalkes et al., 2003), pregnant C3H mice were givendrinking water containing sodium arsenic at 0, 42,5 and 85 ppm ad libitum from day 8 to 18 ofgestation. These dosages were well tolerated and did not decrease the body weight of the damsduring gestation and the birth weight of the offspring after birth. However, after weaning at 4weeks, the offsprings were put into separate gender-base groups according to maternal exposurelevel. The offspring received no additional arsenic treatment. The study lasted 74 weeks in malesand 90 weeks in females. A complete necropsy was performed on all mice and tissues wereexamined. In male, there was a dose-related increases in the incidences of heptatocellularcarcinoma, liver tumor, adrenal tumor. In females offsprin, dose-related increases occurred inovarian tumors incidence and lung carcinoma incidence were observed.(Waalkes et al., 2003)
The same authors note that “there is a paucity of human data regarding inorganic arsenic exposureduring pregnancy and potential adverse effects on progeny. The available epidemiological studieswere neither rigorously designed nor well controlled. These studies failed to find a definitive orconsistent association between arsenic exposure and adverse pregnancy outcome. Consequently,claims of potential adverse effects of inorganic arsenic on human development remainunsubstantiated.” This conclusion is consistent with ATSDR (2000a), which noted that“Although several studies have reported marginal associations between prolonged low-dosehuman arsenic exposure and adverse reproductive outcomes, including spontaneous abortion,stillbirth, developmental impairment, and congenital malformation, none of these studies haveprovided convincing evidence for such effects. “
The January 22, 2001 Federal Register Notice (Vol. 66, No. 14, pages 7027-7028), in which thearsenic drinking water standard was discussed in relation to susceptibility of certain humansubpopulations including infants and children also supports the view that inorganic arsenic doesnot pose a special sensitivity to children. In that notice, the Agency agreed with a report by theNational Research Council noting “that there is a marked variation in susceptibility to arsenic-induced toxic effects which may be influenced by factors such as genetic polymorphisms, life stageat which exposures occur, sex, nutritional status, and concurrent exposures to other agents orenvironmental factors.” However, the view was also shared between the EPA and NRC that“there is insufficient scientific information to permit separate cancer risk estimates for potentialsubpopulations...and that factors that influence sensitivity to or expression of arsenic-associatedcancer and non-cancer effects need to be better characterized. The EPA agrees with the NRCthat there is not enough information to make risk conclusions regarding any specific

9
subpopulations.” In the latest update to this issue (NRC, 2001), it is noted that while “evidencefrom human studies suggests the potential for adverse effects on several reproductive endpoints...“there are no reliable data that indicate heightened susceptibility of children to arsenic.”
Neurotoxicity of inorganic arsenic is not evident in studies with experimental animals. However,there is a large body of epidemiology studies and case reports which describe neurotoxicity inhumans after both acute and chronic exposures, characterized by headache, lethargy, seizures,coma, encephalopathy (after acute exposures of 2 mg/kg/day and above), and peripheralneuropathy (after repeated exposures to 0.03-0.1 mg/kg/day) (ATSDR, 2000a).
Mutagenicity studies using inorganic arsenic have shown mixed results. Sodium arsenite is notgenotoxic to Chinese hamster ovary (CHO) cells (Rossman et al., 1980) or Syrian hamsterembryo cells (Lee et al., 1985b) when selecting for ouabain- (ATPase) or thioguanine-resistant(hypoxanthine phosphoribosyl transferase, HPRT) mutants. In the L5178Y mouse lymphomaassay, sodium arsenite is weakly genotoxic at the thymidine kinase locus without metabolicactivation (Oberly et al., 1982; Moore et al., 1997a). Sodium arsenate is even a weaker mutagenwith (Oberly et al., 1982) and without metabolic activation (Moore et al., 1997a). The type ofeffects reported by Moore et al. (1997a) were chromosomal aberrations, micronuclei (arseniteonly) polyploidy and endoreduplication.
Sodium arsenate and sodium arsenite induce sister chromatid exchanges and chromosomalaberrations in hamster embryo cells (10-7mol/litre-10-4mol/litre) (Larramendy et al., 1981; Lee etal., 1985b; Kochhar et al., 1996). The aberrations are characterized by chromatid gaps, breaks,and fragmentation, endoreduplication and chromosomal breaks. These clastogenic effects areobserved at lower doses of arsenite than arsenate. The difference may be due to greater in vitrocellular uptake of arsenite than arsenate (Lerman et al., 1983; Bertolero et al., 1987). GaAs (2.5-10 µg/ml) did not induce micronuclei in Syrian hamster embryo cells (Gibson et al., 1997).
Recently, methylated trivalent forms of arsenic have been shown to nick and/or completelydegrade f X174 DNA in vitro (Mass et al., 2001), while sodium arsenite, arsenate, and thepentavalent methylated forms of arsenic were without effect. In the single-cell gel assay (COMETassay)using human lymphocytes, inorganic arsenite and arsenate produced concentration-dependent linear increases in DNA damage, but the methylated trivalent forms of arsenic wereobserved to be 54-77 times more potent in this assay than the non-methylated forms. DNAdamage occurred in the absence of metabolic activation in both assays.
1.1.3 Metabolism
Metabolism of inorganic arsenic first proceeds through non-enzymatic reduction of arsenate toarsenite, which can then undergo enzymatic methylation to the products monomethylarsinic acidand dimethylarsinic acid. These products are then reduced to the monomethylarsinous acid anddimethylarsinous acid produts. The major site of methylation appears to be liver, where themethylation reaction is mediated by methyltransferase enzymes using S-adenylmethionine as a

10
cosubstrate. The products of inorganic arsenic metabolism in urine have been identified as As(+3),As(+5), monomethylarsinous acid, and dimethylarsinous acid. Urinary products appear similaramong species studied (ATSDR, 2000a), but the relative proportions of these products varygreatly. 1.2 Hazard Characterization - Chromium
Chromium is a naturally occurring element found in animals, plants, rocks, in soil, and in volcanicdust and gases. In the trivalent (+3) state, chromium compounds are stable and occur in nature inthis state in ores such as ferrochromite. Chromium (VI) is second-most stable relative to the (+3)form, but rarely occurs naturally and is usually produced from anthropogenic sources (ATSDR,2000b). The general population is exposed to chromium by inhalation of ambient air, ingestion offood, and drinking of water. Dermal contact with chromium can also occur from skin contactwith products containing chromium or from soils containing chromium.
In humans and animals, chromium (III) is an essential nutrient that plays a role in glucose, fat, andprotein metabolism. The biologically active form of chromium exists as a complex of chromium(III), nicotninc acid, and possibly the amino acids glycine, cysteine, and glutamic acid to formglucose tolerance factor. GTF is believed to function by facilitating the interaction of insulin withits cellular receptor sites although the exact mechanism is not known. The National ResearchCouncil recommends a dietary intake of 50-200 micrograms per day for chromium III.
Chromium in the ambient air occurs from natural sources, industrial and product uses,and burning of fossil fuels and wood. The most important industrial sources of chromium in theatmosphere originate from ferrochrome production. Ore refining, chemical and refractoryprocessing, cement-producing plants, automobile brake lining and catalytic converters forautomobiles, leather tanneries, and chrome pigments also contribute to the atmospheric burden ofchromium (Fishbein, 1981). Chromate chemicals used as mist inhibitors in cooling towers andthe mist formed during chrome plating are probably the primary sources of Cr(VI) emitted asmists in the atmosphere (Towill et al., 1978).
Surface runoff, deposition from air, and release of municipal and industrial waste watersare the sources of chromium in surface waters.
Ingested hexavalent chromium is efficiently reduced to the trivalent form in the gastrointestinaltract (DeFlora et al., 1987). In the lungs, hexavalent chromium can be reduced to the trivalentform by ascorbate and glutathione. Given the rapid reduction of Cr(VI) to Cr(III) in vivo, it isrelevant to consider whether environmental exposures to Cr(VI) or administration of Cr(VI) incontrolled animal experiments is essentially identical to environmental exposures to Cr(III) oradministration of Cr(III) in controlled experiments. For chromium, hazard data show clearly that Cr (VI) demonstrates more significant toxicity than Cr (III). The Agency has not identified anyendpoints of concern for Cr(III). For exposure to Cr(VI), the Agency has identified toxicologicalendpoints of concern and has used these endpoints in conjunction with exposure to Cr(VI) for
11
evaluating risks associated with Cr (VI).
1.2.1 Acute Toxicity
The acute toxicity summary of the Chromium (VI) is summarized in Table 2. In acute toxicity animalstudies, administration of chromium (VI) (as chromic acid) by the oral, dermal, and inhalationroutes resulted in significant acute toxicity as measured by lethality. The measured oral LD50 inrats was reported as 52 mg/kg, the dermal LD50 as 57 mg/kg, and the inhalation LC50 as 0.217mg/L, placing chromium (VI) in Toxicity Category I for acute lethality. Human reports of deathafter ingestion of chromium show lethality at similar dose levels (ATSDR, 1998). Chromium (VI)is a significant eye and skin irritant, and severe allergic reactions consisting of redness andswelling of the skin have also been noted in exposed animals and humans. Case reports of humanswho have intentionally or accidentally ingested chromium have also shown severe respiratoryeffects (pulmonary edema, bronchitis, bronchopneumonia), cardiovascular effects (cardiac arrest),and gastrointestinal effects (hemorrhage, ulceration).
In contrast to the acute toxicity of chromium (VI), acute toxicity data for chromium (III) showless severe acute toxicity, with oral LD50 values in rats reported as 183-200 mg/kg or 2365mg/kg. There are no reports of lethality in experimental animals after acute inhalation or acutedermal exposure to chromium (III). However, skin irritation and sensitization have also beenobserved from exposure to chromium (III).
The dermal irritancy and sensitization potential of chromium compounds are worthy of note. Thepotent skin allergenicity of chromium has been well documented in the literature, and chromiumcompounds have been reported to be the most frequent sensitizing agents in man (IRIS, 2000). The prevalence of Cr(VI) sensitivity among the general U.S. population is estimated to be 0.08%,based on studies conducted by Proctor et al (1998). Most of the occurrences of contact dermatitisand sensitization cited are from the result of occupational exposures, but include the woodpreserving industry (Burrows, 1983). For previously sensitized individuals, very low dosage ofCr(VI) can elicit allergic contact dermatitis. Several studies document the sensitization reactions
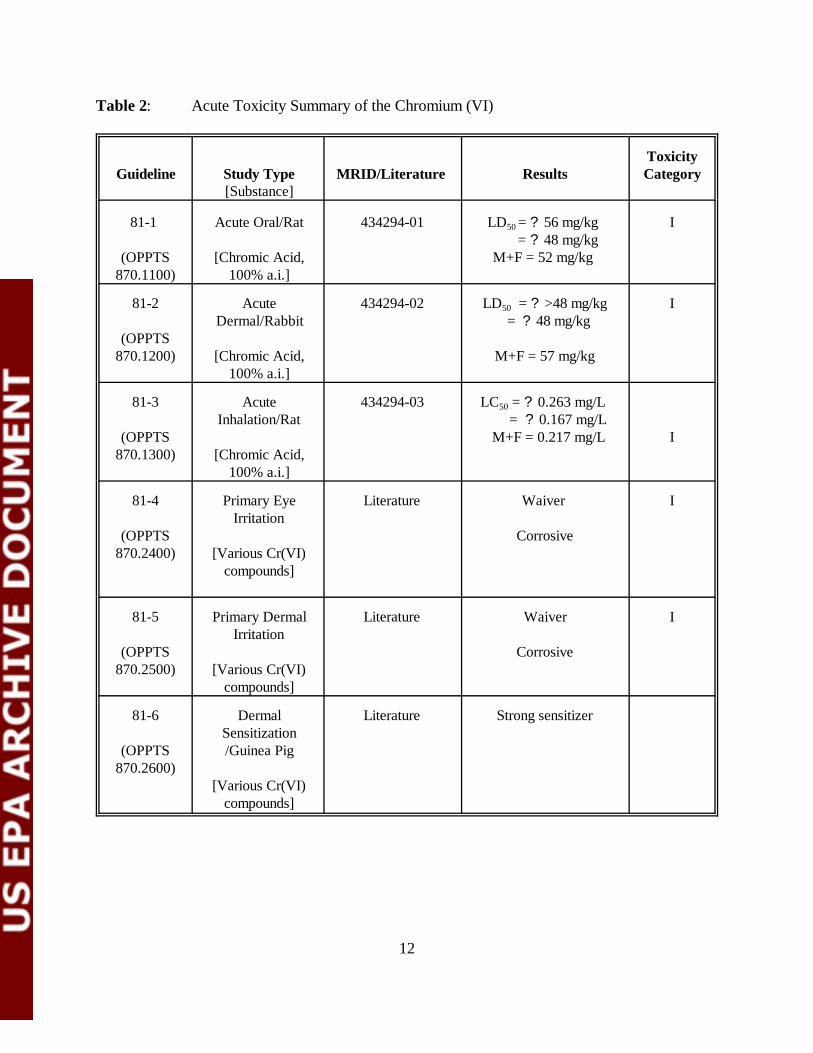
12
Table 2: Acute Toxicity Summary of the Chromium (VI)
Guideline Study Type[Substance]
MRID/Literature
ResultsToxicityCategory
81-1
(OPPTS870.1100)
Acute Oral/Rat
[Chromic Acid,100% a.i.]
434294-01 LD50 = ? 56 mg/kg = ? 48 mg/kg M+F = 52 mg/kg
I
81-2
(OPPTS870.1200)
AcuteDermal/Rabbit
[Chromic Acid,100% a.i.]
434294-02 LD50 = ? >48 mg/kg = ? 48 mg/kg
M+F = 57 mg/kg
I
81-3
(OPPTS870.1300)
AcuteInhalation/Rat
[Chromic Acid,100% a.i.]
434294-03 LC50 = ? 0.263 mg/L = ? 0.167 mg/L
M+F = 0.217 mg/L
I
81-4
(OPPTS870.2400)
Primary EyeIrritation
[Various Cr(VI)compounds]
Literature Waiver
Corrosive
I
81-5
(OPPTS870.2500)
Primary DermalIrritation
[Various Cr(VI)compounds]
Literature Waiver
Corrosive
I
81-6
(OPPTS870.2600)
DermalSensitization/Guinea Pig
[Various Cr(VI)compounds]
Literature Strong sensitizer
13
observed in humans previously exposed dermally to chromium (VI) compounds. Sensitizationcan also be observed in humans with chromium (III) if exposure concentration is high enough(ATSDR, 2000b). Bagdon (1991) collected skin hypersensitivity data for trivalent chromiumcompounds in human subjects and concluded that the threshold level for evoking hypersensitivityreactions from trivalent chromium compounds is approximately 50-fold higher than for hexavalentchromium compounds.
Experimental animal models also show that sensitization to chromium compounds can occur, andin some cases, the sensitization response observed is similar using an equivalent dose of eitherchromium (VI) or chromium (III) (ATSDR, 2000b).
1.2.2 Non-Acute Toxicity
Subchronic toxicity studies in experimental animals have demonstrated hematologic and hepaticeffects from repeated oral exposure to chromium (VI). In a 9 week study in which male andfemale Sprague-Dawley rats were fed diets containing potassium dichromate at dose levels of 0,15, 50, 100, or 400 ppm potassium dichromate [NTP, 1996], there were no treatment relatedfindings noted in mean body weights, water and feed consumption, organ weights or microscopicpathology of the liver, kidneys and ovaries. Hematology findings effects consisted of decreases inmean corpuscular volume (MCV) and mean corpuscular hemoglobin (MCH) at the high dose(8.4 and 9.8 mg/kg/day in male and female rats respectively). There were no reported hepaticeffects in this study. However, Kumar and Rana (1992) reported increased accumulation ofhepatic lipids after gavage treatment of rats with 13.5 mg/kg chromium (VI) (as potassiumchromate) after 20 days of treatment.
In a 9-week feeding study in mice conducted by the National Toxicology Program (1996) inwhich mice were fed diets containing 1.1, 3.5, 7.4, and 32 mg/kg/day chromium (males) or 1.8,5.6, 12, and 48 mg/kg/day chromium (females), hepatic cytoplasmic vacuolization was observedto be slightly increased at the high dose in males and females, and the appearance of the vacuoleswas suggestive of lipid accumulation. Additional endpoints examined in this study included bodyweights, feed and water consumption, organ weights, microscopic evaluation of the liver, kidneyand ovaries, hematology, histology of the testis and epididymis for Sertoli nuclei, andpreleptotene spermatocyte counts in Stage X or XI tubules and chromatin analysis. Slightdecreases in body weight were observed during this study, but there was no significant effect oftreatment on clinical signs, necropsy findings, or microscopic histology. Hematologic effectswere observed and consisted of a 2-4% decrease in MCV at weeks 3, 6, and 9 in high dose malesand females and at week 6 in the 100 ppm females. The MCV returned to normal in the femalemice after the recovery period (week 17); however the MCV increased 2.8% in the 400 ppmmales.
The MCV changes at weeks 3, 6 and 9 were, in general associated with small decreases in theRBC, and small decreases in the MCH, although only the MCH values from the 400 ppm males(week 9), the 400 ppm females (Weeks 3 and 6), the 15 and 100 ppm females (week 3) were

14
decreased.
Occupational exposure to chromium by inhalation has been studied in the chromatemanufacturing and ferrochromium industries; however, exposures all include mixed exposures toboth Cr(III) and Cr(VI). The Cr(VI) species is widely considered to be the causative agent inreports of excess cancer risk in chromium workers. However, studies are inadequate to rule out acontribution by Cr(III), and Cr(VI) cannot be unequivocally demonstrated to be the causativeagent for noncarcinogenic effects following inhalation.
A number of epidemiologic studies have considered the association between inhalation ofchromium and noncarcinogenic endpoints, including upper respiratory irritation and atrophy,lower respiratory effects, and systemic effects. Symptoms reported from inhalation exposure tomists and dusts containing chromium have included nasal tissue damage, perforated septum,ulcerated septum, chrome holes, nosebleed, inflamed mucosa, nasal septal perforation, and nasalseptal ulceration (USEPA IRIS, 1998). Exposure to vapors of chromium salts has also beensuspected as a cause of asthma, coughing, wheezing, and other respiratory distress inferrochromium workers.
Despite the consistency of the reported effects from inhalation of chromium contained in dustsand mists, the actual Cr(III) and Cr(VI) exposure levels in many of the studies attributingrespiratory effects to chromium were unknown. In addition, data on other confounding factorssuch as smoking were frequently unavailable. These caveats significantly complicate determinationof the potential health effects associated with inhalation exposure to chromium (ATSDR, 2000b).
Although human data examining developmental endpoints are scarce, animal studies haveconsistently shown that chromium, particularly chromium(VI), is a developmental toxicant.Oral ingestion of chromium (VI) compounds in experimental animals results in significantdevelopmental toxicity. Studies describing the effects observed have been published in the IRISToxicological Reviews for both chromium (VI) and chromium (III) as well as from submittedstudies to the Agency and are summarized here.
Trivedi et al. (1989) exposed mice to 250, 500, and 1,000 ppm potassium dichromate dailythrough drinking water during the entire gestational period. The authors reported decreased fetalweight, increased resorptions, and increased abnormalities (tail kinking, delayed ossification ofthe cranium) in exposed mice. The medium- and high-dose groups registered significantreductions in body weight gain when compared to controls. The most significant finding of thestudy was the complete absence of uterine implantation in the high-dose group. The 250 and 500ppm dose groups also showed significant incidences of resorption as compared to controls. Theauthors observed significant increases in preimplantation and postimplantation losses and dose-dependent reductions in total weight and crown-rump length in the lower dose groups.Additional effects included treatment-related increases in abnormalities in the tail, wristforelimbs and subdermal hemorrhagic patches in the offspring.

15
Junaid et al. (1996) exposed female Swiss albino mice to 250, 500, or 750 ppm potassiumdichromate in drinking water to determine the potential embryotoxicity of hexavalent chromiumduring days 6-14 of gestation. No notable changes in behavior or clinical signs were observed inthe control or treated dams. Chromium levels in blood, placenta, and fetus increased in a dose-dependent fashion over the course of the study. The authors reported retarded fetal developmentand embryo- and fetotoxic effects including reduced fetal weight, reduced number of fetuses (liveand dead) per dam, and higher incidences of stillbirths and postimplantation loss in the 500 and750 ppm dosed mothers. Significantly reduced ossification in nasal, frontal, parietal,interparietal, caudal, and tarsal bones was observed in the high-dose group, while reducedossification in only the caudal bones was observed in the 500 ppm dose group. Based on thebody weight of the animals (30 +/- 5 g) and the drinking water ingested by the animals in the 250ppm dose group (8.0 ml/mouse/day), the dose level in the 250 ppm group can be identified as 67mg/kg-day. The maternal NOAEL was 63 [22.3] mg/kg/day while the LOAEL was 42.1mg/kg/day and was based on a decreased gestational body weight. At the lowest dose tested, theincidence of resorptions was increased and a developmental NOAEL was, therefore, notdetermined.
Kanojia et al. (1996) exposed female Swiss albino rats to 250, 500, or 750 ppm potassiumdichromate in drinking water for 20 days 3 months prior to gestation to determine the potentialteratogenicity of hexavalent chromium. No notable changes in behavior or clinical signs wereobserved in the control or treated dams. Chromium levels in blood, placenta, and fetus weresignificantly increased in the dams of the 500 and 750 ppm dose groups. The authors reported areduced number of corpora lutea and implantations, retarded fetal development, and embryo- andfetotoxic effects including reduced number of fetuses (live and dead) per dam and higherincidences of stillbirths and postimplantation loss in the 500 and 750 ppm dosed mothers.Significantly reduced parietal and interparietal ossification was observed in the high-dose group.Based on the body weight of the animals (175 +/- 25 g) and the drinking water ingested by theanimals in the 250 ppm dose group (26 ml/mouse/day) the dose level in the 250 ppm group canbe identified as 37 mg/kg-day.
Tyl (1991) examined the developmental and maternal effects of daily administration of chromicacid (55.0% a.i.) at dosages of 0, 0.1, 0.5, 2.0 or 5.0 mg/kg/day by gavage in rabbits. Clinicalsigns of toxicity , including diarrhea, and slow, audible or labored breathing were observed inpredominately in the 2.0 and 5.0 mg/kg/day groups. However, these signs did not show a dose-response and were observed in lesser incidence at 5.0 mg/kg/day vs. 2.0 mg/kg/day. However, theincidence of mortality (at 2.0 mg/kg/day, one doe died on gestation day (GD) 28; at 5.0mg/kg/day, 5 does died (one each on GD 10, 14, and two on GD 15) and the magnitude ofdecreased body weight gain during the dosing period (average weight loss of 48 grams at 2.0mg/kg/day, and average weight loss of 140 grams at 5.0 mg/kg/day during gestation days 7-19)were observed to occur in a dose-related fashion at 2.0 and 5.0 mg/kg/day. Food efficiency wasalso observed to be significantly lower during the dosing period in the 5.0 mg/kg/day dose group. Cesarean section observations were unremarkable in this study at any dose level. No treatmentrelated effects on either fetal malformations or variations were observed.
16
The Maternal NOAEL = 0.5 [0.12] mg/kg/day and LOAEL = 2.0 [0.48] mg/kg/day (based on theincreased incidence of maternal mortality and decreased body weight gain ). The DevelopmentalNOAEL = 2.0 [0.48] mg/kg/day and LOAEL > 2.0 [>0.48] mg/kg/day based on the lack ofdevelopmental effects at any dose level tested.
By contrast to effects of chromium (VI), effects on development and reproduction from exposureto Cr (III) show either negative results or effects only at high doses. For example, male andfemale rats treated with 1,806 mg Cr(III) kg/day as Cr(III) oxide 5 days/week for 60 days beforegestation and throughout the gestation period had normal fertility, gestational length, and littersize (Ivankovic and Preussman, 1975). Elbetieha and Al-Hamood (1997) examined fertilityfollowing chromium chloride exposures in mice. Sexually mature male and female mice wereexposed to 1,000, 2,000, or 5,000 mg/L chromium chloride in drinking water for 12 weeks.Exposure of male mice to 5,000 ppm trivalent chromium compounds for 12 weeks had adverseimpacts on male fertility. Testes weights were increased in the males exposed in the 2,000 and5,000 mg/L dose groups, while seminal vesicle and preputial gland weights were reduced in the5,000 mg/L exposed males. The number of implantation sites and viable fetuses were significantlyreduced in females exposed to 2,000 and 5,000 mg/L chromium chloride. Water consumption wasnot reported precluding calculation of the doses received. However it is evident that adverseeffects were observed only at a high dose of Cr (III).
The National Toxicology Program recently conducted a three-part study to investigateoral ingestion of hexavalent chromium in experimental animals (NTP, 1996a,b, 1997).The study included a determination of the potential reproductive toxicity of potassiumdichromate in Sprague-Dawley rats, a repeat of the study of Zahid et al. (1990) using BALB/Cmice, and a Reproductive Assessment by Continuous Breeding study in BALB/C mice.The study in the Sprague-Dawley rat (NTP, 1996a) was conducted in order to generatedata in a species commonly used for regulatory studies. Groups of 24 males and 48 females wereexposed to 0, 15, 50, 100, or 400 ppm potassium dichromate daily in the diet for 9 weeksfollowed by a recovery period of 8 weeks. Six male and 12 female rats were sacrificed after 3, 6,or 9 full weeks of treatment or after the full recovery period. Animals were examined for bodyweights; feed and water consumption; organ weights; microscopic evaluation of the liver, kidney,and ovaries; hematology; histology of the testis and epididymus for Sertoli nuclei andpreleptotene spermatocyte counts in Stage X or XI tubules; and chromatin analysis. Notreatment-related hematology findings were reported except for slight decreases in MCV andMCH values in the male and female treatment groups receiving 400 ppm potassium dichromate(24 mg/kg-day). While the trends in MCV and MCH were not large and were within thereference ranges, they are consistent with the findings of the companion studies in BALB/C miceand were characterized by the authors as suggestive of a potential bone marrow/erythroidresponse. The authors considered the 100 ppm (6 mg/kg-day) dose group to be representative ofthe NOAEL for the study.
The reproductive study in BALB/C mice (NTP, 1996b) was conducted to reproduce theconditions utilized by Zahid et al. (1990) in their examination of comparative effects of trivalent

17
and hexavalent chromium on spermatogenesis of the mouse. Groups of 24 male and 48 femaleBALB/C mice were exposed to 0, 15, 50, 100, or 400 ppm potassium dichromate in the diet for 9weeks followed by a recovery period of 8 weeks. Six male and 12 female mice were sacrificedafter 3, 6, or 9 full weeks of treatment or after the full recovery period. Animals were examinedfor body weights; feed and water consumption; organ weights; microscopic evaluation of theliver, kidney, and ovaries; hematology; histology of the testis and epididymus for Sertoli nucleiand preleptotene spermatocyte counts in Stage X or XI tubules; and chromatin analysis.Treatment-related effects included a slight reduction in the mean body weights in the 400 ppmmales and the 100 ppm females, a slight increase in food consumption at all dose levels, a slightdecrease in MCV and MCH at 400 ppm, and cytoplasmic vacuolization of the hepatocyte at 50,100 and 400 ppm. None of the effects on spermatogenesis reported by Zahid et al. (1990) wereobserved in this study. On the basis of the cytoplasmic vacuolization of the hepatocyte in the 50,100, and 400 ppm dose groups, the authors selected 15 ppm (4 mg/kg-day) as the NOAEL.
Increased resorptions and increased post-implantation loss as well as gross fetal abnormalitieswere observed in offspring of pregnant mice exposed to potassium dichromate at 57 mg/kg/day indrinking water during gestation (ATSDR, 2000b). At a higher dose of 234 mg/kg/day, noimplantations were observed in maternal mice. In a second study in mice, potassium dichromatewas administered in the diet for 7 weeks at dose levels of 15.1 and 28 mg/kg/day. Reduced spermcounts and degeneration of the outer layer of the seminiferous tubules was observed at the 15.1mg/kg/day dose, and morphologically altered sperm was observed at the 28 mg/kg/day dose.
In male rats administered 20 mg/kg/day chromium trioxide for 90 days by gavage, reducedtesticular weight, decreased testicular testosterone, and reduced Leydig cell number was observed(Chowdhury and Mitra, 1995).
Despite the wealth of animal studies on the developmental and reproductive toxicity of chromiumVI, there are too few human data with which to make any reliable conclusion regarding thesusceptibility of the developing fetus, infants, or children to the toxic effects of chromium VI. Theevidence available suggests similar toxic effects in adults and children from ingestion of chromiumVI (ATSDR, 2000b). Hexavalent chromium (Cr VI) is known to be carcinogenic in humans by the inhalation route ofexposure. Results of occupational epidemiologic studies of chromium-exposed workers areconsistent across investigators and study populations. Dose-response relationships have beenestablished for chromium exposure and lung cancer. Chromium-exposed workers are exposed toboth Cr(III) and Cr(VI) compounds. Because only Cr(VI) has been found to be carcinogenic inanimal studies, however, it was concluded that only Cr(VI) should be classified as a humancarcinogen.
Animal data are consistent with the human carcinogenicity data on hexavalent chromiumby theinhalation route. Hexavalent chromium compounds are also carcinogenic in animal bioassays byother routes of exposure, such as: intramuscular injection site tumors in rats and mice,
18
intrapleural implant site tumors for various Cr(VI) compounds in rats, intrabronchial implantationsite tumors for various Cr(VI) compounds in rats, and subcutaneous injection site sarcomas in rats(IRIS, 2001). However, these routes of administration are not relevant to exposures of chromiumin CCA-treated wood.
Data addressing human carcinogenicity from exposures to Cr(III) alone are not available, and dataare inadequate for an evaluation of human carcinogenic potential. Two oral studies located in theavailable literature (Schroeder et al., 1965; Ivankovic and Preussman, 1975) reported negativeresults for rats and mice. Several animal studies have been performed to assess the carcinogenicpotential of Cr(III) by inhalation. These studies have not found an increased incidence of lungtumors following exposure either by natural routes, intrapleural injection, or intrabronchialimplantation (Baetjer et al., 1959; Hueper and Payne, 1962; Levy and Venitt, 1975; Levy andMartin, 1983).
The data from oral and inhalation exposures of animals to trivalent chromium do not supportdetermination of the carcinogenicity of trivalent chromium. IARC (1990) concluded that animaldata are inadequate for the evaluation of the carcinogenicity of Cr(III) compounds. Furthermore,although there is sufficient evidence of respiratory carcinogenicity associated with exposure tochromium, the relative contributions of Cr(III), Cr(VI), metallic chromium, or soluble versusinsoluble chromium to carcinogenicity cannot be elucidated. In vitro data are suggestive of a potential mode of action for hexavalent chromium carcinogenesis. Hexavalent chromium carcinogenesis may result from the formation of mutagenic oxidatitiveDNA lesions following intracellular reduction to the trivalent form. Cr(VI) readily passes throughcell membranes and is rapidly reduced intracellularly to generate reactive Cr(V) and Cr(IV)intermediates a reactive oxygen species. A number of potentially mutagenic DNA lesions areformed during the reduction of Cr(VI). Hexavalent chromium is mutagenic in bacterial assays,yeasts, and V79 cells, and Cr(VI) compounds decrease the fidelity of DNA synthesis in vitro andproduce unscheduled DNA synthesis as a consequence of DNA damage. Chromate has beenshown to transform both primary cells and cell lines (ATSDR, 2000b).
Intracellular reduction of Cr(VI) generates reactive chromium V and chromium IV intermediatesas well as hydroxyl free radicals (OH) and singlet oxygen. A variety of DNA lesions are generatedduring the reduction of Cr(VI) to Cr(III), including DNA strand breaks, alkali-labile sites, DNA-protein and DNA-DNA crosslinks, and oxidative DNA damage, such as 8-oxo-deoxyguanosine.The relative importance of the different chromium complexes and oxidative DNA damage in thetoxicity of Cr(VI) is unknown.
Hexavalent chromium has been shown to be genotoxic only in the presence of appropriatereducing agents in vitro or in viable cell systems in vitro or in vivo. Hexavalent chromium hasbeen shown to be mutagenic in bacterial systems in the absence of a mammalian activatingsystem, and not mutagenic when a mammalian activating system is present. Hexavalent chromiumis also mutagenic in eukaryotic test systems and clastogenic in cultured mammalian cells.

19
Hexavalent chromium in the presence of glutathione has been demonstrated to produce genotoxicDNA adducts that inhibit DNA replication and are mutagenic (IRIS, 2000). Chromium (III) hasalso produced positive mutagenic responses in vitro (IRIS, 2000).
1.2.3 Metabolism
Absorption of chromium by the oral route ranges from essentially zero for the insoluble chromiumIII compound chromic oxide to 10% for potassium chromate. Absorption through exposure in thediet, in water, or from contaminated soil is consistently low, with values reported in the range of1-5% (ATSDR, 2000b; USEPA, 1998). Hexavalent chromium can be reduced to the trivalentform in the epithelial lining fluid of the lungs by ascorbate and glutathione as well as by gastricjuice in the stomach, which contributes to the low oral absorption. Absorption by the dermal routeis also low (1.3% after 24 hours as reported by Bagdon et al., 1991) Once absorbed, chromium compounds are distributed to all organs of the body without anypreferential distribution to any one organ. However, exposures to higher levels of chromium, suchas can occur in the chrome plating industry and chrome refining plants, may result in accumulationof chromium in tissues. Witmer et al. (1989, 1991) studied chromium distribution in tissues of ratsadministered chromium via gavage. In one experiment, the highest dose of sodium chromate [5.8mg Cr(VI)/kg/day for 7 days] resulted in concentrations of chromium in the tissues in thefollowing order: liver (22 ?g chromium/whole organ) > kidney (7.5 ?g) > lung (4.5 ?g) > blood(2 ?g) > spleen (1 ?g). These tissues combined retained about 1.7% of the administered dose;however, some tissues were not analyzed. At the two lower doses administered (1.2 or 2.3mg/kg/day), very little chromium was detected (<0.5 µg/organ) in the organs analyzed.
Maruyama (1982) studied the chromium content in major organs of mice exposed to potassiumdichromate [Cr(VI)] or chromium trichloride ([Cr(III)] for 1 year in drinking water. Groups ofmice received 4.4, 5.0 or 14.2 mg Cr(VI)/kg/day or 4.8, 6.1 or 12.3 mg Cr(III)/kg/day. Examination of organs and blood in mice that received Cr(VI) revealed that the liver and spleenhad the highest levels of chromium, although some chromium accumulation was observed in alltissues. In mice that received Cr(III), the liver was the only organ with detectable amounts ofchromium, and at levels that were about 40-90 times less than in mice that received the Cr(VI)compound. MacKenzie et al. (1958) reported that in rats following the administration of similarconcentrations of Cr(VI) as potassium chromate or Cr(III) as chromium trichloride in drinkingwater for 1 year, tissue levels were approximately 9 times greater in rats that received the Cr(VI)compound, compared to rats that received the Cr(III) compound.
If hexavalent chromium is absorbed, it can readily enter red blood cells through facilitateddiffusion, where it will be reduced to the trivalent form by glutathione. During reduction to thetrivalent form, chromium may interact with cellular macromolecules, including DNA (Wiegand etal., 1985), or may be slowly released from the cell (Bishop and Surgenor, 1964). Chromium IIIcan be cleared rapidly from the blood but more slowly from tissues, which may be related to theformation of trivalent chromium complexes with proteins or amino acids (Bryson and Goodall,
20
1983).
The liver is a primary site of chromium metabolism and has been studied in animals. Incubation ofCr(VI) with rat liver microsomes in the presence of the enzyme cofactor nicotinamide adeninedinucleotide phosphate (NADPH) resulted in the reduction of Cr(VI) to Cr(III) (ATSDR, 2000b). Exclusion of the co-factors necessary for the production of NADPH resulted in a large decreasein the reduction of Cr(VI) to Cr (III).
Chromium metabolism can result in the formation of species that interact with deoxyribonucleicacid (DNA). The reduction of Cr(VI) to a Cr(V) intermediate involves a single electron transferfrom the microsomal electron-transport cytochrome P-450 system (Jennette 1982). Thesereactive Cr(V) complexes/ intermediates are relatively unstable and persist for approxim-ately 1hour in vitro. During this time the Cr(V) complexes/ intermediates can interact withdeoxyribonucleic acid (DNA), which may eventually lead to cancer. When Cr(VI) interacts withglutathione, Cr(V) complexes and glutathione thonyl radicals were produced, and when Cr(VI)interacts with DNA and glutathione, DNA adducts were formed (Aiyar et al. 1989). Theformation of Cr(V) was found to correlate with DNA adduct formation. Following reactions ofCr(VI) with hydrogen peroxide, hydroxyl radicals were produced; the addition of DNA resulted inthe formation of an 8-hydroxy guanine adduct and DNA strand breakage.
The elimination of chromium after oral exposure has been studied in both humans and animals. Inone study, human volunteers received an acute oral dose of radiolabeled Cr(III) or Cr(VI)(Donaldson and Barreras 1966). Fecal samples were collected for 24 hours, and urine sampleswere collected for 6 days and analyzed for chromium. Approximately 99.6% of the Cr(III)compound was recovered in the 6-day fecal sample, while 89.4% of the Cr(VI) compound wasrecovered. The results of the analysis of the 24-hour urine samples indicated that 0.5% and 2.1%of the administered dose of the Cr(III) and the Cr(VI) compounds, respectively, were recoveredin the urine. Other potential routes of excretion include hair, fingernails and breast milk (ATSDR2000b).
In several studies in which rats and hamsters were fed Cr(VI) compounds, fecal excretion ofchromium varied slightly from 97% to 99% of the administered dose, and urinary excretion ofchromium, administered as Cr(III) or Cr(VI) compounds, varied from 0.6% to 1.4% of the dose(Donaldson and Barreras 1966, Henderson et al. 1979, Sayato et al. 1980). Following the gavageadministration of 13.92 mg chromium/kg/day as calcium chromate for 8 days, the total urinaryand fecal excretion of chromium on days 1 and 2 of dosing were <0.5% and 1.8%, respectively(Witmer et al. 1991). The total urinary and fecal excretion of chromium on days 7 and 8 ofdosing were 0.21% and 12.35%, respectively. Donaldson et al. (1984), reported that excretion ofCr(III) and creatinine clearance were almost equal suggesting that tubular absorption orreabsorption of chromium in the kidneys was minimal.
2.0 DOSE-RESPONSE ASSESSMENT
21
The process of dose-response assessment as part of a total risk assessment involves describing thequantitative relationship between the exposure to a chemical and the extent of toxic injury ordisease. Following the process of hazard identification, in which the available toxicology data isreviewed and selection of NOAELs and LOAELs is made for each study, the reviewed data for apesticide chemical is presented to a committee of scientists within the Office of PesticidePrograms who reach concurrence on toxicology endpoints that best represent the toxic effectsexpected from various routes of exposure and durations of exposure. For most pesticidechemicals, the process results in selection of acute and chronic Reference Dose values (which canbe used as benchmark values for acute and chronic dietary risk calculations), as well as endpointvalues for non-dietary risk assessments involving occupational and/or residential exposures by theoral, dermal, and inhalation routes. Endpoints are selected for non-dietary exposures to representshort-term (1-30 days), intermediate-term (30-180 days), and long-term exposure scenarios, asneeded. In addition, incidental oral exposure endpoints are selected for short-term andintermediate term exposure durations to represent ingestion of pesticide chemical residues thatmay occur from hand-to-mouth behaviors. In general, toxicity endpoint selection should, to theextent possible, match the temporal and spatial characteristics of the exposure scenarios selectedfor use in the risk assessment. These endpoints are then used in conjunction with exposure valuesto calculate risks associated with various types of exposure, depending upon the uses of thepesticide chemical.
Toxicology endpoints for both inorganic arsenic and chromium have been selected for theresidential exposure assessment and are presented below:

22
2.1 Inorganic Arsenic-Endpoint Selection
On August 21, 2001, the OPP’s Hazard Identification Assessment Review Committee (HIARC)evaluated the toxicology data base of Inorganic Arsenic and established the toxicologicalendpoints for occupational exposure risk assessments. On October, 23-25 2001, the FIFRAScientific Advisory Panel (SAP) met and discussed some issues about the end points proposed bythe HIARC. The inorganic arsenic toxicological end-points selected for CCA occupational riskassessment are summarized in Table 4.
2.1.1 Acute Reference Dose (aRfD)
In the Office of Pesticide Program (OPP) in EPA, the acute reference dose (aRfD) was used inthe risk assessment associated with oral exposure to food related chemicals. Inorganic arsenic isnot registered for any food uses and there are no existing tolerances. For inorganic arsenic ascontained within CCA-treated wood, therefore, an acute RfD is not relevant to the exposuresfrom registered use.
2.1.2 Chronic Reference Dose (cRfD)
The U.S. EPA has published a chronic RfD value for inorganic arsenic (USEPA IRIS, 1998). However, as with the acute RfD, in OPP, the chronic RfD in OPP was considered for evaluatingrisks associated with food and/or drinking water related chemical uses. Because there are noexposure scenarios relevant to the currently registered uses of inorganic arsenic, and specificallythe registered uses in CCA-treated lumber. No chronic RfD value is need for the current inorganicarsenic use in CCA-treated wood use. However, if the Agency determines in the future that anaggregate assessment is needed for calculation of risk from exposure to arsenic in treated lumberand exposure in drinking water and/or food, the chronic RfD value can be utilized.
2.1.3 Short (1-30 days ) and Intermediate (30-180 days) Incidental Oral Exposure
Based on the registered use of CCA-treated lumber for fencing and decking materials inresidential settings, incidental oral exposure is expected, based on potential ingestion of soilcontaminated with arsenic as a result of leaching from wood, and from ingestion of arsenicresidues from the palm as a result of direct dermal contact with treated wood. The studiesselected for short- and intermediate-term incidental oral exposure are the human case reports ofFranzblau and Lilis (Arch. of Envir. Health 44(6): 385-390, 1989) and Mizuta et al. (Bull.Yamaguchi Med. Sch. 4(2-3): 131-149, 1956). The LOAEL of 0.05 mg/kg/day was selected,based on facial edema, gastrointestinal symptoms, neuropathy, and skin lesions observed at thisdose level
Franzblau et al., (1989) reported 2 cases of subchronic (2 months) arsenic intoxication resultingfrom ingestion of contaminated well water (9-10.9 mg/L) sporadically (once or twice a week) forabout 2 months. Acute gastrointestinal symptoms, central and peripheral neuropathy, bone
23
marrow suppression, hepatic toxicity and mild mucous membrane and cutaneous changes werepresented. The calculated dose was 0.03 - 0.08 mg/kg/day based on a body weight of 65 Kg andingestion of from 238 to 475 ml water/day.
Mizuta et al. (1956) reported a poisoning incident involving the presence of arsenic [probablycalcium arsenate] contained in soy-sauce. The duration of exposure was 2-3 weeks. The arseniccontent was estimated at 0.1 mg/ml. Out of 417 patients, the authors reported on 220 (age notspecified for all patients. The age of the 46 paints with age information are ranging from 15 - 69).An early feature of the poisoning was appearance of facial edema that was most marked on theeyelids. Other symptoms presented included multifaceted gastrointestinal symptoms, liverenlargement, upper respiratory symptoms, peripheral neuropathy and skin disorders. In themajority of the patients, the symptoms appeared within two days of ingestion and then declinedeven with continued exposure. There was evidence of minor gastrointestinal bleeding (occult blood in gastric and duodenal juice). There were abnormalities in electrocardiograms (altered Q-Tintervals and P and T waves). These changes were not evident on reexamination after recoveryfrom the clinical symptoms. An abnormal patellar reflex was evident in >50% of the cases. Thiseffect did not return to normal during the course of the investigation.
Based on the consumption of the arsenic in the contaminated soy-sauce, the pattern of soy-sauceconsumption and on measured urinary arsenic levels, the authors estimated consumption ofarsenic at 3 mg/day. Although the body weight was not reported, the EPA assumes an averagebody weight of 55 kg in the Asian population. The estimated exposure was, therefore, 0.05mg/kg/day and was considered the LOAEL. The LOAEL= 0.05 mg/kg/day (edema of theface; gastrointestinal, upper respiratory, skin, peripheral and neuropathy symptoms).
These two case reports are appropriate for both short- and intermediate-term incidental oralendpoints for the following reasons:
1) Symptoms reported in the Mizuta study (gastrointestinal disorders, neuropathy, livertoxicity) occurred after 2-3 weeks of exposure, making this endpoint appropriate for theshort-term (1-30 days) exposure period. This study also examined toxicity by the relevantroute of exposure (oral).
2) Similar symptoms were observed in the Franzblau study, and are appropriate for theintermediate-term endpoint as they were observed to occur after longer-term (2 months)exposure.
A Margin of Exposure (MOE) of 30 applied to the LOAEL was suggested the majority of theSAP panel members in the 2001 meeting.
USEPA Region 8 has also published a report on selection of acute and chronic Reference Dosesfor Inorganic Arsenic, intended to apply to exposures of 1-14 days and 15 days-7 years (USEPARegion 8, 2001). The use of the term “reference dose” in the Region 8 report “apply to readily
24
soluble forms of arsenic and are intended to include total oral exposure to inorganic arsenic, thatis drinking water, food, and soil. “ The report concludes that a NOAEL value of 0.015mg/kg/day from a study by Mazumder et al (Int. J. Epidem. 27: 871-877) can be used for acuteand subchronic reference dose values, with an uncertainty factor of 1. Alternately, the LOAEL of0.05 mg/kg/day and an uncertainty factor of 3 (for extrapolation from the LOAEL to theNOAEL) could be selected from this same study. A full factor of 10 was not employed byRegion 8 based on the reasoning that a No Adverse Effect Level “is likely at an exposure onlyslightly below the effect level” (USEPA Region 8, 2001). However, this report did not discussseverity or irreversibility of effects observed in the Mizuta et al. report as a factor in selecting theuncertainty factor, which was taken into consideration by the OPP HIARC. Further, the effectobserved in the Mazumder et al. study of hyperkeratosis is a result of chronic exposure and notshort- or intermediate-term exposure and was thus felt to be inappropriate for determination ofshort- and intermediate-term incidental oral risk. The Region 8 report was part of the backgrounddocuments presented to the 2001 SAP.
For the risk assessment, based on the recommendations of the SAP, the Agency decided to use a Margin of Exposure (MOE) of 30. This value of 30 was recommended on the basis that theseverity of symptoms near or moderately above the LOAEL (0.05mg/kg/day) warranted a fulluncertainty factor of 10 and an uncertainty factor of 3 for protection of children.
2.1.4 Dermal Absorption
Dermal absorption of inorganic arsenic is represented by the study of Wester et al. (Fund. Appl.Toxicol. 20: 336-340, 1993). In this study, the percutaneous absorption of arsenic acid (H 3AsO4)from water and soil both in vivo using rhesus monkeys and in vitro with human skin wasexamined. In vivo, absorption of arsenic acid from water (loading 5 µl/cm2 skin area) was 6.4 ±3.9% at the low dose (0.024 ng/cm2) and 2.0 ± 1.2% at the high dose (2.1 µg/cm 2). Absorptionfrom soil (loading 0.04 g soil/cm2 skin area) in vivo was 4.5 ± 3.2% at the low dose (0. 04ng/cm2) and 3.2 ± 1.9% at the high dose (0.6 µg/cm 2). Thus, in vivo in the rhesus monkey,percutaneous absorption of arsenic acid is low from either soil or water vehicles and does notdiffer appreciably at doses more than 10,000-fold apart. Wester et al. (1993) also reported that forhuman skin, at the low dose, 1.9% was absorbed from water and 0.8% from soil over a 24-hperiod.
The value of 6.4% dermal absorption was chosen based on the use of non-human primates forderivation of this value and the fact that this was a well-conducted study. It is observed in thisstudy that a higher dose on the skin resulted in lower dermal absorption as noted above, but thedata in this and other studies suggests sufficient variability in the absorption such that use of the6.4% dermal absorption value is sufficiently but not overly conservative. For children playingaround playground equipment, however, it is assumed the dermal exposure would be arsenic inwood surface residue and/or arsenic in soil, a dermal absorption value of 3% will be used (SAP,2001).
25
2.1.5 Short (1-30 days ) and Intermediate (30-180 days) Dermal Exposure
Since there is no appropriate dermal studies, same as studies selected for short- and intermediate-term incidental oral exposure, the case reports of Franzblau and Lilis (Arch. of Envir. Health44(6): 385-390, 1989) and Mizuta et al. (Bull. Yamaguchi Med. Sch. 4(2-3): 131-149, 1956)were selceted for short (1-30 days ) and intermediate (30-180 days) term dermal exposurescenarios. The LOAEL of 0.05 mg/kg/day was selected, based on facial edema, gastrointestinalsymptoms, neuropathy, and skin lesions observed at this dose level. An Margin of Exposure(MOE) of 30 should be applied to the LOAEL. This value consists of a 10x factor forintraspecies variation and a 3x factor for extrapolating from a LOAEL to a NOAEL.
2.1.6 Long-Term Dermal Exposure
While no long-term dermal exposures are expected from residential exposure to arsenic in CCA-treated lumber, long-term dermal exposure is expected in the occupational setting. Thus, for thisexposure scenario, the dose and endpoint selected are the NOAEL of 0.0008 mg/kg/day from theTseng et al. (1968) study, which examined chronic non -cancer and cancer effects from arsenicexposure through well water in a large cohort in Taiwan.
In Taiwan, Tseng, (1977), Tseng, (1968) [U.S. EPA, 1998] noted that hyperpigmentation,keratosis and possible vascular complications were seen at the LOAEL of 0.17 mg/L, convertedto 0.014 mg/kg/day.
The NOAEL was based on the arithmetic mean of 0.009 mg/L in a range of arsenic concentrationof 0.001 to 0.017 mg/L. The NOAEL also included estimation of arsenic from food. Since oralarsenic exposure data were missing, arsenic concentrations in sweet potatoes and rice wereestimated as 0.002 mg/day. Other assumptions included consumption of 4.5 L water/day and 55kg body weight (Abernathy, (1989). Thus, the converted NOAEL = [(0.009 mg/L x 4.5 L/day) +0.002 mg/day]/55 kg = 0.0008 mg/kg/day. The LOAEL dose was estimated using the sameassumptions as the NOAEL starting with an arithmetic mean water concentration from Tseng,(1977) of 0.17 mg/L. LOAEL = [(0.17 mg/L x 4.5 L/day)+ 0.002 mg/day]/55 kg = 0.014mg/kg/day. Therefore the NOAEL = 0.0008 mg/kg and the LOAEL= 0.014 mg/kg/day (basedon hyperpigmentation, keratosis and possible vascular complications )
An MOE of 3 is applied to this risk assessment. A factor of 3 and not 10 is used based on thelarge sample size of the Tseng study (> 40,000) and is in agreement with the published value andrationale in the 1998 IRIS document on inorganic arsenic.
2.1.7 Short-, Intermediate-, and Long-term Inhalation Exposure
Short-, intermediate-, and long-term endpoints were not identified in the HIARC report forinhalation exposures to arsenic. Since no inhalation studies are available, committee selected thesame studies as for the dermal risk assessments. Since the dose identified for inhalation riskassessments are from oral studies, route-to-route extrapolation should be as follows:
26
Step I: The inhalation exposure component (i.e., g a.i./day) using a 100%(default) absorption rate and application rate should be converted to anequivalent oral dose (mg/kg/day);
Step II: The dermal exposure component (i.e., mg/kg/day) using 6.4 % absorptionfactor and application rate should be converted to an equivalent oral dose. The dose should be combined with the converted oral dose in Step I.
Step III:To calculate the MOE's, the combined dose from Step I and II should thenbe compared to the oral LOAEL of 0.05 mg/kg/day for short andintermediate term exposure and the oral NOAEL of 0.0008 mg/kg/day forlong-term exposure.
As discussed in endpoints selected for dermal exposure scenarios (Sections 2.1.5 and 2.1.6),acceptable Margin of Exposure (MOE) of 30 should be applied to the short- and intermediateinhalation scenarios. For long-term inhalation exposure scenarios, an acceptable margin ofexposure of 3 should be applied.
2.1.8 Carcinogenicity
There is sufficient evidence from human data indicating arsenic exposure can cause cancer. Anincreased lung cancer mortality was observed in multiple human populations exposed primarilythrough inhalation. Also, increased mortality from multiple internal organ cancers (liver, kidney,lung, and bladder) and increased incidences of skin cancer were observed in populationsconsuming drinking water high in inorganic arsenic. In order to evaluate the cancer riskassociated with arsenic exposure in drinking water, in 1997, at EPA's request, the NationalAcademy of Sciences' (NAS) Subcommittee on Arsenic of the Committee on Toxicology of theNational Research Council (NRC) met. Their charge was to review EPA's assessments of arsenic. The NAS/NRC Subcommittee finished their work in March 1999. In general, the NRC reportconfirms and extends concerns about human carcinogenicity of drinking water containing arsenicand offers perspective on dose-response issues and needed research. The NRC recommendedthat EPA analyze risks of internal cancers both separately and combined.
EPA applied many of the recommendations from the 1999 NRC report in the risk characterizationused to support the January 2001 revised arsenic drinking water regulation. In the riskassessment, EPA used risk estimates taken from Morales et al. (2000). Morales et al. fit a varietyof dose-response models to lung and bladder cancer data from an arseniasis-endemic region ofsouthwestern Taiwan. Risk was assumed to increase linearly with dose, from zero to the effectivedose (central estimate) at which 1% of population is affected by the chemical (ED01). The slopeof the line extrapolated from ED01 to the origin was calculated and used as the cancer slopefactor for cancer risk assessment (see Plot 1 as an example). In the risk assessment associatedwith inorganic arsenic in drinking water in 2000 (EPA,2001), EPA presented two sets of risk estimates, higher and lower:
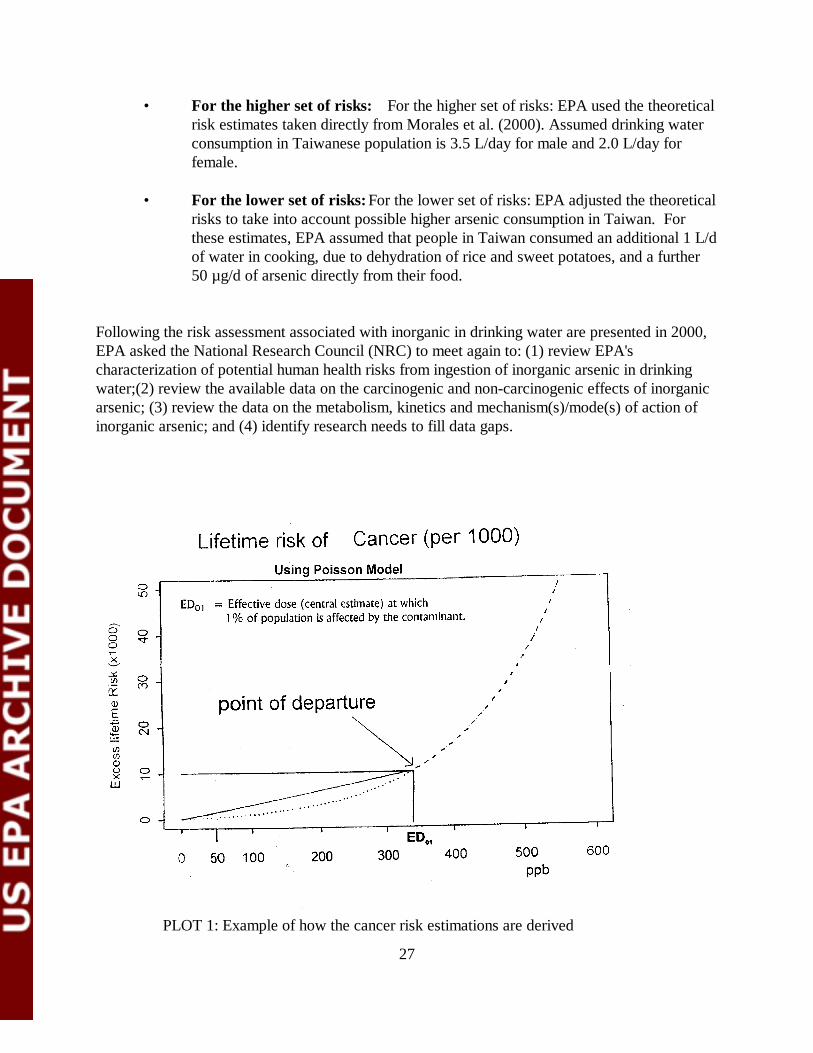
27
PLOT 1: Example of how the cancer risk estimations are derived
• For the higher set of risks: For the higher set of risks: EPA used the theoreticalrisk estimates taken directly from Morales et al. (2000). Assumed drinking waterconsumption in Taiwanese population is 3.5 L/day for male and 2.0 L/day forfemale.
• For the lower set of risks: For the lower set of risks: EPA adjusted the theoreticalrisks to take into account possible higher arsenic consumption in Taiwan. Forthese estimates, EPA assumed that people in Taiwan consumed an additional 1 L/dof water in cooking, due to dehydration of rice and sweet potatoes, and a further50 µg/d of arsenic directly from their food.
Following the risk assessment associated with inorganic in drinking water are presented in 2000,EPA asked the National Research Council (NRC) to meet again to: (1) review EPA'scharacterization of potential human health risks from ingestion of inorganic arsenic in drinkingwater;(2) review the available data on the carcinogenic and non-carcinogenic effects of inorganicarsenic; (3) review the data on the metabolism, kinetics and mechanism(s)/mode(s) of action ofinorganic arsenic; and (4) identify research needs to fill data gaps.
28
In 2001, NRC published an update to the 1999 NRC report and concluded that (1)arsenic- -induced bladder and lung cancers still should be the focus of an arsenic-related cancerrisk assessment; (2) the southwestern Taiwan data are still the most appropriate forarsenic-related cancer risk assessments; and (3) present modes of action data are not sufficient todepart from the default assumption of linearity. The 2001 NRC update also made specificrecommendations with respect to the overall cancer risk estimate.
The Agency is currently considering the best way to address all the NRC’s recommendations. Based on the Agency's considerations of these recommendations, the current proposed cancerpotency number may change in the final version of this risk assessment. For this risk assessment,an oral cancer slope factor of 3.67 (mg/kg/day)-1 was used. This is the mean slope factor derivedfrom the higher risk approach for both lung and bladder cancers. This slope factor was used bythe EPA’s Office of Water when it established the MCL for arsenic in drinking water (U.S. EPA,2001) and also by the Consumer Product Safety Commission when it performed its deterministicassessment for children’s risks from CCA-treated playsets in March 2003 (CPSC, 2003).
The slope factor published by EPA’s Integrated Risk Information System (IRIS), 1.5(mg/kg/day)-1 , is also being revisited in FY2003 due to the recommendation by the NRC in2001. If the Agency had used the current IRIS cancer slope factor (1.5 (mg/kg/day)-1 ) insteadof the slope factor used in the Office of Water’s arsenic MCL document (3.67(mg/kg/day)-1)(U.S. EPA, 2001), the cancer risk would be approximately 41% of the currentcancer risk estimates in this document . For example, a reported cancer risk of 5.0E-4 using thecancer slope factor of 3.67(mg/kg/day)-1 would be equivalent to 2.0E-4 using the IRIS cancerslope factor of 1.5 (mg/kg/day) -1.
For inhalation exposure route, in this risk assessment, the cancer endpoint is 4.3 x 10⁻³ ( g/m3)-1
which is equivalent to a cancer slope factor of 15.1 (mg/kg/day)-1 (EPA, 1989). All the EPAproposed Q1* are summarized in Table 3.
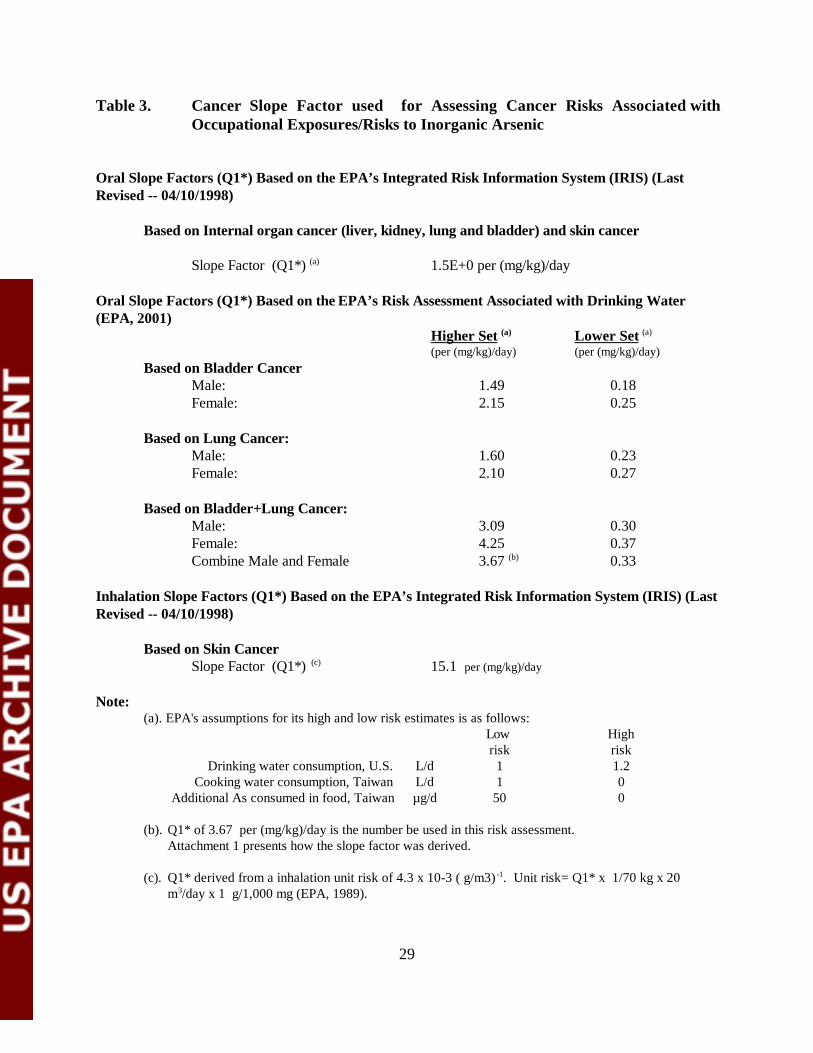
29
Table 3. Cancer Slope Factor used for Assessing Cancer Risks Associated withOccupational Exposures/Risks to Inorganic Arsenic
Oral Slope Factors (Q1*) Based on the EPA’s Integrated Risk Information System (IRIS) (LastRevised -- 04/10/1998)
Based on Internal organ cancer (liver, kidney, lung and bladder) and skin cancer
Slope Factor (Q1*) (a) 1.5E+0 per (mg/kg)/day
Oral Slope Factors (Q1*) Based on the EPA’s Risk Assessment Associated with Drinking Water(EPA, 2001)
Higher Set (a) Lower Set (a)
(per (mg/kg)/day) (per (mg/kg)/day)Based on Bladder Cancer
Male: 1.49 0.18 Female: 2.15 0.25
Based on Lung Cancer:Male: 1.60 0.23Female: 2.10 0.27
Based on Bladder+Lung Cancer:Male: 3.09 0.30Female: 4.25 0.37Combine Male and Female 3.67 (b) 0.33
Inhalation Slope Factors (Q1*) Based on the EPA’s Integrated Risk Information System (IRIS) (LastRevised -- 04/10/1998)
Based on Skin CancerSlope Factor (Q1*) (c) 15.1 per (mg/kg)/day
Note:(a). EPA's assumptions for its high and low risk estimates is as follows:
Low High risk risk
Drinking water consumption, U.S. L/d 1 1.2Cooking water consumption, Taiwan L/d 1 0
Additional As consumed in food, Taiwan µg/d 50 0
(b). Q1* of 3.67 per (mg/kg)/day is the number be used in this risk assessment.Attachment 1 presents how the slope factor was derived.
(c). Q1* derived from a inhalation unit risk of 4.3 x 10⁻³ ( g/m3) -1. Unit risk= Q1* x 1/70 kg x 20m3/day x 1 g/1,000 mg (EPA, 1989).
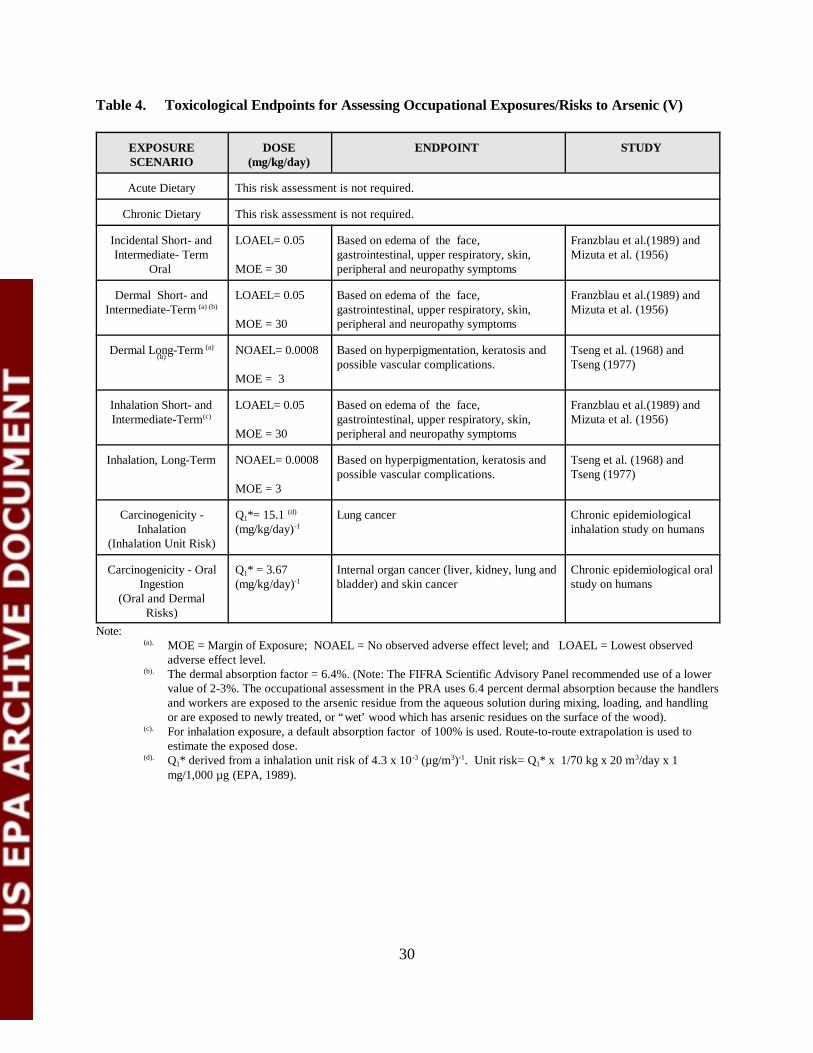
30
Table 4. Toxicological Endpoints for Assessing Occupational Exposures/Risks to Arsenic (V)
EXPOSURESCENARIO
DOSE(mg/kg/day)
ENDPOINT STUDY
Acute Dietary This risk assessment is not required.
Chronic Dietary This risk assessment is not required.
Incidental Short- andIntermediate- Term
Oral
LOAEL= 0.05
MOE = 30
Based on edema of the face, gastrointestinal, upper respiratory, skin,peripheral and neuropathy symptoms
Franzblau et al.(1989) andMizuta et al. (1956)
Dermal Short- andIntermediate-Term (a) (b)
LOAEL= 0.05
MOE = 30
Based on edema of the face, gastrointestinal, upper respiratory, skin,peripheral and neuropathy symptoms
Franzblau et al.(1989) andMizuta et al. (1956)
Dermal Long-Term (a)(b)
NOAEL= 0.0008
MOE = 3
Based on hyperpigmentation, keratosis andpossible vascular complications.
Tseng et al. (1968) andTseng (1977)
Inhalation Short- andIntermediate-Term (c)
LOAEL= 0.05
MOE = 30
Based on edema of the face, gastrointestinal, upper respiratory, skin,peripheral and neuropathy symptoms
Franzblau et al.(1989) andMizuta et al. (1956)
Inhalation, Long-Term NOAEL= 0.0008
MOE = 3
Based on hyperpigmentation, keratosis andpossible vascular complications.
Tseng et al. (1968) andTseng (1977)
Carcinogenicity -Inhalation
(Inhalation Unit Risk)
Q1*= 15.1 (d)
(mg/kg/day)-1Lung cancer Chronic epidemiological
inhalation study on humans
Carcinogenicity - OralIngestion
(Oral and DermalRisks)
Q1* = 3.67(mg/kg/day)-1
Internal organ cancer (liver, kidney, lung andbladder) and skin cancer
Chronic epidemiological oralstudy on humans
Note:(a). MOE = Margin of Exposure; NOAEL = No observed adverse effect level; and LOAEL = Lowest observed
adverse effect level.(b). The dermal absorption factor = 6.4%. (Note: The FIFRA Scientific Advisory Panel recommended use of a lower
value of 2-3%. The occupational assessment in the PRA uses 6.4 percent dermal absorption because the handlersand workers are exposed to the arsenic residue from the aqueous solution during mixing, loading, and handlingor are exposed to newly treated, or “wet’ wood which has arsenic residues on the surface of the wood).
(c). For inhalation exposure, a default absorption factor of 100% is used. Route-to-route extrapolation is used toestimate the exposed dose.
(d). Q1* derived from a inhalation unit risk of 4.3 x 10⁻³ (µg/m3)-1. Unit risk= Q1* x 1/70 kg x 20 m3/day x 1mg/1,000 µg (EPA, 1989).
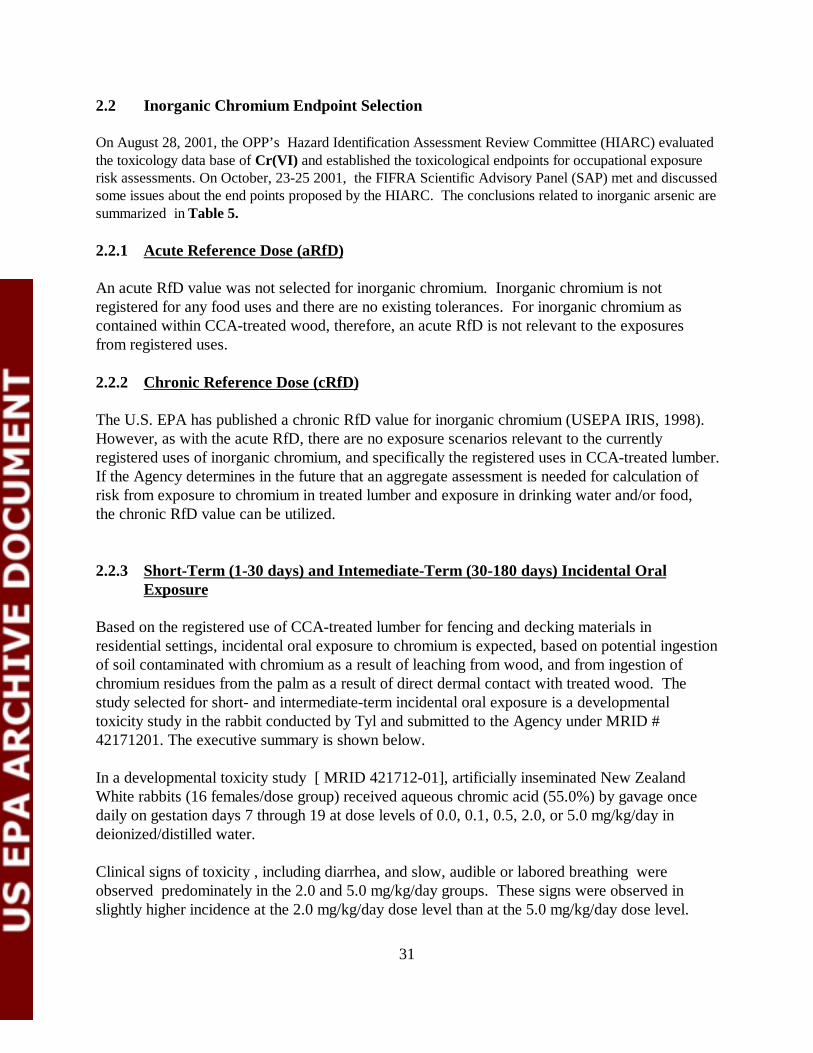
31
2.2 Inorganic Chromium Endpoint Selection
On August 28, 2001, the OPP’s Hazard Identification Assessment Review Committee (HIARC) evaluatedthe toxicology data base of Cr(VI) and established the toxicological endpoints for occupational exposurerisk assessments. On October, 23-25 2001, the FIFRA Scientific Advisory Panel (SAP) met and discussedsome issues about the end points proposed by the HIARC. The conclusions related to inorganic arsenic aresummarized in Table 5.
2.2.1 Acute Reference Dose (aRfD)
An acute RfD value was not selected for inorganic chromium. Inorganic chromium is notregistered for any food uses and there are no existing tolerances. For inorganic chromium ascontained within CCA-treated wood, therefore, an acute RfD is not relevant to the exposuresfrom registered uses.
2.2.2 Chronic Reference Dose (cRfD)
The U.S. EPA has published a chronic RfD value for inorganic chromium (USEPA IRIS, 1998). However, as with the acute RfD, there are no exposure scenarios relevant to the currentlyregistered uses of inorganic chromium, and specifically the registered uses in CCA-treated lumber.If the Agency determines in the future that an aggregate assessment is needed for calculation ofrisk from exposure to chromium in treated lumber and exposure in drinking water and/or food,the chronic RfD value can be utilized.
2.2.3 Short-Term (1-30 days) and Intemediate-Term (30-180 days) Incidental OralExposure
Based on the registered use of CCA-treated lumber for fencing and decking materials inresidential settings, incidental oral exposure to chromium is expected, based on potential ingestionof soil contaminated with chromium as a result of leaching from wood, and from ingestion ofchromium residues from the palm as a result of direct dermal contact with treated wood. Thestudy selected for short- and intermediate-term incidental oral exposure is a developmentaltoxicity study in the rabbit conducted by Tyl and submitted to the Agency under MRID #42171201. The executive summary is shown below.
In a developmental toxicity study [ MRID 421712-01], artificially inseminated New ZealandWhite rabbits (16 females/dose group) received aqueous chromic acid (55.0%) by gavage oncedaily on gestation days 7 through 19 at dose levels of 0.0, 0.1, 0.5, 2.0, or 5.0 mg/kg/day indeionized/distilled water.
Clinical signs of toxicity , including diarrhea, and slow, audible or labored breathing wereobserved predominately in the 2.0 and 5.0 mg/kg/day groups. These signs were observed inslightly higher incidence at the 2.0 mg/kg/day dose level than at the 5.0 mg/kg/day dose level.
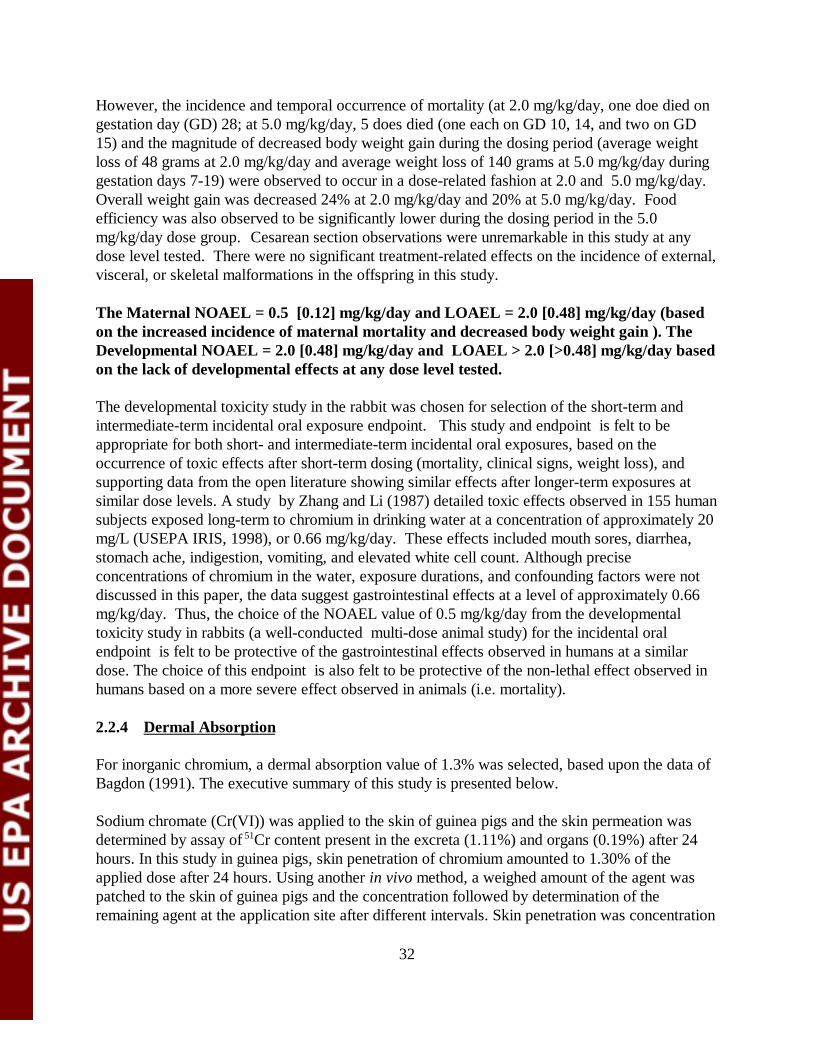
32
However, the incidence and temporal occurrence of mortality (at 2.0 mg/kg/day, one doe died ongestation day (GD) 28; at 5.0 mg/kg/day, 5 does died (one each on GD 10, 14, and two on GD15) and the magnitude of decreased body weight gain during the dosing period (average weightloss of 48 grams at 2.0 mg/kg/day and average weight loss of 140 grams at 5.0 mg/kg/day duringgestation days 7-19) were observed to occur in a dose-related fashion at 2.0 and 5.0 mg/kg/day. Overall weight gain was decreased 24% at 2.0 mg/kg/day and 20% at 5.0 mg/kg/day. Foodefficiency was also observed to be significantly lower during the dosing period in the 5.0mg/kg/day dose group. Cesarean section observations were unremarkable in this study at anydose level tested. There were no significant treatment-related effects on the incidence of external,visceral, or skeletal malformations in the offspring in this study.
The Maternal NOAEL = 0.5 [0.12] mg/kg/day and LOAEL = 2.0 [0.48] mg/kg/day (basedon the increased incidence of maternal mortality and decreased body weight gain ). TheDevelopmental NOAEL = 2.0 [0.48] mg/kg/day and LOAEL > 2.0 [>0.48] mg/kg/day basedon the lack of developmental effects at any dose level tested.
The developmental toxicity study in the rabbit was chosen for selection of the short-term and intermediate-term incidental oral exposure endpoint. This study and endpoint is felt to beappropriate for both short- and intermediate-term incidental oral exposures, based on theoccurrence of toxic effects after short-term dosing (mortality, clinical signs, weight loss), andsupporting data from the open literature showing similar effects after longer-term exposures atsimilar dose levels. A study by Zhang and Li (1987) detailed toxic effects observed in 155 humansubjects exposed long-term to chromium in drinking water at a concentration of approximately 20mg/L (USEPA IRIS, 1998), or 0.66 mg/kg/day. These effects included mouth sores, diarrhea,stomach ache, indigestion, vomiting, and elevated white cell count. Although preciseconcentrations of chromium in the water, exposure durations, and confounding factors were notdiscussed in this paper, the data suggest gastrointestinal effects at a level of approximately 0.66mg/kg/day. Thus, the choice of the NOAEL value of 0.5 mg/kg/day from the developmentaltoxicity study in rabbits (a well-conducted multi-dose animal study) for the incidental oralendpoint is felt to be protective of the gastrointestinal effects observed in humans at a similardose. The choice of this endpoint is also felt to be protective of the non-lethal effect observed inhumans based on a more severe effect observed in animals (i.e. mortality).
2.2.4 Dermal Absorption
For inorganic chromium, a dermal absorption value of 1.3% was selected, based upon the data ofBagdon (1991). The executive summary of this study is presented below.
Sodium chromate (Cr(VI)) was applied to the skin of guinea pigs and the skin permeation wasdetermined by assay of 51Cr content present in the excreta (1.11%) and organs (0.19%) after 24hours. In this study in guinea pigs, skin penetration of chromium amounted to 1.30% of theapplied dose after 24 hours. Using another in vivo method, a weighed amount of the agent waspatched to the skin of guinea pigs and the concentration followed by determination of theremaining agent at the application site after different intervals. Skin penetration was concentration
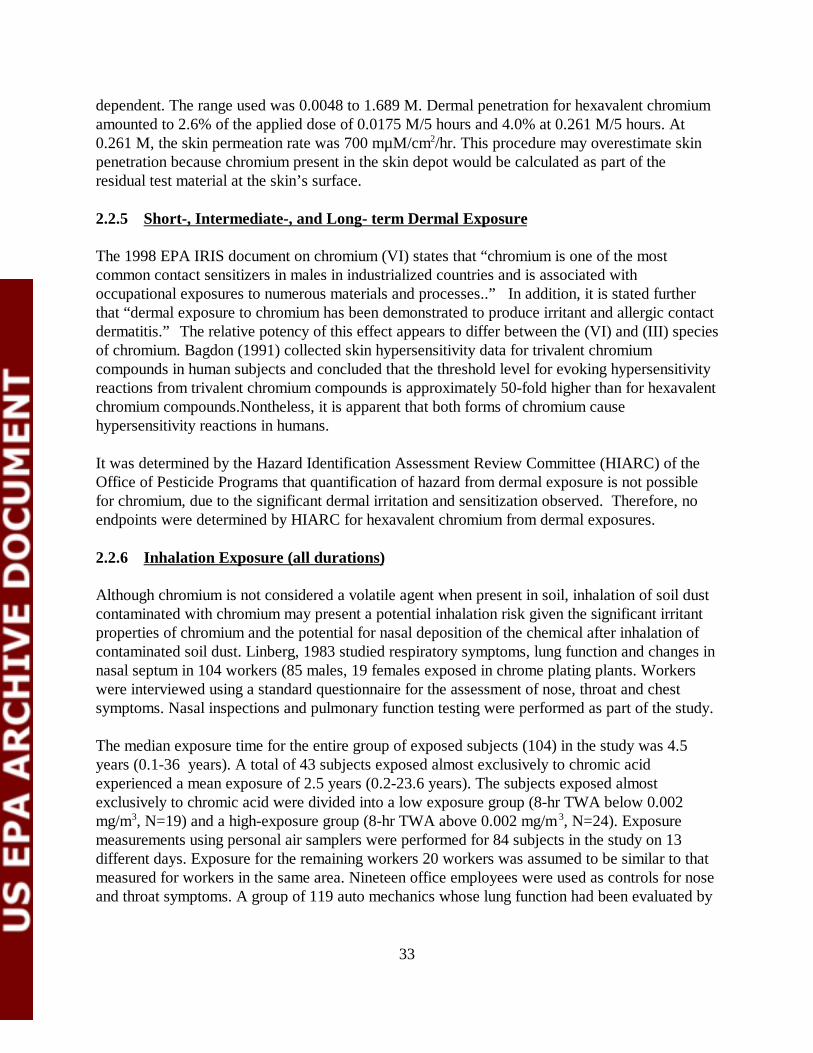
33
dependent. The range used was 0.0048 to 1.689 M. Dermal penetration for hexavalent chromiumamounted to 2.6% of the applied dose of 0.0175 M/5 hours and 4.0% at 0.261 M/5 hours. At0.261 M, the skin permeation rate was 700 mµM/cm2/hr. This procedure may overestimate skinpenetration because chromium present in the skin depot would be calculated as part of theresidual test material at the skin’s surface.
2.2.5 Short-, Intermediate-, and Long- term Dermal Exposure
The 1998 EPA IRIS document on chromium (VI) states that “chromium is one of the mostcommon contact sensitizers in males in industrialized countries and is associated withoccupational exposures to numerous materials and processes..” In addition, it is stated furtherthat “dermal exposure to chromium has been demonstrated to produce irritant and allergic contactdermatitis.” The relative potency of this effect appears to differ between the (VI) and (III) speciesof chromium. Bagdon (1991) collected skin hypersensitivity data for trivalent chromiumcompounds in human subjects and concluded that the threshold level for evoking hypersensitivityreactions from trivalent chromium compounds is approximately 50-fold higher than for hexavalentchromium compounds.Nontheless, it is apparent that both forms of chromium causehypersensitivity reactions in humans.
It was determined by the Hazard Identification Assessment Review Committee (HIARC) of theOffice of Pesticide Programs that quantification of hazard from dermal exposure is not possiblefor chromium, due to the significant dermal irritation and sensitization observed. Therefore, noendpoints were determined by HIARC for hexavalent chromium from dermal exposures.
2.2.6 Inhalation Exposure (all durations)
Although chromium is not considered a volatile agent when present in soil, inhalation of soil dustcontaminated with chromium may present a potential inhalation risk given the significant irritantproperties of chromium and the potential for nasal deposition of the chemical after inhalation ofcontaminated soil dust. Linberg, 1983 studied respiratory symptoms, lung function and changes innasal septum in 104 workers (85 males, 19 females exposed in chrome plating plants. Workerswere interviewed using a standard questionnaire for the assessment of nose, throat and chestsymptoms. Nasal inspections and pulmonary function testing were performed as part of the study.
The median exposure time for the entire group of exposed subjects (104) in the study was 4.5years (0.1-36 years). A total of 43 subjects exposed almost exclusively to chromic acidexperienced a mean exposure of 2.5 years (0.2-23.6 years). The subjects exposed almostexclusively to chromic acid were divided into a low exposure group (8-hr TWA below 0.002mg/m3, N=19) and a high-exposure group (8-hr TWA above 0.002 mg/m 3, N=24). Exposuremeasurements using personal air samplers were performed for 84 subjects in the study on 13different days. Exposure for the remaining workers 20 workers was assumed to be similar to thatmeasured for workers in the same area. Nineteen office employees were used as controls for noseand throat symptoms. A group of 119 auto mechanics whose lung function had been evaluated by
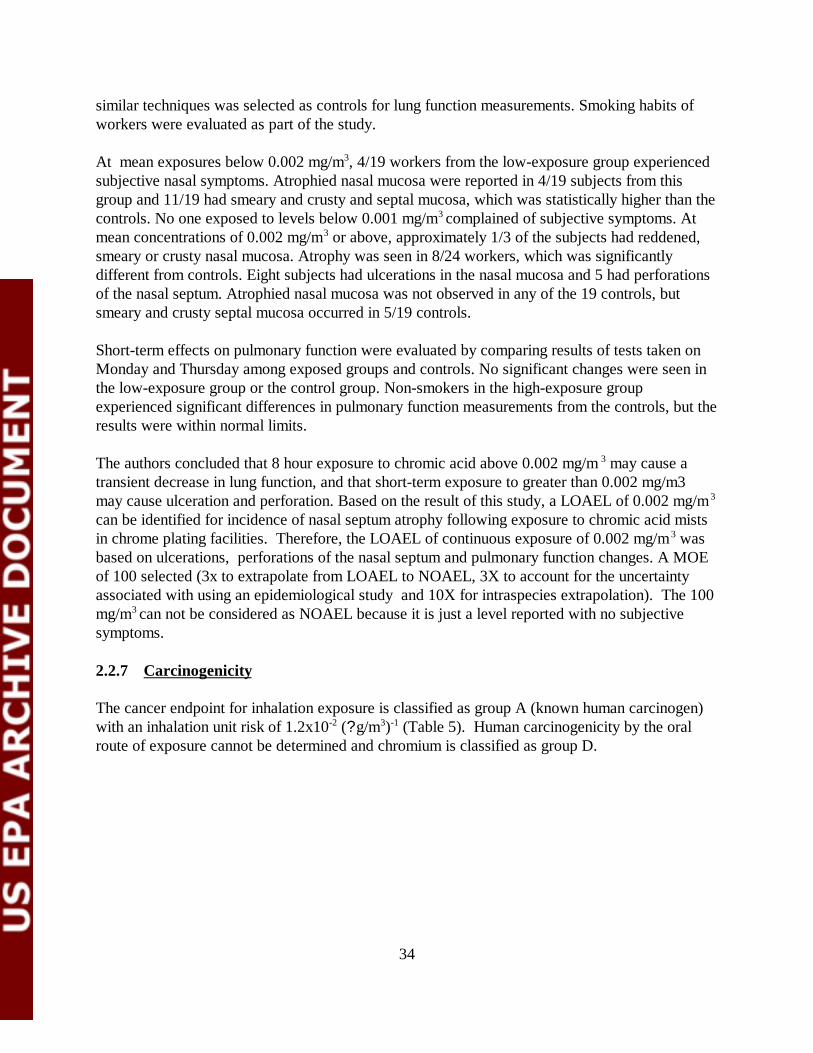
34
similar techniques was selected as controls for lung function measurements. Smoking habits ofworkers were evaluated as part of the study.
At mean exposures below 0.002 mg/m3, 4/19 workers from the low-exposure group experiencedsubjective nasal symptoms. Atrophied nasal mucosa were reported in 4/19 subjects from thisgroup and 11/19 had smeary and crusty and septal mucosa, which was statistically higher than thecontrols. No one exposed to levels below 0.001 mg/m3 complained of subjective symptoms. Atmean concentrations of 0.002 mg/m3 or above, approximately 1/3 of the subjects had reddened,smeary or crusty nasal mucosa. Atrophy was seen in 8/24 workers, which was significantlydifferent from controls. Eight subjects had ulcerations in the nasal mucosa and 5 had perforationsof the nasal septum. Atrophied nasal mucosa was not observed in any of the 19 controls, butsmeary and crusty septal mucosa occurred in 5/19 controls.
Short-term effects on pulmonary function were evaluated by comparing results of tests taken onMonday and Thursday among exposed groups and controls. No significant changes were seen inthe low-exposure group or the control group. Non-smokers in the high-exposure groupexperienced significant differences in pulmonary function measurements from the controls, but theresults were within normal limits.
The authors concluded that 8 hour exposure to chromic acid above 0.002 mg/m 3 may cause atransient decrease in lung function, and that short-term exposure to greater than 0.002 mg/m3may cause ulceration and perforation. Based on the result of this study, a LOAEL of 0.002 mg/m 3
can be identified for incidence of nasal septum atrophy following exposure to chromic acid mistsin chrome plating facilities. Therefore, the LOAEL of continuous exposure of 0.002 mg/m 3 was based on ulcerations, perforations of the nasal septum and pulmonary function changes. A MOEof 100 selected (3x to extrapolate from LOAEL to NOAEL, 3X to account for the uncertaintyassociated with using an epidemiological study and 10X for intraspecies extrapolation). The 100mg/m3 can not be considered as NOAEL because it is just a level reported with no subjectivesymptoms.
2.2.7 Carcinogenicity
The cancer endpoint for inhalation exposure is classified as group A (known human carcinogen)with an inhalation unit risk of 1.2x10⁻² (?g/m3)-1 (Table 5). Human carcinogenicity by the oralroute of exposure cannot be determined and chromium is classified as group D.
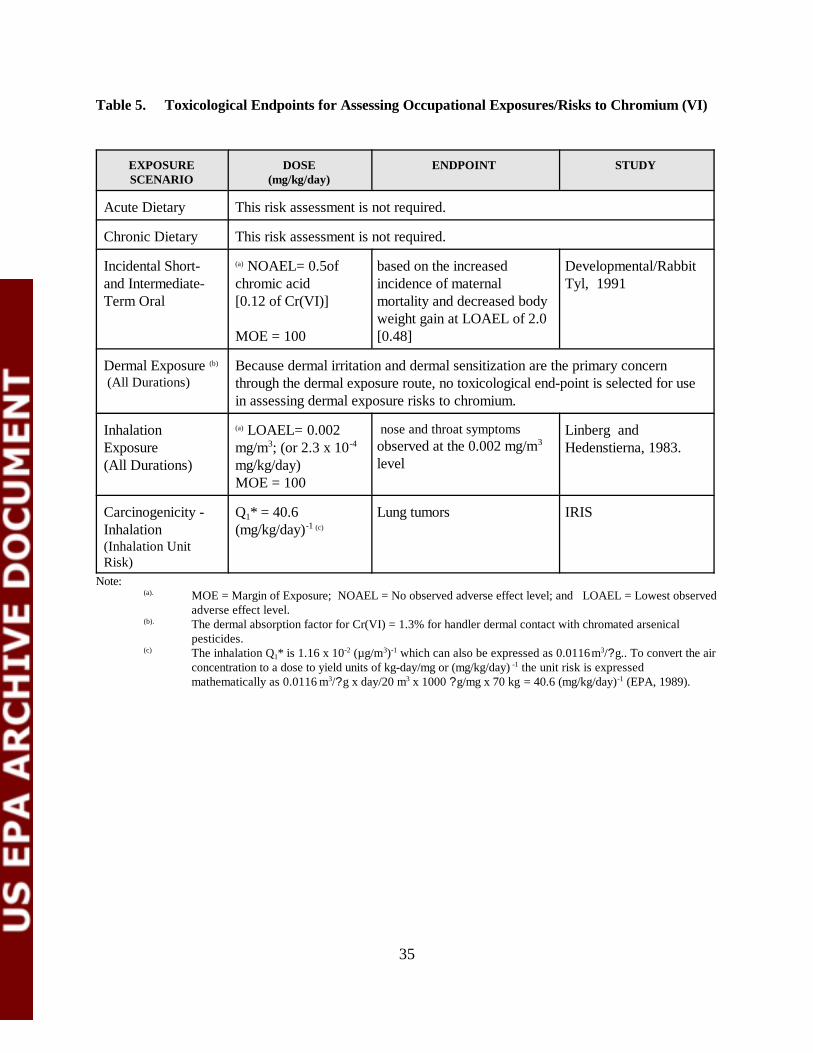
35
Table 5. Toxicological Endpoints for Assessing Occupational Exposures/Risks to Chromium (VI)
EXPOSURESCENARIO
DOSE(mg/kg/day)
ENDPOINT STUDY
Acute Dietary This risk assessment is not required.
Chronic Dietary This risk assessment is not required.
Incidental Short-and Intermediate-Term Oral
(a) NOAEL= 0.5ofchromic acid [0.12 of Cr(VI)]
MOE = 100
based on the increasedincidence of maternalmortality and decreased bodyweight gain at LOAEL of 2.0[0.48]
Developmental/RabbitTyl, 1991
Dermal Exposure (b)
(All Durations)Because dermal irritation and dermal sensitization are the primary concernthrough the dermal exposure route, no toxicological end-point is selected for usein assessing dermal exposure risks to chromium.
InhalationExposure(All Durations)
(a) LOAEL= 0.002mg/m3; (or 2.3 x 10⁻⁴
mg/kg/day)MOE = 100
nose and throat symptomsobserved at the 0.002 mg/m3
level
Linberg andHedenstierna, 1983.
Carcinogenicity -Inhalation(Inhalation UnitRisk)
Q1* = 40.6(mg/kg/day)-1 (c)
Lung tumors IRIS
Note:(a). MOE = Margin of Exposure; NOAEL = No observed adverse effect level; and LOAEL = Lowest observed
adverse effect level.(b). The dermal absorption factor for Cr(VI) = 1.3% for handler dermal contact with chromated arsenical
pesticides.(c) The inhalation Q1* is 1.16 x 10⁻² (µg/m3)-1 which can also be expressed as 0.0116 m3/?g.. To convert the air
concentration to a dose to yield units of kg-day/mg or (mg/kg/day) -1 the unit risk is expressedmathematically as 0.0116 m3/?g x day/20 m3 x 1000 ?g/mg x 70 kg = 40.6 (mg/kg/day)-1 (EPA, 1989).

36
3.0 REFERENCES
Aiyar J, Borges K, Floyd RA, et al. 1989. Role of chromium(V), glutathione thiyl radical andhydroxyl radical intermediates in chromium(VI)-induced DNA damage. Toxicol EnvironChem 22:135-148.
Amdur, MO; Doull, J; Klaassen, CD. (1993) Casarett and Doull’s Toxicology. New York:McGraw Hill.
ATSDR (2000a). Toxicological Profile for Arsenic.: U.S. Department of Health and HumanServices, Public Health Service.
ATSDR (2000b): Toxicological Profile for Chromium. U.S. Department of Health and HumanServices, Public Health Service.
*Author not stated. 1985 Acute Oral Toxicity Study, Bio/dynamics, Inc. Project 5465-84. May30, 1985. Data Accession No. 26356. Unpublished.
*Author not stated. 1984. Acute Dermal Toxicity Study, Bio/dynamics Inc. Project 5466-84.Nov, 1984. Data Accession No. 26356. Unpublished.
*Author not stated. 1984. Primary Eye Irritation Study, Bio/dynamics, Inc. Project 5468-84.April 24, 1984. Data Accession No. 26356. Unpublished.
*Author not stated. 1984. Primary Dermal Irritation Study, Bio/dynamics, Inc. Project 5467-84.April 18, 1985. Data Accession No. 26356. Unpublished.
Baetjer, AM; Lowney, JF; Steffee, H; et al. (1959) Effect of chromium on incidence of lungtumors in mice and rats. Arch Ind Health 20:124-135.
Bagdon, R.E. and Hazen, R.E. (1991): Skin Permeation and Cutaneous Hypersensitivity as aBasis for Making Risk Assessments of Chromium As a Soil Contaminant. Env. Hlth.Perspec. 92: 111-119.
Bertolero F, Pozzi G, Sabbioni E, et al. 1987. Cellular uptake and metabolic reduction ofpentavalent to trivalent arsenic as determinants of cytotoxicity and morphologicaltransformation. Carcinogenesis 8:803-808.
Bishop, C; Surgenor, M, eds. (1964) The red blood cell: a comprehensive treatise. New York:Academic Press.
Bryson WG, Goodall CM. 1983. Differential toxicity and clearance kinetics of chromium(III) or(VI) in mice. Carcinogenesis 4(12):1535-1539.
37
Chowdhury AR, Mitra C. 1995. Spermatogenic and steroidogenic impairment after chromiumtreatment in rats. Indian J Exp Biol 33:480-484.
Cohen, Y., Winer, A.M., Creelman, L., and Mabuni, C. 1999.A Critical Assessment of Chromiumin the Environment. Critical Rev. in Environmental Science and Technology 29(1): 1-46.
CPSC, 2003. Briefing Package. Petition to Ban Chromated Copper Arsenate (CCA)-TreatedWood in Playground Equipment (Petition HP 01-3). February 2003.
De Flora S, Badolati GS, Serra D, et al. 1987a. Circadian reduction of chromium in the gastric environment. Mutat Res 192:169-174.
Donaldson DL, Smith CC, and Yunice AA. 1984. Renal excretion of chromium-51 chloride in thedog. Am J Physiol 246:F870-F878.
Donaldson RM and Barreras RF. 1966. Intestinal absorption of trace quantities of chromium. JLab Clin Med 68:484-493.
Federal Register, May 6, 1993, Vol 58, p. 26975, [as cited in Federal Register, Vol 58, No234/Wednesday, Dec. 8, 1993/Notices, p. 64580-64582]
Fishbein L. 1981. Sources, transport and alterations of metal compounds: An overview. I.Arsenic,beryllium, cadmium, chromium and nickel. Environ Health Perspect 40:43-64.
Franzblau, A. and Lilis, R. 1989. Acute Arsenic Intoxication from Environmental ArsenicExposure. Archives of Envir. Health 44(6). 385-390.
Freeman, GB., Johnson, J.D., Killinger, J.M., Liao, S.C., Davis, A.O., Ruby, M.V., Chaney, R.L.,Lovre, S.C., and Bergstrom, P.D. 1993. Bioavailability of Arsenic in Soil Impacted bySmelter Activities Following Oral Administration in Rabbits. Fundamental and AppliedToxicology 21:83-88
Freeman, G.B., Schoof, R.A., Ruby, M.V., Davis, A.O., Dill, J.A., Liao, S.C., Lapin, C.A., andBergstrom, P.D. 1995. Bioavailability of Arsenic in Soil and House Dust Impacted bySmelter Activities Following Oral Administration in Cynomologus Monkeys. Fundamental and Applied Toxicology 28:215-222
Gibson DP, Brauninger R, Shaffi HS, et al. 1997. Induction of micronuclei in Syrian hamsterembryocells: comparison of results in the SHE cell transformation assay for nationaltoxicology program test chemicals. Mutat Res 392(1-2):61-70.
Groen, K., Vaesen, H.A.G., Klest, J.I.G. deBar, J.L.M., von Ooik, T. Timmerman, A. and Vlug,R.G. 1993. Bioavailability of Inorganic Arsenic from Bog Ore-Containing Soil in theDog. Environmental Health Perspective 102: 182-184.
38
Henderson RF, Rebar AH, Pickrell JA, et al. 1979. Early damage indicators in the lung. III. Biochemical and cytological response of the lung to inhaled metal salts. Toxicol ApplPharmacol 50:123-136.
Hopenhayn-Rich et al., 1998: Lung and Kidney Cancer Mortality Associated with Arsenic inDrinking Water in Cordoba, Argentina. Epidemiology 27: 561-569.
Hopenhayn-Rich et al., 2000: Chronic Arsenic Exposure and Risk of Infant Mortality in TwoAreas of Chile. Env. Hlth. Perspec. 108: 667-673, July 2000.
Hopenhayn, C, Ferreccio, C, Browning, SR, Huang, B. et al. (2003) Arsenic Exposure fromDrinking Water and Birth Weight. Epidemiology 14:593-602.
Hueper, WC; Payne, WW. (1962) Experimental studies in metal carcinogenesis--Chromium,nickel, iron, arsenic. Arch Environ Health 5:445-462.
International Agency for Research on Cancer (IARC). 1990. IARC monographs on the evaluationof the carcinogenic risk of chemicals to humans. Vol. 49. Some metals and metalliccompounds. Lyon, France: World Health Organization.
IRIS. 2000. Chromium VI. Integrated Risk Information System. U.S. EnvironmentalProtectionAgency, Office of Health and Environmental Assessment, EnvironmentalCriteria and Assessment Office, Cincinnati, OH.
Ivankovic, S; Preussman, R. 1975. Absence of toxic and carcinogenic effects after administrationsof high doses of chronic oxide pigment in subacute and long term feeding experiments inrats. Food Cosmet Toxicol 13:347-351.
Jennette KW. 1982. Microsomal reduction of the carcinogen chromate produced chromium(V). JAm Chem Soc 104:874-875.
Junaid M, Murthy RC, Saxena DK. 1996a. Embryo- and fetotoxicity of chromium inpregestationally exposed mice. Bull Environ Contam Toxicol 57:327-334.
Kanojia RK, Junaid M, Murthy RC. 1996. Chromium induced teratogenicity in female rat.ToxicolLett 89:207-213.
Kenyon, E.M. and Hughes, M.F. 2001.: A concise review of the toxicity and carcinogenicity ofdimethylarsinic acid. Toxicology 160: 227-236.
39
Kochhar TS, Howard W, Hoffman S, et al. 1996. Effect of trivalent and pentavalent arsenic incausing chromosome alterations in cultured Chinese hamster ovary (CHO) cells. ToxicolLett 84(1):37-42.
Lerman S, Clarkson TW, Gerson RJ. 1983. Arsenic uptake and metabolism by liver cells isdependent on arsenic oxidation state. Chem Biol Interact 45:401-406.
Larramendy ML, Popescu NC, DiPaolo J. 1981. Induction by inorganic metal salts of sisterchromatid exchanges and chromosome aberrations in human and Syrian hamster strains.Environ Mutagen 3:597-606.
Lebow, S. 1996. Leaching of Wood Preservative Components and their Mobility in theEnvironment- Summary of Pertinent Literature. Gen. Tech. Rep. FPL-GTR-93. Madison,WI: U.S. Department of Agriculture, Forest Service, Forest Products Laboratory, 36 p.
Lee, T-C, et al. 1985. Comparison of arsenic-induced cell transformation, cytotoxicity, mutation,and cytogenetic effects in Syrian hamster embryo cells in culture. Carcinogenesis 6(10):1421-1426.
Levy, LS; Venitt, S. 1975. Carcinogenic and mutagenic activity of chromium-containingmaterials. Br J Cancer 32:254-255.
Levy, LS; Martin, PA. 1983. The effects of a range of chromium-containing materials on rat lung.Dye Color Manufacturers Association.
Maruyama, Y.(1982): The health effect of mice given oral administration of trivalent andhexavalent chromium over a long term. Acta Scholae Medicinalis Universitatis in Gifu31:24-36.
Mass, M.J. et al. 2001.: Methylated Trivalent Arsenic Species are Genotoxic. Chem. Res.Toxicol. 14: 355-361.
Mizuta, N, Mizuta, et al. 1956. An Outbreak of Acute Arsenic Poisoning Caused by Arsenic-Containing Soy-Sauce (Shoyu). A Clinical Report of 220 Cases. Bull Yamaguchi MedSch 4(2-3):131-149.
Moore MM, Harrington-Brock K, Doerr CL. 1997. Relative genotoxic potency of arsenic and itsmethylated metabolites. Mutat Res 386(3):279-290.
Morales, K. H.; Ryan, L.; Kuo, T.; Wu, M.; and Chen, C.. 2000. Risk of Internal Cancers fromArsenic in Drinking Water. Environ. Health Perspect 108:655-661.
National Research Council: Arsenic in Drinking Water: 2001 Update. September, 2001, NationalAcademy Press, Washington, D.C.
40
National Toxicology Program (NTP). 1996. Final report on the reproductive toxicity ofpotassium dichromate (hexavalent)(CAS No. 7778-50-9) administered in diet to SD rats.Dec. 16, 1996. U.S. Department of Commerce, National Technical Information Service,PB97125355.
National Toxicology Program (NTP). 1997a. Final report on the reproductive toxicity ofpotassium dichromate (hexavalent) (CAS No. 7778-50-9) administered in diet to BALB/Cmice. Jan 10, 1997. U.S. Department of Commerce, National Technical InformationService, PB97125363.
NTP, Public Health Service, U.S. Department of Health and Human Services. 1997. Final report.Potassium dichromate (hexavalent): reproductive assessment by continuous breeding whenadministered to BALB/c mice in the diet. February 18, 1997. Available from: NationalInstitute of Environmental Health Sciences, Research Triangle Park, NC.
NRC (National Research Council). 1999. Arsenic in Drinking Water. National Academy Press,Washington, D.C.
Oberly TJ, Piper CE, McDonald DS. 1982. Mutagenicity of metal salts in the L5178Y mouselymphoma assay. J Toxicol Environ Health 9:367-376.
Rossman, T.G. et al. 1980.: Absence of arsenite mutagenicity in E. coli and Chinese hamster cells. Environ. Mut. 2: 371-379.
Sayato Y, Nakamuro K, Matsui S, et al. 1980. Metabolic fate of chromium compounds. I. Comparative behavior of chromium in rat administered with Na2
51CrO4 and 51CrCl3. JPharm Dyn 3:17-23.
Schroeder, HA; Balassa, JJ; Vinton, WH, Jr. 1965. Chromium, cadmium and lead in rats: effectson lifespan, tumors, and tissue levels. J Nutr 86:51-66.
Suzuki Y, Fukuda K. 1990. Reduction of hexavalent chromium by ascorbic acid and glutathionewith special reference to the rat lung. Arch Toxicol 64:169-176.
Towill, LE; Shriner, CR; Drury, JS; et al. 1978. Reviews of the environmental effects ofpollutants. III. Chromium. Prepared by the Health Effects Research Laboratory, OfficeofResearch and Development, U.S. Environmental Protection Agency, Cincinnati, OH.Report No. ORNL/EIS-80. EPA 600/1-78-023. NTIS PB 282796.
Trivedi B, Saxena DK, Murthy RC, et al. 1989. Embryotoxicity and fetotoxicity of orallyadministered hexavalent chromium in mice. Reprod Toxicol 3:275-278.
41
Tseng, W.P., H.M. Chu, S.W. How, J.M. Fong, C.S. Lin, and S. Yeh. 1968. Prevalence of skincancer in an endemic area of chronic arsenicism in Taiwan. J. Natl. Cancer Inst.40:453-463.
Tseng W-P. 1977. Effects and dose-response relationships of skin cancer and Blackfoot diseasewith arsenic. Environ Health Perspect 19:109-119.
USEPA. Bioavailability of Arsenic and Lead in Environmental Substrates. 1. Results of an OralDosing Study of Immature Swine. Superfund/Office of Environmental Assessment,Region 10, EPA 910/R-96-002, 1996.
USEPA. 2001. National Primary Drinking Water Regulation; Arsenic and Clarifications toCompliance and New Source Contaminants Monitoring; Final Rule. Federal Register. Vol. 66, No. 14. p. 6975, January 22, 2001.
USEPA Region 8, 2001: Derivation of Acute and Subchronic Oral Reference Doses for InorganicArsenic.
USEPA, IRIS, Chromium (VI), 1998; CASRN 18540-29-9, 9/3/1998 .
Waalkes, MP; Ward, JM; Liu, J. and Diawan, BA. 2003. Transplacental carcinogenicity ofInorganic Arsenic in the Drinking Water: Induction of Hepatic, Ovarian, Pulmary, andAdrenal Tumors in Mice. Toxicology and Applied Pharmacology: 186:7-17.
Wiegand, HJ; Ottenwalder, H; Bolt, HM. 1985. Fast uptake kinetics in vitro of 51 Cr(VI) by redblood cells of man and rat. Arch Toxicol 57:31-34.
Wester, R.C., Maibach, H.I., Sedik, L. Melendres, J., and Wader, M. 1993. In Vivo and in VitroPercutaneous Absorption and Skin Decontamination of Arsenic From Water and Soil.Fundamental and Applied Toxicology 20:336-340
Williams, T.W. : Rawlins, B.G.; Smith, B.; and Breward, N. 1998. In-Vitro Determination ofArsenic Bioavailability in Contaminated Soil and Mineral Benefication Waste from RonPhibun, Southern Thailand: A Basis for Improved Human Risk Assessment. Environmental Geochemistry and Health: 20
Witmer, C.M, Harris R and Shupack SI. 1991. Oral bioavailability of chromium from a specificsite. Environ Health Perspect 92:105-110.
Zahid,Z.R., Al-Hakkak ZS, Kadhim AHH, et al. 1990. Comparative effects of trivalent andhexavalent chromium on spermatogenesis of the mouse. Toxicol Environ Chem 25:131-136.
Attachment 1
US EPA�s Risk Assessment for Arsenic in Drinking Water
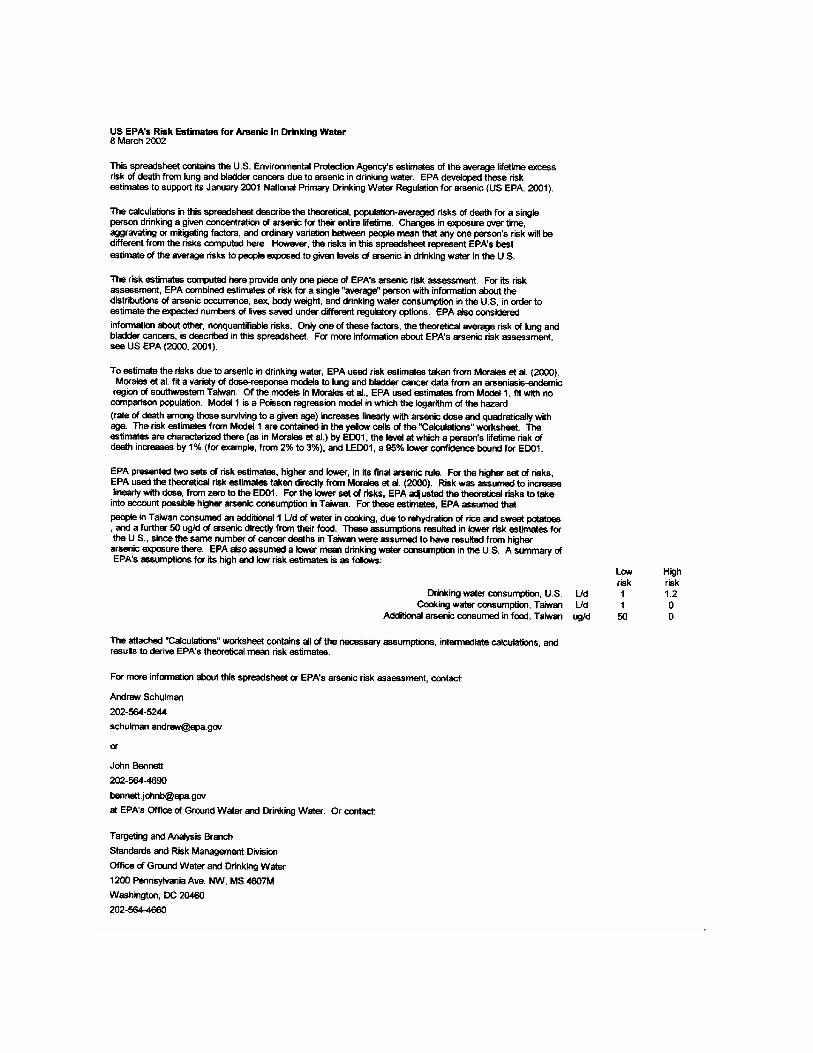
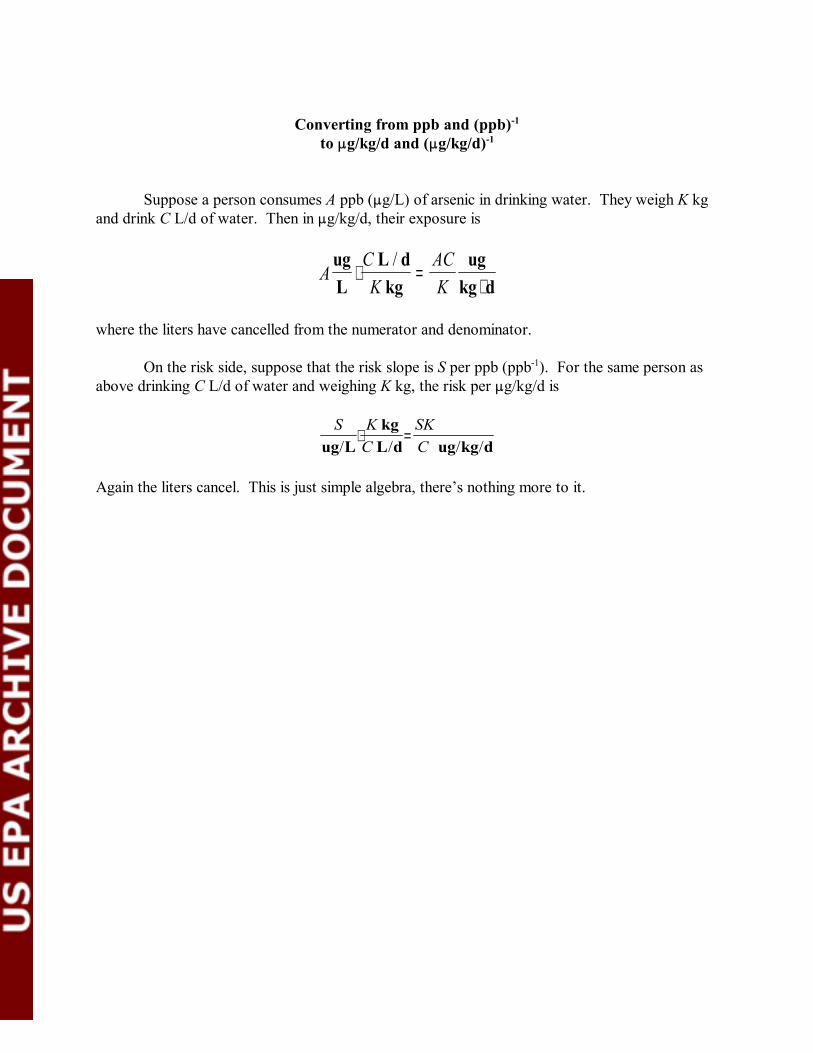
Converting from ppb and (ppb)-1
to :g/kg/d and (:g/kg/d)-1
Suppose a person consumes A ppb (:g/L) of arsenic in drinking water. They weigh K kgand drink C L/d of water. Then in :g/kg/d, their exposure is
ACK
ACK
ugL
L dkg
ugkg d
⋅ =⋅
/
where the liters have cancelled from the numerator and denominator.
On the risk side, suppose that the risk slope is S per ppb (ppb-1). For the same person asabove drinking C L/d of water and weighing K kg, the risk per :g/kg/d is
S KC
SKCug L
kgL d ug kg d/ / / /
⋅ =
Again the liters cancel. This is just simple algebra, there�s nothing more to it.
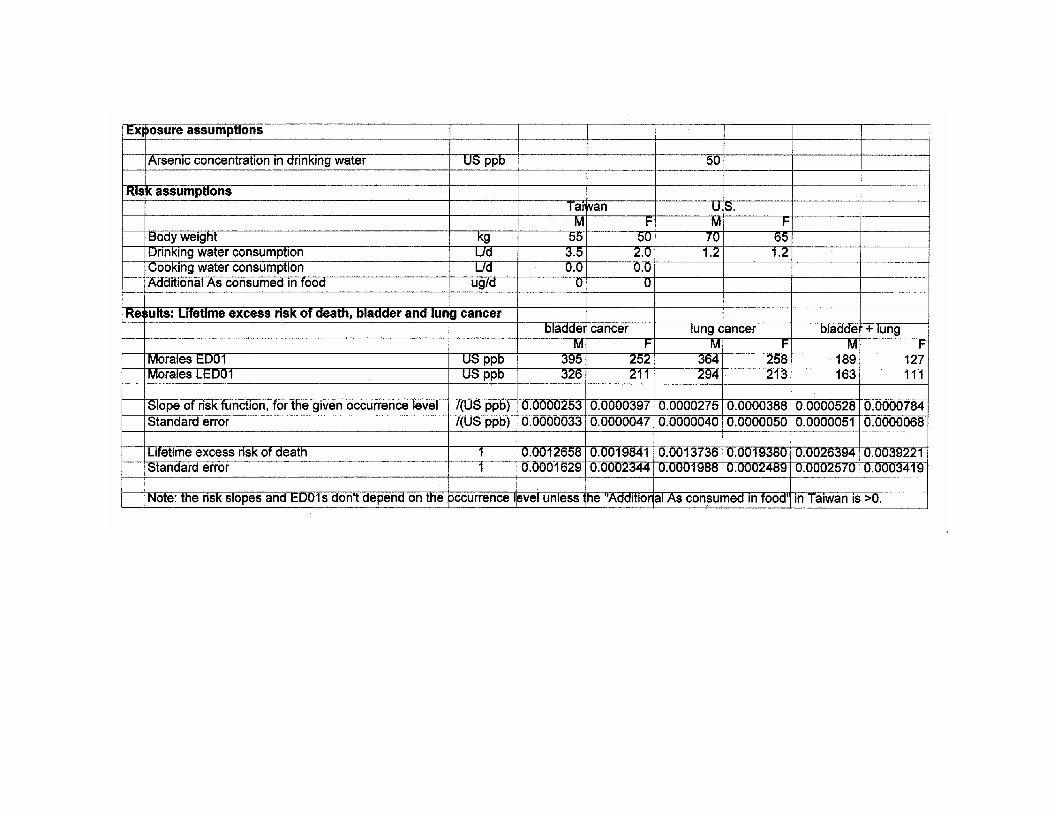

30
3.0 REFERENCES
Aiyar J, Borges K, Floyd RA, et al. 1989. Role of chromium(V), glutathione thiyl radical andhydroxyl radical intermediates in chromium(VI)-induced DNA damage. Toxicol EnvironChem 22:135-148.
Amdur, MO; Doull, J; Klaassen, CD. (1993) Casarett and Doull’s Toxicology. New York:McGraw Hill.
ATSDR (2000a). Toxicological Profile for Arsenic.: U.S. Department of Health and HumanServices, Public Health Service.
ATSDR (2000b): Toxicological Profile for Chromium. U.S. Department of Health and HumanServices, Public Health Service.
*Author not stated. 1985 Acute Oral Toxicity Study, Bio/dynamics, Inc. Project 5465-84. May30, 1985. Data Accession No. 26356. Unpublished.
*Author not stated. 1984. Acute Dermal Toxicity Study, Bio/dynamics Inc. Project 5466-84.Nov, 1984. Data Accession No. 26356. Unpublished.
*Author not stated. 1984. Primary Eye Irritation Study, Bio/dynamics, Inc. Project 5468-84.April 24, 1984. Data Accession No. 26356. Unpublished.
*Author not stated. 1984. Primary Dermal Irritation Study, Bio/dynamics, Inc. Project 5467-84.April 18, 1985. Data Accession No. 26356. Unpublished.
Baetjer, AM; Lowney, JF; Steffee, H; et al. (1959) Effect of chromium on incidence of lungtumors in mice and rats. Arch Ind Health 20:124-135.
Bagdon, R.E. and Hazen, R.E. (1991): Skin Permeation and Cutaneous Hypersensitivity as aBasis for Making Risk Assessments of Chromium As a Soil Contaminant. Env. Hlth.Perspec. 92: 111-119.
Bertolero F, Pozzi G, Sabbioni E, et al. 1987. Cellular uptake and metabolic reduction ofpentavalent to trivalent arsenic as determinants of cytotoxicity and morphologicaltransformation. Carcinogenesis 8:803-808.
Bishop, C; Surgenor, M, eds. (1964) The red blood cell: a comprehensive treatise. New York:Academic Press.
Bryson WG, Goodall CM. 1983. Differential toxicity and clearance kinetics of chromium(III) or(VI) in mice. Carcinogenesis 4(12):1535-1539.
31
Chowdhury AR, Mitra C. 1995. Spermatogenic and steroidogenic impairment after chromiumtreatment in rats. Indian J Exp Biol 33:480-484.
Cohen, Y., Winer, A.M., Creelman, L., and Mabuni, C. (1999): A Critical Assessment ofChromium in the Environment. Critical Rev. in Environmental Science and Technology29(1): 1-46.
De Flora S, Badolati GS, Serra D, et al. 1987a. Circadian reduction of chromium in the gastricenvironment. Mutat Res 192:169-174.
Donaldson DL, Smith CC, and Yunice AA. 1984. Renal excretion of chromium-51 chloride in thedog. Am J Physiol 246:F870-F878.
Donaldson RM and Barreras RF. 1966. Intestinal absorption of trace quantities of chromium. JLab Clin Med 68:484-493.
Federal Register, May 6, 1993, Vol 58, p. 26975, [as cited in Federal Register, Vol 58, No234/Wednesday, Dec. 8, 1993/Notices, p. 64580-64582]
Fishbein L. 1981. Sources, transport and alterations of metal compounds: An overview. I.Arsenic,beryllium, cadmium, chromium and nickel. Environ Health Perspect 40:43-64.
Franzblau, A. and Lilis, R. 1989. Acute Arsenic Intoxication from Environmental ArsenicExposure. Archives of Envir. Health 44(6). 385-390.
Freeman, GB., Johnson, J.D., Killinger, J.M., Liao, S.C., Davis, A.O., Ruby, M.V., Chaney, R.L.,Lovre, S.C., and Bergstrom, P.D. 1993. Bioavailability of Arsenic in Soil Impacted bySmelter Activities Following Oral Administration in Rabbits. Fundamental and AppliedToxicology 21:83-88
Freeman, G.B., Schoof, R.A., Ruby, M.V., Davis, A.O., Dill, J.A., Liao, S.C., Lapin, C.A., andBergstrom, P.D. 1995. Bioavailability of Arsenic in Soil and House Dust Impacted bySmelter Activities Following Oral Administration in Cynomologus Monkeys. Fundamental and Applied Toxicology 28:215-222
Gibson DP, Brauninger R, Shaffi HS, et al. 1997. Induction of micronuclei in Syrian hamsterembryocells: comparison of results in the SHE cell transformation assay for nationaltoxicology program test chemicals. Mutat Res 392(1-2):61-70.
Groen, K., Vaesen, H.A.G., Klest, J.I.G. deBar, J.L.M., von Ooik, T. Timmerman, A. and Vlug,R.G. 1993. Bioavailability of Inorganic Arsenic from Bog Ore-Containing Soil in theDog. Environmental Health Perspective 102: 182-184.

32
Henderson RF, Rebar AH, Pickrell JA, et al. 1979. Early damage indicators in the lung. III. Biochemical and cytological response of the lung to inhaled metal salts. Toxicol ApplPharmacol 50:123-136.
Hopenhayn-Rich et al., 1998: Lung and Kidney Cancer Mortality Associated with Arsenic inDrinking Water in Cordoba, Argentina. Epidemiology 27: 561-569.
Hopenhayn-Rich et al., 2000: Chronic Arsenic Exposure and Risk of Infant Mortality in TwoAreas of Chile. Env. Hlth. Perspec. 108: 667-673, July 2000.
Hueper, WC; Payne, WW. (1962) Experimental studies in metal carcinogenesis--Chromium,nickel, iron, arsenic. Arch Environ Health 5:445-462.
International Agency for Research on Cancer (IARC). (1990) IARC monographs on theevaluation of the carcinogenic risk of chemicals to humans. Vol. 49. Some metals andmetallic compounds. Lyon, France: World Health Organization.
IRIS. 2000. Chromium VI. Integrated Risk Information System. U.S. EnvironmentalProtectionAgency, Office of Health and Environmental Assessment, EnvironmentalCriteria and Assessment Office, Cincinnati, OH.
Ivankovic, S; Preussman, R. (1975) Absence of toxic and carcinogenic effects afteradministrations of high doses of chronic oxide pigment in subacute and long term feedingexperiments in rats. Food Cosmet Toxicol 13:347-351.
Jennette KW. 1982. Microsomal reduction of the carcinogen chromate produced chromium(V). JAm Chem Soc 104:874-875.
Junaid M, Murthy RC, Saxena DK. 1996a. Embryo- and fetotoxicity of chromium inpregestationally exposed mice. Bull Environ Contam Toxicol 57:327-334.
Kanojia RK, Junaid M, Murthy RC. 1996. Chromium induced teratogenicity in female rat.ToxicolLett 89:207-213.
Kenyon, E.M. and Hughes, M.F. (2001): A concise review of the toxicity and carcinogenicity ofdimethylarsinic acid. Toxicology 160: 227-236.
Kochhar TS, Howard W, Hoffman S, et al. 1996. Effect of trivalent and pentavalent arsenic incausing chromosome alterations in cultured Chinese hamster ovary (CHO) cells. ToxicolLett 84(1):37-42.
Lerman S, Clarkson TW, Gerson RJ. 1983. Arsenic uptake and metabolism by liver cells isdependent on arsenic oxidation state. Chem Biol Interact 45:401-406.
33
Larramendy ML, Popescu NC, DiPaolo J. 1981. Induction by inorganic metal salts of sisterchromatid exchanges and chromosome aberrations in human and Syrian hamster strains.Environ Mutagen 3:597-606.
Lebow, S. (1996): Leaching of Wood Preservative Components and their Mobility in theEnvironment- Summary of Pertinent Literature. Gen. Tech. Rep. FPL-GTR-93. Madison,WI: U.S. Department of Agriculture, Forest Service, Forest Products Laboratory, 36 p.
Lee, T-C, et al. (1985): Comparison of arsenic-induced cell transformation, cytotoxicity,mutation, and cytogenetic effects in Syrian hamster embryo cells in culture.Carcinogenesis 6(10): 1421-1426.
Levy, LS; Venitt, S. (1975) Carcinogenic and mutagenic activity of chromium-containingmaterials. Br J Cancer 32:254-255.
Levy, LS; Martin, PA. (1983) The effects of a range of chromium-containing materials on ratlung. Dye Color Manufacturers Association.
Maruyama, Y.(1982): The health effect of mice given oral administration of trivalent andhexavalent chromium over a long term. Acta Scholae Medicinalis Universitatis in Gifu31:24-36.
Mass, M.J. et al. (2001): Methylated Trivalent Arsenic Species are Genotoxic. Chem. Res.Toxicol. 14: 355-361.
Mizuta, N, Mizuta, et al. 1956. An Outbreak of Acute Arsenic Poisoning Caused by Arsenic-Containing Soy-Sauce (Shoyu). A Clinical Report of 220 Cases. Bull Yamaguchi MedSch 4(2-3):131-149.
Moore MM, Harrington-Brock K, Doerr CL. 1997. Relative genotoxic potency of arsenic and itsmethylated metabolites. Mutat Res 386(3):279-290.
National Research Council: Arsenic in Drinking Water: 2001 Update. September, 2001, NationalAcademy Press, Washington, D.C.
National Toxicology Program (NTP). 1996. Final report on the reproductive toxicity ofpotassium dichromate (hexavalent)(CAS No. 7778-50-9) administered in diet to SD rats.Dec. 16, 1996. U.S. Department of Commerce, National Technical Information Service,PB97125355.
National Toxicology Program (NTP). 1997a. Final report on the reproductive toxicity ofpotassium dichromate (hexavalent) (CAS No. 7778-50-9) administered in diet to BALB/C
34
mice. Jan 10, 1997. U.S. Department of Commerce, National Technical InformationService, PB97125363.
NTP, Public Health Service, U.S. Department of Health and Human Services. (1997) Final report.Potassium dichromate (hexavalent): reproductive assessment by continuous breeding whenadministered to BALB/c mice in the diet. February 18, 1997. Available from: NationalInstitute of Environmental Health Sciences, Research Triangle Park, NC.
NRC (National Research Council). 1999. Arsenic in Drinking Water. National Academy Press,Washington, D.C.
Oberly TJ, Piper CE, McDonald DS. 1982. Mutagenicity of metal salts in the L5178Y mouselymphoma assay. J Toxicol Environ Health 9:367-376.
Roberts, S.M.; Welmar, W.R.; Venson, J.R.; Munson, J.W.; and Bergeron. Measurement ofArsenic Bioavailability from Soils Using a Primate Model. Abstract.
Rossman, T.G. et al. (1980): Absence of arsenite mutagenicity in E. coli and Chinese hamstercells. Environ. Mut. 2: 371-379.
Sayato Y, Nakamuro K, Matsui S, et al. 1980. Metabolic fate of chromium compounds. I. Comparative behavior of chromium in rat administered with Na2
51CrO4 and 51CrCl3. JPharm Dyn 3:17-23.
Schroeder, HA; Balassa, JJ; Vinton, WH, Jr. (1965) Chromium, cadmium and lead in rats: effectson lifespan, tumors, and tissue levels. J Nutr 86:51-66.
Suzuki Y, Fukuda K. 1990. Reduction of hexavalent chromium by ascorbic acid and glutathionewith special reference to the rat lung. Arch Toxicol 64:169-176.
Towill, LE; Shriner, CR; Drury, JS; et al. (1978) Reviews of the environmental effects ofpollutants. III. Chromium. Prepared by the Health Effects Research Laboratory, OfficeofResearch and Development, U.S. Environmental Protection Agency, Cincinnati, OH.Report No. ORNL/EIS-80. EPA 600/1-78-023. NTIS PB 282796.
Trivedi B, Saxena DK, Murthy RC, et al. 1989. Embryotoxicity and fetotoxicity of orallyadministered hexavalent chromium in mice. Reprod Toxicol 3:275-278.
Tseng, W.P., H.M. Chu, S.W. How, J.M. Fong, C.S. Lin, and S. Yeh. 1968. Prevalence of skincancer in an endemic area of chronic arsenicism in Taiwan. J. Natl. Cancer Inst.40:453-463.
35
Tseng W-P. 1977. Effects and dose-response relationships of skin cancer and Blackfoot diseasewith arsenic. Environ Health Perspect 19:109-119.
USEPA. Relative Bioavailability of Arsenic in Mining Wastes, Region 8, Document Control No.4500-88-AORH, 1997.
USEPA. Bioavailability of Arsenic and Lead in Environmental Substrates. 1. Results of an OralDosing Study of Immature Swine. Superfund/Office of Environmental Assessment,Region 10, EPA 910/R-96-002, 1996.
USEPA Region 8, 2001: Derivation of Acute and Subchronic Oral Reference Doses for InorganicArsenic.
U.S. EPA, IRIS, Chromium (VI), 1998; CASRN 18540-29-9, 9/3/1998 .
Wiegand, HJ; Ottenwalder, H; Bolt, HM. (1985) Fast uptake kinetics in vitro of 51 Cr(VI) by redblood cells of man and rat. Arch Toxicol 57:31-34.
Wester, R.C., Maibach, H.I., Sedik, L. Melendres, J., and Wader, M. 1993. In Vivo and in VitroPercutaneous Absorption and Skin Decontamination of Arsenic From Water and Soil.Fundamental and Applied Toxicology 20:336-340
Williams, T.W. : Rawlins, B.G.; Smith, B.; and Breward, N. 1998. In-Vitro Determination ofArsenic Bioavailability in Contaminated Soil and Mineral Benefication Waste from RonPhibun, Southern Thailand: A Basis for Improved Human Risk Assessment. Environmental Geochemistry and Health: 20
Witmer, C.M, Harris R and Shupack SI. 1991. Oral bioavailability of chromium from a specificsite. Environ Health Perspect 92:105-110.
Zahid,Z.R., Al-Hakkak ZS, Kadhim AHH, et al. 1990. Comparative effects of trivalent andhexavalent chromium on spermatogenesis of the mouse. Toxicol Environ Chem 25:131-136.

Appendix B
Risk Spreadsheets
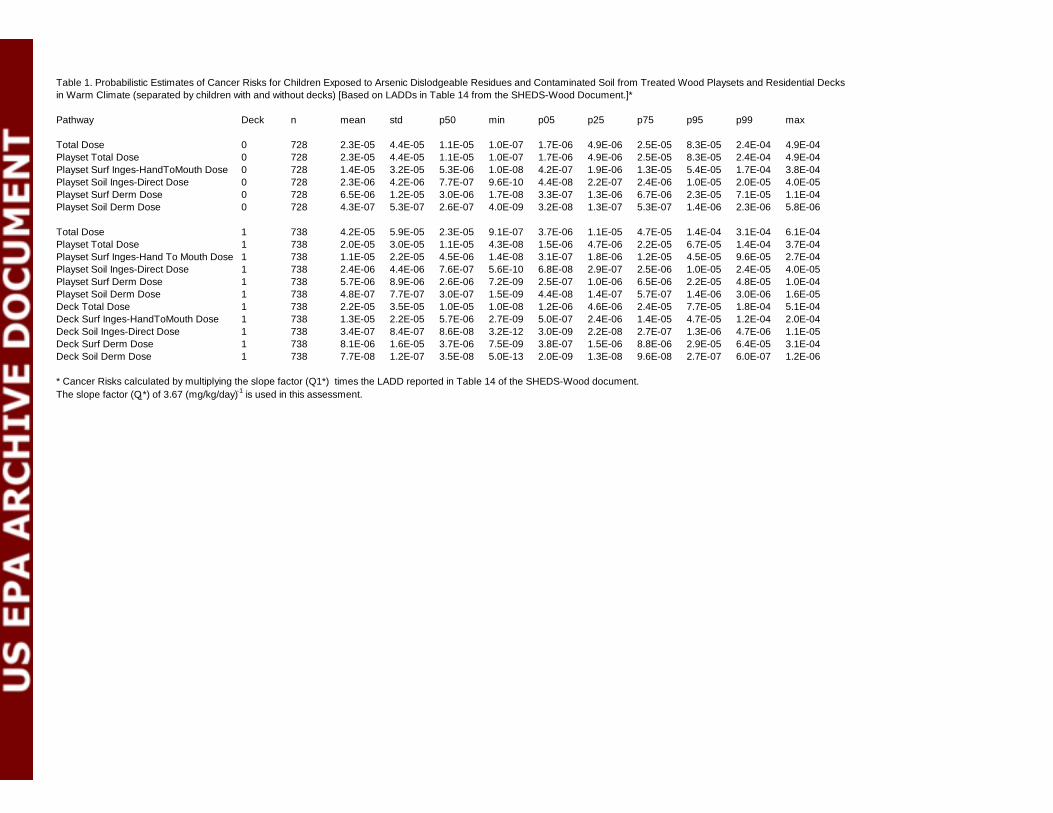
Pathway Deck n mean std p50 min p05 p25 p75 p95 p99 max
Total Dose 0 728 2.3E-05 4.4E-05 1.1E-05 1.0E-07 1.7E-06 4.9E-06 2.5E-05 8.3E-05 2.4E-04 4.9E-04Playset Total Dose 0 728 2.3E-05 4.4E-05 1.1E-05 1.0E-07 1.7E-06 4.9E-06 2.5E-05 8.3E-05 2.4E-04 4.9E-04Playset Surf Inges-HandToMouth Dose 0 728 1.4E-05 3.2E-05 5.3E-06 1.0E-08 4.2E-07 1.9E-06 1.3E-05 5.4E-05 1.7E-04 3.8E-04Playset Soil Inges-Direct Dose 0 728 2.3E-06 4.2E-06 7.7E-07 9.6E-10 4.4E-08 2.2E-07 2.4E-06 1.0E-05 2.0E-05 4.0E-05Playset Surf Derm Dose 0 728 6.5E-06 1.2E-05 3.0E-06 1.7E-08 3.3E-07 1.3E-06 6.7E-06 2.3E-05 7.1E-05 1.1E-04Playset Soil Derm Dose 0 728 4.3E-07 5.3E-07 2.6E-07 4.0E-09 3.2E-08 1.3E-07 5.3E-07 1.4E-06 2.3E-06 5.8E-06
Total Dose 1 738 4.2E-05 5.9E-05 2.3E-05 9.1E-07 3.7E-06 1.1E-05 4.7E-05 1.4E-04 3.1E-04 6.1E-04Playset Total Dose 1 738 2.0E-05 3.0E-05 1.1E-05 4.3E-08 1.5E-06 4.7E-06 2.2E-05 6.7E-05 1.4E-04 3.7E-04Playset Surf Inges-Hand To Mouth Dose 1 738 1.1E-05 2.2E-05 4.5E-06 1.4E-08 3.1E-07 1.8E-06 1.2E-05 4.5E-05 9.6E-05 2.7E-04Playset Soil Inges-Direct Dose 1 738 2.4E-06 4.4E-06 7.6E-07 5.6E-10 6.8E-08 2.9E-07 2.5E-06 1.0E-05 2.4E-05 4.0E-05Playset Surf Derm Dose 1 738 5.7E-06 8.9E-06 2.6E-06 7.2E-09 2.5E-07 1.0E-06 6.5E-06 2.2E-05 4.8E-05 1.0E-04Playset Soil Derm Dose 1 738 4.8E-07 7.7E-07 3.0E-07 1.5E-09 4.4E-08 1.4E-07 5.7E-07 1.4E-06 3.0E-06 1.6E-05Deck Total Dose 1 738 2.2E-05 3.5E-05 1.0E-05 1.0E-08 1.2E-06 4.6E-06 2.4E-05 7.7E-05 1.8E-04 5.1E-04Deck Surf Inges-HandToMouth Dose 1 738 1.3E-05 2.2E-05 5.7E-06 2.7E-09 5.0E-07 2.4E-06 1.4E-05 4.7E-05 1.2E-04 2.0E-04Deck Soil Inges-Direct Dose 1 738 3.4E-07 8.4E-07 8.6E-08 3.2E-12 3.0E-09 2.2E-08 2.7E-07 1.3E-06 4.7E-06 1.1E-05Deck Surf Derm Dose 1 738 8.1E-06 1.6E-05 3.7E-06 7.5E-09 3.8E-07 1.5E-06 8.8E-06 2.9E-05 6.4E-05 3.1E-04Deck Soil Derm Dose 1 738 7.7E-08 1.2E-07 3.5E-08 5.0E-13 2.0E-09 1.3E-08 9.6E-08 2.7E-07 6.0E-07 1.2E-06
* Cancer Risks calculated by multiplying the slope factor (Q1*) times the LADD reported in Table 14 of the SHEDS-Wood document.The slope factor (Q1*) of 3.67 (mg/kg/day)-1 is used in this assessment.
Table 1. Probabilistic Estimates of Cancer Risks for Children Exposed to Arsenic Dislodgeable Residues and Contaminated Soil from Treated Wood Playsets and Residential Decks in Warm Climate (separated by children with and without decks) [Based on LADDs in Table 14 from the SHEDS-Wood Document.]*
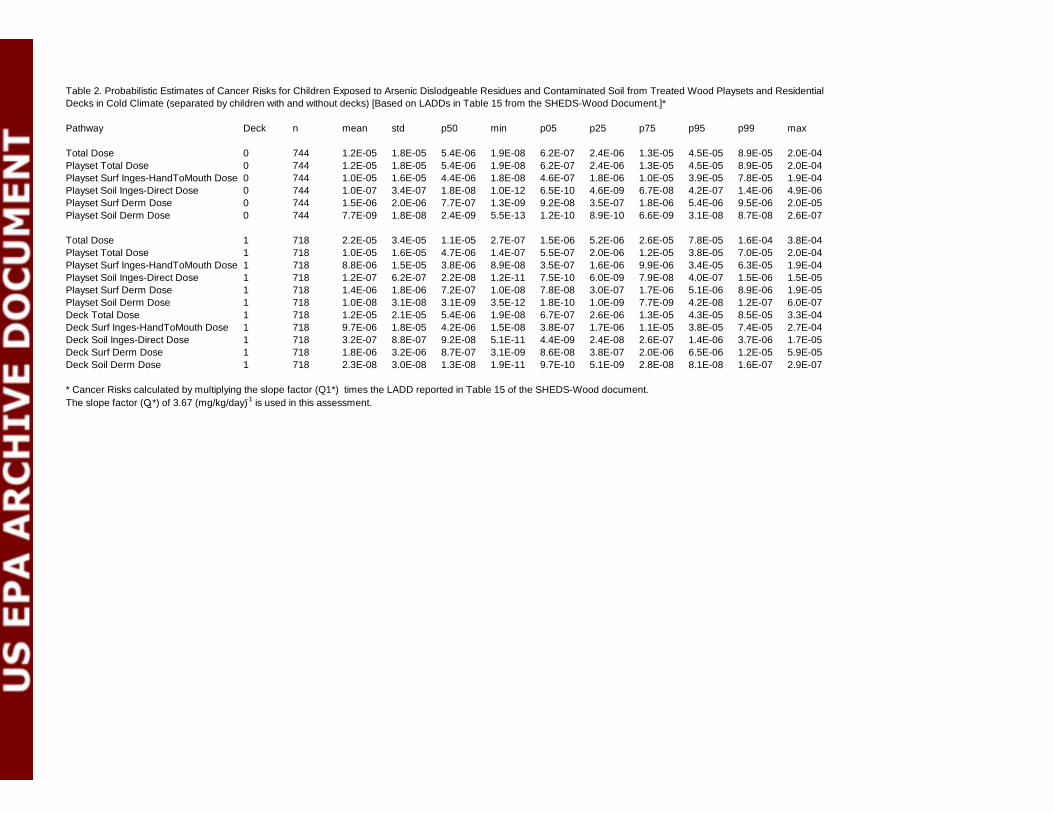
Pathway Deck n mean std p50 min p05 p25 p75 p95 p99 max
Total Dose 0 744 1.2E-05 1.8E-05 5.4E-06 1.9E-08 6.2E-07 2.4E-06 1.3E-05 4.5E-05 8.9E-05 2.0E-04Playset Total Dose 0 744 1.2E-05 1.8E-05 5.4E-06 1.9E-08 6.2E-07 2.4E-06 1.3E-05 4.5E-05 8.9E-05 2.0E-04Playset Surf Inges-HandToMouth Dose 0 744 1.0E-05 1.6E-05 4.4E-06 1.8E-08 4.6E-07 1.8E-06 1.0E-05 3.9E-05 7.8E-05 1.9E-04Playset Soil Inges-Direct Dose 0 744 1.0E-07 3.4E-07 1.8E-08 1.0E-12 6.5E-10 4.6E-09 6.7E-08 4.2E-07 1.4E-06 4.9E-06Playset Surf Derm Dose 0 744 1.5E-06 2.0E-06 7.7E-07 1.3E-09 9.2E-08 3.5E-07 1.8E-06 5.4E-06 9.5E-06 2.0E-05Playset Soil Derm Dose 0 744 7.7E-09 1.8E-08 2.4E-09 5.5E-13 1.2E-10 8.9E-10 6.6E-09 3.1E-08 8.7E-08 2.6E-07
Total Dose 1 718 2.2E-05 3.4E-05 1.1E-05 2.7E-07 1.5E-06 5.2E-06 2.6E-05 7.8E-05 1.6E-04 3.8E-04Playset Total Dose 1 718 1.0E-05 1.6E-05 4.7E-06 1.4E-07 5.5E-07 2.0E-06 1.2E-05 3.8E-05 7.0E-05 2.0E-04Playset Surf Inges-HandToMouth Dose 1 718 8.8E-06 1.5E-05 3.8E-06 8.9E-08 3.5E-07 1.6E-06 9.9E-06 3.4E-05 6.3E-05 1.9E-04Playset Soil Inges-Direct Dose 1 718 1.2E-07 6.2E-07 2.2E-08 1.2E-11 7.5E-10 6.0E-09 7.9E-08 4.0E-07 1.5E-06 1.5E-05Playset Surf Derm Dose 1 718 1.4E-06 1.8E-06 7.2E-07 1.0E-08 7.8E-08 3.0E-07 1.7E-06 5.1E-06 8.9E-06 1.9E-05Playset Soil Derm Dose 1 718 1.0E-08 3.1E-08 3.1E-09 3.5E-12 1.8E-10 1.0E-09 7.7E-09 4.2E-08 1.2E-07 6.0E-07Deck Total Dose 1 718 1.2E-05 2.1E-05 5.4E-06 1.9E-08 6.7E-07 2.6E-06 1.3E-05 4.3E-05 8.5E-05 3.3E-04Deck Surf Inges-HandToMouth Dose 1 718 9.7E-06 1.8E-05 4.2E-06 1.5E-08 3.8E-07 1.7E-06 1.1E-05 3.8E-05 7.4E-05 2.7E-04Deck Soil Inges-Direct Dose 1 718 3.2E-07 8.8E-07 9.2E-08 5.1E-11 4.4E-09 2.4E-08 2.6E-07 1.4E-06 3.7E-06 1.7E-05Deck Surf Derm Dose 1 718 1.8E-06 3.2E-06 8.7E-07 3.1E-09 8.6E-08 3.8E-07 2.0E-06 6.5E-06 1.2E-05 5.9E-05Deck Soil Derm Dose 1 718 2.3E-08 3.0E-08 1.3E-08 1.9E-11 9.7E-10 5.1E-09 2.8E-08 8.1E-08 1.6E-07 2.9E-07
* Cancer Risks calculated by multiplying the slope factor (Q1*) times the LADD reported in Table 15 of the SHEDS-Wood document.The slope factor (Q1*) of 3.67 (mg/kg/day)-1 is used in this assessment.
Table 2. Probabilistic Estimates of Cancer Risks for Children Exposed to Arsenic Dislodgeable Residues and Contaminated Soil from Treated Wood Playsets and Residential Decks in Cold Climate (separated by children with and without decks) [Based on LADDs in Table 15 from the SHEDS-Wood Document.]*
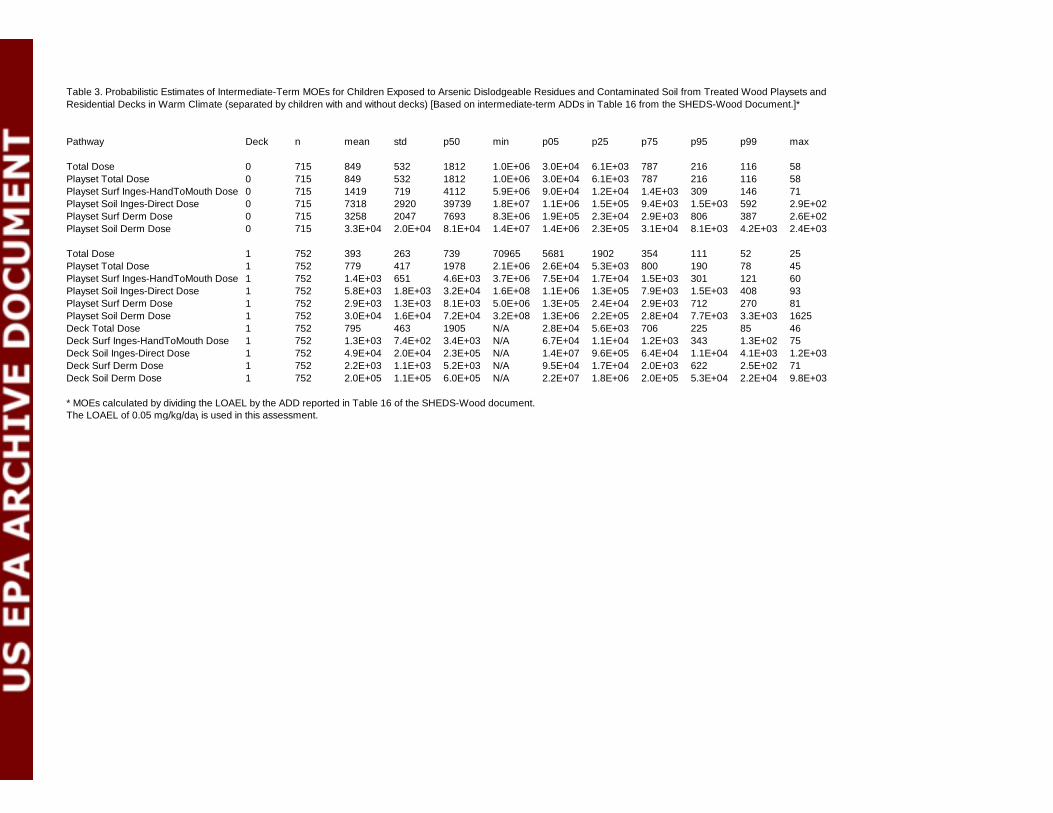
Pathway Deck n mean std p50 min p05 p25 p75 p95 p99 max
Total Dose 0 715 849 532 1812 1.0E+06 3.0E+04 6.1E+03 787 216 116 58Playset Total Dose 0 715 849 532 1812 1.0E+06 3.0E+04 6.1E+03 787 216 116 58Playset Surf Inges-HandToMouth Dose 0 715 1419 719 4112 5.9E+06 9.0E+04 1.2E+04 1.4E+03 309 146 71Playset Soil Inges-Direct Dose 0 715 7318 2920 39739 1.8E+07 1.1E+06 1.5E+05 9.4E+03 1.5E+03 592 2.9E+02Playset Surf Derm Dose 0 715 3258 2047 7693 8.3E+06 1.9E+05 2.3E+04 2.9E+03 806 387 2.6E+02Playset Soil Derm Dose 0 715 3.3E+04 2.0E+04 8.1E+04 1.4E+07 1.4E+06 2.3E+05 3.1E+04 8.1E+03 4.2E+03 2.4E+03
Total Dose 1 752 393 263 739 70965 5681 1902 354 111 52 25Playset Total Dose 1 752 779 417 1978 2.1E+06 2.6E+04 5.3E+03 800 190 78 45Playset Surf Inges-HandToMouth Dose 1 752 1.4E+03 651 4.6E+03 3.7E+06 7.5E+04 1.7E+04 1.5E+03 301 121 60Playset Soil Inges-Direct Dose 1 752 5.8E+03 1.8E+03 3.2E+04 1.6E+08 1.1E+06 1.3E+05 7.9E+03 1.5E+03 408 93Playset Surf Derm Dose 1 752 2.9E+03 1.3E+03 8.1E+03 5.0E+06 1.3E+05 2.4E+04 2.9E+03 712 270 81Playset Soil Derm Dose 1 752 3.0E+04 1.6E+04 7.2E+04 3.2E+08 1.3E+06 2.2E+05 2.8E+04 7.7E+03 3.3E+03 1625Deck Total Dose 1 752 795 463 1905 N/A 2.8E+04 5.6E+03 706 225 85 46Deck Surf Inges-HandToMouth Dose 1 752 1.3E+03 7.4E+02 3.4E+03 N/A 6.7E+04 1.1E+04 1.2E+03 343 1.3E+02 75Deck Soil Inges-Direct Dose 1 752 4.9E+04 2.0E+04 2.3E+05 N/A 1.4E+07 9.6E+05 6.4E+04 1.1E+04 4.1E+03 1.2E+03Deck Surf Derm Dose 1 752 2.2E+03 1.1E+03 5.2E+03 N/A 9.5E+04 1.7E+04 2.0E+03 622 2.5E+02 71Deck Soil Derm Dose 1 752 2.0E+05 1.1E+05 6.0E+05 N/A 2.2E+07 1.8E+06 2.0E+05 5.3E+04 2.2E+04 9.8E+03
* MOEs calculated by dividing the LOAEL by the ADD reported in Table 16 of the SHEDS-Wood document.The LOAEL of 0.05 mg/kg/day is used in this assessment.
Table 3. Probabilistic Estimates of Intermediate-Term MOEs for Children Exposed to Arsenic Dislodgeable Residues and Contaminated Soil from Treated Wood Playsets and Residential Decks in Warm Climate (separated by children with and without decks) [Based on intermediate-term ADDs in Table 16 from the SHEDS-Wood Document.]*
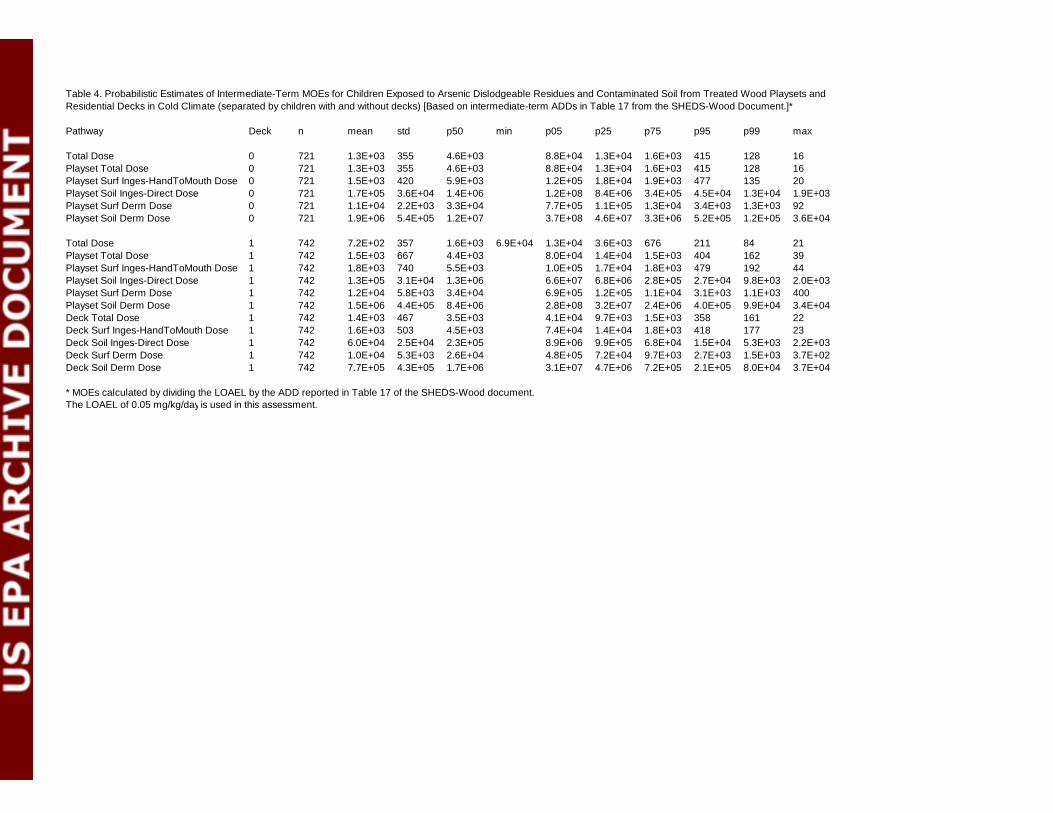
Pathway Deck n mean std p50 min p05 p25 p75 p95 p99 max
Total Dose 0 721 1.3E+03 355 4.6E+03 8.8E+04 1.3E+04 1.6E+03 415 128 16Playset Total Dose 0 721 1.3E+03 355 4.6E+03 8.8E+04 1.3E+04 1.6E+03 415 128 16Playset Surf Inges-HandToMouth Dose 0 721 1.5E+03 420 5.9E+03 1.2E+05 1.8E+04 1.9E+03 477 135 20Playset Soil Inges-Direct Dose 0 721 1.7E+05 3.6E+04 1.4E+06 1.2E+08 8.4E+06 3.4E+05 4.5E+04 1.3E+04 1.9E+03Playset Surf Derm Dose 0 721 1.1E+04 2.2E+03 3.3E+04 7.7E+05 1.1E+05 1.3E+04 3.4E+03 1.3E+03 92Playset Soil Derm Dose 0 721 1.9E+06 5.4E+05 1.2E+07 3.7E+08 4.6E+07 3.3E+06 5.2E+05 1.2E+05 3.6E+04
Total Dose 1 742 7.2E+02 357 1.6E+03 6.9E+04 1.3E+04 3.6E+03 676 211 84 21Playset Total Dose 1 742 1.5E+03 667 4.4E+03 8.0E+04 1.4E+04 1.5E+03 404 162 39Playset Surf Inges-HandToMouth Dose 1 742 1.8E+03 740 5.5E+03 1.0E+05 1.7E+04 1.8E+03 479 192 44Playset Soil Inges-Direct Dose 1 742 1.3E+05 3.1E+04 1.3E+06 6.6E+07 6.8E+06 2.8E+05 2.7E+04 9.8E+03 2.0E+03Playset Surf Derm Dose 1 742 1.2E+04 5.8E+03 3.4E+04 6.9E+05 1.2E+05 1.1E+04 3.1E+03 1.1E+03 400Playset Soil Derm Dose 1 742 1.5E+06 4.4E+05 8.4E+06 2.8E+08 3.2E+07 2.4E+06 4.0E+05 9.9E+04 3.4E+04Deck Total Dose 1 742 1.4E+03 467 3.5E+03 4.1E+04 9.7E+03 1.5E+03 358 161 22Deck Surf Inges-HandToMouth Dose 1 742 1.6E+03 503 4.5E+03 7.4E+04 1.4E+04 1.8E+03 418 177 23Deck Soil Inges-Direct Dose 1 742 6.0E+04 2.5E+04 2.3E+05 8.9E+06 9.9E+05 6.8E+04 1.5E+04 5.3E+03 2.2E+03Deck Surf Derm Dose 1 742 1.0E+04 5.3E+03 2.6E+04 4.8E+05 7.2E+04 9.7E+03 2.7E+03 1.5E+03 3.7E+02Deck Soil Derm Dose 1 742 7.7E+05 4.3E+05 1.7E+06 3.1E+07 4.7E+06 7.2E+05 2.1E+05 8.0E+04 3.7E+04
* MOEs calculated by dividing the LOAEL by the ADD reported in Table 17 of the SHEDS-Wood document.The LOAEL of 0.05 mg/kg/day is used in this assessment.
Table 4. Probabilistic Estimates of Intermediate-Term MOEs for Children Exposed to Arsenic Dislodgeable Residues and Contaminated Soil from Treated Wood Playsets and Residential Decks in Cold Climate (separated by children with and without decks) [Based on intermediate-term ADDs in Table 17 from the SHEDS-Wood Document.]*
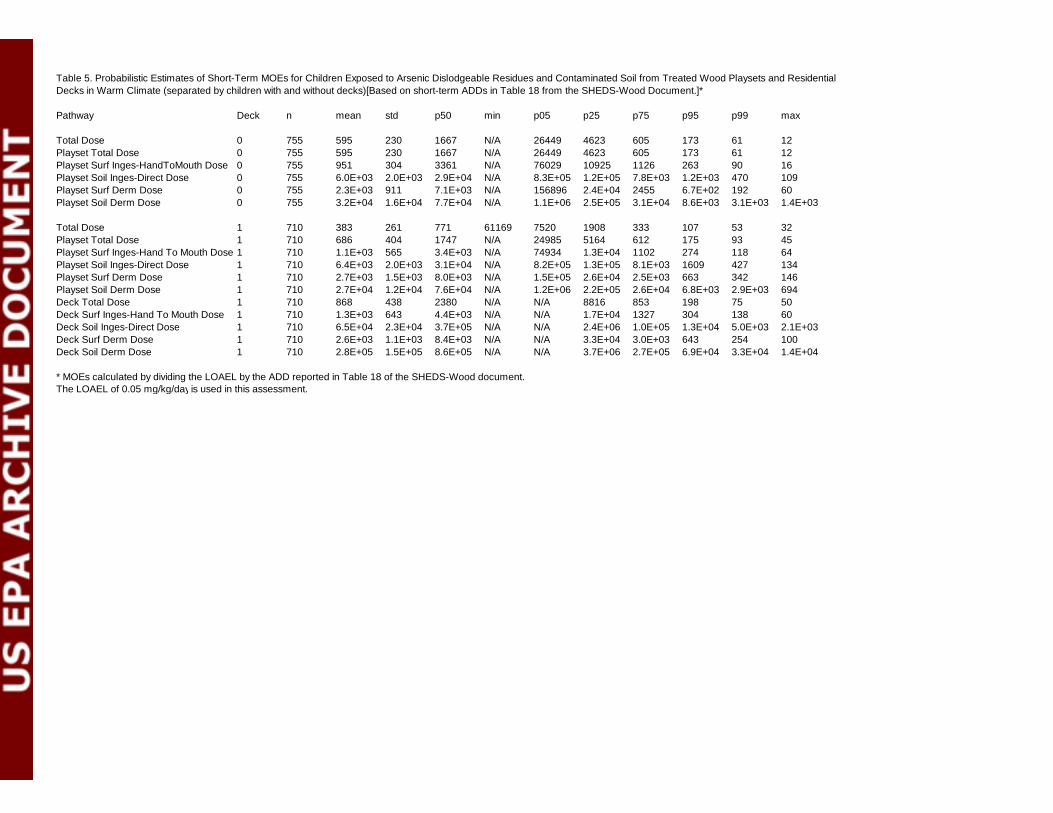
Pathway Deck n mean std p50 min p05 p25 p75 p95 p99 max
Total Dose 0 755 595 230 1667 N/A 26449 4623 605 173 61 12Playset Total Dose 0 755 595 230 1667 N/A 26449 4623 605 173 61 12Playset Surf Inges-HandToMouth Dose 0 755 951 304 3361 N/A 76029 10925 1126 263 90 16Playset Soil Inges-Direct Dose 0 755 6.0E+03 2.0E+03 2.9E+04 N/A 8.3E+05 1.2E+05 7.8E+03 1.2E+03 470 109Playset Surf Derm Dose 0 755 2.3E+03 911 7.1E+03 N/A 156896 2.4E+04 2455 6.7E+02 192 60Playset Soil Derm Dose 0 755 3.2E+04 1.6E+04 7.7E+04 N/A 1.1E+06 2.5E+05 3.1E+04 8.6E+03 3.1E+03 1.4E+03
Total Dose 1 710 383 261 771 61169 7520 1908 333 107 53 32Playset Total Dose 1 710 686 404 1747 N/A 24985 5164 612 175 93 45Playset Surf Inges-Hand To Mouth Dose 1 710 1.1E+03 565 3.4E+03 N/A 74934 1.3E+04 1102 274 118 64Playset Soil Inges-Direct Dose 1 710 6.4E+03 2.0E+03 3.1E+04 N/A 8.2E+05 1.3E+05 8.1E+03 1609 427 134Playset Surf Derm Dose 1 710 2.7E+03 1.5E+03 8.0E+03 N/A 1.5E+05 2.6E+04 2.5E+03 663 342 146Playset Soil Derm Dose 1 710 2.7E+04 1.2E+04 7.6E+04 N/A 1.2E+06 2.2E+05 2.6E+04 6.8E+03 2.9E+03 694Deck Total Dose 1 710 868 438 2380 N/A N/A 8816 853 198 75 50Deck Surf Inges-Hand To Mouth Dose 1 710 1.3E+03 643 4.4E+03 N/A N/A 1.7E+04 1327 304 138 60Deck Soil Inges-Direct Dose 1 710 6.5E+04 2.3E+04 3.7E+05 N/A N/A 2.4E+06 1.0E+05 1.3E+04 5.0E+03 2.1E+03Deck Surf Derm Dose 1 710 2.6E+03 1.1E+03 8.4E+03 N/A N/A 3.3E+04 3.0E+03 643 254 100Deck Soil Derm Dose 1 710 2.8E+05 1.5E+05 8.6E+05 N/A N/A 3.7E+06 2.7E+05 6.9E+04 3.3E+04 1.4E+04
* MOEs calculated by dividing the LOAEL by the ADD reported in Table 18 of the SHEDS-Wood document.The LOAEL of 0.05 mg/kg/day is used in this assessment.
Table 5. Probabilistic Estimates of Short-Term MOEs for Children Exposed to Arsenic Dislodgeable Residues and Contaminated Soil from Treated Wood Playsets and Residential Decks in Warm Climate (separated by children with and without decks)[Based on short-term ADDs in Table 18 from the SHEDS-Wood Document.]*
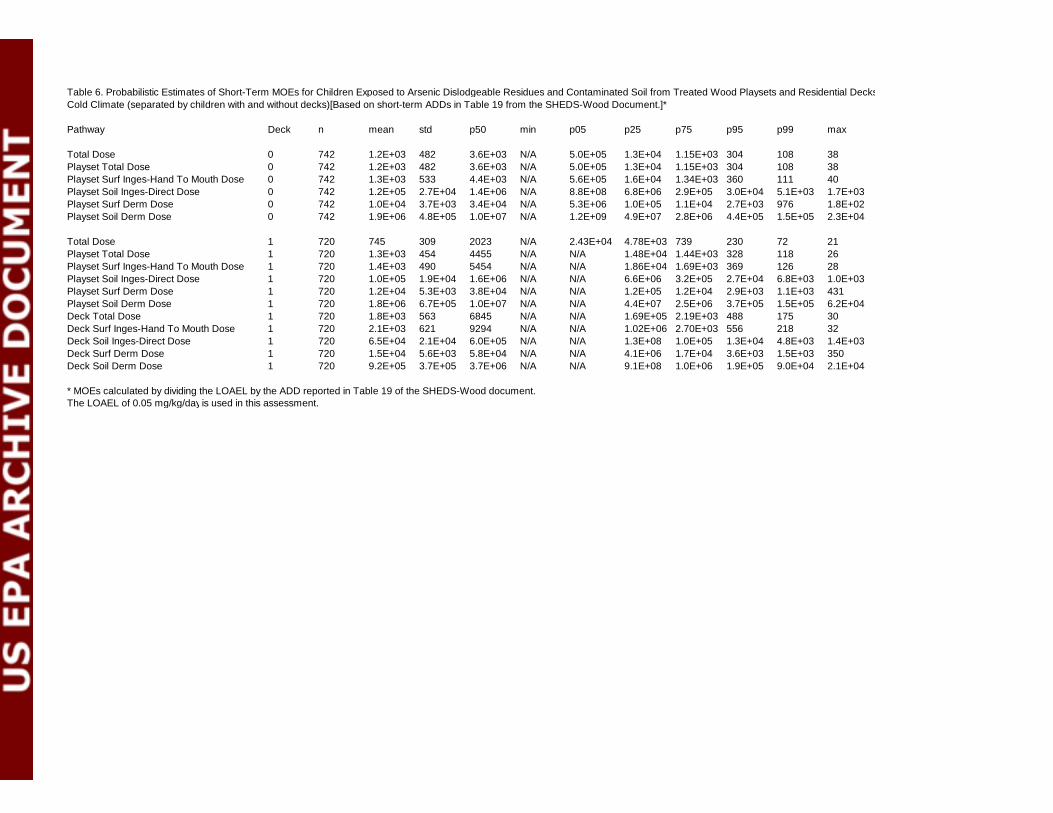
Pathway Deck n mean std p50 min p05 p25 p75 p95 p99 max
Total Dose 0 742 1.2E+03 482 3.6E+03 N/A 5.0E+05 1.3E+04 1.15E+03 304 108 38Playset Total Dose 0 742 1.2E+03 482 3.6E+03 N/A 5.0E+05 1.3E+04 1.15E+03 304 108 38Playset Surf Inges-Hand To Mouth Dose 0 742 1.3E+03 533 4.4E+03 N/A 5.6E+05 1.6E+04 1.34E+03 360 111 40Playset Soil Inges-Direct Dose 0 742 1.2E+05 2.7E+04 1.4E+06 N/A 8.8E+08 6.8E+06 2.9E+05 3.0E+04 5.1E+03 1.7E+03Playset Surf Derm Dose 0 742 1.0E+04 3.7E+03 3.4E+04 N/A 5.3E+06 1.0E+05 1.1E+04 2.7E+03 976 1.8E+02Playset Soil Derm Dose 0 742 1.9E+06 4.8E+05 1.0E+07 N/A 1.2E+09 4.9E+07 2.8E+06 4.4E+05 1.5E+05 2.3E+04
Total Dose 1 720 745 309 2023 N/A 2.43E+04 4.78E+03 739 230 72 21Playset Total Dose 1 720 1.3E+03 454 4455 N/A N/A 1.48E+04 1.44E+03 328 118 26Playset Surf Inges-Hand To Mouth Dose 1 720 1.4E+03 490 5454 N/A N/A 1.86E+04 1.69E+03 369 126 28Playset Soil Inges-Direct Dose 1 720 1.0E+05 1.9E+04 1.6E+06 N/A N/A 6.6E+06 3.2E+05 2.7E+04 6.8E+03 1.0E+03Playset Surf Derm Dose 1 720 1.2E+04 5.3E+03 3.8E+04 N/A N/A 1.2E+05 1.2E+04 2.9E+03 1.1E+03 431Playset Soil Derm Dose 1 720 1.8E+06 6.7E+05 1.0E+07 N/A N/A 4.4E+07 2.5E+06 3.7E+05 1.5E+05 6.2E+04Deck Total Dose 1 720 1.8E+03 563 6845 N/A N/A 1.69E+05 2.19E+03 488 175 30Deck Surf Inges-Hand To Mouth Dose 1 720 2.1E+03 621 9294 N/A N/A 1.02E+06 2.70E+03 556 218 32Deck Soil Inges-Direct Dose 1 720 6.5E+04 2.1E+04 6.0E+05 N/A N/A 1.3E+08 1.0E+05 1.3E+04 4.8E+03 1.4E+03Deck Surf Derm Dose 1 720 1.5E+04 5.6E+03 5.8E+04 N/A N/A 4.1E+06 1.7E+04 3.6E+03 1.5E+03 350Deck Soil Derm Dose 1 720 9.2E+05 3.7E+05 3.7E+06 N/A N/A 9.1E+08 1.0E+06 1.9E+05 9.0E+04 2.1E+04
* MOEs calculated by dividing the LOAEL by the ADD reported in Table 19 of the SHEDS-Wood document.The LOAEL of 0.05 mg/kg/day is used in this assessment.
Table 6. Probabilistic Estimates of Short-Term MOEs for Children Exposed to Arsenic Dislodgeable Residues and Contaminated Soil from Treated Wood Playsets and Residential Decks in Cold Climate (separated by children with and without decks)[Based on short-term ADDs in Table 19 from the SHEDS-Wood Document.]*
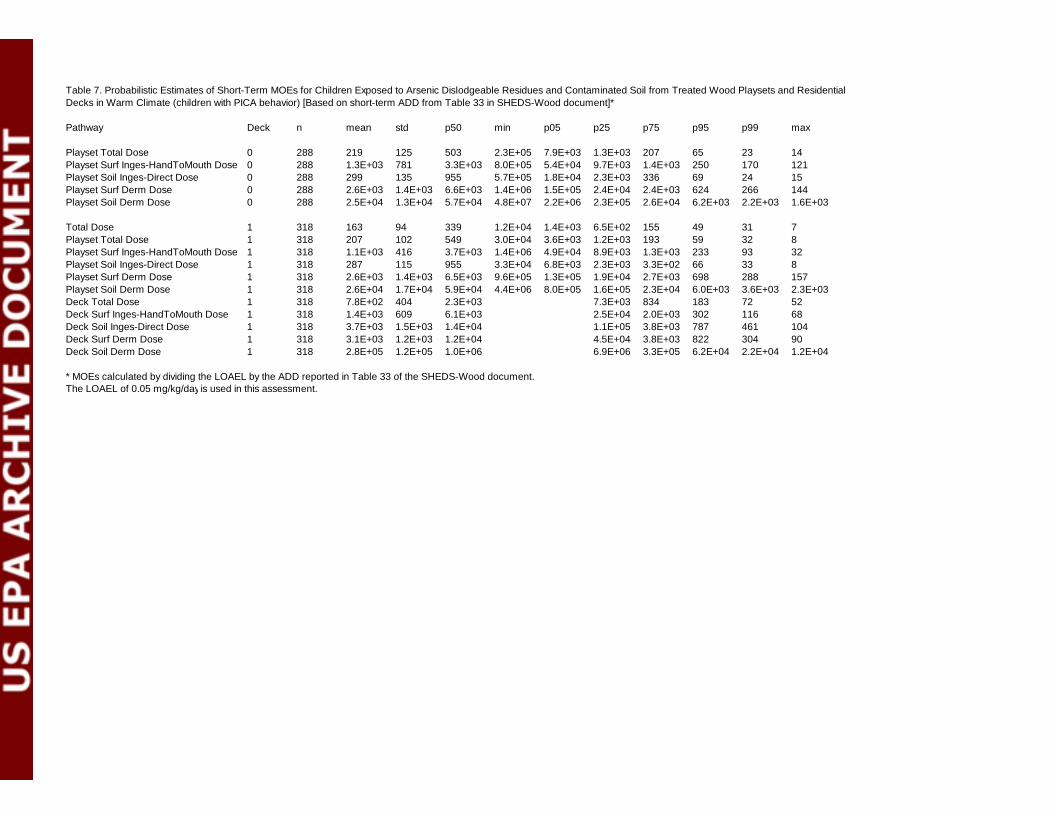
Pathway Deck n mean std p50 min p05 p25 p75 p95 p99 max
Playset Total Dose 0 288 219 125 503 2.3E+05 7.9E+03 1.3E+03 207 65 23 14Playset Surf Inges-HandToMouth Dose 0 288 1.3E+03 781 3.3E+03 8.0E+05 5.4E+04 9.7E+03 1.4E+03 250 170 121Playset Soil Inges-Direct Dose 0 288 299 135 955 5.7E+05 1.8E+04 2.3E+03 336 69 24 15Playset Surf Derm Dose 0 288 2.6E+03 1.4E+03 6.6E+03 1.4E+06 1.5E+05 2.4E+04 2.4E+03 624 266 144Playset Soil Derm Dose 0 288 2.5E+04 1.3E+04 5.7E+04 4.8E+07 2.2E+06 2.3E+05 2.6E+04 6.2E+03 2.2E+03 1.6E+03
Total Dose 1 318 163 94 339 1.2E+04 1.4E+03 6.5E+02 155 49 31 7Playset Total Dose 1 318 207 102 549 3.0E+04 3.6E+03 1.2E+03 193 59 32 8Playset Surf Inges-HandToMouth Dose 1 318 1.1E+03 416 3.7E+03 1.4E+06 4.9E+04 8.9E+03 1.3E+03 233 93 32Playset Soil Inges-Direct Dose 1 318 287 115 955 3.3E+04 6.8E+03 2.3E+03 3.3E+02 66 33 8Playset Surf Derm Dose 1 318 2.6E+03 1.4E+03 6.5E+03 9.6E+05 1.3E+05 1.9E+04 2.7E+03 698 288 157Playset Soil Derm Dose 1 318 2.6E+04 1.7E+04 5.9E+04 4.4E+06 8.0E+05 1.6E+05 2.3E+04 6.0E+03 3.6E+03 2.3E+03Deck Total Dose 1 318 7.8E+02 404 2.3E+03 7.3E+03 834 183 72 52Deck Surf Inges-HandToMouth Dose 1 318 1.4E+03 609 6.1E+03 2.5E+04 2.0E+03 302 116 68Deck Soil Inges-Direct Dose 1 318 3.7E+03 1.5E+03 1.4E+04 1.1E+05 3.8E+03 787 461 104Deck Surf Derm Dose 1 318 3.1E+03 1.2E+03 1.2E+04 4.5E+04 3.8E+03 822 304 90Deck Soil Derm Dose 1 318 2.8E+05 1.2E+05 1.0E+06 6.9E+06 3.3E+05 6.2E+04 2.2E+04 1.2E+04
* MOEs calculated by dividing the LOAEL by the ADD reported in Table 33 of the SHEDS-Wood document.The LOAEL of 0.05 mg/kg/day is used in this assessment.
Table 7. Probabilistic Estimates of Short-Term MOEs for Children Exposed to Arsenic Dislodgeable Residues and Contaminated Soil from Treated Wood Playsets and Residential Decks in Warm Climate (children with PICA behavior) [Based on short-term ADD from Table 33 in SHEDS-Wood document]*

Pathway Deck n mean std p50 min p05 p25 p75 p95 p99 max
Total Dose 0 731 1.5E-05 3.3E-05 7.3E-06 1.2E-08 1.0E-06 3.4E-06 1.6E-05 4.4E-05 1.2E-04 7.1E-04Playset Total Dose 0 731 1.5E-05 3.3E-05 7.3E-06 1.2E-08 1.0E-06 3.4E-06 1.6E-05 4.4E-05 1.2E-04 7.1E-04Playset Surf Inges-HandToMouth Dose 0 731 1.1E-05 3.2E-05 4.0E-06 7.7E-09 3.7E-07 1.6E-06 1.1E-05 3.6E-05 1.1E-04 7.1E-04Playset Soil Inges-Direct Dose 0 731 2.7E-06 5.7E-06 9.5E-07 9.5E-10 5.3E-08 3.1E-07 2.9E-06 1.1E-05 2.8E-05 8.9E-05Playset Surf Derm Dose 0 731 1.8E-08 3.8E-08 8.4E-09 2.6E-11 9.6E-10 3.4E-09 2.1E-08 6.0E-08 1.4E-07 7.5E-07Playset Soil Derm Dose 0 731 6.1E-07 7.7E-07 4.0E-07 6.8E-10 4.7E-08 1.8E-07 7.5E-07 1.8E-06 3.7E-06 9.4E-06
Total Dose 1 740 2.9E-05 5.0E-05 1.7E-05 4.1E-07 2.3E-06 7.3E-06 3.2E-05 9.8E-05 2.3E-04 8.6E-04Playset Total Dose 1 740 1.4E-05 2.1E-05 7.6E-06 6.3E-08 1.0E-06 3.3E-06 1.6E-05 4.1E-05 1.2E-04 2.9E-04Playset Surf Inges-HandToMouth Dose 1 740 1.1E-05 2.1E-05 5.5E-06 3.8E-08 4.0E-07 1.9E-06 1.3E-05 3.9E-05 1.1E-04 2.9E-04Playset Soil Inges-Direct Dose 1 740 1.7E-06 3.3E-06 5.5E-07 4.1E-09 3.6E-08 2.1E-07 1.7E-06 7.8E-06 1.5E-05 3.2E-05Playset Surf Derm Dose 1 740 1.9E-08 3.1E-08 9.9E-09 5.1E-11 1.2E-09 4.3E-09 2.1E-08 6.1E-08 1.6E-07 3.7E-07Playset Soil Derm Dose 1 740 3.7E-07 4.7E-07 2.2E-07 1.7E-09 2.8E-08 1.1E-07 4.5E-07 1.1E-06 2.7E-06 5.2E-06Deck Total Dose 1 740 1.6E-05 3.3E-05 6.9E-06 1.3E-07 6.9E-07 2.7E-06 1.7E-05 5.6E-05 1.3E-04 5.7E-04Deck Surf Inges-HandToMouth Dose 1 740 1.5E-05 3.3E-05 6.4E-06 5.9E-08 4.9E-07 2.3E-06 1.7E-05 5.6E-05 1.2E-04 5.7E-04Deck Soil Inges-Direct Dose 1 740 3.3E-07 1.0E-06 8.8E-08 5.3E-11 2.8E-09 2.2E-08 2.6E-07 1.3E-06 3.8E-06 1.6E-05Deck Surf Derm Dose 1 740 2.9E-08 5.9E-08 1.4E-08 8.8E-11 1.2E-09 5.5E-09 3.2E-08 8.7E-08 1.9E-07 9.0E-07Deck Soil Derm Dose 1 740 7.9E-08 1.1E-07 4.2E-08 1.6E-12 1.3E-09 1.5E-08 9.3E-08 3.0E-07 5.6E-07 9.3E-07
* Cancer Risks calculated by multiplying the slope factor (Q1*) times the LADD reported in the revised Table 35 of the SHEDS-Wood document.The slope factor (Q1*) of 3.67 (mg/kg/day)-1 is used in this assessment.
Table 8. Probabilistic Estimates of Cancer Risks for Children Exposed to Arsenic Dislodgeable Residues and Contaminated Soil from Treated Wood Playsets and Residential Decks in Warm Climate (Dermal Residue Absorption Rate =0.01%)[Based on LADDs in Table 35 from the SHEDS-Wood Document]*
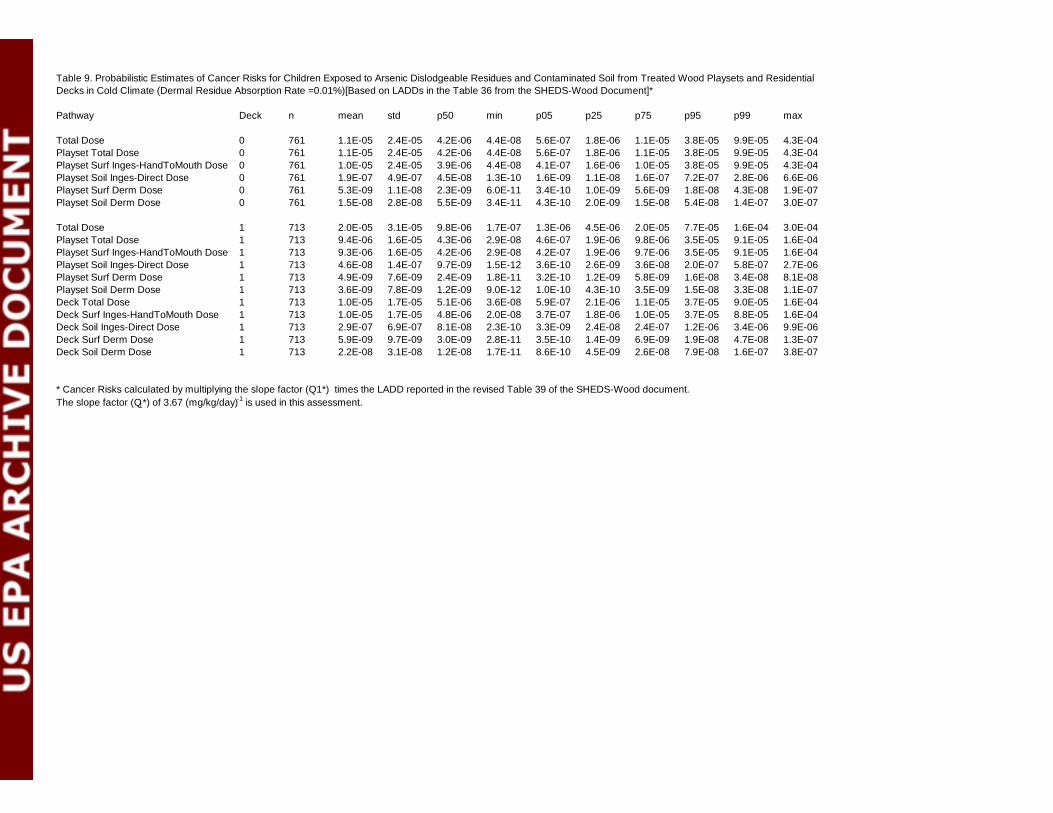
Pathway Deck n mean std p50 min p05 p25 p75 p95 p99 max
Total Dose 0 761 1.1E-05 2.4E-05 4.2E-06 4.4E-08 5.6E-07 1.8E-06 1.1E-05 3.8E-05 9.9E-05 4.3E-04Playset Total Dose 0 761 1.1E-05 2.4E-05 4.2E-06 4.4E-08 5.6E-07 1.8E-06 1.1E-05 3.8E-05 9.9E-05 4.3E-04Playset Surf Inges-HandToMouth Dose 0 761 1.0E-05 2.4E-05 3.9E-06 4.4E-08 4.1E-07 1.6E-06 1.0E-05 3.8E-05 9.9E-05 4.3E-04Playset Soil Inges-Direct Dose 0 761 1.9E-07 4.9E-07 4.5E-08 1.3E-10 1.6E-09 1.1E-08 1.6E-07 7.2E-07 2.8E-06 6.6E-06Playset Surf Derm Dose 0 761 5.3E-09 1.1E-08 2.3E-09 6.0E-11 3.4E-10 1.0E-09 5.6E-09 1.8E-08 4.3E-08 1.9E-07Playset Soil Derm Dose 0 761 1.5E-08 2.8E-08 5.5E-09 3.4E-11 4.3E-10 2.0E-09 1.5E-08 5.4E-08 1.4E-07 3.0E-07
Total Dose 1 713 2.0E-05 3.1E-05 9.8E-06 1.7E-07 1.3E-06 4.5E-06 2.0E-05 7.7E-05 1.6E-04 3.0E-04Playset Total Dose 1 713 9.4E-06 1.6E-05 4.3E-06 2.9E-08 4.6E-07 1.9E-06 9.8E-06 3.5E-05 9.1E-05 1.6E-04Playset Surf Inges-HandToMouth Dose 1 713 9.3E-06 1.6E-05 4.2E-06 2.9E-08 4.2E-07 1.9E-06 9.7E-06 3.5E-05 9.1E-05 1.6E-04Playset Soil Inges-Direct Dose 1 713 4.6E-08 1.4E-07 9.7E-09 1.5E-12 3.6E-10 2.6E-09 3.6E-08 2.0E-07 5.8E-07 2.7E-06Playset Surf Derm Dose 1 713 4.9E-09 7.6E-09 2.4E-09 1.8E-11 3.2E-10 1.2E-09 5.8E-09 1.6E-08 3.4E-08 8.1E-08Playset Soil Derm Dose 1 713 3.6E-09 7.8E-09 1.2E-09 9.0E-12 1.0E-10 4.3E-10 3.5E-09 1.5E-08 3.3E-08 1.1E-07Deck Total Dose 1 713 1.0E-05 1.7E-05 5.1E-06 3.6E-08 5.9E-07 2.1E-06 1.1E-05 3.7E-05 9.0E-05 1.6E-04Deck Surf Inges-HandToMouth Dose 1 713 1.0E-05 1.7E-05 4.8E-06 2.0E-08 3.7E-07 1.8E-06 1.0E-05 3.7E-05 8.8E-05 1.6E-04Deck Soil Inges-Direct Dose 1 713 2.9E-07 6.9E-07 8.1E-08 2.3E-10 3.3E-09 2.4E-08 2.4E-07 1.2E-06 3.4E-06 9.9E-06Deck Surf Derm Dose 1 713 5.9E-09 9.7E-09 3.0E-09 2.8E-11 3.5E-10 1.4E-09 6.9E-09 1.9E-08 4.7E-08 1.3E-07Deck Soil Derm Dose 1 713 2.2E-08 3.1E-08 1.2E-08 1.7E-11 8.6E-10 4.5E-09 2.6E-08 7.9E-08 1.6E-07 3.8E-07
* Cancer Risks calculated by multiplying the slope factor (Q1*) times the LADD reported in the revised Table 39 of the SHEDS-Wood document.The slope factor (Q1*) of 3.67 (mg/kg/day)-1 is used in this assessment.
Table 9. Probabilistic Estimates of Cancer Risks for Children Exposed to Arsenic Dislodgeable Residues and Contaminated Soil from Treated Wood Playsets and Residential Decks in Cold Climate (Dermal Residue Absorption Rate =0.01%)[Based on LADDs in the Table 36 from the SHEDS-Wood Document]*
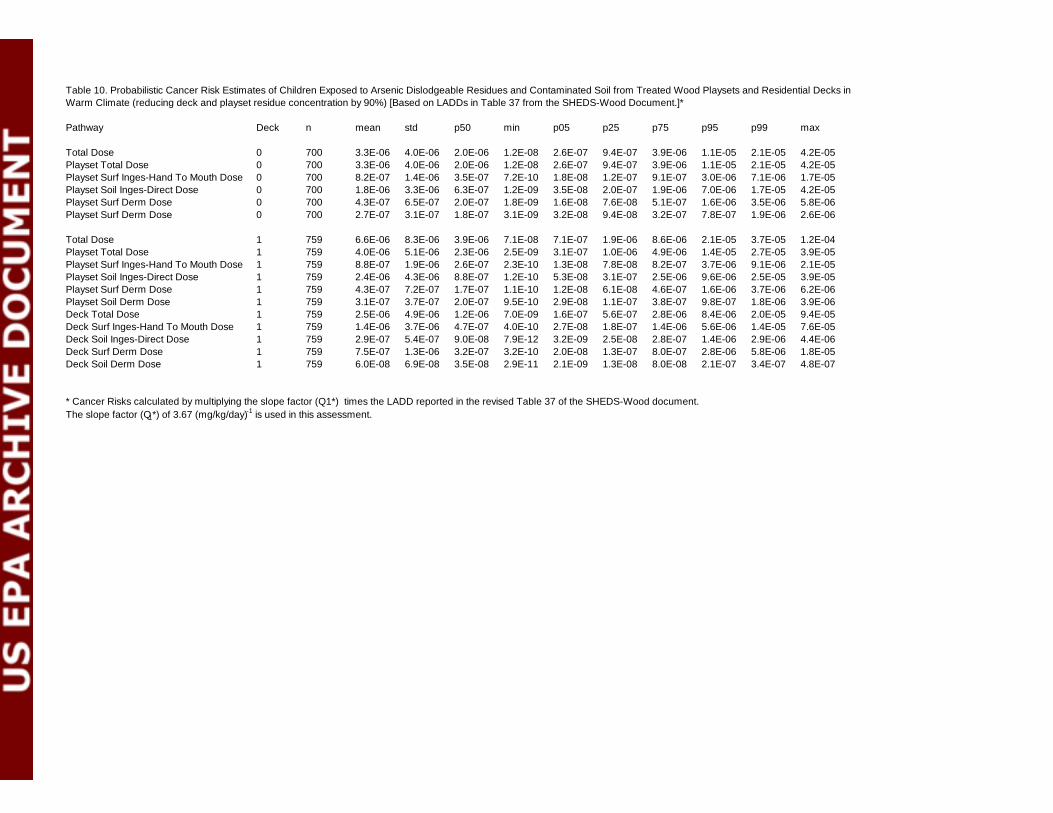
Pathway Deck n mean std p50 min p05 p25 p75 p95 p99 max
Total Dose 0 700 3.3E-06 4.0E-06 2.0E-06 1.2E-08 2.6E-07 9.4E-07 3.9E-06 1.1E-05 2.1E-05 4.2E-05Playset Total Dose 0 700 3.3E-06 4.0E-06 2.0E-06 1.2E-08 2.6E-07 9.4E-07 3.9E-06 1.1E-05 2.1E-05 4.2E-05Playset Surf Inges-Hand To Mouth Dose 0 700 8.2E-07 1.4E-06 3.5E-07 7.2E-10 1.8E-08 1.2E-07 9.1E-07 3.0E-06 7.1E-06 1.7E-05Playset Soil Inges-Direct Dose 0 700 1.8E-06 3.3E-06 6.3E-07 1.2E-09 3.5E-08 2.0E-07 1.9E-06 7.0E-06 1.7E-05 4.2E-05Playset Surf Derm Dose 0 700 4.3E-07 6.5E-07 2.0E-07 1.8E-09 1.6E-08 7.6E-08 5.1E-07 1.6E-06 3.5E-06 5.8E-06Playset Surf Derm Dose 0 700 2.7E-07 3.1E-07 1.8E-07 3.1E-09 3.2E-08 9.4E-08 3.2E-07 7.8E-07 1.9E-06 2.6E-06
Total Dose 1 759 6.6E-06 8.3E-06 3.9E-06 7.1E-08 7.1E-07 1.9E-06 8.6E-06 2.1E-05 3.7E-05 1.2E-04Playset Total Dose 1 759 4.0E-06 5.1E-06 2.3E-06 2.5E-09 3.1E-07 1.0E-06 4.9E-06 1.4E-05 2.7E-05 3.9E-05Playset Surf Inges-Hand To Mouth Dose 1 759 8.8E-07 1.9E-06 2.6E-07 2.3E-10 1.3E-08 7.8E-08 8.2E-07 3.7E-06 9.1E-06 2.1E-05Playset Soil Inges-Direct Dose 1 759 2.4E-06 4.3E-06 8.8E-07 1.2E-10 5.3E-08 3.1E-07 2.5E-06 9.6E-06 2.5E-05 3.9E-05Playset Surf Derm Dose 1 759 4.3E-07 7.2E-07 1.7E-07 1.1E-10 1.2E-08 6.1E-08 4.6E-07 1.6E-06 3.7E-06 6.2E-06Playset Soil Derm Dose 1 759 3.1E-07 3.7E-07 2.0E-07 9.5E-10 2.9E-08 1.1E-07 3.8E-07 9.8E-07 1.8E-06 3.9E-06Deck Total Dose 1 759 2.5E-06 4.9E-06 1.2E-06 7.0E-09 1.6E-07 5.6E-07 2.8E-06 8.4E-06 2.0E-05 9.4E-05Deck Surf Inges-Hand To Mouth Dose 1 759 1.4E-06 3.7E-06 4.7E-07 4.0E-10 2.7E-08 1.8E-07 1.4E-06 5.6E-06 1.4E-05 7.6E-05Deck Soil Inges-Direct Dose 1 759 2.9E-07 5.4E-07 9.0E-08 7.9E-12 3.2E-09 2.5E-08 2.8E-07 1.4E-06 2.9E-06 4.4E-06Deck Surf Derm Dose 1 759 7.5E-07 1.3E-06 3.2E-07 3.2E-10 2.0E-08 1.3E-07 8.0E-07 2.8E-06 5.8E-06 1.8E-05Deck Soil Derm Dose 1 759 6.0E-08 6.9E-08 3.5E-08 2.9E-11 2.1E-09 1.3E-08 8.0E-08 2.1E-07 3.4E-07 4.8E-07
* Cancer Risks calculated by multiplying the slope factor (Q1*) times the LADD reported in the revised Table 37 of the SHEDS-Wood document.The slope factor (Q1*) of 3.67 (mg/kg/day)-1 is used in this assessment.
Table 10. Probabilistic Cancer Risk Estimates of Children Exposed to Arsenic Dislodgeable Residues and Contaminated Soil from Treated Wood Playsets and Residential Decks in Warm Climate (reducing deck and playset residue concentration by 90%) [Based on LADDs in Table 37 from the SHEDS-Wood Document.]*
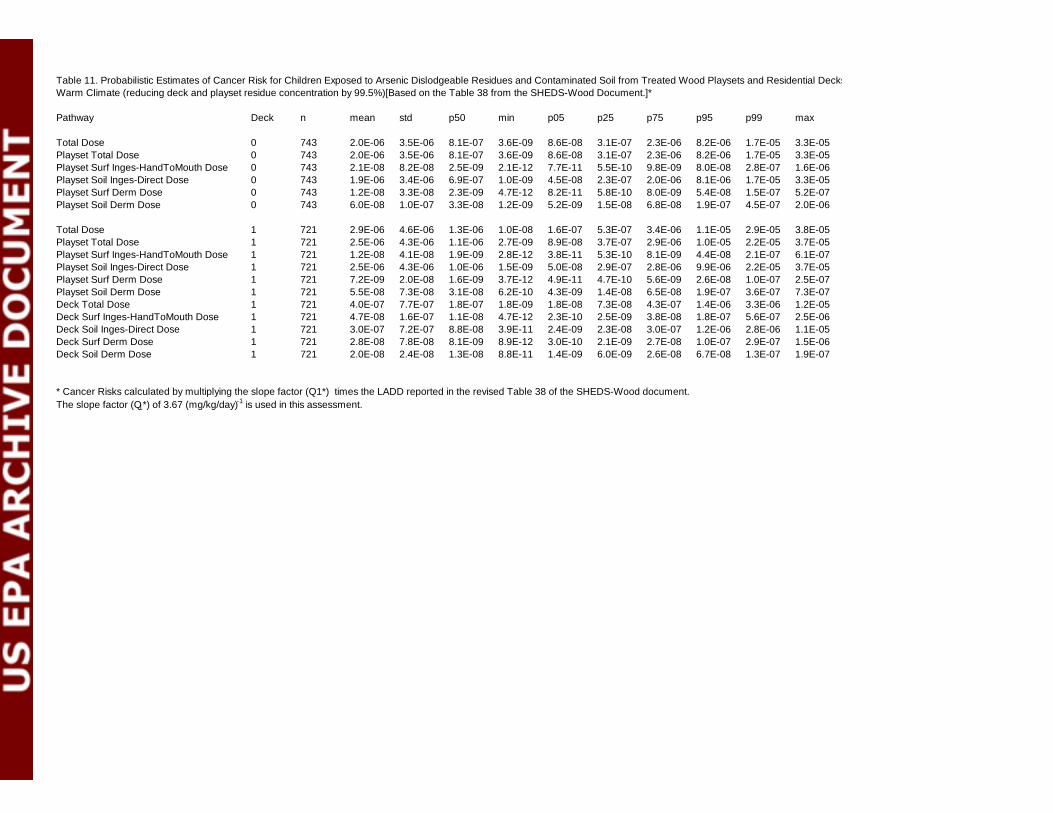
Pathway Deck n mean std p50 min p05 p25 p75 p95 p99 max
Total Dose 0 743 2.0E-06 3.5E-06 8.1E-07 3.6E-09 8.6E-08 3.1E-07 2.3E-06 8.2E-06 1.7E-05 3.3E-05Playset Total Dose 0 743 2.0E-06 3.5E-06 8.1E-07 3.6E-09 8.6E-08 3.1E-07 2.3E-06 8.2E-06 1.7E-05 3.3E-05Playset Surf Inges-HandToMouth Dose 0 743 2.1E-08 8.2E-08 2.5E-09 2.1E-12 7.7E-11 5.5E-10 9.8E-09 8.0E-08 2.8E-07 1.6E-06Playset Soil Inges-Direct Dose 0 743 1.9E-06 3.4E-06 6.9E-07 1.0E-09 4.5E-08 2.3E-07 2.0E-06 8.1E-06 1.7E-05 3.3E-05Playset Surf Derm Dose 0 743 1.2E-08 3.3E-08 2.3E-09 4.7E-12 8.2E-11 5.8E-10 8.0E-09 5.4E-08 1.5E-07 5.2E-07Playset Soil Derm Dose 0 743 6.0E-08 1.0E-07 3.3E-08 1.2E-09 5.2E-09 1.5E-08 6.8E-08 1.9E-07 4.5E-07 2.0E-06
Total Dose 1 721 2.9E-06 4.6E-06 1.3E-06 1.0E-08 1.6E-07 5.3E-07 3.4E-06 1.1E-05 2.9E-05 3.8E-05Playset Total Dose 1 721 2.5E-06 4.3E-06 1.1E-06 2.7E-09 8.9E-08 3.7E-07 2.9E-06 1.0E-05 2.2E-05 3.7E-05Playset Surf Inges-HandToMouth Dose 1 721 1.2E-08 4.1E-08 1.9E-09 2.8E-12 3.8E-11 5.3E-10 8.1E-09 4.4E-08 2.1E-07 6.1E-07Playset Soil Inges-Direct Dose 1 721 2.5E-06 4.3E-06 1.0E-06 1.5E-09 5.0E-08 2.9E-07 2.8E-06 9.9E-06 2.2E-05 3.7E-05Playset Surf Derm Dose 1 721 7.2E-09 2.0E-08 1.6E-09 3.7E-12 4.9E-11 4.7E-10 5.6E-09 2.6E-08 1.0E-07 2.5E-07Playset Soil Derm Dose 1 721 5.5E-08 7.3E-08 3.1E-08 6.2E-10 4.3E-09 1.4E-08 6.5E-08 1.9E-07 3.6E-07 7.3E-07Deck Total Dose 1 721 4.0E-07 7.7E-07 1.8E-07 1.8E-09 1.8E-08 7.3E-08 4.3E-07 1.4E-06 3.3E-06 1.2E-05Deck Surf Inges-HandToMouth Dose 1 721 4.7E-08 1.6E-07 1.1E-08 4.7E-12 2.3E-10 2.5E-09 3.8E-08 1.8E-07 5.6E-07 2.5E-06Deck Soil Inges-Direct Dose 1 721 3.0E-07 7.2E-07 8.8E-08 3.9E-11 2.4E-09 2.3E-08 3.0E-07 1.2E-06 2.8E-06 1.1E-05Deck Surf Derm Dose 1 721 2.8E-08 7.8E-08 8.1E-09 8.9E-12 3.0E-10 2.1E-09 2.7E-08 1.0E-07 2.9E-07 1.5E-06Deck Soil Derm Dose 1 721 2.0E-08 2.4E-08 1.3E-08 8.8E-11 1.4E-09 6.0E-09 2.6E-08 6.7E-08 1.3E-07 1.9E-07
* Cancer Risks calculated by multiplying the slope factor (Q1*) times the LADD reported in the revised Table 38 of the SHEDS-Wood document.The slope factor (Q1*) of 3.67 (mg/kg/day)-1 is used in this assessment.
Table 11. Probabilistic Estimates of Cancer Risk for Children Exposed to Arsenic Dislodgeable Residues and Contaminated Soil from Treated Wood Playsets and Residential Decks in Warm Climate (reducing deck and playset residue concentration by 99.5%)[Based on the Table 38 from the SHEDS-Wood Document.]*
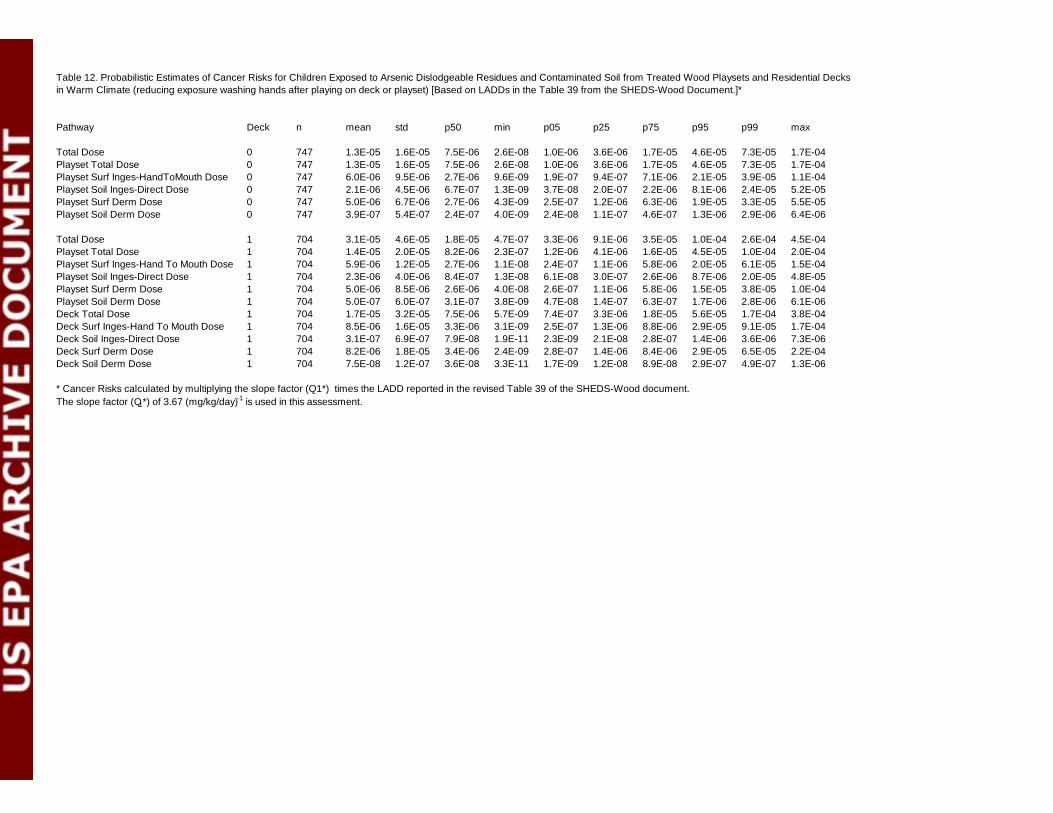
Pathway Deck n mean std p50 min p05 p25 p75 p95 p99 max
Total Dose 0 747 1.3E-05 1.6E-05 7.5E-06 2.6E-08 1.0E-06 3.6E-06 1.7E-05 4.6E-05 7.3E-05 1.7E-04Playset Total Dose 0 747 1.3E-05 1.6E-05 7.5E-06 2.6E-08 1.0E-06 3.6E-06 1.7E-05 4.6E-05 7.3E-05 1.7E-04Playset Surf Inges-HandToMouth Dose 0 747 6.0E-06 9.5E-06 2.7E-06 9.6E-09 1.9E-07 9.4E-07 7.1E-06 2.1E-05 3.9E-05 1.1E-04Playset Soil Inges-Direct Dose 0 747 2.1E-06 4.5E-06 6.7E-07 1.3E-09 3.7E-08 2.0E-07 2.2E-06 8.1E-06 2.4E-05 5.2E-05Playset Surf Derm Dose 0 747 5.0E-06 6.7E-06 2.7E-06 4.3E-09 2.5E-07 1.2E-06 6.3E-06 1.9E-05 3.3E-05 5.5E-05Playset Soil Derm Dose 0 747 3.9E-07 5.4E-07 2.4E-07 4.0E-09 2.4E-08 1.1E-07 4.6E-07 1.3E-06 2.9E-06 6.4E-06
Total Dose 1 704 3.1E-05 4.6E-05 1.8E-05 4.7E-07 3.3E-06 9.1E-06 3.5E-05 1.0E-04 2.6E-04 4.5E-04Playset Total Dose 1 704 1.4E-05 2.0E-05 8.2E-06 2.3E-07 1.2E-06 4.1E-06 1.6E-05 4.5E-05 1.0E-04 2.0E-04Playset Surf Inges-Hand To Mouth Dose 1 704 5.9E-06 1.2E-05 2.7E-06 1.1E-08 2.4E-07 1.1E-06 5.8E-06 2.0E-05 6.1E-05 1.5E-04Playset Soil Inges-Direct Dose 1 704 2.3E-06 4.0E-06 8.4E-07 1.3E-08 6.1E-08 3.0E-07 2.6E-06 8.7E-06 2.0E-05 4.8E-05Playset Surf Derm Dose 1 704 5.0E-06 8.5E-06 2.6E-06 4.0E-08 2.6E-07 1.1E-06 5.8E-06 1.5E-05 3.8E-05 1.0E-04Playset Soil Derm Dose 1 704 5.0E-07 6.0E-07 3.1E-07 3.8E-09 4.7E-08 1.4E-07 6.3E-07 1.7E-06 2.8E-06 6.1E-06Deck Total Dose 1 704 1.7E-05 3.2E-05 7.5E-06 5.7E-09 7.4E-07 3.3E-06 1.8E-05 5.6E-05 1.7E-04 3.8E-04Deck Surf Inges-Hand To Mouth Dose 1 704 8.5E-06 1.6E-05 3.3E-06 3.1E-09 2.5E-07 1.3E-06 8.8E-06 2.9E-05 9.1E-05 1.7E-04Deck Soil Inges-Direct Dose 1 704 3.1E-07 6.9E-07 7.9E-08 1.9E-11 2.3E-09 2.1E-08 2.8E-07 1.4E-06 3.6E-06 7.3E-06Deck Surf Derm Dose 1 704 8.2E-06 1.8E-05 3.4E-06 2.4E-09 2.8E-07 1.4E-06 8.4E-06 2.9E-05 6.5E-05 2.2E-04Deck Soil Derm Dose 1 704 7.5E-08 1.2E-07 3.6E-08 3.3E-11 1.7E-09 1.2E-08 8.9E-08 2.9E-07 4.9E-07 1.3E-06
* Cancer Risks calculated by multiplying the slope factor (Q1*) times the LADD reported in the revised Table 39 of the SHEDS-Wood document.The slope factor (Q1*) of 3.67 (mg/kg/day)-1 is used in this assessment.
Table 12. Probabilistic Estimates of Cancer Risks for Children Exposed to Arsenic Dislodgeable Residues and Contaminated Soil from Treated Wood Playsets and Residential Decks in Warm Climate (reducing exposure washing hands after playing on deck or playset) [Based on LADDs in the Table 39 from the SHEDS-Wood Document.]*
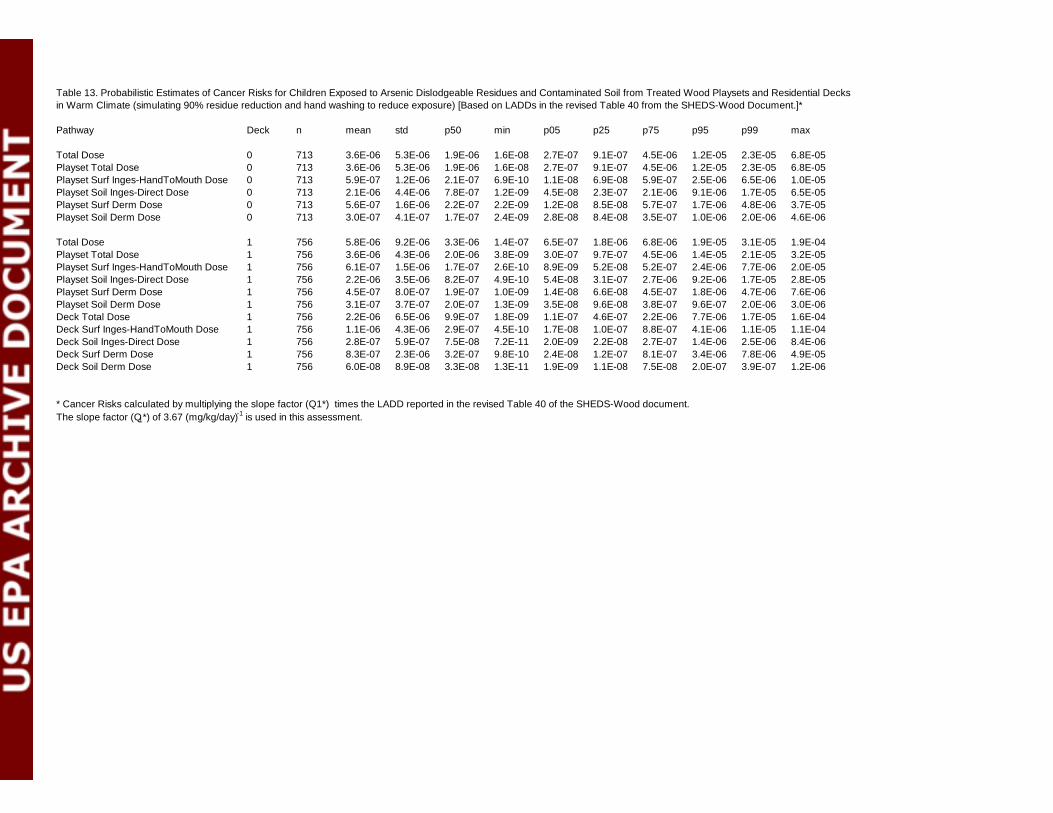
Pathway Deck n mean std p50 min p05 p25 p75 p95 p99 max
Total Dose 0 713 3.6E-06 5.3E-06 1.9E-06 1.6E-08 2.7E-07 9.1E-07 4.5E-06 1.2E-05 2.3E-05 6.8E-05Playset Total Dose 0 713 3.6E-06 5.3E-06 1.9E-06 1.6E-08 2.7E-07 9.1E-07 4.5E-06 1.2E-05 2.3E-05 6.8E-05Playset Surf Inges-HandToMouth Dose 0 713 5.9E-07 1.2E-06 2.1E-07 6.9E-10 1.1E-08 6.9E-08 5.9E-07 2.5E-06 6.5E-06 1.0E-05Playset Soil Inges-Direct Dose 0 713 2.1E-06 4.4E-06 7.8E-07 1.2E-09 4.5E-08 2.3E-07 2.1E-06 9.1E-06 1.7E-05 6.5E-05Playset Surf Derm Dose 0 713 5.6E-07 1.6E-06 2.2E-07 2.2E-09 1.2E-08 8.5E-08 5.7E-07 1.7E-06 4.8E-06 3.7E-05Playset Soil Derm Dose 0 713 3.0E-07 4.1E-07 1.7E-07 2.4E-09 2.8E-08 8.4E-08 3.5E-07 1.0E-06 2.0E-06 4.6E-06
Total Dose 1 756 5.8E-06 9.2E-06 3.3E-06 1.4E-07 6.5E-07 1.8E-06 6.8E-06 1.9E-05 3.1E-05 1.9E-04Playset Total Dose 1 756 3.6E-06 4.3E-06 2.0E-06 3.8E-09 3.0E-07 9.7E-07 4.5E-06 1.4E-05 2.1E-05 3.2E-05Playset Surf Inges-HandToMouth Dose 1 756 6.1E-07 1.5E-06 1.7E-07 2.6E-10 8.9E-09 5.2E-08 5.2E-07 2.4E-06 7.7E-06 2.0E-05Playset Soil Inges-Direct Dose 1 756 2.2E-06 3.5E-06 8.2E-07 4.9E-10 5.4E-08 3.1E-07 2.7E-06 9.2E-06 1.7E-05 2.8E-05Playset Surf Derm Dose 1 756 4.5E-07 8.0E-07 1.9E-07 1.0E-09 1.4E-08 6.6E-08 4.5E-07 1.8E-06 4.7E-06 7.6E-06Playset Soil Derm Dose 1 756 3.1E-07 3.7E-07 2.0E-07 1.3E-09 3.5E-08 9.6E-08 3.8E-07 9.6E-07 2.0E-06 3.0E-06Deck Total Dose 1 756 2.2E-06 6.5E-06 9.9E-07 1.8E-09 1.1E-07 4.6E-07 2.2E-06 7.7E-06 1.7E-05 1.6E-04Deck Surf Inges-HandToMouth Dose 1 756 1.1E-06 4.3E-06 2.9E-07 4.5E-10 1.7E-08 1.0E-07 8.8E-07 4.1E-06 1.1E-05 1.1E-04Deck Soil Inges-Direct Dose 1 756 2.8E-07 5.9E-07 7.5E-08 7.2E-11 2.0E-09 2.2E-08 2.7E-07 1.4E-06 2.5E-06 8.4E-06Deck Surf Derm Dose 1 756 8.3E-07 2.3E-06 3.2E-07 9.8E-10 2.4E-08 1.2E-07 8.1E-07 3.4E-06 7.8E-06 4.9E-05Deck Soil Derm Dose 1 756 6.0E-08 8.9E-08 3.3E-08 1.3E-11 1.9E-09 1.1E-08 7.5E-08 2.0E-07 3.9E-07 1.2E-06
* Cancer Risks calculated by multiplying the slope factor (Q1*) times the LADD reported in the revised Table 40 of the SHEDS-Wood document.The slope factor (Q1*) of 3.67 (mg/kg/day)-1 is used in this assessment.
Table 13. Probabilistic Estimates of Cancer Risks for Children Exposed to Arsenic Dislodgeable Residues and Contaminated Soil from Treated Wood Playsets and Residential Decks in Warm Climate (simulating 90% residue reduction and hand washing to reduce exposure) [Based on LADDs in the revised Table 40 from the SHEDS-Wood Document.]*
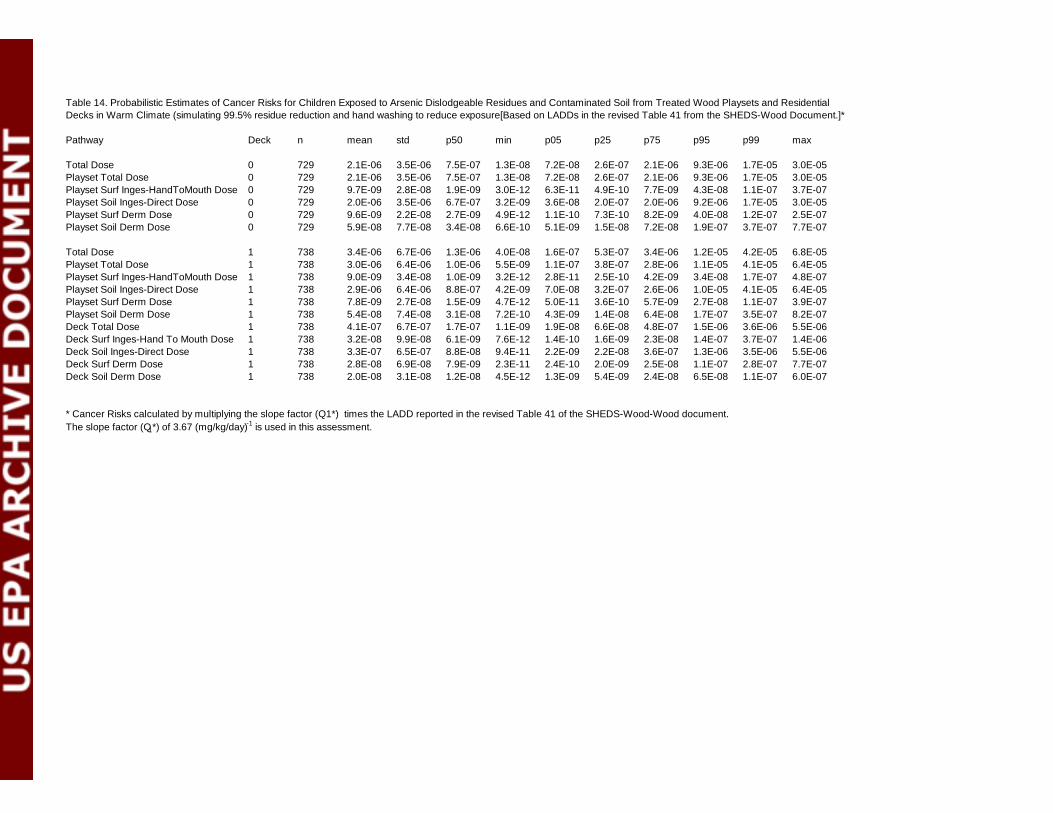
Pathway Deck n mean std p50 min p05 p25 p75 p95 p99 max
Total Dose 0 729 2.1E-06 3.5E-06 7.5E-07 1.3E-08 7.2E-08 2.6E-07 2.1E-06 9.3E-06 1.7E-05 3.0E-05Playset Total Dose 0 729 2.1E-06 3.5E-06 7.5E-07 1.3E-08 7.2E-08 2.6E-07 2.1E-06 9.3E-06 1.7E-05 3.0E-05Playset Surf Inges-HandToMouth Dose 0 729 9.7E-09 2.8E-08 1.9E-09 3.0E-12 6.3E-11 4.9E-10 7.7E-09 4.3E-08 1.1E-07 3.7E-07Playset Soil Inges-Direct Dose 0 729 2.0E-06 3.5E-06 6.7E-07 3.2E-09 3.6E-08 2.0E-07 2.0E-06 9.2E-06 1.7E-05 3.0E-05Playset Surf Derm Dose 0 729 9.6E-09 2.2E-08 2.7E-09 4.9E-12 1.1E-10 7.3E-10 8.2E-09 4.0E-08 1.2E-07 2.5E-07Playset Soil Derm Dose 0 729 5.9E-08 7.7E-08 3.4E-08 6.6E-10 5.1E-09 1.5E-08 7.2E-08 1.9E-07 3.7E-07 7.7E-07
Total Dose 1 738 3.4E-06 6.7E-06 1.3E-06 4.0E-08 1.6E-07 5.3E-07 3.4E-06 1.2E-05 4.2E-05 6.8E-05Playset Total Dose 1 738 3.0E-06 6.4E-06 1.0E-06 5.5E-09 1.1E-07 3.8E-07 2.8E-06 1.1E-05 4.1E-05 6.4E-05Playset Surf Inges-HandToMouth Dose 1 738 9.0E-09 3.4E-08 1.0E-09 3.2E-12 2.8E-11 2.5E-10 4.2E-09 3.4E-08 1.7E-07 4.8E-07Playset Soil Inges-Direct Dose 1 738 2.9E-06 6.4E-06 8.8E-07 4.2E-09 7.0E-08 3.2E-07 2.6E-06 1.0E-05 4.1E-05 6.4E-05Playset Surf Derm Dose 1 738 7.8E-09 2.7E-08 1.5E-09 4.7E-12 5.0E-11 3.6E-10 5.7E-09 2.7E-08 1.1E-07 3.9E-07Playset Soil Derm Dose 1 738 5.4E-08 7.4E-08 3.1E-08 7.2E-10 4.3E-09 1.4E-08 6.4E-08 1.7E-07 3.5E-07 8.2E-07Deck Total Dose 1 738 4.1E-07 6.7E-07 1.7E-07 1.1E-09 1.9E-08 6.6E-08 4.8E-07 1.5E-06 3.6E-06 5.5E-06Deck Surf Inges-Hand To Mouth Dose 1 738 3.2E-08 9.9E-08 6.1E-09 7.6E-12 1.4E-10 1.6E-09 2.3E-08 1.4E-07 3.7E-07 1.4E-06Deck Soil Inges-Direct Dose 1 738 3.3E-07 6.5E-07 8.8E-08 9.4E-11 2.2E-09 2.2E-08 3.6E-07 1.3E-06 3.5E-06 5.5E-06Deck Surf Derm Dose 1 738 2.8E-08 6.9E-08 7.9E-09 2.3E-11 2.4E-10 2.0E-09 2.5E-08 1.1E-07 2.8E-07 7.7E-07Deck Soil Derm Dose 1 738 2.0E-08 3.1E-08 1.2E-08 4.5E-12 1.3E-09 5.4E-09 2.4E-08 6.5E-08 1.1E-07 6.0E-07
* Cancer Risks calculated by multiplying the slope factor (Q1*) times the LADD reported in the revised Table 41 of the SHEDS-Wood-Wood document.The slope factor (Q1*) of 3.67 (mg/kg/day)-1 is used in this assessment.
Table 14. Probabilistic Estimates of Cancer Risks for Children Exposed to Arsenic Dislodgeable Residues and Contaminated Soil from Treated Wood Playsets and Residential Decks in Warm Climate (simulating 99.5% residue reduction and hand washing to reduce exposure[Based on LADDs in the revised Table 41 from the SHEDS-Wood Document.]*

Appendix C
Comparison of Total Risks to Risk Reduction Impacts
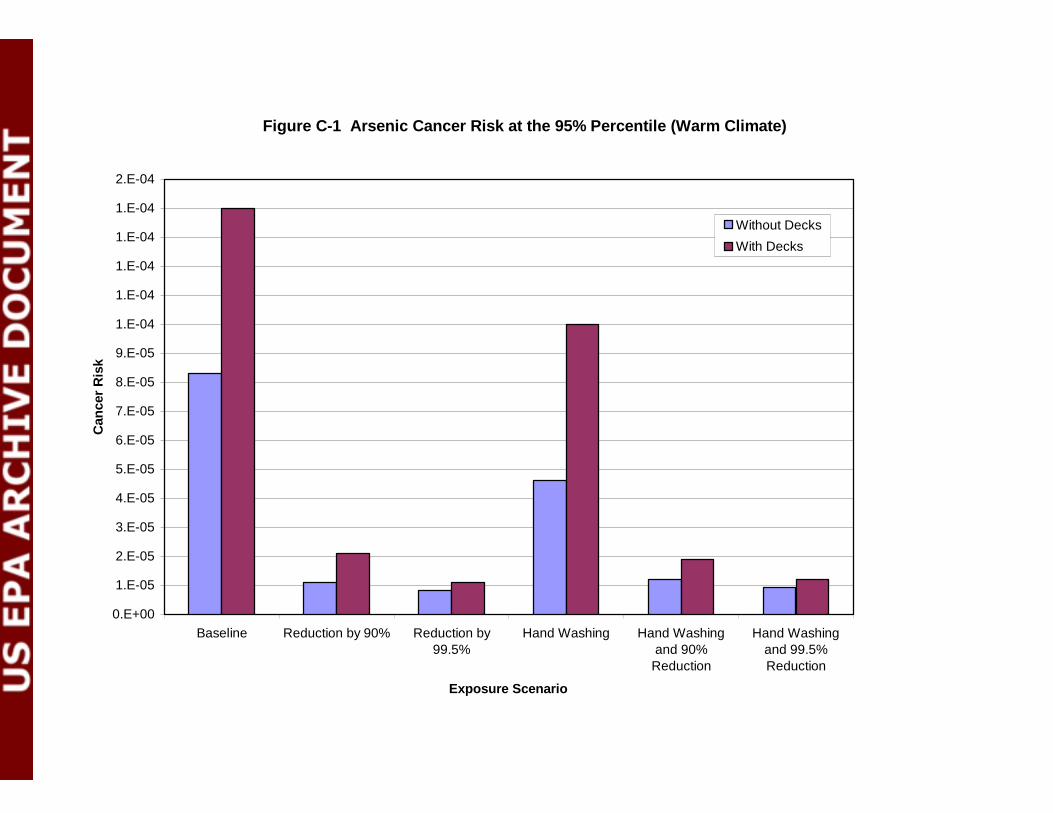
Figure C-1 Arsenic Cancer Risk at the 95% Percentile (Warm Climate)
0.E+00
1.E-05
2.E-05
3.E-05
4.E-05
5.E-05
6.E-05
7.E-05
8.E-05
9.E-05
1.E-04
1.E-04
1.E-04
1.E-04
1.E-04
2.E-04
Baseline Reduction by 90% Reduction by99.5%
Hand Washing Hand Washingand 90%
Reduction
Hand Washingand 99.5%Reduction
Exposure Scenario
Can
cer
Ris
k
Without Decks
With Decks
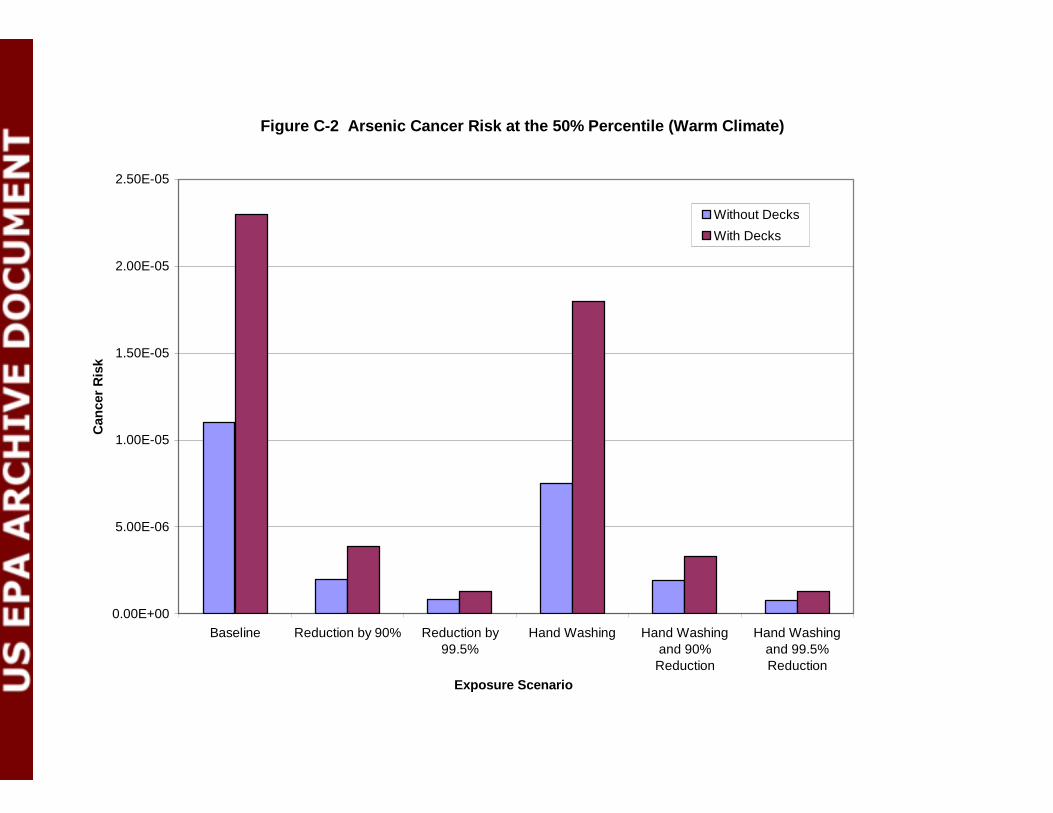
Figure C-2 Arsenic Cancer Risk at the 50% Percentile (Warm Climate)
0.00E+00
5.00E-06
1.00E-05
1.50E-05
2.00E-05
2.50E-05
Baseline Reduction by 90% Reduction by99.5%
Hand Washing Hand Washingand 90%
Reduction
Hand Washingand 99.5%Reduction
Exposure Scenario
Can
cer
Ris
k
Without Decks
With Decks
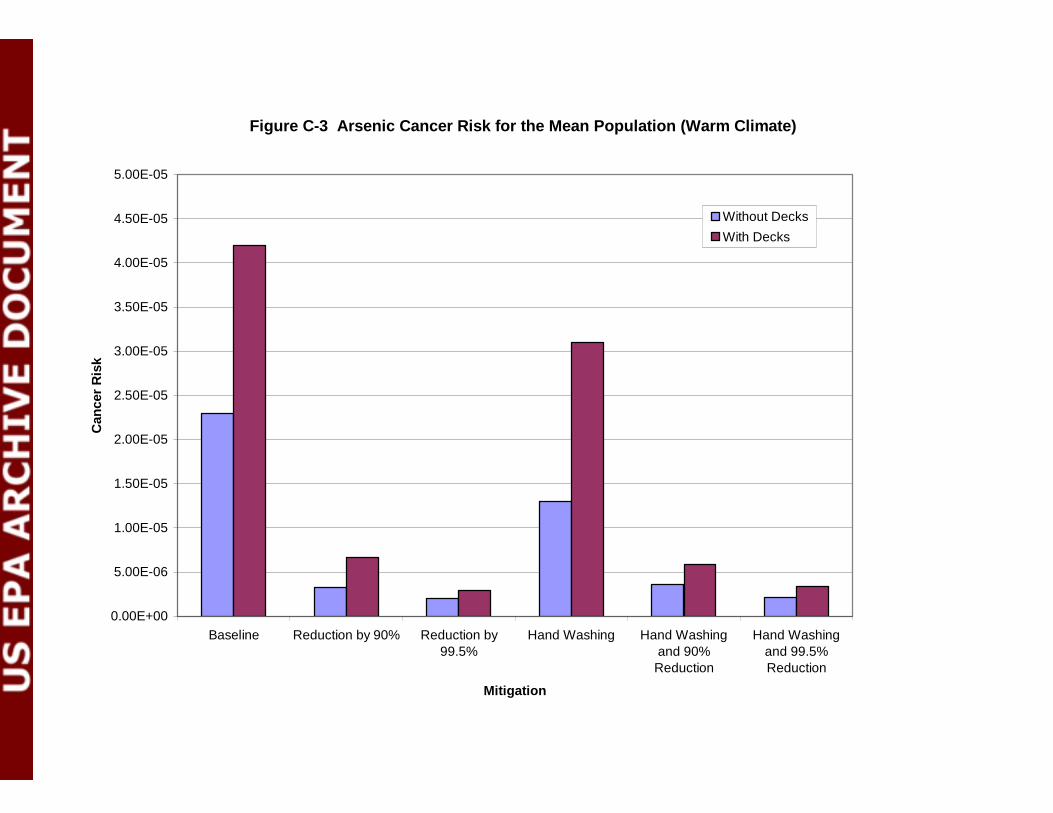
Figure C-3 Arsenic Cancer Risk for the Mean Population (Warm Climate)
0.00E+00
5.00E-06
1.00E-05
1.50E-05
2.00E-05
2.50E-05
3.00E-05
3.50E-05
4.00E-05
4.50E-05
5.00E-05
Baseline Reduction by 90% Reduction by99.5%
Hand Washing Hand Washingand 90%
Reduction
Hand Washingand 99.5%Reduction
Mitigation
Can
cer
Ris
k
Without DecksWith Decks
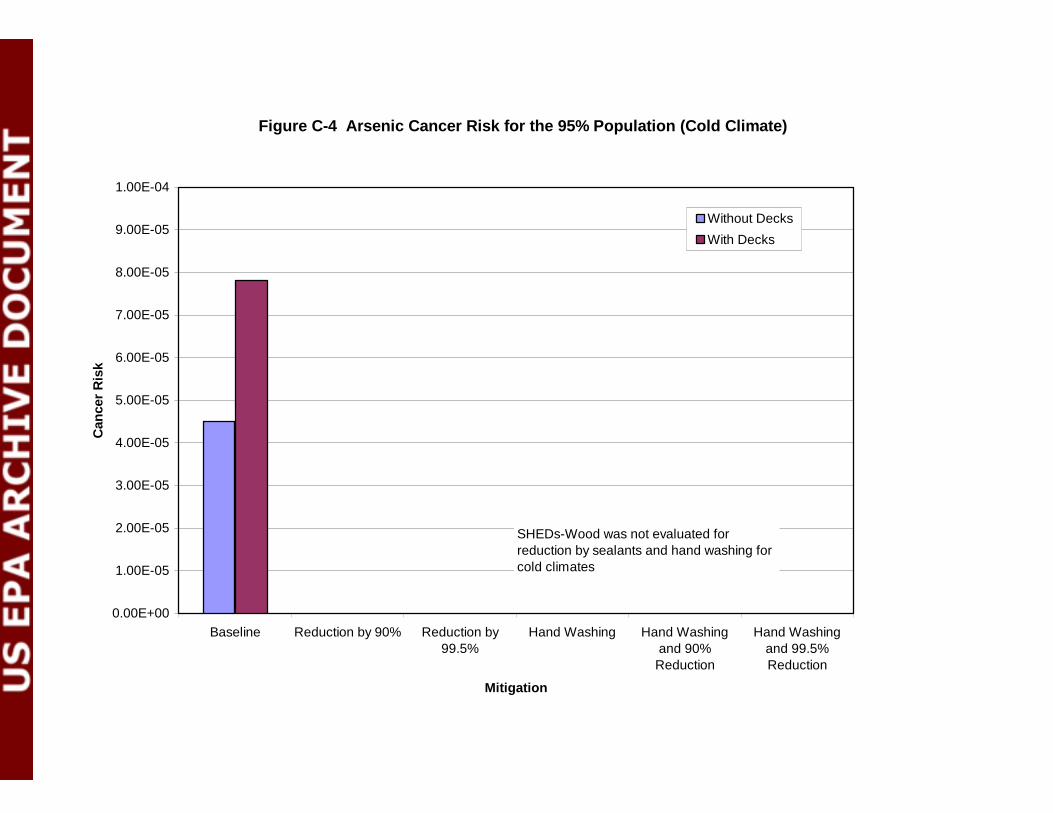
Figure C-4 Arsenic Cancer Risk for the 95% Population (Cold Climate)
0.00E+00
1.00E-05
2.00E-05
3.00E-05
4.00E-05
5.00E-05
6.00E-05
7.00E-05
8.00E-05
9.00E-05
1.00E-04
Baseline Reduction by 90% Reduction by99.5%
Hand Washing Hand Washingand 90%
Reduction
Hand Washingand 99.5%Reduction
Mitigation
Can
cer
Ris
k
Without Decks
With Decks
SHEDs-Wood was not evaluated for reduction by sealants and hand washing for cold climates
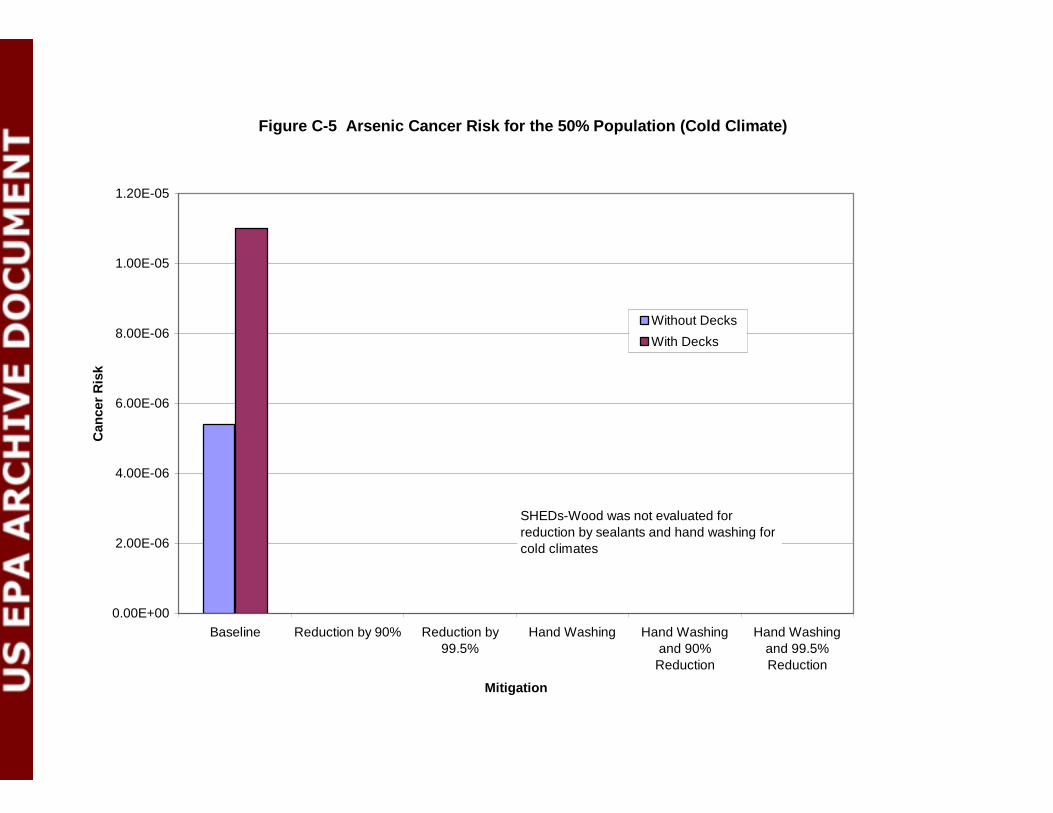
Figure C-5 Arsenic Cancer Risk for the 50% Population (Cold Climate)
0.00E+00
2.00E-06
4.00E-06
6.00E-06
8.00E-06
1.00E-05
1.20E-05
Baseline Reduction by 90% Reduction by99.5%
Hand Washing Hand Washingand 90%
Reduction
Hand Washingand 99.5%Reduction
Mitigation
Can
cer
Ris
k
Without Decks
With Decks
SHEDs-Wood was not evaluated for reduction by sealants and hand washing for cold climates
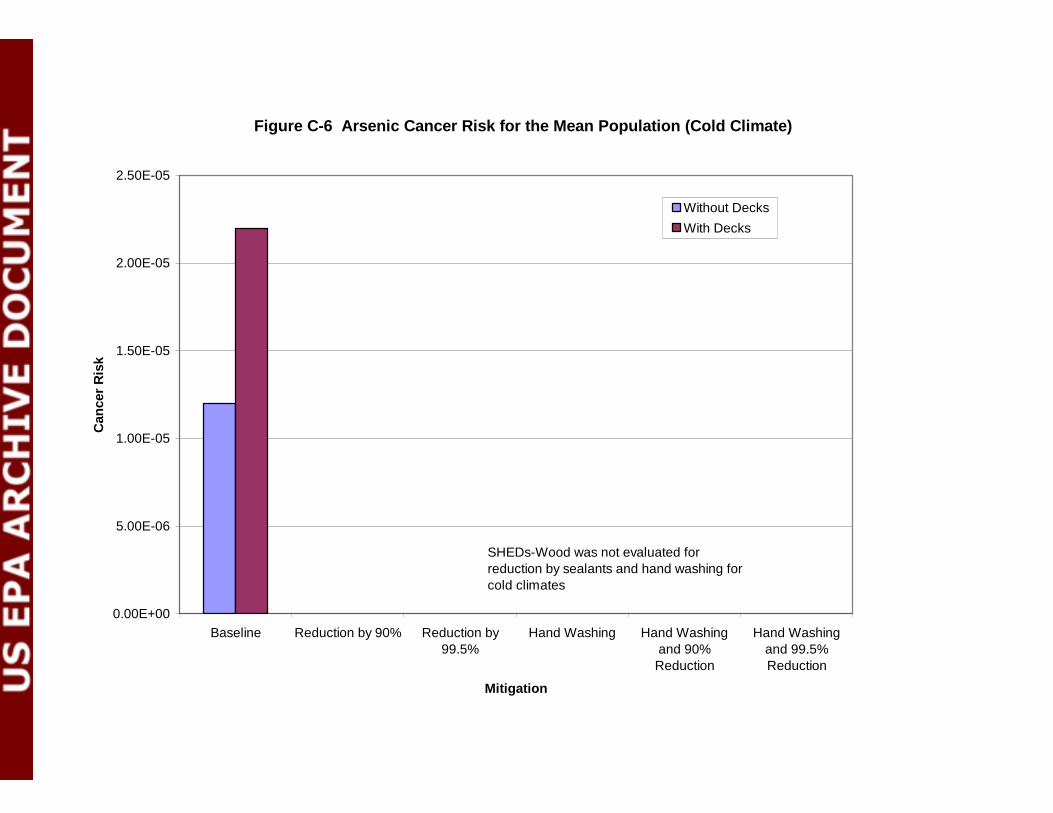
Figure C-6 Arsenic Cancer Risk for the Mean Population (Cold Climate)
0.00E+00
5.00E-06
1.00E-05
1.50E-05
2.00E-05
2.50E-05
Baseline Reduction by 90% Reduction by99.5%
Hand Washing Hand Washingand 90%
Reduction
Hand Washingand 99.5%Reduction
Mitigation
Can
cer
Ris
k
Without DecksWith Decks
SHEDs-Wood was not evaluated for reduction by sealants and hand washing for cold climates
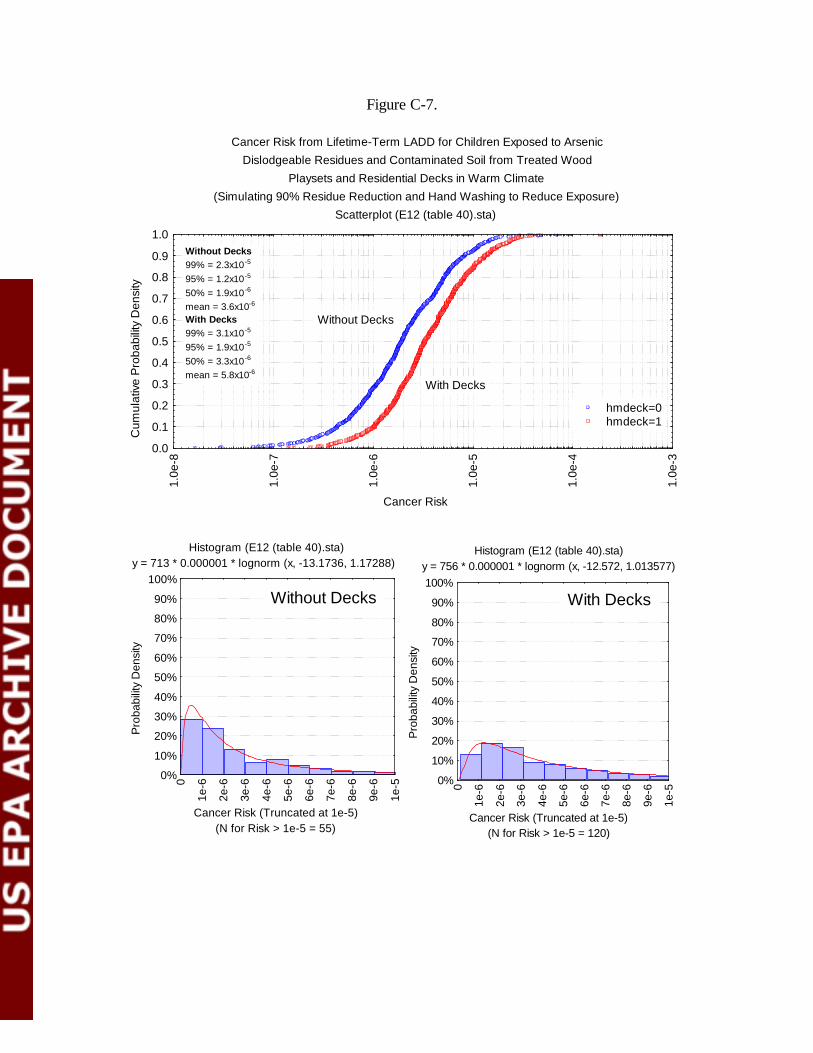
Cancer Risk from Lifetime-Term LADD for Children Exposed to ArsenicDislodgeable Residues and Contaminated Soil from Treated Wood
Playsets and Residential Decks in Warm Climate(Simulating 90% Residue Reduction and Hand Washing to Reduce Exposure)
Scatterplot (E12 (table 40).sta)
Cancer Risk
Cum
ulat
ive
Pro
babi
lity
Den
sity
0.0
0.1
0.2
0.3
0.4
0.5
0.6
0.7
0.8
0.9
1.0
1.0e
-8
1.0e
-7
1.0e
-6
1.0e
-5
1.0e
-4
1.0e
-3
Without Decks
With Decks
hmdeck=0hmdeck=1
Without Decks99% = 2.3x10⁻⁵
95% = 1.2x10⁻⁵
50% = 1.9x10⁻⁶
mean = 3.6x10⁻⁶
With Decks99% = 3.1x10⁻⁵
95% = 1.9x10⁻⁵
50% = 3.3x10⁻⁶
mean = 5.8x10⁻⁶
Histogram (E12 (table 40).sta) y = 713 * 0.000001 * lognorm (x, -13.1736, 1.17288)
(N for Risk > 1e-5 = 55)Cancer Risk (Truncated at 1e-5)
Pro
babi
lity
Den
sity
0%
10%
20%
30%
40%
50%
60%
70%
80%
90%
100%
0
1e-6
2e-6
3e-6
4e-6
5e-6
6e-6
7e-6
8e-6
9e-6
1e-5
Histogram (E12 (table 40).sta) y = 756 * 0.000001 * lognorm (x, -12.572, 1.013577)
(N for Risk > 1e-5 = 120)Cancer Risk (Truncated at 1e-5)
Pro
babi
lity
Den
sity
0%
10%
20%
30%
40%
50%
60%
70%
80%
90%
100%
0
1e-6
2e-6
3e-6
4e-6
5e-6
6e-6
7e-6
8e-6
9e-6
1e-5
Without Decks With Decks
Figure C-7.

Cancer Risk from Lifetime-Term LADD for Children Exposed to ArsenicDislodgeable Residues and Contaminated Soil from Treated Wood
Playsets and Residential Decks in Warm Climate(Simulating 99.5% Residue Reduction and Hand Washing to Reduce Exposure)
Scatterplot (E13 (table 41).sta)
Cancer Risk
Cum
ulat
ive
Pro
babi
lity
Den
sity
0.0
0.1
0.2
0.3
0.4
0.5
0.6
0.7
0.8
0.9
1.0
1.0e
-8
1.0e
-7
1.0e
-6
1.0e
-5
1.0e
-4
Without Decks
With Decks
hmdeck=0hmdeck=1
Without Decks99% = 1.7x10⁻⁵
95% = 9.3x10⁻⁶
50% = 7.5x10⁻⁷
mean = 2.1x10⁻⁶
With Decks99% = 4.2x10⁻⁵
95% = 1.2x10⁻⁵
50% = 1.3x10⁻⁶
mean = 3.4x10⁻⁶
Histogram (E13 (table 41).sta) y = 729 * 0.000001 * lognorm (x, -14.09607, 1.485913)
(N for Risk > 1e-5 = 32)Cancer Risk (Truncated at 1e-5)
Pro
babi
lity
Den
sity
0%
10%
20%
30%
40%
50%
60%
70%
80%
90%
100%
0
1e-6
2e-6
3e-6
4e-6
5e-6
6e-6
7e-6
8e-6
9e-6
1e-5
Histogram (E13 (table 41).sta) y = 738 * 0.000001 * lognorm (x, -13.52167, 1.33602)
(N for Risk > 1e-5 = 50)Cancer Risk (Truncated at 1e-5)
Pro
babi
lity
Den
sity
0%
10%
20%
30%
40%
50%
60%
70%
80%
90%
100%
0
1e-6
2e-6
3e-6
4e-6
5e-6
6e-6
7e-6
8e-6
9e-6
1e-5
Without Decks With Decks
Figure C-8.
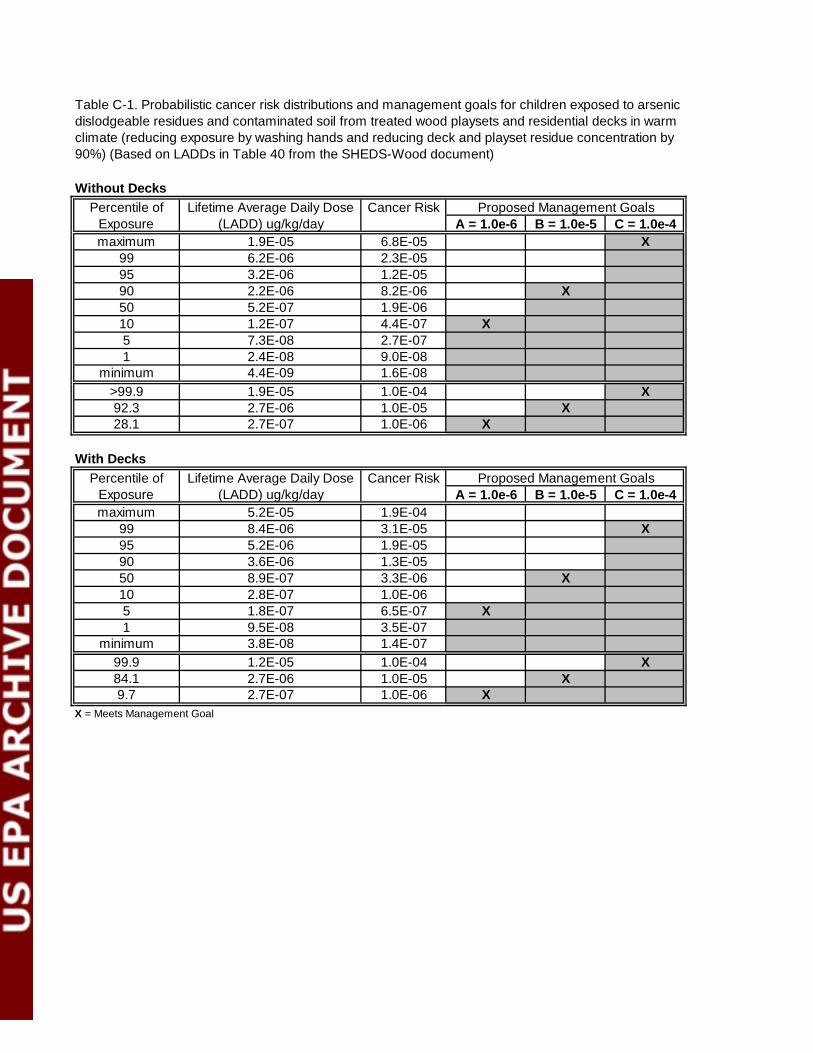
Without Decks
A = 1.0e-6 B = 1.0e-5 C = 1.0e-4maximum 1.9E-05 6.8E-05 X
99 6.2E-06 2.3E-0595 3.2E-06 1.2E-0590 2.2E-06 8.2E-06 X50 5.2E-07 1.9E-0610 1.2E-07 4.4E-07 X5 7.3E-08 2.7E-071 2.4E-08 9.0E-08
minimum 4.4E-09 1.6E-08>99.9 1.9E-05 1.0E-04 X92.3 2.7E-06 1.0E-05 X28.1 2.7E-07 1.0E-06 X
With Decks
A = 1.0e-6 B = 1.0e-5 C = 1.0e-4maximum 5.2E-05 1.9E-04
99 8.4E-06 3.1E-05 X95 5.2E-06 1.9E-0590 3.6E-06 1.3E-0550 8.9E-07 3.3E-06 X10 2.8E-07 1.0E-065 1.8E-07 6.5E-07 X1 9.5E-08 3.5E-07
minimum 3.8E-08 1.4E-0799.9 1.2E-05 1.0E-04 X84.1 2.7E-06 1.0E-05 X9.7 2.7E-07 1.0E-06 X
X = Meets Management Goal
Table C-1. Probabilistic cancer risk distributions and management goals for children exposed to arsenic dislodgeable residues and contaminated soil from treated wood playsets and residential decks in warm climate (reducing exposure by washing hands and reducing deck and playset residue concentration by 90%) (Based on LADDs in Table 40 from the SHEDS-Wood document)
Percentile of Exposure
Lifetime Average Daily Dose (LADD) ug/kg/day
Cancer Risk Proposed Management Goals
Percentile of Exposure
Lifetime Average Daily Dose (LADD) ug/kg/day
Cancer Risk Proposed Management Goals
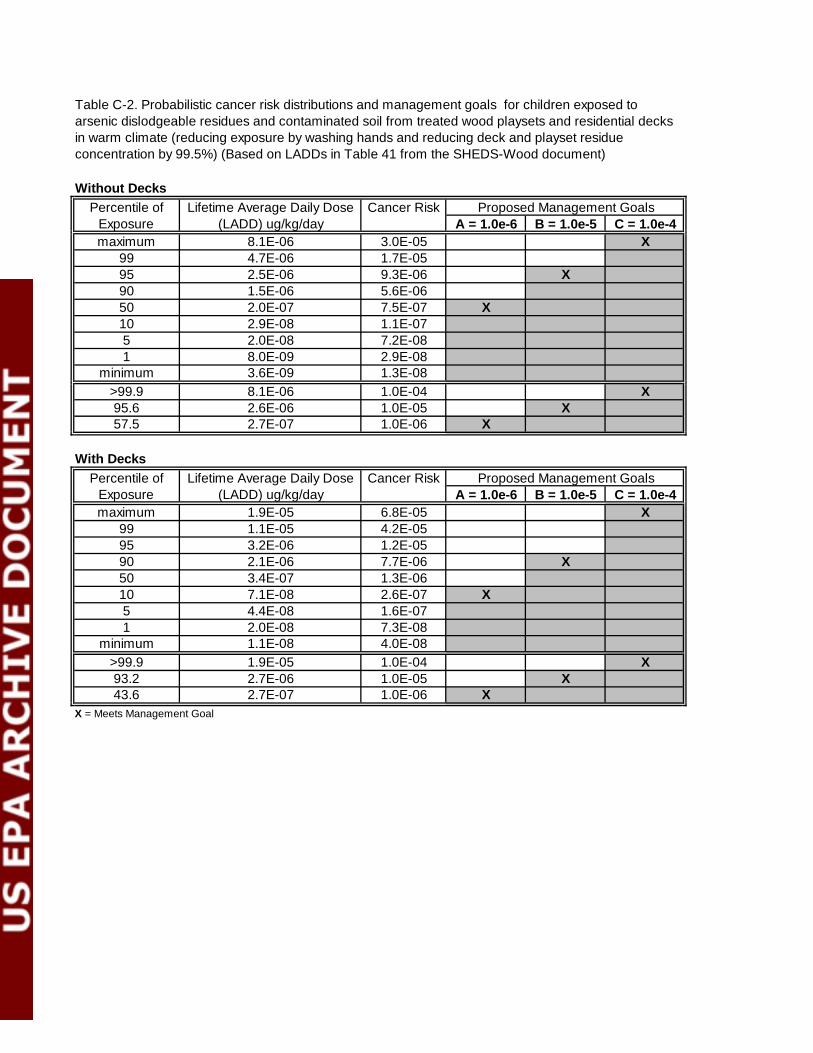
Without Decks
A = 1.0e-6 B = 1.0e-5 C = 1.0e-4maximum 8.1E-06 3.0E-05 X
99 4.7E-06 1.7E-0595 2.5E-06 9.3E-06 X90 1.5E-06 5.6E-0650 2.0E-07 7.5E-07 X10 2.9E-08 1.1E-075 2.0E-08 7.2E-081 8.0E-09 2.9E-08
minimum 3.6E-09 1.3E-08>99.9 8.1E-06 1.0E-04 X95.6 2.6E-06 1.0E-05 X57.5 2.7E-07 1.0E-06 X
With Decks
A = 1.0e-6 B = 1.0e-5 C = 1.0e-4maximum 1.9E-05 6.8E-05 X
99 1.1E-05 4.2E-0595 3.2E-06 1.2E-0590 2.1E-06 7.7E-06 X50 3.4E-07 1.3E-0610 7.1E-08 2.6E-07 X5 4.4E-08 1.6E-071 2.0E-08 7.3E-08
minimum 1.1E-08 4.0E-08>99.9 1.9E-05 1.0E-04 X93.2 2.7E-06 1.0E-05 X43.6 2.7E-07 1.0E-06 X
X = Meets Management Goal
Percentile of Exposure
Lifetime Average Daily Dose (LADD) ug/kg/day
Cancer Risk Proposed Management Goals
Table C-2. Probabilistic cancer risk distributions and management goals for children exposed to arsenic dislodgeable residues and contaminated soil from treated wood playsets and residential decks in warm climate (reducing exposure by washing hands and reducing deck and playset residue concentration by 99.5%) (Based on LADDs in Table 41 from the SHEDS-Wood document)
Percentile of Exposure
Lifetime Average Daily Dose (LADD) ug/kg/day
Cancer Risk Proposed Management Goals

Appendix D
Comparison of Residue and Soil Risks
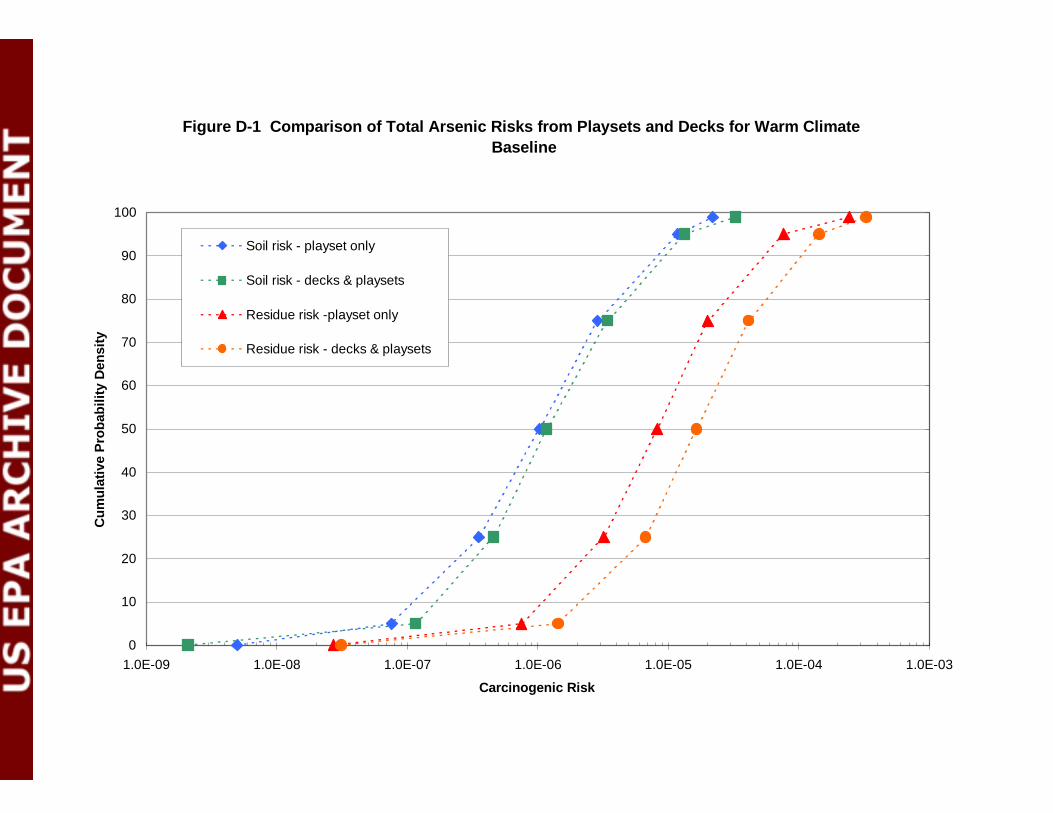
Figure D-1 Comparison of Total Arsenic Risks from Playsets and Decks for Warm ClimateBaseline
0
10
20
30
40
50
60
70
80
90
100
1.0E-09 1.0E-08 1.0E-07 1.0E-06 1.0E-05 1.0E-04 1.0E-03
Carcinogenic Risk
Cum
ulat
ive
Pro
babi
lity
Den
sity
Soil risk - playset only
Soil risk - decks & playsets
Residue risk -playset only
Residue risk - decks & playsets
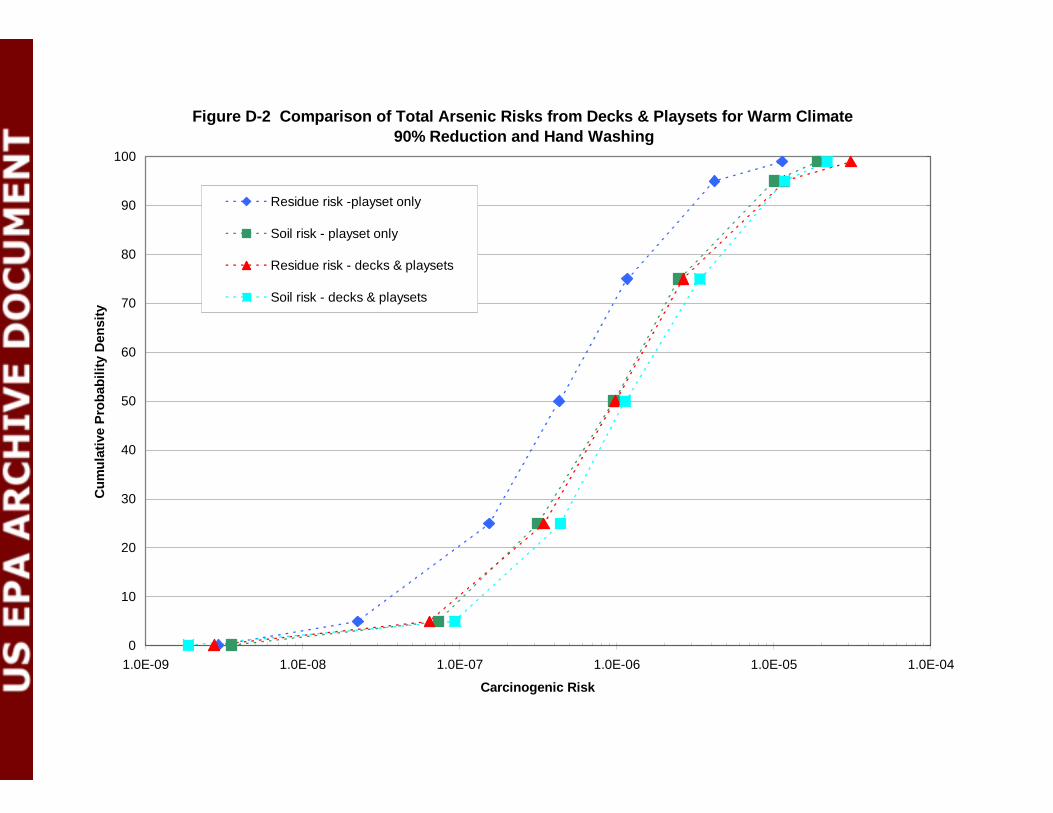
Figure D-2 Comparison of Total Arsenic Risks from Decks & Playsets for Warm Climate90% Reduction and Hand Washing
0
10
20
30
40
50
60
70
80
90
100
1.0E-09 1.0E-08 1.0E-07 1.0E-06 1.0E-05 1.0E-04
Carcinogenic Risk
Cum
ulat
ive
Pro
babi
lity
Den
sity
Residue risk -playset only
Soil risk - playset only
Residue risk - decks & playsets
Soil risk - decks & playsets
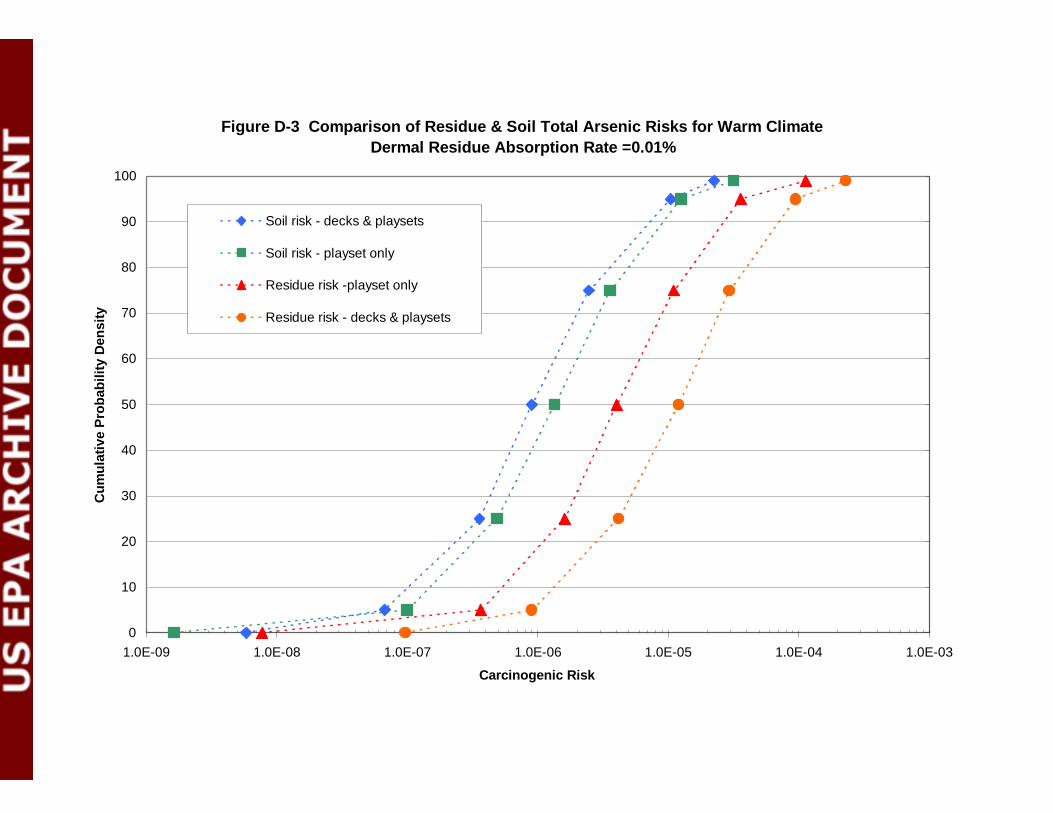
Figure D-3 Comparison of Residue & Soil Total Arsenic Risks for Warm ClimateDermal Residue Absorption Rate =0.01%
0
10
20
30
40
50
60
70
80
90
100
1.0E-09 1.0E-08 1.0E-07 1.0E-06 1.0E-05 1.0E-04 1.0E-03
Carcinogenic Risk
Cum
ulat
ive
Pro
babi
lity
Den
sity
Soil risk - decks & playsets
Soil risk - playset only
Residue risk -playset only
Residue risk - decks & playsets
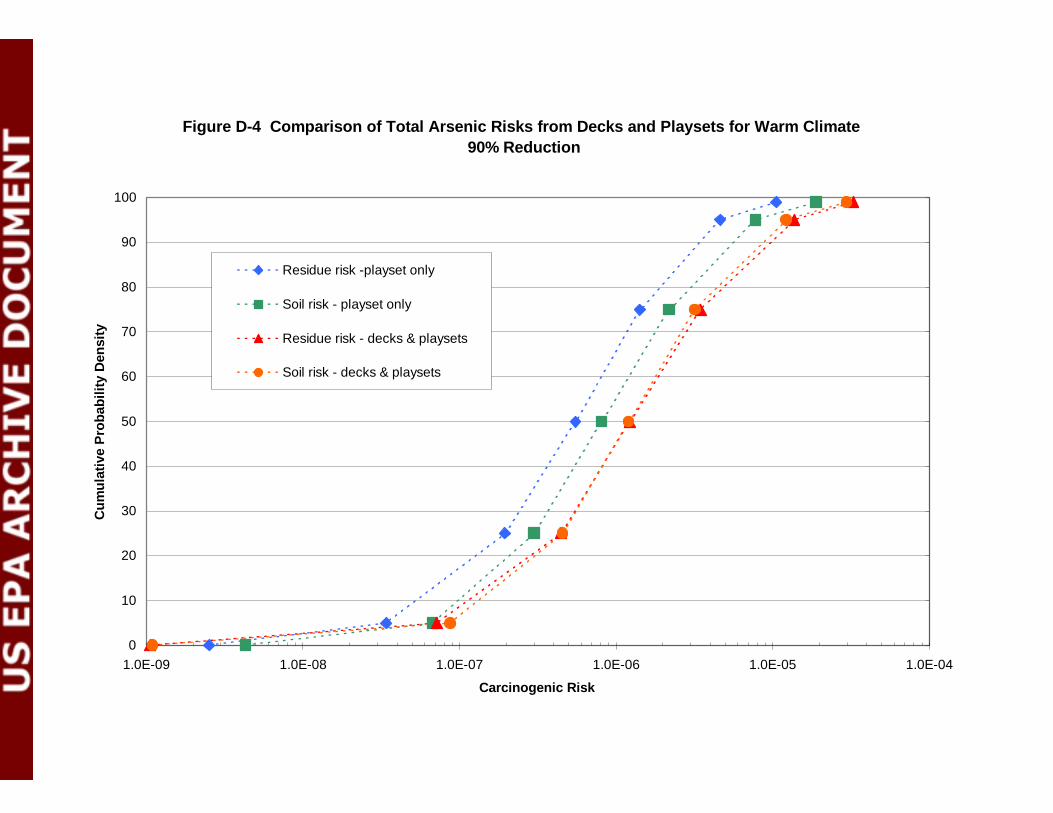
Figure D-4 Comparison of Total Arsenic Risks from Decks and Playsets for Warm Climate90% Reduction
0
10
20
30
40
50
60
70
80
90
100
1.0E-09 1.0E-08 1.0E-07 1.0E-06 1.0E-05 1.0E-04
Carcinogenic Risk
Cum
ulat
ive
Pro
babi
lity
Den
sity
Residue risk -playset only
Soil risk - playset only
Residue risk - decks & playsets
Soil risk - decks & playsets
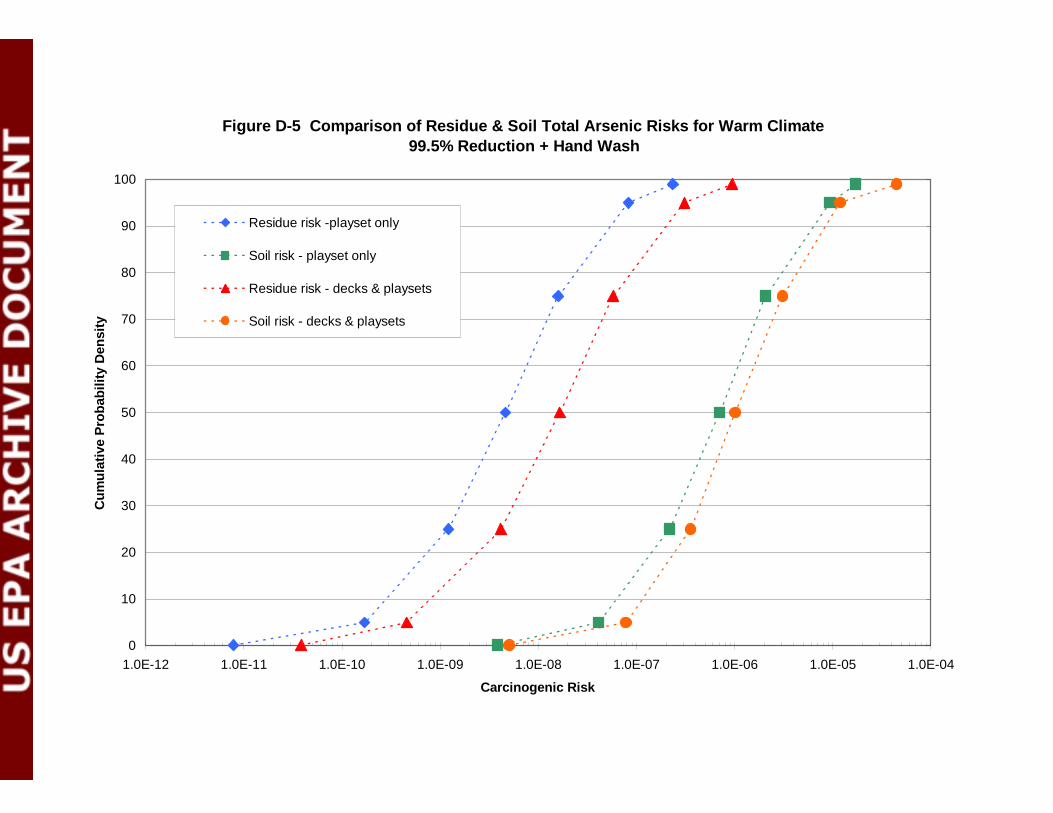
Figure D-5 Comparison of Residue & Soil Total Arsenic Risks for Warm Climate99.5% Reduction + Hand Wash
0
10
20
30
40
50
60
70
80
90
100
1.0E-12 1.0E-11 1.0E-10 1.0E-09 1.0E-08 1.0E-07 1.0E-06 1.0E-05 1.0E-04
Carcinogenic Risk
Cum
ulat
ive
Pro
babi
lity
Den
sity
Residue risk -playset only
Soil risk - playset only
Residue risk - decks & playsets
Soil risk - decks & playsets
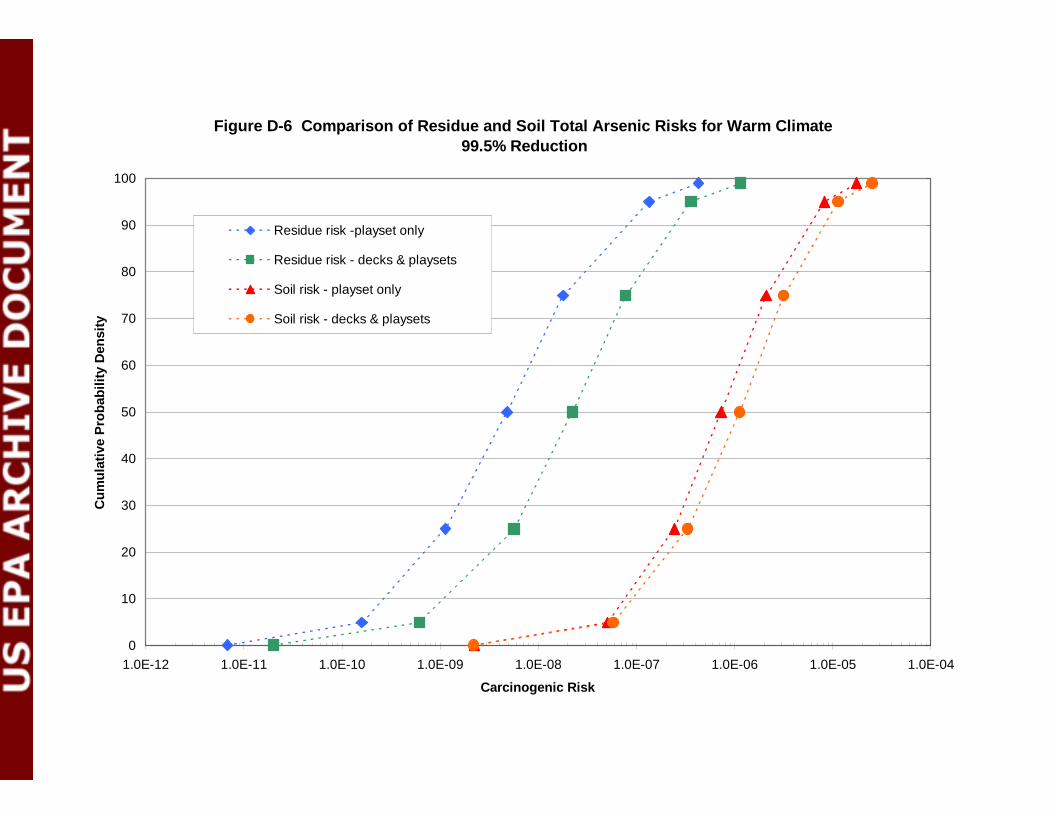
Figure D-6 Comparison of Residue and Soil Total Arsenic Risks for Warm Climate99.5% Reduction
0
10
20
30
40
50
60
70
80
90
100
1.0E-12 1.0E-11 1.0E-10 1.0E-09 1.0E-08 1.0E-07 1.0E-06 1.0E-05 1.0E-04
Carcinogenic Risk
Cum
ulat
ive
Pro
babi
lity
Den
sity
Residue risk -playset only
Residue risk - decks & playsets
Soil risk - playset only
Soil risk - decks & playsets
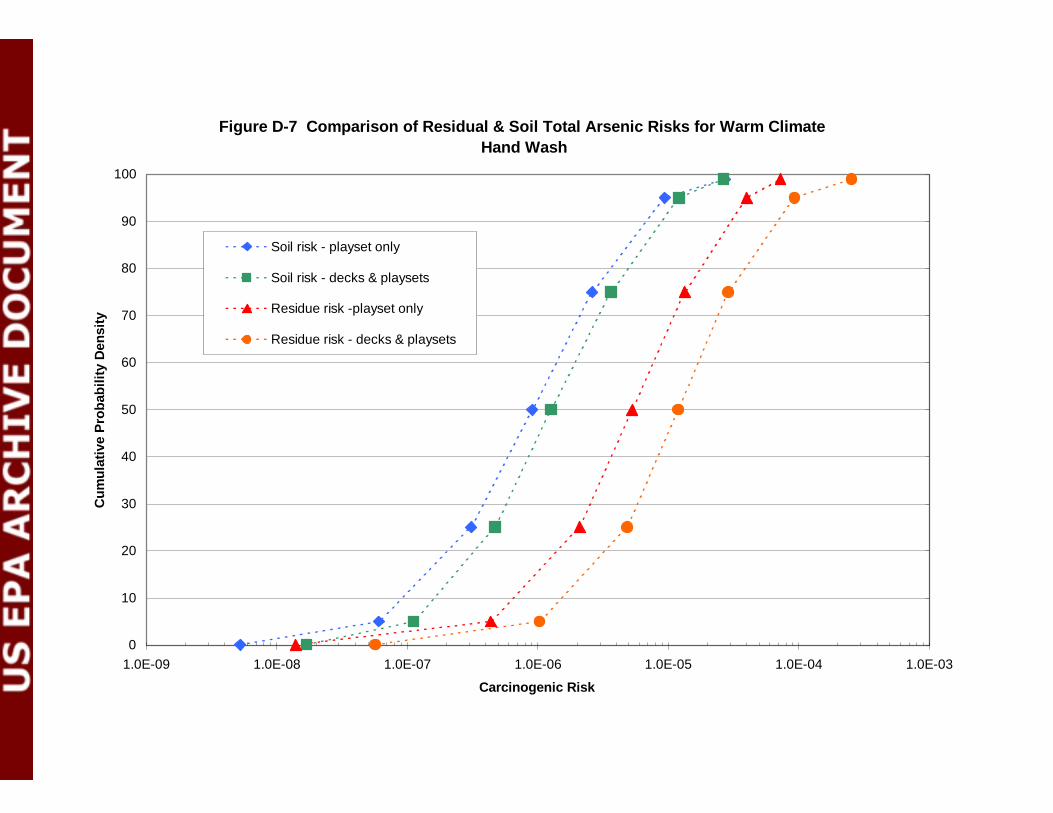
Figure D-7 Comparison of Residual & Soil Total Arsenic Risks for Warm ClimateHand Wash
0
10
20
30
40
50
60
70
80
90
100
1.0E-09 1.0E-08 1.0E-07 1.0E-06 1.0E-05 1.0E-04 1.0E-03
Carcinogenic Risk
Cum
ulat
ive
Pro
babi
lity
Den
sity
Soil risk - playset only
Soil risk - decks & playsets
Residue risk -playset only
Residue risk - decks & playsets

Appendix E
Summary of Relative Bioavailability StudiesPrepared by Jonathan Chen, Ph.D 9-15-2003
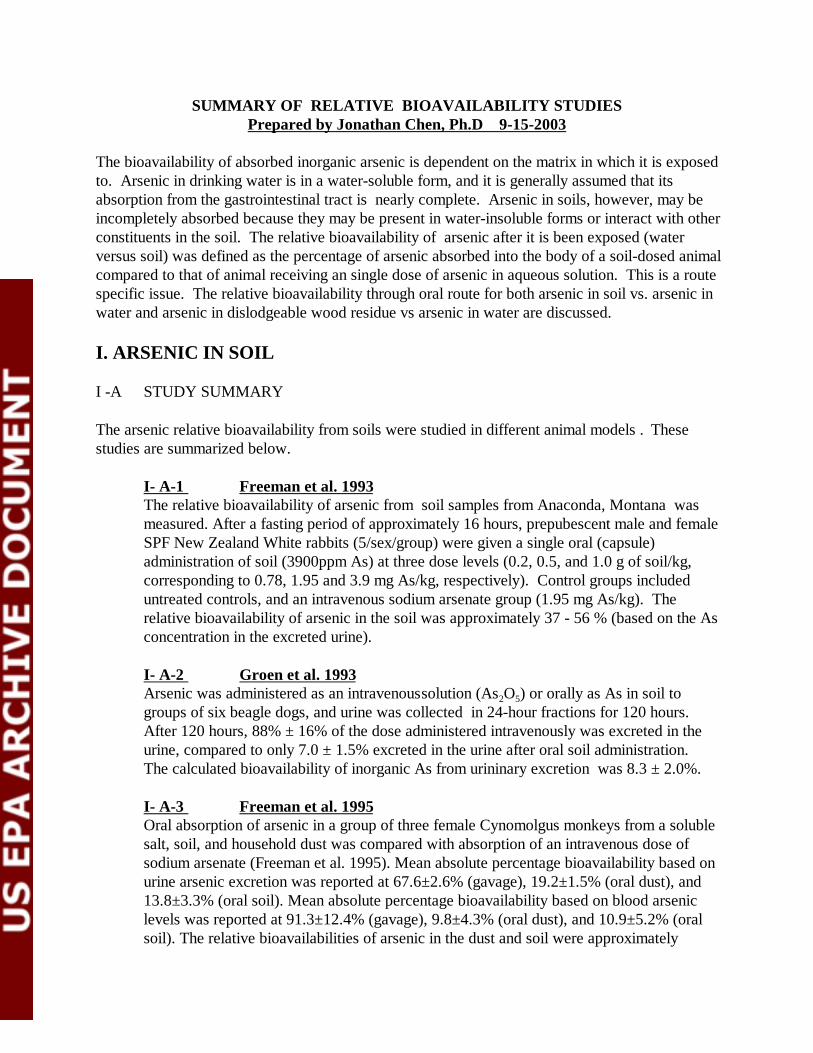
SUMMARY OF RELATIVE BIOAVAILABILITY STUDIESPrepared by Jonathan Chen, Ph.D 9-15-2003
The bioavailability of absorbed inorganic arsenic is dependent on the matrix in which it is exposedto. Arsenic in drinking water is in a water-soluble form, and it is generally assumed that itsabsorption from the gastrointestinal tract is nearly complete. Arsenic in soils, however, may beincompletely absorbed because they may be present in water-insoluble forms or interact with otherconstituents in the soil. The relative bioavailability of arsenic after it is been exposed (waterversus soil) was defined as the percentage of arsenic absorbed into the body of a soil-dosed animalcompared to that of animal receiving an single dose of arsenic in aqueous solution. This is a routespecific issue. The relative bioavailability through oral route for both arsenic in soil vs. arsenic inwater and arsenic in dislodgeable wood residue vs arsenic in water are discussed.
I. ARSENIC IN SOIL
I -A STUDY SUMMARY
The arsenic relative bioavailability from soils were studied in different animal models . Thesestudies are summarized below.
I- A-1 Freeman et al. 1993The relative bioavailability of arsenic from soil samples from Anaconda, Montana wasmeasured. After a fasting period of approximately 16 hours, prepubescent male and femaleSPF New Zealand White rabbits (5/sex/group) were given a single oral (capsule)administration of soil (3900ppm As) at three dose levels (0.2, 0.5, and 1.0 g of soil/kg,corresponding to 0.78, 1.95 and 3.9 mg As/kg, respectively). Control groups includeduntreated controls, and an intravenous sodium arsenate group (1.95 mg As/kg). Therelative bioavailability of arsenic in the soil was approximately 37 - 56 % (based on the Asconcentration in the excreted urine).
I- A-2 Groen et al. 1993Arsenic was administered as an intravenous solution (As2O5) or orally as As in soil togroups of six beagle dogs, and urine was collected in 24-hour fractions for 120 hours. After 120 hours, 88% ± 16% of the dose administered intravenously was excreted in theurine, compared to only 7.0 ± 1.5% excreted in the urine after oral soil administration. The calculated bioavailability of inorganic As from urininary excretion was 8.3 ± 2.0%.
I- A-3 Freeman et al. 1995Oral absorption of arsenic in a group of three female Cynomolgus monkeys from a solublesalt, soil, and household dust was compared with absorption of an intravenous dose ofsodium arsenate (Freeman et al. 1995). Mean absolute percentage bioavailability based onurine arsenic excretion was reported at 67.6±2.6% (gavage), 19.2±1.5% (oral dust), and13.8±3.3% (oral soil). Mean absolute percentage bioavailability based on blood arseniclevels was reported at 91.3±12.4% (gavage), 9.8±4.3% (oral dust), and 10.9±5.2% (oralsoil). The relative bioavailabilities of arsenic in the dust and soil were approximately

28.4% and 20.4% respectively (based on urine).
I- A-4 USEPA Region 10, 1996The relative bioavailability of arsenic and lead in soil or slag from the Ruston/NorthTacoma Superfund Site has been studied in immature swine that received one single oraldose of soil or sodium arsenate (EPA, 1996). Following a 12 hour overnight fast, eachanimal was given a single administration of the appropriate test material. Solutions ofsodium arsenate and lead acetate were administered separately and not mixed togetherprior to administration. The group receiving environmental media received a single oraladministration od one of four quantities of soils at 25, 60, 100 or 150 mg soil/kg of bodyweight (BW) (0.04, 0.10, 0.16, or 0.24 mg As/kg BW and 0.03, 0.08, 0.14, or 0.20 mgpb / kg BW). Control groups include intravenous or gavage doses of solution arsenic, untreated controls (received aqueous vehicle only), and an intravenous sodium arsenategroup (1.95 mg As/kg). Because several urine samples were lost during samplingprocedure, urinary arsenic excretion was not used as an biomarker in estimatingbioavailability. Based on the blood level of arsenic, the relative bioavailability of arsenic(soil versus water) in the soil was 78% (56 - 111%).
I- A-5 USEPA Region 8, 1997The bioavailability of arsenic in soil has been studied in juvenile swine that received dailyoral doses of soil or sodium arsenate (in food or by gavage) for 15 days (EPA 1997). Thesoils were obtained from various mining and smelting sites and contained, in addition toarsenic at concentrations of 100-300 µg/g, lead at concentrations of 3,000-14,000 µg/g.The arsenic doses ranged from 1 to 65.4 µg/kg/day. The fraction of the arsenic doseexcreted in urine was measured on days 7 and 14 and the relative bioavailability of thesoil-borne arsenic was estimated as the ratio of urinary excretion fractions, soilarsenic:sodium arsenate. The mean relative bioavailability of soil-borne arsenic rangedfrom 0 to 98% in soils from seven different sites (mea±SD, 45% ±32). Estimates forrelative bioavailability of arsenic in samples of smelter slag and mine tailings ranged from7to 5l% (mean±SD, 35%±27).
I- A-6 Roberts et al. 2001The relative bioavailability of arsenic from selected soil samples was measured in a primatemodel. Sodium arsenate was administered to five male Cebus apella monkeys by theintravenous and oral routes, and urine and feces were collected over a four-day period.Pharmacokinetic behavior of arsenic and the fractions of dose excreted in urine and feceswere consistent with previous observations in humans. Soil samples from four waste sitesin Florida (one from an electrical substation, one from a wood preservative treatment(CCA) site, one from a pesticide application site, and one from a cattle dip vat site) weredried and sieved. Soil doses were prepared from these samples and administered orally tothe monkeys. Relative bioavailability was assessed based on urinary excretion of arsenicfollowing the soil dose compared with excretion following an oral dose of arsenic insolution. Relatively consistent bioavailability measurements were obtained amongmonkeys given the same soil sample. Differences in bioavailability were observed fordifferent sites, with relative bioavailability ranging from 10.7±14.9% (mean±SD) to
24.7±3.2% for the four soil samples.
I- A-7 American Chemistry Council (ACC), 2003a.
The bioavailability of arsenic in soil affected by CCA-treated wood has been studied injuvenile swine (ACC, 2003a). The soil was collected near the base of utility poles treatedwith CCA Type C wood. The poles were installed on the site for around 5 years. Thearsenic concentration in the utility pole soil was 320 µg/g. Groups of five swine weregiven oral doses of sodium arsenate or utility pole soil twice a day for 15 days. Theamount of arsenic absorbed by each animal was evaluated by measuring the amount ofarsenic excreted in the urine (as measured on days 8 to 9 and 10 to 11). The urinaryexcretion fraction (UEF) (the ratio of the amount excreted per 48 hours divided by thedose given per 48 hours) was calculated for sodium arsenate and the utility pole soil usinglinear regression analysis. By using sodium arsenate as a relative frame of reference, themean RBA estimate for the soil affected by the CCA-treated wood is 49% (90th % CI =41% - 58%).
The study design, the soil types and the results of these studies are summarized in Table I-1.
I-B DISCUSSION AND CONCLUSION
The issue has been discussed in the October 23- 25, 2001 FIFRA Scientific Advisory PanelMeeting. In the meeting, the Agency as the panel members to comment on the choice of thedata set and value chosen for representation of the relative bioavailability of inorganic arsenicfrom ingestion of arsenic-contaminated soil. The panel considered that a research is neededto obtain data on the relative bioavailability of arsenic from soil contamination specificallyresulting from CCA-treated wood applications. Based on this consideration, ACC (2003)conducted the study with soil contaminated directly from CCA-treated wood with the juvenileswine model. This is the only study using soil that is contaminated with CCA-treated soil.Although, only one soil type is involved in the study, after evaluating all available information,the Agency decide to use 49% as the relative bioavailabilty value in the risk assessment.
II. ARSENIC IN WOOD RESIDUE
In the October 23- 25, 2001 FIFRA Scientific Advisory Panel Meeting, the panel memberalso suggested the Agency to look into the relative bioavailability issue associated with theabsorption of arsenic from non-soil substances (such as wood chips or other buffermaterial) that might be subject to incidental ingestion. For playground equipment,the dislodgeable arsenic from CCA-treated wood become the primaryconcern.
To address this issue, ACC sponsored a study (2003b). A study using juvenile
swine as test animals was performed to measure the gastrointestinal absorption of arsenicin dislodgeable material obtained from the surface of chromated copper arsenate(CCA)-treated wood. The CCA residue was collected from the surface of 1,456CCA-treated boards of wood (Southern Yellow Pie or Ponderosa Pine) that had beenweathered in the environment for 1 to 4 years. The arsenic concentration in thedislodgeable arsenic material was 3500 µg/g. Groups of five swine were given oral dosesof sodium arsenate or dislodgeable arsenic twice a day for 12 days. The amount of arsenicabsorbed by each animal was evaluated by measuring the amount of arsenic excreted in theurine (as measured on days 6 to 7, 8 to 9, and 10 to 11). The urinary excretion fraction(UEF) (the ratio of the amount excreted per 48 hours divided by the dose given per 48hours) was calculated for sodium arsenate and the dislodgeable arsenic using linearregression analysis. Using sodium arsenate as a relative frame of reference, the RBAestimate for the test material is 29% (90th % CI = 26% - 32%).
The Agency consider this is a valid study and the result (29%) will be used as the relativebioavailability of dislodgeable srsenic from CCA-treated wood.
III. REFERENCES
ACC, 2003a. CCA Workgroup, Relative Bioavailability of Arsenic in Soil Affected byCCATreated Wood. Prepared by Veterinary Medical Diagnostic Laboratory College ofVeterinary Medicine. University of Missouri, Syracuse Research Corporation, Denver,Colorado
.ACC, 2003b. CCA Workgroup, Relative Bioavailability of Dislodgeable Arsenic fromCCATreated Wood, Prepared by Veterinary Medical Diagnostic Laboratory Medicine.University of Missouri, Syracuse Research Corporation, Denver, Colorado.
Freeman, G.B., Schoof, R.A., Ruby, M.V., Davis, A.O., Dill, J.A., Liao, S.C., Lapin, C.A., andBergstrom, P.D. 1995. Bioavailability of Arsenic in Soil and House Dust Impacted bySmelter Activities Following Oral Administration in Cynomologus Monkeys. Fundamental and Applied Toxicology 28:215-222
Freeman, GB., Johnson, J.D., Killinger, J.M., Liao, S.C., Davis, A.O., Ruby, M.V., Chaney, R.L.,Lovre, S.C., and Bergstrom, P.D. 1993. Bioavailability of Arsenic in Soil Impacted bySmelter Activities Following Oral Administration in Rabbits. Fundamental and AppliedToxicology 21:83-88
Groen, K., Vaesen, H.A.G., Klest, J.I.G. deBar, J.L.M., von Ooik, T. Timmerman, A. and Vlug,R.G. 1993. Bioavailability of Inorganic Arsenic from Bog Ore-Containing Soil in theDog. Environmental Health Perspective 102: 182-184.
Roberts, S.M.; Welmar, W.R.; Venson, J.R.; Munson, J.W.; and Bergeron 2001. Meausrement ofArsenic Bioavailability from Soils Using a Primate Model. Unpublished.
UUS. EPA, 1996.. Bioavailability of Arsenic and Lead in Environmental Substrates. 1. Results ofan Oral Dosing Study of Immature Swine. Superfund/Office of EnvironmentalAssessment,Region 10, EPA 910/R-96-002,
US. EPA. 1997. Relative Bioavailability of Arsenic in Mining Wastes, Region 8, DocumentControl No. 4500-88-AORH, 1997.
U.S. EPA, 2001. Children's Exposure to CCA-Treated Wood Playground Equipment andCCAContaminated Soil (Final Report to SAP 9/27/01). Prepared by the Office ofPesticide Programs Antimicrobial Division. Draft Version, September 27, 2001.
Appendix F
SAP Report No. 2001-12FIFRA Scientific Advisory Panel Meeting,
October 23- 25, 2001, held at the Sheraton Crystal CityHotel, Arlington, Virginia
A Set of Scientific Issues Being Considered by theEnvironmental Protection Agency Regarding:
Preliminary Evaluation of the Non-dietary Hazard andExposure to Children from Contact with Chromated Copper
Arsenate (CCA)-treated Wood Playground Structures andCCA-contaminated Soil.
OFFICE OFPREVENTION, PESTICIDES, AND
TOXIC SUBSTANCES
UNITED STATES ENVIRONMENTAL PROTECTION AGENCYWASHINGTON, D.C. 20460
December 12, 2001
MEMORANDUM
SUBJECT: Transmittal of the Final Report for the FIFRA Scientific Advisory Panel (SAP)Meeting Held October 23 - 25, 2001
TO: Marcia E. Mulkey, DirectorOffice of Pesticide Programs
FROM: Olga Odiott, Designated Federal OfficialFIFRA Scientific Advisory PanelOffice of Science Coordination and Policy
Larry Dorsey, Executive SecretaryFIFRA Scientific Advisory PanelOffice of Science Coordination and Policy
THRU: Vanessa T. Vu, Ph.D., DirectorOffice of Science Coordination and Policy
Please find attached the Report for the FIFRA SAP open meeting held October 23-25,2001:Preliminary Evaluation of the Non-dietary hazard and Exposure to Children from Contactwith Chromated Copper Arsenate Treated Wood Playground Structures andContaminated Soil.
cc:Stephen Johnson Lois RossiSusan Hazen Frank SandersJanet Andersen Richard SchmittDon Barnes (SAB) Margaret StasikowskiJames Jones OPP DocketDenise KeehnerElizabeth LeoveyAnne LindsayDouglas Parsons
SAP Report No. 2001-12
FIFRA Scientific Advisory Panel Meeting, October 23- 25, 2001, held at the Sheraton Crystal City
Hotel, Arlington, Virginia
A Set of Scientific Issues Being Considered by the Environmental Protection Agency Regarding:
Preliminary Evaluation of the Non-dietary Hazard andExposure to Children from Contact with Chromated CopperArsenate (CCA)-treated Wood Playground Structures andCCA-contaminated Soil.
SAP Report No. 2001-12
FIFRA Scientific Advisory Panel Meeting, October 23 - 25, 2001, held at the Sheraton Crystal City
Hotel, Arlington, Virginia
A Set of Scientific Issues Being Considered by the Environmental Protection Agency Regarding:
Preliminary Evaluation of the Non-dietary Hazard andExposure to Children from Contact with Chromated CopperArsenate (CCA)-treated Wood Playground Structures andCCA-contaminated Soil.
Olga Odiott, M.S. Stephen M. Roberts, Ph.D.Designated Federal Official FIFRA SAP Session ChairFIFRA Scientific Advisory Panel FIFRA Scientific Advisory PanelDate: December 12, 2001 Date: December 12, 2001
ii
NOTICE
This report has been written as part of the activities of the Federal Insecticide, Fungicide, andRodenticide Act (FIFRA), Scientific Advisory Panel (SAP). This report has not been reviewedfor approval by the United States Environmental Protection Agency (Agency) and, hence, thecontents of this report do not necessarily represent the views and policies of the Agency, nor ofother agencies in the Executive Branch of the Federal government, nor does mention of tradenames or commercial products constitute a recommendation for use.
The FIFRA SAP was established under the provisions of FIFRA, as amended by the FoodQuality Protection Act (FQPA) of 1996, to provide advice, information, and recommendations tothe Agency Administrator on pesticides and pesticide-related issues regarding the impact ofregulatory actions on health and the environment. The Panel serves as the primary scientificpeer review mechanism of the EPA, Office of Pesticide Programs (OPP) and is structured toprovide balanced expert assessment of pesticide and pesticide-related matters facing the Agency. Food Quality Protection Act Science Review Board members serve the FIFRA SAP on an ad-hoc basis to assist in reviews conducted by the FIFRA SAP. Further information about FIFRASAP reports and activities can be obtained from its website at http://www.epa.gov/scipoly/sap/or the OPP Docket at (703) 305-5805. Interested persons are invited to contact Larry Dorsey,SAP Executive Secretary, via e-mail at [email protected].

iii
CONTENTS
PARTICIPANTS ------------------------------------------------------------------ 1
PUBLIC COMMENTERS -------------------------------------------------------- 3
INTRODUCTION ----------------------------------------------------------------- 5
CHARGE --------------------------------------------------------------------------- 6
DETAILED RESPONSE TO THE CHARGE -------------------------------- 15
ADDITIONAL PANEL RECOMMENDATIONS --------------------------- 55
REFERENCES -------------------------------------------------------------------- 59
1
Federal Insecticide, Fungicide, and Rodenticide ActScientific Advisory Panel Meeting
October 23 –25, 2001
Preliminary Evaluation of the Non-dietary Hazard and Exposure to Children from Contactwith Chromated Copper Arsenate (CCA)-treated Wood Playground Structures and CCA-contaminated Soil.
PARTICIPANTS
FIFRA SAP Chair
Stephen M. Roberts, Ph.D., Director, Center for Environmental and Human Toxicology,University of Florida
Scientific Advisory Panel Members
Fumio Matsumura, Ph.D., Institute of Toxicology and Environmental Health, University ofCalifornia at Davis
Mary Anna Thrall, D.V.M., Department of Pathology, College of Veterinary Medicine &Biomedical Sciences, Colorado State University
FQPA Science Review Board Members
John L. Adgate, Ph.D., University of Minnesota School of Public Health, Division ofEnvironmental and Occupational Health
Michael Bates, Ph.D., Visiting Researcher, School of Public Health, University of California,Berkeley
James V. Bruckner, Ph.D., Department of Pharmaceutical and Biomedical Sciences, College ofPharmacy, University of Georgia
Karen Chou, Ph.D., Institute for Environmental Toxicology, Institute of International Health,Dept. of Animal Science, Michigan State University
Harvey Clewell, M.S., ENVIRON International Corporation, Ruston, Louisiana
M. Rony Francois, M.D., Ph.D.c, University of South Florida, College of Public Health
Natalie Freeman, Ph.D., Department of Environmental and Community Medicine, Robert WoodJohnson Medical School, University of Medicine and Dentistry of New Jersey
2
Gary L. Ginsberg, Ph.D., Connecticut Department of Public Health, EnvironmentalEpidemiology, and Occupational Health, CT Dept. of Public Health
Terry Gordon, Ph.D., NYU School of Medicine
Steven Heeringa, Ph.D., Director, Statistical Design and Analysis, Institute for Social ResearchUniversity of Michigan
Claudia Hopenhayn-Rich, M.P.H., Ph.D., Department of Preventive Medicine andEnvironmental Health, University of Kentucky
John Kissel, Ph.D., Department of Environmental Health, School of Public Health andCommunity Medicine, University of Washington
Michael J. Kosnett, M.D., M.P.H., Division of Clinical Pharmacology and Toxicology,University of Colorado Health Sciences Center
Peter S.J. Lees, Ph.D., C.I.H., Johns Hopkins University, Bloomberg School of Public Health,Department of Environmental Health Sciences, Division of Environmental Health Engineering,
Ross B. Leidy, Ph.D., Director, Pesticide Residue Research Laboratory, Department ofToxicology, North Carolina State University
Peter D.M. Macdonald, D.Phil., Department of Mathematics and Statistics, McMasterUniversity, Hamilton, Ontario, Canada
David W. Morry, Ph.D., Office of Environmental Health Hazard Assessment,California Environmental Protection Agency
Paul Mushak, Ph.D., PB Associates, Durham, NC
Xianglin Shi, Ph.D., Pathology and Physiology Research Branch, National Institute forOccupational Safety and Health, Morgantown, WV
Andrew Smith, SM, ScD, Director, Environmental Toxicology Program, Maine Department ofHuman Services
Helena Solo-Gabriele, Ph.D., P.E., Department of Civil,Arch., and Environmental Engineering,University of Miami, FL
Jacob J. Steinberg, M.D., Albert Einstein College of Medicine, Director, Autopsy Division,Director, Residency Training Program, Environmental Medicine and Pathology Laboratory,Montefiore Medical Center, N.Y.
Miroslav Styblo, Ph.D., Department of Pediatrics, School of Medicine, and Department of
3
Nutrition, School of Public Health, Department of Pediatrics, University of North Carolina
John Wargo, Ph.D., Environmental Policy and Risk Analysis, Yale University, CT
PUBLIC COMMENTERS
Oral statements were made by:Jane Houlihan, Environmental Working Group, Washington, D.C.
Cristopher Williams, Ph.D., Ecology and Environment Inc.,Tallahassee, FL
Ligia Mora-Applegate, M.S.P., M.P.A., M.P.H., Florida Department of EnvironmentalProtection
Pascal Kamdem, Ph.D., Michigan State University, on behalf of American Forest and PaperAssociation
H. Vasken Aposhian, Ph.D., University of Arizona, on behalf of Arch Chemicals, Inc.
Jay Feldman, Beyond Pesticides / National Coalition Against the Misuse of Pesticides
Yvette Lowney, M.P.H., Exponent, on behalf of the American Chemistry Council
Barbara Beck, Ph.D., DABT, Gradient Corporation, on behalf of Osmose and Arch Chemicals,Inc.
Bill Walsh, Healthy Building Network, Washington, DC
John Butala, M.S., Toxicology Consultants, Inc., on behalf of American Chemistry CouncilArsenical Wood Preservatives Task Force
Joyce Tsuji, Ph.D., Exponent, on behalf of American Forest and Paper Association
Scott Conklin, Universal Forest Products, Inc.
Robert Turkewitz, Ness, Motley, Loadholt, Mount Pleasant, SC
Steven Lamm, M.D., Consultants in Epidemiology & Occupational Health, Inc., Washington,DC
4
Written statements were made by:The Accord Group, on behalf of Osmose and Arch Chemicals, Inc.
Mr. Marc Leathers, Leathers & Associates, Inc.
Ligia Mora-Applegate, M.S.P., M.P.A., M.P.H., Florida Department of EnvironmentalProtection
5
INTRODUCTION
The Federal Insecticide, Fungicide, and Rodenticide Act (FIFRA), Scientific Advisory Panel(SAP) has completed its review of the set of scientific issues being considered by the Agencypertaining to its review of the Office of Pesticide Programs' (OPP) Preliminary Evaluation of theNon-dietary Hazard and Exposure to Children from Contact with Chromated Copper Arsenate(CCA)-treated Wood Playground Structures and CCA-contaminated Soil. Advance notice of themeeting was published in the Federal Register on September 19, 2001. The review wasconducted in an open Panel meeting held in Arlington, Virginia, October 23- 25, 2001. Themeeting was chaired by Stephen M. Roberts, Ph.D. Ms. Olga Odiott served as the DesignatedFederal Official.
The scientific issues addressed by the FIFRA SAP were complex and varied. Panel memberswere selected to serve because of their expertise in one or more of the subject areas beingdiscussed. The Panel was asked to evaluate the scientific soundness and OPP’s evaluation of theexposure and hazard data available to the Agency for CCA. Specifically, the Panel was asked to1) review the exposure scenarios and hazard endpoints that the Agency intends to use in itsCCA-risk characterization for children; and 2) provide recommendations concerning additionaldata needed to reduce the uncertainties of this risk characterization.
6
CHARGE
Issue: Short- and Intermediate-term Endpoint Selection for Inorganic Arsenic
For inorganic arsenic, the data of Franzblau et al (1989) and Mizuta et al (1956) using aLOAEL value of 0.05 mg/kg/day is proposed for selection of short-term andintermediate-term incidental oral endpoints as well as short-term and intermediate-termdermal endpoints. An acceptable Margin of Exposure value of 100 is also proposed. The acceptable Margin of Exposure value includes a 10x factor for intraspecies variationas well as a 10x factor for use of a LOAEL value and the severity of the effects observedin the Mizuta study.
Question 1: Please comment on the Agency’s selection of the 0.05 mg/kg/dayLOAEL value for use in assessing risks to the general population as well as childrenfrom short-term and intermediate-term incidental oral and dermal exposures, andthe appropriateness of the use of a 10x factor for severity of the toxic effectsobserved in the Mizuta study. Please provide an explanation and scientificjustification for your conclusions as to whether the presented data are adequate orwhether other data should be considered for selection of this endpoint.
Issue: Relative Bioavailability of Inorganic Arsenic
The bioavailability of inorganic arsenic is dependent on the matrix in which it exists. Forpurposes of this discussion, the relative bioavailability of inorganic arsenic afteringestion of arsenic-contaminated soil is defined as the percentage of arsenic absorbedinto the body from soil compared to that of arsenic administered in drinking water. Arsenic in drinking water is in a water-soluble form, and bioavailability by this route ishigh (i.e. 95-100%). Arsenic in soil, however, has reduced bioavailability due toexistence in a water-insoluble form or its interaction with other soil constituents thatimpair absorption.
The available data on urinary and fecal recovery of arsenic after an intravenous dose ofsodium arsenate in experimental animals compared to recovery after administration ofsodium arsenate to experimental animals in soil was examined. Based on these data, avalue of 25% bioavailability was selected for arsenic from soil ingestion. This value isbased upon the data of Roberts et al. (2001) and Freeman et al. (1995) using non-humanprimates. These data were felt to best represent relative bioavailability of inorganicarsenic in soil based on the use of non-human primates and the physiological similarity inthe pattern of metabolism with humans, and the use of CCA-contaminated soil in thestudy for estimation of bioavailability.
7
Question 2: Please comment on the choice of this data set and value chosen forrepresentation of the relative bioavailability of inorganic arsenic from ingestion ofarsenic-contaminated soil. Please discuss the strengths and weaknesses of theselected data and also provide an explanation as to whether this 25% value isappropriate for estimation of bioavailability in children.
Issue: Dermal Absorption Value for Inorganic Arsenic
A value of 6.4% for the dermal absorption of arsenic was selected to representabsorption from dermal contact with inorganic arsenic. This value is based upon the dataof Wester et al. (1993) and represents percent absorbed dose of arsenic applied to theskin in a water solution. Although this value is slightly higher than the value of 4.5%obtained for arsenic applied in soil, the mean values for absorption from water and soilboth showed significant variability (i.e. 6.4% " 3.9% in water, 4.5% "3.2% in soil) suchthat use of the 6.4% dermal absorption value was selected. It is observed in this studythat a higher dose on the skin resulted in lower dermal absorption as noted above, but thedata in this study suggests sufficient variability in the absorption such that use of the6.4% dermal absorption value is sufficiently but not overly conservative.
Question 3: Please comment on the selection of the value of 6.4% for dermalabsorption of inorganic arsenic and whether or not this value will be appropriatefor use in all scenarios involving dermal exposure to arsenic from CCA-treatedwood, including children’s dermal contact with wood surface residues andcontaminated soils.
Issue: Selection of Hazard Database for Hazard Characterization of Inorganic Chromium in CCA-Treated Wood
Hazard data show clearly that Cr (VI) demonstrates more significant toxicity than Cr(III). However, there is little data delineating the valence state of chromium incompounds that leach from in-service CCA-treated wood (Lebow, 1996). Interconversionof Cr (VI) and Cr (III) in the environment is observed (Cohen et al., 1999), and at leastone study has reported measurable levels of hexavalent chromium in soils (Lebow,1996). In-service CCA-treated wood contains mainly chromium (III), due to reduction ofchromium (VI) during fixation. However, when fixation conditions are not ideal or whenstorage temperatures are low, Cr (VI) is observed to be present in leachate from thetreated wood and in addition, conditions in some soil types can result in conversion ofleached Cr (III) to Cr (VI).
Question 4: As available monitoring data do not differentiate among chromiumspecies found in CCA dislodgeable residues on wood surfaces and in soils, and as Cr(VI) is the more toxic species of chromium, please comment on whether use of the
8
hazard data for chromium (VI) is the best choice for characterizing hazard and riskfrom exposure to chromium as a component of CCA-treated wood. Please provide ascientific explanation and justification for your recommendation on the choice ofeither the chromium (III) or chromium (VI) hazard database.
Issue: Short- and Intermediate-term Endpoint Selection for Inorganic Chromium
For inorganic chromium (VI), OPP proposes using the developmental toxicity study ofTyl (MRID 42171201) with a NOAEL value of 0.5 mg/kg/day [0.12 mg/kg/daychromium equivalents] and an MOE of 100 (10x for interspecies variation, 10x forintraspecies variation) for selection of short-term and intermediate-term incidental oralendpoints.
Question 5: Please comment on the Agency’s selection of the 0.5 mg/kg/day NOAELvalue for use in assessing risks to the general population as well as children fromshort-term and intermediate-term incidental oral exposures to inorganic chromiumas contained in CCA-treated wood. Please provide an explanation and scientificjustification for your conclusions as to whether the presented data are adequate orwhether other data should be considered for selection of these endpoints.
Issue: Selection of Endpoints for Dermal Risk Assessments for Inorganic Chromium
Dermal exposure to chromium has been demonstrated to produce irritant and allergiccontact dermatitis, and chromium is also one of the most common contact sensitizers inmales in industrialized countries (IRIS, 2000). The relative potency of Cr (VI) and Cr(III) in causing dermal effects has been estimated to differ by approximately 50-fold(Bagdon,1991) but both produce irritation and dermal sensitization. In the OPP HIARCreview of selection of dermal toxicity endpoints, it was concluded that skin irritation andskin allergenicity are the primary effects of concern from dermal exposure to Cr(VI), asthese effects are the predominant response from dermal exposure to inorganic chromium. Thus, endpoints based on systemic effects from dermal exposure were not selected.
Question 6: Please comment on whether the significant non-systemic dermal effectsfrom dermal exposure to inorganic chromium should form the basis of dermalresidential risk assessments, and, if so, how the Agency should establish a dermalendpoint for such an assessment.
Issue: Selection of Parameters and Methodology for Characterizing Child Exposures
OPP intends to develop realistic exposure scenarios and dose estimates for characterizingpotential dermal/oral ingestion exposures to children in playground settings from contactwith dislodgeable As and Cr residues on CCA-treated wood playground structures and inCCA-contaminated soils. In keeping with EPA policy, OPP would like its estimates to
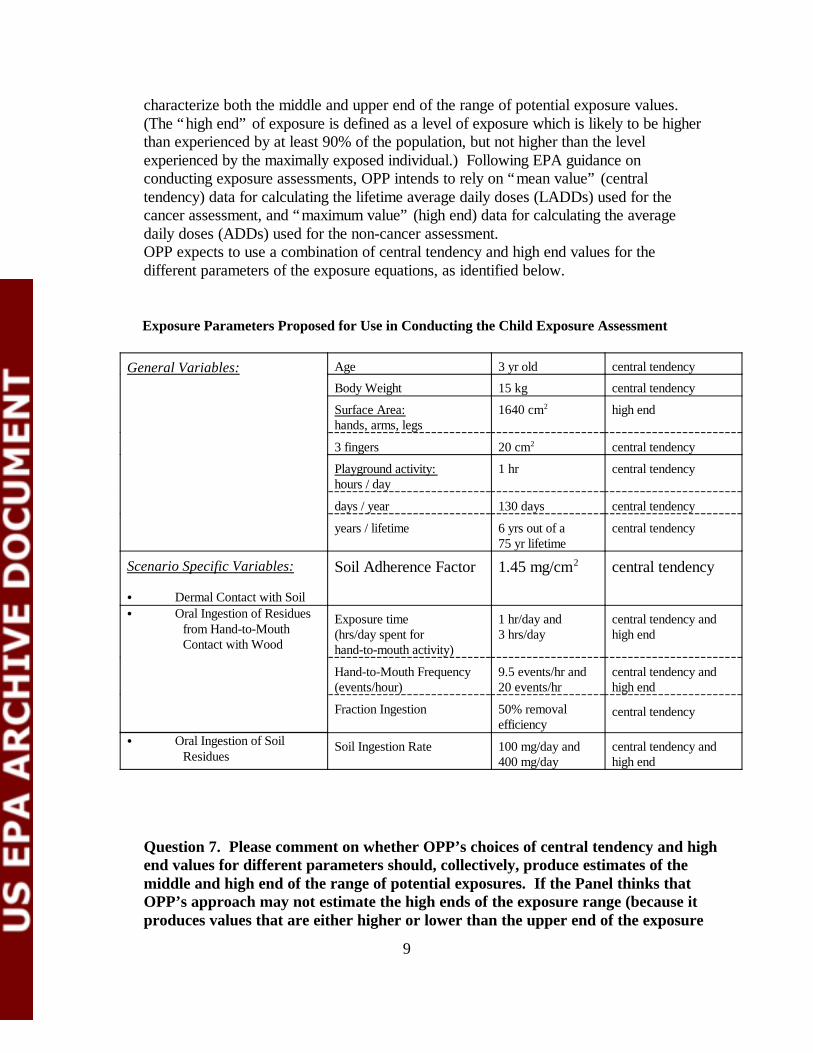
9
characterize both the middle and upper end of the range of potential exposure values. (The “high end” of exposure is defined as a level of exposure which is likely to be higherthan experienced by at least 90% of the population, but not higher than the levelexperienced by the maximally exposed individual.) Following EPA guidance onconducting exposure assessments, OPP intends to rely on “mean value” (centraltendency) data for calculating the lifetime average daily doses (LADDs) used for thecancer assessment, and “maximum value” (high end) data for calculating the averagedaily doses (ADDs) used for the non-cancer assessment. OPP expects to use a combination of central tendency and high end values for thedifferent parameters of the exposure equations, as identified below.
Exposure Parameters Proposed for Use in Conducting the Child Exposure Assessment
General Variables: Age 3 yr old central tendency
Body Weight 15 kg central tendency
Surface Area:hands, arms, legs
1640 cm2 high end
3 fingers 20 cm2 central tendency
Playground activity: hours / day
1 hr central tendency
days / year 130 days central tendency
years / lifetime 6 yrs out of a75 yr lifetime
central tendency
Scenario Specific Variables:
C Dermal Contact with Soil
Soil Adherence Factor 1.45 mg/cm2 central tendency
C Oral Ingestion of Residuesfrom Hand-to-MouthContact with Wood
Exposure time(hrs/day spent for hand-to-mouth activity)
1 hr/day and 3 hrs/day
central tendency andhigh end
Hand-to-Mouth Frequency(events/hour)
9.5 events/hr and20 events/hr
central tendency andhigh end
Fraction Ingestion 50% removalefficiency
central tendency
C Oral Ingestion of SoilResidues
Soil Ingestion Rate 100 mg/day and400 mg/day
central tendency andhigh end
Question 7. Please comment on whether OPP’s choices of central tendency and highend values for different parameters should, collectively, produce estimates of themiddle and high end of the range of potential exposures. If the Panel thinks thatOPP’s approach may not estimate the high ends of the exposure range (because itproduces values that are either higher or lower than the upper end of the exposure

10
range), please comment on what specific values should be modified to produceestimates of the high end of potential exposure.
EPA recognizes that there are many parameters that affect the level of potential exposureand that each of these parameters may vary. Probabilistic (e.g., Monte Carlo) techniquesare capable of using multiple data sets which reflect the variability of parameters toproduce estimates of the distribution of potential exposures. OPP has identified anumber of data sets that contain information on the variability of parameters affecting thelevels of exposure to CCA residues experienced by children as a result of theirplayground activities. Nonetheless, OPP intends to develop deterministic estimates ofpotential exposure using selected values (either central tendency or high end) fordifferent parameters, in such a manner that the estimates describe both the middle andhigh end of the range of exposures.
Question 8: Please comment on whether the existing data bases on the variability ofthe different parameters affecting potential exposure are adequate to support thedevelopment of probabilistic estimates of potential exposure. If the Panel regardsthe data bases as adequate for that purpose, please identify which parametersshould be addressed using a distribution of values and which data bases should beused to supply the distribution for particular parameters.
Issue: Transfer of Residues from Wood Surface to Skin
In lieu of appropriate data on residue transfer from wood to skin surfaces, OPP proposesto rely on assumptions for residue transfer from turf as a surrogate. A one-to-onerelationship is assumed between the transferable residues on turf and the surface area ofthe skin after contact (i.e., if the transferable residue on the turf is 1 mg/cm 2, then theresidue on the human skin is also 1 mg/cm 2 after contact with the turf). This is based onOPP’s Residential SOP’s (April, 2000). OPP plans to apply this one-to-one relationshipto the current assessment, assuming a one-to-one relationship between the dislodgeableresidues on the wood surface and the surface of the skin after contact.
Question 9: OPP is assuming that a one-to-one relationship applies to the transferof residues from wood to skin. The Panel is asked to address whether this is areasonable assumption, and if not, to provide guidance on other approaches.
Issue: Selection of a Soil Adherence Factor
The Soil Adherence Factor (AF) is defined as the amount of soil which adheres to theskin. The AF is highly dependent on the soil type, moisture content of soil and skin,amount of time the soil contacts the skin, and human activities. OPP adopted a dermalexposure scenario for children touching CCA-contaminated soil which relies on an AF of1.45 mg/cm2 (U.S.EPA’s Superfund RAG, 1989) for hand contacting commercial potting
11
soil in lieu of playground soil. A recently drafted report (U.S.EPA’s Superfund RAG,Part E., Supplemental Guidance for Dermal Risk Assessment, draft, 2000), recommended an activity-specific surface area weighted AF value for a child resident at a day carecenter (1 to 6 years old) of 0.2 mg/cm2.Question 10: The Panel is asked to comment on whether the proposed AF of 1.45mg/cm2 for hand contact with commercial potting soil is a realistic value for use inestimating the transfer of residues from playground soil to skin in this assessment.
Issue: Variability of Residue Data Available for Soil and Wood.
The soil and wood residue data being considered for this assessment has been generatedover the last 25 years. There are several variables influencing the consistency of thedata:
- Data were gathered and analyzed by several different research laboratories- Data were collected at different geographic sites- Differences in wood types and treatments between data sets
Additionally, the leaching rates of arsenic and chromium (to both the wood surface andthe soil) are highly dependent on factors such as wood type, degree of weathering, age ofwood, moisture content, pressure treatment process and retention time, use ofcoatings/sealants, and variations in the analytical and sampling techniques betweenlaboratories.
OPP summarized the residue data by selecting and recommending some of the mean andmaximum values from each study in order to compare the degree of leaching from thewood and the level of contamination in the soils. The “mean” data will be used todevelop the lifetime average daily doses (LADDs) for the cancer assessment, and“maximum” data used in developing the average daily doses (ADDs) for the non-cancerassessment.
Question 11: OPP will need to calculate intermediate-term, and possibly long-termexposures in this assessment using available wood/soil residue data. The Panel isasked to recommend a credible approach for selecting residue data values for use inOPP’s risk assessment, taking into consideration the inherent variability of the datasets. Please advise us on which values are best for representing central tendencyand high-end exposures. Also, the Panel is asked to discuss the feasibility ofcombining data from individual data sets.
Issue: Combining Multiple Exposure Scenarios into a Comprehensive Estimate of Risk
Children playing on playgrounds containing CCA-treated wood structures will beexposed to arsenic and chromium residues on wood surfaces and in soils via oral anddermal routes. OPP has discussed four proposed exposure scenarios individually in theexposure assessment; however, to adequately assess the risks to children from exposure
12
to arsenic and chromium residues through playground contact with wood and soil media,all four scenarios must be considered concurrently.
Question 12: Does the Panel have any recommendations for combining the fourscenarios (oral/wood, dermal/wood, oral/soil, dermal/soil) such that a realisticaggregate of these exposure routes may be estimated?
Issue: Inhalation Exposure Potential from Wood/Soil Media
The Agency has selected a NOAEL value of 2.4 x 10⁻⁴ mg/m 3 taken from the 1998 IRISupdate for Cr(VI) using the study of Lindberg and Hedenstierna (Arch Environ Health38(6):367-374) who observed ulcerations, perforations of the nasal septum andpulmonary function changes in 104 workers (85 males, 19 females) exposed in chromeplating plants at a concentration of 7.14 x 10⁻⁴ mg/m 3. The NOAEL value selected isintended to represent an endpoint for use in inhalation risk assessments representative ofany duration of exposure.
OPP does not propose to evaluate potential exposures via the inhalation route for thechild playground exposure assessment. The Agency anticipates that the inhalationpotential from contact with either CCA-treated wood or CCA-contaminated soil isnegligible. Neither arsenic As(V) nor chromium Cr(VI) residues are volatile on thesurfaces of treated wood, or readily available as respirable airborne particulateconcentrations. During play activities in CCA-contaminated soil, any airborne soil-bound residues that a child might inhale through the nose or mouth are not anticipated tocontribute significantly to the overall exposure (i.e., exposure will be insignificantcompared to the oral dose attributed to soil ingestion or hand-to-mouth activities).
Question 13: Can the Panel comment on whether OPP should conduct a childplayground inhalation exposure assessment, taking into consideration the hazardprofile for chromium (VI) as an irritant to mucous membranes? If so, can the Panelcomment on whether the endpoint described above is appropriate for assessing therisk to children from such an exposure?
Issue: Consideration of Buffering Materials as a Source of Exposure
The CPSC specifies suitable loose-fill surfacing materials (e.g., wood chips/mulch, sand,gravel, and shredded rubber tires) for use under and around public playground equipmentas shock-absorbing buffers (i.e., “buffering materials”) to protect children from injuryduring a fall. (Handbook for Public Playground Safety, U.S. CPSC, Pub. No. 325) . Concerns surrounding use of these buffers include the potential for CCA compounds toleach from the CCA-treated playground equipment and absorb into the bufferingmaterials. In addition, these buffers may include wood mulch products originating fromrecycled construction and demolition (C&D) debris that may contain varying quantitiesof CCA-treated wood. Coupling CCA-treated playground equipment with playground
13
barriers made from recycled wood mulch containing CCA-treated wood may increasebackground levels of arsenic and chromium, posing greater human exposure and healthconcerns.
Leaching studies conducted in Florida by Townsend et al. (2001) on new CCA-treatedwood samples (wood blocks, chipped wood mulch, and sawdust) indicated that theconcentrations of metals in leachate solutions were higher for wood processed intochips/mulch or sawdust over wood blocks. The degree to which wood leaches appears tobe dependent on particle size since wood chips/mulch have increased surface areasavailable for leaching, and consequently exposure, over dimensional lumber.
Currently there are limited data available which adequately address the effects ofleaching of CCA-treated wood compounds from playground structures to bufferingmaterials used under and around these structures. A recent report released by Florida’sAlachua County Board of County Commissioners (2001) presents soil and mulch datafrom limited arsenic sampling conducted by Environmental Protection Department staffat five county owned parks. Tire chip and wood mulch buffering materials sampled athalf-depth (2"-6") from areas immediately adjacent to CCA wood playground borders,playground posts, and within playground areas (between borders/posts) yielded arsenicconcentrations for wood mulch of 43.1 - 61.2 mg/kg ( border) and 0.5 mg/kg (play areas),and for tire chips 3.5 - 70.3 mg/kg ( border), 10.3 - 80.3 mg/kg (posts) and 0.4 - 0.9mg/kg (play areas). Each park had a liner in place between the mulch material and thebare soil.
Question 14: Data on the effectiveness of reducing exposure by using bufferingmaterials are limited. Does the Panel have recommendations as to whetheradditional studies to obtain this information are warranted? Does the Panel havesuggestions on how OPP can best evaluate child exposures attributed to contact withCCA-contaminated buffering materials ?
Issue: Effectiveness of Stains/Sealants/Coatings at Reducing Leaching of CCA Compoundsfrom Treated Wood
Several researchers have reported that stains/sealants/coatings can reduce the rate ofleaching of CCA compounds from treated wood and that the effectiveness of thesecoating materials over time varies greatly, depending on the type of surface coating usedand environmental conditions effecting the wood. Stilwell (1998) reported over a 95%reduction in dislodgeable arsenic residues from CCA-treated wood surfaces coated withpolyurethane, acrylic or spar varnish, and an average of 90% reduction for oil-based alkylresins for samples tested one year after a sealant was applied. CDHS (1987) reported96%, and 82% reductions in dislodgeable arsenic from stained CCA-treated woodsurfaces after one month and 2 years, respectively. Lebow and Evans (1999) reportedthat staining CCA-treated wood surfaces reduced leaching of arsenic by 25%.
14
Question 15: The Panel is asked to comment as to whether stains, sealants and othercoating materials should be recommended as a mitigation measure to reduceexposure to arsenic and chromium compounds from CCA treated wood. If so, canthe Panel comment on the most appropriate way for the Agency to recommendeffective coating materials when the current data on long-term performance arelimited and sometimes inconsistent, and should the Agency specify a time intervalfor the re-application of these selected coating materials? Can the Panel makerecommendations for additional studies?
15
DETAILED RESPONSES TO THE CHARGE
Question 1 Please comment on the Agency’s selection of the 0.05 mg/kg/day LOAELvalue for use in assessing risks to the general population as well as childrenfrom short-term and intermediate-term incidental oral and dermalexposures, and the appropriateness of the use of a 10x factor for severity ofthe toxic effects observed in the Mizuta study. Please provide anexplanation and scientific justification for your conclusions as to whether thepresented data are adequate or whether other data should be considered forselection of this endpoint.
RecommendationThere was consensus by the Panel that 0.05 mg As/kg per day is an appropriate LOAEL forshort- (1 to 30 day) and intermediate- (31 to 180 day) human ingestion of the chemical. Themajority of Panel members expressing an opinion recommended a margin of exposure (MOE) of30 from this LOAEL to afford protection from non-cancer health effects. Some Panel membersthought an MOE of 10 would be adequate.
DiscussionBoth Mizuta et al. (1956) and Fanzblau and Lilis (1989) described symptoms and clinical signsof arsenic poisoning in persons believed to have consumed 0.03 – 0.08 mg/kg per day for up toseveral weeks. Confidence in these dose estimates is low. Mizuta et al. (1956) did not provideinformation on their analytical method or on the basis for estimating the extent of arsenicconsumption [from soy sauce] in patients experiencing arsenic toxicity. The information inFranzblau and Lilis (1989) pertaining to dose is derived in part from a retrospective estimate ofwater ingestion rates by two individuals who sporadically utilized an arsenic contaminated well.
Despite reservations about the dose estimates from these two studies, confidence in 0.05 mg/kgper day as an appropriate LOAEL is quite high in that several other clinical studies havereported the emergence of adverse signs and symptoms associated with the ingestion ofinorganic arsenic at similar doses. These include accounts of gastrointestinal disturbances andless commonly mild peripheral neuropathy in individuals consuming medicinal preparationssuch as Fowler’s solution or liquor arsenicalis at doses of 5 to 10 mg of arsenite per day over aperiod of days to months (Stockman, 1902; Pope, 1902; Harter and Novitch, 1967). Daily dosesof arsenic that were probably in the range of 1 to 5 mg arsenite per day for weeks to monthsresulted in gastrointestinal and peripheral neurological findings during the Manchester beerepidemic of 1900 (Reynolds, 1901; Kelynack and Kirby, 1901). Arsenic exposure in drinkingwater for 1 to 4 months was observed to result in gastrointestinal, neurological, and skinsymptoms at doses estimated to be > 0.05 mg/kg per day (Wagner, 1979 as summarized inBenson, 2001). While each of these studies individually has limitations in terms of establishinga LOAEL, there is reassurance in the relative consistency of the LOAEL value they collectivelyprovide. Confidence is further enhanced by the large overall number of subjects, the ethnicdiversity of the subjects, and the inclusion of potentially sensitive subpopulations (including
16
children) across studies.
Several members of the Panel expressed the opinion that the severity of symptoms noted in somepatients near or moderately above a LOAEL of 0.05 mg/kg per day warranted a full uncertaintyfactor of 10. Reports of peripheral neuropathy, gastrointestinal bleeding, liver damage, lowblood counts, CNS dysfunction, and abnormal electrocardiograms were mentioned as examplesof signs and symptoms of concern in these patients. Humans appear to be more sensitive thanmost laboratory animals to arsenic toxic effects, and there is little information on the shape ofthe dose-response curve for these effects in humans. Without knowledge of the dose-responserelationships, it is difficult to forecast acceptable margins of safety. This uncertainty contributedto the recommendation that a 10X uncertainty factor be applied to the LOAEL of 0.05mg/kg/day.
The Panel was divided on whether the MOE should include an additional uncertainty factor. Themajority of Panel members expressing an opinion recommended that a MOE include anadditional intraspecies uncertainty factor of 3 to provide for protection of children. They pointedout that there may be subpopulations of children at special risk of arsenic toxicity, such asindividuals with concomitant toxic exposures and/or vitamin and nutritional deficiencies thatmight impact arsenic kinetics. They noted that there is a paucity of information on thetoxicokinetics of arsenic and its metabolites in children, and that it is unclear whether there areage-dependent differences in GI absorption or biotransformation of arsenic that might influencetoxicity. It was acknowledged that data available at present generally indicate that responses ofchildren and adults to arsenic do not differ significantly qualitatively or quantitatively. However, the opinion was expressed that these data pertain largely to effects on the skin, andthat the immature central and peripheral nervous systems may be quite another matter. Shortand intermediate term exposure to sufficiently high doses of arsenic are neurotoxic in adults, anddata offering insight as to the arsenic doses associated with neurological effects in children wereviewed by these Panel members as lacking. Specifically, an absence of adequate studiesmonitoring neurological indices in children exposed at or near the proposed arsenic LOAEL wascited. Some Panel members expressed concern for childhood exposure to arsenic in combinationwith other neurotoxic metals, and for synergy with other toxicants. Toxicity data oncombinations of arsenic and other toxicants are extremely limited, and some Panel membersquestioned whether a NOAEL developed for inorganic arsenic alone is applicable undercircumstances of exposure to other components of CCA.
Some Panel members argued that an additional intraspecies uncertainty factor of 3X was notrequired, and that an overall MOE of 10 would be adequate to protect human health. It wasnoted that an MOE of 30 would identify doses above 0.0017 mg/kg per day as having thepotential to produce adverse non-cancer effects with exposures of 180 days or less. For a 15 kgchild, 0.0017 mg/kg per day is equivalent to 25 micrograms of arsenic per day. Since it isestimated that the background diet of a 3 year old includes approximately 5 micrograms ofinorganic arsenic (NRC, 1999), the 30-fold margin applied to a 15 kg child would be akin toexpressing concern regarding short- or intermediate-term doses greater than an additional 20micrograms of arsenic per day. There are no data demonstrating acute or subchronic noncancereffects at this approximate level of exposure. The United States experience with respect to
17
existing levels of arsenic in drinking water was cited as evidence for this. The US EPA hasestimated that there are in excess of 1200 public drinking water systems in the United States thatdeliver drinking water with arsenic concentrations in excess of 20 ug/L (US EPA, 2001). Sincethe level of water consumption by some 3 year olds is 60 ml/kg (90 th percentile estimate) (NRC,2001), there appear to be many communities in the United States where young children havealready been consuming >25 micrograms day. There are no reliable reports in the medicalliterature documenting or suggesting that adverse health effects from arsenic have occurred inthese children. Several health surveys conducted in U.S. communities where the arsenicconcentration in drinking water was several hundred micrograms per liter have also not detectedadverse non-cancer effects (Harrington et al., 1978; Kreiss et al., 1983; Southwick et al., 1983). It was pointed out that both the Agency for Toxic Substances and Disease Registry (ATSDR)and U.S. EPA Region 8 have established health criteria for short- and intermediate-termexposure to arsenic of 0.005 mg/kg-day or higher, which is equivalent to an MOE of 10 or less[from a LOAEL of 0.05 mg/kg-day]. Finally, it was noted by one Panel member that clinicalstudies on children exposed to arsenic in drinking water associated the increased severity ofobserved multisystemic adverse effects in children compared to adults to a higher dose rate inchildren, and not to intrinsically increased susceptibility (Zaldivar, 1977; Zaldivar and Gullier,1977; Zaldivar and Ghai, 1980).
Some Panel members cautioned that exposures above the MOE do not necessarily mean thathealth effects will occur and that the Agency should use the MOE in a screening level capacityonly. That is, firm conclusions on the presence or absence of health effects should not be drawnsolely on the basis of doses calculated to exceed the MOE.
Question 2: Please comment on the choice of this data set and value chosen forrepresentation of the relative bioavailability of inorganic arsenic fromingestion of arsenic-contaminated soil. Please discuss the strengths andweaknesses of the selected data and also provide an explanation as towhether this 25% value is appropriate for estimation of bioavailability inchildren.
RecommendationPanel members expressed a diversity of opinions regarding the designation of 25% as a value forthe estimated relative bioavailability of inorganic arsenic from ingestion of arsenic-contaminatedsoil. Several members of the Panel felt that EPA should consider alternatives to a fixed value of25% for the relative bioavailability of arsenic in soil in the vicinity of CCA contamination, whileothers felt that 25% was a reasonable interim value. Many members suggested an interim valueof 50%. Several Panel members recommended that a range of values be considered: for somethe suggested range was 25 to 50%, while another member suggested consideration of the fullrange of bioavailability for arsenic in soil reported in the literature (near zero to 98%).
In addition to oral absorption of arsenic from soil, consideration should be given to absorption ofarsenic from nonsoil substances (such as wood chips or other buffer material) that might besubject to incidental ingestion.

18
Research is needed to obtain data on the relative bioavailability of arsenic from numerous sitesthat encompass the broad range of soil types and arsenic contamination specifically resultingfrom CCA-treated wood applications. These studies should be conducted in appropriate animalmodels preferably at doses that simulate the anticipated level of exposure of children playing onor around structures or sites subject to CCA contamination.
DiscussionThere is general scientific consensus that a number of physical, chemical, and biological factorsmay impact the extent of gastrointestinal absorption of a substance present in ingested soilrelative to absorption of the same substance ingested in solution. For arsenic, as with severalother metals, solubility of the form of arsenic present in soil is a key factor, such that increasedsolubility or extractability of the metal from soil to an aqueous solution is positively correlatedwith increased absorption. Chemical and physical factors influencing the solubility orextractability of arsenic from the soil include 1) the molecular form of the arsenic species; 2) thenature of its chemical and/or physical interaction with the constituents of the soil matrix (e.g.,chemical bonding, sorption, complexation, rinding, or encapsulation); and 3) the size, porosity,compaction, and surface area of the arsenic-containing soil particulates or agglomerations. Biological factors may also influence the absorption of an ingested metal present in soil,including 1) the species-specific metabolism of the metal, including metabolism by microflorawithin the gastrointestinal tract (Hall et al., 1997), 2) the physical condition of the animal at thetime of ingestion (e.g., the effect of drugs, physical stress, toxins, nutritional perturbations, ordisease states on the animal’s physiology), 3) the presence of other ingested material (food,drugs, or other substances) in the intestinal tract, and 4) in some cases the age and/ordevelopmental stage of the animal. The dose regimen that characterizes the ingestion of themetal and the soil matrix may also exert influence on the absorption, in terms of either absoluteamounts or the percent of the dose administered. For example, data on absorption of lead fromsoils (Kierski, 1992; Mushak, 1998) suggest that bolus administration of a large mass of metaland/or metal-containing soil matrix may be associated with a lesser degree of gastrointestinalabsorption, in terms of percent of total ingested amount, than might result from administration ofthe same mass in smaller, divided doses.
Members of the Panel expressed concern that the findings of Roberts et al. (2001) and Freemanet al. (1995) have not provided a sufficient basis to establish a relative bioavailability of 25% forarsenic present in soil as a consequence of CCA related release or contamination. The single,high dose, bolus administration of arsenate and arsenic-containing soils used in the studies byRoberts et al. (2001) and Freeman et al. (1995) does not reasonably simulate the relatively lowdose, repeated ingestion of arsenic-containing soil that would be anticipated with hand-to-mouthbehavior of a child playing in the vicinity of a CCA application. The arsenic concentration of thetest soils (ranging from 101 to 743 mg/kg) appears high relative to those measured in the vicinityof CCA-treated structures in children’s playgrounds in several recent investigations. Theexperimental design used by the investigators resulted in these soils being introduced into themonkey test subjects in single high mass boluses. For example, in the case of soil obtained froma “wood treatment site”, it may be calculated that the soil-associated arsenic dose of 0.3 mgAs/kg body weight was achieved by administering a 3 kg monkey a single oral dose of 9000 mgof soil. In like manner, in Freeman et al. (1995), the monkeys (which weighed between 2 to 3 kg)

19
were given single, oral doses of 3000 to 4500 mg of soil containing 410 ppm arsenic. Enhancedconfidence in the generalizability of the relative bioavailability values from such studies mightbe obtained from experimental designs that utilize multiple, smaller soil doses spanning a rangeof relevant arsenic concentrations.
There is uncertainty regarding the extent to which the test soils used in the studies by Roberts etal. (2001) and Freeman et al. (1995) reflect arsenic speciation and chemical and physicalcharacteristics of the soil matrix in the vicinity of CCA contamination at a playground. Although a soil sample from the investigation by Roberts et al (2001) was identified as comingfrom a “wood treatment site,” this sample was not characterized further. The arsenic in that soilmay have resulted in part from direct spillage of raw CCA product onto the soil, rather thanleaching of arsenic from a weathered piece of CCA-treated wood.
The animal model used in the studies by Roberts et al. (2001) and Freeman et al. (1995) were theCebus apella monkey and the cynomolgus monkey, respectively. Intravenous dosing withsodium arsenate suggested that these nonhuman primates were similar to humans with respect toexcreting absorbed arsenic almost entirely through the urine (<5% of the recovered doseoccurred in the feces). Also, the extent of excretion of an oral dose of sodium arsenate in urineand feces was quite similar between these monkeys and humans. At this point in time, the Panelis not aware of information regarding the biomethylation patterns of arsenic species in thesenonhuman primates. This is an issue of some concern for some Panel members because othernonhuman primates, such as the marmoset monkey, do not biomethylate arsenic and exhibitprolonged retention of some arsenic species in vivo. These Panel members thought that thiscould potentially result in an underestimation of relative bioavailability if a significantproportion of the arsenic specie(s) present in the test soils was retained in the body for a longerperiod of time relative to the reference material, sodium arsenate in solution. Underestimationcould also result if arsenic present in the test soil underwent greater relative biliary excretioncompared to sodium arsenate. Other Panel members acknowledged these possibilities butexpressed the opinion that these factors were not likely to significantly affect the findings.
At the present time, little is known regarding differential absorption and metabolism of arsenic injuvenile versus adult animals. Some Panel members expressed concern that the developmentalage of the animal model might be a potentially significant variable, since it is known that infantsand even older children as well as very young animals, sometimes have the potential forincreased uptake of contaminants. Although the swine models have utilized juvenile pigs, thecurrent monkey bioavailability data were obtained with adult animals. To the extent that thenutritional or dietary status of children and experimental test animals may affect the uptake ofother substances, the absorption of arsenic (particularly arsenate) in the face of phosphorousdeficiency is of potential concern for these Panel members. They noted, for example, thatarsenate uptake by cells has been shown to be increased in low phosphate media (Huang andLee, 1996) and suggested the need for further research on the impact of nutritional anddevelopmental factors on bioavailability determinations. Other Panel members pointed out thatthe absorption of arsenite and arsenate, in absolute terms, is already extensive in adult animalsand humans. As a result, the potential for greater absorption in children is limited, andconsequently they did not think that use of arsenic bioavailabilty values from adult animals was
20
a significant concern (the Panel members thought that arsenic bioavailability values from adultanimals were applicable to immature subjects).
As discussed in more detail elsewhere in this report, the interactive effect of metal combinationsmay influence arsenic absorption, biotransformation, and excretion. For example, whenadministered together with selenite, some inorganic arsenic compounds undergo increasedbiliary excretion (Levander, 1977; Gailer et al., 2000) , a factor that may potentially serve tounderestimate relative bioavailability in models that examine relative urinary excretion as amarker of relative bioavailability.
Panel members noted several other studies that have investigated the oral bioavailability ofarsenic in soils. Widely divergent results for relative bioavailability have been reported, a findingthat is not unexpected given the variability in soil-associated arsenic compounds, soil matrices,animal models, and experimental design. For example, Casteel et al. (2001), under the auspicesof U.S. EPA Region VIII, recently examined the relative bioavailability of arsenic in soils fromthe VBI70 superfund site in Denver, CO. Using a swine model that investigated six soilspecimens spanning a range of arsenic concentrations, the mean relative bioavailability was31%, with a 95% upper confidence limit of 42%. This latter value (42%) has been utilized in riskcalculations contained in the site’s baseline risk assessment (US EPA, 2001). Other relativebioavailability studies have been noted or reviewed in the Inorganic Arsenic Report of theHazard Identification Assessment Review Committee (HIARC, 8/21/2001), and a recentpublication by Ruby et al. (1999). Results for relative bioavailability have ranged from near zeroto 50%, with the exception of two soils from Aspen, CO, that yielded much higher results, albeitwith extremely wide confidence intervals (62% ± 55, 98% ± 86; Casteel et al., 1997; Ruby et al.,1999).
Question 3: Please comment on the selection of the value of 6.4% for dermal absorptionof inorganic arsenic and whether or not this value will be appropriate for usein all scenarios involving dermal exposure to arsenic from CCA-treatedwood, including children’s dermal contact with wood surface residues andcontaminated soils.
RecommendationsThe Panel recommends that EPA use a value less than 6.4%, probably in the range 2-3%, fordermal absorption of inorganic arsenic. The Agency should consider using a figure forabsorption rate (e.g., percent exposure absorbed per hour) rather than a value for percentabsorption.
Research, using arsenic in more appropriate chemical form (that it is present in dislodgeableCCA residues and in soil beneath CCA-treated sites) and in a relevant matrix, should be carriedout to improve estimates of dermal absorption.
21
DiscussionThe Panel accepted the EPA view that the publication by Wester et al. (1993) provided the mostappropriate available data for addressing this question. This research included a study that usedseven rhesus monkeys. The absorptions of the pentavalent arsenic species H 3AsO4, radiolabeledwith As73, in water solution and added to soil, were compared. For both water and soil, a high-exposure and a low-exposure group were used. The low exposure groups represented “theminimum arsenic that could be used given the specific activity of the compound.” Theseexposures were 0.00004 µg/cm2 for the soil group and 0.000024 µg/cm2 for the water formulationgroup. The high exposure group was described as “representative of what would be encounteredin more contaminated areas.” These exposures were 0.6 µg/cm2 for the soil exposure group and2.1 µg/cm2 for the water group. The skin exposures were for 24 hours and confined within anon-occlusive cover. Urine was collected for seven days following the beginning of theexposure period. Results were adjusted for excretion by other routes than urine and for retentionin the body using results from monkeys that had been treated with an intravenous dose ofarsenic. The data showed that 80.1% of the intravenous dose administered to the monkeys wasexcreted in the urine over a period of seven days.
The Panel noted a number of limitations in the reporting of the design and conduct of the studyby Wester et al. These included:
• Uncertainty whether separate monkeys had been used for the dose groups or the samemonkeys had been reused. If the latter, then it raised the possibility of cross-contamination, such that there could have been continued “slow leaking” of arsenic frombody reservoirs that would have affected latter parts of the experiment.
• The large particle size of the soil used. Particle size is likely to affect bioavailabilitybecause of differences in surface-to-volume ratio.
• The procedure by which arsenic was added to the soil was not described. The contactperiod prior to skin application appears likely to have been very short relative to the timethat would be necessary for binding to the soil particles.
• The water in which the arsenic was dissolved was not adequately described in terms of itschemical characterization.
• There was no information on whether the cage was washed to collect radioactivity and, ifso, how this was taken into account for the purposes of calculating the absorbed dose.
• To keep the soil on the skin, a device made of two aluminum eyeguards sandwichedaround a Goretex membrane was taped over the soil after application to the skin. Thesoil used had a particle size distribution larger than would typically be expected to adhereto skin. It is likely that soil fell to the bottom of the dosing device (which had a largervolume than the volume of the soil applied) and was not uniformly distributed on skin.
22
• The applicability of soil and water data to arsenic residues derived from wood surfaces isunknown.
Results of the study by Wester et al. (1993) were as shown in the following table:
In vivo percutaneous absorption of arsenic from water and soil on Rhesus Monkeys
Percent applied doseWater Soil
Low exposure High exposure Low exposure High exposure6.4 ± 3.9 2.0 ± 1.2 4.5 ± 3.2 3.2 ± 1.9
An inverse relationship between exposure concentrations and percent absorbed was noted. Thelowest exposure (water formulation) was associated with the highest percent absorbed – 6.4%. This value was proposed by EPA as the default value for skin absorption.
The Panel considered that, on general toxicological principles, for the purpose of extrapolatingthe results to humans, it would be more appropriate to have results obtained using a morerealistic level of exposure, namely the higher exposure level used in the experiment. In thatregard, it was also noted that the soil group had a higher degree of arsenic absorption (3.2%)than the water formulation group (2.0%). There were two possible reasons why this might havehappened: 1) a factor in the soil that promoted exposure or 2) random biological variationbecause of the small numbers of monkeys in the groups (three monkeys in the water formulationgroup and four in the soil group). The Panel considered the second reason the more likely.
On this basis, the Panel considered that a value for skin absorption in the range 2-3% would bemore appropriate than 6.4%. However, it was felt that this was likely to overestimate actualabsorption, because the monkeys had been exposed for 24 hours and the form of arsenic used inthe experiment was probably more water soluble than arsenic from CCA treatment. Also, thetreated soil had had no opportunity to “age,” a process that could bind the arsenical moleculesmore tightly to the soil matrix and reduce absorption. The possibility of considering a measureof absorption that took into account time of exposure (i.e., absorption rate) was felt to be worthyof further consideration.
A separate in vitro experiment reported by Wester et al. involved measuring absorption ofarsenic from water and soil on human skin. This gave a result of 0.76 % absorption from soiland 1.9 % from water.
It was also noted that there was a lack of information on the chemical form of arsenic in CCAresidues. The assumption was that residues were likely to be in the pentavalent form. If therewere trivalent arsenic present, then the kinetics of arsenic absorption could be different. However, there is no available information on skin absorption of trivalent arsenic compounds.
23
In view of the limitations of the research on which this evaluation was based, the Panelconsidered that there was an urgent need for further research on skin absorption of CCAresidues, employing the form of arsenic found in dislodgeable residues and soil from CCA-treated installations.
The Panel also considered a proposal by two of the public presenters – Gradient and Exponent –to adjust the percent absorbed (as determined by Wester et al.) by a factor representing therelative bioavailability of gastrointestinal absorption of CCA arsenic residues. The rationale forthis adjustment was that the Wester experiment had used a more water soluble form of arsenicthan was present in CCA residues, and it had not had the opportunity to “age” after being addedto soil. The Panel accepted that the form of arsenic used in the experiments by Wester et al.(1993) was not ideal, but considered it inappropriate to adopt this proposal for an adjustmentfactor, since it would involve a form of “double-counting” of soil-related factors that reduceabsorption. It was felt that the recommended research would better address the issue identifiedby Gradient and Exponent.
Question 4: As available monitoring data do not differentiate among chromium speciesfound in CCA dislodgeable residues on wood surfaces and in soils, and as Cr(VI) is the more toxic species of chromium, please comment on whether useof the hazard data for chromium (VI) is the best choice for characterizinghazard and risk from exposure to chromium as a component of CCA-treatedwood. Please provide a scientific explanation and justification for your recommendation on the choice of either the chromium (III) or chromium(VI) hazard database.
RecommendationIt is the Panel’s conclusion that, at present, there is no reliable evidence on either the presence orabsence of Cr(VI) in dislodgeable residues on treated wood surfaces. Some measurable Cr(VI)probably exists in certain soils, but it is unlikely to be 100% of total chromium. One approachwould be to use an estimate of 25 to 50% hexavalent chromium. Some Panel memberssuggested 5 to 10% would be conservative. In order to be health protective, it would bescientifically reasonable to use the Cr(VI) hazard database with respect to a range of chromiumfractions. The Panel strongly recommends that EPA conduct studies of chromium speciation (inboth dislodgeable residues and soil samples) in their proposed studies.
DiscussionThere was little disagreement that available information on the valence state of chromium didnot establish either the presence or absence of Cr(VI) in dislodgeable residues. The speciationdata presented at this meeting are limited. However, the limited Florida data suggest that Cr(VI)may not be a major environmental hazard, even as we acknowledge that the hexavalent form ofchromium is the more significant health hazard. Further research on valence speciation ofchromium at sites where treated wood is being used is warranted.
24
Several members of the Panel noted that detection of Cr(VI) would be confounded by the factthat Cr(VI) in dislodgeable residues would be much more soluble and therefore more mobile totransport off treated surfaces with rain events. This complication could be accounted for in thefuture pilot studies being planned by EPA and CPSC. The Panel did not elaborate further on theissue of Cr(VI) in dislodgeable residues, and the rest of the Panel’s focus was on valency issuesfor soil chromium.
Several members of the Panel noted that there is some evidence from two types of studies thatCr(VI) can exist in soils in measurable amounts. The fraction of Cr(VI) in soils is highlydependent on such soil characteristics as moisture content, pH, binding sites for adsorption onmineral and organic components, etc. One line of study entailed experimental evaluation ofCr(VI) formation and stability in soils of differing chemical, moisture, and complexing types(Bartlett, 1991; Bartlett et al., 1983; Bartlett et al., 1979).
A critical factor in formation of Cr(VI) in undisturbed, non-acid soils of typical moisture contentis the oxidation of Cr(III) to Cr(VI) by manganese oxide. Bartlett also reported that Cr(VI) canbe adsorbed and stabilized to some extent.
A second body of information consists of determination of the fraction of Cr(VI) in soils inHudson County, NJ, which received alkaline chromite ore processing residues. The fraction ofCr(VI) ranged from 1-50% (Burke et al., 1991). At this site, the amount of Cr(VI) was seldommore than 10%. In situations where the chromium was in solution in surface water, chromiumblooms (crystallization) occurred on the soil surface as the soil dried out and contained up to50% Cr(VI).
The overall discussion by the Panel of what fraction of Cr(VI) in soils should be adopted by EPAin any preliminary risk assessment efforts elicited a range of values and a variety of conclusionsas to their significance. This variety of opinions included a desire to wait for the pilot studiesbeing planned nationally before going any further. Some members indicated a range from 5-10% would be conservative. Other Panel members indicated a range of 25 to 50%. One Panelmember noted that it was inappropriate to consider the chromite ore residue data in New Jersey.
It was generally the view that it would be unlikely that 100% of total chromium would bepresent as Cr(VI) in playground and deck areas. Conversely, no Panel member tendered theview that Cr(VI) would never exist in any soils associated with playgrounds and/or decksconstructed of CCA-treated wood.
The Panel generally was interested in having the planned studies by EPA and CPSC include asmuch chemical speciation data as possible -- much more than the agencies had indicated in theirdraft protocols.
One Panel member, with assent from others, noted that the issue of chromium valency in soils isnot subordinated to the subsequent redox transformations that might be assumed to occur in thestomachs of children ingesting soils containing Cr(VI). That is, any transformation of Cr(VI) toCr(III) in receiving body compartments (lung, GI tract) occurs via uptake of Cr(VI) and
25
formation of intermediate, bioreactive valencies that may be linked to the mechanism of thetoxicity of Cr(VI).
Question 5: Please comment on the Agency’s selection of the 0.5 mg/kg/day NOAELvalue for use in assessing risks to the general population as well as childrenfrom short-term and intermediate-term incidental oral exposures toinorganic chromium as contained in CCA-treated wood. Please provide anexplanation and scientific justification for your conclusions as to whether thepresented data are adequate or whether other data should be considered forselection of these endpoints.
RecommendationThe Panel expressed concerns regarding the selection of the 0.5 mg/kg/day NOAEL for short-term and intermediate-term incidental oral exposures to inorganic chromium. In general, theseconcerns involved the appropriateness of the study selected by EPA (Tyl, 1991) to derive thisvalue. It is the Panel’s recommendation that the Agency re-review the literature and considerother potentially more relevant studies.
DiscussionThe SAP agreed that the most appropriate toxicology data for the development of the NOAELshould involve the same species of chromium as present in CCA-dislodgeable materials andcontaminated soils which are the subject of the risk assessment. Given the absence ofappropriate data, this decision will ultimately depend on the results of field studies such as theplayground studies proposed by EPA/CPSC.
The Panel questioned whether the study proposed for the derivation of the NOAEL (Tyl, 1991)actually demonstrated the purported effect. The Panel was divided on this issue; some thoughtthe study adequate and appropriate to support the proposed NOAEL while others thought thestudy to be flawed and inappropriate.
• The selected study had the primary purpose of evaluating the reproductive anddevelopmental effects of exposure to Cr(VI). While no developmental effects wereobserved, maternal effects were noted and were used to derive the NOAEL. Rabbitswere given a bolus of chromic acid (CrO 3) diluted in distilled water by gavage for twelveconsecutive days. Dosing was at 0, 0.1, 0.5, 2.0, 5.0 mg/kg/day levels; the 5.0 mg/kg/daydose was noted to have a pH of 1.52. Maternal effects observed included mortality in the2.0 and 5.0 mg/kg/day groups and reduced weight gain, decreased food absorptionefficiency, labored breathing, and diarrhea in the 5.0 mg/kg/day group. No pathologicabnormalities were noted in any group.
Several members of the Panel questioned the attribution of the observed effects to the Cr( VI)dosing; they believed that an acid effect could not be ruled out. Others discounted thispossibility stating that dietary residues could readily neutralize the acid. Specifically, it wasnoted that rabbits retain half their ingested diet 24 hours after conventional fasting began
26
(Carmichael et al., 1945) and this residue would serve to buffer against acid injury from acidicmedia given after conventional fasting. There was no resolution of this difference ininterpretation.
Studies cited by the Agency (MacKenzie, 1958) and Zhang and Li (1987) are generallysupportive of the NOAEL value derived from Tyl, but, as noted by OPP, these studies sufferfrom a lack of definitive exposure information and are of inappropriate duration for use inderiving a short or intermediate measure.
Question 6: Please comment on whether the significant non-systemic dermal effects fromdermal exposure to inorganic chromium should form the basis of dermalresidential risk assessments, and, if so, how the Agency should establish adermal endpoint for such an assessment.
RecommendationThe Panel advises that EPA should base risk assessments for noncancer health effects of dermalexposure to hexavalent chromium on direct dermal effects – irritant and allergic contactdermatitis. The Panel was unable to provide EPA with methods for establishing endpoints anddetermining dose response relationships for these effects.
DiscussionIt is unlikely that sufficient chromium could penetrate the skin and enter the circulation to causesystemic effects from dermal exposure. Skin penetration for chromium is estimated to be 1%. Itis usually assumed that the contribution to systemic effects from dermal exposure is not likely tobe significant relative to oral exposure. Direct dermal effects (irritation and allergenicity) aretherefore likely to be the controlling endpoints as far as dermal exposures are concerned. ThePanel therefore advises that EPA base its residential risk assessments for the dermal route onthese direct dermal effects. In order to make sure this route is inconsequential for systemiceffects, one could run a PBPK model and compare the target tissue doses from the oral anddermal routes.
The Panel believes that EPA should consult with the New Jersey Department of EnvironmentalProtection (see Bagdon and Hazen, 1991) concerning establishing dermal endpoints andperforming dose response assessments for dermal exposure to chromium using direct skin effectendpoints. The main problem will be determining the appropriate endpoint and obtaining ausable dose estimate from the published literature using data from exposure of workers and otherexposed individuals (Bagdon and Hazen, 1991; Burke et al., 1991) or possibly from animalexperiments mentioned in the ATSDR document (Mor et al., 1988; Gross et al., 1968; Jansenand Berrens, 1968).
Question 7. Please comment on whether OPP’s choices of central tendency and high endvalues for different parameters should, collectively, produce estimates of themiddle and high end of the range of potential exposures. If the Panel thinksthat OPP’s approach may not estimate the high ends of the exposure range

27
(because it produces values that are either higher or lower than the upperend of the exposure range), please comment on what specific values should bemodified to produce estimates of the high end of potential exposure.
RecommendationThe Panel offers the following recommendations:
• Particularly when using point estimates it is important to do subset analyses for specificregions of the country (for example, the South compared to the North or Midwest) andfor age groups (for example, one year olds compared to 5-6 year olds).
• The averaging of exposure over a 75-year lifetime may underestimate risk. More researchis needed to understand the uncertainty associated with this form of temporal averaging.
• More research is needed on the amount of soil ingested, as this is still a source ofuncertainty.
• For fully evaluating high end exposures it would be necessary to include exposure ofchildren with Pica.
• A probabilistic assessment as discussed in question 8 is recommended.
DiscussionComments of OPP’s choices of central tendency and high-end values for different parametershave been approached in two ways: assessing the quality of the specific values OPP haspresented and evaluating whether the point estimates used in the Agency’s calculations willprovide reasonable estimates of the high-end exposure range.
Specific valuesThe prototypical three year old behaviorally does not represent either a one year old or a six yearold. In addition, the surface area used for fingers, 20 cm 2, while appropriate for a three year old,would be an overestimate for young children, since both the surface area of the hand and theproportion of the surface area which is fingers are different for younger children. This is anargument for either doing subset analyses for smaller age groups, or doing probabilisticevaluations.
Time spent at play outdoors may be an overestimate for the measure of central tendency. BothNHAPS data and that reported by Silvers et al. (1994) suggest that most of the time children areat play outdoors is on grass or paved areas, neither of which represent the types of substratestypically found around CCA wood play structures.
The assumption that the average child spends 130 days playing on these structures is also not arealistic central tendency measure. The National Human Activity Pattern Survey (NHAPS) datafor children 1-4 years old suggests that on any day only 50% of children may play outdoors andthat, of those, approximately 40% would play on the types of substrates on which playequipment is found. Data presented from Florida suggest that there may be major regionaldifferences in these estimates which would not be treated well with point estimates unlessregional subset analyses were done.

28
The hand to mouth frequencies proposed are based on both indoor and outdoor mouthingperiods. Freeman et al. (2001) found that, among children in Minnesota, mouthing rates weresignificantly higher indoors than outdoors (approximately 3 times higher indoors). At the sametime, if residues or soil adheres to hands, the ingestion of that material may not take placeoutdoors, but occur indoors after the child has played on the equipment. Freeman in her ownevaluations has shifted to using the median value of Reed’s data (8.5/hr) rather than using themean of 9.5/hr as a more conservative value for a measure of central tendency. It should benoted that most mouthing behaviors occur indoors during quiet times such as when watchingTV. It has been infrequently observed during active outdoor play other than by infants and veryyoung toddlers.
The issue of whether replenishment occurs after mouthing needs to be addressed. Contacts withsurfaces and objects are “fast and furious,” with the average contact duration of 4 seconds andhundreds occurring per hour. If total replenishment occurs after 4-5 contacts (Rodes et al.,2001), then it is likely that the fingers are fully loaded between mouthing events.
Some Panel members noted that the central value for soil ingestion rates of 100 mg/day isprobably an overestimate. Median values reported by both Stanek and Calabrese (1995), andDavis (1990) range from 0-96 and 25-81 mg/day, depending of the tracer used. Other estimatesrange between 35-70 mg/day and may be more realistic (Sedman, 1989 and 1994; Calabrese,1995). These values also represent total soil consumption for the day, and not just from the 1-3hours of play by CCA treated equipment, which would be something less than 100% of daily soilconsumption. In addition, the use of 400 mg/day as the high-end value is also an overestimatebased on Calabrese and Stanek’s work.
In considering high-end exposures, the Agency might consider including an evaluation ofchildren with Pica behaviors. This is an area for which there are little data but may be importantfor understanding the high end exposures.
Reasonable estimatesThe dermal and ingestion models proposed are very simplistic, but there is no harm with tryingthem and trying a variety of inputs as a first step in understanding exposure and risk. There maybe no point trying to agree on a correct set of inputs at this time. Additional data on dermal andingestion exposure will improve the models and reduce uncertainties. All of the coefficients andparameters seem to be conservatively biased toward overestimating exposure. When inflated“central tendency” values are put into the deterministic exposure calculation, they can beexpected to overestimate the expected or “central tendency” exposure. If the distribution ofexposure is highly positively skewed, this bias may be considerable. In some cases the arithmeticmean values presented are substantially skewed and should be replaced by median values as abetter indicator of central tendency.
Working with the high-end values will be even worse, as the result will correspond to the veryrare event of an exposure that is extreme in every aspect and hence will be higher than is everobserved in reality.
29
Looking at the general variables that the Agency proposes to use for characterizing childexposures through dermal and oral routes, the general conclusion is that using a range of valuesin a probabilistic evaluation should be the way to approach evaluating child exposures. Issuesrelated to a probabilistic model are discussed in Question 8.
If the deterministic model is used, any parameters that are unnecessarily inflated should bereduced. One value to look at first is the calculation of skin surface area, which could bereplaced by the “effective skin surface area.” The hours per day of playground activity couldalso be looked at, the days per year will probably vary regionally.
The models proposed by the Agency for the study of children's acute and chronic CCA metalsexposures (ADD-average daily dose and LADD-lifetime average daily dose) from playstructures involve the composition (through multiplication and division) of stochastic variablesfrom multiple sources and transitions in the dermal and oral exposure routes. The truecomposite exposure distribution is expected to be right skewed (e.g., log normal or similardistribution). It is also expected that the distribution is left censored—rarely at zeroexposure—but at other exposures not related to playground or play structure use.
Estimates of ADD and LADD distributions, their means, medians, and quantiles, should reflectthe distributional parameters (means and variability) of each of the exposure components, thecovariance of the exposure components, and, through sensitivity analysis, the uncertainty(variance and bias) of the sample-based or postulated value of these parameters. In addition, theinfluence of covariates (e.g., region, climate) not explicitly included in the estimation modelmust be taken into account.
The proposed estimators of ADD and LADD are simple product and/or ratio statistics. In thesimple case of a product of two variables, the product of central tendency values is
E(X) E(Y) = E(XY) – Cov(X, Y)
This implies that for positively correlated X, Y the product of means will underestimate themean of the product.
Furthermore, if these central tendency measures are estimated from sample data, theapproximate variance of the product is
Var(X Y) = Var(X) E2(Y) + Var(Y) E2(X) + 2 Cov(X, Y) E(X) E(Y)
That is, the variance of the product will be inflated if there is a positive correlation between thevariables. For statistics such as the proposed estimators of the ADD or LADD, the propertiesillustrated here for means of two distributions will be propagated through calculations involvingmeans of more than two variables.
The median of the product X Y may not be the product of the median even if the twodistributions are uncorrelated. To illustrate, take two simple discrete uniform distributions, X=(1,
30
2, 3), Y = (2, 8, 14). Generate all possible (X, Y) pairs and create the distribution of their product(e.g., 1 x 2=2, 1 x 8 = 8, etc.) assuming no correlation. The composite product distributionincludes 9 equally likely values X Y=(2, 4, 6, 8, 14, 16, 24, 28, 42) with median = 14, but theproduct of the medians of the X and Y distributions is 2 x 8 =16.
Likewise, the product of the medians and other distributional quantiles (e.g., Q 90, Q95) for X andY that are positively or negatively correlated will be biased for the quantile of their productdistribution. The direction and magnitude of the bias will depend on the size of the correlationand the shape (symmetry and variability about mean) of the distributions of X and Y. Thetheory here is based on Dirichlet distributions for the products of order statistics.
The alternative to the deterministic approach that is proposed is a probabilistic modeling of theexposure routes. Bayesian methods, possibly with flat priors over the range of measuredparameter values, might be considered as the probabilistic approach is developed.
Question 8: Please comment on whether the existing data bases on the variability of thedifferent parameters affecting potential exposure are adequate to supportthe development of probabilistic estimates of potential exposure. If the Panelregards the data bases as adequate for that purpose, please identify whichparameters should be addressed using a distribution of values and whichdata bases should be used to supply the distribution for particularparameters.
RecommendationIn view of its concerns that the deterministic model reviewed in Question 7 will not correctlyestimate the central tendency or percentiles of the exposure distribution, the SAP recommendsthat the EPA immediately begin to take steps toward the development and progressiverefinement of probabilistic models of exposure. The probabilistic models will give high-endvalues that are interpretable as a percentile of the modeled exposure distribution rather than abiased approximation of the upper limit of exposure. The existing databases on the variabilityof the different parameters affecting potential exposures of children using CCA-treatedplayground structures are adequate to begin the development of probabilistic estimates ofpotential exposure provided the uncertainty associated with these data is reflected in theexposure modeling. As noted above, the Panel views the development of a probabilisticassessment as a process of progressive learning and refinement. New or more detailed data onstates and transition factors are needed and will contribute to improvements in the exposuremodels as they become available.
DiscussionThe Monte Carlo risk assessment of CCA metals exposures presented by the EnvironmentalWorking Group (EWG), while it contains several deterministic and simplifying assumptions, is agood start and illustrates what can be done with existing data. The use of a probabilisticapproach avoids the arbitrariness and artificiality of selecting single values to represent factorsthat are known to vary considerably across individual exposures. This advantage is of particular
31
importance for the case of the RME estimates, where it has been demonstrated that the selectionof reasonable upper bounds for several distributed parameters used as independent variables in acalculation can result in an estimate of the dependent variable (e.g., exposure) that isunreasonably far out in the tail of the probability distribution for that variable.
EPA guidelines for probabilistic exposure assessment and software programs like SHED, ReX,LifeLine, and Calendex can be used to perform a multi-dimensional analysis (separating, to theextent possible, variability and uncertainty). The LifeLine and Calendex models that have beenreviewed by prior SAPs and proposed for studies of cumulative (including residential) exposureto organophosphates provide basic algorithms for beginning probabilistic approaches. Oneadvantage of these programs is that they permit inspection of individual exposure values and thecumulative contribution of individual components to aggregate exposures. In these softwaresystems, varying degrees of deterministic analysis can be forced by simply limiting thevariability of the stochastic distributions.
The Panel recognizes that probabilistic exposure assessment is a relatively recent advance in riskassessment methodology. Therefore, a parallel approach is suggested, in which deterministicexposure estimates may be determined quickly and in advance of probabilistic estimatesprimarily to develop an initial understanding of which parameters have the greatest leverage onthe final distribution of exposure outcomes. In addition, it is recommended that a limitedvariability analysis, similar to that presented by EWG, be performed as well as a fullvariability/uncertainty analysis. If a probabilistic approach is used, the 50 th and appropriateupper percentiles can be used as the central tendency and high-end estimates, respectively. Evenif the Agency determines that a probabilistic approach cannot be used for the exposure estimates,the probabilistic results will play an important role in the risk characterization, for characterizingthe variability of individual risk, the impact of uncertainty on the risk estimates, and thesuitability of the selected central tendency and “high-end” values used in the deterministiccalculations.
As mentioned above, a limited variability analysis could be performed in a similar fashion to theanalysis presented by EWG. In this case, the Monte Carlo analysis would only vary parametersfor which substantial data on variability are available. In the EWG analysis these included dailysoil ingestion, dislodgeable arsenic, soil arsenic, and body weight. The approach used by EWGfor body weight and surface area, following a child from 12 to 84 months of age with theopportunity for moving, is recommended, since it permits the incorporation of other age-dependent parameters such as mouthing behavior.
The details of the Monte Carlo analysis will need to be determined by considering the presumednature of the anticipated exposures and the available data. For example, if it is assumed that achild uses a single playset for the entire 6 years, then a single randomly selected data set fordislodgeable arsenic can be associated with each child. If it is assumed that a child would usemore than one playset, a more complicated sampling approach would be necessary. Alternatively, a very simple approach would be to repeatedly select at random from the totalityof the data for dislodgeable and soil arsenic and use these selected values in the deterministicformulas together with the assumed values for the other parameters. The Panel encourages the
32
Agency to plan for modeling the exposure risks not only of special scenarios of individualexposures but also exposures in special high-risk populations. Such high-risk populations mightinclude children in day care settings and living in warm climates, where the exposures to CCAtreated wood may be more frequent and of longer duration than in the general population atlarge.
The more complete two-dimensional analysis should include distributions for all of theparameters in the exposure calculations. To the extent possible, separate distributions would bedeveloped to describe variability (inherent variation) and uncertainty (lack of certainty regardingthe correct value). The resulting exposure estimates would take the form of a “distribution ofdistributions” in which the variability around the central estimate would be displayed in onedimension while the uncertainty in the central estimate would be displayed in the seconddimension. The multiple curves presented by EWG for different parameter assumptions is a(simpler) example of such a concept. However, instead of just showing the variability results fordiscrete alternatives of the uncertain parameters, distributions would be presented. Thedistributions used to describe uncertainty are necessarily much simpler than those informed byvariability data. For example, a parameter may be characterized as having a uniform distribution(with equal likelihood of being anywhere in a given range), or by a triangular distribution (with apeak at the best estimate and vertices at the extreme values). The biggest problem with thisapproach is that there is often considerable uncertainty whether the observed differences in thevalue of a parameter represent variability or uncertainty or variability compounded byexperimental bias (which introduces uncertainty). It is usually valuable to perform an analysison the probabilistic approach that evaluates the sensitivity of the conclusions to alternativedecisions that could be made regarding the variability/uncertainty distributions. As mentionedearlier, even if it is decided that the use of such an analysis for the risk assessment would not beappropriate, the results of the analysis would be very useful for characterizing the potentialimpact of uncertainty on a risk assessment using a partial probabilistic/deterministic approach.
Publications and presentations given to the Panel indicate that more data are needed tocharacterize other sources of variation and that there are more factors that need to be included inthe model.
One area of improvement that could be addressed immediately is better representation of age-specific differences in children’s body size and behaviors. For modeling population exposures, afirst improvement over the current assumption of a fixed age and body weight for exposedchildren is to draw on data for children that are available from major survey data sets such as theNational Health and Nutrition Examination Survey (NHANES). The EWG simulation studypresented to the SAP by Dr. Houlihan used this approach. These samples of children providerepresentative age- and gender-specific data on body weights and heights for U.S. children. Modeling of exposure should adopt the methodology employed in LifeLine and other softwarethat “ages” the child through the exposure window. As the child ages in the probabilisticsimulation, the appropriate age-specific activity and exposure factor data are applied to estimatetime-dependent contributions to short- and long-term exposures.
Another major source of uncertainty in the current model of exposure is the data on the
33
distribution of frequency and duration of children’s exposures to CCA-treated wood playstructures. The deterministic model proposed in the EPA presentation to the SAP makes a verysimplifying assumption of constant daily and annual exposure frequency for six years of life. Obtaining precise, nationally representative time and activity data for children in the relevant ageranges would be tremendously costly. However, small local studies and existing small-sampledata from the National Human Activity Pattern Survey (NHAPS), the Child Supplement to thePanel Study of Income Dynamics (PSID; http://www.isr.umich.edu/src/child-development/publications.html ), and other studies could be used to better approximate thevariability in frequency and duration of outdoor play. These data could then be interpolated toapproximate time spent on CCA-treated play structures. We need more detailed information onthe relative time spent on the structure and in the substrate. These data might be obtained fromexisting or new observational studies. Activity patterns will very likely depend on the weather,as children may, for example, avoid sand that is too hot or too wet. Data on the correlationbetween As/Cr in the structure and its substrate will be needed to use this information.
The EPA is planning a new survey of existing playground structures and substrates. Theseshould be executed as one combined survey to look for correlations between existing structuresand their substrate. All possible covariates should be recorded in the hope that the “unexplainedvariation” in As and Cr levels could be reduced from what we have seen in studies to date.Covariates might include the following: evidence of construction debris (sawdust) in thesubstrate, nature of substrate (clay, sand, etc.), source of wood, age of structure, condition ofsurface (new, aged, worn to a shine), climate. Initially, the probabilistic modeling could rely onthe empirical distributions provided by Townsend, et al. and Stillwell data on soil and surfaceresidue concentrations. The Panel expects that the new survey data will be substituted when theybecome available. In its response to Question 11, the Panel recommends that data obtained instudies of CCA treated decks not be viewed as representative of dislodgeable residues on CCAtreated play structures or in the soils or substrates beneath these structures.
Panel members also identified the transfers of CCA residues from surfaces and soils as a majoruncertainty factor in the modeling of exposure. For example, it is possible that wet-weather playand play on damp structures bring increased risk of uptake, but there seems to be no informationother than wet-hand/dry-hand wipe studies. The Panel strongly recommends that the EPAexplore and evaluate alternatives (by comparison) to the hand loading transfer efficiency inmodeling the transfer of CCA metals from surfaces and soils to the child’s hands and other skinsurfaces. Specifically, the Panel recommends that the EPA conduct direct hand loadingmeasurements in samples of children (preferably) or adults (if human subjects concernsintervene). The best empirical data may actually be collected through sampling of children whoare actively involved in playing on CCA treated structures. The Panel also cautions thatempirical distributions of arsenic and chromium concentrations measured in these hand loadingstudies not be used as the concentration values for dermal exposure through non-hand skinsurfaces. One Panel member noted that probabilistic exposure models should allow occasionalevents like splinters and abraded skin to be included in the exposure pathway.
The Panel also noted that the better distributional data on children’s outdoor hand-to-mouthfrequency and the fraction of residue transfer are needed to improve the probabilistic modeling
34
of children’s exposure. Data from Dr. Natalie Freeman and her colleagues is expected in theSpring of 2002. Preliminary results will be presented at a conference in early November, 2001.
In its response to Question 8, some Panel members noted that there ultimately should be abiomonitoring study that does a reality check on the predictions of the model, perhaps arranginga sample of children to play in a CCA-free environment for several months and comparing somemeasure of arsenic uptake with the same measure in a matched sample using existing CCA-treated playgrounds. The suggestion was made to collect urine samples from children during thetime period after they had actively played on treated and untreated structures. A furthercomment was made that any analysis of arsenic in urine should examine the speciation of thearsenic. The topic of biomonitoring studies was discussed at length at the conclusion of thequestion responses. The reader is referred to the general summary of this discussion for asummary of the Panel’s recommendations on the need and design issues for biomonitoringstudies.
Question 9: OPP is assuming that a one-to-one relationship applies to the transfer ofresidues from wood to skin. The Panel is asked to address whether this is areasonable assumption, and if not, to provide guidance on other approaches.
RecommendationThe Panel does not recommend assuming that a one-to-one relationship applies to the transfer ofCCA chemical residues from wood to skin as proposed by the Agency. It is the Panel’s opinionthat the underlying conceptual model is questionable. Sufficient justification for a one-to-onerelationship was not provided and the limited available empirical data contradict the validity ofthe assumed one-to-one relationship.
The Panel strongly recommends that the Agency expand its planned joint study with CPSC tomeasure dislodgeable CCA chemicals from an appropriate sample of play structures, so as toobtain information of more direct value for exposure assessment. Ideally CCA chemicalloadings on the hands (and possibly other skin surfaces) of children using play structures wouldbe measured in addition to corresponding dislodgeable residues. At a minimum, some Panelistswould accept gathering of data sufficient to more adequately support implementation of OPP’scurrent conceptual model (e.g., matched adult volunteer hand and cloth wipe samples to betterestablish the relationship between these two measures as well as the constancy of anyrelationship as a function of surface area sampled).
The Panel was divided on an interim recommendation for the Agency while it awaits collectionof these additional data for the EPA/CPSC study. Some Panel members were willing to endorseinterim use of existing hand or fabric wipe data if described probabilistically. One Panelmember voiced strong opposition to any use of cloth wipe data until the Agency obtainedadditional information establishing the validity of the assumption of a constant loading as afunction of wiped surface area. At least one Panel member opposed use of a “transfer

35
efficiency” approach, preferring a “transfer factor” approach which cannot be implementedwithout further data collection.
DiscussionThe Panel was not given any explanation or justification of how OPP’s Residential SOP – withits assumption of a one-to-one transfer of pesticide residues from surface to skin – was derivedand whether there is general agreement on its principle and use. [Note: The SAP meeting atwhich the proposed residential SOPs were discussed was held in September of 1999. Thereference to April, 2000 is unclear. No source bearing that date was provided as backgroundmaterial or is cited in the background document.]
The Panel noted a number of factors that make an assessment of the appropriateness of a one-to-one transfer relationship difficult. Variables that might influence surface-to-skin transfer includethe nature of the initial CCA treatment, type of wood (softwood, hardwood, etc.), condition ofwood (age, moisture content, etc.), orientation of wood member (vertical or horizontal), natureof the surface residue (particle-bound, dissolved, crystalline, etc.), condition of skin (moist/dry,intact/broken, clean/dirty), and nature of contact (pressure, duration, static/dynamic, etc.). ThePanel discussed the extent to which both published peer reviewed literature and new informationpresented at the meeting provided empirical data for evaluating the assumed one-to-one transferof CCA chemicals from wood surfaces. Dr. Stillwell reported transfers of 30 to > 90% when CCA chemicals were applied to a glass surface using his cloth swipe technology. The higherlevels of transfer were observed when using damp cloth. Similarly high transfer factors werereported for a study (Rodes et al., 2001) with hand presses to remove household dust. This studyshowed that the magnitude of transfer was sensitive to surface material (stainless steel > vinyl >carpet) and hand moisture content (wet > damp > dry), although the applicability of this study todislodgeable CCA wood chemicals was unclear. The Panel was presented with an unpublishedstudy by Scientific Certification Systems (SCS, 2001) that compared loadings of hand swipesversus “KimWipe” tissue swipes of CCA wood. This study reported that transfer efficiencies fordamp adult hands were lower than those observed using dry “KimWipe” tissue swipes of CCAwood. Damp hand swipes were reported to be 7.5% of results obtained using “KimWipe” tissueswipes of new CCA wood surfaces that had not been treated with a sealant. The damp handswipes were 44% of “KimWipe” tissue swipes of aged CCA wood. The Panel noted that thesecomparisons reflect different surface areas swiped by hand (500 cm 2) versus tissue (100 cm2),and expressed concern over potential nonlinearity in loading as a function of surface area. Exponent presented an analysis of existing data indicating that hand swipes were on averageabout 25% of cloth/tissue wipes, but the Panel noted variability and uncertainties related to thesize of the surface area sampled, the type of contact and consistency across testers, and humidityof contact surface confounded the interpretation of results.
One Panel member stated that the Agency’s proposed model for computing hand loading ofCCA chemicals appeared capable of substantially underestimating and overestimating theamount of transfer, based on comparing predicted hand loadings from cloth and tissue swipe datawith observed hand loading data. The Panel member strongly urged the Agency to make use ofcurrent data with both hand and cloth swipe data (e.g., Lu and Fenske, 1999; California DHS,1987; SCS, 1998) to validate their conceptual model. It was emphasized that the assumption of
36
a constant transfer efficiency as a function of surface area wipe had not been established andindeed there were data to argue to the contrary.
It was noted by the Panel that all the transfer studies discussed use the hand only, and thetransfer may be different with different body surfaces that may contact the wood. The issue wasalso raised that there are no studies showing that transfer efficiency is constant across differentsurface area sizes or types. It should also be noted that Rodes (2000) found that skin loading ofdust particles reaches a maximum after typically 4-5 contacts. After that, there may bedislodging of particles from skin.
Addition of collection of hand wipe samples from children engaged in unstaged activity on playstructures has been recommended for the proposed CPSC-EPA field project. Wipe samplesshould include body parts other than hands, or non-hand surfaces should be removed from thedermal/dislodgeable residue scenario, as loading on body parts other than hands will probably bemuch lower than loading on hands. If the Agency intends to do these transfer evaluations, itneeds to adopt an appropriate standardized sampling protocol for surface collection since thatwill affect the outcome. Specifically, the Agency needs to include validation of the assumptionof constant transfer efficiency as a function of the sampled surface area.
In conclusion, the Panel agrees that a one-to-one relationship for transfer of residues from woodto skin is not justified at this time. The Panel also agrees on the need to collect empirical datathat realistically reflect the activities of children on CCA-treated wood play structures and otherpossible points of contact such as decks and walkways. If a probabilistic risk assessment is tobe conducted before new, relevant empirical data are generated, a wide range of possible transferefficiencies (TEs) should be used in a manner that reflect the uncertainty and variability in theavailable data.
Question 10: The Panel is asked to comment on whether the proposed Soil AdherenceFactor (AF) of 1.45 mg/cm2 for hand contact with commercial potting soil is a realisticvalue for use in estimating the transfer of residues from playground soil to skin in thisassessment.
RecommendationUse of an AF of 1.45 mg/cm 2 is not recommended. The proposed AF was derived from anunpublished study of very limited scope. EPA has funded subsequent research to derive morerepresentative values.
37
DiscussionThe proposed AF represents a fairly high hand level and is too high for whole-exposed-body-surface average. Soil loadings on non-hand body parts are typically lower than loadings onhands. The soon-to-be-released RAGS Part E provides an estimate of a surface-area-weightedaverage soil adherence factor for children. However that number reflects multiple activities onmultiple surface types. For purposes of evaluating use of CCA-treated wood in play structures,consideration of media found under play structures is required. Adherence factors relevant toloose media appear most appropriate. A possible alternative to the value recommended inRAGS Part E would be the children-playing data from Kissel et al., 1998. Those data werecollected from 8-12 year olds playing in a bed of sandy loam installed in a greenhouse. (Thedata can be downloaded from http://depts.washington.edu/jkspage/greenpost.html .) Most of thedata were collected under wet soil conditions. The wet soil data should be conservative for soiland may be adequate for buffer materials. No data describing adherence of buffering materials(bark, pea gravel, ground tires) to skin are known to exist.
The proposed dermal/soil scenario utilizes an absorption factor derived from 24-hourexperiments, implying that the exposure period is also 24 hours. Soil exposures occurintermittently and are interrupted by bathing events. (For instance it is unlikely that soil loadingsequivalent to those observed in the greenhouse experiments noted above would be maintainedfor 24 hours.) A probabilistic approach incorporating temporal description of both exposure andabsorption is preferable to the deterministic approach proposed by OPP. To the extent possible,variation with age, season, and geographical region should also be incorporated.
Question 11: OPP will need to calculate intermediate-term, and possibly long-termexposures in this assessment using available wood/soil residue data. ThePanel is asked to recommend a credible approach for selecting residue datavalues for use in OPP’s risk assessment, taking into consideration theinherent variability of the data sets. Please advise us on which values arebest for representing central tendency and high end exposures. Also, thePanel is asked to discuss the feasibility of combining data from individualdata sets.
RecommendationThe proposed USEPA/CPSC study of wood and soil residues associated with CCA-treatedplayground equipment provides a unique opportunity to generate a substantial data set on thevariability of residue levels for the playground scenario using a standardized sampling andanalytical methodology. This study should help to resolve uncertainty regarding the relativecontribution of true, inherent variability in residues versus variability due to differences inmethodology. It is critical, therefore, that the protocol be highly detailed regarding samplingmethods, locations, and frequencies and that the protocol be rigidly followed. Basic scientificcriteria for acceptance of the final data set should be laid out first and include: standardizedcollection methods, precision, accuracy, reproducibility, and other measures of QA/QC.

38
The Agency should not combine data with quite differing levels of precision andconservativeness, and use one set of data to drive other model considerations. The model cannotbe fully evaluated without real world (i.e., biomonitoring or soil consumption) data forcomparison, and that comparison cannot be made without a representation of both variability anduncertainty in model outputs.
DiscussionThere are few studies related to children’s playgrounds, and no study contains all of the data thatthe Panel considers critical to getting an accurate determination of what children are beingexposed to on playgrounds and on CCA-treated decks. The Panel believes that separate studiesshould be conducted (i.e., those looking at residue levels on playgrounds, and those examininghome decks and home playgrounds). The residue data should not be combined from decks andplaygrounds. Data from piers, walkways in wetlands, and similar structures do not fit theplayground scenario and should be ignored. The Panel recommends that the Agency expand theupcoming study to 25 playgrounds and 25 home decks/home playground combinations in eachof the three U.S. study areas (e.g., Northeast) in order to determine what children are beingexposed to. An extensive sampling regimen must be undertaken.
The critical data required for risk analyses should include the following information andsamples:
• Soils selected should mirror those most commonly found in each region;• History of the playground equipment (e.g., wood type, age, coatings/sealants etc.) must
be collected;• Representative soils should be collected in order to determine speciation and profiles of
As, including organic arsenic species and chromium in the soil profile at each site; soilsmust be collected from throughout the area below and adjacent to the playequipment/deck and analyzed separately to determine the primary sites of residue levelsthat are unique to each playground/deck studied; adequate control soils must be collectedfrom adjacent areas;
• Soils, including controls should be characterized thoroughly (e.g., clay, sand and siltcontent, pH, organic matter, moisture, etc.);
• Wood borings from sections of the playground equipment known to have frequentcontact by children at play (this can be accomplished by video) for residue analysesshould be collected to determine residue levels in wood and relate these to residue levelsthat have leached to the surface (the treatment process is not uniform due to knots,growth rings, etc., and there probably are “hot spots” of As and Cr) (this is related toQuestion 9);
• Wipes have been used as a means of determining dislodgeability, but there is no standardtechnique that provides reliability and uniformity to data collected from various surfaces;
• Consider collecting hand, arm and leg rinses from a representative sampling of childrenplaying on the equipment and tie these to biomonitoring analyses;
• Analyses of buffering materials from play areas including borders should be included inthe study (related to Question 14).
39
Each of the available data sets should be critically evaluated to determine whether they havebeen obtained 1) from a relevant structure and 2) using acceptable sampling and analysismethodologies.
The following studies present some representative soil data and can be used until additional dataare collected:
• Playground equipment: Riedel, D. et al. 1991. Residues of arsenic, chromium and copperon and near playground structures built of wood pressure-treated with “CCA” typepreservatives. Draft report to Health and Welfare Canada, 49 pp. (10 playgroundsexamined); Malcom Pirnie. 2001. Report results of soil sampling analysis. Chromatedcopper arsenate treated wood at playground structures. Draft appendices. Prepared forAm. Chem. Council. (4 playgrounds in U.S.)
• Decks: Stillwell, D. E. and K. D. Gorny. 1997. Contamination of soil with copper,chromium and arsenic under decks built from pressure treated wood. Bull. Environ.Contam. Toxicol. 58:22-29 (7 decks); Scientific Certification Systems. 2000. Study ofarsenic leaching into soils underneath CCA treated wood decks. Prepared for Osmose,Inc., 47 pp. (10 decks 5-5 to 10 yr and 5-10 to 15 yr old); Townsend, T., H. Solo-Gabriele. 2001. Metal concentrations in soils below decks made of CCA-treated wood .FL Center for Solid and Hazardous Waste Management, Gainesville, FL, 88 pp. (9structures in FL).
The Agency asked for advice on values for best representing central tendency and high-endexposures. The best measure of the central tendency depends on the shape of the distribution.One Panel Member noted that it has been suggested (Crump, 1998) that the arithmetic mean, asopposed to the geometric mean, is the preferred measure of central tendency for exposure whenthe concern is for health effects. The best approach for estimating central tendency and high-endexposures and for dealing substantively with the process would be a two-stage probabilisticanalysis that evaluates both variability and uncertainty. The use of distributional analyses forCCA exposures should rely on firmly established and transparent criteria that are common to allprobabilistic analyses. Many of the same principles that have been incorporated into theassessments of food and residential exposure guidance, for example, should be incorporated intothe CCA assessments. In order to do this it is important to develop clear and consistent criteriafor both the modeling process and methods for dealing with model uncertainty, modelvariability, and input uncertainty. All three of these must be addressed systematicallythroughout the process.
This three-point framework for describing model variability and uncertainty is based on thepoints outlined in Cullen and Frey (1999), which is a useful guidebook and starting point foraddressing the issues raised by this question. Once these principles are clearly articulated andinculcated, decisions based on application of this framework should be easier to justify.
Given the multiple models, data sets, and analyses involved in developing an assessment ofCCA, probabilistic methods are the preferred approach for estimating exposures and risks. Thatsaid, the use of uniform distributions, which are generally used in cases where data are sparse orinconsistent, are better than point estimates. Fitted distributions should be used when there is
40
some underlying rationale, such as processes driven by physical parameters where some dataexist or in cases where there are fairly good data, such as soil consumption rates. There areseveral options for combining these data. When appropriate, multiple data sets could simply becombined into a single, “global” data set that could be used as input for a probabilistic exposureassessment. However, this simple approach ignores the “inadvertent” weighting associated withcombining data from experiments with different numbers of samples. Appropriate weightingfactors could be applied to each data set to correct for this effect.
Alternatively, weightings could be applied on the basis of a judgment concerning the“representative nature” of a particular data set. The specifics of the approach for combiningthese data should be determined by a qualified statistician in conjunction with scientists familiarwith the data. A similar analysis has previously been performed to obtain a “global” distributionfor the hair:blood partition coefficient for methylmercury (Clewell et al. 1999).
It is inevitable that dissimilar data will be combined once exposures are aggregated, butuncertainty and variability should be distinguished. The Agency should not combine data withquite differing levels of precision and conservativeness, and use one set of data to drive othermodel considerations. The model cannot be fully evaluated without real world (i.e.,biomonitoring or soil consumption) data for comparison, and that comparison cannot be madewithout a representation of both variability and uncertainty in model outputs. In performing a probabilistic analysis the Panel suggests using intervals (i.e., uniformdistributions) rather than point estimates when data are sparse/uncertain. This approach reducesthe burden of data collection and parameterization and, although it is simpler than second-orderMonte Carlo simulations that formally separate variability from uncertainty, it still distinguishesthe two. Using intervals in a Monte Carlo simulation avoids creating a mix of partiallyprobabilistic and partially deterministic estimates.
Question 12: Does the Panel have any recommendations for combining the four scenarios(oral/wood, dermal/wood, oral/soil, dermal/soil) such that a realisticaggregate of these exposure routes may be estimated?
The Panel offers the following recommendations:• The Panel encourages the Agency to aggregate exposure estimates across all potential
sources. This should occur in a way that makes the contribution of various sources ofexposure transparent and tracks separate species of arsenic and chromium. Although dataat present are limited, it is possible that the different species of arsenic encountered fromdistinct exposure scenarios may differ with respect to their hazard. For example, arsenicin the form of a complex of copper chromated arsenate ingested from direct contact withfreshly treated wood might be metabolized and excreted differently than arsenate leachedfrom weathered wood and ingested incidentally in soil.
• The suggested scenarios (oral/wood, dermal/wood, oral/soil, dermal/soil) capture theexposures that may occur on playscapes and decks. Inhalation exposure may be a route
41
that should be included, however at this point in time, data are insufficient to estimate thedistribution of possible inhalation exposures. Refer to the response to question 13 forfurther analysis.
• However, in terms of the aggregate exposure assessment, the proposed scenarios do notcapture sources of exposure that appear to be significant. The Panel suggests that theAgency broaden its inquiry to consider the diversity of possible exposures to arsenic,chromium and copper. Some Panel members felt that the Agency should expand itsformal analyses of exposure to include other media under the jurisdiction of other EPAoffices—drinking water, air, and waste—to avoid a fragmented and incremental approachto risk assessment and management of arsenic, chromium and copper species.
• Probabilistic methods should be used to estimate exposure and risk. This demandsselection of best available data sets to construct distributions. This must be done withconsiderable care. The EWG approach seems conceptually reasonable; however, theirmethod combines point estimates with distributions, and this may introduce bias into theestimates. The Lifeline method is especially well adapted to aggregate exposures acrossdiverse routes, while preserving estimates at the level of the individual. The Agencyshould be encouraged to develop this model in the immediate future while closing datagaps.
• Uncertainty should be carefully characterized, distributions characterized, and clearcriteria applied to judge the quality of available data for each parameter included in theassessment. The Agency should further develop Table 4 in the EPA support documentChildren’s Exposure to CCA Treated Wood Playground Equipment and CCAContaminated Soil. Table 8 in the Gradient Corporation submission provides a similarmodel that attempts to identify ranges of factors potentially affecting exposure, tracks thesources of data, and provides a preliminary characterization of uncertainty.
• Regarding uncertainty and default assumptions the Agency should confront twoquestions directly: When are data of sufficient quality to include in a modeling effort? What should be done until data are adequate? The SAP provided the Agency with clearcriteria to judge data quality in 1999, and these were recognized in support documentsprovided to this panel. Under conditions of moderate or high uncertainty (absence ofsufficient data to fully capture the variability in exposure from these sources), theAgency should develop clear default assumptions to be employed until sufficient data aresecured. These assumptions should err on the side of overestimation of exposure, orfactors that contribute to exposure, and reduced if and when credible data are presented.
• The Agency should develop methods that aggregate exposure and risk estimates forindividuals. These may then be aggregated by various demographic characteristics—age,income, ethnicity, and location (north/south; urban/rural), or specific behavioralcharacteristics.
42
• The literature on childhood behavior and activity patterns that may be associated withCCA exposures is quite young. It provides only a limited basis for understanding theassociations between behavior and exposure. The Panel recommends that the Agencyundertake studies of childhood behavior and activity patterns to clarify these possibleassociations, as children move through their daily life. These studies would be useful inEPA assessment of exposures to many different hazardous substances. The Agency’sefforts in developing the Exposure Factors Handbook and the more recent Children’sExposure Factors Handbook are very positive and important contributions that supportdata based, behavioral scenario-building.
• The Panel anticipates considerable year-to-year variability in exposure among childrenages 1-6. Toddlers between 1 and 2 years of age play, behave, eat and dress verydifferently than 6 year olds, and these are likely to affect contact with contaminatedmedia.
• Residential, educational, day-care, recreational, and occupational environments all offerthe possibility of childhood exposures to CCA. Specific locations where CCA is incommon use include decks, playscapes, railings, docks, piers, pilings, fencing, andexposed untreated interiors of structures, especially those close to the ground such assills. Picnic tables, mulch, and contact with wood scraps, smoke from intentional andunintentional fires, and ashes from burned construction debris could all be sources ofexposure.
• CCA-treated wood is increasingly being used for interior construction, and if unfinishedand left exposed, may be an additional source of childhood exposure. It would be helpfulfor the Agency to estimate the extent of these uses.
• The Panel encourages the Agency to consider possible high exposure scenarios definedby overlapping risk factors. For example, a toddler living in the Southwest, mayexperience high drinking water concentrations of arsenic. At the same time the warmclimate encourages extended periods of outdoor recreation. If this child is enrolled in aday care facility with decks and play structures made from CCA-treated wood, theaggregate exposure may be high. The identification of populations that are bothphysiologically susceptible and highly exposed would provide a logical basis for strategicrisk management.

43
Question 13: Can the Panel comment on whether OPP should conduct a child playgroundinhalation exposure assessment, taking into consideration the hazard profilefor chromium (VI) as an irritant to mucous membranes? If so, can the Panelcomment on whether the endpoint described above is appropriate forassessing the risk to children from such an exposure?
RecommendationThe Panel notes that both the trivalent and hexavalent forms of chromium are of concern in theinhalation route of exposure and that arsenic should also be considered in the inhalation route ofexposure.
However, the Panel agrees that calculations of probable exposure concentrations suggest that theAgency should not consider the inhalation route of exposure to inhaled metals in their riskassessment. The SAP strongly suggests, however, that exposure concentrations be monitored viapersonal and area sampling to validate such a conclusion.
DiscussionThe contribution of inhaled metals to the risk for children using playground equipmentconstructed of CCA wood is dependent on the airborne level of metals. Unfortunately, there areno data on the ambient concentrations of metals in the vicinity of CCA-wood play structures.There is a need for determination of the range of background ambient exposure levels tochromium and arsenic and to compare these values to potential exposure levels for a 15-kg childduring a 1-3 hours of play. Soil in the immediate vicinity of play structures is frequently disturbed during child play andinhalable particles can be resuspended and re-entrained in air. Although the question posed tothe SAP referred to the volatility of the inhaled metals, the primary concern is a resuspended dirtscenario, and not the volatility of chromium and arsenic, which should be considered. Thequestions posed to the Panel also referred to respirable particles. Most mechanically generatedparticles are very large. Thus, inhalable (particles which can be inhaled into the nasal or oralpassages; generally less than 100 :m in aerodynamic size) and not respirable (particles whichreach the gas exchange region of the lung; generally less than 3 or 4 :m) particles are of concernin terms of the nasal effects of chromium. These particles deposit in the nasal cavity, are clearedtowards the back of the throat, and swallowed, thus ultimately resulting in an oral delivery.
It is likely that the assumption of 100% hexavalent chromium is an overestimate of its proportionin the soil and dislodgeable residue. In addition, there are very sparse published data onhexavalent vs. trivalent chromium in CCA-treated wood and none (except for what waspresented by Drs. Stillwell and Townsend) for soil. Such a data set regarding the valence stateof chromium in soil needs to be developed.
Because no data have been developed for airborne metals in the vicinity of playgrounds builtwith CCA-treated wood, one must use surrogate values to calculate a potential risk. The Panelmembers introduced three arguments against the need for an inhalation examination of thepotential effects of playground exposure to chromium and arsenic. First, workers are exposed to
44
much higher concentrations of CCA-treated wood dust in occupational settings (Decker et al.,2001) and the occupational exposure limit for chromium is not exceeded. It must be considered,of course, that an occupational exposure limit (OEL) is set for a healthy adult worker over an 8-hour period.
Second, using the NOAEL given in the EPA document for adverse nasal effects in workers, onecan calculate relative inhalable concentrations of chromium for a child. Using a roughassumption of the volume of air inhaled by a child, the level of exposure to inhalable chromiumis insignificant:
• Using the following rough assumptions, one can calculate that a 15 kg child inhalesapproximately 5.4 m 3 in a 24 hour period:
0.25 l/breath x 15 breaths/min x 60 min/hr x 24 hour/day = 5.4 m 3.
• Assumption of a NOAEL of 2.4 x 10 -4 mg/m3 (noted in the EPA document) yields:
0.086 :g/kg-day for 24 hr (0.000086 mg/kg-day for 24 hr exposure) for a 15 kg childor
0.0036 :g/kg-day for 1hr (i.e., 0.000036 mg/kg-day for 1 hour exposure).
Therefore, in comparison to the LOAEL of 0.05 mg/kg-day (or 50 :g/kg-day) considered inQuestion 1, this exposure level is below that of concern.
Of course, an assumption of 2.4 x 10 -4 mg/m3 as a NOAEL for hexavalent chromium could behigh, but as noted previously, it is unknown what the exposure levels are for airborne particles inplayground areas.
Third, one can calculate a worst-case scenario for inhaled resuspended soil and compare it to thecentral tendency value for the oral ingestion of soil. If one uses a central tendency value of 100mg soil ingested/day for a child (as suggested by EPA), this can be compared with the potentialconcentration of airborne soil particles which would need to be inhaled to equal this amount ofsoil delivered via the oral route. Using a rough assumption of 5 m 3 for the volume of air inhaledin a day suggests that a child would have to be exposed to an airborne concentration of 20mg/m3.
100 mg/day / 5 m3/day = 20 mg/m3
This value of 20 mg/m 3 for inhalable particles is exceedingly high and is very unlikely in aplayground setting. It was noted by Panel members that the soil, sand, or buffering materialbelow the playground structure may influence the degree of resuspension of dislodgeable CCAor soil.
Thus, it appears to be unlikely that an inhalation pathway needs to be considered in the EPA riskassessment of the use of CCA-treated wood in playground settings. However, the Panel feels it

45
would be prudent to develop a data set for airborne/reentrained soil particles to validate thisrecommendation. It is suggested that personal or area monitoring be added to the proposedEPA-CPSC playground study. In addition, this data set should include airborne arsenic as thereis no justification to exclude it in an inhalable CCA-treated wood risk assessment.
Question 14: Data on the effectiveness of reducing exposure by using buffering materialsare limited. Does the Panel have recommendations as to whether additionalstudies to obtain this information are warranted? Does the Panel havesuggestions on how OPP can best evaluate child exposures attributed tocontact with CCA-contaminated buffering materials?
RecommendationThe consensus of the Panel is that additional studies are warranted to obtain information neededto assess the exposures associated with using buffering materials.
Buffering materials do not appear to provide a means to reduce exposures to CCA leached fromplay structures. Rather, buffering materials can present important risk scenarios that differ fromthe four scenarios currently proposed for analysis by the Agency. These additional scenariosinclude: 1) exposure to buffer materials that become contaminated with metals from CCAleached from play structures and 2) exposure to buffer materials that contain CCA because theyconsist of recycled construction/demolition debris which contains CCA-treated wood.
Exposure to buffer materials that become contaminated with metals from CCA needs to beexamined. This effort should be aided by the generation of data describing the amount andnature of exposure in young children who play on or with these materials. It may also bepossible to generate bounding estimates of exposure from these materials for the purpose ofscreening the relative importance of this scenario compared to other play structure-relatedscenarios.
Exposure to buffer materials that contain CCA-bearing mulch will likely result in a sufficienthazard potential to warrant a modification of the recycling practices that lead to the introductionof this mulch into children's play environments.
DiscussionBuffering materials refer to those materials that are placed below a play set to minimize injury inthe event of a fall. Examples of buffering materials include sand, pea gravel, wood mulch, andtire chips.
There are two sets of issues imbedded in the concern over buffering materials. The first is thepotential that the materials can become contaminated due to their close proximity and contactwith CCA-treated wood play structures as CCA leached from the play structures coats thebuffers. The second issue is the potential presence of CCA-containing wood in constructiondebris that is recycled into wood mulch used as buffering material. Both of these issues are of

46
particular concern because children may be attracted to the buffering materials due to theirunusual textures, colors, and ready availability. Therefore, where there is CCA contamination ofbuffering materials, exposure potential to young children may be particularly high.
Regarding buffer materials that become contaminated by CCA leached from the play structure,the following assumptions can be used to help conceptualize the issue:
• Leached CCA forms a surface coating that is dislodgeable and thus available to childrenwho handle these materials. This implies that the proper way to analyze these materialsfor the purposes of risk assessment is to find out how much dislodgeable residue ispresent on the buffer material surfaces in ug/cm2 surface area as has been done with playstructure surfaces, rather than analyzing the entire material to get a ppm readout ofarsenic or chromium on a mass unit basis. Expressing the contamination as metalconcentration per surface area has the advantage of direct applicability to risk assessmentequations since children can be modeled to take up some or all of the dislodgeableresidue through mouthing behavior (putting entire chip or stone in mouth for briefperiod) or via chip-to-hand transfer followed by hand-to-mouth behavior. However, it isunlikely that children will actually ingest an entire chip and so the ppm typemeasurement would be less relevant. The Panel noted that the Alachua County, Floridadata presented to the Panel, while limited in number of samples, suggested similar ppmcontamination of buffer material (shredded rubber in this case) as neighboring soil. However, since buffers will not be ingested on a mg/day basis, the exposure implicationsof ppm in soil and ppm in buffer are not the same.
The recommendation that comes from these considerations is that buffering materials that arepassive recipients of CCA leached from play structures should be chemically analyzed byfinding out how much dislodgeable metal is available per square centimeter surface area. Asuggestion for how to conduct this analysis is to put a representative number of chips/stones intodilute acid solution to extract the metals, analyze the metal content in the extract (e.g., ICP) andthen calculate the dislodgeable residue by dividing the total metal extracted by the surface areaof the chips/stones placed into the dilute acid solution. This would result in an estimate of themaximum metal loading concentration that children may dislodge onto hands or extract in theirmouth.
The Panel is not aware of any survey or videotaping data of children’s behaviors with respect tobuffer materials. Therefore, exposure assessment in this area will be uncertain and datacollection is important. The most direct and empirical form of data collection may be thesampling of children’s hands and other exposed dermal surfaces at the end of a play event to findout how much of the dislodgeable material (measured by analyzing the buffer materials asdescribed above, from various portions of the playground) is transferred onto children’s hands. This may allow for an estimation of buffer-to-hand (or skin) transfer efficiency. Given that thistransfer will be highly age and behavior dependent (types of interactions with the buffermaterials and location on playground where child interacts with buffer), there will be muchvariability in the data. Therefore, a sizable dataset would be needed to obtain a representativedistribution of dermal loading per play event. The value of such distributions obtained in this
47
way is that they could be suitable inputs to probabilistic (Monte Carlo style) exposurecalculations.
Another option for data collection pertinent to this exposure scenario is obtaining observational(e.g., videotape) data on children’s play activities to compile information on the frequency ofcontact with the buffer materials and classification of contact into categories such as superficial(brief touches) vs. intimate (handling/playing with the chips) vs. mouthing of chips. Thisinformation could then be combined with study data on how much CCA is dislodged from thechips from superficial vs. intimate vs. mouthing of chips in studies involving children or adultvolunteers performing these types of activities. Of course, the mouthing of chips would not beperformed but would have to be simulated in some way or assumptions used regarding percentextraction of residues from chip/stone residence for brief periods in the mouth.
Actual empirical data are most desirable for input into this or any other human health riskassessment. However, to evaluate the need to collect field data and perform a refined analysisfor this particular scenario, the Agency may want to consider performing bounding, screeninglevel calculations. Given that without the types of empirical data described above there will begreater uncertainty in exposure estimates, the defaults used should necessarily be high-endbounding assumptions. Such assumptions may look like the following:
• The dislodgeable residue loading on wood/rubber/gravel buffers is equal to thedislodgeable residue on the wood play structure. This may tend to be a reasonable upperbound on the relationship between wood structure to recipient buffer material loadingsince the buffer material will not only receive leached CCA but will also have suchresidues washed off in rain events, and so some equilibrium (probably no higher thanwhat is on the donor wood) would be established on the buffer materials.
• The chip-to-hand transfer efficiency is 1:1, that is, whatever surface loading that isassumed to be on the chips will also exist on the hands. This assumption implies intimatecontact with the chips such that the hands would be in equilibrium with the chips. Lowerlevels of loading are also possible from less intimate contact but would not represent anupper bound default. Higher levels of loading in which the hand actually accumulatesdislodgeable residue might also theoretically occur, but empirical data would be neededto find out the circumstances under which this might be possible.
• Mouthing of chips/gravel would extract all the dislodgeable residue from that buffermaterial; the amount of residue available is based upon the surface area of the chip(empirical measurements for different buffering materials should be used) and theloading on the chip (as discussed above).
• The Panel did not have an opportunity to explore what might be reasonable boundingassumptions on frequency of mouthing behavior, time spent playing in chips relative totime spent on play structure itself, hand-to-mouth frequency, etc. (This might be basedupon the same videotaping studies used for the hand-to-mouth assumptions for childrenon play structures.)

48
In summary, the Panel recommends that empirical data be gathered with respect to children’sexposures to dislodgeable residues of CCA from buffer materials via actual children’s playstudies or from observational data on children’s play behavior combined with data describing therange of chip-to-hand transfer for different degrees of contact. An additional study designmentioned during Panel deliberations was to have a single playscape underlain with differingbuffering materials including no buffer (native soil) around different portions of the playstructure. After a period of environmental loading and equilibration of buffer material, thenchildren could be instructed to play on one of the buffer types to allow a comparison of exposurepotential across the range of different materials.
Whatever study data are generated, they should be of sufficient diversity and robustness tocharacterize the distribution of behaviors and residue transfer efficiencies. However, ifappropriate empirical datasets are not available for probabilistic assessments, EPA may considerthe option of screening level deterministic assessments using reasonable upper bound defaultsbased upon available empirical data.
The possibility that these buffers might lead to a decrease in exposure to CCA relative to nativesoils does not look promising, based upon the evidence that leached CCA can lead to elevatedarsenic concentrations near CCA-treated wood structures (Alachua County data). However,additional studies along these lines or as described above may better answer this question.
Unfortunately, when construction debris is recycled into mulch, a percentage of the wood maycontain CCA. Data are available (Tolaymat et al., 2000, Townsend et al. 2001, and Solo-Gabriele 1998, 1999) that indicate that CCA-treated wood is found in mulches produced fromconstruction and demolition facilities within Florida. During 1996, the mulch from 12 differentconstruction and demolition facilities was found to contain 6% CCA-treated wood by weight, onaverage. A study at 3 facilities during 1999 found that concentrations of CCA-treated wood inmulch varied between 9 and 30%. Mulch samples collected from retail establishments showedevidence of CCA as observed by arsenic leaching tests.
If CCA-wood bearing mulches are used as buffering material under play structures, then therecould a higher exposure potential from children’s hand contact and mouthing of CCA woodmulch. As the wood degrades into smaller pieces and dust, there might be a higher opportunityfor bulk ingestion of material containing high concentrations of metals both from directmouthing of small objects and from hand to mouth transfer. Additionally, the dust generatedfrom playing with the mulch might become an inhalation risk issue, particularly with respect tothe Cr(VI) that may be present in the dust particles.
Rather than conduct a risk assessment on this portion of the scenario, the Panel recommendssurvey, intervention, and education activities on the part of the Agency, perhaps coordinatedwith other agencies, to prevent this exposure pathway to the extent possible. The survey wouldbe of the wood mulch marketplace to determine to what degree CCA-treated wood enters theplayscape environment, including practices at the municipal and homeowner/residential levels. This survey information should be followed with focused intervention and education/warnings to
49
prevent or modify the practices that lead to this type of wood entering children’s playenvironments.
Question 15: The Panel is asked to comment as to whether stains, sealants and othercoating materials should be recommended as a mitigation measure to reduce exposure toarsenic and chromium compounds from CCA treated wood. If so, can the Panel commenton the most appropriate way for the Agency to recommend effective coating materialswhen the current data on long-term performance are limited and sometimes inconsistent,and should the Agency specify a time interval for the re-application of these selectedcoating materials? Can the Panel make recommendations for additional studies?
RecommendationThe Panel offers the following conclusions and recommendations:
• The Panel recommends that the EPA inform the public of the ability of certain coatingsto substantially reduce leachable and dislodgeable CCA chemicals and thus reducepotential exposure to arsenic and chromium. While the Panel makes recommendationsbelow regarding the need for additional studies in this area, it feels that the currentevidence is sufficient to begin advising the public about the use of coatings now.
• The weight-of-evidence from available studies indicates that certain coatings cansubstantially reduce dislodgeable and leachable CCA chemicals.
• Reductions of 70 to 95% in dislodgeable arsenic were seen in all studies that subjectedCCA wood to natural weathering.
• There is no evidence that water repellents added directly to the CCA treatment solutionare effective in reducing leachable/dislodgeable CCA chemicals;
• Current data are not adequate for identifying a particular coating as being clearly superioror inferior to reducing leachable/dislodgeable CCA chemicals.
• Confidence is highest for polyurethane as this coating has been shown to result insubstantial 70 to >95% reduction in dislodgeable arsenic in a well controlled field study,a “real-world” application allowing for effects of use, and a short-term controlledlaboratory study.
• Current data support a treatment frequency of once per year, although for some productsthis may be too frequent (e.g., possibly polyurethane where one study noted up to 95%reduction in dislodgeable arsenic out to 2 years). This is an area in need of additionalstudy.
• More studies are needed to evaluate the performance / efficacy of different types andbrands of coatings.
50
DiscussionImportant definitions when evaluating coating data include the differences between treated anduntreated wood. Treated wood typically implies that the wood is CCA treated. Untreated woodrefers to virgin wood without the addition of CCA wood treatment chemicals. Both treated anduntreated wood can be either coated or uncoated. Coatings or sealants refer to paints, stains,varnishes, and polyurethane resins applied to wood surfaces. For years the manufacturers ofCCA wood have recommended the use of surface coatings to reduce the checking and crackingof wood resulting from effects of weather, such as rain, temperature, humidity, solar radiation (http://www.preservedwood.com/faqs/faqs.html ). Intuitively, reductions in leachable anddislodgeable CCA chemicals should be expected to the extent that coatings establish a barrier tomoisture contacting and entering wood and as a barrier to direct hand contact with the woodsurface. Likewise, the surface area available for leaching, including access to deeper woodlayers which are less depleted of CCA chemicals, should be reduced given that such coatingsreduce checking and cracking of CCA wood.
Evaluation of Coating DataSealant studies evaluated were separated into three groups: Studies that evaluated the impacts ofcoatings on dislodgeable arsenic, impacts on leaching of arsenic, and related studies.
Studies available to the Panel that evaluated the impact of coatings on dislodgeable arsenicincluded: Stilwell 1998, Scientific Certification Systems 1998, California Department of HealthServices 1987, and the Consumer Products Safety Commission 1990. Stilwell, 1998, evaluatedboards with four different coatings (polyurethane, latex/acrylic, oil stain, and spar varnish). Hisresults indicate that these coatings remained very effective in reducing dislodgeable CCAchemicals for at least one year after they are applied. This study did not evaluate theperformance of sealants beyond one year. The boards were subjected to natural weatheringprocesses but the study did not include the effects of wear from human use. Also, theexperimental design would have benefited with the inclusion of a temporal control.
The SCS 1998 study evaluated the impacts of two post-treatment coatings (Superset stain, 3Mclear sealer/polyurethane -) and one coating incorporated into the CCA-treatment process(Osmose water repellent). The other two coatings were applied after the wood was CCA-treated. The SCS study was a laboratory-based study using a series of boards. It is assumed thatthe measurements of the dislodgeable arsenic were taken shortly after the coatings were applied. Wear and tear from human use was not simulated, nor was rainfall or other weather relatedeffects taken into consideration. Results from this study were variable indicating that the 3Mpolyurethane sealant was effective at reducing dislodgeable arsenic whereas the Superdec stainand the Osmoses water repellent were not effective. Results from this work suggest that there isvariability in the reduction of dislodgeable arsenic by different types and brands of coatings.
The California Department of Health Services 1987 study was the only study that evaluatedstructures (a fishing pier treated with polyurethane and a playset treated with an oil-based stain)that were in current use and therefore included the effects of wear and tear upon the efficacy ofthe coatings. Results of this study suggest that coatings provide a considerable reduction in theamount of dislodgeable arsenic and, in the case of polyurethane, out to two years post-treatment.
51
One drawback of the study is the lack of an uncoated temporal control. However, the decreasein dislodgeable arsenic was very large that even in the absence of such a control, the data areconsidered to be meaningful.
The last study, sponsored by the Consumer Products Safety Commission in 1990, evaluated anoil-based stain and a water repellent in a laboratory setting. The results of this study werevariable which is reflected in the high standard deviation observed in the uncoated CCA-treatedcontrol. This variability confounds the ability to interpret the data and therefore the results areconsidered inconclusive.
Only one study, Cooper et al. 1997, evaluated the ability of coatings to reduce the leachability ofarsenic from CCA-treated wood. This study evaluated the ability of Thompson’s water seal(applied after CCA treatment) to reduce leaching of CCA from fences. The efficacy of waterrepellents applied as part of the CCA treatment chemical were evaluated for fences and decks. Results show that Thompson’s water seal (applied after CCA treatment) significantly reducedthe quantity of arsenic for a period of two years after the application of the water seal. The waterrepellents applied as part of the CCA treatment chemical were not effective at reducingleachable arsenic concentrations.
Related studies cited as part of the EPA review include Riedel et al. 1991 and Lebow and Evans,1999. Riedel et al., 1991, focused on collecting dislodgeable arsenic data from 10 CCA-treatedplaysets. Some playsets were coated with sealants and some were uncoated. This study is usefulin providing a range of dislodgeable arsenic variables from playsets. However, there are manyconfounding factors when comparing the coated set of playsets with the uncoated sets. Theseconfounding factors include differences in retention levels between one playset and another,wear and tear, locations sampled, and absence of any information on time elapsed from when acoating was last applied. Given these confounding factors it is difficult to conclude whether ornot coatings reduce the quantities of dislodgeable arsenic.
Lebow and Evans et al., 1999, evaluated the use of an innovative pre-stain (water soluble acrylicpolymer with an iron oxide) which was applied prior to treatment with CCA. Results from thisstudy found that the pre-stain was able to reduce the release of arsenic by 25 to 30%. This was alaboratory study that simulated natural rainfall over a 17-week period.

52
Conclusions from studiesTable 1 summarizes design features of the various studies and results in terms of percentreduction in dislodgeable or leachable arsenic. Results of these studies as a whole support thatsurface coatings (applied after CCA treatment) are effective at reducing the quantities ofdislodgeable and leachable arsenic. Reductions of 70 to 90% in dislodgeable arsenic wereobserved across the studies as CCA-treated wood was subjected to natural weathering. Conflicting results were obtained from the laboratory studies. It is noted that no studies lookedat both dislodgeable and leachable arsenic fractions. The current data are not sufficient toidentify a superior coating. The evidence is strongest for polyurethane, based on results fromStilwell 1998, California DHS 1987, and SCS 1998. Future experiments should evaluate theefficacy of different types of brands of coatings on both the quantities of dislodgeable andleachable arsenic. Such studies should include a validated and consistent measure ofdislodgeable (e.g., Stilwell, 1998) and leachable CCA chemicals and should evaluateperformance over at least a 2-year and preferably a 3-year period. Furthermore, studies shouldalso focus on the durability of the coatings when subjected to wear and tear and include naturalweathering conditions.
The Panel recommends that the Agency inform the public of the potential benefits associatedwith coatings in reducing leachable and dislodgeable CCA chemicals. Polyurethane should berecommended for the time being. It should be also mentioned that other coatings show somepromise including acrylic/latex, oil-based stains, and some consumer applied water sealants,although data are more limited. Furthermore, recommendations should mention that somecoatings will change the surface properties of the wood making it necessary for additionaltraction on floors and deck portions of playsets. It is recommended that the decks be sealed atleast once per year. More definitive information concerning the use of coatings should beprovided to the public once additional data are available.
One Panel member recommended that the coating applied be clearly visible so that the effects ofwear can be easily observed. The Panel member indicated this is especially important in light ofthe fact that there are limited data on the durability of the coatings against wear. In areas ofheavy wear, the coating should be applied more frequently than once per year if the coating isvisibly removed from these high-wear areas.
Another Panel member, who supported the use of coatings, voiced the concern that the CCAchemical may accumulate below the coatings which if pealed and ingested could result in anelevated risk to children. This comment emphasizes the need to periodically inspect the coatingsto minimize this potential exposure route.
It is important to keep in mind that none of the studies cited in this review have been publishedin peer-reviewed journals. The strength of the overall conclusions made through this reviewrelies on the relative consistency between the results observed between some studies.
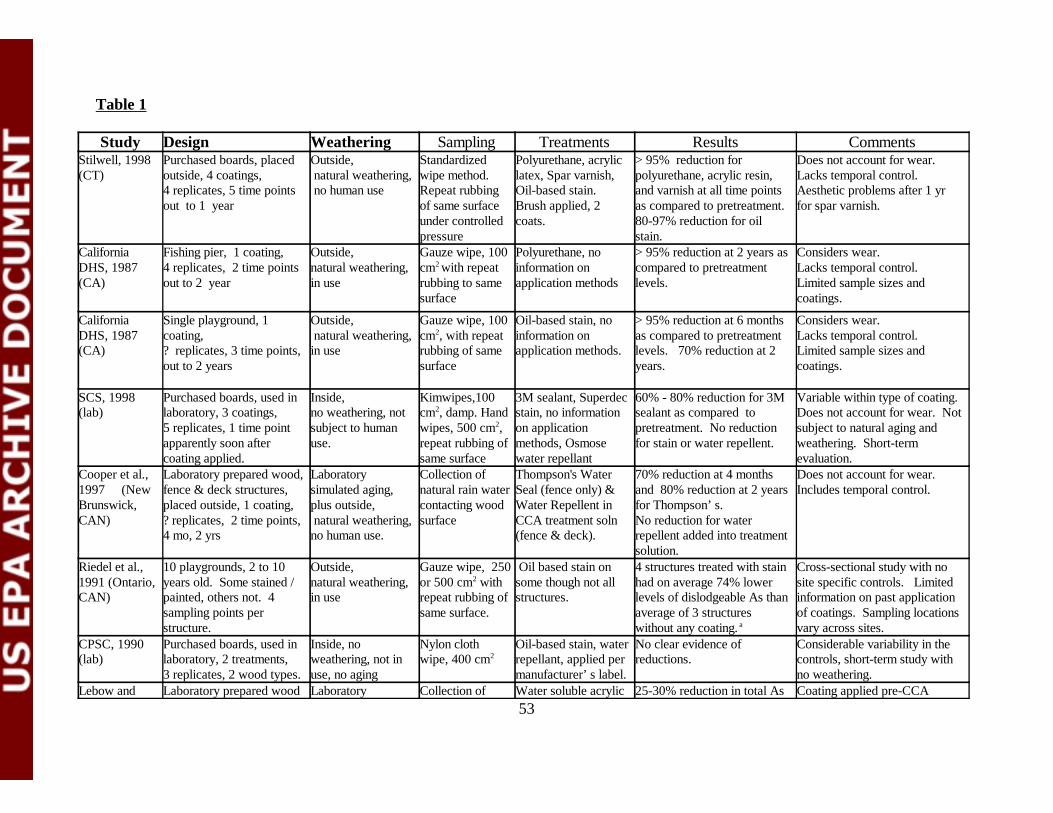
53
Table 1
Study Design Weathering Sampling Treatments Results CommentsStilwell, 1998(CT)
Purchased boards, placedoutside, 4 coatings, 4 replicates, 5 time pointsout to 1 year
Outside, natural weathering, no human use
Standardizedwipe method.Repeat rubbingof same surfaceunder controlledpressure
Polyurethane, acryliclatex, Spar varnish,Oil-based stain. Brush applied, 2coats.
> 95% reduction forpolyurethane, acrylic resin,and varnish at all time pointsas compared to pretreatment. 80-97% reduction for oilstain.
Does not account for wear. Lacks temporal control.Aesthetic problems after 1 yrfor spar varnish.
CaliforniaDHS, 1987(CA)
Fishing pier, 1 coating, 4 replicates, 2 time points out to 2 year
Outside, natural weathering, in use
Gauze wipe, 100cm2 with repeatrubbing to samesurface
Polyurethane, noinformation onapplication methods
> 95% reduction at 2 years ascompared to pretreatmentlevels.
Considers wear. Lacks temporal control.Limited sample sizes andcoatings.
CaliforniaDHS, 1987(CA)
Single playground, 1coating, ? replicates, 3 time points,out to 2 years
Outside, natural weathering, in use
Gauze wipe, 100cm2, with repeatrubbing of samesurface
Oil-based stain, noinformation onapplication methods.
> 95% reduction at 6 monthsas compared to pretreatmentlevels. 70% reduction at 2years.
Considers wear. Lacks temporal control.Limited sample sizes andcoatings.
SCS, 1998(lab)
Purchased boards, used inlaboratory, 3 coatings,5 replicates, 1 time pointapparently soon aftercoating applied.
Inside, no weathering, notsubject to humanuse.
Kimwipes,100cm2, damp. Handwipes, 500 cm2,repeat rubbing ofsame surface
3M sealant, Superdecstain, no informationon applicationmethods, Osmosewater repellant
60% - 80% reduction for 3Msealant as compared topretreatment. No reductionfor stain or water repellent.
Variable within type of coating.Does not account for wear. Notsubject to natural aging andweathering. Short-termevaluation.
Cooper et al.,1997 (NewBrunswick, CAN)
Laboratory prepared wood,fence & deck structures,placed outside, 1 coating, ? replicates, 2 time points, 4 mo, 2 yrs
Laboratorysimulated aging,plus outside, natural weathering,no human use.
Collection ofnatural rain watercontacting woodsurface
Thompson's WaterSeal (fence only) &Water Repellent inCCA treatment soln(fence & deck).
70% reduction at 4 monthsand 80% reduction at 2 yearsfor Thompson’s. No reduction for waterrepellent added into treatmentsolution.
Does not account for wear. Includes temporal control.
Riedel et al.,1991 (Ontario,CAN)
10 playgrounds, 2 to 10years old. Some stained / painted, others not. 4sampling points perstructure.
Outside, natural weathering, in use
Gauze wipe, 250or 500 cm2 withrepeat rubbing ofsame surface.
Oil based stain onsome though not allstructures.
4 structures treated with stainhad on average 74% lowerlevels of dislodgeable As thanaverage of 3 structureswithout any coating. a
Cross-sectional study with nosite specific controls. Limitedinformation on past applicationof coatings. Sampling locationsvary across sites.
CPSC, 1990 (lab)
Purchased boards, used inlaboratory, 2 treatments, 3 replicates, 2 wood types.
Inside, noweathering, not inuse, no aging
Nylon clothwipe, 400 cm2
Oil-based stain, waterrepellant, applied permanufacturer’s label.
No clear evidence ofreductions.
Considerable variability in thecontrols, short-term study withno weathering.
Lebow and Laboratory prepared wood Laboratory Collection of Water soluble acrylic 25-30% reduction in total As Coating applied pre-CCA
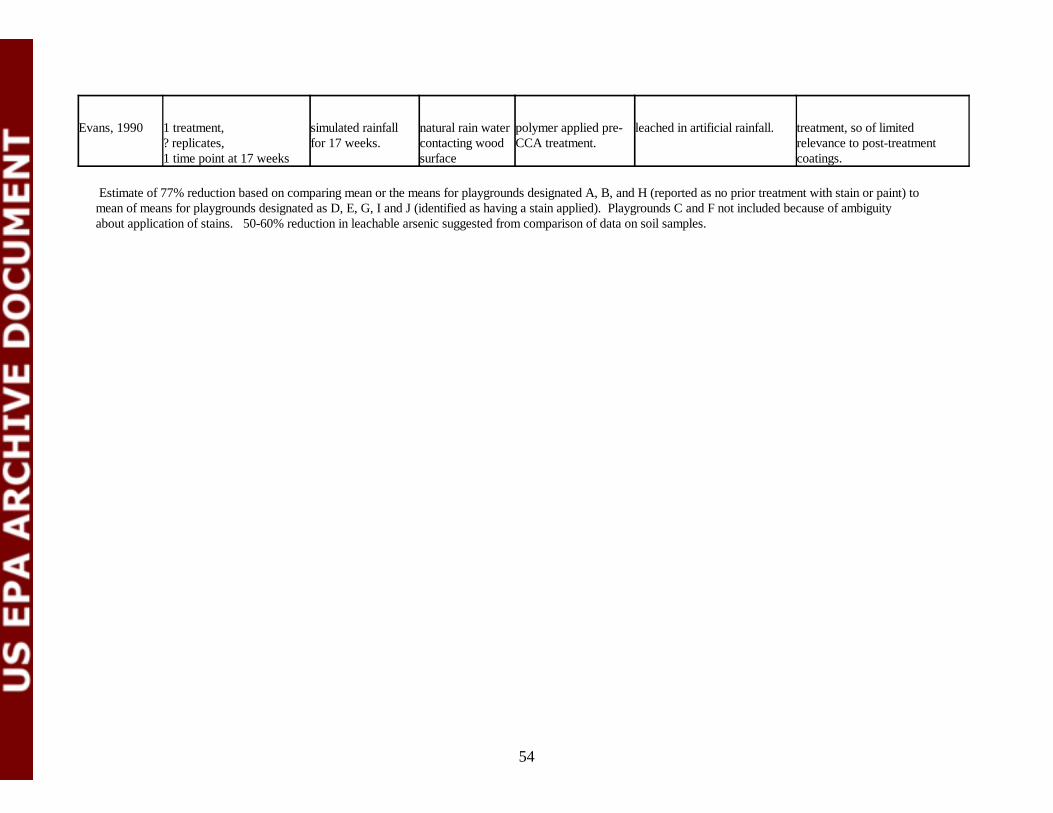
54
Evans, 1990 1 treatment, ? replicates, 1 time point at 17 weeks
simulated rainfallfor 17 weeks.
natural rain watercontacting woodsurface
polymer applied pre-CCA treatment.
leached in artificial rainfall. treatment, so of limitedrelevance to post-treatmentcoatings.
Estimate of 77% reduction based on comparing mean or the means for playgrounds designated A, B, and H (reported as no prior treatment with stain or paint) tomean of means for playgrounds designated as D, E, G, I and J (identified as having a stain applied). Playgrounds C and F not included because of ambiguityabout application of stains. 50-60% reduction in leachable arsenic suggested from comparison of data on soil samples.

55
ADDITIONAL PANEL RECOMMENDATIONS
A. Biomonitoring study
RecommendationThe Panel recommends that a biomonitoring study of children normally exposed to CCA-treated play equipment and decks be conducted. This study should be designed according towell-accepted epidemiological principles, with adequate sample size, to resolve the issue ofwhether there is substantive exposure of children to arsenic (and possibly chromium)residues. The study should include urinary arsenic measurements as a biomarker ofexposure. If practicable, skin wipe samples should be collected in the same study. It wouldbe used to provide exposure information that could be used directly in the risk assessmentand also to validate the proposed exposure models.
Planning and study design should begin immediately, as there is a need for such information,irrespective of the final form of the proposed exposure models.
DiscussionIn the course of its deliberations the Panel noted two particular things: Firstly, the high degree ofuncertainty inherent in the assumptions and default measures proposed for use in the exposureassessment pathway. The cumulative uncertainty in the resulting exposure assessment (and,therefore, the risk assessment) was likely to be substantial. Secondly, the Panel noted theabsence of data on exposure of children to arsenic and chromium residues from playing on CCA-treated playground equipment and decks.
There was general consensus that there was an urgent need to obtain biomonitoring data for twomain purposes: to obtain data that could be directly used in risk assessments and to validate theexposure assessment models.
The ultimate risk assessments that would employ the exposure data would be of two kinds: riskassessments involving acute or short-term toxicity endpoints and assessments of chronic toxicityendpoints, particularly carcinogenicity. The former would involve relatively large differences inexposure between children exposed and unexposed to CCA-treated timber structures. Thesedifferences could be detected in studies using smaller numbers of children than would benecessary for assessments of carcinogenic risk, when smaller incremental exposures might beimportant.
Concerns about the potential difficulties of carrying out epidemiological studies of this naturewere raised. These included the possibility of confounding by other sources of arsenic exposureand whether it would be possible to obtain a representative sample of children.
In response, it was pointed out that other exposures to arsenic would only cause confounding ifthey were correlated with exposures to arsenic from CCA. A priori, this seemed unlikely.
56
Provided a sufficient sample size was used and data on any potential confounding factors werecollected, confounding would not necessarily be a problem and, if necessary, could be adjustedfor in the statistical analysis.
In regard to whether a representative sample was necessary, it was agreed that such a sampleshould not be necessary in the first instance, as the primary issue was one of causal inference –whether there was evidence that children were substantially exposed to arsenic and chromiumfrom CCA-treated timber. A first study could be done in a potentially “worst case” situation. Ifsuch a study provided evidence of minimal exposure then it would be likely that childrenactually did not receive substantial exposure to residues from CCA-treated timber. On the otherhand, if such a study did show evidence of exposure then further studies in other settings wouldbe appropriate for refinement of the exposure assessments.
Ideally, the proposed study would include collection of skin (particularly hand) wipe data fromthe children. This could lead to an improved understanding of the relationship between skinexposure and actual absorption. However, it is important that collection of such wipe samplesdoes not lead to underestimates of the amount of arsenic absorbed and that the collection processdoes not alter the normal play activities of the children.
It was generally agreed that such studies, involving children, are inherently difficult and need tobe designed and carried out very carefully. Because of the potentially long lead time for suchstudies, it is advisable to begin the planning process for such a study as soon as possible. At thesame time, the risk assessment process should not be delayed pending final results of thebiomonitoring study.
B. Effects of Metal-Metal Interactions on Toxicokinetics of Arsenic from CCA-Contaminated Materials and Environmental Media (Soil, Dislodgeable Material)
RecommendationDetailed information must be provided about total composition of metals and metalloids that areintroduced into CCA-treated wood and that are present in contaminated soil and dislodgeablematerials. Information about known interactions between arsenic, chromium, and copper shouldbe included into the risk assessment related to CCA-treated wood. Additional studies are neededto obtain more data about chemical and biological interactions of arsenic, chromium, copper, andother metal (metalloid) contaminants found in CCA-treated (contaminated) materials.
DiscussionExposures to CCA-treated wood components or to CCA-contaminated environmental mediarepresent in fact combined exposures to three metals (metalloids), arsenic, chromium, andcopper. It is generally recognized that biological effects associated with a co-exposure to amixture of metals may significantly differ from effects caused by an exposure to each metalseparately. The presence of chromium and copper may affect toxicokinetics (e.g., absorption,tissue distribution/retention, biotransformation, biliary and urinary excretion) of arsenic and vice
57
versa. Because bulk chemical agents are used for the CCA treatment, other minor chemicalcontaminants are also of concern in their effect on the subsequent disposition of arsenic with co-ingestion by exposed children.
Metabolic and toxicological interactions between the three major metallic components of theCCA mixture have previously been reported:
• Co-exposures to arsenic are known to cause a profound accumulation of copper by thekidney cortex (Ademuyiwa, et al., 1996). Although, copper is a relatively nontoxic metal,possible adverse consequences associated with its accumulation in the kidney should beconsidered under these exposure conditions.
• Co-exposures to arsenic affect tissue levels of chromium in laboratory animals with nosignificant effects on hypoglycemic properties of inorganic chromium (Aguilar et al.,1997).
• Combined acute exposure to Cr(VI), arsenate, and copper causes a marked decreased infetal weight and increased incidence of fetal resorption and abnormality formation in rats,while none of the metals is teratogenic when administered (i.p.) separately (Mason et al.,1989).
One concern is the extent to which impurities would affect the process of biliary excretion ofarsenic. Any effect on biliary excretion, for example, would complicate easy comparisons andcomputational adjustments for biliary excretion when doing relative bioavailability studies. Thatis, these substances would affect arsenic in dislodgeable residues or receiving soils but obviouslywould not affect any toxicokinetics of the reference, soluble As(V) or As(III) dosing solution. This creates a miscomparison. For example, inorganic selenium is known to modify excretion ofarsenic in bile. It has previously been shown that the biliary excretion of arsenic is stronglydependent on glutathione levels in hepatic tissue (Gyurasics et al., 1991). Co-exposures toselenite dramatically increase levels of arsenic in bile in rats (Gregus et al., 1998). Metabolicinteractions between arsenic, selenium, and glutathione are responsible for this effect. Acomplex, seleno-bis(S-glutathionyl) arsinium ion, has recently been identified in the bile ofrabbits injected with selenite and arsenite ( Gailert et al., 2000). Similar biliary interactions havealso been reported for other metalloids (Gregus et al., 1998). Although effects of copper and/orchromium on biliary excretion of arsenic are unknown, a report of Peoples et al., (1979)provided to the Panel indicate that they exist. Here, dogs were fed with food containing sawdustfrom CCA and ACA treated wood. The first dog received 6 mg As in CCA sawdust; the seconddog received 13.2 mg As in ACA sawdust (ACA does not contain chromium). Based on urinaryexcretion, about 40% of the arsenic dose was absorbed in the first dog over 8 days. In contrast,about 60-70% was absorbed in the second dog, indicating that the presence of chromium in CCAsawdust may decrease absorption and/or urinary excretion of arsenic. The fact that these are one-animal and one-dose data prevents more extensive evaluation of these results.
Other interactions with arsenic that are of concern are those that may potentially affect uptake ofarsenic in various media as a function of nutritional status. As noted in responses to Question 2,the arsenic pathway interacts with the phosphorus pathway in biological systems so that a child's
58
nutritional status with respect to phosphorus deficiency or adequacy could possibly affect theparameter of arsenic uptake.
C. Bioavailability of Dislodgeable CCA Residues
The Panel agreed with the Agency’s decision to assume on an interim basis 100% relativebioavailability of ingested dislodgeable CCA residue. During the public comment period, resultsof an unpublished study were presented in which the absolute oral bioavailability of dislodgedmaterial from CCA-treated wood was measured in hamsters. The Panel recommended not usingthis information in the risk assessment at this time because the material dosed has not beencharacterized and concerns about the animal model. However, the Panel recognizes that oralabsorption is a critical variable in the assessment of dose from oral exposure to CCA residuesand encourages further research to characterize it.
59
REFERENCES
Ademuyiwa O., Elsenhans B., Nguyen P.T., Forth W. (1996) Arsenic-copper interaction in thekidney of the rat: influence of arsenic metabolites. Pharmacol. Toxicol. 78:154-160.
Aguilar M.V., Martinez-para M.C. and Gonzales M.J. (1997) Effects of Arsenic(V)-Chromium(III) interaction on plasma glucose and cholesterol levels in growing rats. AnnalsNutr. Metab. 41:189-195.
Bartlett R.J. (1991) Chromium cycling in soils and water: links, gaps, and methods. Environ. Health Perspect. 92: 17-24.
Bartlett R.D. and James, B.R. (1983) Behavior of chromium in soils. V. Fate of organically-complexed Cr added to soil. J. Environ. Qual. 12: 169-172.
Bartlett R.J. and James B.R. (1979) Oxidation of chromium in soils. J. Environ. Qual. 8: 31-35.
Bagdon, R.E. and Hazen, R.E. (1991) Skin permeation and cutaneous hypersensitivity as a basisof making risk assessments of chromium as a soil contaminant. Environ. Health Perspect. 92,111-119.
Burke, T., Fagliano, J., Goldoft, M., Hazen, R.E., Iglewicz, R. and McKee, T. (1991) Chromiteore processing residue in Hudson County, New Jersey. Environ. Health Perspect. 92, 131-137.
Carmichael E.B., Strickland, J.T., and Driver, R.L. (1945) The contents of the stomach, smallintestine, cecum and colon of normal and fasting rabbits. Amer. J. Physiol. 143: 562-566, 1945.
Calabrese, E.J. and Stanek, E.J. (1995) Resolving inter-tracer inconsistencies in soil ingestionestimation. Environmental Health Perspectives 103:454-457.
California Department of Health Services. (1987) Condensed report to the Legislature:Evaluation of hazards posed by the use of wood preservatives on playground equipment. State ofCalifornia. Office of Environmental Health Hazard Assessment, Department of Health Services,Health and Welfare Agency.
Casteel, S. W.; Brown, L. D. and Dunsmore, M. E.. (1997) Relative bioavailability of arsenic inmining wastes; Document Control No. 4500-88-AORH; U.S. Environmental Protection Agency:Region VIII, Denver, CO.
Casteel S.W., Evans, T. and Dunsmore, M.E. Relative bioavailability of arsenic in soils from thevbi70 site. (prepared for US EPA, Region VIII). Final Report, January, 2001
60
Clewell, H.J., Gearhart, J.M., Gentry, P.R., Covington, T.R., VanLandingham, C.B., Crump,K.S., and Shipp, A.M. 1999. Evaluation of the uncertainty in an oral Reference Dose formethylmercury due to interindividual variability in pharmacokinetics. Risk Anal 19:541-552.
Cooper, P. and Y.T. Ung. (1977b) Effect of water repellents on leaching of CCA from treatedfence and deck units – An update. Presented at the 28th Annual Meeting of the InternationalResearch Group on Wood Preservation, May 26-30, 1977, Whistler, Canada
Crump, K. (1998) On summarizing group exposures: Is an arithmetic mean or a geometric meanmore appropriate? Risk Anal 18:293-297.
Cullen, A., and H.C. Frey. (1999) Probabilistic techniques in exposures assessment: Ahandbook for dealing with variability and uncertainty in models and inputs. Plenum Press.
Davis, S., Waller, P., Buschbon, R., Ballou, J., and White, P. (1990) Quantitative estimates ofsoil ingestion in normal children between the ages of 2 and 7 years: Population based estimatesusing aluminum, silicon, and titanium as soil tracer elements. Arch. Environ. Health. 45: 112-122.
Decker, P., Cohen, B., Butala, J.H., and Gordon, T. Exposure to wood dust and heavy metals inworkers using CCA pressure-treated wood. Amer Ind Hyg Assoc J (in press).
EPA. Baseline Human Health Risk Assessment . Vasquez Boulevard and I-70 Superfund Site.US EPA, Region VIII. August, 2001
Freeman, G.B., Schoof, R.A., Ruby, M.V., Davis, A.O., Dill, J.A., Liao, S.C., Lapin, C.A., andBergstrom, P.D. (1995) )Bioavailability of arsenic soil and house dust impacted by smelteractivities following oral administration in cynomologus monkeys. Fundamental and AppliedToxicology 28: 215-222
Freeman, N.C.G., Jimenez, M. and Reed, K.J. (2001) Quantitative analysis of children’s microactivity patterns: the Minnesota children’s pesticide exposure study. J.Exposure Analysis andEnvironmental Epidemiology 11:
Gailer, J., George, G.N., Pickering, I.J., Prince, R.C., Ringwald, S.C., Pemberton, J.E., Glass,R.S., Younis, H.S., DeYoung, D.W., and Aposhian, H.V. (2000) A metabolic link betweenarsenite and selenite: The seleno-bis(S-glutathionyl) arsinium ion. J. Am. Chem. Soc., 122,4637-4639.
Gregus, Z., Gyurasics, Á., and Koszorús, L. (1998) Interactions between selenium and group Va-metalloids (arsenic, antimony and bismuth) in the biliary excretion. Environ. Toxicol.Pharmacol., 5:89-99.
61
Gross, P.R., Katz, S.A., and Samitz, M.H. (1968) Sensitization of guinea pigs to chromiumsalts. J. Invest. Dermatol. 50, 424-427.
Gyurasics, Á., Varga, F., and Gregus, Z. (1991) Effects of arsenicals on biliary excretion ofendogenous glutathione and xenobiotics with glutathione-dependent hepatobiliary transport.Biochem. Pharmacol., 41:937-944.
Gyurasics, Á, Varga, F., and Gregus, Z. (1991) Glutathione-dependent biliary excretion ofarsenic. Biochem. Pharmacol. 42:465-468.
Hall, L.L., George S.E., Kohan M.G. Styblo, M., and Thomas, D.J. (1997) In vitro methylationof inorganic arsenic in mouse caecum. Toxicol. Appl. Pharmacol. 147:101-109.
Huang, R.N., Lee, T.C. (1996) Cellular uptake of trivalent arsenite and pentavalent arsenate inKB cells cultured in phosphate-free medium. Tox Appl Pharmacol 136:243-249.
Jansen, L.H., and Berrens, L. (1968) Sensitization and partial desensitization of guinea pigs tohexavalent chromium. Dermatologica 137, 65-73.
Kierski, M.W. (1992). The Oral bioavailability of soil-lead in the Weanling rabbit. Ph.D. Thesis, Minneapolis, MN: University of Minnesota Diss. Abs. Int. B: 53: 2819-2820.
Kissel J.C., Shirai, J.H., Richter, K.Y., and Fenske, R.A. (1998) Investigation of dermal contactwith soil in controlled trials, J.Soil Contam. 7(6):737-752
Lebow, S.T. and Evans, J.W. (1999) Effect of prestain on the release rate of cooper, chromium,and arsenic from Western hemlock. USDA Forest Service, Forest Products Laboratory,Madison, Wisconsin. Research Note FPL-RN-0271
Levander, O.A. (1977) Metabolic interrelationships between arsenic and selenium. Environ Health Perspect 19:159-164. (A review).
Lu, C. and Fenske, R.A. (1999) Dermal transfer of chlorpyrifos residues from residentialsurfaces: Comparison of hand press, hand drag, wipe, and polyurethane foam rollermeasurements after broadcast and aerosol pesticide applications. Environ Health Perspect107:463-467.
MacKenzie, R.D., Byerrum, R.U., and Decker, C.F. (1958) Chronic toxicity studies II. Hexavalent and trivalent chromium administered in drinking water to rats. A.M.A. ArchIndustrial Health 18: 232-234.
62
Mason R.W., Edwards I.R., and Fisher L.C. (1989) Teratogenicity of combinations of sodiumdichromate, sodium arsenate, and copper sulphate in the rat. Comp. Biochem. Physiol. 93C:407-411.
Mor, S., Ben Efraim, S., and Leibovici, J.L. (1988) Successful contact sensitization to chromatein mice. Int. Arch. Allergy Appl. Immunol. 85, 452-457.
Mushak, P. (1998) Uses and limits of empirical data in measuring and modeling human leadexposure. Environ. Health Perspect. 106 (Suppl. 6) 1467-1484.
Peoples, S.A. and Parker, H.R. (1979) The absorption and excretion of arsenic from the ingestionof sawdust of arsenical treated wood by dogs. University of California, School of VeterinaryMedicine, Davis, CA. July.
Roberts, S.M., Weimar W.R., Vinson, J.R., Munson, J.W., and Bergeron R.J. (2001)Measurement of arsenic bioavailability from soils using a primate model. ToxicologicalSciences 60: 436 Presented at the 2001 Annual Meeting of the Society of Toxicology.
Rodes, C.E., Newsome, J.R., and Vanderpool, R.W. (2001) Experimental methodologies andpreliminary transfer factor data for estimation of dermal exposure to particles. J. ExposureAnalysis and Environmental Epidemiology 11: 123-139.
Ruby, M.V., Schoof, R., and Brattin, W. (1999) Advances in evaluating the oral bioavailabilityof inorganics in soil for use in human health risk assessment. Environ Sci Tech 33:3697-3705
Sedman, R.M. (1989) The development of applied action levels for soil contact: A scenario forthe exposure of humans to soil in a residential setting. Environmental Health Perspectives 79:291-313.
Sedman, R.M. and mahmood, R.J. (1994) Soil ingestion by children and adults reconsideredusing the results of recent tracer studies. Journal of the Air and Waste Management Association44:141-144.
Silvers, A. Florence, B.T., Rourke, D.L. and Lorimer, R.J. (1994) How children spend their time:A sample survey for use in exposure and risk assessments. Risk Analysis 14: 931-944.
Solo-Gabriele, H.M. and Townsend, T.G. (1999) Disposal practices and managementalternatives for CCA-treated wood waste. Waste Management Research 17: 378-389.
Stanek, E.J. and Calabrese, E.J. (1995) Daily estimates of soil ingestion in children.Environmental Health Perspectives 103: 276-285.
Stilwell, D. (1998) Arsenic from CCA-treated wood can be reduced by coating. Frontiers ofPlant Science 51(1): 6-8.

63
Tolaymat, T.M., Townsend, T.G., and H. Solo-Gabriele (2000) Chromated copper arsenatetreated wood in recovered wood. Environmental Engineering and Science . 17(1) : 19-28.
Townsend, T.G., K. Stook, Tolaymat, T.M., Song, J.K., H. Solo-Gabriele, Hosein, N., andKhan, B. (2001) New lines of CCA-treated wood research: In-service and disposal issues –Final Technical Report #00-12. Submitted to the Florida Center for Solid and Hazardous Waste,Gainesville, Florida.
Tyl, R.W., Marr, M., and Meyers, C.B. (1991) Developmental toxicity evaluation of chromicacid administered by gavage to New Zealand white rabbits. Research Triangle Institute,Research Triangle Park, NC Study No. 60C-4808-30/40. Unpublished.
U.S. Consumer Product Safety Commission (CPSC). (1990) Estimate of risk of skin cancer fromdislodgeable arsenic on pressure treated wood playground equipment.
Wester, R.C., Maibach, H.I., Sedik, L., Melendres, J., and Wader, M. (1993) In vivo and in vitropercutaneous absorption and skin decontamination of arsenic from water and soil. Fundamentaland Applied Toxicology 20: 336-340.
Zaldivar, R. (1977) Ecological investigations on arsenic dietary intake and endemic chronicpoisoning in man: dose-response curve. Zbl Bakt Hyg, I Art Orig B 164:481-484.
Zaldivar, R., and Ghai, G.L. (1980) Cllinical epidemiological studies on endemic chronic arsenicpoisoning in children and adults, including observations on children with high and low intake ofdietary arsenic. Zbl Bakt Hyg, I Abt Orig B 170:409-421.
Zaldivar, R., and Guillier, A. (1977) Environmental and clinical investigations on endemicchronic arsenic poisoning in infants in children. Zbl Bakt Hyg, I Abt Orig B 165:226-234.
Zhang, J.D. and Li, S.K. (1997) Cancer mortality in a Chinese population exposed to hexavalentchromium in water. J.Occ. Env. Med. 39 (4): 315-319.
Attachment 1 for Appendix F
The Office of Pesticides Programs (OPP) Responses to Scientific Advisory Panel (SAP) Recommendations for
CCA Children Exposure and Risk Assessment
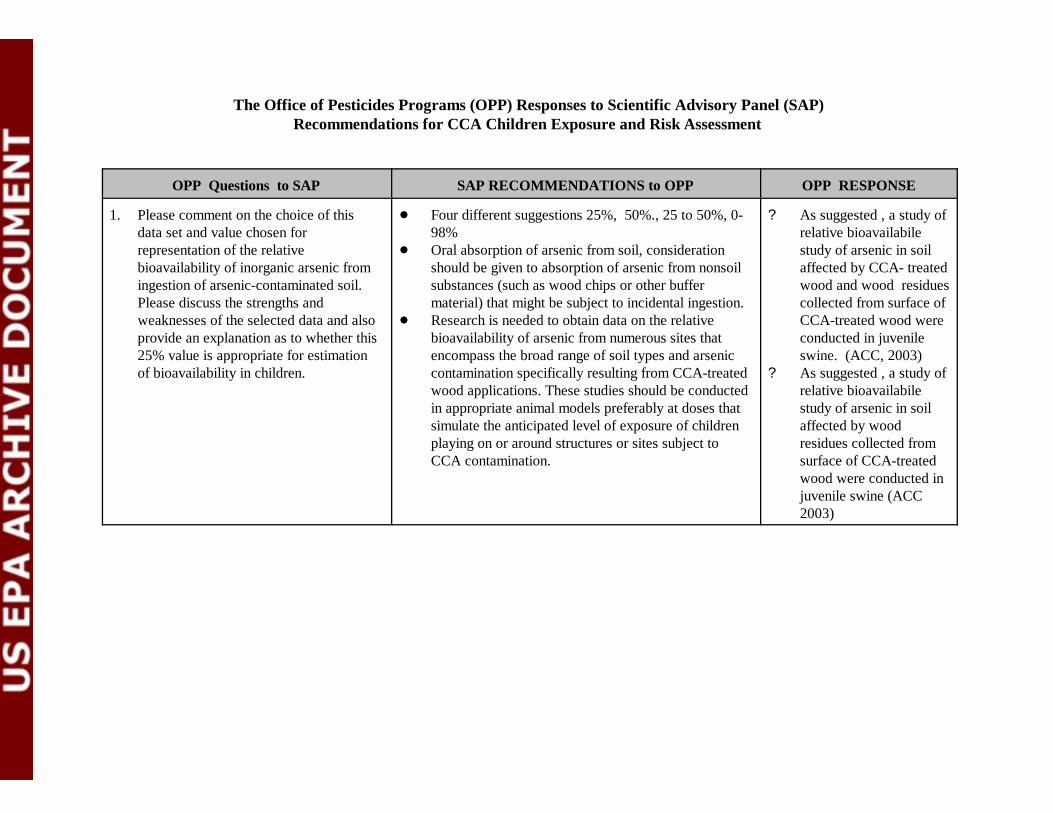
The Office of Pesticides Programs (OPP) Responses to Scientific Advisory Panel (SAP)Recommendations for CCA Children Exposure and Risk Assessment
OPP Questions to SAP SAP RECOMMENDATIONS to OPP OPP RESPONSE
1. Please comment on the choice of thisdata set and value chosen forrepresentation of the relativebioavailability of inorganic arsenic fromingestion of arsenic-contaminated soil.Please discuss the strengths andweaknesses of the selected data and alsoprovide an explanation as to whether this25% value is appropriate for estimationof bioavailability in children.
! Four different suggestions 25%, 50%., 25 to 50%, 0-98%
! Oral absorption of arsenic from soil, considerationshould be given to absorption of arsenic from nonsoilsubstances (such as wood chips or other buffermaterial) that might be subject to incidental ingestion.
! Research is needed to obtain data on the relativebioavailability of arsenic from numerous sites thatencompass the broad range of soil types and arseniccontamination specifically resulting from CCA-treatedwood applications. These studies should be conductedin appropriate animal models preferably at doses thatsimulate the anticipated level of exposure of childrenplaying on or around structures or sites subject toCCA contamination.
? As suggested , a study ofrelative bioavailabilestudy of arsenic in soilaffected by CCA- treatedwood and wood residuescollected from surface ofCCA-treated wood wereconducted in juvenileswine. (ACC, 2003)
? As suggested , a study ofrelative bioavailabilestudy of arsenic in soilaffected by wood residues collected fromsurface of CCA-treatedwood were conducted injuvenile swine (ACC2003)
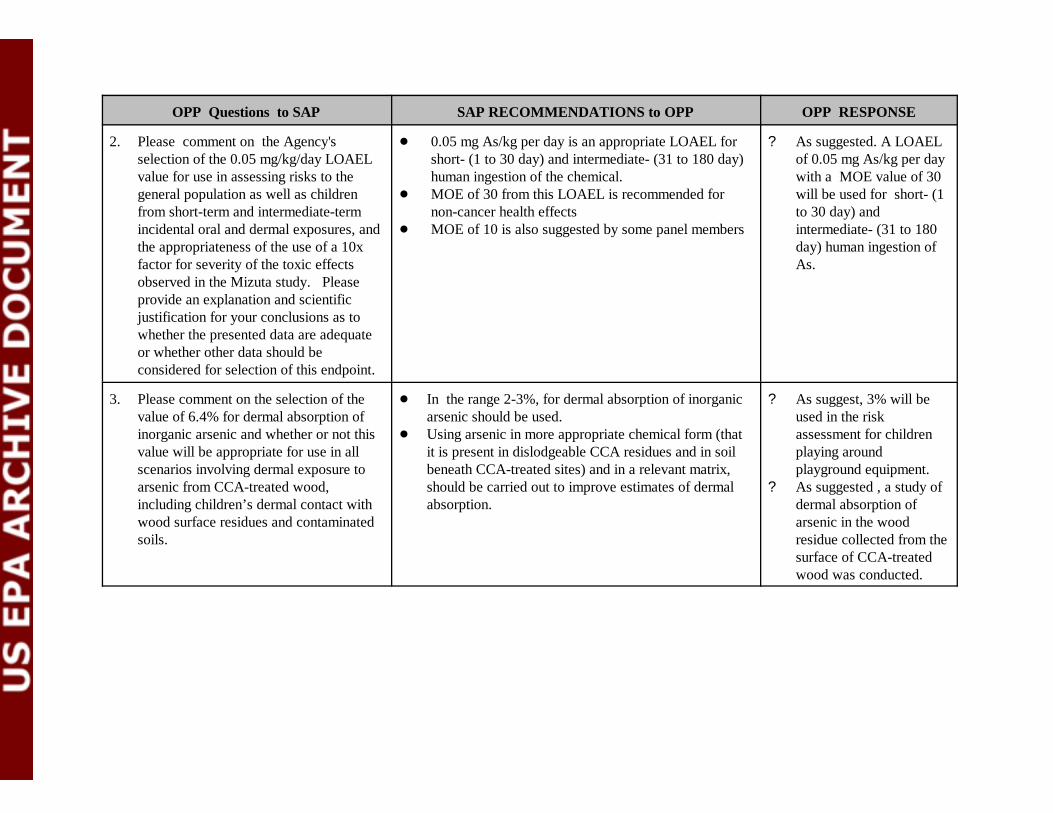
OPP Questions to SAP SAP RECOMMENDATIONS to OPP OPP RESPONSE
2. Please comment on the Agency'sselection of the 0.05 mg/kg/day LOAELvalue for use in assessing risks to thegeneral population as well as childrenfrom short-term and intermediate-termincidental oral and dermal exposures, andthe appropriateness of the use of a 10xfactor for severity of the toxic effectsobserved in the Mizuta study. Pleaseprovide an explanation and scientificjustification for your conclusions as towhether the presented data are adequate or whether other data should beconsidered for selection of this endpoint.
! 0.05 mg As/kg per day is an appropriate LOAEL forshort- (1 to 30 day) and intermediate- (31 to 180 day)human ingestion of the chemical.
! MOE of 30 from this LOAEL is recommended for non-cancer health effects
! MOE of 10 is also suggested by some panel members
? As suggested. A LOAELof 0.05 mg As/kg per daywith a MOE value of 30will be used for short- (1to 30 day) andintermediate- (31 to 180day) human ingestion ofAs.
3. Please comment on the selection of thevalue of 6.4% for dermal absorption ofinorganic arsenic and whether or not thisvalue will be appropriate for use in allscenarios involving dermal exposure toarsenic from CCA-treated wood,including children’s dermal contact withwood surface residues and contaminatedsoils.
! In the range 2-3%, for dermal absorption of inorganicarsenic should be used.
! Using arsenic in more appropriate chemical form (thatit is present in dislodgeable CCA residues and in soilbeneath CCA-treated sites) and in a relevant matrix,should be carried out to improve estimates of dermalabsorption.
? As suggest, 3% will beused in the riskassessment for childrenplaying aroundplayground equipment.
? As suggested , a study ofdermal absorption ofarsenic in the woodresidue collected from thesurface of CCA-treatedwood was conducted.
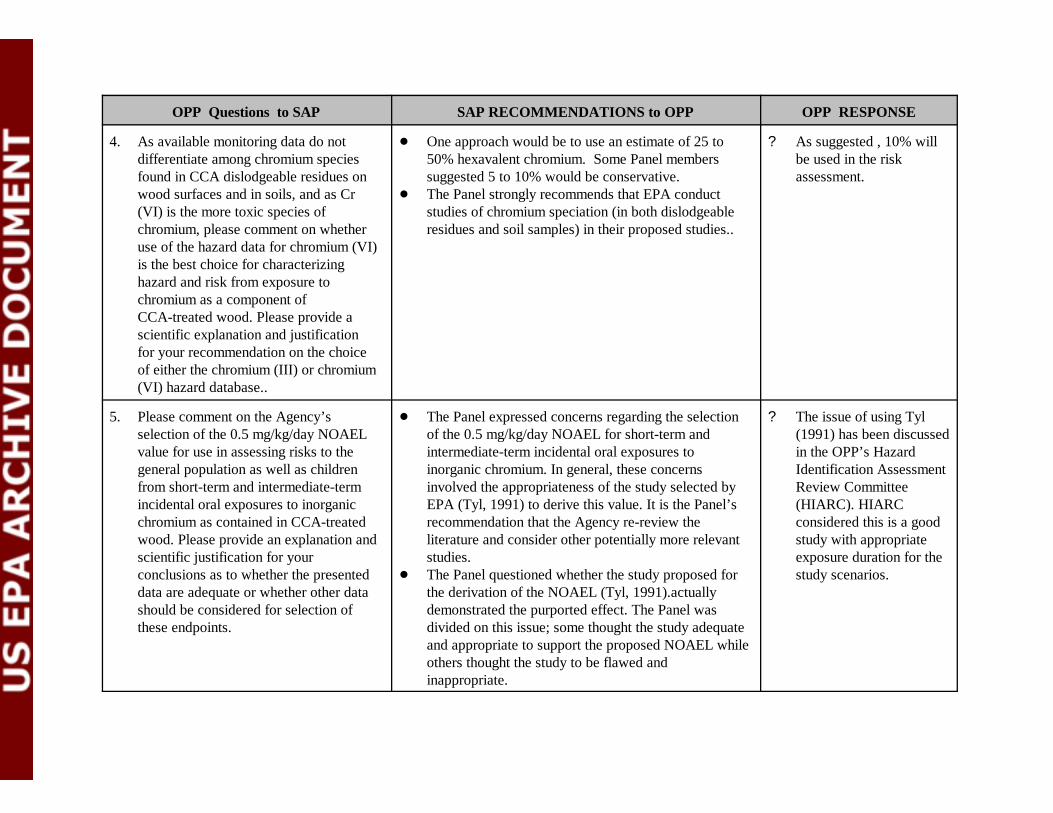
OPP Questions to SAP SAP RECOMMENDATIONS to OPP OPP RESPONSE
4. As available monitoring data do notdifferentiate among chromium speciesfound in CCA dislodgeable residues onwood surfaces and in soils, and as Cr(VI) is the more toxic species ofchromium, please comment on whetheruse of the hazard data for chromium (VI)is the best choice for characterizinghazard and risk from exposure tochromium as a component ofCCA-treated wood. Please provide ascientific explanation and justificationfor your recommendation on the choiceof either the chromium (III) or chromium(VI) hazard database..
! One approach would be to use an estimate of 25 to50% hexavalent chromium. Some Panel memberssuggested 5 to 10% would be conservative.
! The Panel strongly recommends that EPA conductstudies of chromium speciation (in both dislodgeableresidues and soil samples) in their proposed studies..
? As suggested , 10% willbe used in the riskassessment.
5. Please comment on the Agency’sselection of the 0.5 mg/kg/day NOAELvalue for use in assessing risks to thegeneral population as well as childrenfrom short-term and intermediate-termincidental oral exposures to inorganicchromium as contained in CCA-treatedwood. Please provide an explanation andscientific justification for yourconclusions as to whether the presenteddata are adequate or whether other datashould be considered for selection ofthese endpoints.
! The Panel expressed concerns regarding the selectionof the 0.5 mg/kg/day NOAEL for short-term andintermediate-term incidental oral exposures toinorganic chromium. In general, these concernsinvolved the appropriateness of the study selected byEPA (Tyl, 1991) to derive this value. It is the Panel’srecommendation that the Agency re-review theliterature and consider other potentially more relevantstudies.
! The Panel questioned whether the study proposed forthe derivation of the NOAEL (Tyl, 1991).actuallydemonstrated the purported effect. The Panel wasdivided on this issue; some thought the study adequateand appropriate to support the proposed NOAEL whileothers thought the study to be flawed andinappropriate.
? The issue of using Tyl(1991) has been discussedin the OPP’s HazardIdentification AssessmentReview Committee(HIARC). HIARCconsidered this is a goodstudy with appropriateexposure duration for thestudy scenarios.
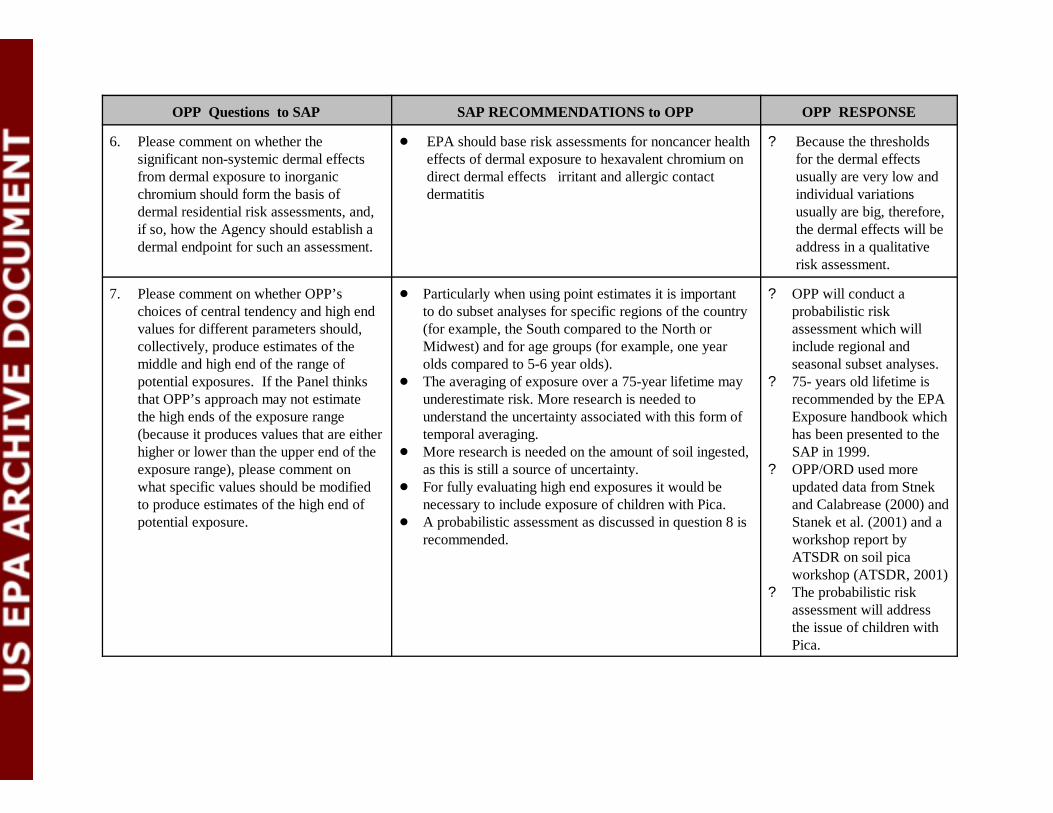
OPP Questions to SAP SAP RECOMMENDATIONS to OPP OPP RESPONSE
6. Please comment on whether thesignificant non-systemic dermal effectsfrom dermal exposure to inorganicchromium should form the basis ofdermal residential risk assessments, and,if so, how the Agency should establish adermal endpoint for such an assessment.
! EPA should base risk assessments for noncancer healtheffects of dermal exposure to hexavalent chromium ondirect dermal effects irritant and allergic contactdermatitis
? Because the thresholdsfor the dermal effects usually are very low andindividual variationsusually are big, therefore,the dermal effects will beaddress in a qualitativerisk assessment.
7. Please comment on whether OPP’schoices of central tendency and high endvalues for different parameters should,collectively, produce estimates of themiddle and high end of the range ofpotential exposures. If the Panel thinksthat OPP’s approach may not estimatethe high ends of the exposure range(because it produces values that are eitherhigher or lower than the upper end of theexposure range), please comment onwhat specific values should be modifiedto produce estimates of the high end ofpotential exposure.
! Particularly when using point estimates it is importantto do subset analyses for specific regions of the country(for example, the South compared to the North orMidwest) and for age groups (for example, one yearolds compared to 5-6 year olds).
! The averaging of exposure over a 75-year lifetime mayunderestimate risk. More research is needed tounderstand the uncertainty associated with this form oftemporal averaging.
! More research is needed on the amount of soil ingested,as this is still a source of uncertainty.
! For fully evaluating high end exposures it would benecessary to include exposure of children with Pica.
! A probabilistic assessment as discussed in question 8 isrecommended.
? OPP will conduct aprobabilistic riskassessment which willinclude regional andseasonal subset analyses.
? 75- years old lifetime isrecommended by the EPAExposure handbook whichhas been presented to theSAP in 1999.
? OPP/ORD used moreupdated data from Stnekand Calabrease (2000) andStanek et al. (2001) and aworkshop report byATSDR on soil picaworkshop (ATSDR, 2001)
? The probabilistic riskassessment will addressthe issue of children withPica.
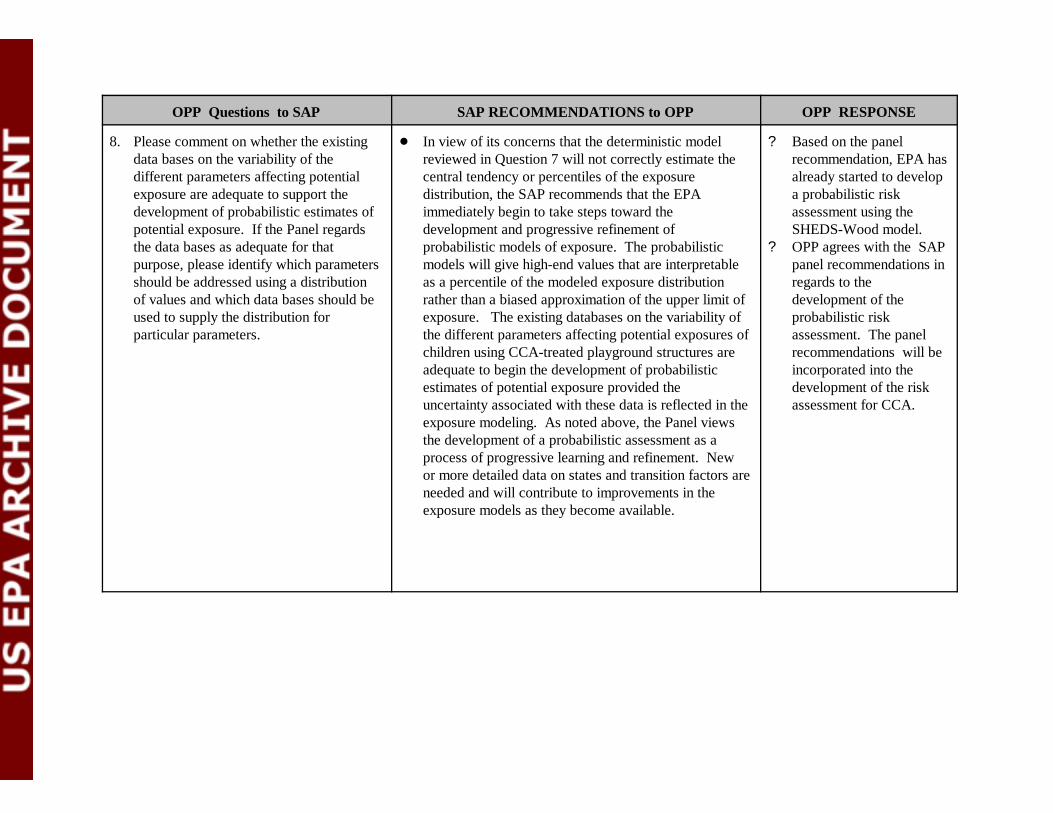
OPP Questions to SAP SAP RECOMMENDATIONS to OPP OPP RESPONSE
8. Please comment on whether the existingdata bases on the variability of thedifferent parameters affecting potentialexposure are adequate to support thedevelopment of probabilistic estimates ofpotential exposure. If the Panel regardsthe data bases as adequate for thatpurpose, please identify which parametersshould be addressed using a distributionof values and which data bases should beused to supply the distribution forparticular parameters.
! In view of its concerns that the deterministic modelreviewed in Question 7 will not correctly estimate thecentral tendency or percentiles of the exposuredistribution, the SAP recommends that the EPAimmediately begin to take steps toward thedevelopment and progressive refinement ofprobabilistic models of exposure. The probabilisticmodels will give high-end values that are interpretableas a percentile of the modeled exposure distributionrather than a biased approximation of the upper limit ofexposure. The existing databases on the variability ofthe different parameters affecting potential exposures ofchildren using CCA-treated playground structures areadequate to begin the development of probabilisticestimates of potential exposure provided theuncertainty associated with these data is reflected in theexposure modeling. As noted above, the Panel viewsthe development of a probabilistic assessment as aprocess of progressive learning and refinement. Newor more detailed data on states and transition factors areneeded and will contribute to improvements in theexposure models as they become available.
? Based on the panelrecommendation, EPA hasalready started to developa probabilistic riskassessment using theSHEDS-Wood model.
? OPP agrees with the SAPpanel recommendations inregards to thedevelopment of theprobabilistic riskassessment. The panelrecommendations will beincorporated into thedevelopment of the riskassessment for CCA.
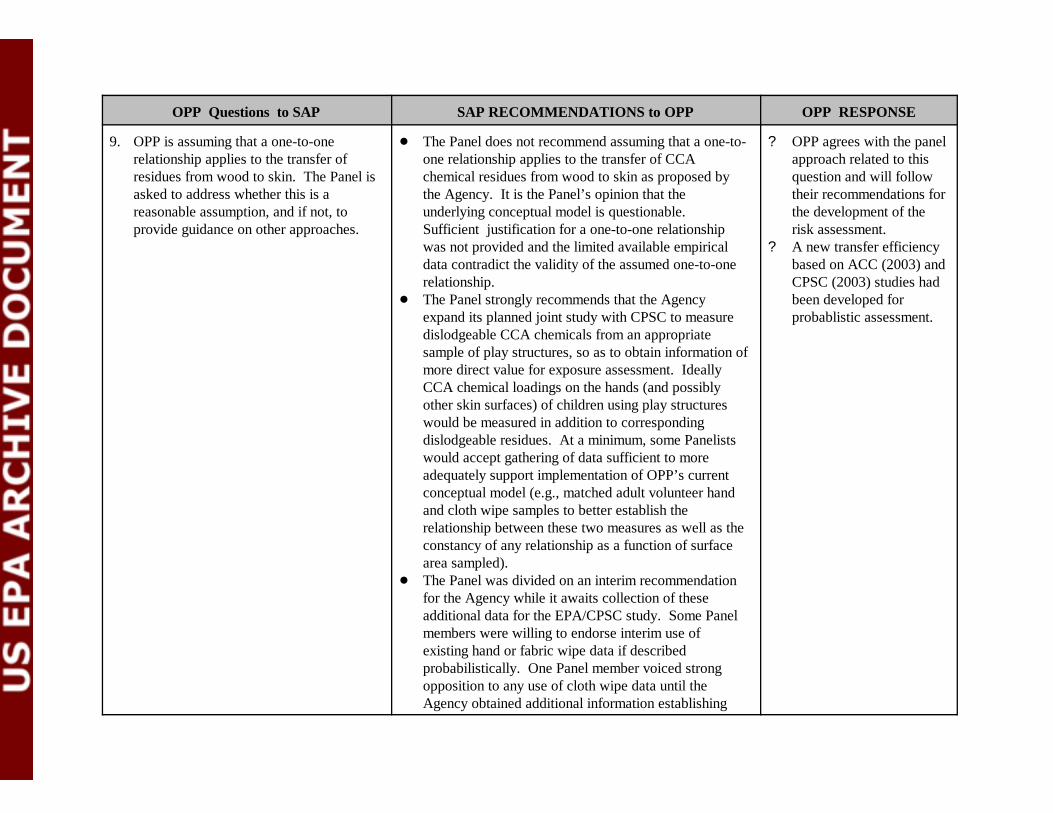
OPP Questions to SAP SAP RECOMMENDATIONS to OPP OPP RESPONSE
9. OPP is assuming that a one-to-onerelationship applies to the transfer ofresidues from wood to skin. The Panel isasked to address whether this is areasonable assumption, and if not, toprovide guidance on other approaches.
! The Panel does not recommend assuming that a one-to-one relationship applies to the transfer of CCAchemical residues from wood to skin as proposed bythe Agency. It is the Panel’s opinion that theunderlying conceptual model is questionable. Sufficient justification for a one-to-one relationshipwas not provided and the limited available empiricaldata contradict the validity of the assumed one-to-onerelationship.
! The Panel strongly recommends that the Agencyexpand its planned joint study with CPSC to measuredislodgeable CCA chemicals from an appropriatesample of play structures, so as to obtain information ofmore direct value for exposure assessment. IdeallyCCA chemical loadings on the hands (and possiblyother skin surfaces) of children using play structureswould be measured in addition to correspondingdislodgeable residues. At a minimum, some Panelistswould accept gathering of data sufficient to moreadequately support implementation of OPP’s currentconceptual model (e.g., matched adult volunteer handand cloth wipe samples to better establish therelationship between these two measures as well as theconstancy of any relationship as a function of surfacearea sampled).
! The Panel was divided on an interim recommendationfor the Agency while it awaits collection of theseadditional data for the EPA/CPSC study. Some Panelmembers were willing to endorse interim use ofexisting hand or fabric wipe data if describedprobabilistically. One Panel member voiced strongopposition to any use of cloth wipe data until theAgency obtained additional information establishing
? OPP agrees with the panelapproach related to thisquestion and will followtheir recommendations forthe development of therisk assessment.
? A new transfer efficiencybased on ACC (2003) andCPSC (2003) studies hadbeen developed forprobablistic assessment.
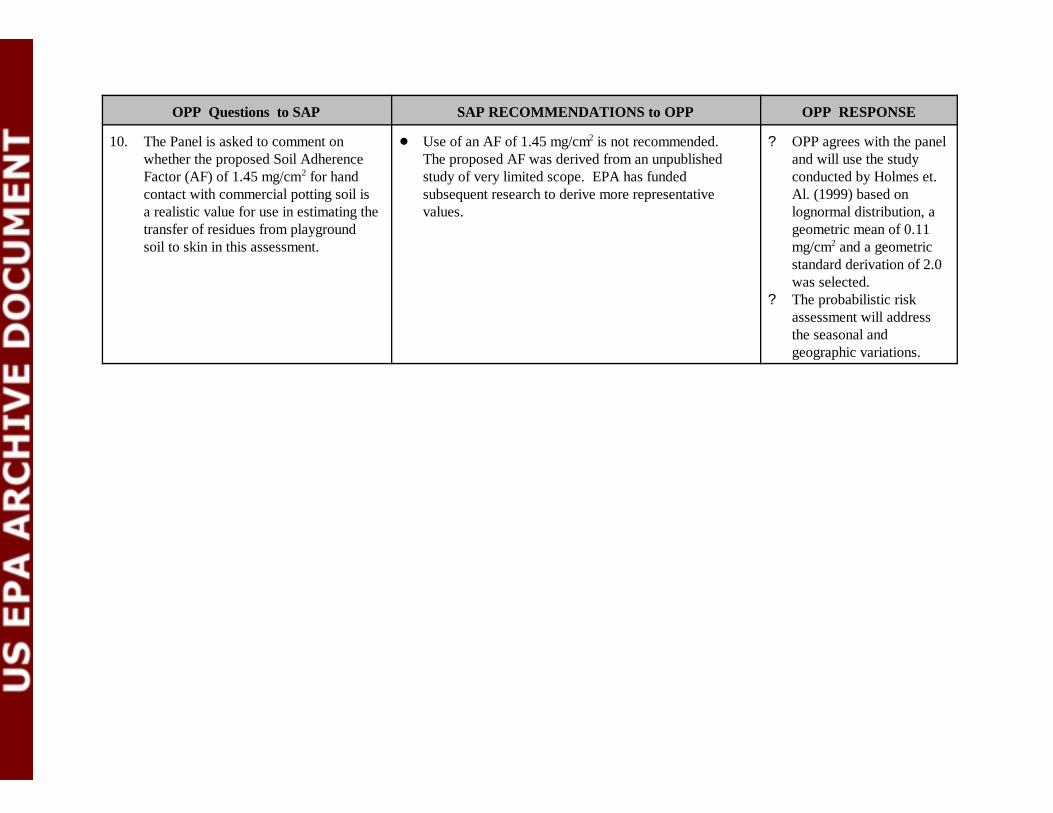
OPP Questions to SAP SAP RECOMMENDATIONS to OPP OPP RESPONSE
10. The Panel is asked to comment onwhether the proposed Soil AdherenceFactor (AF) of 1.45 mg/cm2 for handcontact with commercial potting soil isa realistic value for use in estimating thetransfer of residues from playgroundsoil to skin in this assessment.
! Use of an AF of 1.45 mg/cm2 is not recommended. The proposed AF was derived from an unpublishedstudy of very limited scope. EPA has fundedsubsequent research to derive more representativevalues.
? OPP agrees with the paneland will use the studyconducted by Holmes et.Al. (1999) based onlognormal distribution, ageometric mean of 0.11mg/cm2 and a geometricstandard derivation of 2.0was selected.
? The probabilistic riskassessment will addressthe seasonal andgeographic variations.
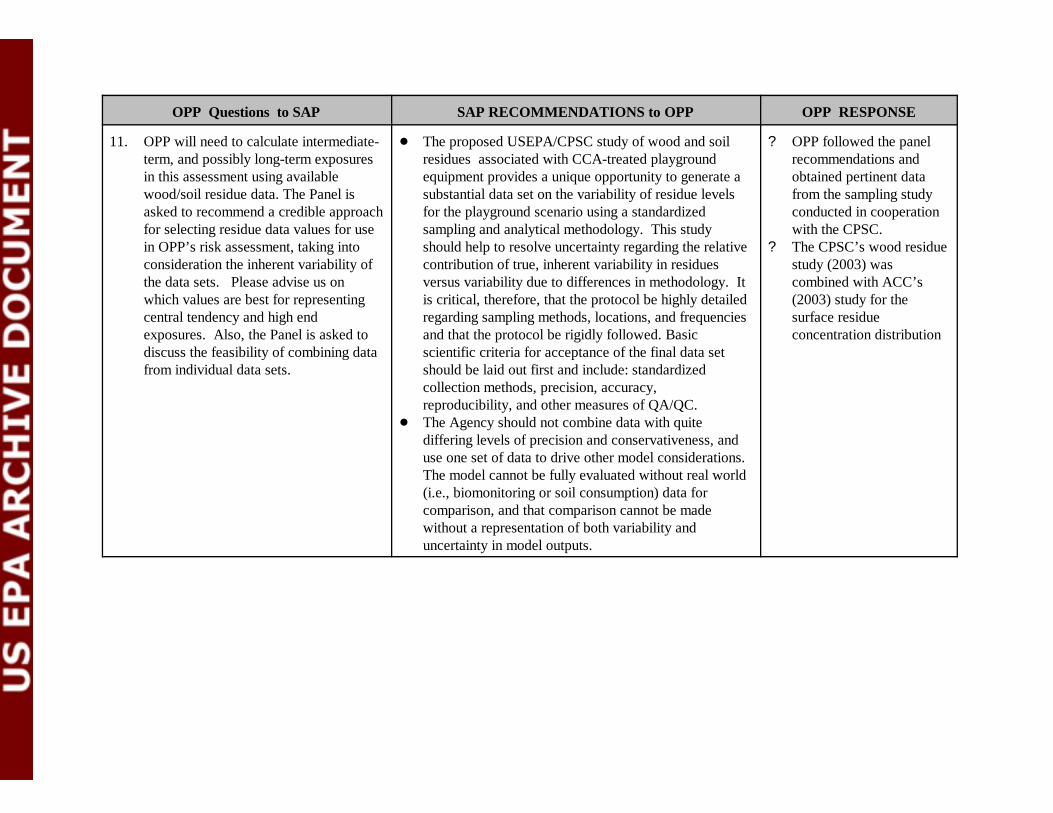
OPP Questions to SAP SAP RECOMMENDATIONS to OPP OPP RESPONSE
11. OPP will need to calculate intermediate-term, and possibly long-term exposuresin this assessment using availablewood/soil residue data. The Panel isasked to recommend a credible approachfor selecting residue data values for usein OPP’s risk assessment, taking intoconsideration the inherent variability ofthe data sets. Please advise us onwhich values are best for representingcentral tendency and high endexposures. Also, the Panel is asked todiscuss the feasibility of combining datafrom individual data sets.
! The proposed USEPA/CPSC study of wood and soilresidues associated with CCA-treated playgroundequipment provides a unique opportunity to generate asubstantial data set on the variability of residue levelsfor the playground scenario using a standardizedsampling and analytical methodology. This studyshould help to resolve uncertainty regarding the relativecontribution of true, inherent variability in residuesversus variability due to differences in methodology. Itis critical, therefore, that the protocol be highly detailedregarding sampling methods, locations, and frequenciesand that the protocol be rigidly followed. Basicscientific criteria for acceptance of the final data setshould be laid out first and include: standardizedcollection methods, precision, accuracy,reproducibility, and other measures of QA/QC.
! The Agency should not combine data with quitediffering levels of precision and conservativeness, anduse one set of data to drive other model considerations. The model cannot be fully evaluated without real world(i.e., biomonitoring or soil consumption) data forcomparison, and that comparison cannot be madewithout a representation of both variability anduncertainty in model outputs.
? OPP followed the panelrecommendations andobtained pertinent datafrom the sampling studyconducted in cooperationwith the CPSC.
? The CPSC’s wood residuestudy (2003) wascombined with ACC’s(2003) study for thesurface residueconcentration distribution
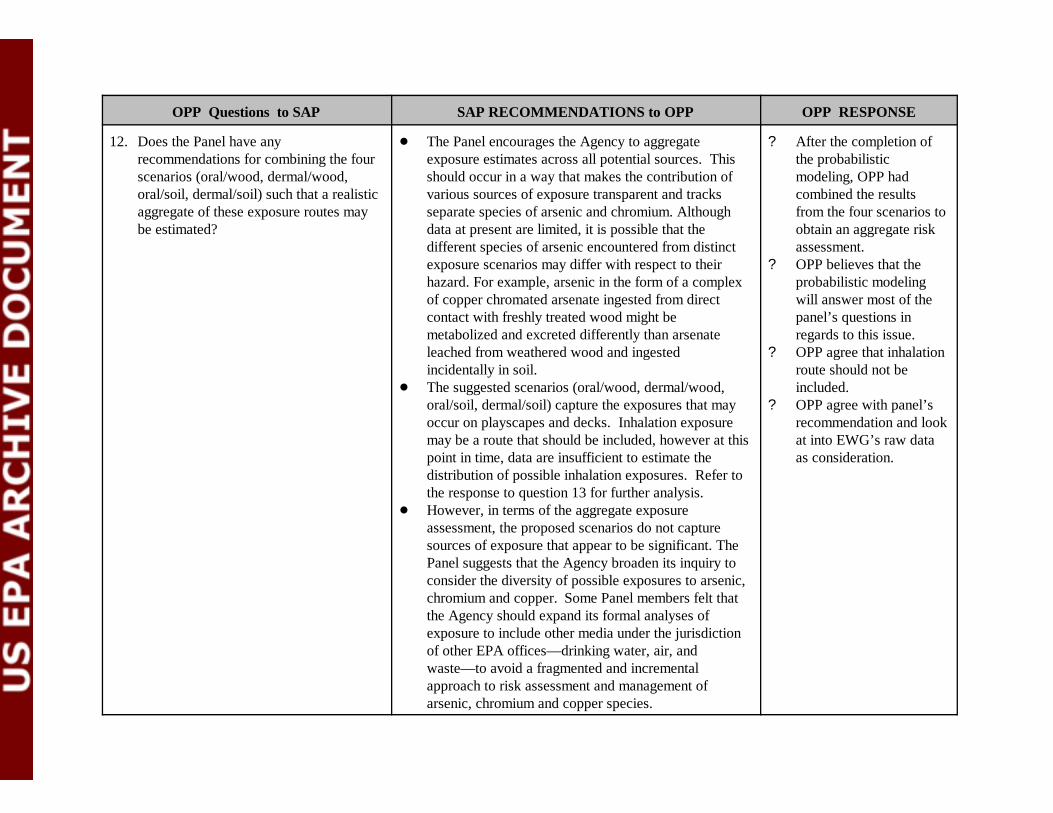
OPP Questions to SAP SAP RECOMMENDATIONS to OPP OPP RESPONSE
12. Does the Panel have anyrecommendations for combining the fourscenarios (oral/wood, dermal/wood,oral/soil, dermal/soil) such that a realisticaggregate of these exposure routes maybe estimated?
! The Panel encourages the Agency to aggregateexposure estimates across all potential sources. Thisshould occur in a way that makes the contribution ofvarious sources of exposure transparent and tracksseparate species of arsenic and chromium. Althoughdata at present are limited, it is possible that thedifferent species of arsenic encountered from distinctexposure scenarios may differ with respect to theirhazard. For example, arsenic in the form of a complexof copper chromated arsenate ingested from directcontact with freshly treated wood might bemetabolized and excreted differently than arsenateleached from weathered wood and ingestedincidentally in soil.
! The suggested scenarios (oral/wood, dermal/wood,oral/soil, dermal/soil) capture the exposures that mayoccur on playscapes and decks. Inhalation exposuremay be a route that should be included, however at thispoint in time, data are insufficient to estimate thedistribution of possible inhalation exposures. Refer tothe response to question 13 for further analysis.
! However, in terms of the aggregate exposureassessment, the proposed scenarios do not capturesources of exposure that appear to be significant. ThePanel suggests that the Agency broaden its inquiry toconsider the diversity of possible exposures to arsenic,chromium and copper. Some Panel members felt thatthe Agency should expand its formal analyses ofexposure to include other media under the jurisdictionof other EPA offices— drinking water, air, andwaste— to avoid a fragmented and incrementalapproach to risk assessment and management ofarsenic, chromium and copper species.
? After the completion ofthe probabilisticmodeling, OPP hadcombined the resultsfrom the four scenarios toobtain an aggregate riskassessment.
? OPP believes that theprobabilistic modelingwill answer most of thepanel’s questions inregards to this issue.
? OPP agree that inhalationroute should not beincluded.
? OPP agree with panel’srecommendation and lookat into EWG’s raw dataas consideration.
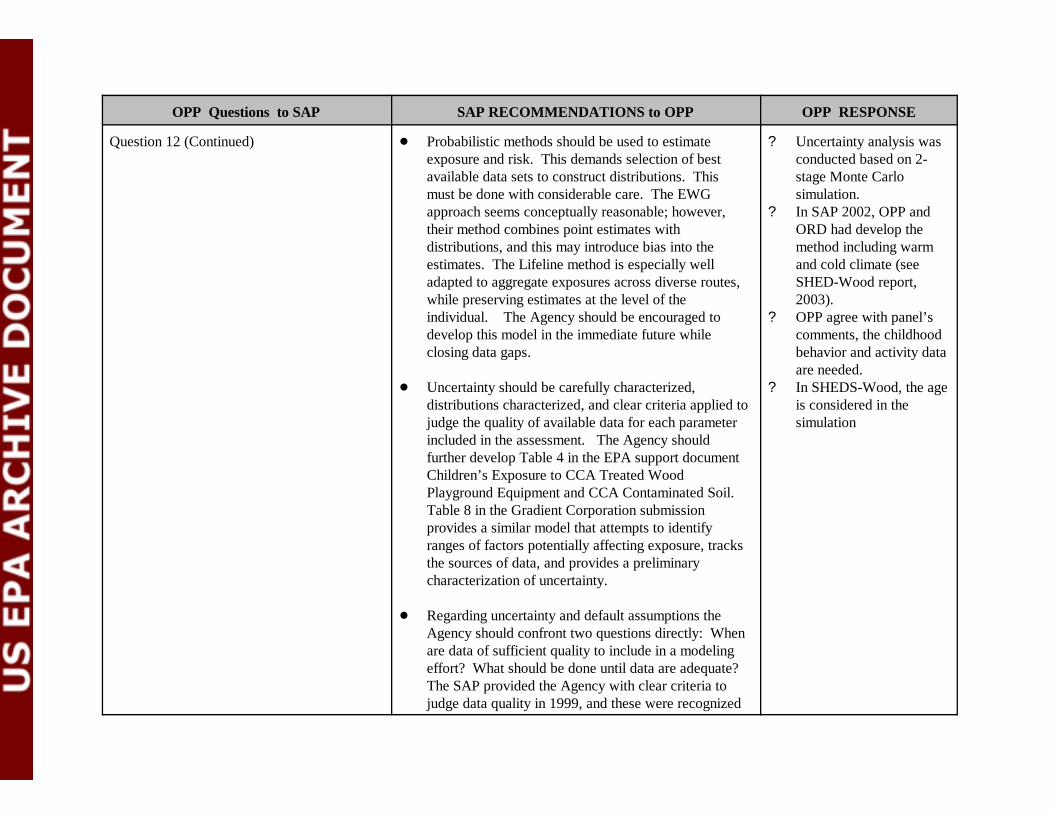
OPP Questions to SAP SAP RECOMMENDATIONS to OPP OPP RESPONSE
Question 12 (Continued) ! Probabilistic methods should be used to estimateexposure and risk. This demands selection of bestavailable data sets to construct distributions. Thismust be done with considerable care. The EWGapproach seems conceptually reasonable; however,their method combines point estimates withdistributions, and this may introduce bias into theestimates. The Lifeline method is especially welladapted to aggregate exposures across diverse routes,while preserving estimates at the level of theindividual. The Agency should be encouraged todevelop this model in the immediate future whileclosing data gaps.
! Uncertainty should be carefully characterized,distributions characterized, and clear criteria applied tojudge the quality of available data for each parameterincluded in the assessment. The Agency shouldfurther develop Table 4 in the EPA support documentChildren’s Exposure to CCA Treated WoodPlayground Equipment and CCA Contaminated Soil. Table 8 in the Gradient Corporation submissionprovides a similar model that attempts to identifyranges of factors potentially affecting exposure, tracksthe sources of data, and provides a preliminarycharacterization of uncertainty.
! Regarding uncertainty and default assumptions theAgency should confront two questions directly: Whenare data of sufficient quality to include in a modelingeffort? What should be done until data are adequate? The SAP provided the Agency with clear criteria tojudge data quality in 1999, and these were recognized
? Uncertainty analysis wasconducted based on 2-stage Monte Carlosimulation.
? In SAP 2002, OPP andORD had develop themethod including warmand cold climate (seeSHED-Wood report,2003).
? OPP agree with panel’scomments, the childhoodbehavior and activity dataare needed.
? In SHEDS-Wood, the ageis considered in thesimulation
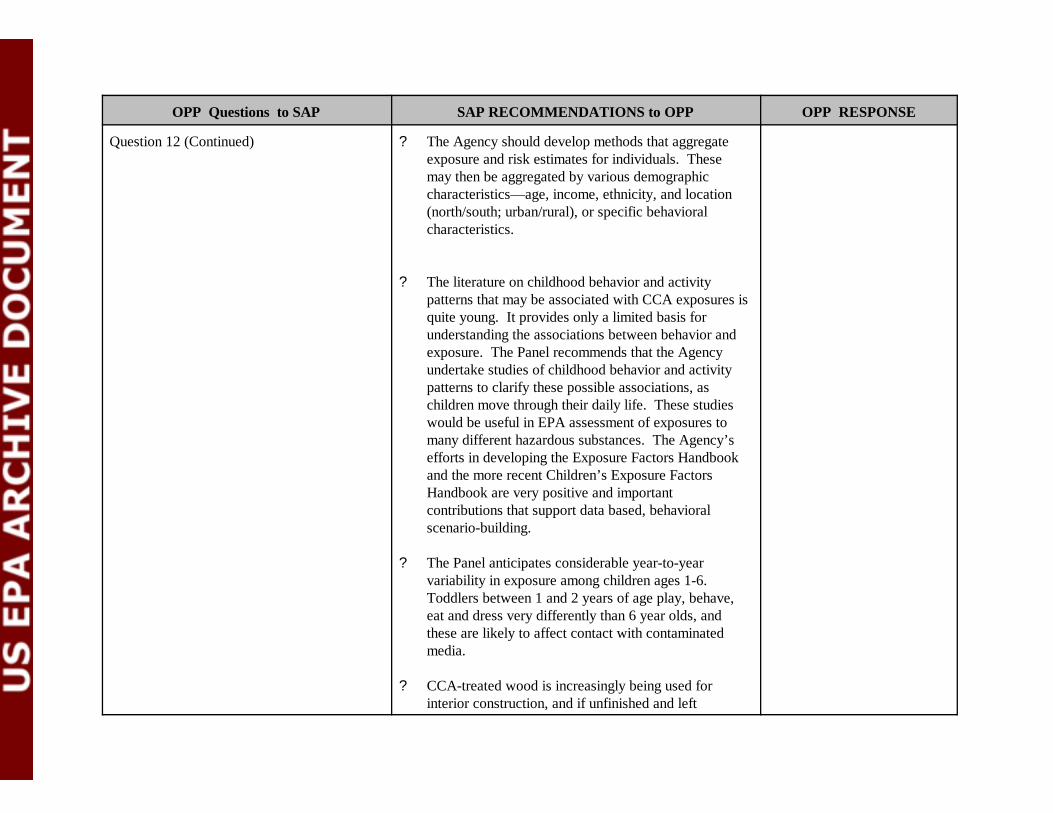
OPP Questions to SAP SAP RECOMMENDATIONS to OPP OPP RESPONSE
Question 12 (Continued) ? The Agency should develop methods that aggregateexposure and risk estimates for individuals. Thesemay then be aggregated by various demographiccharacteristics— age, income, ethnicity, and location(north/south; urban/rural), or specific behavioralcharacteristics.
? The literature on childhood behavior and activitypatterns that may be associated with CCA exposures isquite young. It provides only a limited basis forunderstanding the associations between behavior andexposure. The Panel recommends that the Agencyundertake studies of childhood behavior and activitypatterns to clarify these possible associations, aschildren move through their daily life. These studieswould be useful in EPA assessment of exposures tomany different hazardous substances. The Agency’sefforts in developing the Exposure Factors Handbookand the more recent Children’s Exposure FactorsHandbook are very positive and importantcontributions that support data based, behavioralscenario-building.
? The Panel anticipates considerable year-to-yearvariability in exposure among children ages 1-6. Toddlers between 1 and 2 years of age play, behave,eat and dress very differently than 6 year olds, andthese are likely to affect contact with contaminatedmedia.
? CCA-treated wood is increasingly being used forinterior construction, and if unfinished and left
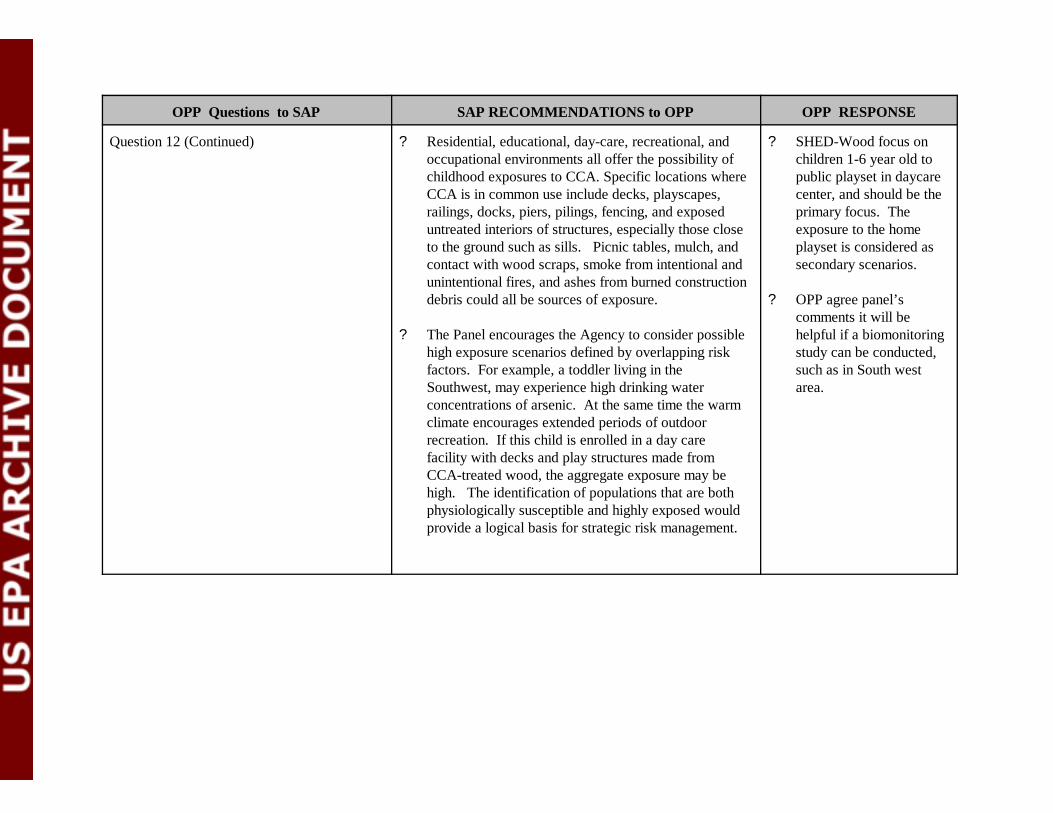
OPP Questions to SAP SAP RECOMMENDATIONS to OPP OPP RESPONSE
Question 12 (Continued) ? Residential, educational, day-care, recreational, andoccupational environments all offer the possibility ofchildhood exposures to CCA. Specific locations whereCCA is in common use include decks, playscapes,railings, docks, piers, pilings, fencing, and exposeduntreated interiors of structures, especially those closeto the ground such as sills. Picnic tables, mulch, andcontact with wood scraps, smoke from intentional andunintentional fires, and ashes from burned constructiondebris could all be sources of exposure.
? The Panel encourages the Agency to consider possiblehigh exposure scenarios defined by overlapping riskfactors. For example, a toddler living in theSouthwest, may experience high drinking waterconcentrations of arsenic. At the same time the warmclimate encourages extended periods of outdoorrecreation. If this child is enrolled in a day carefacility with decks and play structures made fromCCA-treated wood, the aggregate exposure may behigh. The identification of populations that are bothphysiologically susceptible and highly exposed wouldprovide a logical basis for strategic risk management.
? SHED-Wood focus onchildren 1-6 year old topublic playset in daycarecenter, and should be theprimary focus. Theexposure to the homeplayset is considered assecondary scenarios.
? OPP agree panel’scomments it will behelpful if a biomonitoringstudy can be conducted,such as in South westarea.
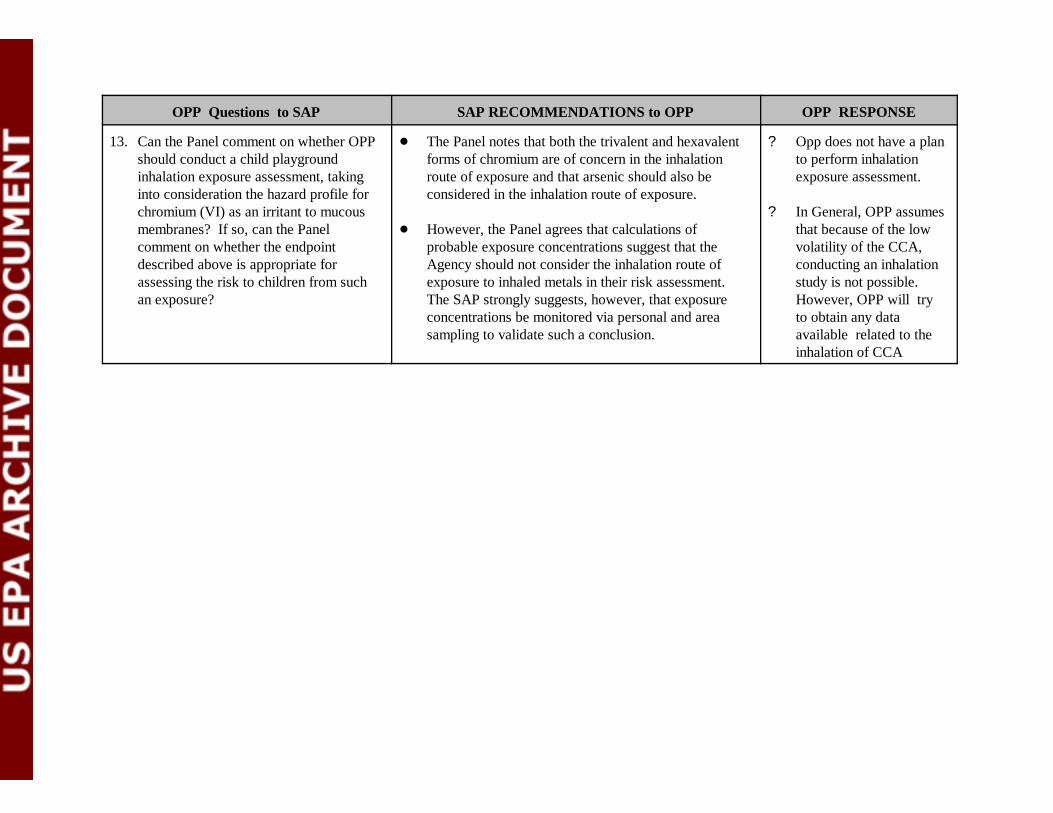
OPP Questions to SAP SAP RECOMMENDATIONS to OPP OPP RESPONSE
13. Can the Panel comment on whether OPPshould conduct a child playgroundinhalation exposure assessment, takinginto consideration the hazard profile forchromium (VI) as an irritant to mucousmembranes? If so, can the Panelcomment on whether the endpointdescribed above is appropriate forassessing the risk to children from suchan exposure?
! The Panel notes that both the trivalent and hexavalentforms of chromium are of concern in the inhalationroute of exposure and that arsenic should also beconsidered in the inhalation route of exposure.
! However, the Panel agrees that calculations ofprobable exposure concentrations suggest that theAgency should not consider the inhalation route ofexposure to inhaled metals in their risk assessment. The SAP strongly suggests, however, that exposureconcentrations be monitored via personal and areasampling to validate such a conclusion.
? Opp does not have a planto perform inhalationexposure assessment.
? In General, OPP assumesthat because of the lowvolatility of the CCA,conducting an inhalationstudy is not possible. However, OPP will tryto obtain any dataavailable related to theinhalation of CCA
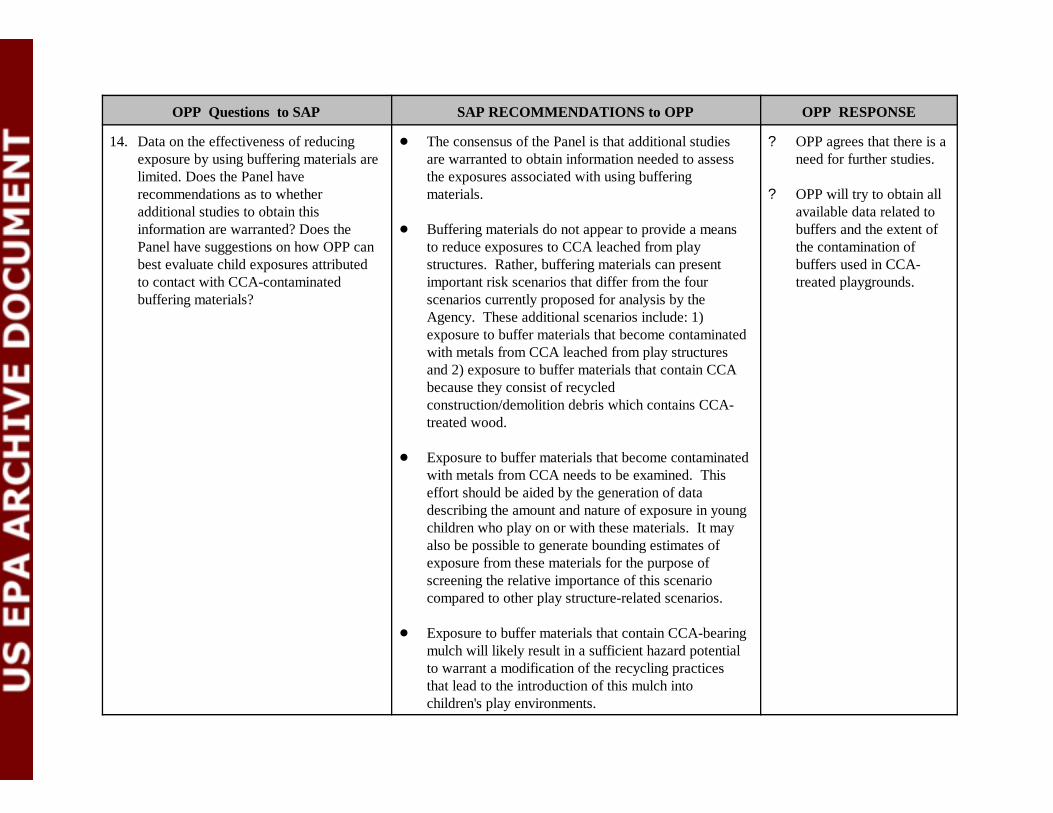
OPP Questions to SAP SAP RECOMMENDATIONS to OPP OPP RESPONSE
14. Data on the effectiveness of reducingexposure by using buffering materials arelimited. Does the Panel haverecommendations as to whetheradditional studies to obtain thisinformation are warranted? Does thePanel have suggestions on how OPP canbest evaluate child exposures attributedto contact with CCA-contaminatedbuffering materials?
! The consensus of the Panel is that additional studiesare warranted to obtain information needed to assessthe exposures associated with using bufferingmaterials.
! Buffering materials do not appear to provide a meansto reduce exposures to CCA leached from playstructures. Rather, buffering materials can presentimportant risk scenarios that differ from the fourscenarios currently proposed for analysis by theAgency. These additional scenarios include: 1)exposure to buffer materials that become contaminatedwith metals from CCA leached from play structuresand 2) exposure to buffer materials that contain CCAbecause they consist of recycledconstruction/demolition debris which contains CCA-treated wood.
! Exposure to buffer materials that become contaminatedwith metals from CCA needs to be examined. Thiseffort should be aided by the generation of datadescribing the amount and nature of exposure in youngchildren who play on or with these materials. It mayalso be possible to generate bounding estimates ofexposure from these materials for the purpose ofscreening the relative importance of this scenariocompared to other play structure-related scenarios.
! Exposure to buffer materials that contain CCA-bearingmulch will likely result in a sufficient hazard potentialto warrant a modification of the recycling practicesthat lead to the introduction of this mulch intochildren's play environments.
? OPP agrees that there is aneed for further studies.
? OPP will try to obtain allavailable data related tobuffers and the extent ofthe contamination ofbuffers used in CCA-treated playgrounds.
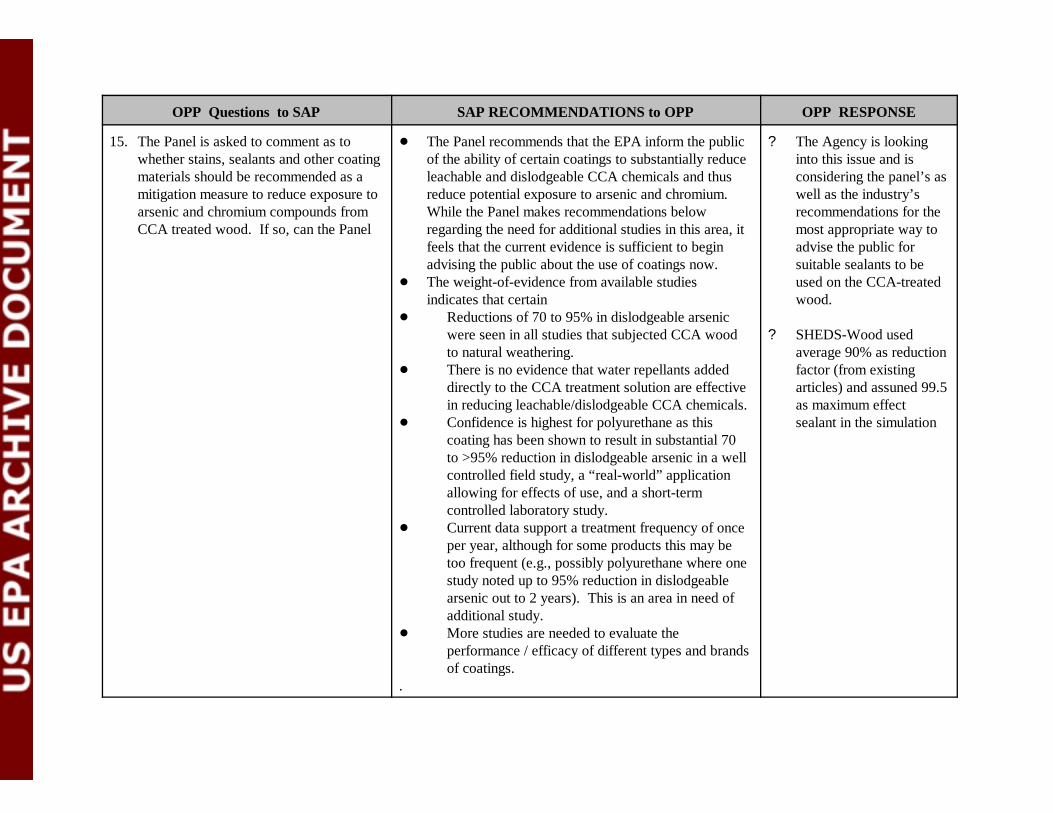
OPP Questions to SAP SAP RECOMMENDATIONS to OPP OPP RESPONSE
15. The Panel is asked to comment as towhether stains, sealants and other coatingmaterials should be recommended as amitigation measure to reduce exposure toarsenic and chromium compounds fromCCA treated wood. If so, can the Panel
! The Panel recommends that the EPA inform the publicof the ability of certain coatings to substantially reduceleachable and dislodgeable CCA chemicals and thusreduce potential exposure to arsenic and chromium. While the Panel makes recommendations belowregarding the need for additional studies in this area, itfeels that the current evidence is sufficient to beginadvising the public about the use of coatings now.
! The weight-of-evidence from available studiesindicates that certain
! Reductions of 70 to 95% in dislodgeable arsenicwere seen in all studies that subjected CCA woodto natural weathering.
! There is no evidence that water repellants addeddirectly to the CCA treatment solution are effectivein reducing leachable/dislodgeable CCA chemicals.
! Confidence is highest for polyurethane as thiscoating has been shown to result in substantial 70to >95% reduction in dislodgeable arsenic in a wellcontrolled field study, a “real-world” applicationallowing for effects of use, and a short-termcontrolled laboratory study.
! Current data support a treatment frequency of onceper year, although for some products this may betoo frequent (e.g., possibly polyurethane where onestudy noted up to 95% reduction in dislodgeablearsenic out to 2 years). This is an area in need ofadditional study.
! More studies are needed to evaluate theperformance / efficacy of different types and brandsof coatings.
.
? The Agency is lookinginto this issue and isconsidering the panel’s aswell as the industry’srecommendations for themost appropriate way toadvise the public forsuitable sealants to beused on the CCA-treatedwood.
? SHEDS-Wood usedaverage 90% as reductionfactor (from existingarticles) and assuned 99.5as maximum effectsealant in the simulation
Appendix G
Effect of Hand Washing on Risks from Exposure to Residues
Effect of Hand Washing on Risks from Exposure to Residues
November 7, 2003
The effect of hand washing on risk from residue only exposure was examined. Twopathways, dermal absorption and ingestion, were summed to determine the risk due to residueonly exposure. Comparisons were then made for this residue risk between baseline and the handwashing mitigation scenario for playsets alone and deck and playset exposure. Results arepresented in bar charts for the 50th and 95th percentiles. The results at the 99th percentile aresomewhat unstable so they are not presented. Figure 1 is for playset only exposure and Figure 2 isfor playset and deck exposure. For playset only exposure, residue risks with hand washing werereduced by approximately 36% at the median and slightly more (48%) at the 95th percentile. Forplayset and deck exposure these differences are less. At the median, playset and deck residue riskunder baseline conditions were reduced by approximately 27%; at the 95th percentile they werereduced by 35%.
When total risk is calculated by combining residue and soil risk the effect of hand washingis less. Table 1 shows a comparison for total risk between baseline and the hand washingmitigation scenario. For playset only exposure the difference between baseline and hand washingat the 50th and 95th percentiles is 32% and 45%, respectively. For playset and deck exposure, risksare reduced by 22% and 29% at these same percentiles. See Zartarian et al. (2003) for a morecomplete description of the hand washing scenario.
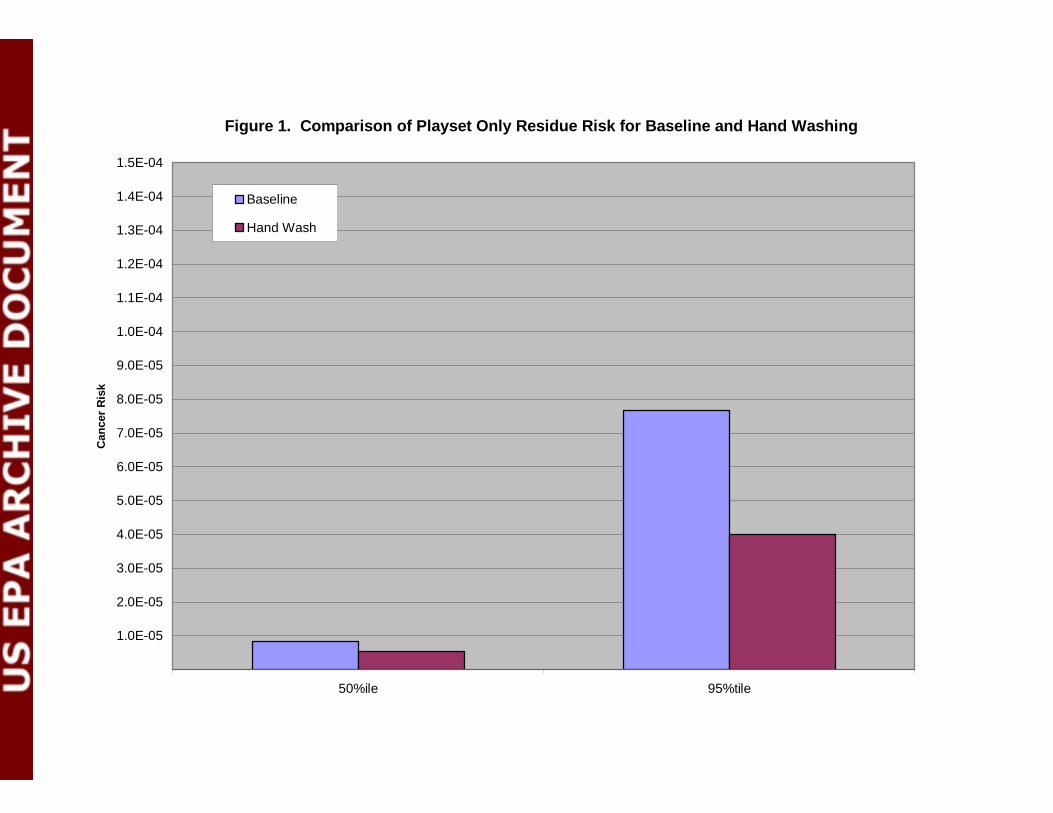
Figure 1. Comparison of Playset Only Residue Risk for Baseline and Hand Washing
0.0E+00
1.0E-05
2.0E-05
3.0E-05
4.0E-05
5.0E-05
6.0E-05
7.0E-05
8.0E-05
9.0E-05
1.0E-04
1.1E-04
1.2E-04
1.3E-04
1.4E-04
1.5E-04
50%ile 95%tile
Can
cer
Ris
k
Baseline
Hand Wash
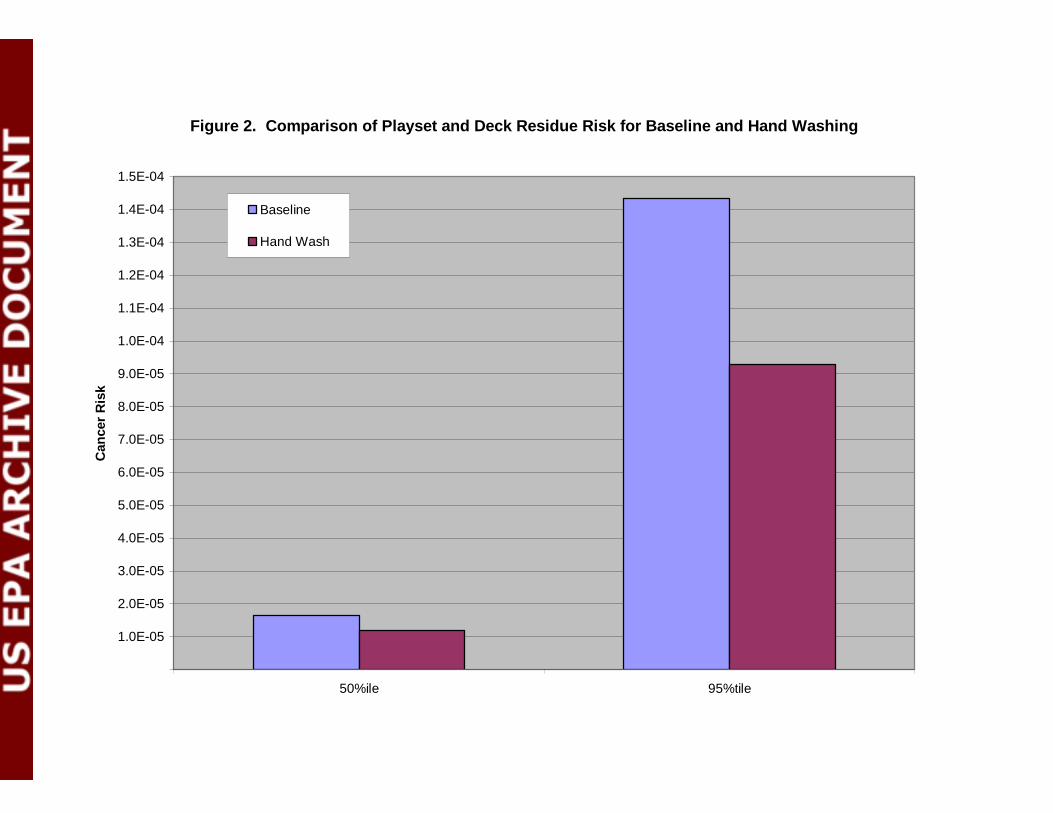
Figure 2. Comparison of Playset and Deck Residue Risk for Baseline and Hand Washing
0.0E+00
1.0E-05
2.0E-05
3.0E-05
4.0E-05
5.0E-05
6.0E-05
7.0E-05
8.0E-05
9.0E-05
1.0E-04
1.1E-04
1.2E-04
1.3E-04
1.4E-04
1.5E-04
50%ile 95%tile
Can
cer
Ris
k
Baseline
Hand Wash
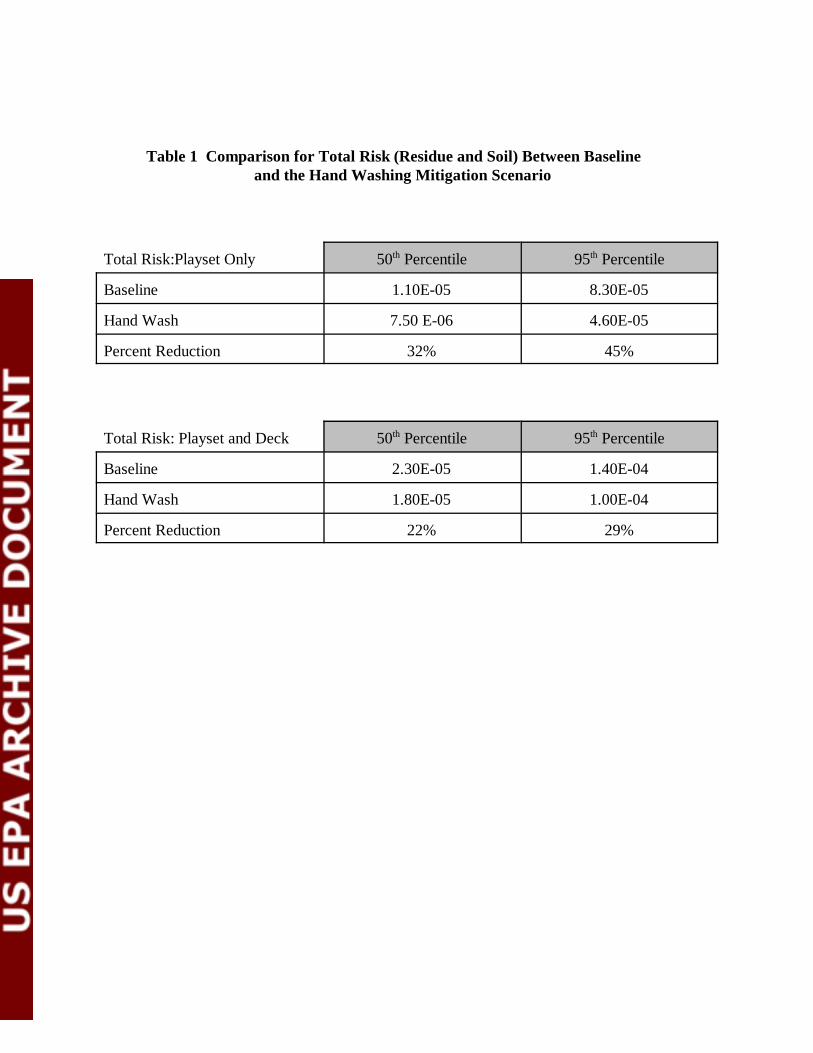
Table 1 Comparison for Total Risk (Residue and Soil) Between Baseline and the Hand Washing Mitigation Scenario
Total Risk:Playset Only 50th Percentile 95th Percentile
Baseline 1.10E-05 8.30E-05
Hand Wash 7.50 E-06 4.60E-05
Percent Reduction 32% 45%
Total Risk: Playset and Deck 50th Percentile 95th Percentile
Baseline 2.30E-05 1.40E-04
Hand Wash 1.80E-05 1.00E-04
Percent Reduction 22% 29%
![End-to-end training of deep probabilistic CCA on paired ...auai.org › uai2019 › proceedings › papers › 340.pdf · [Ngiam et al., 2011]. However, a multimodal autoen-coder](https://img.pdfslide.us/doc/110x75/5f174ceaa58077769c43a3b3/end-to-end-training-of-deep-probabilistic-cca-on-paired-auaiorg-a-uai2019.jpg)