Embed Size (px)
Citation preview

A Probabilistic Model of Redundancy in Information Extraction
University of Washington
Department of Computer Science and Engineering
http://www.cs.washington.edu/research/knowitall
Doug Downey, Oren Etzioni, Stephen Soderland
2
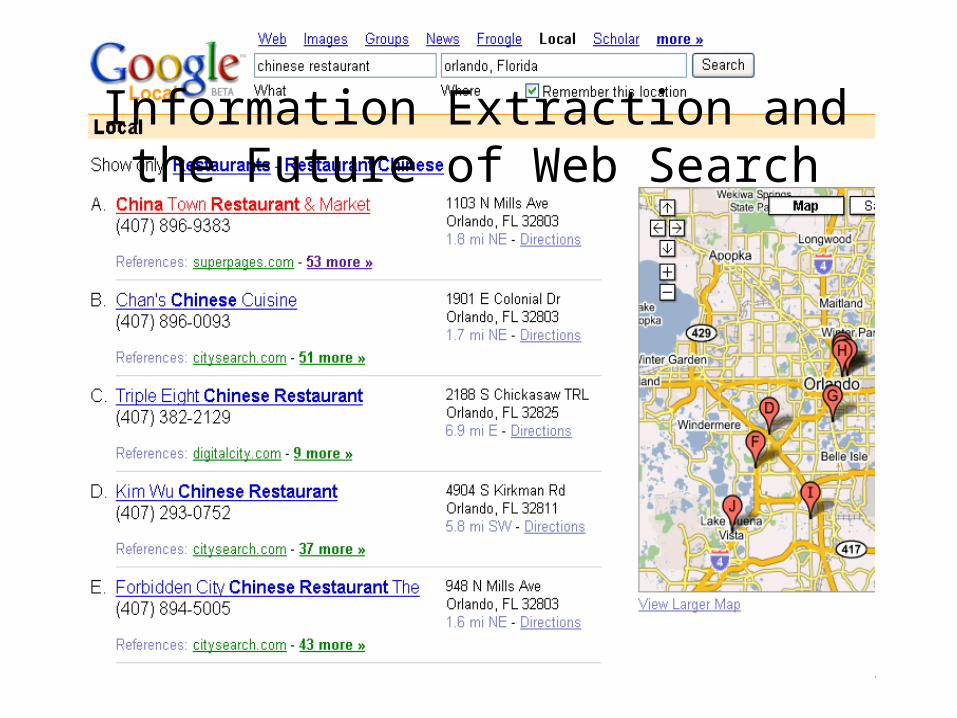
Information Extraction and the Future of Web Search

3
Motivation for Web IE
• What universities have active biotech research and in what departments?
• What percentage of the reviews of the Thinkpad T-40 are positive?
The answer is not on any single Web page!

4
Review: Unsupervised Web IE
Goal: Extract information on any subject automatically.

5
Review: Extraction Patterns
Generic extraction patterns (Hearst ’92):• “…Cities such as Boston, Los Angeles, and
Seattle…”(“C such as NP1, NP2, and NP3”) => IS-A(each(head(NP)), C), …
• “Detailed information for several countries such as maps, …” ProperNoun(head(NP))
• “I listen to pretty much all music but prefer country such as Garth Brooks”

6
“Erik Jonsson, CEO of Texas Instruments, mayor of Dallas from 1964-1971, and…” “Erik Jonsson, CEO of Texas Instruments, mayor of Dallas from 1964-1971, and…”
Binary Extraction Patterns
R(I1, I2) I1, R of I2
Instantiated Pattern:
Ceo(Person, Company) <person> , CEO of <company>
“…Jeff Bezos, CEO of Amazon…”“..Matt Damon, star of The Bourne Supremacy..”

7
Review: Unsupervised Web IE
Goal: Extract information on any subject automatically.
→Generic extraction patterns
Generic patterns can make mistakes.
→Redundancy.
8
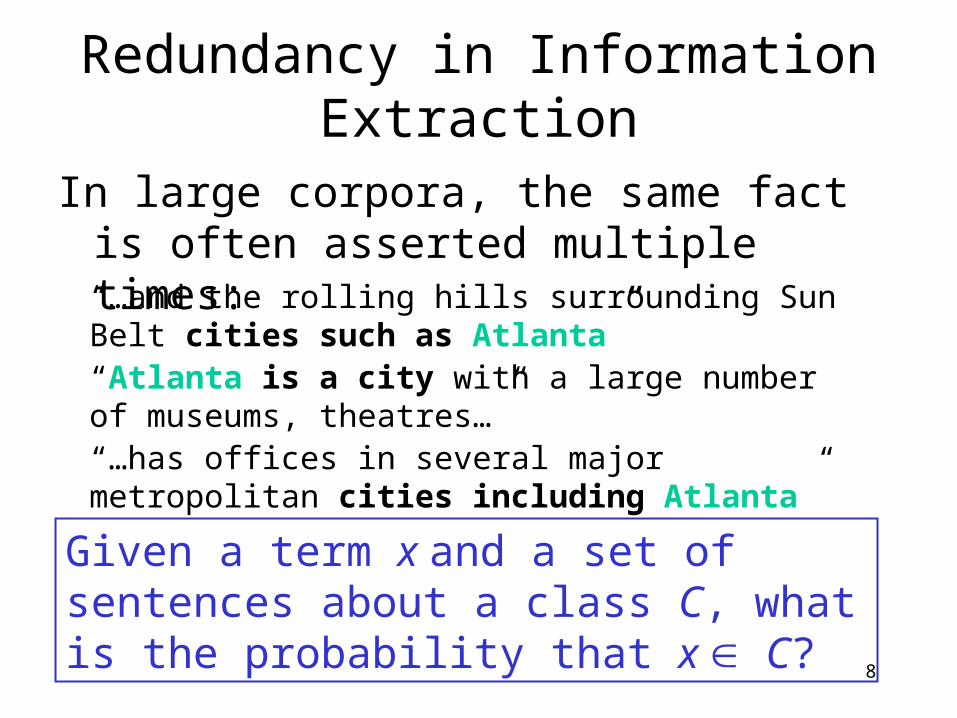
Redundancy in Information Extraction
In large corpora, the same fact is often asserted multiple times:“…and the rolling hills surrounding Sun Belt cities such as Atlanta”“Atlanta is a city with a large number of museums, theatres…”“…has offices in several major metropolitan cities including Atlanta”
Given a term x and a set of sentences about a class C, what is the probability that x C?
9
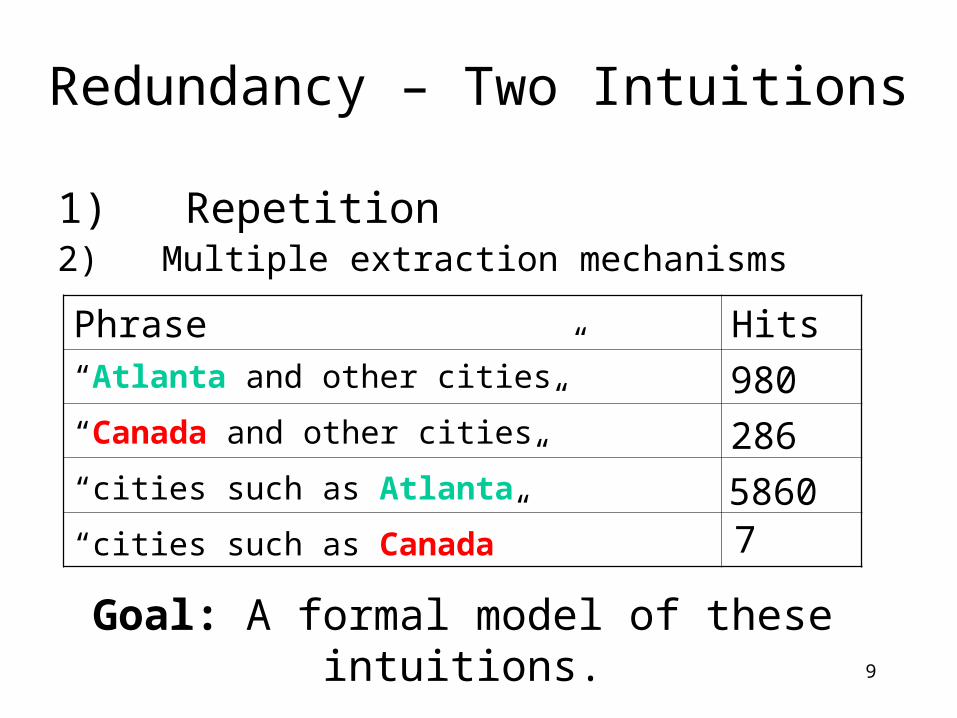
Redundancy – Two Intuitions
2) Multiple extraction mechanismsPhrase Hits
1) Repetition
“Atlanta and other cities” 980“Canada and other cities” 286“cities such as Atlanta” 5860“cities such as Canada” 7
Goal: A formal model of these intuitions.

10
Outline
1. Modeling redundancy – the problem
2. URNS model
3. Parameter estimation for URNS
4. Experimental results
5. Summary
11
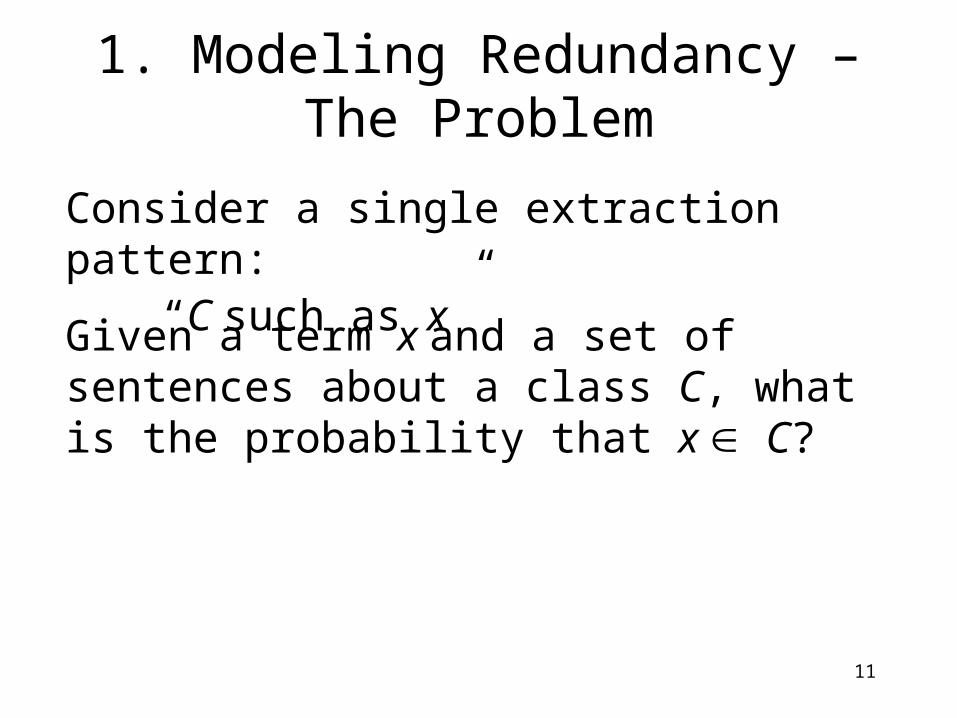
1. Modeling Redundancy – The Problem
Consider a single extraction pattern:“C such as x”
Given a term x and a set of sentences about a class C, what is the probability that x C?

12
1. Modeling Redundancy – The Problem
Consider a single extraction pattern:“C such as x”
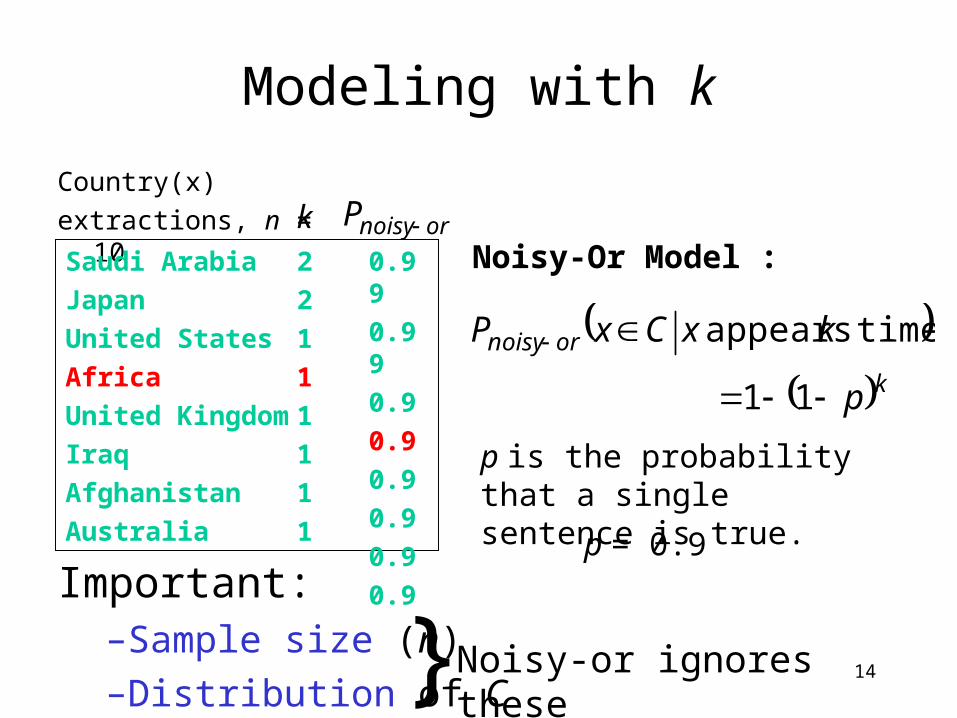
If an extraction x appears k times in a set of n sentences containing this pattern, what is the probability that x C?

13
Modeling with k
“…countries such as Saudi Arabia…”
“…countries such as the United States…”
“…countries such as Saudi Arabia…”
“…countries such as Japan…”
“…countries such as Africa…”
“…countries such as Japan…”
“…countries such as the United Kingdom…”
“…countries such as Iraq…”
“…countries such as Afghanistan…”
“…countries such as Australia…”
Country(x)
extractions, n = 10
14
Modeling with k
Country(x)
extractions, n = 10
Saudi Arabia
Japan
United States
Africa
United Kingdom
Iraq
Afghanistan
Australia
k2
2
1
1
1
1
1
1
Noisy-Or Model :
k
ornoisy
p
kxCxP
11
times appears
p is the probability that a single sentence is true.
ornoisyP 0.99
0.99
0.9
0.9
0.9
0.9
0.9
0.9
Important: –Sample size (n) –Distribution of C }Noisy-or ignores these
p = 0.9

15
Needed in Model: Sample Size
kJapan
Norway
Israil
OilWatch Africa
Religion Paraguay
Chicken Mole
Republics of Kenya
Atlantic Ocean
New Zeland
Country(x)
extractions, n ~50,000 ornoisyP 1723
295
1
1
1
1
1
1
1
0.9999…
0.9999…
0.9
0.9
0.9
0.9
0.9
0.9
0.9
Country(x)
extractions, n = 10
Saudi Arabia
Japan
United States
Africa
United Kingdom
Iraq
Afghanistan
Australia
k2
2
1
1
1
1
1
1
ornoisyP 0.99
0.99
0.9
0.9
0.9
0.9
0.9
0.9
As sample size increases, noisy-or becomes inaccurate.

16
Needed in Model: Distribution of C
nk
freq
p
kxCxP
100011
times appears
kJapan
Norway
Israil
OilWatch Africa
Religion Paraguay
Chicken Mole
Republics of Kenya
Atlantic Ocean
New Zeland
Country(x)
extractions, n ~50,000 ornoisyP 1723
295
1
1
1
1
1
1
1
0.9999…
0.9999…
0.9
0.9
0.9
0.9
0.9
0.9
0.9

17
Needed in Model: Distribution of C
nk
freq
p
kxCxP
100011
times appears
kJapan
Norway
Israil
OilWatch Africa
Religion Paraguay
Chicken Mole
Republics of Kenya
Atlantic Ocean
New Zeland
Country(x)
extractions, n ~50,000
1723
295
1
1
1
1
1
1
1
0.9999…
0.9999…
0.05
0.05
0.05
0.05
0.05
0.05
0.05
freqP

18
Needed in Model: Distribution of C
kToronto
Belgrade
Lacombe
Kent County
Nikki
Ragaz
Villegas
Cres
Northeastwards
City(x)
extractions, n ~50,000
274
81
1
1
1
1
1
1
1
0.9999…
0.98
0.05
0.05
0.05
0.05
0.05
0.05
0.05
freqP
Probability that x C depends on the distribution of C.
kJapan
Norway
Israil
OilWatch Africa
Religion Paraguay
Chicken Mole
Republics of Kenya
Atlantic Ocean
New Zeland
Country(x)
extractions, n ~50,000
1723
295
1
1
1
1
1
1
1
0.9999…
0.9999…
0.05
0.05
0.05
0.05
0.05
0.05
0.05
freqP

19
Outline
1. Modeling redundancy – the problem
2. URNS model
3. Parameter estimation for URNS
4. Experimental results
5. Summary
20
2. The URNS Model – Single Urn

21
2. The URNS Model – Single Urn
U.K.
Sydney
Urn for City(x)
Cairo
Tokyo
Tokyo
Atlanta
Atlanta
Yakima
Utah
U.K.

22
Tokyo
2. The URNS Model – Single Urn
U.K.
Sydney
Urn for City(x)
Cairo
Tokyo
Tokyo
Atlanta
Atlanta
Yakima
Utah
U.K.
…cities such as Tokyo…

23
Single Urn – Formal Definition
C – set of unique target labels
E – set of unique error labels
num(b) – number of balls labeled by b C E
num(B) –distribution giving the number of balls for each label b B.

24
Single Urn Example
num(“Atlanta”) = 2
num(C) = {2, 2, 1, 1, 1}
num(E) = {2, 1}
Estimated from data
U.K.
Sydney
Urn for City(x)
Cairo
Tokyo
Tokyo
Atlanta
Atlanta
Yakima
Utah
U.K.

25
Single Urn: Computing Probabilities
If an extraction x appears k times in a set of n sentences containing a pattern, what is the probability that x C?
26
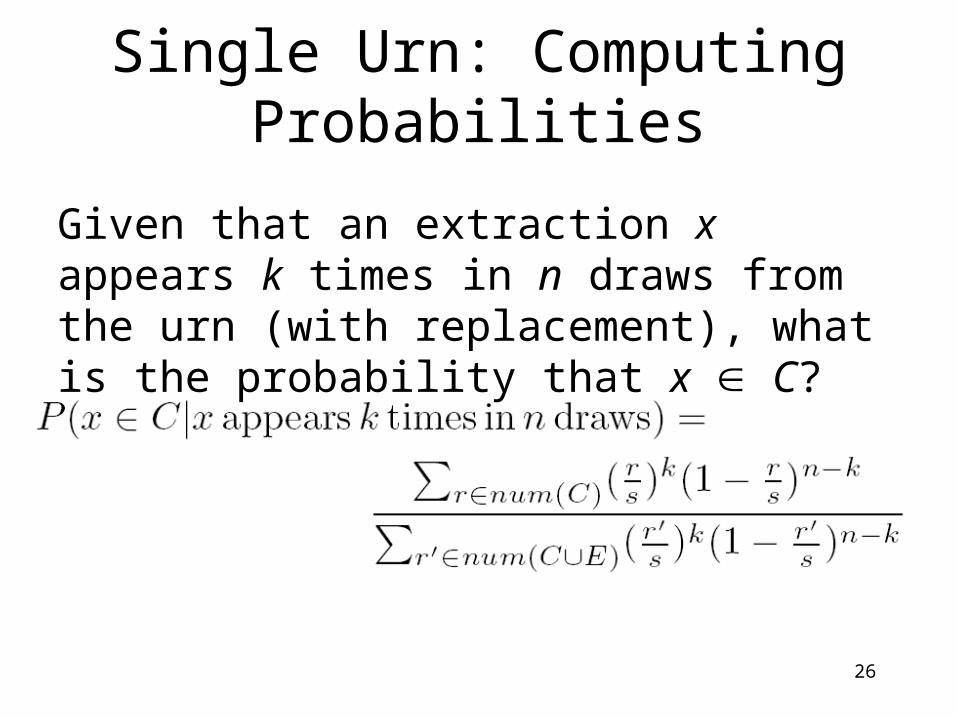
Single Urn: Computing Probabilities
Given that an extraction x appears k times in n draws from the urn (with replacement), what is the probability that x C?

27
Consider the case where num(ci) = RC and num(ej) = RE
for all ci C, ej E
Then:
Then using a Poisson Approximation:
Odds increase exponentially with k, but decrease exponentially with n.
Uniform Special Case

28
The URNS Model – Multiple Urns
Correlation across extraction mechanisms is higher for elements of C than for elements of E.

29
Outline
1. Modeling redundancy – the problem
2. URNS model
3. Parameter estimation for URNS
4. Experimental results
5. Summary

30
Simplifying Assumptions:– Assume that num(C) and num(E) are Zipf
distributed.• Frequency of ith most repeated label in C
– Then num(C) and num(E) are characterized by five parameters:
pECzz EC ,,,,
3. Parameter Estimation for URNS
Czi

31
Supervised Learning– Differential Evolution (maximizing conditional
likelihood)
Unsupervised Learning– Growing interest in IE without hand-tagged
training data (e.g. DIPRE; Snowball; KNOWITALL; Riloff and Jones 1999; Lin, Yangarber, and Grishman 2003)
– How to estimate num(C) and num(E)?
Parameter Estimation

32
Unsupervised Learning– EM, with additional assumptions:
• |E| = 1,000,000
• zE = 1
• p is given (p = 0.9 for KnowItAll patterns)
Unsupervised Parameter Estimation

33
EM for Unsupervised IE:– E-Step: Assign probabilities to extracted facts
using URNS.– M-Step:
1. Estimate zC by linear regression on log-log scale.
2. Set |C| equal to expected number of true labels extracted, plus unseen true labels (using Good-Turing estimation).
EM Process

34
Outline
1. Modeling redundancy – the problem
2. URNS model
3. Parameter estimation for URNS
4. Experimental results
5. Summary

35
Previous Approach: PMI (in KNOWITALL, inspired by Turney, 2001)
PMI(“<City> hotels”, “Tacoma”) =
–Expensive: several hit-count queries per extraction
–Using URNS improves efficiency by ~8x
–‘Bootstrapped’ training data not representative
–Probabilities are polarized (Naïve Bayes)
Tacoma""
hotels" Tacoma"
Hits
Hits
4. Experimental Results

36
0
1
2
3
4
5
City Film Country MayorOf
De
via
tio
n f
rom
ide
al l
og
lik
elih
oo
d
urns
noisy-or
pmi
Unsupervised Likelihood Performance

37
Parameter URNS improvement over:
Noisy-or PMI
zE = 1, | E| = 106,
p = 0.914x 19x
zE = 1.1 15x 19x
zE = 0.9 14x 18x
|E| = 107 13x 18x
|E| = 105 14x 18x
p = 0.95 9x 12x
p = 0.80 8x 11x
URNS Robust to Parameter Changes

38
0
0.1
0.2
0.3
0.4
0.5
0.6
0.7
0.8
0.9
1
Country City Film MayorOfC
las
sif
ica
tio
n E
rro
r
urns
noisy-or
pmi
0
0.1
0.2
0.3
0.4
0.5
0.6
0.7
0.8
0.9
1
Country City Film MayorOf
Cla
ss
ific
ati
on
Err
or
urns
noisy-or
pmi
(False +) = 9(False –)
Loss Functions:
(False +) = (False –)
Classification Accuracy

39
Supervised Results
0
1
2
3
4
5
City Film Country MayorOf
De
via
tio
n f
rom
ide
al l
og
lik
elih
oo
d
urns
noisy-or
logistic regression
SVM
URNS outperforms noisy-or by 19%, logistic regression by 10%, but SVM by less than 1%.

40
Modeling Redundancy – Summary
Given a term x and a set of sentences about a class C, what is the probability that x C?

41
URNS Model of Redundancy in Text Classification
Parameter learning algorithms
Substantially improved performance for Unsupervised IE
Modeling Redundancy – Summary

42
Pattern Learning
City =>– cities such as <City>– <City> and other cities– cities including <City>– <City> is a city, etc.
But what about:– <City> hotels– headquartered in <City>– the greater <City> area, etc.
43
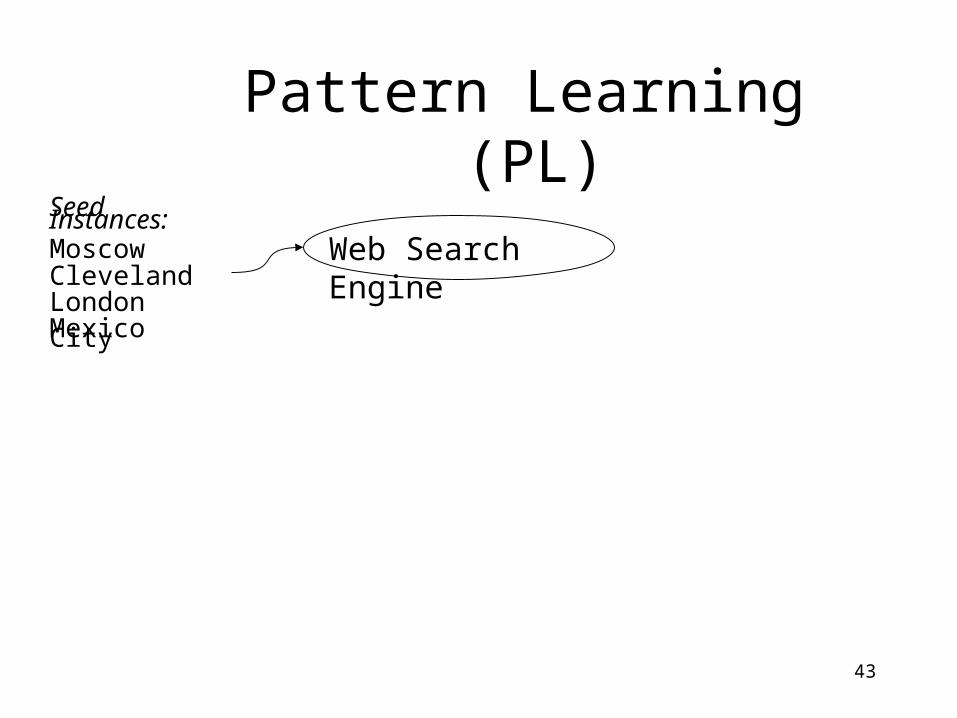
Pattern Learning (PL)Seed Instances:MoscowClevelandLondonMexico City
Web Search Engine

44
Pattern Learning (PL)Seed Instances:MoscowClevelandLondonMexico City
…near the city of Cleveland you can find the …
Web Search Engine
Context Strings:

45
Pattern Learning (PL)Seed Instances:MoscowClevelandLondonMexico City
…near the city of Cleveland you can find the …
Large collection of context strings
Web Search Engine
The “best” patterns:city of <City>
Context Strings:
A pattern is any substring of a context string that includes the seed.
Repeat as desired

46
Which patterns are “best”Both precision and recall are important, but hard to measure.
47
Which patterns are “best”
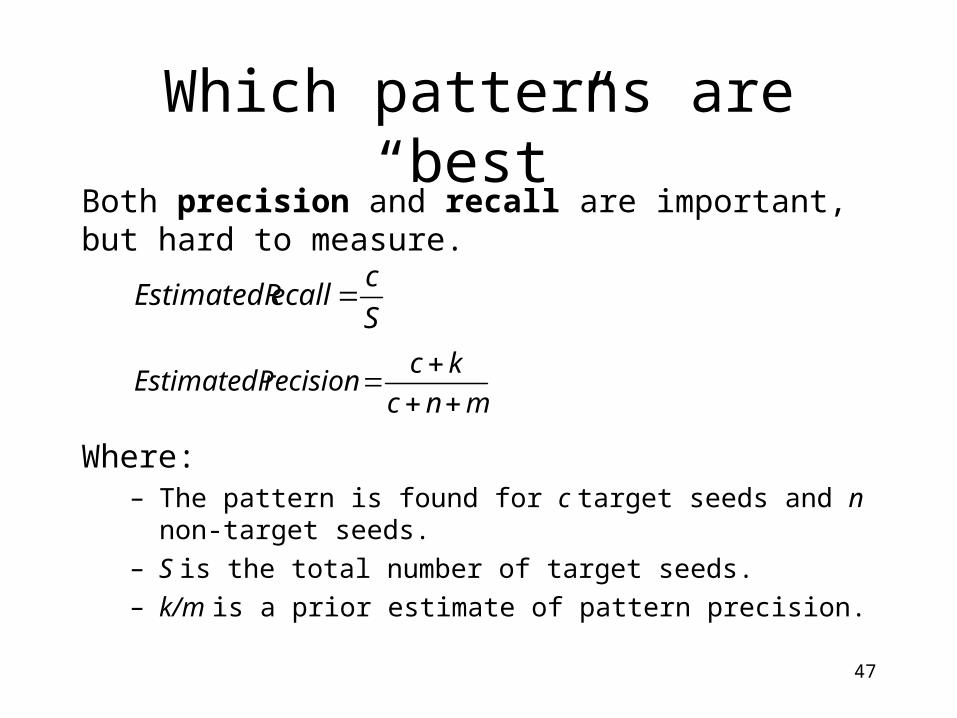
Where:– The pattern is found for c target seeds and n non-target seeds.
– S is the total number of target seeds.
– k/m is a prior estimate of pattern precision.
mnc
kcrecisionEstimatedP
S
cecallEstimatedR
Both precision and recall are important, but hard to measure.

48
Patterns as Extractors and Discriminators
Patterns Pattern Learner
(PL)
Extractors (increase coverage)
Discriminators (increase accuracy)

49
“City”Execute domain-independent extractorse.g. cities such as <City>
Web Search Engine
Parse web pagesCompute PMI with domain-
independent discriminators (e.g. “Tacoma and other cities” has 80 hits)
City(“Tacoma”) with probability 0.998
KnowItAll

50
“City”Execute domain-independent and learned extractorse.g. headquartered in <City>
Web Search Engine
Parse web pagesCompute PMI with domain-
independent or learned discriminators (e.g. “Tacoma hotels” has 42,000 hits)
City(“Tacoma”) with probability 0.998
KnowItAll with Pattern Learning

51
“City”
Web Search Engine
Parse web pages
City(“Tacoma”) with probability 0.998
KnowItAll with Pattern Learning
Experiment 2
Experiment 1Execute domain-independent and learned extractorse.g. headquartered in <City>
Compute PMI with domain-independent or learned discriminators (e.g. “Tacoma hotels” has 42,000 hits)

52
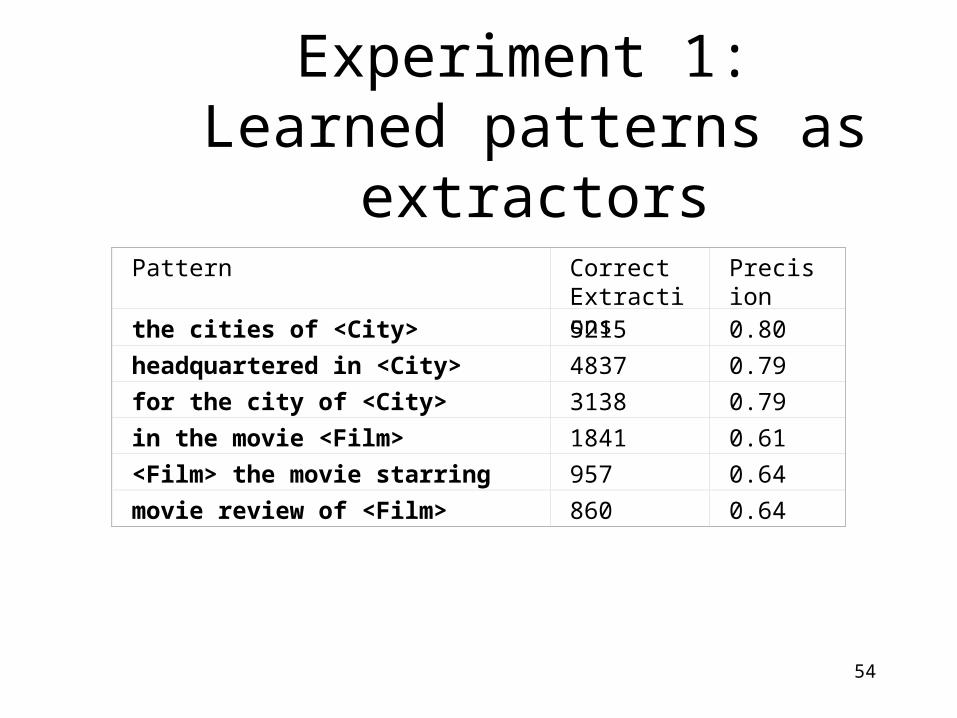
Experiment 1: Learned patterns as extractors
Baseline – KnowItAll with domain independent extractors.
Baseline+PL – KnowItAll with both domain-independent and learned extractors.
In both cases, domain independent discriminators.
We compare coverage – i.e. the number of instances extracted at a fixed level of precision (0.90).

53
Experiment 1: Learned patterns as extractors
Film
Adding PL improves coverage by 50% to 80%.
City
0
2,000
4,000
6,000
8,000
10,000
12,000
14,000
16,000
Baseline Baseline + PL
Nu
mb
er
of
Ins
tan
ce
s
not in baseline
in both
in baseline
0
1,000
2,000
3,000
4,000
5,000
6,000
7,000
Baseline Baseline + PLN
um
ber
of
Inst
ance
s
not in baseline
in both
in baseline
54
Experiment 1: Learned patterns as extractors
Pattern Correct Extractions
Precision
the cities of <City> 5215 0.80
headquartered in <City> 4837 0.79
for the city of <City> 3138 0.79
in the movie <Film> 1841 0.61
<Film> the movie starring 957 0.64
movie review of <Film> 860 0.64

55
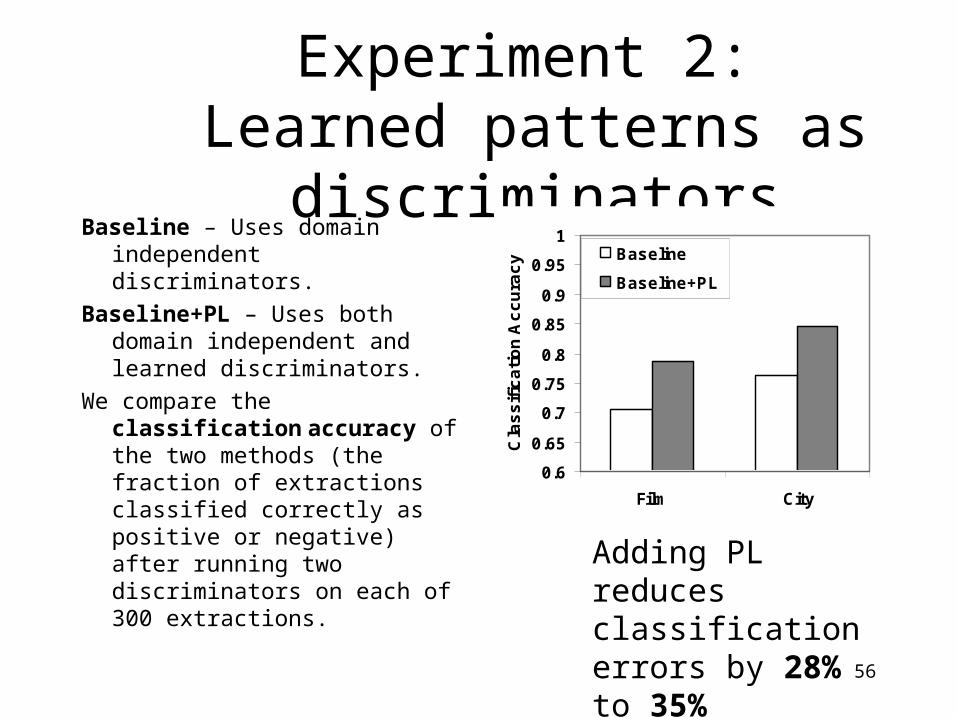
Experiment 2: Learned patterns as discriminators
Baseline – Uses domain independent discriminators.
Baseline+PL – Uses both domain independent and learned discriminators.
We compare the classification accuracy of the two methods (the fraction of extractions classified correctly as positive or negative) after running two discriminators on each of 300 extractions.
56
Experiment 2: Learned patterns as discriminators
Baseline – Uses domain independent discriminators.
Baseline+PL – Uses both domain independent and learned discriminators.
We compare the classification accuracy of the two methods (the fraction of extractions classified correctly as positive or negative) after running two discriminators on each of 300 extractions.
Adding PL reduces classification errors by 28% to 35%
0.6
0.65
0.7
0.75
0.8
0.85
0.9
0.95
1
Film CityC
las
sif
ica
tio
n A
cc
ura
cy Baseline
Baseline+PL

57
Selecting discriminators
In Experiment 2, for each extraction we executed:– a fixed pair of discriminators– choosing those with the highest precision
This approach can be improved.

58
Selecting discriminators
The baseline ordering can be improved in several ways:– Precision and recall are important for accuracy.

59
Selecting discriminators
The baseline ordering can be improved in several ways:– Precision and recall are important for accuracy.– Discriminators can perform better on some extractions
than on others:• E.g. rare extractions:
– A high-precision but rare discriminator might falsely return a PMI a zero (e.g. “cities such as Fort Calhoun” has 0 hits)
– Using a more prevalent discriminator on rare facts could improve accuracy (e.g. “Fort Calhoun hotels” has 20 hits).

60
Selecting discriminators
The baseline ordering can be improved in several ways:– Precision and recall are important for accuracy.– Discriminators can perform better on some extractions
than on others:• E.g. rare extractions:
– A high-precision but rare discriminator might falsely return a PMI a zero (e.g. “cities such as Fort Calhoun” has 0 hits)
– Using a more prevalent discriminator on rare facts could improve accuracy (e.g. “Fort Calhoun hotels” has 20 hits).
– The system should prioritize uncertain extractions.

61
The Discriminator Selection Problem
Goal: given a set of extractions and discriminators, find a policy that maximizes expected accuracy.– Known as “active classification.” Assume
discriminators are conditionally independent (as in Guo, 2002).
The general optimization problem is NP-hard.The MU Heuristic is optimal in important special
cases and improves performance in practice.

62
The MU Heuristic
Greedily choose the action with maximal marginal utility MU:
We can compute MU given – the discriminator’s precision and recall (adjusted according to the
extraction’s hit count) – the system’s current belief in the extraction.
(similar to Etzioni 1991).
action ofcost
accuracyin increase ExpectedMU

63
Experiment 3: Testing the MU Heuristic
As in experiment 2, the Baseline and Baseline+PL configurations execute two discriminators (ordered by precision) on each of 300 extractions.
The MU configurations are constrained to execute the same total number of discriminators (600), but can dynamically choose to execute the discriminator and extraction with highest marginal utility.

64
Experiment 3: Testing the MU Heuristic
Ordering by MU further reduces classification errors by 19% to 35%, for a total error reduction of 47% to 53%.
0.6
0.65
0.7
0.75
0.8
0.85
0.9
0.95
1
Film City
Cla
ss
ific
ati
on
Ac
cu
rac
y
Baseline MU(Baseline+PL)Baseline+PL MU(Baseline+PL)

65
Summary
Pattern Learning– Increased coverage by 50% to 80%.– Decreased errors 28% to 35%.
Theoretical Model– decreased errors an additional 19% to 35%.

66
Extensions to PL
Complex patterns– Syntax (Snow and Ng 2004), Classifiers (Snowball)
– Tend to require good training data
Iteration (Patterns->Seeds->Patterns->….)– (Brin 1998, Agichtein and Gravano 2000, Riloff 1999)
– Scope creep…URNS?

67
Backup

68
Additional Experiments
Normalization/Negative Evidence– Don’t mistake cities for countries, etc (e.g. Lin
et al 2003, Thelen & Riloff 2002)
Learning extraction patterns– E.g. DIPRE, Snowball
Other applications– E.g. PMI applied to synonymy (Turney, 2001)
Future Work
69
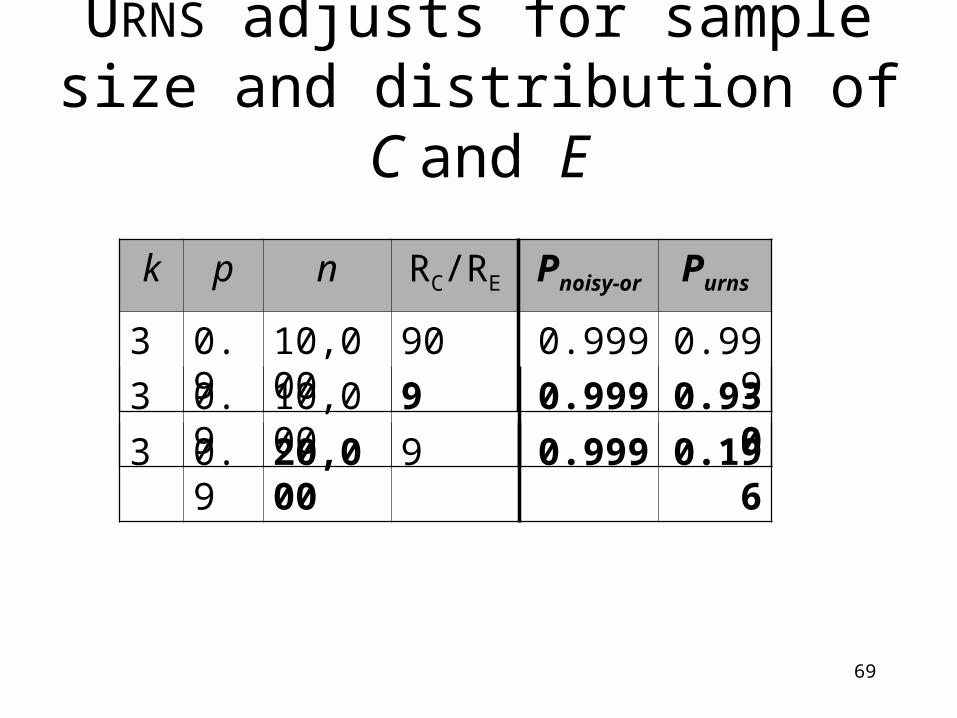
k p n RC/RE Pnoisy-or Purns
3 0.9 10,000 90 0.999 0.999
URNS adjusts for sample size and distribution of C and E
3 0.9 10,000 9 0.999 0.930
3 0.9 20,000 9 0.999 0.196
70
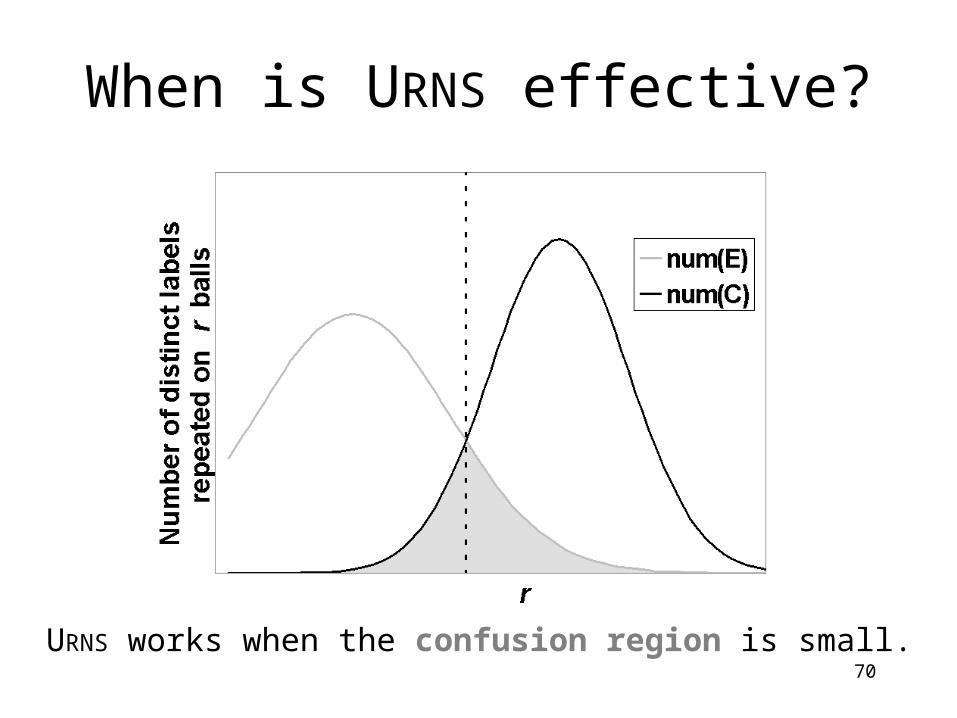
URNS works when the confusion region is small.
When is URNS effective?

71
The URNS Model – Multiple Urns
Phrase Hits“Atlanta and other cities” 980
5860“cities such as Atlanta”6x
“Canada and other cities” 286
“cities such as Canada” 70.02x
Correlation between counts for different extractors is informative.
“Texas and other cities” 4710
“cities such as Texas” 90.002x
72
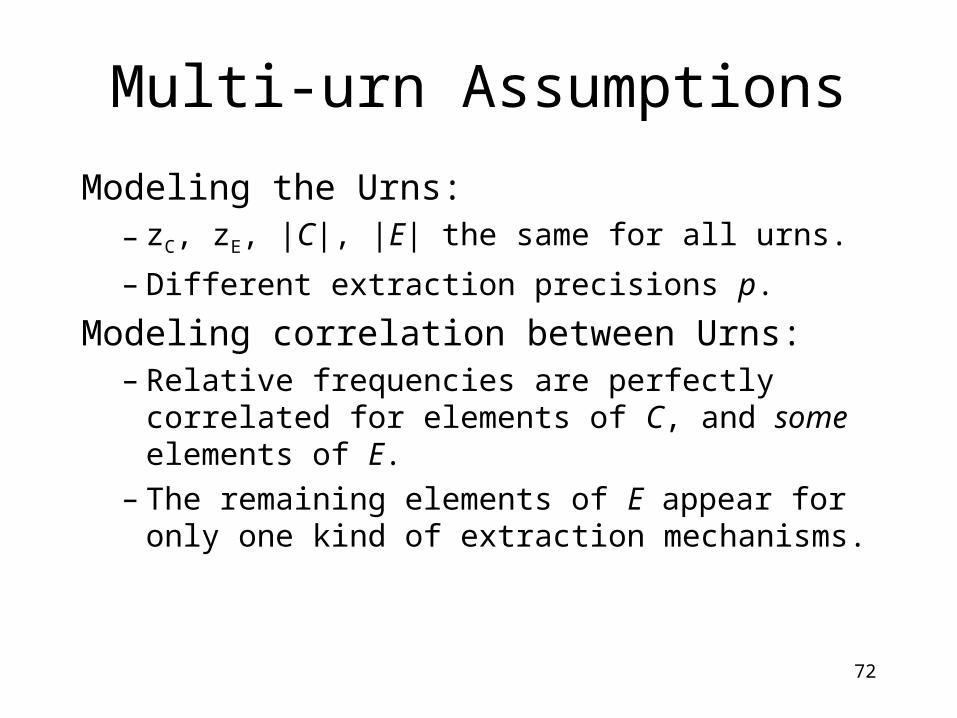
Modeling the Urns:– zC, zE, |C|, |E| the same for all urns.
– Different extraction precisions p.
Modeling correlation between Urns:– Relative frequencies are perfectly correlated for
elements of C, and some elements of E.– The remaining elements of E appear for only
one kind of extraction mechanisms.
Multi-urn Assumptions

73
Am(x, k, m) = Event that extraction x is seen k times in urn m.
Multi-urn Assumptions
ECxMm mmm
CcMm mmim
MM
nkxAP
nkcAP
nnkkxCxP
i
,,
,,
draws,...,in times ,..., appears ||1||1
With our assumptions, we can obtain the above expression in closed form.
74
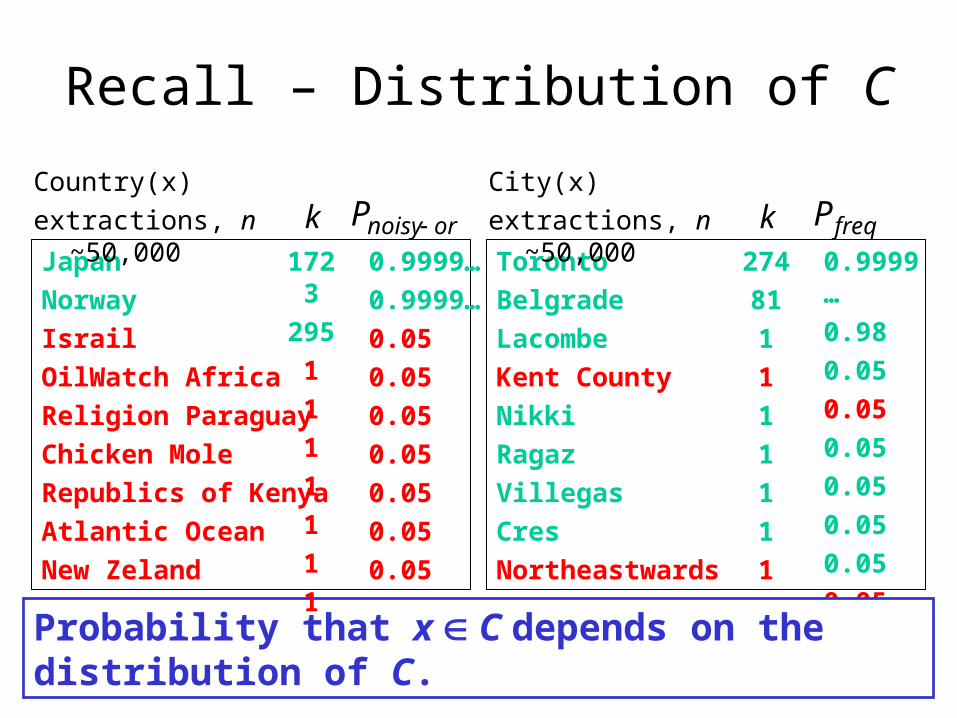
Recall – Distribution of C
kToronto
Belgrade
Lacombe
Kent County
Nikki
Ragaz
Villegas
Cres
Northeastwards
City(x)
extractions, n ~50,000
274
81
1
1
1
1
1
1
1
0.9999…
0.98
0.05
0.05
0.05
0.05
0.05
0.05
0.05
freqP
Probability that x C depends on the distribution of C.
kJapan
Norway
Israil
OilWatch Africa
Religion Paraguay
Chicken Mole
Republics of Kenya
Atlantic Ocean
New Zeland
Country(x)
extractions, n ~50,000 ornoisyP 1723
295
1
1
1
1
1
1
1
0.9999…
0.9999…
0.05
0.05
0.05
0.05
0.05
0.05
0.05

75
Untagged Data
-0.5
0.5
1.5
2.5
3.5
0 1 2 3 4 5
Log(Rank)
Lo
g(k
)
City
Country
A mixture of samples from num(C) and num(E):
Challenge: Estimate num(C), num(E).

76
Redundancy in IE – Heuristics/noisy-or models (e.g. Riloff & Jones 1999; Brin
1998; Agichtien & Gravano 2000; Lin et al. 2003)
– Supervised models (Skounakis & Craven, 2003)
– Do not model n, num(C), num(E)
BLOG models (Milch et al. 2004)– Our focus is on IE/Text Classification; we give
algorithms, experimental results
Related Work

77
CRFs for confidence estimation (Culotta & McCallum, 2004)
– Our interest is combining evidence from multiple extractions.
Related Work

78
Supervised Results
Deviation from the ideal log-likelihood.