Embed Size (px)
Citation preview
A Probabilistic Framework for Car Detection in Imagesusing Context and Scale
David Held, Jesse Levinson and Sebastian Thrun
Abstract— Detecting cars in real-world images is an impor-tant task for autonomous driving, yet it remains unsolved.The system described in this paper takes advantage of contextand scale to build a monocular single-frame image-based cardetector that significantly outperforms the baseline. The systemuses a probabilistic model to combine multiple forms of evidencefor both context and scale to locate cars in a real-world image.We also use scale filtering to speed up our algorithm by afactor of 3.3 compared to the baseline. By using a calibratedcamera and localization on a road map, we are able to obtaincontext and scale information from a single image without theuse of a 3D laser. The system outperforms the baseline byan absolute 9.4% in overall average precision and 11.7% inaverage precision for cars smaller than 50 pixels in height, forwhich context and scale cues are especially important.
I. INTRODUCTIONAutonomous driving is an important task that could poten-
tially save over a million lives each year [1]. However, fullyautonomous driving, especially using affordable sensors,remains an unsolved problem. In order to safely drive onhighways and urban streets, it is important for an autonomoussystem to be aware of the surrounding environment. Toavoid collisions with other vehicles, it is crucial to have asystem that can accurately detect nearby cars. Additionally,for driving at high speeds, detecting cars from a distance isalso important. In this paper, we present an image-based cardetection system using context and scale that significantlyoutperforms the baseline detector on this task.
A number of recent robotics efforts have combined 3Ddepth information with 2D appearance cues for indoor objectdetection. For example, affordable 3D range sensors havebeen used for object detection at close range in indoorenvironments [2]–[4] but these sensors fail at longer rangeand in outdoor environments. Stereo data has been usedto assist object detection [5], but such data is noisy andmost useful at shorter ranges. Multiple frames can also becombined to estimate depth using a structure-from-motionapproach, as in [6] and [7]. Time-of-flight cameras have alsobeen used [8], which provide low resolution images with adepth map at short ranges.
For long ranges in outdoor environments, the Velodynemulti-beam laser has been used successfully for high perfor-mance in both segmentation [9] and track classification [10].However, this laser costs about $80,000 and is thus pro-hibitively expensive for commercial applications such asaffordable autonomous driving.
Manuscript received September 16, 2011.D. Held, J. Levinson, and S. Thrun are with the Computer Science Depart-
ment, Stanford University, Stanford, California 94305 USA {davheld,jessel, thrun}@cs.stanford.edu
Fig. 1. Left: Detections returned by Felzenszwalb’s state-of-the-art cardetector. Note the large number of detections at inappropriate scales and con-texts. Right: Detections returned by our algorithm, combining appearance,scale, and context. Note that the detections are all much more reasonable.False positives are shown in red; true positives are shown in green. Thisfigure was produced by lowering the threshold for illustration purposes. Ata higher threshold, only the correct detections are returned by our method.
In the vision community, some researchers have attemptedto improve object detection by inferring scale from a singleimage, most notably in [11]. However, it is unclear from thiswork how many of the errors are a result of an incorrectscale estimation. For instance, [11] presents an examplein which the windows of a building cause the model toestimate an incorrect location for the horizon line, leadingto poor detection performance. Although the performance isimpressive given their difficult task, in robotics applicationswe can take advantage of external knowledge without havingto infer the scene geometry from visual cues alone.
Over the past decade, there has been a profusion of com-puter vision research using context for object detection [12]–[15]. As with scale, in robotic applications we can use mapscombined with localization to obtain context informationdirectly, without having to infer it from the image.
In this paper, we present a probabilistic model for combin-ing appearance, scale, and context scores for object detectionin images obtained from a robotic framework. Because of theflexibility of our model, we can combine multiple pieces ofevidence for both scale and context without having to infera single understanding of the scene. We are able to obtainscale and context information using only our localizationsystem and a road map, without having to use any sensorsto measure the scale or context directly. We also filter ourimages by scale prior to feature extraction, leading to a
speed up over the baseline of a factor of 3.3. The resultingsystem significantly outperforms the baseline, especially ondistant cars for which context and scale cues are particularlyimportant relative to appearance cues alone.
II. DETECTION SCORES
A. Appearance Model
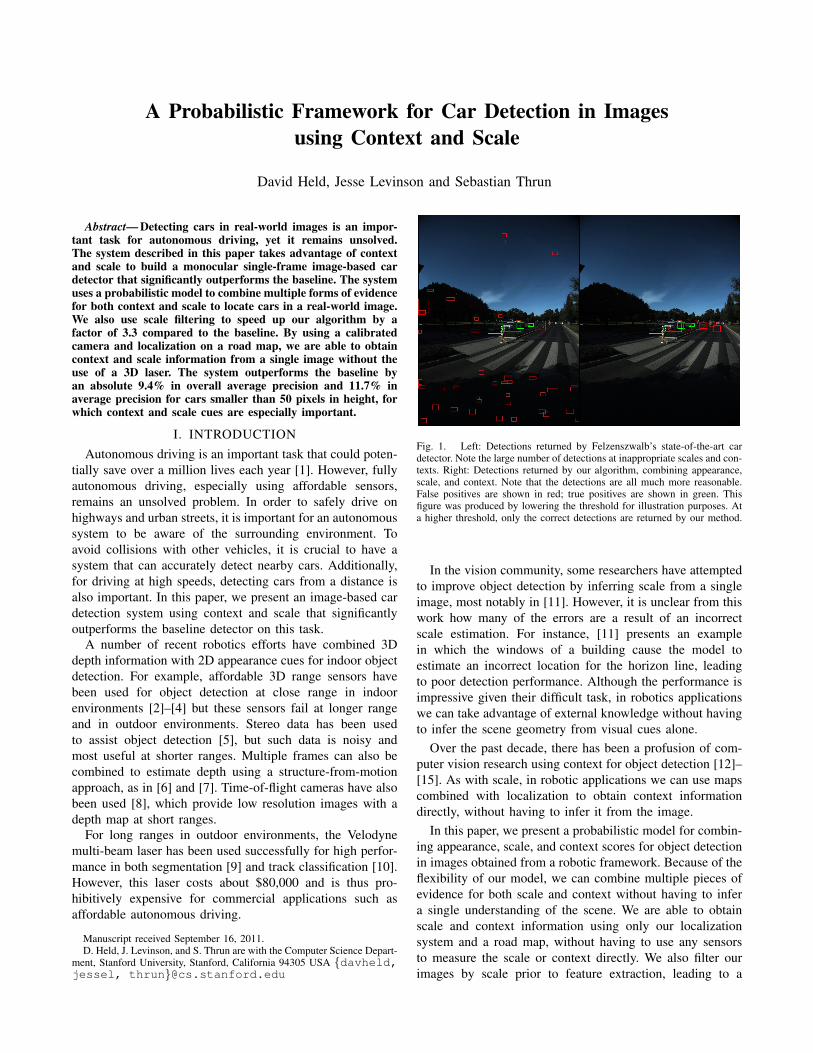
The appearance model we use is Felzenszwalb’s de-formable parts-based model [16], trained on the PASCAL2007 training set. We use the cascade-detection speed-updescribed in [17]. This model comes pre-trained with abaseline car detector [18]. Briefly, the model uses a latentSVM to learn a set of car templates (Figure 2) that represent6 different car orientations. Each orientation consists of a“root” template that roughly corresponds to the outline ofa car, and 6 “part” templates that contain more detailedrepresentations of different sections of a car in an image.Each of these templates is convolved with the gradient ofthe test image at multiple scales, and the locations with highresponses for the root and part templates, in which the parttemplates are reasonably positioned with respect to the root,are declared to be car detections.
Fig. 2. Car models used by the Felzenszwalb appearance model (bestviewed on a computer at high resolution). Left column: Car root templates.Middle column: Car part templates. Right column: Expected position of eachof the parts, relative to the root. Each row represents a car at a differentorientation.
The first step of our algorithm is to run Felzenszwalb’sappearance model on the scale-filtered image, described insection III-A. The result is a set of bounding boxes, eachwith a score which indicates how much the appearance ofthe bounding box matches with that of a car. Note thatbecause of shadows, occlusions, or car types that do notmatch to one of the templates, some cars will get a relativelylow score from our appearance model. Additionally, someobjects that are not cars will get a relatively high score dueto random gradients in the image that happen to align withone of the car templates. To remove these false positiveswithout creating new false negatives, our algorithm uses theappearance score as just one of a set of scores to determinethe final classification for each bounding box.
B. Scale Scores
As shown in Figure 1, using just the appearance modelalone results in many false detections at the wrong scale.For example, the appearance model will return detectionsthat appear close to the camera but are extremely small, anddetections that are far from the camera that are extremelylarge. Both of these are unrealistic given the natural rangeof car sizes in the real world.
To help remove some of these false positives, we computetwo scores for each bounding box based on how scale-appropriate the size of the box is given its location on theimage. The two scores take into account two different sourcesof variance. First, cars come in different shapes and sizes,and the variance in real-world car height causes a similarvariance in the size of cars in the image. Second, errors inelevation, pitch, calibration, and discretization can compoundto lead to an error in the estimated height of an object in theimage. Because of these two different sources of variance, wecompute two scale scores, each of which assumes a differentsource of variance.
To compute the first scale score, we use the camera’sknown position and orientation relative to the ground toestimate the real-world height (in meters) of an objectcontained within a given bounding box in the image. Theimplementation details of this height estimation using ourrobotic system are explained in section IV-A. Next, wecalculate the probability of a real car having this estimatedheight using a probability distribution over car heights. Inthis case, we assume that cars have a mean height of 1.6 mwith a standard deviation of 0.4 m. The computed probabilityis rescaled from 0 to 1 and the resulting value is used as ascale score. This score predicts the scale-appropriateness of agiven bounding box, while taking into account the real-worldvariance in car heights.
We also add a second score to take into account the vari-ance caused by errors in our height estimation. To calculatethis score, we first compute the expected height h, in pixels,of a car that is 1.6 m tall and located at the location of thebounding box in the image. We then estimate that, becauseof errors in our prediction, the actual size (in pixels) of abounding box from a car of this height might be modeledby a Gaussian distribution, with a mean of h and a standarddeviation of 20 pixels. Using this distribution, we computethe probability that a car projected into the image will bethe size of our bounding box, given our estimated distanceto this bounding box. We scale the result to range from 0 to1. Using these two scores, we can prune away false positivesthat appear at unrealistic scales for cars in images.
C. Context Scores
Figure 1 also demonstrates that the appearance model of-ten detects cars located at unrealistic positions in the image,such as in the sky or inside a tree. Because our autonomousvehicle already requires a road map for navigation, we canuse this road map, and our known position and orientation onthis map, to automatically estimate the position of the road
in an image. The implementation details of this computationfor our robotic system are described in section IV-B.
Using the estimated position of the road in an image, wewould like to give a low weight to detections located atunlikely positions. Note that, because we are giving a higherweight to cars cars located on the road, we are less likely todetect cars parked on the grass or in a nearby parking lot. Forour application, this is acceptable or even desired, becausewe wish to use this car detector to locate other cars on ornear the road, in order to avoid accidents while driving.
As with scale, we compute two context scores, to takeinto account two sources of variance. First, a car might notalways be driving in the middle of the road, but rather itmight be driving in the shoulder of the road. Second, errorsin calibration might cause our system to incorrectly estimatewhich parts of the image contain the road. Thus we addtwo context scores, each of which will take into account adifferent source of variance.
The first context score takes into account the variance fromcars pulled over to the side of the road, or otherwise notdriving in the center of the road. To compute this contextscore, we first estimate the location of the bounding box inglobal coordinates. To do this, we assume that the bottomcenter pixel of the bounding box is a point on the ground. Wethen use our localization system and our calibrated camerato estimate the global coordinates of the object containedwithin this bounding box. Using this estimated real-worldposition, we then estimate the distance in meters to thenearest road using a quadtree road network system. Theimplementation details are further described in section IV-B. Using this distance, we compute the first context scoreas
scorem =1
dm + 1
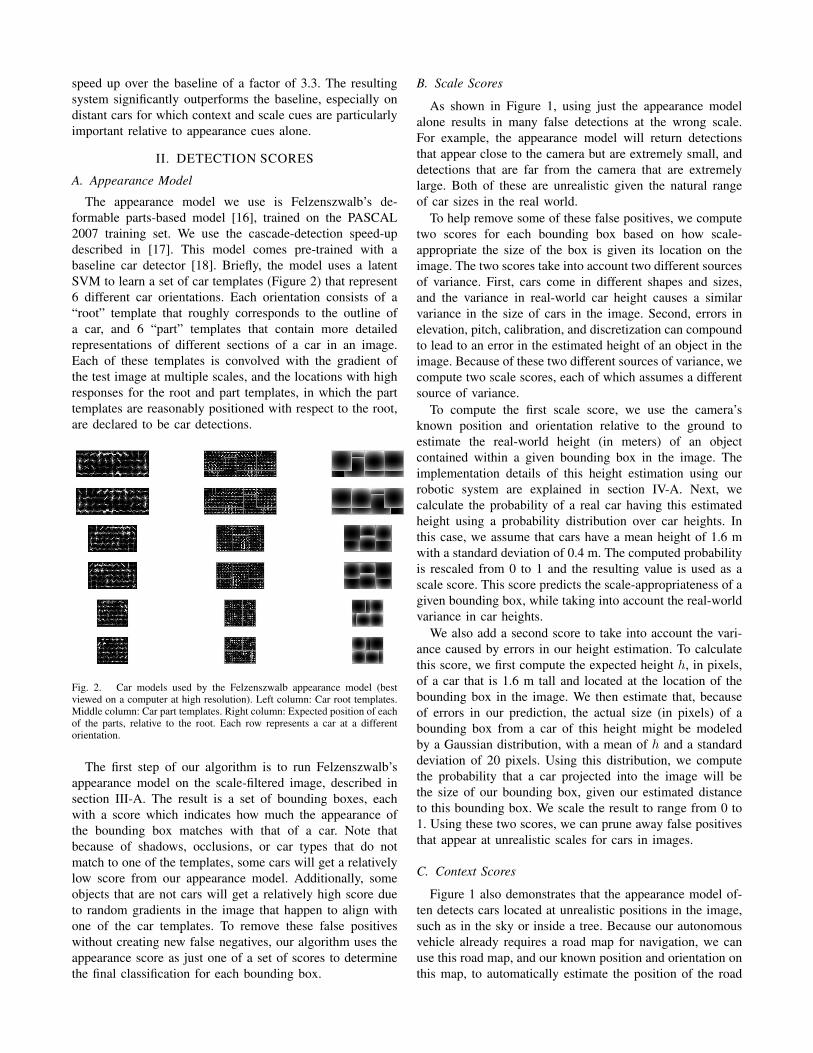
where dm is the estimated distance in meters to the nearestroad. When the bounding box is located on the road, we havedm = 0, leading to a score of 1. For cars located to the sideof the road, the score decreases slowly to 0. This score canbe visualized in Figure 3.
Fig. 3. Left: car image. Middle: Context score, based on the estimateddistance to road in meters. Right: Context score, based on the estimateddistance to road in pixels. Brighter parts indicate a higher context score;darker parts indicate a lower context score.
On the other hand, errors in localization might cause usto incorrectly estimate the position of the road in the image.
To account for these types of errors, we add another contextscore in which we estimate the distance in pixels, dp, fromthe bounding box to the nearest road pixel. This context scoreis now computed as
scorep =1
dp + 1
This score can be visualized in Figure 3. Note that bothof the context scores are computed automatically using ourlocalized position on a road map and our calibrated camera.
III. ALGORITHM
A. Scale Filtering
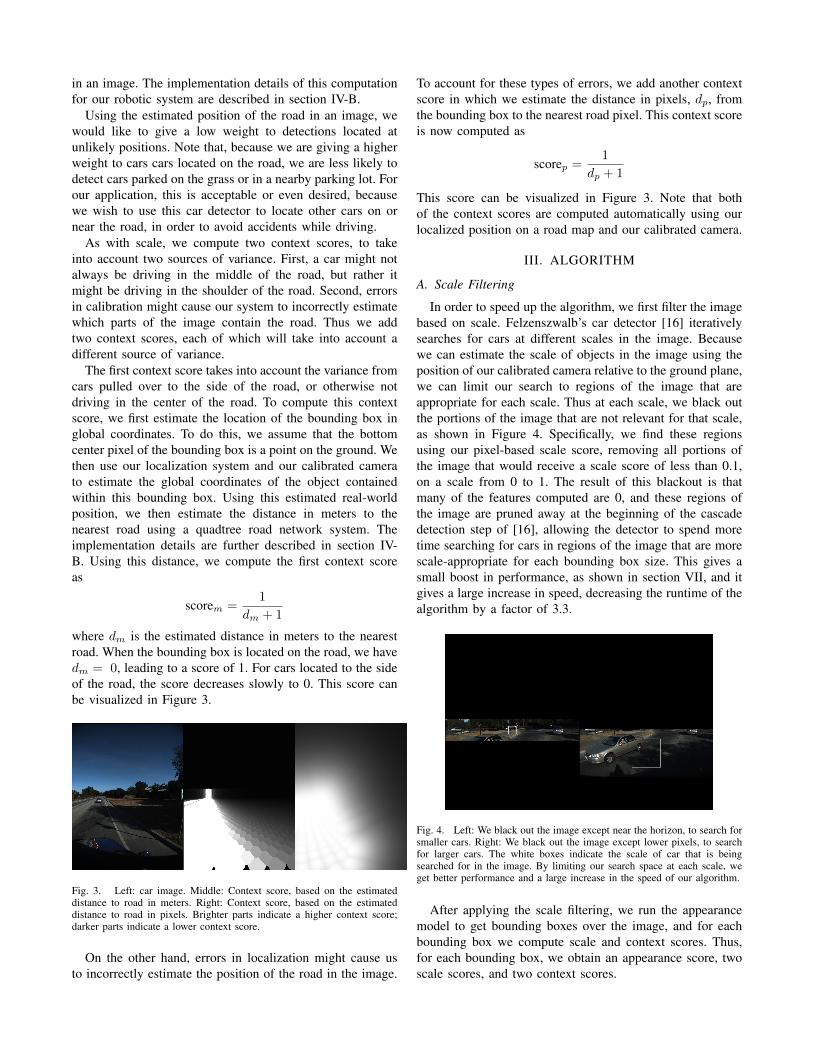
In order to speed up the algorithm, we first filter the imagebased on scale. Felzenszwalb’s car detector [16] iterativelysearches for cars at different scales in the image. Becausewe can estimate the scale of objects in the image using theposition of our calibrated camera relative to the ground plane,we can limit our search to regions of the image that areappropriate for each scale. Thus at each scale, we black outthe portions of the image that are not relevant for that scale,as shown in Figure 4. Specifically, we find these regionsusing our pixel-based scale score, removing all portions ofthe image that would receive a scale score of less than 0.1,on a scale from 0 to 1. The result of this blackout is thatmany of the features computed are 0, and these regions ofthe image are pruned away at the beginning of the cascadedetection step of [16], allowing the detector to spend moretime searching for cars in regions of the image that are morescale-appropriate for each bounding box size. This gives asmall boost in performance, as shown in section VII, and itgives a large increase in speed, decreasing the runtime of thealgorithm by a factor of 3.3.
Fig. 4. Left: We black out the image except near the horizon, to search forsmaller cars. Right: We black out the image except lower pixels, to searchfor larger cars. The white boxes indicate the scale of car that is beingsearched for in the image. By limiting our search space at each scale, weget better performance and a large increase in the speed of our algorithm.
After applying the scale filtering, we run the appearancemodel to get bounding boxes over the image, and for eachbounding box we compute scale and context scores. Thus,for each bounding box, we obtain an appearance score, twoscale scores, and two context scores.
B. Probabilistic Framework
Using the appearance, scale, and context scores describedin section II, we compute a new prediction for each boundingbox using the dual form of L2-regularized logistic regression.This regression is trained using our training set, describedbelow. Our training set contains 282,283 negative exam-ples and only 2,180 positive examples. Because of thislarge imbalance, we weight the C parameter differentlyacross the different classes. For the negative class, we useC0 = 0.007664 ∗ C and for the positive class we useC1 = 0.992336 ∗ C, thereby weighting the loss differentlyfor positive and negative training examples to counter theimbalance in the class sizes. We choose a C value of 10,000from cross-validation by holding out 20% of our training setfor parameter tuning. After choosing C, the final model islearned on all of the training data.
Using the resulting logistic regression model, we predicta new confidence value for each bounding box. Note that,because we are using a probabilistic framework, we are notlimited to compute a single maximum-likelihood estimate ofour distance to the road or the real-world height of eachbounding box object. Rather, we can compute two scoresfor each of scale and context and one score for appearance,and we can use all of these scores to predict our finalclassification. Thus, our model is extremely flexible andcan be used with any number of scores that may not beconditionally independent.
C. Aggressive non-maximum suppression
After applying the logistic regression to rescore all ofour detections, we often end up with a large number ofoverlapping high-scoring detections that all correspond to thesame car in the real world. To handle this, we apply an ag-gressive non-maximum suppression algorithm, discarding allbounding boxes that overlap with a higher-scoring boundingbox by at least 20%. For cars that occlude each other by morethan 20%, this will result in missed detections. However,because cars tend to stay separated in the real world inorder to avoid collisions, this assumption is reasonable inmany cases. This non-maximum suppression results in anoverall gain on our validation performance as well as ourtest performance, so we include this as the final step of ouralgorithm.
IV. SYSTEM
Our research vehicle is a 2006 Volkswagen Passat wagon.A Point Grey Ladybug-3 panoramic RGB camera with six1600x1200 cameras and a 15 Hz frame rate is used to capturevideo; for simplicity, the results in this paper use only asingle forward-facing camera out of the six. An ApplanixPOS-LV 420 GPS/IMU system with Omnistar satellite-basedVirtual Base Station service generates pose and inertial up-dates for the vehicle at 200 Hz. This localization, combinedwith the hand-measured calibration between the Ladybugcamera and the vehicle (which must be performed once whenthe camera is fixed to the car), give us a registration betweenthe camera images and the digital road map, represented in
global coordinates. Note that, although our Applanix local-ization system is rather expensive ($150,000), Section VIIIshows that our method is robust to localization errors typicalof consumer-grade GPS systems, so a much cheaper and lessaccurate localization system could also have been used.
A. Estimating Scale
Given the registration between the camera images and theglobal coordinate system, we can project any point fromthe real world onto the camera image. However, the reversetransformation is ambiguous; a single point on the imagecorresponds to a line of points in the real world. In order toestimate the distance to objects in the image, we compute aset of “image reference points” as follows: first, we imagine agrid placed on the ground plane surrounding the ego vehicle.In our case, we use a 100 m by 100 m grid in which pointsare spaced 0.5 m apart. For this paper, we have assumedthat the ground is planar, although maps with elevation datacould easily be used if necessary.
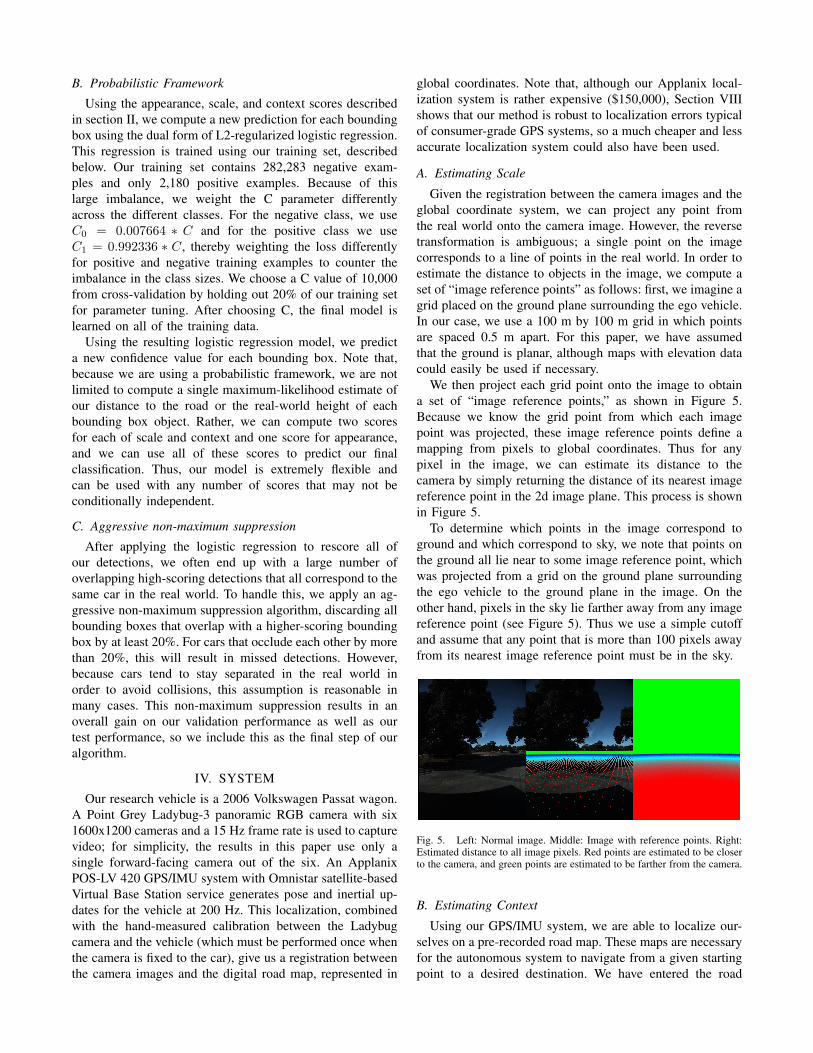
We then project each grid point onto the image to obtaina set of “image reference points,” as shown in Figure 5.Because we know the grid point from which each imagepoint was projected, these image reference points define amapping from pixels to global coordinates. Thus for anypixel in the image, we can estimate its distance to thecamera by simply returning the distance of its nearest imagereference point in the 2d image plane. This process is shownin Figure 5.
To determine which points in the image correspond toground and which correspond to sky, we note that points onthe ground all lie near to some image reference point, whichwas projected from a grid on the ground plane surroundingthe ego vehicle to the ground plane in the image. On theother hand, pixels in the sky lie farther away from any imagereference point (see Figure 5). Thus we use a simple cutoffand assume that any point that is more than 100 pixels awayfrom its nearest image reference point must be in the sky.
Fig. 5. Left: Normal image. Middle: Image with reference points. Right:Estimated distance to all image pixels. Red points are estimated to be closerto the camera, and green points are estimated to be farther from the camera.
B. Estimating Context
Using our GPS/IMU system, we are able to localize our-selves on a pre-recorded road map. These maps are necessaryfor the autonomous system to navigate from a given startingpoint to a desired destination. We have entered the road
network into a quadtree data structure for fast queries. Bylocalizing our position and orientation on the map, and byusing the scale calibration described in section IV-A, weare able to automatically estimate which pixels in the imagelie on the road and which do not, as follows: For a givenpixel, we use the image reference point system described insection IV-A to estimate the position of this pixel relative tothe car, assuming that this pixel lies on the ground plane.Then given our position in global coordinates, we can usethis relative position to estimate the global position of thispixel. Next we simply look up the global position of thispoint in our quadtree road network to estimate the distancefrom this pixel to the nearest road. This information is usedto compute the context score, described in section II-C andvisualized in Figure 3.
V. BASELINE
The baseline of our algorithm is the appearance modelfrom Felzenszwalb’s deformable parts-based model [16],trained on the PASCAL 2007 training set, as describedin section II-A. The appearance model we use containstwo minor variations on top of the original code that ispublicly available online. First, the original model combines8 neighboring pixels into a single super-pixel, in order tocompress the image to the size of the template. We foundthat 8 pixels was too large to detect the smallest cars in ourtest set, so we lower this super-pixel size to 4 neighboringpixels. We change this parameter for both our context/scaledetector and for the baseline detector, allowing us to detectsmaller cars in both cases.
Second, the non-maximum suppression step that is used inthe original code removes bounding boxes for which the ratioof the intersection with a higher-scoring bounding box to thearea of the higher-scoring bounding box alone is greater than0.5. We find that this tends to favor larger bounding boxes atthe expense of filtering out smaller bounding boxes, whichis not preferred. Thus we modify this slightly to only filterbounding boxes for which the ratios of intersection to thearea of both the lower and higher scoring bounding boxesare both greater than 0.5.
Both the change in the bin-size and the change in the non-maximum suppression algorithm are only minor adjustmentsto the original code from [18]. We use the original algorithmwith these two adjustments as the baseline to compareperformance with our algorithm.
As described in section III-C, the last step in our algorithmis to apply an aggressive non-maximum suppression. Toisolate the effect of using scale and context on our perfor-mance, we compare the performance of our algorithm toa second baseline, in which we apply this aggressive non-maximum suppression to Felzenszwalb’s original deformableparts-based model [16].
VI. DATASET
A. Training Sets
For the appearance model, we used the pre-trained carmodels provided with [18] that were trained on the car
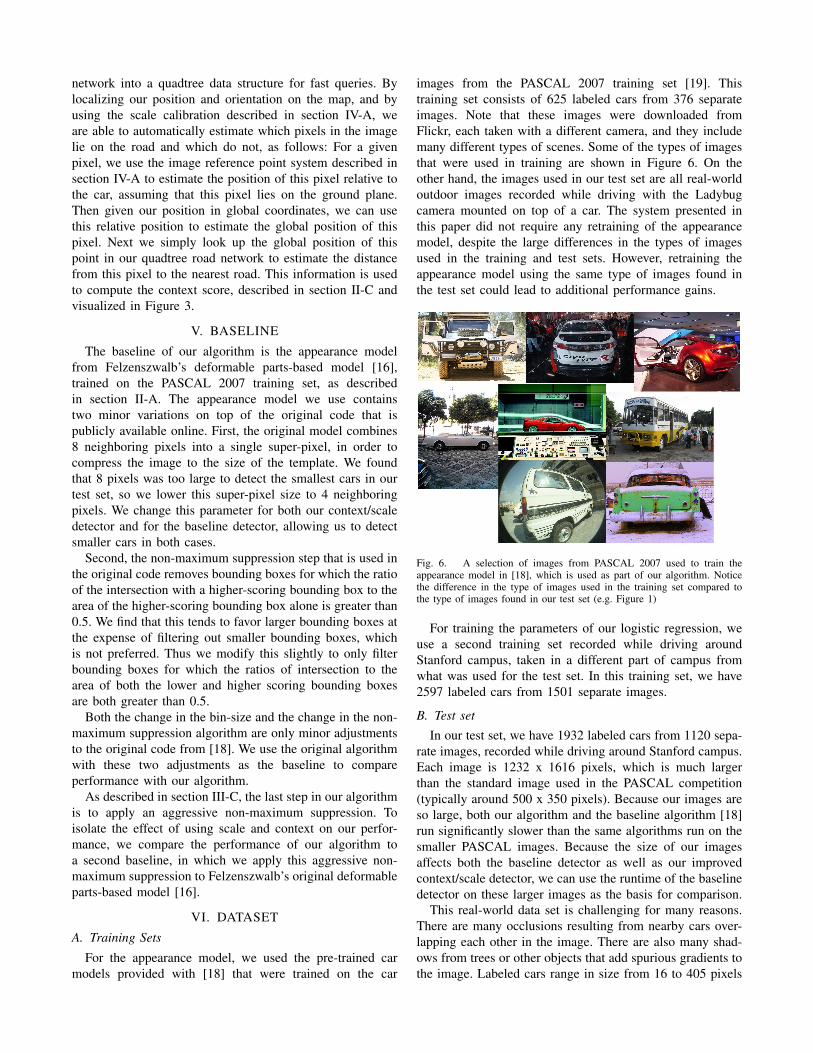
images from the PASCAL 2007 training set [19]. Thistraining set consists of 625 labeled cars from 376 separateimages. Note that these images were downloaded fromFlickr, each taken with a different camera, and they includemany different types of scenes. Some of the types of imagesthat were used in training are shown in Figure 6. On theother hand, the images used in our test set are all real-worldoutdoor images recorded while driving with the Ladybugcamera mounted on top of a car. The system presented inthis paper did not require any retraining of the appearancemodel, despite the large differences in the types of imagesused in the training and test sets. However, retraining theappearance model using the same type of images found inthe test set could lead to additional performance gains.
Fig. 6. A selection of images from PASCAL 2007 used to train theappearance model in [18], which is used as part of our algorithm. Noticethe difference in the type of images used in the training set compared tothe type of images found in our test set (e.g. Figure 1)
For training the parameters of our logistic regression, weuse a second training set recorded while driving aroundStanford campus, taken in a different part of campus fromwhat was used for the test set. In this training set, we have2597 labeled cars from 1501 separate images.
B. Test set
In our test set, we have 1932 labeled cars from 1120 sepa-rate images, recorded while driving around Stanford campus.Each image is 1232 x 1616 pixels, which is much largerthan the standard image used in the PASCAL competition(typically around 500 x 350 pixels). Because our images areso large, both our algorithm and the baseline algorithm [18]run significantly slower than the same algorithms run on thesmaller PASCAL images. Because the size of our imagesaffects both the baseline detector as well as our improvedcontext/scale detector, we can use the runtime of the baselinedetector on these larger images as the basis for comparison.
This real-world data set is challenging for many reasons.There are many occlusions resulting from nearby cars over-lapping each other in the image. There are also many shad-ows from trees or other objects that add spurious gradients tothe image. Labeled cars range in size from 16 to 405 pixels
and have a wide range of models, colors, and orientations.These are all challenges that a real car will encounter whiletrying to drive autonomously, and all of these issues mustbe dealt with in some way before vision-based autonomousdriving is possible.
VII. RESULTS
By pre-filtering each image by scale, we are able to reducethe runtime of our algorithm from 43 seconds per framedown to 13 seconds, or a speedup of 3.3 times over thebaseline on the same set of images. The time for computingthe context and scale scores, and using these scores in thelogistic regression framework, has a negligible effect on ourtotal computation time. Although our unoptimized imple-mentation currently runs at approximately 1% of real-time,we believe that with intelligent optimizations and a GPUimplementation, real-time performance could be achieved.
In looking at the weights learned by our logistic regressionclassifier, the distance to the road is given the most weightand is thus deemed to be very important in correctly identi-fying an object as a car. The appearance and height scoresare given similar weights and are thus considered to haveroughly equal importance.
The performance of our algorithm compared to the base-line can be seen in Figure 7. As explained in section V,we have two algorithms that we both consider to be ourbaselines - Felzenszwalb’s original appearance model, andFelzenszwalb’s model with aggressive non-maximum sup-pression. Figure 7 shows that our algorithm achieves anaverage precision of 52.9%, whereas the better of the twobaselines achieves an average precision of only 43.5%. Notethat, because cars make up a small percentage of each image,both the baseline and our algorithm are performing far betterthan random chance. The total area occupied by all cars inour test set makes up about 1.1% of the total area of alltest images, so a random classifier would have a precisionof about 1.1%.
Fig. 7. Comparison of our algorithm (magenta) to the baseline (cyan). Darkblue: Baseline 1, from Felzenszwalb [18]. Cyan: Baseline 1 using aggres-sive non-maximum suppression. Green: Scale filtering. Red: Context/scalerescoring. Magenta: Context/scale rescoring with aggressive non-maximumsuppression
The majority of the benefit of using context and scalecomes when searching for cars that are far away. Because
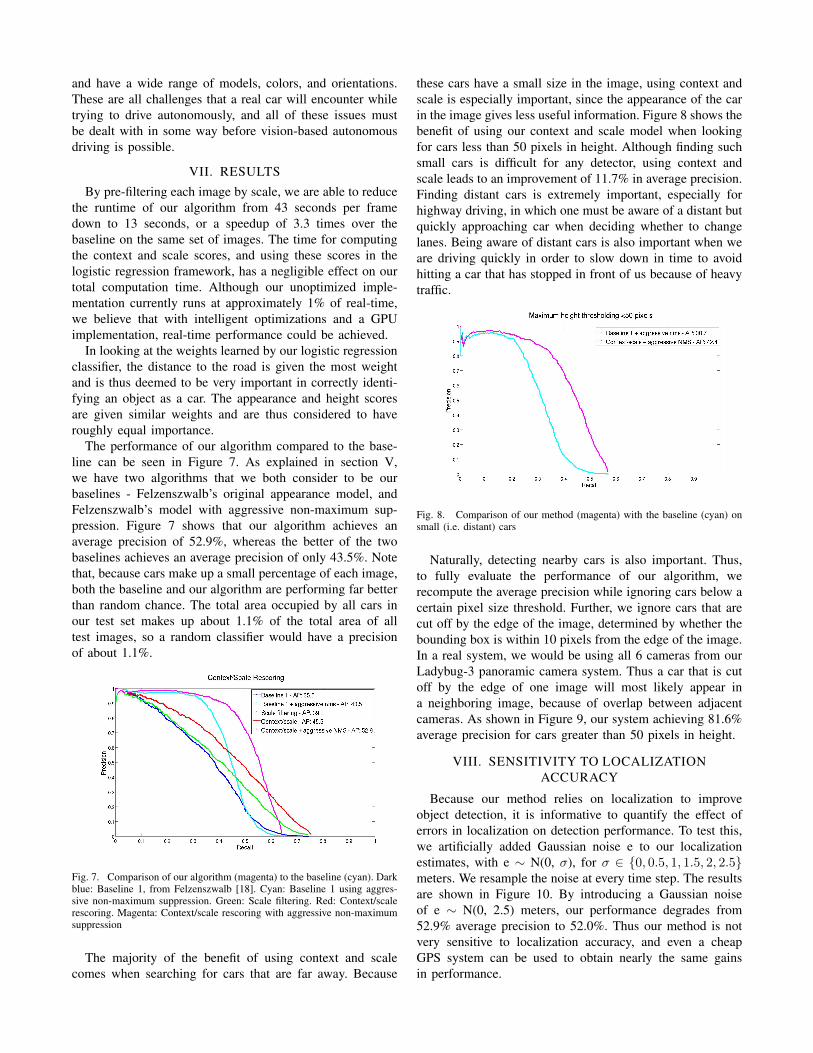
these cars have a small size in the image, using context andscale is especially important, since the appearance of the carin the image gives less useful information. Figure 8 shows thebenefit of using our context and scale model when lookingfor cars less than 50 pixels in height. Although finding suchsmall cars is difficult for any detector, using context andscale leads to an improvement of 11.7% in average precision.Finding distant cars is extremely important, especially forhighway driving, in which one must be aware of a distant butquickly approaching car when deciding whether to changelanes. Being aware of distant cars is also important when weare driving quickly in order to slow down in time to avoidhitting a car that has stopped in front of us because of heavytraffic.
Fig. 8. Comparison of our method (magenta) with the baseline (cyan) onsmall (i.e. distant) cars
Naturally, detecting nearby cars is also important. Thus,to fully evaluate the performance of our algorithm, werecompute the average precision while ignoring cars below acertain pixel size threshold. Further, we ignore cars that arecut off by the edge of the image, determined by whether thebounding box is within 10 pixels from the edge of the image.In a real system, we would be using all 6 cameras from ourLadybug-3 panoramic camera system. Thus a car that is cutoff by the edge of one image will most likely appear ina neighboring image, because of overlap between adjacentcameras. As shown in Figure 9, our system achieving 81.6%average precision for cars greater than 50 pixels in height.
VIII. SENSITIVITY TO LOCALIZATIONACCURACY
Because our method relies on localization to improveobject detection, it is informative to quantify the effect oferrors in localization on detection performance. To test this,we artificially added Gaussian noise e to our localizationestimates, with e ∼ N(0, σ), for σ ∈ {0, 0.5, 1, 1.5, 2, 2.5}meters. We resample the noise at every time step. The resultsare shown in Figure 10. By introducing a Gaussian noiseof e ∼ N(0, 2.5) meters, our performance degrades from52.9% average precision to 52.0%. Thus our method is notvery sensitive to localization accuracy, and even a cheapGPS system can be used to obtain nearly the same gainsin performance.
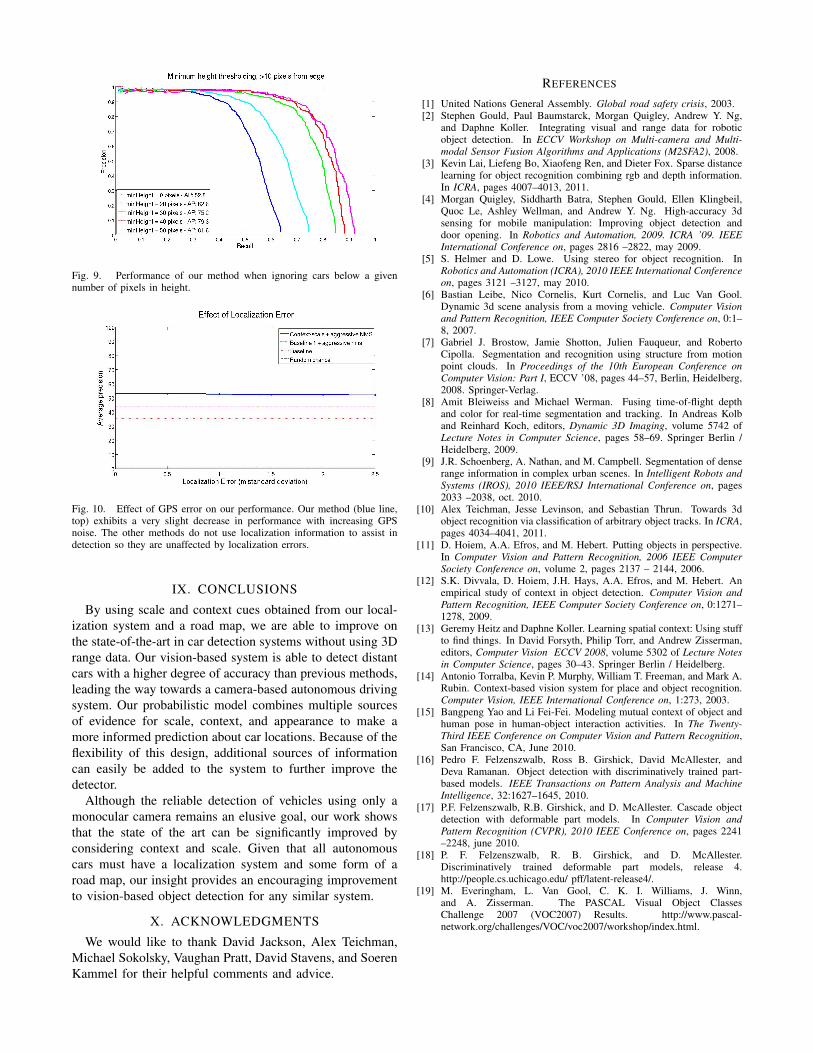
Fig. 9. Performance of our method when ignoring cars below a givennumber of pixels in height.
Fig. 10. Effect of GPS error on our performance. Our method (blue line,top) exhibits a very slight decrease in performance with increasing GPSnoise. The other methods do not use localization information to assist indetection so they are unaffected by localization errors.
IX. CONCLUSIONS
By using scale and context cues obtained from our local-ization system and a road map, we are able to improve onthe state-of-the-art in car detection systems without using 3Drange data. Our vision-based system is able to detect distantcars with a higher degree of accuracy than previous methods,leading the way towards a camera-based autonomous drivingsystem. Our probabilistic model combines multiple sourcesof evidence for scale, context, and appearance to make amore informed prediction about car locations. Because of theflexibility of this design, additional sources of informationcan easily be added to the system to further improve thedetector.
Although the reliable detection of vehicles using only amonocular camera remains an elusive goal, our work showsthat the state of the art can be significantly improved byconsidering context and scale. Given that all autonomouscars must have a localization system and some form of aroad map, our insight provides an encouraging improvementto vision-based object detection for any similar system.
X. ACKNOWLEDGMENTS
We would like to thank David Jackson, Alex Teichman,Michael Sokolsky, Vaughan Pratt, David Stavens, and SoerenKammel for their helpful comments and advice.
REFERENCES
[1] United Nations General Assembly. Global road safety crisis, 2003.[2] Stephen Gould, Paul Baumstarck, Morgan Quigley, Andrew Y. Ng,
and Daphne Koller. Integrating visual and range data for roboticobject detection. In ECCV Workshop on Multi-camera and Multi-modal Sensor Fusion Algorithms and Applications (M2SFA2), 2008.
[3] Kevin Lai, Liefeng Bo, Xiaofeng Ren, and Dieter Fox. Sparse distancelearning for object recognition combining rgb and depth information.In ICRA, pages 4007–4013, 2011.
[4] Morgan Quigley, Siddharth Batra, Stephen Gould, Ellen Klingbeil,Quoc Le, Ashley Wellman, and Andrew Y. Ng. High-accuracy 3dsensing for mobile manipulation: Improving object detection anddoor opening. In Robotics and Automation, 2009. ICRA ’09. IEEEInternational Conference on, pages 2816 –2822, may 2009.
[5] S. Helmer and D. Lowe. Using stereo for object recognition. InRobotics and Automation (ICRA), 2010 IEEE International Conferenceon, pages 3121 –3127, may 2010.
[6] Bastian Leibe, Nico Cornelis, Kurt Cornelis, and Luc Van Gool.Dynamic 3d scene analysis from a moving vehicle. Computer Visionand Pattern Recognition, IEEE Computer Society Conference on, 0:1–8, 2007.
[7] Gabriel J. Brostow, Jamie Shotton, Julien Fauqueur, and RobertoCipolla. Segmentation and recognition using structure from motionpoint clouds. In Proceedings of the 10th European Conference onComputer Vision: Part I, ECCV ’08, pages 44–57, Berlin, Heidelberg,2008. Springer-Verlag.
[8] Amit Bleiweiss and Michael Werman. Fusing time-of-flight depthand color for real-time segmentation and tracking. In Andreas Kolband Reinhard Koch, editors, Dynamic 3D Imaging, volume 5742 ofLecture Notes in Computer Science, pages 58–69. Springer Berlin /Heidelberg, 2009.
[9] J.R. Schoenberg, A. Nathan, and M. Campbell. Segmentation of denserange information in complex urban scenes. In Intelligent Robots andSystems (IROS), 2010 IEEE/RSJ International Conference on, pages2033 –2038, oct. 2010.
[10] Alex Teichman, Jesse Levinson, and Sebastian Thrun. Towards 3dobject recognition via classification of arbitrary object tracks. In ICRA,pages 4034–4041, 2011.
[11] D. Hoiem, A.A. Efros, and M. Hebert. Putting objects in perspective.In Computer Vision and Pattern Recognition, 2006 IEEE ComputerSociety Conference on, volume 2, pages 2137 – 2144, 2006.
[12] S.K. Divvala, D. Hoiem, J.H. Hays, A.A. Efros, and M. Hebert. Anempirical study of context in object detection. Computer Vision andPattern Recognition, IEEE Computer Society Conference on, 0:1271–1278, 2009.
[13] Geremy Heitz and Daphne Koller. Learning spatial context: Using stuffto find things. In David Forsyth, Philip Torr, and Andrew Zisserman,editors, Computer Vision ECCV 2008, volume 5302 of Lecture Notesin Computer Science, pages 30–43. Springer Berlin / Heidelberg.
[14] Antonio Torralba, Kevin P. Murphy, William T. Freeman, and Mark A.Rubin. Context-based vision system for place and object recognition.Computer Vision, IEEE International Conference on, 1:273, 2003.
[15] Bangpeng Yao and Li Fei-Fei. Modeling mutual context of object andhuman pose in human-object interaction activities. In The Twenty-Third IEEE Conference on Computer Vision and Pattern Recognition,San Francisco, CA, June 2010.
[16] Pedro F. Felzenszwalb, Ross B. Girshick, David McAllester, andDeva Ramanan. Object detection with discriminatively trained part-based models. IEEE Transactions on Pattern Analysis and MachineIntelligence, 32:1627–1645, 2010.
[17] P.F. Felzenszwalb, R.B. Girshick, and D. McAllester. Cascade objectdetection with deformable part models. In Computer Vision andPattern Recognition (CVPR), 2010 IEEE Conference on, pages 2241–2248, june 2010.
[18] P. F. Felzenszwalb, R. B. Girshick, and D. McAllester.Discriminatively trained deformable part models, release 4.http://people.cs.uchicago.edu/ pff/latent-release4/.
[19] M. Everingham, L. Van Gool, C. K. I. Williams, J. Winn,and A. Zisserman. The PASCAL Visual Object ClassesChallenge 2007 (VOC2007) Results. http://www.pascal-network.org/challenges/VOC/voc2007/workshop/index.html.