Embed Size (px)
Citation preview
Help in applying BCA can be obtained from the BCA Center at [email protected]
A Primer for Understanding Benefit-Cost Analysis
Richard O. Zerbe, DirectorTyler Scott, Ph.D. Student
Benefit-Cost Analysis CenterThe Daniel J. Evans School of Public AffairsUniversity of Washington
A Primer for Understanding Benefit-Cost Analysis 2
Contents
Overview .....................................................................................................................................3
Definitions ...........................................................................................................................3
Need for BCA......................................................................................................................4
Data Systems ......................................................................................................................5
Integrated Data Systems .................................................................................................6
Basic Steps in Benefit-Cost Analysis ...........................................................................6
Define the Scope and Assumptions of the BCA ...............................................8
Identify Outcomes and Quantify Costs and Benefits ......................................9
Choose a Discount Rate and Calculate the Present Values .........................12
Choose a BCA Measure and Carry Out the Calculations ............................. 14
Address Risk and Uncertainty ...............................................................................15
The Use of Benefit-Cost Analysis: When and to what extent is BCA used? ......................................................................... 16
FIGURE 1: Supply and Demand of Data .................................................17
Benefit-Cost Analysis in Practice: City of Ortin Example ........................................................................................................... 19
Defining the Scope of the Analysis .................................................................... 19
Identifying and Quantifying Costs and Benefits............................................ 20
TABLE 1: Cash Flow Streams - City of Ortin ..........................................21
Choosing a Discount Rate and Determining Present Values ......................22
TABLE 2: Present Values of Programs ...................................................23
Computing a Summary Metric and Comparing Alternatives ......................23
TABLE 3: BCA Summary Measures.........................................................24
Risk and Uncertainty ...............................................................................................24
Conclusion ................................................................................................................................25
References ................................................................................................................................27
Acknowledgements .............................................................................................................. 29
3 ACTIONABLE INTELLIGENCE: Policy Reform Through Integrated Data Systems
Overview
DEFINITIONS Benefit-cost analysis (BCA), and cost-benefit-analysis (CBA), which are generally regarded as equivalent terms, are accounting frameworks used to evaluate the financial consequences of decisions.1 In this sense, BCA is similar to analyses that corporations conduct in order to evaluate investment decisions. However, it differs in two significant ways: first, the objective of BCA is to increase public welfare, not profit. This serves to increase both the technical and political complexity of the exercise, because the exact definition of “public welfare” is elusive. Second, because BCA often encompasses non-market goods, such as the value of a recreational visit or wildlife viewing at a park, the required data is often not found in market transactions. Such data must instead be generated through resource-intensive surveys or other statistical analyses. For instance, for the value of a park that has no entry fee, analysts might instead estimate the value of a recreational visit by asking park users how much they would be willing to pay to use the park or determine the costs visitors incur to travel to the park. Of course the value of BCA depends on accurate data. BCA’s at any level of government can be used to eliminate wasteful products but they can also be used to identify other profitable projects that would enhance welfare. Such beneficial projects can, in principal, create government revenues and thereby decrease taxes.
It is important to distinguish between benefit-cost analysis and another commonly employed financial analysis methodology, cost-effectiveness analysis (CEA). CEA is a more limited form of financial analysis, wherein a desired level of a given output (e.g. a 10 percent increase in student retention or the expansion of a given homelessness intervention to a new district of a city) is specified and then the least-cost means by which to achieve this goal is selected (from among the various policy alternatives). This is typically the approach we would expect from an organization responding to an exogenously imposed constraint, such as a regulation specifying a maximum pollution level. When the specified output level is in fact the socially efficient level, the cost-effectiveness approach will yield the same outcome as the benefit-cost model. However, without estimating the marginal benefit costs and benefits of the change in output (i.e. conducting a full benefit-cost analysis) there is
1 Zerbe has attempted to treat BCA as “better-defined subcategory of CBA”, whose legal foundations tend to ameliorate or eliminate the criticisms of CBA. Zerbe, Richard O. 2007. “The Legal Foundation of Cost-Benefit Analysis.” Charleston Law Review 2(1): 93-184.
A Primer for Understanding Benefit-Cost Analysis 4
no guarantee that the attained is efficient (optimally balances all costs and benefits). Cost-effectiveness is also used widely in health care where benefits are thought, not always correctly, to be immeasurable.
NEED FOR BCAThe United States Government widely uses BCA under the direction of presidential executive orders.2 Under these orders, the White House Office of Management and Budget (OMB) requires the use of BCA by government agencies within the executive branch, and provides a set of guidelines under which BCA is to be conducted. The Office of Information and Regulatory Analysis (OIRA), which is part of OMB, is a major user of BCA for evaluations of regulatory decisions. BCA is also used by state and local governments, albeit to a lesser (and much less consistent) extent (Schwartz in press). For example, the state of Washington, through the Washington State Institute for Public Policy (WSIPP), performs analyses of significant new social programs for the state legislature.3
If used properly, the BCA framework can reduce poorly conceived government spending.4 In fact, agencies such OIRA have already reduced wasteful spending, but not to the full extent possible, as not all issues have been fully examined.5 Moreover, BCA for hard-to-quantify social initiatives under the purview of state and local governments is severely lacking. Not only is BCA lacking in quantity but in quality as well. Schwartz’s (in press) recent survey of state-level analysis programs found states to have an average grade of a D+ (with D- being the lowest possible score), demonstrating the vast room for improvement in the use of BCA at lower levels of government.
At the state, county, and municipal levels, the use of a comprehensive, accurate BCA is expensive and difficult, especially for social policy applications. Many of the governance bodies tasked with overseeing issues, such as county health programs or urban housing and homelessness, lack adequate resources to conduct BCA. These
2 Executive Order (EO) 12291 (Reagan 1981), EO 12498 (Reagan 1985), EO 12866 (Clinton 1993), EO 13258 (Bush 2002), EO 13422 (Bush 2007), EO 13497 (Obama 2009).
3 See http://www.wsipp.wa.gov/4 The rationale for government investment is externalities. Externalities are effects that are not
accounted for in decisions. They arise from the expenses of operating markets, that is, from transaction costs. It is helpful in considering a CBA analysis to consider how transactions costs can be reduced to achieve either quasi-market solutions or the best form of government intervention.
5 Graham, John D. 2008. “Saving Lives Through Administrative Law and Economics”. University of Pennsylvania Law Review. 157(2): 101-245.
5 ACTIONABLE INTELLIGENCE: Policy Reform Through Integrated Data Systems
smaller groups often lack trained analysts and funding for research, a problem exacerbated by the fact that social policy typically engenders significant non-market benefits and costs. Such non-market values raise the difficulty and complexity (and thus cost) of an analysis. Further, since social policy at lower levels of government is often decentralized and carried out by numerous organizations, appropriate data sets often do not exist. Due to these issues, organizations often cannot conduct an accurate, useful BCA.
It is our contention that BCA results in more efficient policy-making throughout all policy sectors, which in turn betters social welfare. In a world of limited resources and seemingly unlimited demands, it is imperative that governments allocate funds judiciously and efficiently. Given this, there is a great need to make BCA more feasible and more accessible at all levels of government and in all governance sectors; we believe that integrated data systems (which for this paper we define broadly as the standardization of data definitions and structures across a collection of data sources (Heimbigner and McLeod 1985; Litwin et al. (1990)) offer a significant means by which to address this need.
DATA SYSTEMSAs stated by Goodhue et al. (1992), information systems themselves should be viewed as having costs (design, implementation, etc.) and benefits (improved decision-making, time savings, etc.). Fundamentally, the purpose of data systems is to address general uncertainty and lower the costs of data collection. Galbraith (1973) writes that in a low-uncertainty environment, organizations address uncertainty using mechanisms of rules and procedures, hierarchies, and goals. However, sources of greater uncertainty (such as faced by most social-policy oriented organizations addressing highly complex modern issues) require the organization to either reduce its need for information processing or increase its information processing capacity (Galbraith 1973). Daft and Lengel (1986) parse this broad concept of uncertainty into the concepts of uncertainty and equivocality, wherein uncertainty refers to the absence of specific, needed information and equivocality refers to the existence of multiple, conflicting interpretations of a situation; equivocality thus implies that it is unclear what information is needed. In this framework, uncertainty can be reduced by increasing the amount of information, while equivocality can be reduced by increasing the richness of information (Daft and Lengel 1986).
A Primer for Understanding Benefit-Cost Analysis 6
INTEGRATED DATA SYSTEMSAny BCA is, in a manner of speaking, always subject to a benefit-cost examination itself; both the overall analysis and its individual subcomponents must be justified by their expected benefits. Thus, the role and extent of BCA depends upon the value of information (subject, of course, to budget and resource constraints). Integrated data systems in the context of BCA is the extent to which integrated data systems: (a) reduce costs of data gathering and data management (i.e. increasing the amount of information); (b) generate new data; and (c) increase the accuracy and precision of BCA estimates. In one sense, these BCA-related benefits, resultant from increased data linkage, might be viewed as somewhat indirect, compared to the primary benefits sought from better integrating data, for instance more efficient or enhanced provision of social services. However, BCA has a very direct relationship to social welfare, in that careful financial analyses can improve policy decision-making and thus enhance social outcomes. Given this, one can readily see the important implications of developing integrated data systems for organizations seeking to use BCA as a decision-making tool. Increased data integration offers to both reduce uncertainty (by allowing the analyst to leverage more data within given resource constraints) and equivocality (by linking different types of data so as to better establish causal relationships).
In what follows, we demonstrate how data integration can impact BCA in these three ways. First, we first describe the usage of BCA, particularly regarding how its usage might be expanded and improved. Next, the basic methodological framework is presented, paying particular attention to the role and value of information in BCA. Finally, we provide a simplified example of a BCA that demonstrates relevant concepts and speaks to the challenges faced in seeking to expand BCA usage.
BASIC STEPS IN BENEFIT-COST ANALYSISThe fundamental equation for any BCA is:
where W = social welfare, CS = consumer surplus, PS = producer surplus, GR = government revenue, and EX = external effects (The term ∆, delta, represents “the change in”). Consumer surplus is the amount consumers would pay over what they do pay, rather than doing without the product at the specified quantity. For example we can ask how much one would pay to have her usual three cups of coffee today, over and above the $5.00 total she now pays. The answer would be her consumer
∆W = ∆CS+∆PS+∆GR+∆EX (1)
7 ACTIONABLE INTELLIGENCE: Policy Reform Through Integrated Data Systems
surplus. Producer surplus is similarly the amount that could be extracted from the producer as a lump sum without reducing (over some specified time period) the amount produced. Government revenue consists of tax or transfer receipts minus government expenditures. External effects take into account such things as pollution damages that are not incorporated directly in the transaction between buyer and seller. Similarly, government project revenue received through taxes involves a tax distortion that is a cost. As a rule of thumb, many analysts multiply the amount of revenue raised by multiplying by 1.2. Similarly revenue raised through bonds distorts the capital market and is incorporated through the discount rate as a higher rate than otherwise.6 The basic decision rule for BCA then, is that that the production of the good or service should be continued as long as the marginal (incremental) social benefits exceed the marginal social costs, as shown above in Equation 1 (i.e., ∆W is positive). Equation 1 demonstrates that in order for a project to be chosen, total net benefits should be positive.
The discovery and use of this formula proceeds in five important steps:
1. Define the scope and assumptions of the BCA.
2. Identify outcomes and quantify costs and benefits for each alternative.
3. Choose a discount rate (interest rate) and calculate the present value of costs and benefits.
4. Choose a measure for comparing alternatives and carry out the necessary calculations.
5. Discuss risk and uncertainty.
In this section, we discuss these steps in detail. In the following section, we provide an extended example to further clarify the concepts we introduce below. The simplified methodology outlined below is drawn from the author’s more detailed BCA texts Zerbe and Bellas (2006) and Zerbe and Dively (1994). The reader should also refer to Stokey and Zeckhauser (1978); Gramlich (1990); Hanley and Spash (1993); Brent (1998); and Jones (2005) for additional guidance. Boardman et al. (2010) provides the most recent, up-to-date methodological text. Further, U.S. Office of Management and Budget Circulars A-94 and A-4 provide similar guidance in regards to government projects and regulation (US OMB 1992; 2003); these documents also serve as common resources for BCA standards and practices.
6 For more on this issue see Burgess and Zerbe (2011).
A Primer for Understanding Benefit-Cost Analysis 8
Define the Scope and Assumptions of the BCA As a first step, the BCA should clearly state the problem to be analyzed and define from whose perspective it is being conducted.7 It should also identify whose costs and benefits will be considered, i.e. the actors who have economic standing.
In practice, a BCA does not include everyone affected by a policy alternative. The decision about whom to include or exclude in a BCA relates to the economic standing of those affected. Most analyses are done in a particular context that determines standing. For instance, a municipality might only consider effects on municipal revenues or limit effects to those felt within its borders. The state government might not consider effects of its pollution policy on neighboring states and the federal government might not consider effects on foreign countries. Many projects will have only minor effects on certain groups, and it often will be too expensive to include these effects under the principle of proportionate analysis.8 In addition, certain sentiments may be disregarded as being irrelevant; for example, one might suffer harm from envy, but this harm would (and should) generally go unrecognized in a BCA.
Once the problem definition, perspective, and economic standing issues are settled, the analyst should seek to determine the period over which the BCA is to be conducted. This is often a subject of controversy. Indeed, consider a situation in which a client requests a BCA for a large convention hall construction project that has very high costs in the first three years, and only generates benefits once it reaches some degree of popularity seven years later. Under these circumstances, a ten-year perspective will likely conclude that the project is not worthwhile, while a twenty-year perspective might lead to the opposite conclusion. Given the possible impact of the analysis period on the outcome of the BCA, it is important for the client and analyst to explore this question in detail before the BCA is undertaken.
The next component of scope definition is the choice between a partial equilibrium analysis (PE) and a general equilibrium (GE) analysis. When the number of markets included in the BCA is restricted, it is called a “partial equilibrium” analysis; when the number of markets included in the analysis is large and these markets
7 While the BCA will most often be conducted from the client’s point of view, the analyst may be called upon to examine a different perspective in some cases.
8 According to the principle of proportionate analysis, the depth and scope of a CBA analysis (and therefore the resources allocated to it) should be proportionate to the expected magnitude of the effects of the project it relates to. Note that it is often the smallest effects that are most expensive to identify and properly quantify.
9 ACTIONABLE INTELLIGENCE: Policy Reform Through Integrated Data Systems
are highly interactive, it is called a “general equilibrium” analysis.9 Certainly, not all analyses require a GE framework; in most cases, a PE analysis is sufficient. The relevant question is, how important are other related markets to the analysis? Where they are few and/or not important, PE is sufficient.
For example, consider a small town that conducts a BCA to determine whether to purchase a garbage truck or continue to outsource garbage collection (this example will be studied in detail in the following section). The effects of the town’s decision on other markets, such as the truck market, energy market, or even the waste hauling market are negligible in this case since the decision involves only one truck and a small tonnage of waste. Such an analysis, limited in its inclusion of markets, would be a partial equilibrium analysis. On the other hand, consider a national oil tax and all of the markets affected: transportation markets, plastic goods and other petroleum product markets, labor markets, and others. An analysis of such a high-magnitude policy should be done from a general-equilibrium perspective in which these major markets and their interactions are considered.
Once the scope of the analysis is set, the BCA should also identify the baseline against which costs and benefits will be compared. This baseline should be the estimated outcome in the absence of the project under consideration, taking into account actions that will happen because the project is not done. Further, the analyst should identify all model assumptions and known limitations of the analysis (such as poor data quality, for example).
Identify Outcomes and Quantify Costs and Benefits Next, a range of possible policy alternatives, as well as their consequences in terms of outcomes, must be identified. Often, the different policy options are specified to the analyst, but in some instances, the analyst might need to identify and develop policy alternatives. If the costs and benefits are not already in monetary units, they must be converted to such units whenever possible. The flow of costs and benefits related to each of the alternatives must be identified for the period of the analysis.
For a BCA, policy costs and benefits are defined in monetary units so as to facilitate comparison among different forms of inputs and outputs. When the costs and benefits at issue relate to goods or services traded in a market, it is relatively straightforward to identify them and include them in a BCA. However, many
9 A calculation of the GE effects can be made by examining the primary market and summing the size of tax distortions in related markets multiplied by the quantity changes in each of these markets. These distortions are like external effects in terms of equation one.
A Primer for Understanding Benefit-Cost Analysis 10
projects have significant non-market benefits and costs, which must be converted to monetary units whenever possible.
The identification of benefits and costs may not always be simple, as these values can be diffuse. For instance, when considering a road project, an analyst may need to include the cost to homeowners that live near the road in terms of pollution and noise. The amount it would take to compensate these homeowners for bearing the pollution and noise would then also count as a project cost (assuming these individuals are considered to have economic standing in the analysis). If the government instead opts to construct a noise-reducing barrier, the cost of erecting the barrier would naturally have to be included as part of the project cost and all, or part, of the noise cost would be dropped.
When the goods considered in a BCA are not traded on the market, their valuation can become complicated. For instance, in evaluating the benefits and costs of building a new road, the government might include a calculation of the time savings to users. To do so, the value of users’ time must be estimated, and multiplied by the number of users. Prices used to value non-market behavior are called shadow prices. Although BCA is a type of financial accounting, it considers many values not counted in business accounting. BCA is used to evaluate policies that concern air and water quality, endangered species, recreational sites, educational opportunities, human health, and many other diverse and difficult-to-quantify outcomes. Such non-market values are derived using either revealed preference or stated preference methods.
In revealed-preference valuation, the analyst utilizes data from market transactions or observable behavior to estimate the values of nonmarket goods associated with the observable transaction. For example, the travel-cost method uses travel expenditures incurred by visitors to reach a site (such as a national park or a beach) as a proxy for the visitor’s willingness-to-pay (WTP) for access to the site; this in turn provides an estimate of the value of that site. Another example of revealed-preference valuation is hedonic regression, where component characteristics of a good or service are valued using multiple regression techniques to provide an estimate of their value. This is common in real estate applications for instance, where house attributes (such as a view or proximity to a school) are not priced directly but are reflected in the value of the house.
Stated-preference valuation uses the survey method, in which individuals are asked how they would behave in a hypothetical market scenario, and these responses are used to produce value estimates. One commonly used stated-preference method is
11 ACTIONABLE INTELLIGENCE: Policy Reform Through Integrated Data Systems
contingent valuation (CV), where survey participants are presented with a policy scenario, and asked to give a WTP value for a gain or a willingness-to-accept (WTA) value for a loss regarding a good or service. A second stated-preference method is conjoint analysis. Rather than asking participants to give a WTP or WTA value for a single good (e.g. air pollution reduction), conjoint analysis presents individuals with a bundle of component attributes; the participant is then asked to choose their most-preferred bundle. The results of the survey can then be analyzed using multiple regression to estimate component values.
The exercise of identifying and quantifying costs and benefits that relate to non-market goods requires a reference point, usually determined by the legal rights of those with economic standing. If those who have a legal right to a good would lose it under a particular policy alternative, their WTA payment for the loss of that good is considered a cost. If those who do not have a legal right to a good would be granted the good under a policy alternative, their WTP for it is considered a benefit.
For example, a government agency could measure the value of reducing noise around a proposed airport by determining how much the affected residents would pay for the noise reduction (a WTP measure), or by determining what price they would need to offer residents to put up with the noise (a WTA measure). The first method assumes that residents have no right to quiet and would need to purchase it; the second assumes that residents have a right to quiet and would need to be compensated for giving up the right. The first measure, the WTP, is constrained by the residents’ income; the second, the WTA, is not. Thus, the second measure will be larger than the first, often by a considerable margin.10
In practice, WTP measures are often used to determine both benefits and costs due to difficulties in determining WTA data. For example, the cost of having one’s home condemned under eminent domain might be much more than its market value, as the homeowner would have an incentive to overstate her willingness to accept (WTA). The willingness to pay (as determined by the market price for the house, for instance) might be used instead. The use of WTP for both benefits and costs will tend to bias downward the benefit-cost ratio as it underestimates costs.
10 Indeed, if an analysis begins with the assumption that an individual does not have the right to the goods and asks what the individual is willing to pay for the goods, the individual’s response will necessarily be constrained by her income – that is, by how much she can afford to pay. If an analysis assumes that the individual already has the right to the goods, and asks what she would be willing to accept to forego it, then her total income will include the goods, and she will require higher compensation because the value of additional money is now lower in her eyes (the income effect). The greater the value of the goods under consideration and the lower the income of the individual, the greater will be the difference between WTA and WTP for that goods.
A Primer for Understanding Benefit-Cost Analysis 12
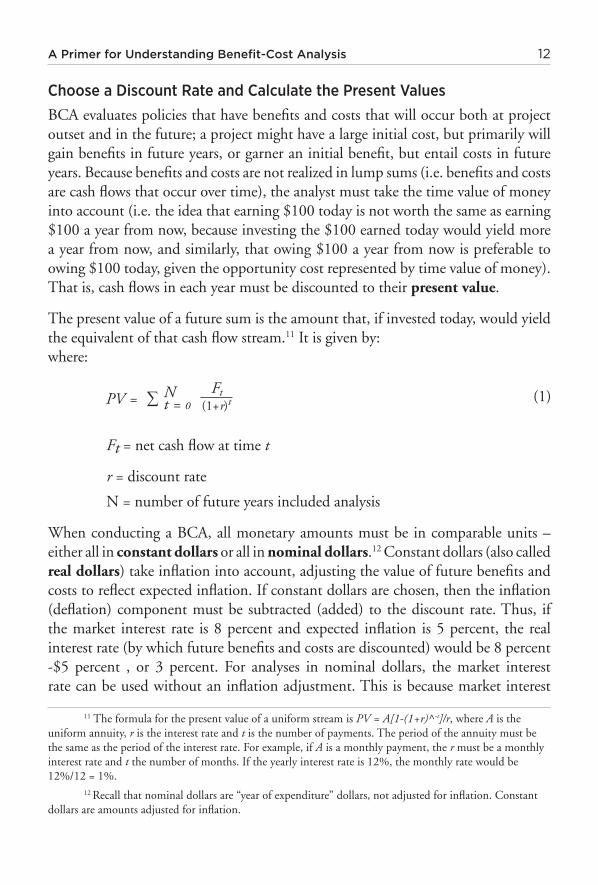
Choose a Discount Rate and Calculate the Present ValuesBCA evaluates policies that have benefits and costs that will occur both at project outset and in the future; a project might have a large initial cost, but primarily will gain benefits in future years, or garner an initial benefit, but entail costs in future years. Because benefits and costs are not realized in lump sums (i.e. benefits and costs are cash flows that occur over time), the analyst must take the time value of money into account (i.e. the idea that earning $100 today is not worth the same as earning $100 a year from now, because investing the $100 earned today would yield more a year from now, and similarly, that owing $100 a year from now is preferable to owing $100 today, given the opportunity cost represented by time value of money). That is, cash flows in each year must be discounted to their present value.
The present value of a future sum is the amount that, if invested today, would yield the equivalent of that cash flow stream.11 It is given by:where:
Ft = net cash flow at time t
r = discount rate
N = number of future years included analysis
When conducting a BCA, all monetary amounts must be in comparable units – either all in constant dollars or all in nominal dollars.12 Constant dollars (also called real dollars) take inflation into account, adjusting the value of future benefits and costs to reflect expected inflation. If constant dollars are chosen, then the inflation (deflation) component must be subtracted (added) to the discount rate. Thus, if the market interest rate is 8 percent and expected inflation is 5 percent, the real interest rate (by which future benefits and costs are discounted) would be 8 percent -$5 percent , or 3 percent. For analyses in nominal dollars, the market interest rate can be used without an inflation adjustment. This is because market interest
11 The formula for the present value of a uniform stream is PV = A[1-(1+r)^-t]/r, where A is the uniform annuity, r is the interest rate and t is the number of payments. The period of the annuity must be the same as the period of the interest rate. For example, if A is a monthly payment, the r must be a monthly interest rate and t the number of months. If the yearly interest rate is 12%, the monthly rate would be 12%/12 = 1%.
12 Recall that nominal dollars are “year of expenditure” dollars, not adjusted for inflation. Constant dollars are amounts adjusted for inflation.
PV = N t = 0
∑ Ft(1+r)t
(1)
13 ACTIONABLE INTELLIGENCE: Policy Reform Through Integrated Data Systems
rates contain an expected inflation component. Real rates show less variability than nominal rates, and, for that reason among others, we recommend using real values, usually based on past real rates, rather than nominal values, as better representing what the future will hold.
The discount rate has a powerful effect on the determination of whether or not the project is worthwhile; thus, it should be chosen with care. Given the temporal distribution of project benefits and costs, a chosen discount rate can cause a project to pass (or fail) a benefit-cost test. For a project with large near-term costs and benefits occurring in future years, a higher discount rate increases the chance that the project will fail a benefit-cost test, and vice versa for a project with front-loaded benefits and cost primarily in future years. If the entity for which the BCA is being conducted does not already have a guideline discount rate, the analyst should choose a baseline rate that takes into account the opportunity cost of money, inflation, and the risk of the cash flow(s) (with riskier cash flows necessitating a higher discount rates).
As a default, the federal Office of Management and Budget states that a real discount rate of 7 percent (i.e. free from inflation effects) should be used as a base-case for regulatory analysis. However, it goes on to say that “[I]f we take the rate that the average saver uses to discount future consumption as our measure of the social rate of time preference, then the real rate of return on long-term government debt may provide a fair approximation. Over the last thirty years, this rate has averaged around 3 percent in real terms on a pre-tax basis.” 13 There is disagreement about the appropriate rate. For example, the Principles and Standards for Benefit-Cost Analysis prepared by the University of Washington Evans School Center for Benefit-Cost Analysis recommends rates between 6 and 9 percent.14 Other sources recommend rates around 3 percent. The 3 percent discount rate guideline will be used for the examples presented in this paper, although in general we recommend the 7 percent rate. Given the influence of the discount rate on analysis outcomes, it is important to test a range of discount rates above and below the baseline rate to demonstrate the role of the rate itself (and the time preference it represents) in determining whether a project has positive benefits.15
13 U.S. OMB (U.S. Office of Management and Budget). 1992. Guidelines and Discount Rates for Benefit-Cost Analysis of Federal Programs OMB Circular A-94. Washington, D.C.: U.S. Government Printing Office.
14 The Principles and Standards for Benefit-Cost Analysis final report will be made available on the website of the Benefit-Cost Analysis Center in fall 2010. (http://evans.washington.edu/node/1262).
15 A discussion of the reasoning for the rate recommended by the Principles and Standards project is beyond our scope here. See URL
A Primer for Understanding Benefit-Cost Analysis 14
Choose a BCA Measure and Carry Out the CalculationsOnce a discount rate is chosen, it can be applied to the flows of costs and benefits identified in Step 2 in order to account for the time value of money and thus allow the flows to be compared over time. This information can then be used in calculations that will yield a BCA measure for the project. Projects are typically summarized using the Net Present Value (NPV) metric.
The NPV is the present value of benefits minus the present value of costs. An investment is said to pass the BCA test and be financially desirable when the NPV (the present value of benefits minus the present value of costs) is greater than zero. Supposing that the discount rate used in a BCA is r, the interpretation of the NPV measure would be as follows: if the NPV is positive, then the project will return more than r; if the NPV is negative, the project will return less than r, so more could be gained by investing elsewhere.A benefit-cost ratio (B/C), the ratio of the present value of benefits to the present value of costs, has often been used to summarize project analyses. Using this metric, the ratio must be greater than one for the project to be financially acceptable. However, the B/C ratio has an important drawback, as ratios can be misleading when the two projects being compared have different costs (different denominators). The requirement that the B/C ratio be greater than one indicates whether or not the project is worthwhile in the absolute, but does not provide a basis for comparison against other projects. This is a problem of scale: a project with total costs of $100,000 may generate a greater increase in real wealth than one with total costs of $100, but the ratio of benefits to costs may not be as high. Zerbe and Dively (1994) show a method for making B/C ratios comparable. Their adjustments will allow the B/C ratio to give an accurate ranking of alternative projects.
Another metric that is often used to describe projects is the internal rate of return (IRR). The IRR is the discount rate that results in the net benefits (net present value) of a project being exactly zero.16 Though, like the B/C ration, the IRR does not reflect the magnitude of project benefits, it can demonstrate the efficiency of a project; for approval, a project would need to have an IRR that is higher than the opportunity cost. Higher IRR figures reflect a higher return rate on an investment. In theory, a firm or governance body should undertake all projects available that have a B/C ratio greater than one or an IRR greater than the opportunity cost of capital. However, governments are resource limited, and typically must choose the best project from among several that pass a B/C or IRR test. While B/C and IRR
16 One should be aware that the IRR may give a wrong answer or multiple answers. For adjustments to the IRR that result in correct answers and only one answer, see Zerbe and Dively (1994).
15 ACTIONABLE INTELLIGENCE: Policy Reform Through Integrated Data Systems
metrics can identify bad and good projects, only the NPV can identify the best project that engenders the greatest net benefit. Thus, NPV is the standard summary metric for BCA.
Address Risk and UncertaintyBCA almost always involves the consideration of future cash flows, which inherently entails risk and uncertainty. Risk is usually defined as an uncertain outcome to which a probabilistic distribution can be assigned. Uncertainty typically refers to an uncertain outcome for which precise quantitative description is unfeasible or unavailable. Uncertainty is often summarized as an event with an unknown probability distribution. For the most part, this distinction is unimportant in BCA; well-quantified risks and poorly quantified uncertainties can both be addressed using sensitivity techniques and probabilistic analysis (see below). Any uncertainties that cannot be addressed quantitatively are then addressed qualitatively in the discussion of analysis results.
There are typically multiple uncertainties in a BCA model. To account for this, analysts often use a probabilistic simulation technique known as Monte Carlo analysis. In a Monte Carlo analysis, the BCA model is simulated a large number of times (often 10,000); each time, parameter estimates are “drawn” from their associated probability distribution, and these values are then employed within the model for that particular iteration. The resulting distribution of analysis outcomes based upon using 10,000 different values for a given parameter can then demonstrate the potential impact of uncertainty on the accuracy of the analysis. Similarly, a sensitivity analysis can vary a given parameter within the model to examine the relationship between change in that parameter and model outcomes. A sensitivity analysis typically isolates one uncertain parameter and manipulates the value, whereas a Monte Carlo analysis varies all uncertain values in concert and randomly chooses each value (based upon a specified distribution).
A Primer for Understanding Benefit-Cost Analysis 16
The Use of Benefit-Cost Analysis: When and to what extent is BCA used?
All financial analyses entail a tradeoff between the cost of the analysis and the value of information gained. A comprehensive BCA can be resource intensive, especially for social policy initiatives, where benefits (and costs) typically accrue in non-market arenas. For areas such as health and the environment, collection and generation of data can be time-consuming and expensive. This serves as a barrier to broader implementation of BCA, as proper data collection can make BCA appear cost-prohibitive.
How much is it worth spending on performing a BCA? The classic business model solution is embodied by the concept of proportionate analysis, which holds that analysis expenditure should be justified by the return to whatever information is gained. Since additional time and resources expended toward gathering data, building more complex models, or disaggregating effects, increase analysis costs, the cost of acquiring such information should at least be equaled by the expected decision-making benefit provided by the informational gain (Farrow and Viscusi 2010). Essentially, this means that an analysis should be subject its own internal BCA. This idea applies to the various nested levels of analysis, including the number and types of policy options considered, types of benefits and costs, whether distributional impacts are included, and the extent to which such impacts should be assessed (Wiener et al. 2009).
This approach, however, ignores the public-goods nature of information. Just as a business will analyze to the extent it benefits itself, so government departments may do the same. Information has value not only for the project at hand but for future similar projects by others, and this social value will not be considered by a piecemeal approach. In many instances, it is does not appear feasible to determine the value of information for a single study. Where integrated data systems are available, they can reduce the costs of conducting a benefit-cost analysis and discover worthwhile projects that otherwise might not have been found.
17 ACTIONABLE INTELLIGENCE: Policy Reform Through Integrated Data Systems
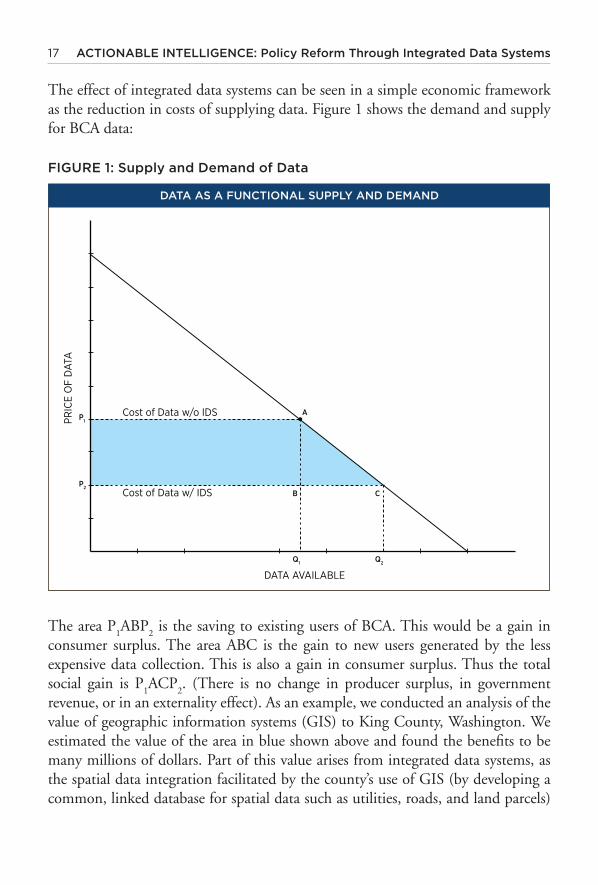
The effect of integrated data systems can be seen in a simple economic framework as the reduction in costs of supplying data. Figure 1 shows the demand and supply for BCA data:
FIGURE 1: Supply and Demand of Data
The area P1ABP
2 is the saving to existing users of BCA. This would be a gain in
consumer surplus. The area ABC is the gain to new users generated by the less expensive data collection. This is also a gain in consumer surplus. Thus the total social gain is P
1ACP
2. (There is no change in producer surplus, in government
revenue, or in an externality effect). As an example, we conducted an analysis of the value of geographic information systems (GIS) to King County, Washington. We estimated the value of the area in blue shown above and found the benefits to be many millions of dollars. Part of this value arises from integrated data systems, as the spatial data integration facilitated by the county’s use of GIS (by developing a common, linked database for spatial data such as utilities, roads, and land parcels)
Cost of Data w/o IDS
Cost of Data w/ IDS
PRIC
E O
F D
ATA
DATA AVAILABLE
A
B C
Q1 Q2
P1
P2
DATA AS A FUNCTIONAL SUPPLY AND DEMAND
A Primer for Understanding Benefit-Cost Analysis 18
fostered a large increase in productivity and a decrease in marginal output costs for tasks requiring spatial data. Moreover, the county is able to realize new benefits due to the enhanced capabilities offered by GIS.
The above example is meant to speak to the broader issue that BCA will gain greater traction and be implemented more widely at the various scales of policy decision-making (and will produce more benefits) if the cost of reaching the directionally correct information threshold is reduced. There is a huge potential benefit to be obtained then from creating and maintaining large data systems that provide detailed, timely, and relevant information otherwise unavailable (Culhane and Metraux 1997), effectively reducing the cost of conducting a useful, accurate BCA.
The value of social information represents the preferred means by which to address the issue of conducting BCA in a resource-limited world. By making data widely available, the cost of conducting BCA can be greatly reduced. This means that an analysis can reach a more accurate informational threshold at a lower expenditure level. Culhane et. al. (2010) discuss the concept (and huge potential benefits) of developing integrated data systems for social policy in great detail. Specifically for BCA application, integrated data systems offer several significant benefits. First, the development of a shadow price repository or database provides a ready source for practitioners to get key values to plug into a model, rather than having to root around for or calculate such values themselves. Not only would this greatly reduce the cost burden associated with obtaining such figures, but it would also increase standardization and accuracy. One would expect that such a common, peer-reviewed source would furnish the most up-to-date, accurate figures, and using the same metrics allows for more faithful comparisons of different analyses. It is important to note, however, that such standardization would not prevent analysts from adequately addressing aspects unique to any particular project or context; that is to say, standardization in this case refers to common sourcing and estimation techniques, not the application of a uniform figure for any and all cases. Moreover, we would contend that a further benefit of integrated data would be that impacts and outcomes could be linked with greater nuance to specific places and contexts, thus allowing for shadow prices to be applied with greater precision.
Second, since social policy BCA often requires analyses across different markets, the analyst must seek to acquire data from several different agency sources and consult different policy-sector literature bases. For instance, education policy has an effect not only in the field of education, but on crime, health, and social-welfare outcomes as well. Developing a comprehensive, queryable database that collects data from
19 ACTIONABLE INTELLIGENCE: Policy Reform Through Integrated Data Systems
different governmental bodies would provide a common, unified source that analysts could consult. This would help ensure that analyses are conducted using standardized, accurate data, making analyses more comparable as well as less expensive.
Finally, such an integrated data system could also serve as a library of BCAs already conducted. This would allow analysts to easily consult and compare with others’ work and help further the state of the art. Moreover, if these analyses are embedded within the database and employ data stored there, analyses can also be replicated. This would greatly increase transparency.
Clearly, the field of BCA would benefit greatly from the implementation of integrated government data systems and an increased effort toward data accessibility. If the cost of acquiring and employing data can be decreased, it can be expected that BCA will be used more extensively in policy decision-making. Further, it can be expected that analyses will be more comprehensive and more accurate. This, in turn, should greatly improve policy decision-making and provide increased social benefits.
Benefit-Cost Analysis in Practice: City of Ortin Example
The application of the basic steps of BCA will be discussed below using a simple, fictional example. In this example, the data requirements are simple, consisting of truck purchase costs, maintenance costs, depreciation and the cost of contracting out. Even in this simple example, however, it would be useful to have data on all of these provided by another government agency. Consider the following problem faced by the city of Ortin17:
Defining the Scope of the Analysis The Ortin city council is attempting to decide whether the city should purchase a garbage truck and conduct its own waste management service or should continue to contract out for garbage collection from a private firm. In this instance, policy-makers have already specified the range of alternatives to be explored; the analysis will only examine the two pre-specified alternatives. Had the council requested that the analyst develop and examine a range of waste management policy alternatives, the BCA might include a wide range of other policy alternatives such as a dual waste and recycling management pick-up program or a deposit program on consumer goods.
17 Ortin is a real town but the example is hypothetical.
A Primer for Understanding Benefit-Cost Analysis 20
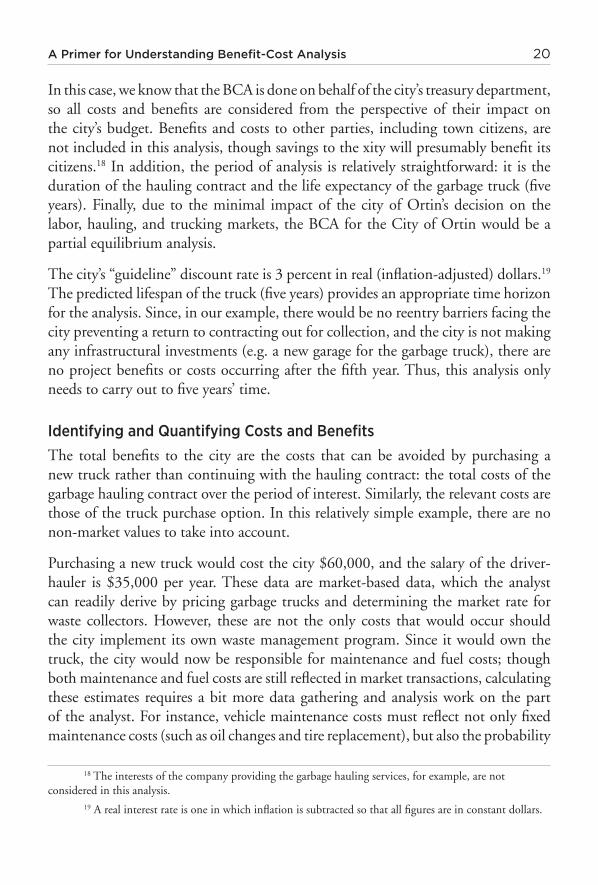
In this case, we know that the BCA is done on behalf of the city’s treasury department, so all costs and benefits are considered from the perspective of their impact on the city’s budget. Benefits and costs to other parties, including town citizens, are not included in this analysis, though savings to the xity will presumably benefit its citizens.18 In addition, the period of analysis is relatively straightforward: it is the duration of the hauling contract and the life expectancy of the garbage truck (five years). Finally, due to the minimal impact of the city of Ortin’s decision on the labor, hauling, and trucking markets, the BCA for the City of Ortin would be a partial equilibrium analysis.
The city’s “guideline” discount rate is 3 percent in real (inflation-adjusted) dollars.19 The predicted lifespan of the truck (five years) provides an appropriate time horizon for the analysis. Since, in our example, there would be no reentry barriers facing the city preventing a return to contracting out for collection, and the city is not making any infrastructural investments (e.g. a new garage for the garbage truck), there are no project benefits or costs occurring after the fifth year. Thus, this analysis only needs to carry out to five years’ time.
Identifying and Quantifying Costs and BenefitsThe total benefits to the city are the costs that can be avoided by purchasing a new truck rather than continuing with the hauling contract: the total costs of the garbage hauling contract over the period of interest. Similarly, the relevant costs are those of the truck purchase option. In this relatively simple example, there are no non-market values to take into account.
Purchasing a new truck would cost the city $60,000, and the salary of the driver-hauler is $35,000 per year. These data are market-based data, which the analyst can readily derive by pricing garbage trucks and determining the market rate for waste collectors. However, these are not the only costs that would occur should the city implement its own waste management program. Since it would own the truck, the city would now be responsible for maintenance and fuel costs; though both maintenance and fuel costs are still reflected in market transactions, calculating these estimates requires a bit more data gathering and analysis work on the part of the analyst. For instance, vehicle maintenance costs must reflect not only fixed maintenance costs (such as oil changes and tire replacement), but also the probability
18 The interests of the company providing the garbage hauling services, for example, are not considered in this analysis.
19 A real interest rate is one in which inflation is subtracted so that all figures are in constant dollars.
21 ACTIONABLE INTELLIGENCE: Policy Reform Through Integrated Data Systems
of incurring unexpected maintenance costs such as part failure or a flat tire. To estimate this, the analyst might use repair data from other municipalities.
This is a ready example of the potential utility of an integrated database; such a database might provide the analyst with a data set of vehicle maintenance costs incurred in other areas or agencies, or better yet, provide a shadow price of vehicle maintenance cost per mile traveled. The analyst could then estimate the number of miles the garbage truck would travel (which must be done to estimate fuel costs in any case) and ensure that the price is accurately scaled (in terms of the price of parts, etc.) for a garbage truck, and thus readily provide an estimate of maintenance costs. Without the database or shadow price, the analyst would either need to devote more time and effort to deriving an estimate, or else make do with a rougher estimate, resulting in either a more expensive, or less accurate, BCA. Moreover, real-world policy BCAs are required to be much more detailed than this simple example. For instance, the city might wish to know the environmental benefits and costs of the two policies or subsequent economic impacts, requiring even more data and shadow price estimates.
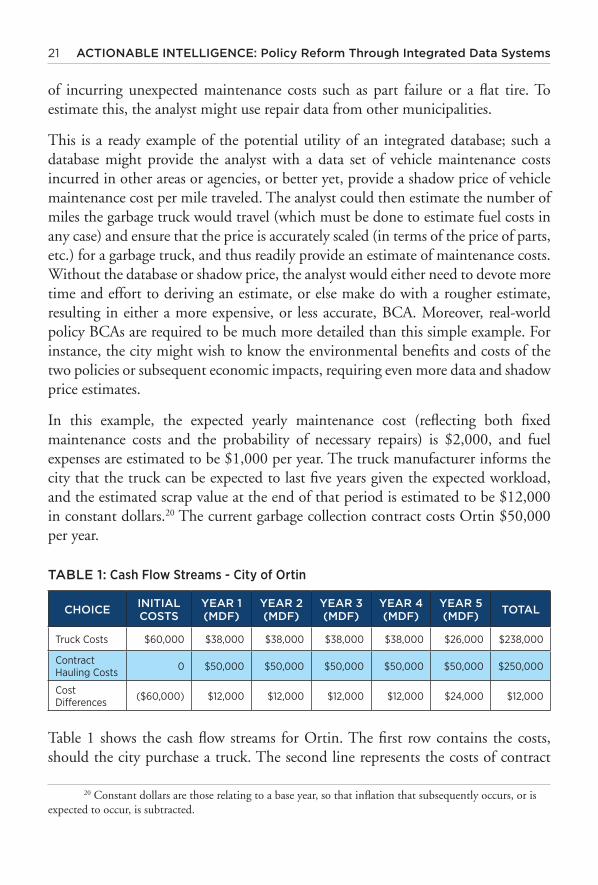
In this example, the expected yearly maintenance cost (reflecting both fixed maintenance costs and the probability of necessary repairs) is $2,000, and fuel expenses are estimated to be $1,000 per year. The truck manufacturer informs the city that the truck can be expected to last five years given the expected workload, and the estimated scrap value at the end of that period is estimated to be $12,000 in constant dollars.20 The current garbage collection contract costs Ortin $50,000 per year.
TABLE 1: Cash Flow Streams - City of Ortin
CHOICEINITIAL COSTS
YEAR 1 (MDF)
YEAR 2 (MDF)
YEAR 3 (MDF)
YEAR 4 (MDF)
YEAR 5 (MDF)
TOTAL
Truck Costs $60,000 $38,000 $38,000 $38,000 $38,000 $26,000 $238,000
Contract Hauling Costs 0 $50,000 $50,000 $50,000 $50,000 $50,000 $250,000
Cost Differences ($60,000) $12,000 $12,000 $12,000 $12,000 $24,000 $12,000
Table 1 shows the cash flow streams for Ortin. The first row contains the costs, should the city purchase a truck. The second line represents the costs of contract
20 Constant dollars are those relating to a base year, so that inflation that subsequently occurs, or is expected to occur, is subtracted.
A Primer for Understanding Benefit-Cost Analysis 22
hauling. The term “MDF” accounts for maintenance, driver, and fuel costs. The base comparison is a continuation of the status quo: contracting out for waste collection. Determining this reference point is crucial to BCA, as benefits and costs of a project must be defined relative to what would happen without the project being implemented. In this example, this is somewhat inconsequential (because a BCA will select the same project regardless of which one is used as the baseline for comparison in this case), as the city has decided it must collect garbage by one means or another, and there are no transaction costs to switching from the current policy. However, if the city was deciding whether or not to provide a waste collection service at all, or looking to initiate a solid waste service for the first time, it would be crucial to develop the true null alternative to these policies (i.e. what would happen in the absence of a policy implementation).21
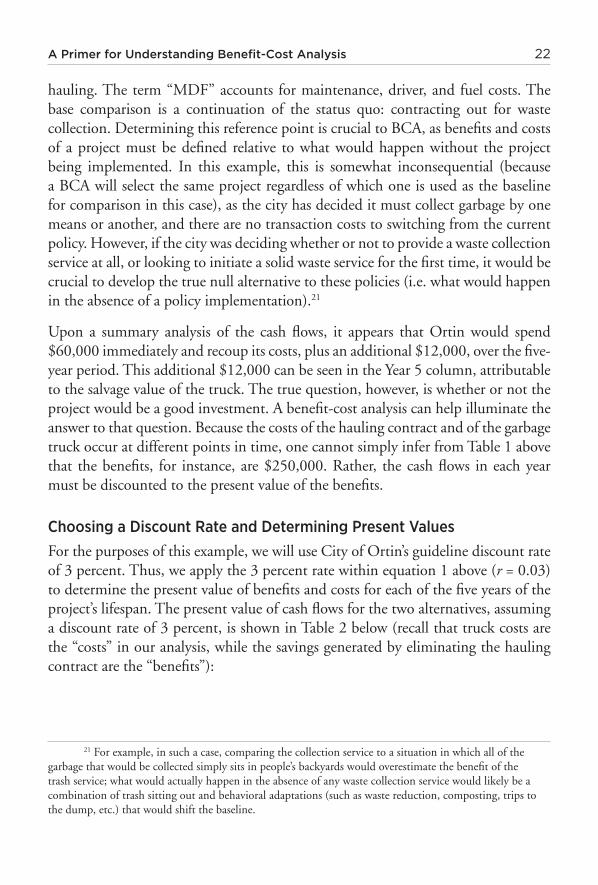
Upon a summary analysis of the cash flows, it appears that Ortin would spend $60,000 immediately and recoup its costs, plus an additional $12,000, over the five-year period. This additional $12,000 can be seen in the Year 5 column, attributable to the salvage value of the truck. The true question, however, is whether or not the project would be a good investment. A benefit-cost analysis can help illuminate the answer to that question. Because the costs of the hauling contract and of the garbage truck occur at different points in time, one cannot simply infer from Table 1 above that the benefits, for instance, are $250,000. Rather, the cash flows in each year must be discounted to the present value of the benefits.
Choosing a Discount Rate and Determining Present ValuesFor the purposes of this example, we will use City of Ortin’s guideline discount rate of 3 percent. Thus, we apply the 3 percent rate within equation 1 above (r = 0.03) to determine the present value of benefits and costs for each of the five years of the project’s lifespan. The present value of cash flows for the two alternatives, assuming a discount rate of 3 percent, is shown in Table 2 below (recall that truck costs are the “costs” in our analysis, while the savings generated by eliminating the hauling contract are the “benefits”):
21 For example, in such a case, comparing the collection service to a situation in which all of the garbage that would be collected simply sits in people’s backyards would overestimate the benefit of the trash service; what would actually happen in the absence of any waste collection service would likely be a combination of trash sitting out and behavioral adaptations (such as waste reduction, composting, trips to the dump, etc.) that would shift the baseline.
23 ACTIONABLE INTELLIGENCE: Policy Reform Through Integrated Data Systems
TABLE 2: Present Values of Programs
INITIAL COSTS
YEAR 1 YEAR 2 YEAR 3 YEAR 4 YEAR 5 TOTAL
Nominal Truck Costs $60,000 $38,000 $38,000 $38,000 $38,000 $26,000 $238,000
PV of Truck Costs $60,000 $36,893 $35,819 $34,775 $33,763 $22,428 $223,678
Nominal Contract Hauling Costs
0 $50,000 $50,000 $50,000 $50,000 $50,000 $250,000
PV of Hauling Contract Cost $0 $48,544 $47,130 $45,757 $44,424 $43,130 $228,985
Cost Difference ($60,000) $12,000 $12,000 $12,000 $12,000 $24,000 $12,000
PV of Cost Difference (Net Present Value)
($60,000) $11,650 $11,311 $10,982 $10,662 $20,703 $5,308
Computing a Summary Metric and Comparing AlternativesAs appears from the calculations above, if the City of Ortin used a 3 percent discount rate, the net present cost to the city of contract hauling is $228,985 (NPV = (-228,985)), whereas the net present cost of purchasing and operating the garbage truck is $223,678 (NPV = (-223,678)). Thus, when compared to the baseline (contract hauling), the NPV of purchasing and operating a garbage truck would be $5,308. Since this figure is greater than zero, we would conclude that the project is financially desirable. Note that this decision is highly dependent upon the discount rate chosen. If, for instance, the city used a 7 percent real discount rate, the project would not pass the BCA test: the net present value of the project would be -$2,242.
Let us review the elements of the BCA for the city of Ortin: the baseline is the present program, the waste-hauling contract. The sum of the present value of any savings that can be made over the costs of this program constitutes the net present value ($5,308). The present value of the costs of the truck program is lower than the present value of the contract program, so the NPV is positive. Table 6 demonstrates the results for each of the four evaluation criteria. The B/C ratio is obtained simply by setting the NPV of the truck purchasing option over that of contract hauling. The IRR can be obtained readily using computer software; instead of setting the interest rate in the case flow equation and calculating NPV, NPV is set to zero and cash flow equation is solved for r (the interest rate).
A Primer for Understanding Benefit-Cost Analysis 24
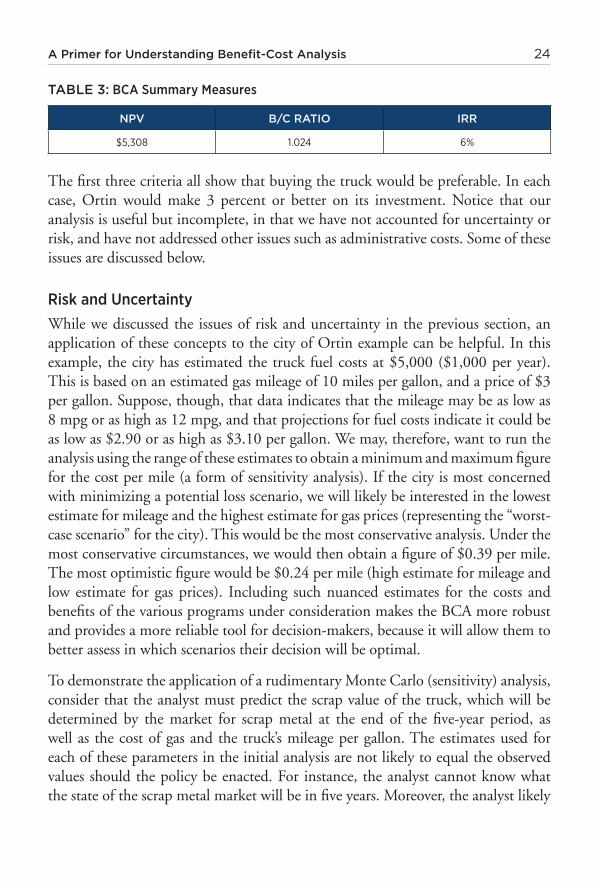
TABLE 3: BCA Summary Measures
NPV B/C RATIO IRR
$5,308 1.024 6%
The first three criteria all show that buying the truck would be preferable. In each case, Ortin would make 3 percent or better on its investment. Notice that our analysis is useful but incomplete, in that we have not accounted for uncertainty or risk, and have not addressed other issues such as administrative costs. Some of these issues are discussed below.
Risk and UncertaintyWhile we discussed the issues of risk and uncertainty in the previous section, an application of these concepts to the city of Ortin example can be helpful. In this example, the city has estimated the truck fuel costs at $5,000 ($1,000 per year). This is based on an estimated gas mileage of 10 miles per gallon, and a price of $3 per gallon. Suppose, though, that data indicates that the mileage may be as low as 8 mpg or as high as 12 mpg, and that projections for fuel costs indicate it could be as low as $2.90 or as high as $3.10 per gallon. We may, therefore, want to run the analysis using the range of these estimates to obtain a minimum and maximum figure for the cost per mile (a form of sensitivity analysis). If the city is most concerned with minimizing a potential loss scenario, we will likely be interested in the lowest estimate for mileage and the highest estimate for gas prices (representing the “worst-case scenario” for the city). This would be the most conservative analysis. Under the most conservative circumstances, we would then obtain a figure of $0.39 per mile. The most optimistic figure would be $0.24 per mile (high estimate for mileage and low estimate for gas prices). Including such nuanced estimates for the costs and benefits of the various programs under consideration makes the BCA more robust and provides a more reliable tool for decision-makers, because it will allow them to better assess in which scenarios their decision will be optimal.
To demonstrate the application of a rudimentary Monte Carlo (sensitivity) analysis, consider that the analyst must predict the scrap value of the truck, which will be determined by the market for scrap metal at the end of the five-year period, as well as the cost of gas and the truck’s mileage per gallon. The estimates used for each of these parameters in the initial analysis are not likely to equal the observed values should the policy be enacted. For instance, the analyst cannot know what the state of the scrap metal market will be in five years. Moreover, the analyst likely
25 ACTIONABLE INTELLIGENCE: Policy Reform Through Integrated Data Systems
cannot really specify that there is any given probability of the scrap value being x1
and a probability of it being x2 and calculate an expected value in such fashion.
To account for this uncertainty, the analyst could instead then have the Monte Carlo simulation draw from a distribution with a mean of the predicted value ($12,000) and a specified standard error term. If the scrap metal market is volatile, this might be a larger term, and vice versa if it is expected to remain fairly static. Each iteration would also conduct a draw from the estimated distribution of gas prices and miles per gallon. The results of each model iteration can be evaluated to determine the expected distribution of project outcomes given these multiple sources of uncertainty. Decision-makers can examine the distribution of outcomes to see if purchasing and operating the truck engenders positive net benefits (relative to contract hauling) at their desired level of risk. For instance, the city might only wish to purchase and operate the truck if there is a 90 percent probability that this option will engender net benefits; the Monte Carlo analysis would demonstrate how many of the simulations achieve this level (for the 90 percent probability threshold, 9,000 of the 10,000 simulations would need to demonstrate positive net benefits), providing an estimate of the likelihood that the project achieves this threshold given the multiple uncertainties involved.
Finally, even in the narrow Ortin example, there is a social value to information, beyond its value to the city of Ortin. The data collected and analyzed by the city furthers the base of knowledge available for future analyses. In analyzing important social problems that are acted upon by governance bodies across jurisdictional boundaries and policy sectors, such as public transportation, health and human services, and housing and homelessness policies, the social value of information will be particularly high--much larger than the social information value shown in the Ortin example. There are multiple, extensive effects stemming from these cross-sector, trans-jurisdictional social policy issues, and comprehensive data on these effects can serve the analytical needs of numerous policy applications.
Conclusion
Whether done in a highly complex fashion for a multi-billion dollar federal project or in a simple, “back-of-the-envelope”-type application for a minor city government rule change, benefit-cost analysis is predicated on the value of information. The basic role of BCA is to provide information that serves to improve decision-making and leads to more efficient policies. Graham (2008) makes a strong empirical case that despite various sources of criticism, BCA has proved efficacious in this regard. As a
A Primer for Understanding Benefit-Cost Analysis 26
tool for policy-makers, BCA helps facilitate more efficient, effective, and beneficial decision-making at every level of policy.
By monetizing policy outcomes, BCA can produce comprehensive assessments of policy interventions that can be compared within a portfolio of policy options. Rather than focusing on sector-specific metrics such as health outcomes, educational attainment, or crime statistics as policy end-goals, BCA takes a broader approach to improving social welfare. This full monetization gives policy-makers access to a range of policy options otherwise unavailable. BCA allows for cross-sector policy comparisons, such as comparing the crime-reducing benefits of education spending and criminal-justice enforcement efforts. In social policy, where many policy effects accrue outside of the targeted policy focus (Vining and Weimer 2010), this is especially important, as alternative solutions can often prove to foster increased efficiency and better outcomes; without the ability to compare, and then employ, diverse policy strategies, social welfare would suffer.
However, these same demands of comprehensiveness and consistency make BCA a highly demanding and complex endeavor. While it is imperative that BCA be employed more widely, comprehensively, and consistently in decision-making, this will only be achieved as long as decision-makers and analysts have the resources to do so. The implementation of BCA can be furthered either by: (a) devoting more time and resources to conducting analyses; or (b) reducing the cost of conducting analyses, in terms of both time and funds, such that appropriate and comprehensive BCAs are more accessible. In our view, the latter option represents the most efficient method. The development of integrated data systems that contain not only raw data, but refined data in the form of key estimates and shadow prices, as well as the methodology and results of other BCAs, would make it much more feasible for analysts at all levels of government and the non-profit sector to conduct BCA. Moreover, for those agencies and individuals already employing BCA, such integrated data systems would reduce the cost and increase the quality of their analyses. Given the sizeable gains already wrought through the application of BCA (again, see Graham 2008), it seems a reasonable hypothesis then that expanding the use and increasing the quality of BCAs in policy-making would, in turn, sizably increase social welfare. Hopefully, these gains can be realized in the near future.
27 ACTIONABLE INTELLIGENCE: Policy Reform Through Integrated Data Systems
References
Boardman, A.E., D.H. Greenberg, A.R. Vining, and D.L. Weimer. 2010. Cost-Benefit Analysis: Concepts and Practice, 3rd Edition. Upper Saddle River, NJ: Prentice Hall.
Brent, R. 1998. Cost-Benefit Analysis for Developing Countries. Cheltenham, UK: Edward Elgar.
Burgess, D. and R. Zerbe, 2011. Appropriate discounting for benefit-cost analysis. Journal of BCA. 2(2): 2.
Bush, G.W. [President]. 2002. Executive Order No. 13258. Federal Register 76: 9385 (February 28, 2002).
Bush, G.W. [President]. 2007. Executive Order No. 13422. Federal Register 72: 2763 (January 23, 2007).
Clinton, W.J. [President]. 1993. Executive Order No. 12866. Code of Federal Regulations 3: 638, reprinted as 5 United States Code § 601.
Culhane D.P. and S. Metraux. 1997. Where to from here?: A policy research agenda based on the analysis of administrative data, in Culhane and Hornburg (eds.), Understanding Homelessness: New Policy and Research Perspectives. Washington D.C.: Fannie Mae Foundation.
Daft, R.L. and R.H. Lengel. 1986. Organizational information requirements, media richness, and structural design. Management Science. 32(5): 554-571
Galbraith, J. 1973. Designing Complex Organizations. Addison-Wesley: Reading, MA.
Goodhue, D.L., M.D. Wybo, and L.J. Kirsch. 1992. The impact of data integration on the costs and benefits of information systems. MIS Quarterly, 16(3): 293–311.
Graham, J.D. 2008. Saving lives through administrative law and economics. University of Pennsylvania Law Review. 157(2): 101-245.
Gramlich, E., 1990. A Guide to Benefit-Cost Analysis, 2nd Edition. Englewood Cliffs: Prentice Hall.
Hanley, N. and C. Spash. 1993. Cost-Benefit Analysis and the Environment. Cheltenham, UK: Edward Elgar.
Heimbigner, D. and D. McLeod. 1985. A federated architecture for information management. ACM Transactions on Office Information Systems. 3(3):253-278
Jones, C. 2005. Applied Welfare Economics. Oxford University Press: Oxford.
Litwin, W., L. Mark, and N. Roussopoulos. 1990. Interoperability of multiple autonomous databases. ACM Computing Surveys 22(3): 267-293
Obama, B. [President]. 2009a. Executive Order No. 13,497. Federal Register 74: 6113 (February 4, 2009).
OMB Circular A-94. Washington, D.C.: U.S. Government Printing Office.
A Primer for Understanding Benefit-Cost Analysis 28
Reagan, R. [President]. 1981. Executive Order 12,291. Federal Register 46: 13,193 (February 19, 1981).
Reagan, R. [President]. 1981. Executive Order 12,498. Federal Register 50: 1036 (January 8, 1985).
Schwartz, J.A. (in press). 52 Experiments with regulatory review: The political and economic inputs into state rulemakings. Institute for Policy Integrity. New York, NY: New York University Law School. Report No. 6, 2010.
U.S. OMB (U.S. Office of Management and Budget). 1992. ―Guidelines and Discount Rates for Benefit-Cost Analysis of Federal Programs
Zerbe, R.O. 2007. The legal foundation of cost-benefit analysis. Charleston Law Review 2(1): 93-184.
Zerbe, R.O., and A.S. Bellas. 2006. A primer for benefit-cost analysis. Cheltenham, UK: Edward Elgar Pub.
Zerbe, R.O. and D. Dively. 1994. Benefit-cost Analysis in Theory and Practice. The HarperCollins Series In Economics. New York: HarperCollins College Publishers

29 ACTIONABLE INTELLIGENCE: Policy Reform Through Integrated Data Systems
Acknowledgements
We thank Nevena Lalic, Julia Purcell and Kiana Scott for helpful suggestions that improved readability.
We also wish to thank outside referees who made helpful suggestions. Any deficiencies are nevertheless the responsibility of the authors.