Embed Size (px)
Citation preview

A Preschool Nutrition Primer for RDs
Pediatric Growth Assessment Part I:
The PrinciplesNutrition Screening Tool
for Every PreschoolerÉvaluation de l’alimentation
des enfants d’âge préscolaire
Understand why to assess growth in the nutritional care of children.Learn about the challenges in doing growth assessment; the necessary measuring and plotting tools; and, how to interpret and use growth data ethically and effectively.Be aware of the current and proposed guidelines for assessing and monitoring the growth of Canadian children and youth.Know about the professional and parent resources to use in practice.
Learning Objectives
Presentation Outline
Growth process National Growth Monitoring PositionInterpreting and assessing growth assessment data including BMI for AgeGrowth plotting and growth data interpretation exercisesResources to address growth concernsTake home messages

Overview of Growth
Three distinct stages of growth:infancy: early, rapid growth period.toddler and school-age children: relatively static.teenage years: growth spurt.

Overview of Growth
Weight:birth weight regained by 10-14 days after initial 6-7% loss (diuresis).doubles by 4-5 months, triples by 1 year, quadruples by age 2.
Length:at birth relates best to maternal size.increases by 50% by 1 yearincreases by 75% by age 2.reaches approximately half of adult height by age 2.
Factors Affecting Growth
Genetic constitutionNormal endocrine functionAdequate nutritionAbsence of chronic diseaseNurturing environment
Fetal, infant, environmental and maternal factors can interact to impair intrauterine and postnatal growth.

Why Assess Growth?
Best general index of health and nutritional status of an individual child and a population.A form of screening for growth disorders or health concerns related to growth.Regular serial measurements-early detection of malnutrition, neglect/abuse, or ill health.Determine adequate nourishment.Can be a reliable indicator of adult overweight and obesity.
Improve nutrition.Reduce the risk of inadequate nutrition.Educate caregivers.Early detection and referral for conditions of growth disorders.Define health and nutrition status of populations for program planning.Assess the response to existing interventions.
Desired Outcomes
Growth Measurements
Basic measurementsRecumbent length (birth to 36 months) or standing height.Weight.Head circumference (birth to 36 months).
Derived indicesLength for age, height for age, weight for age, weight for length/height, body mass index (BMI).Compared to age and sex specific reference data.

Challenges in Assessing Growth
Failure to perform measurements.Use of reliable, well-calibrated equipment.Use of standard, accurate, measurement techniques,Appropriate choice of growth charts.Accurate plotting on growth charts.Appropriate interpretation of growth indicators.
National Growth Monitoring Position 2004
CollaboratorsDietitians of Canada, Canadian Pediatric Society, College of Family Physicians of Canada, Community Health Nurses Association of Canada.
Target AudienceHealth care professionals and parents.
PurposeTo facilitate understanding of the growth process and importance of accurate measurement and plotting of anthropometrics.To guide in selection and interpretation of growth charts.

National Recommendations 2004
Use CDC clinical growth chart set 23rd to 97th percentile
Birth to 36 monthsLength, weight, head circumference, weight for length.
2-20 yearsHeight (stature), weight, BMI for Age.
National Recommendations 2004
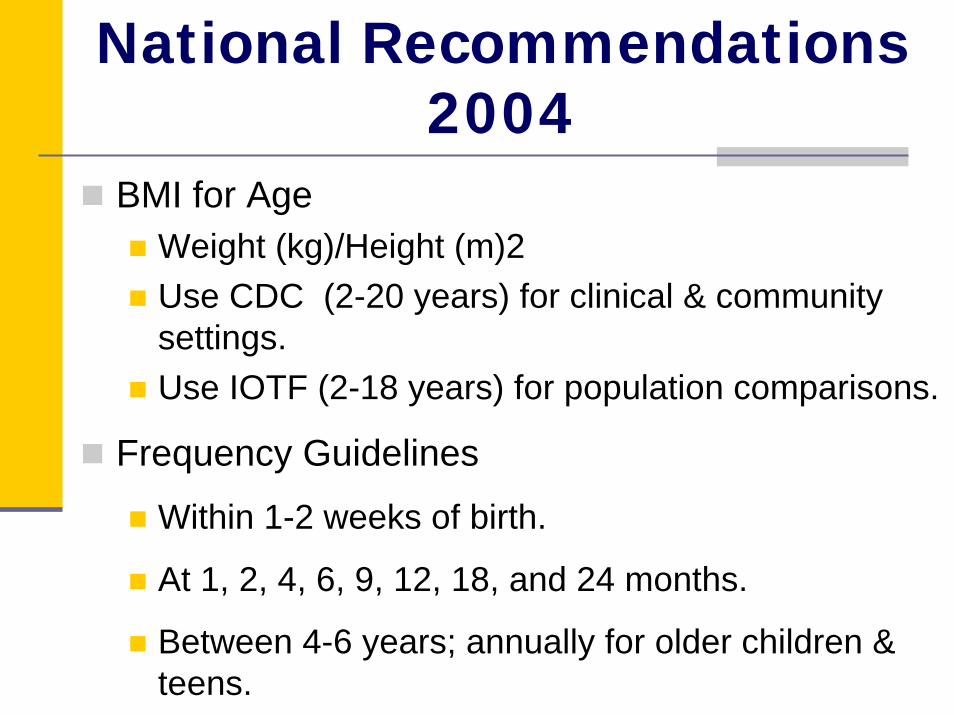
BMI for AgeWeight (kg)/Height (m)2Use CDC (2-20 years) for clinical & community settings.Use IOTF (2-18 years) for population comparisons.
Frequency Guidelines
Within 1-2 weeks of birth.
At 1, 2, 4, 6, 9, 12, 18, and 24 months.
Between 4-6 years; annually for older children & teens.

Children with Special NeedsUse CDC with consideration of conditions affecting growth.
Breastfed InfantsCan use CDC with caution-risk of misinterpretation.Growth rates differ-leaner after 3-4 months.
Preterm InfantsUse gestation adjusted age until 24-36 months.Use CDC or IHDP charts with VLBW and LBW based on purpose of growth tracking.
National Recommendations 2004
WHO Growth Standards
Considered the Gold Standard or a target for all children to achieve.
Correct an existing inconsistency between current nutrition recommendations and growth monitoring practices.
Canadian Collaborative Group evaluated the impact of using the new WHO growth charts.
New Canadian guidelines released February 8, 2010.

Canadian Guidelines2010
Children birth to five years2006 WHO Child Growth Standards
Children and adolescentsWHO Growth Reference 2007
Why?Growth references vs growth standards.Promotion of breastfeeding as the norm.Cross-sectional vs longitudinal growth monitoring.Addressing the obesity epidemic.International sample population.Validation with subjective assessments by HPs.Transitioning charts as child ages.

Canadian Guidelines2010
Differences between CDC and WHOAppearance and age ranges.Breastfed vs formula fed growth patterns.Increased emphasis on the use of BMI-for-age over age 2.Use of z scores.Weight-for-age.Cut-off points and terminology and messages to parents and children.Crossing percentiles and norm percentile “surfing”.Prevalence of under and overnutrition.

Canadian Guidelines2010
Children with Special NeedsPre-term infantsChildren of different ethnicitiesCanadian First Nations, Inuit and Metis
Growth monitoring frequency1-2 weeks after birth.2,4,6,9,12,18,24 months.Annually after age 2 through adolescence.Should occur at all well-health and acute care visit.

Canadian Guidelines2010
Additional References and ResourcesCollaborative StatementExecutive SummaryCurrent Issues: The Inside Story (Q and A for Health Professionals) (members side only)Health Professional’s Guide for using the new WHO growth chartsIs My Child Growing Well? Q and A for Parents
www.dietitians.ca/growthcharts

Growth Charts
CDC charts are a set of growth references-describes a sample with no health claims.WHO charts are growth standards or a “healthy” sample – a model or target to achieve.Assess general nutritional status of a population in diverse settings.Tool with cut-points to screen for health and nutritional disorders.

Growth Charts
An educational resource to promote improved child health care by families.Single measure = size.Serial measurements = growth.Only part of the picture; not a diagnostic tool.

Considerations for Growth Charts and Measurements
Population vs individual datavariability in individual growth and body compositions e.g. 5% of healthy children are below the 5th percentile for stature.direction of measurements more important than actual percentile.
Shifting percentilesnormal percentile shift “regression towards the mean”(50th p) in the first 2-3 years & at puberty.crossing percentiles could be a sign of growth disturbance e.g. ≥ 2 percentiles down = growth failure.
Considerations for Growth Charts and Measurements
Normal versus optimal growthgrowth charts can’t evaluate growth patterns as optimal or sub-optimal.don’t distinguish normal variability and a mild pathological problem.maximal growth is not necessarily optimal growth.
Short versus long-term growthgrowth spurts and periods of stasis - can be difficult to detect due to measurement errors and measurement intervals.seasonal fluctuations-greatest velocity in spring, lowest in the winter.
Considerations for Growth Charts and Measurements
Heredity versus environmentenvironment is modifiable-diet, activity level, disease state, social factors.heritable factors resistant e.g. bone density, body density, BMI, skin fold thickness, stature, muscularity, body proportions.
Sexual and skeletal maturationover / under nutrition affects sexual and skeletal maturation.

Considerations for Growth Charts and Measurements
Catch-up growthunderstanding is limited.growth deficit can be partially recovered but tends to be incomplete.net growth loss affected by severity and length of growth impairment, age at which it occurs.less likely to be fully compensated if occurs over age 2.weight deficits improve first, then height.those who are wasted but not stunted catch-up faster.

Growth of Aboriginal Children
CPS First Nations and Inuit Health CommitteeNeed for special growth charts?Current recommendations-use CDC. This population may have growth patterns that differ from normal standards.Canadian reference population lacked sufficient number of specific racial and ethnic groups to consider separate charts.
Keep in mind the current revision statement from the National Growth Monitoring Position.

Growth of Children with Special Needs
Increased risk of malnutrition and inappropriate growth patterns.Decreased oral intakes, activity levels and repeated medical setbacks.Often have growth curves different from reference curves.Difficult to measure-musculoskeletal deformities, spasms, splints, braces; non-ambulatory, overweight.Alternative measures
crown-rump length, sitting height.body segment lengths (upper arm lengths, lower leg length) or total length (arm, arm or “wing” span).skin-fold measures.
Growth Charts for Children with Special Needs
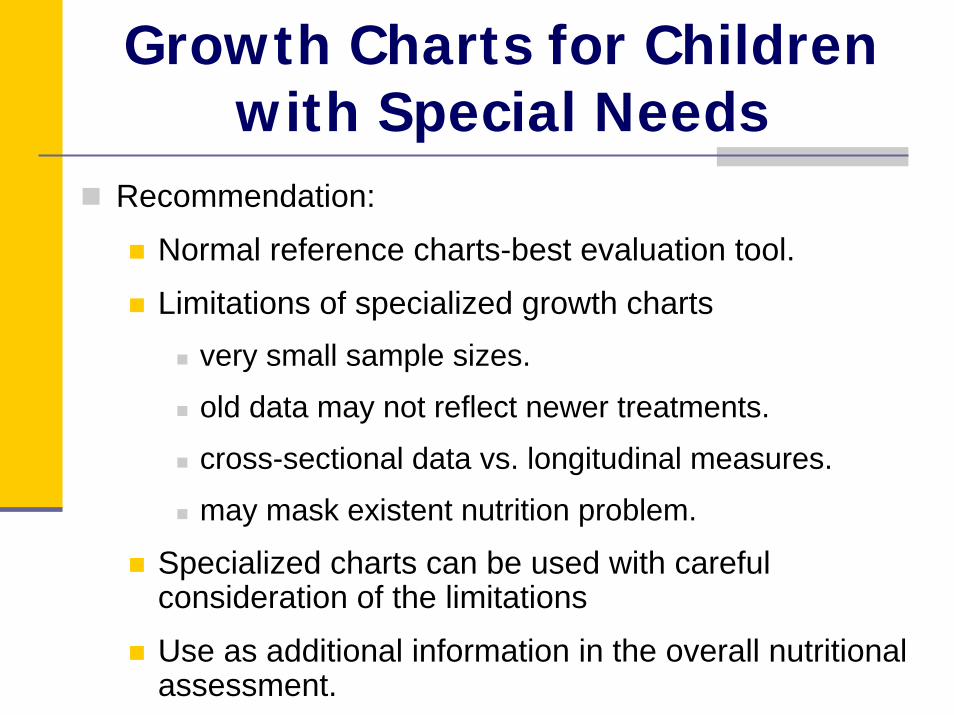
Recommendation:
Normal reference charts-best evaluation tool.
Limitations of specialized growth chartsvery small sample sizes.
old data may not reflect newer treatments.
cross-sectional data vs. longitudinal measures.
may mask existent nutrition problem.
Specialized charts can be used with careful consideration of the limitations
Use as additional information in the overall nutritional assessment.
Growth in Preterm Infants
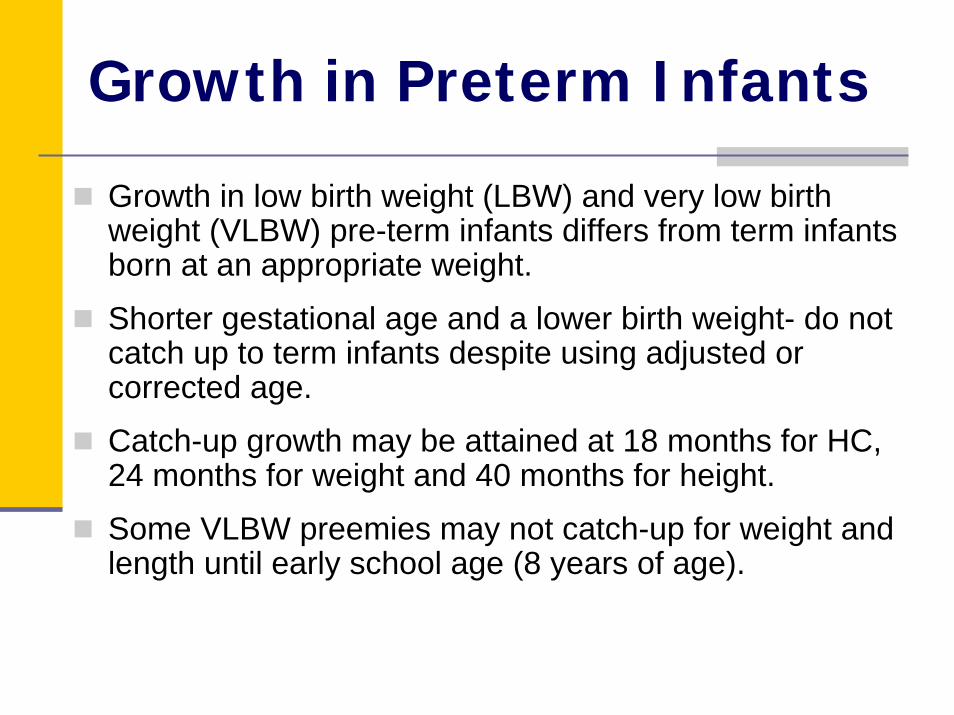
Growth in low birth weight (LBW) and very low birth weight (VLBW) pre-term infants differs from term infants born at an appropriate weight.
Shorter gestational age and a lower birth weight- do not catch up to term infants despite using adjusted or corrected age.
Catch-up growth may be attained at 18 months for HC, 24 months for weight and 40 months for height.
Some VLBW preemies may not catch-up for weight and length until early school age (8 years of age).
Growth in Preterm Infants
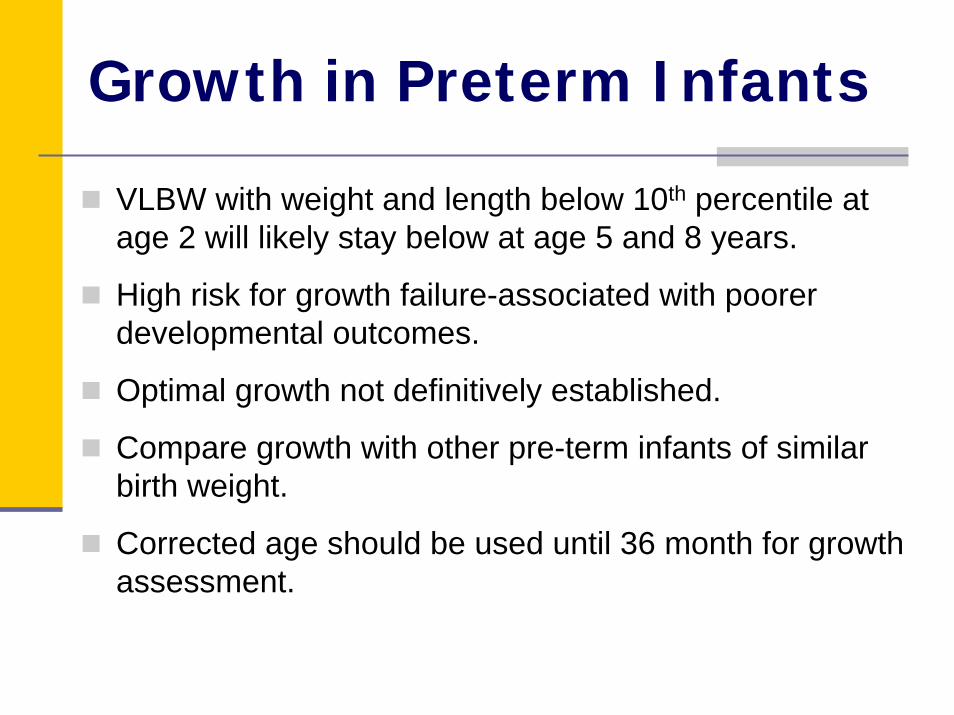
VLBW with weight and length below 10th percentile at age 2 will likely stay below at age 5 and 8 years.
High risk for growth failure-associated with poorer developmental outcomes.
Optimal growth not definitively established.
Compare growth with other pre-term infants of similar birth weight.
Corrected age should be used until 36 month for growth assessment.
Growth in Preterm Infants
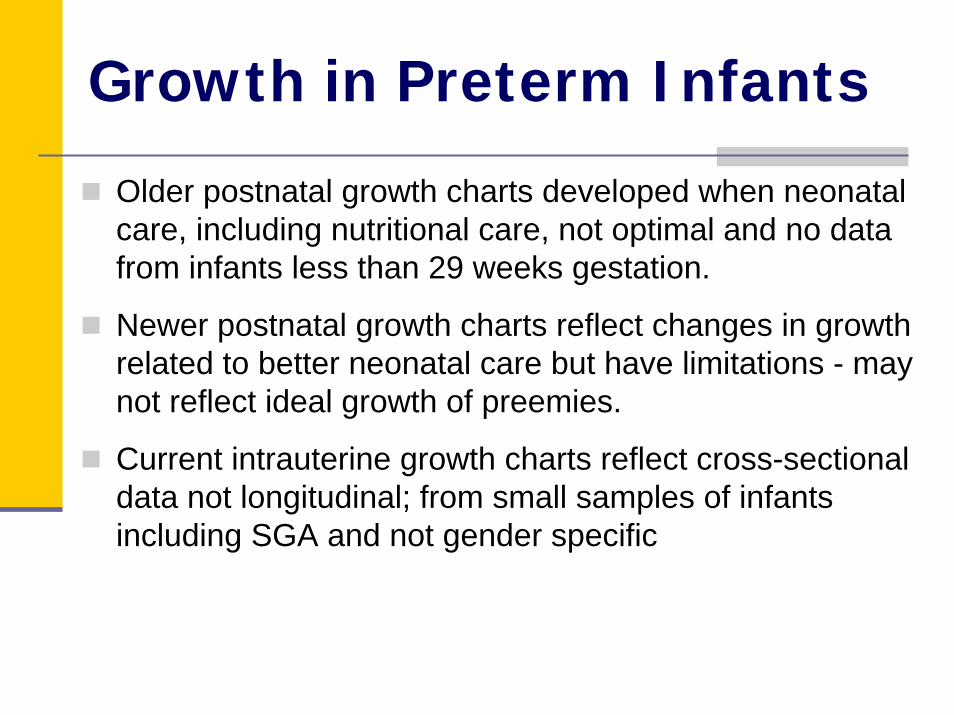
Older postnatal growth charts developed when neonatal care, including nutritional care, not optimal and no data from infants less than 29 weeks gestation.
Newer postnatal growth charts reflect changes in growth related to better neonatal care but have limitations - may not reflect ideal growth of preemies.
Current intrauterine growth charts reflect cross-sectional data not longitudinal; from small samples of infants including SGA and not gender specific

2001 IHDP Growth Charts for Preemies
IHDP or CDC Charts? Based on purpose
Pediatrics 2003 April:111(4Pt 1): 750-8.
BioMed Central Pediatrics 2003 December, 3:13.
Canadian Journal of Dietetic Research and Practice 2004 Spring, 65(1): 22-32.
Growth Monitoring in Community Settings Birth to 20 years: A Reference Manual, March 2005.
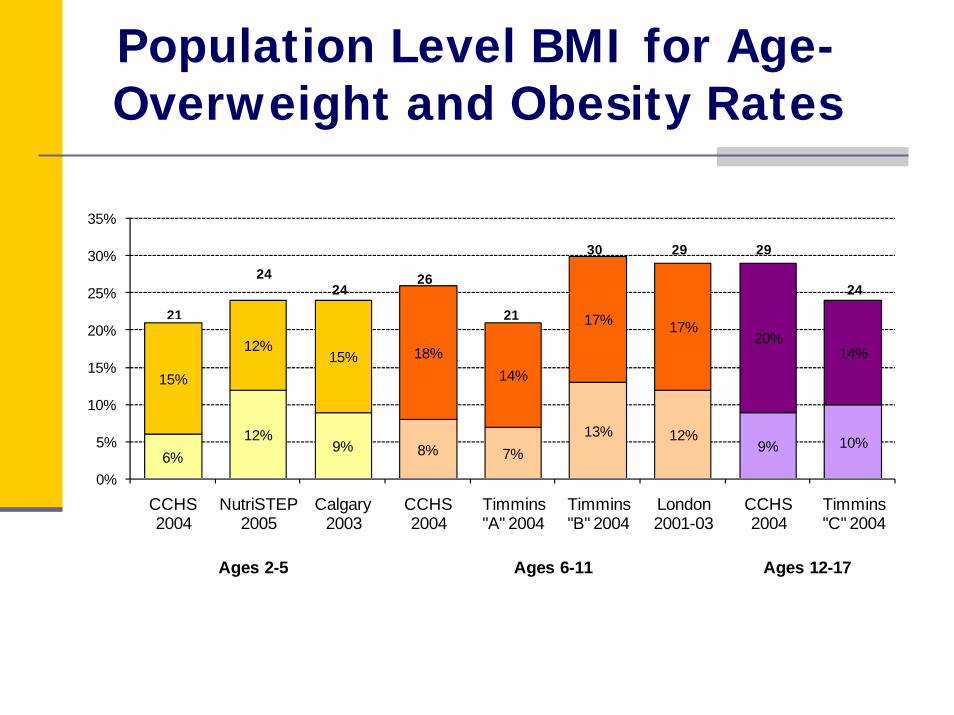
Population Level BMI for Age-Overweight and Obesity Rates
6%12%
9% 8% 7%13% 12%
9% 10%
15%
12%15% 18%
14%
17% 17%20%
14%
0%
5%
10%
15%
20%
25%
30%
35%
CCHS 2004
NutriSTEP 2005
Calgary 2003
CCHS 2004
Timmins "A" 2004
Timmins "B" 2004
London 2001-03
CCHS 2004
Timmins "C" 2004
Ages 2-5 Ages 6-11 Ages 12-17
21
2424
26
21
30 29 29
24

Using BMI to Screen for Pediatric Obesity
Weight-poor indicator of fatness or obesity.Use BMI to screen over age 2.Wt for stature ≠ BMI for age.Stature doesn’t adjust for age during periods when body fat differs substantially e.g. short toddlers, tall infants.BMI for age-safe, simple and inexpensive.Significant correlation to direct measures of fat as well as subcutaneous measures.

Advantages of BMI
Reproducible, non-invasive.Validated against measures of body fat.Consistent with adult standards- can use over age 2 to track childhood overweight into adulthood.A reference for adolescents beyond puberty.Relates to health risks
Correlates with clinical risk factors for CVD such as hyperlipidemia, hyperinsulinemia and hypertension.During pubescence, is related to lipid levels and high blood pressure in middle age.
Interpreting the BMI for Age
Keep in mind:AgeBMI pattern
Adiposity rebound after age 5 ½ yearsGenderMuscle mass versus fat massStage of sexual maturationEthnic differences
Adiposity Rebound
Adiposity increases during first year of life.After 12 months of age, BMI for Age declines and falls during preschool years to a minimum (4-6 years of age).BMI for Age then increases through teen and adulthood.“Adiposity Rebound” is the increase in BMI after its lowest point.Early “rebound” may be critical in adult obesity-if before ages 4 to 6.More research needed-adipose tissue vs lean body mass or bone; impact on adult obesity.

Using the BMI with Children
Track changes in BMI over time.Increases of ≥ 2 units/year may reflect excessive increase in body fat. Degree of change that indicates risk is not known.If crossing percentiles or abnormal trend, review weight for age and stature for age.
Limitations of BMI
Not reliable in disease states associated with abnormal growth, body composition, timing of puberty.Not appropriate for children with deformities confounding measurement of stature.Lack of science and experience to assess underweight-more research needed.

BMI: One Piece of the Puzzle
BMI-a derived value based on population data.Child is their own referenceNormal variability in individual growth and body composition - 5% of healthy children grow below the 5th percentile and above the 95th percentile (bell curve distribution).Single measurements insufficient - needs to be tracked over time for trends.

BMI: One Piece of the Puzzle
Error(s) in measurement incorrect data and interpretation.
1.9 cm height variation = 1 BMI percentile (Calgary Region 2002 pilot).
Not diagnostic.Further assessment: skin-fold thickness, co-morbidity, family history, recent health history, physical exam.Health risks: eating habits, physical activity patterns, genetic predisposition, other risk factors.

CDC BMI for Age Cutoffs
≥ 95th percentile
85th to < 95th percentile
5th to < 85th percentile
< 5th percentile
Overweight (Obese*)
Risk of overweight(0verweight*)
Normal weight
Underweight
* Canadian definition/term
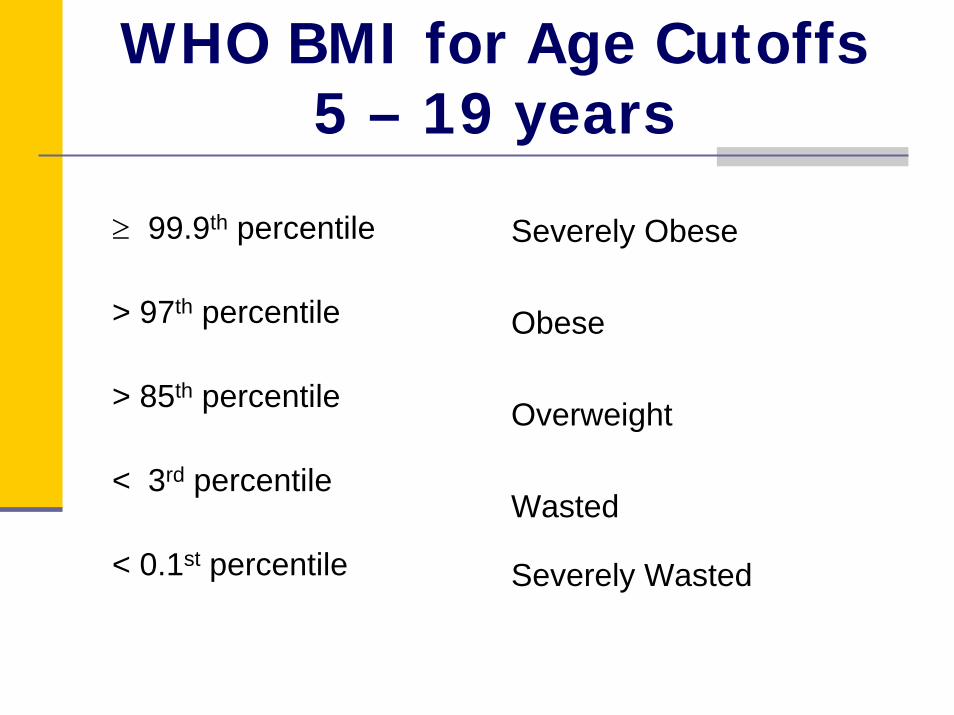
WHO BMI for Age Cutoffs 5 – 19 years
≥ 99.9th percentile
> 97th percentile
> 85th percentile
< 3rd percentile
< 0.1st percentile
Severely Obese
Obese
Overweight
Wasted
Severely Wasted

At Risk?
This boy is 3 years, 3 weeks old.What is his BMI-for-age?Is he at risk for being overweight?
Photo from UC Berkeley Longitudinal Study, 1973

Plotted BMI for Age
Measurements: Age=3 y 3 wksHeight=100.8 cmWeight=18.6 kgBMI=18.3 BMI-for-age=95th percentile Obese overweight
Boys: 2 to 20 years
BMI BMI
BMI BMI
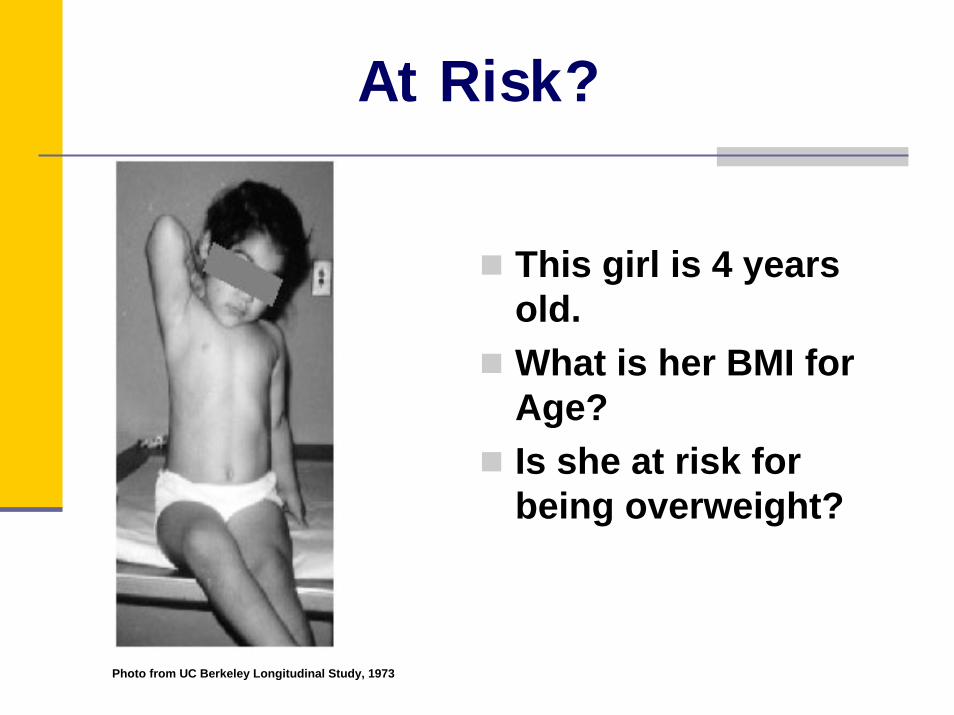
At Risk?
This girl is 4 years old.What is her BMI for Age?Is she at risk for being overweight??
Photo from UC Berkeley Longitudinal Study, 1973
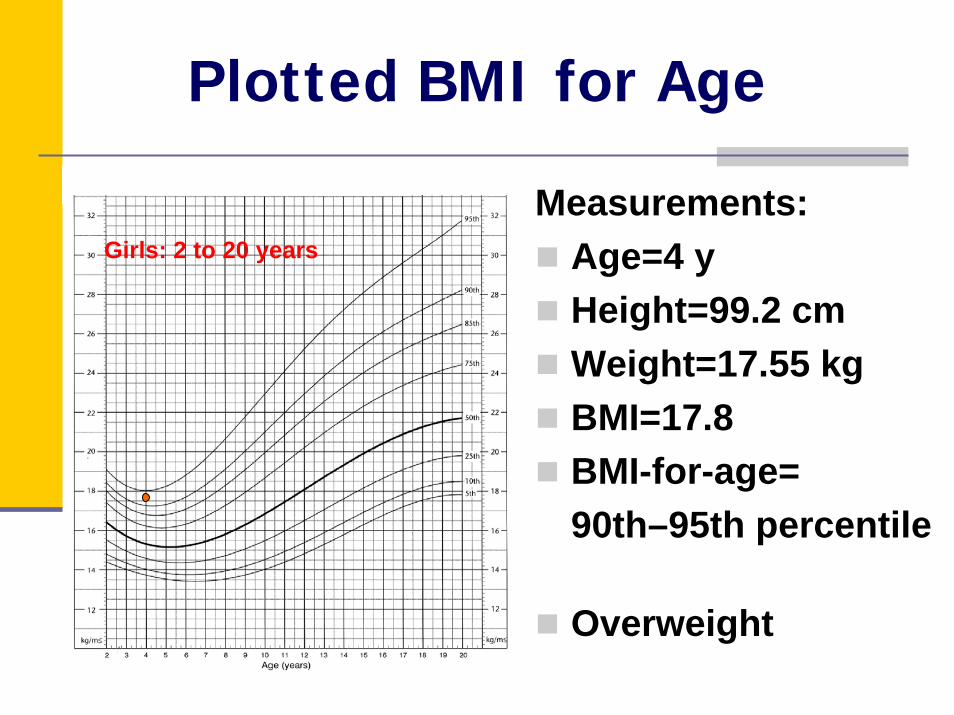
Plotted BMI for Age
Measurements: Age=4 yHeight=99.2 cmWeight=17.55 kg BMI=17.8BMI-for-age= 90th–95th percentile
Overweight
Girls: 2 to 20 years
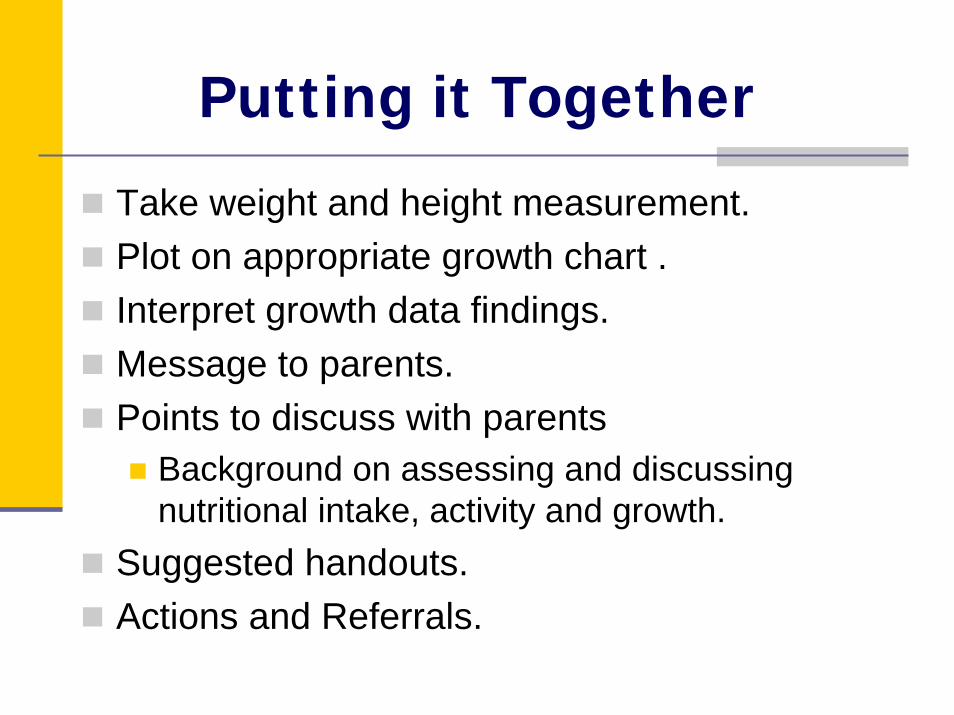
Putting it Together
Take weight and height measurement.Plot on appropriate growth chart .Interpret growth data findings.Message to parents.Points to discuss with parents
Background on assessing and discussing nutritional intake, activity and growth.
Suggested handouts.Actions and Referrals.
Core Messages for Parents
Growth pattern over time is more important than a single measurement.Weight & length/height measurements are health screening tools.Growth is one sign of general health.Many things affect a child’s growth.Growth reflects family growth patterns.

Core Messages for Parents
Focus on healthy eating & lifestyle habits rather than physical appearance. Focus on positive lifestyle habits and feeding/eating relationship.Parents should model positive body image and respect child’s individuality.
Growth assessment should be considered a tool to assess readiness for information and need to
explore things further.

American Dietetic Association and Dietitians of Canada Manual of Clinical Nutrition: www.eatright.orgCentre for Disease Control and Prevention: www.cdc.gov/growthchartsCalgary Health Region: www.calgaryhealthregion.ca/nutritionDietitians of Canada: www.dietitians.ca
Promoting Optimal Monitoring of Child Growth in Canada: Using the New WHO Growth Charts (A Collaborative Statement).Is My Child Growing Well? Questions and Answers for Parents.A Health Professional’s Guide for Using the new WHO Growth Charts.
Professional/Parent Resources

Acknowledgements
Nutrition Resource Centre: www.nutritionrc.ca. Presentation adapted from Growing children well: What you need to know and use in practice, Northern Ontario Dietetic Internship Pediatric Videoseries, January 2008. Available from: Lee Rysdale at [email protected]. Content revisions by Jane Lac, RD. Consultant. [email protected]