Embed Size (px)
Citation preview

NGWA.org Ground Water Monitoring & Remediation 00, no. 0/ xxxx 0000/pages 00–00 1
© 2012, The Author(s)Ground Water Monitoring & Remediation
© 2012, National Ground Water Association.doi: 10.1111/j1745–6592.2012.01413.x
A Practical Measurement Strategy to Estimate Nonlinear Chlorinated Solvent Sorption in Low foc Sedimentsby Guohui Wang, Richelle M. Allen-King, Sungwook Choung, Stanley Feenstra, Robert Watson, and Michael Kominek
IntroductionSorption refers to the processes by which sediments
and soils retain contaminants. Sorption includes partition-ing (absorption) and adsorption of contaminants on the various forms of organic matter in soil or aquifer materi-als. In subsurface reactive solute transport investigation and remediation design, sorption influences the soil cleanup level and retards contaminant movement. According to US Environmental Protection Agency regulation (EPA 1996), most investigations on contaminated sites do not require sorption measurements. For hydrophobic and moderately hydrophobic organic compounds (collectively termed HOCs here), the distribution coefficient (K
d) between the
sorbed and aqueous concentrations (q and Cw, respec-
tively) is commonly estimated from the fraction organic carbon (f
oc) content and the EPA empirically determined
organic carbon-water partition coefficient (Koc,e
) through
Kd = f
ocK
oc,e (Schwarzenbach et al. 2003). However, recent
HOC sorption research has shown that the observed Koc,c
(=K
d,c/f
oc, the organic carbon-water partition coefficient
corresponding to a particular Cw) for subsurface materi-
als are frequently two to three orders of magnitude greater than the empirical K
oc,e commonly cited in regulation (EPA
1996) due to adsorption on thermally altered carbonaceous matter (TACM) in the sediments (Allen-King et al. 2002; Huang et al. 2003; Cornelissen et al. 2005; Arp et al. 2009). Therefore, the use of the EPA default K
oc,e (EPA 1996) may
lead to a lower than necessary soil cleanup level and under-estimation of the total contaminant mass present in the subsurface. In addition, it also results in underestimation of retardation that slows the dissolved phase plume move-ment in the subsurface during plume advance and retreat in response to remedial actions.
The presence of TACM has been linked to adsorption behavior that is particularly evident when low relative aque-ous concentrations (C
w/S where S is the aqueous solubil-
ity) are of interest. The broad term TACM encompasses noncarbonate, carbon-containing matter and includes car-bonaceous matter (CM) forms created by combustion and pyrolysis processes, such as soot and char, as well as by
AbstractIn this study, we tested a practical strategy useful for accurate chlorinated volatile organic compound (cVOC) sorption
prediction. Corresponding to the feature of the superposition of adsorption due to thermally altered carbonaceous matter (TACM) with organic carbon-water partitioning, a nonlinear Freundlich sorption isotherm covering a wide range of aqueous concentrations was defined by equilibrium sorption measurement at one or a few low concentration points with extrapola-tion to the empirical organic carbon-water partition coefficient (K
oc,e) near compound solubility. We applied this approach
to obtain perchloroethene equilibrium sorption isotherm parameters for TACM-containing glacial sand and gravel subsoil samples from a field site in New York. Sorption and associated K
oc,c applicable to low (5-500 µg/L) and high (>100,000 µg/L)
aqueous concentrations were determined in batch experiments. (The Koc,c
is the organic carbon-normalized sorption partition coefficient corresponding to aqueous concentration C
w.) The K
oc,c measurements at low concentration (~5 µg/L) were 6 to 34
times greater than the Koc,e
. The importance of this type of data is illustrated through presentation of its substantial impact on the site remedy. In so doing, we provide an approach that is broadly applicable to cVOC field sites with similar circumstances (low carbon content glacial sand and gravel with TACM).

2 G. Wang et al./ Ground Water Monitoring & Remediation 00, no. 0: 00–00 NGWA.org
As a practical approach to characterize site-specific sorbed contaminant concentration and mass distributions, and based on the feature of the superposition of adsorp-tion and partitioning processes (Figure 1), Allen-King et al. (2002) proposed measurement of equilibrium sorption at one or a few low concentration points with extrapolation to the K
oc,e near compound solubility to define parameters
for a nonlinear Freundlich isotherm. This approach differs from the method used in research studies aimed at advanc-ing the theoretical basis of the sorption processes by using far fewer measurement points. Experiments to advance pro-cess understanding generally rely on a very large number of measurement points to define sorption isotherms and relevant parameters (Xia and Pignatello 2001) and are not practical for use in the investigation and evaluation of con-taminated sites. Although Allen-King et al. (2002) pointed out the limitations in this approach, in particular that the estimated isotherm may not produce reliable transport mod-eling simulations because of the inherent limitations of the nonlinear Freundlich isotherm, this approach is theoreti-cally adequate for determining whether nonlinear sorption is apparent or important for the sediment and contaminant of interest and, if so, for evaluating the mass and concentra-tion distributions among phases. For sediment/contaminant combinations in which sorption nonlinearity is significant, the data collection effort should target the low concentration range of interest. These data provide greater insight on site-specific behavior than using the K
oc,e approach. However,
this practical approach has not been previously verified with any reported experimental demonstration.
In the project presented here, we tested the proposed approach through experiments to obtain perchloroethene (PCE) equilibrium sorption isotherm parameters and asso-ciated K
oc,c applicable at low (C
w/S < 0.002) and high (C
w/S
< 0.4) aqueous concentrations applicable to purposes listed below. The proposed approach was verified by the comparison of the experimentally determined isotherms with isotherm parameters estimated using the simplified “single concentration point” approach, and by comparison of K
d,c at intermediate C
w. There were in total three low
geologic processes (diagenesis and catagenesis), such as coal and kerogen (Allen-King et al. 2002).
Several formulations of “dual mode” sorption models for sediments have been proposed (Weber et al. 1992; Xing and Pignatello 1997; Xia and Ball 1999). All of these combine one or more adsorption isotherms with partitioning to capture the behavior observed for various field sample and chemi-cal combinations, as shown schematically in Figure 1. The superposition of adsorption and partitioning processes leads to elevated K
oc,c values at low concentrations due to TACM-
related adsorption, as well as large differences among sample K
oc,c at low concentrations resulting from differences in the
proportion and capacity/affinity of different TACM forms. This is illustrated by contrasting Figure 1a and 1b in which much higher K
oc,c would be expected at low aqueous concen-
trations for the sample with the greater adsorbent proportion and/or with higher capacity/affinity TACM forms. However, at aqueous concentrations near solubility, the K
oc,c converge
to a partitioning-dominated value provided that the adsorp-tion “sites” are saturated, resulting in values near the K
oc,e
at aqueous concentrations near solubility. Combined adsorp-tion dominated behavior at low aqueous concentrations and partitioning-dominated behavior at high concentrations is consistent with a nonlinear Freundlich isotherm with a slope (or Freundlich exponent, n) <1.
Unfortunately, the substantial theoretical advance-ments in understanding combined adsorption-partitioning processes on HOC behavior, reviewed in greater detail in the following section, have translated into too few practi-cal applications, particularly for chlorinated volatile organic compounds (cVOC) in deep vadose zones and groundwater. Instead of the often used empirical approach that results in a singular K
oc,c applied to all aqueous concentrations, there
is a need to develop and evaluate practical methods for the investigation of contaminated sites to determine site-specific sorption parameters for combinations of contami-nants, concentrations, and site materials in which adsorption processes are significant without the time consuming and costly full-range multipoint sorption isotherm determina-tions performed for research studies.
Figure 1. Schematic of the superposition of adsorption and partitioning processes comparing high (a) and low (b) adsorbent proportions between samples with the same foc. Large differences in the Koc,c among samples occur at low concentrations. Dotted lines represent the total sorption. Broken and dashed lines indicate partitioning and adsorption contributions, respectively. Solid lines indicate the fit nonlinear Freundlich model.
1.E-05 1.E-04 1.E-03 1.E-02 1.E-01 1.E+00C w/S
q
CombinedSorption Isotherm
Linear Partition Component
AdsorptionComponent
(b)
Freundlich model
1.E-05 1.E-04 1.E-03 1.E-02 1.E-01 1.E+00C w /S
q AdsorptionComponent
Linear Partition
CombinedSorption Isotherm
(a)
Freundlich model

NGWA.org G. Wang et al./ Ground Water Monitoring & Remediation 00, no. 0: 00–00 3
of physicochemical properties, TACM shows much greater surface area, porosity and microporosity, more condensed structure, greater aromaticity, and lower oxygen/carbon and hydrogen/carbon ratios than the unaltered organic parent material. All these features make TACM more hydropho-bic and provide more adsorption sites. As a result, much higher K
oc,c values (=K
d,c/f
oc) and nonlinearity are expected
for HOCs in TACM-containing soils and sediments, espe-cially at low aqueous concentrations.
Figure 2 shows an example illustrating that the observed PCE K
oc,c corresponding to a particular aqueous
concentration varies significantly among samples. The data plotted in Figure 2 summarize the peer-reviewed lit-erature reports of PCE sorption measurements made over a wide concentration range. Particular attention was given to identify reports for sandy, low f
oc sedimentary subsurface
samples because such characteristics are typical of many surficial systems (such as Quaternary glacial deposits in valley basins which compose the productive aquifers) that have persistent cVOC contaminants (Piwoni and Banerjee 1989; Grathwohl 1990; Ball and Roberts 1991; Weber et al. 1992; Farrell and Reinhard 1994; Allen-King et al. 1996; Njoroge et al. 1998; Ferris 1999; John et al. 2000; Li and Werth 2001; Zhao et al. 2005). The data in Figure 2 clearly show that the observed PCE K
oc,c differs with aqueous con-
centration and can be up to approximately two orders of magnitude greater than the S or K
ow-derived K
oc,e values.
The samples with higher Koc,c
are mostly from deposits in which TACM has been identified.
The discussion above clearly demonstrates the occur-rence of elevated K
oc,c and its variability among samples,
which, according to the literature, is due to the different TACM proportions and/or forms. The question arises, “is the existence of TACM in natural soils and sediments common and expected?” A significant body of literature has been published documenting the presence of TACM in sediments. The TACM has been identified in glacial sand, glaciolacustrine silty clay, glaciofluvial sand, and other sedimentary deposits as well as in surface soils. The reason for the widespread distribution of the TACM in modern and historic sediments is because it can withstand rock cycle weathering processes due to its more condensed structure and, for kerogen, because it often occurs within a sedimentary rock matrix. Hence, TACM can be trans-ported over significant distances and deposited or redepos-ited in various sedimentary environments. The attributes of TACM—its presence in the rock record since approxi-mately the time of the emergence of land plants (Schmidt and Noack 2000) and its ability to be redeposited—sug-gest that most sediments and sedimentary rocks likely incorporated forms of TACM at deposition. Practically, if an aquifer contaminated by cVOCs had low f
oc that had
not undergone extensive chemical weathering to remove TACM postdeposition, it would be reasonable to expect “excess” (> empirical) sorption at low aqueous concentra-tions resulting from the existence of TACM. It would be likely that “old” kerogen or field char would be present in the sediments. The TACM would cause greater retardation and sorbed concentrations than expected from the f
oc based
on the empirical approach.
(Exps 1-3) and one high (Exp 4A/4B) aqueous concentra-tion experiments completed for multiple samples and with replication at each concentration. As part of a more exten-sive remedial investigation, the low concentration data and sorption parameters collected in this study were used to define a site-specific cleanup level for PCE in vadose zone soil and the high concentration tests were used to deter-mine the total concentration threshold in soil above which residual DNAPL (dense nonaqueous phase liquid) PCE was present (Broholm et al. 1999). This paper emphasizes the approach that we used to obtain a high quality and reli-able PCE sorption data set for subsurface glacial sediment samples from a field site in New York. In so doing, we provide an approach broadly applicable to cVOCs at field sites with similar attributes (low f
oc subsurface sediments
with TACM). Our approach, rooted in applicable litera-ture, included screening experiments that provided infor-mation needed to plan the larger set of batch experiments as well as an experiment required to explore the dynamics of sorption equilibration.
Background (Review of Sorption Literature for PCE)
The compound specific Koc,e
value used in US EPA regu-lations is an empirical value resulting from measurements reported in the literature (EPA 1996). It has been demon-strated repeatedly that the K
oc,e for a particular compound
is relatively uniform (within a factor of ~3) for soils and modern sediments with relatively high f
oc and/or when high
concentrations are examined. In these circumstances, parti-tioning is the dominant sorption process because the adsorp-tion “sites” are saturated (Allen-King et al. 2002). The K
oc,e
value for PCE used in regulations is based on compilations of such literature measurements (EPA 1996; NYSDEC and NYSDOH 2006). For example, for PCE 10 of the 15 studies in the EPA database used either high f
oc (>~1%) sediment
and/or high concentrations (Cw/S < 0.01), resulting in a geo-
metric mean Koc,e
= 265 L/kg (EPA 1996). This mean value is used to establish PCE “default” vadose zone soil con-centrations intended to protect groundwater via the f
ocK
oc,e
partitioning approach. The Koc,e
value agrees well, within a factor of 2-3, with those derived from either the octanol-water partition coefficient (K
ow) or S based on the linear-
solvation energy or partitioning theory (Schwarzenbach et al. 2003). The adsorption-partition theory described above provides a basis for limiting the application of the empiri-cal approach to appropriate circumstances that match the conditions (or assumptions) upon which the approach is based, that is, high aqueous concentrations and/or very low adsorbent proportion. It is clear that the K
oc,e partitioning
concept, where the target compounds are assumed to be evenly dissolved into the organic matter, cannot account for the TACM-adsorption mechanism mentioned above.
A significant body of literature has been published over the past approximately 20 years documenting the high and nonlinear sorption of hydrophobic and moderately hydro-phobic organic contaminants to TACM, summarized in review articles by Allen-King et al. (2002), Huang et al. (2003), and Cornelissen et al. (2005). Characterized in terms

4 G. Wang et al./ Ground Water Monitoring & Remediation 00, no. 0: 00–00 NGWA.org
outside of the area of greatest PCE concentration were collected by hollow-stem auger drilling using a 7.6 cm (3 inch nominal) diameter split-spoon sampler. Three samples consisted of sand and gravel (sample nos. 312-10.5, 313-6.5, and 314-7), and three samples consisted of medium to fine sand (sample nos. 312-4, 313-9.3, and 314-3.5). The sample numbering system includes the soil boring number followed by the shallowest value of the depth range in feet.
Each sample was air dried and was dry sieved through 2 and 12.5 mm screens to facilitate the creation of representa-tive subsamples by using different sample preparation pro-cedures on different grain size fractions (more information on grain size distribution in Supporting Information). The
Materials and Methods
Sample Collection and PreparationPure tetrachloroethene (PCE, 99% min) and trichlo-
roethene (used as analytical internal standard, 99.5% min) were purchased from Alfa-Aesar (Voigt Global Distribution Inc., Lawrence, Kansas). The sediment samples were collected at a former dry cleaning facility in New York State. A soil gas survey showed that PCE releases had occurred and there was evidence of residual DNAPL at this site. The subsurface sediments are primar-ily sand fill underlain by glaciofluvial sand and gravel and sand outwash underlain by a glaciolacustrine silt unit. A total of six samples (Table 1) from the vadose zone
Figure 2. Carbon-normalized sorption distribution coefficients Koc,c (=Kd,c/foc) for PCE at three aqueous concentrations (5, 5000, and 50,000 µg/L) computed from published isotherms from citations listed in the text. The data are plotted only for Cw that are within the range used in each original study. Dashed lines designate the Koc,e values estimated from compound solubility (log Koc = −0.88 log S+0.07) or octanol-water partition coefficient (log Koc = 1.03 log Kow−0.61) (Seth et al. 1999; Schwarzenbach et al. 2003). The Koc,e values shown (370 and 770 mL/g, respectively) were estimated from S = 240 mg/L (Broholm and Feenstra 1995) and log Kow = 3.4 (Ball and Roberts 1992).
1.E+01
1.E+02
1.E+03
1.E+04
1.E+05
0.01 0.1 1 10f oc (%)
Kd/f o
c (L
/kg)
(b) 5,000 µg/L
1.E+01
1.E+02
1.E+03
1.E+04
1.E+05
0.01 0.1 1 10f oc (%)
Kd/f
oc(L
/kg)
(a) 5 µg/L
1.E+01
1.E+02
1.E+03
1.E+04
1.E+05
0.01 0.1 1 10f oc (%)
Kd/f
oc (
L/kg
)
(c) 50,000 µg/L
sand
sand with TACM
silt & clay
silt & clay with TACM
--- S- or Kow-derived Koc
Table 1Sample Number and Depth and Selected Properties
Sample Number 312-4 312-10.5 313-6.5 313-9.3 314-3.5 314-7
Sample location (soil boring number) 312 313 314
Depth, m (feet) 1.22–2.59(4.0–8.5)
3.2–4.27(10.5–14.0)
1.98–2.44(6.5–8.0)
2.83–3.87(9.3–12.7)
1.07–1.68(3.5–5.5)
2.13–2.96(7.0–9.7)
<2 mm (%) 97.0 85.6 77.6 99.4 94.7 33.3
foc
(%) 0.079 0.05 0.049 0.079 0.122 0.054

NGWA.org G. Wang et al./ Ground Water Monitoring & Remediation 00, no. 0: 00–00 5
a glass ampoule (5 or 10 mL nominal) or sealed with a Polytetrafluoroethylene (PTFE)-lined butyl rubber septa into a 38 mL serum vial (Exp 4B). The quantity of added methanol from the PCE stock solution was maintained sufficiently low such that it would not affect the sorption equilibrium attained (Munz and Roberts 1986). The total mass of PCE added to each batch system (M
0) was cross
checked by determining it in two ways: from the known volume and concentration of PCE stock solution added, and from quadruplicate measurements of vials contain-ing the hexane with internal standard with the PCE stock solution added identically as it was to the sorption vials. Prior to sampling, the ampoules were continuously rotated at approximately 5 rpm for 7 d and mixed rigorously on a vortex mixer once per day to ensure complete mixing within each system (e.g., no sediment stuck in a relatively stagnant portion of the vial) for Exps 1-3. For the Exp 4 vials, the vortex mixing was extended to at least 2 min/d because of the very high sediment:water ratios used in these batch systems. To determine system losses (X) from the Exp 4B systems, the PCE stock solution was added to sediment-free control vials in the same manner that was used for the sorption vials. For the ampoule batch systems (Exps 1-3 and Exp 4A), no system losses were consid-ered assuming that the only sinks for PCE in the ampoule systems are partitioning to the sediment, air and water. Following the contact time, the batch systems were centri-fuged for 40 min at 2000 rpm (g = 581.9) for ampoules and at 1000 rpm (g = 145.5) for septa-sealed vials. An aliquot of the supernatant (~0.25-1.5 mL), sampled via gas-tight syringe, was transferred into a vial where the dissolved PCE was extracted into hexane-containing trichloroethene as an internal standard. The PCE concentration in the hex-ane extraction solution was measured by gas chromatogra-phy coupled to an electron capture detector.
medium and coarser pebbles (>12.5 mm diameter) were excluded from sorption experiments, because (1) these materials are not generally included in sediment samples for PCE analysis and (2) most of the solid fractions of samples consist of <2 mm diameter materials (Table 1). The <2 mm fraction of each sample was homogenized and riffle split to obtain representative subsamples for pul-verization. Representative subsamples of the 2-12.5 mm grains were obtained by piling and quartering. The sub-samples were then smashed with a rock hammer to reduce the grains to <2 mm diameter prior to pulverization. The sample pulverization was carried out using SPEX shatter box with an Alumina Ceramic Container following Ball and Roberts (1991) method (about 5 g samples for 45 s graining in the shatter box). Following pulverization, pow-ders of the <2 and 2-12.5 mm grains of each sample were remixed in proportions identical to the proportions in the bulk sample exclusive of the >12.5 mm material. Previous researchers have demonstrated that pulverization does not affect the equilibrium PCE sorption observed (Ball and Roberts 1991) and is necessary for K
d,c measurement in
a reasonable time, and to ensure accurate measurements that avoid “pseudo” equilibrium (Wang et al. 2007).
foc MeasurementThe f
oc, measured in duplicate on each pulverized sam-
ple, was determined using high temperature (950 °C) dry combustion with CO
2 quantification by coulometric detec-
tor (CM 5012; UIC Inc. Joliet, Illinois) following preacidi-fication using HCl to remove carbonates. All of the samples have relatively low f
oc (0.05-0.12%) (Table 1).
Batch Sorption ExperimentsBatch experiments with three different purposes were
conducted in this study: screening, equilibration time, and K
d,c measurements. Prior to the K
d,c sorption mea-
surements, screening experiments at both low and high aqueous concentrations were conducted to determine appropriate sediment:water ratios for the K
d,c batch exper-
iments (Supporting Information). In addition, sorptive uptake rate experiments with two of the samples (314-3.5 and 314-7) were carried out at a low aqueous concen-tration to determine the contact time required to obtain equilibrium with pulverized samples. Both the screening and equilibrium time tests were designed as prerequisite preliminary experiments (Supporting Information), but the data from these experiments were not used in the final data analysis. The equilibration time experiments supported the selection of a 7-d contact time to achieve sorption equilibrium with the pulverized samples. This is comparable to prior findings by Ball and Roberts (1991) and Kleineidam et al. (1999).
The PCE Kd,c
were determined using a batch technique similar to Allen-King et al. (1998, 2006). Table 2 lists the conditions for each set of batch experiments (Exps 1-3, 4A and 4B). All the batch experiments were carried out in quadruplicate at laboratory temperature (~21 °C). The pulverized sediment (5-50 g) with a known volume of synthetic groundwater (5-17 mL) and mass of PCE, from methanol stock solution, was either flame sealed into
Table 2The Experiment Setup Summary Information for Kd,c
Batch Systems
Experiment Low ConcentrationHigh
Concentration1
Experiment Number Exp 1 Exp 2 Exp 3 Exp 4A Exp 4B
Ampoule or vial volume (mL)
5 5 5 10 38 (vial)
Sorbents All All All 312-4313-9.3314-3.5
312-10.5313-6.5314-7
PCE mass added (µg)
0.65 6.5 0.065 120010002
2500
Target aqueous concentration
50 500 5 100,000 100,000
1High concentration experiments were conducted in two parts (Exp 4A and 4B), and each part used a different vessel. In Exp 4A, the 10 mL (nominal) ampoules were used for the three samples with greater f
oc and in Exp 4B, the approximately
38 mL septum-sealed vials were used for the three samples with lower foc
. 2Approximately 1200 µg was added to the sample no. 314-3.5 systems and approximately 1000 µg PCE was added to all other systems.

6 G. Wang et al./ Ground Water Monitoring & Remediation 00, no. 0: 00–00 NGWA.org
determined for both low and full concentration ranges are listed in Table 3. Figure 3 also compares the sample obser-vations with the K
oc,e (=265 mL/g) estimated using f
oc =
0.05 or 0.12%, the lowest and highest of the samples in this study. This depiction underscores the similarity between the estimated and observed results at the highest aqueous con-centrations, for example, near PCE solubility (~0.4 S), as well as the significant deviation at low concentrations.
Figure 4 shows the observed Koc,c
dependence on aque-ous concentration for two example samples compared with the K
oc,e. Similar to many of the studies reviewed for
Figure 2, our results demonstrate that the Koc,c
values vary when a large concentration range is considered. Differences between the samples are also obvious, although the trends with aqueous concentration are similar. For any particu-lar sample, the K
oc,c observed at the lowest concentration
point (~5 µg/L) is 9-27 times greater than that observed at the highest concentration (~100,000 µg/L). At the low-est aqueous concentration, the observed K
oc,c are up to 34
times greater than the solubility-derived Koc,e
(370 mL/g), whereas at the highest concentration these two values
Data AnalysisThe K
d,c for each batch system was determined using
a mass balance approach from measurements of the total mass of PCE added to each batch system (M
0) and observed
solution concentration in aqueous phase after equilibration (C
w),
Kd,c
= M
0 + M'
0 – C
w (V
w + HV
a + X) ________________________
msC
w
, (1)
where Vw, V
a are the volumes of water and air, respectively,
and ms is the sediment mass. The H is the Henry’s Law con-
stant. The M0́ is the PCE background mass in the sediment.
The background PCE mass only needed to be accounted in computations for the lowest aqueous concentration point (Exp 3). The X represents the concentration-dependent loss from the system through diffusion through the septa. The X is applicable to the Exp 4B systems only and was computed from the sediment-free control vials based on the equilib-rium solution concentrations following the approach used in previous work (Allen-King et al. 1995). Sorption to the septa, or loss from the vial by diffusion, are both concen-tration-driven processes. In the Exp 4B, a literature value of 0.61 for the Henry’s Law constant appropriate to laboratory temperature was assumed (Gossett 1987). The X computed from the control vials resulted in 10-12% of M
0 for the Exp
4B sorption systems and was much less than the mass frac-tion sorbed (29-64%, depending on sample).
The log-transformed data were fit using a linear regres-sion to determine the Freundlich sorption coefficient (K
f)
and slope (n), defined according to Equation (2).
q = Kf C
w n , (2)
where q denotes the sorbed phase concentration.
Results and Discussion
Equilibrium Sorption Isotherms and Koc,c AnalysisThe data over the observed aqueous concentrations were
fit well by the Freundlich sorption model (Figure 3). All the sorption isotherms of PCE on site samples are nonlin-ear with n = 0.66-0.78. The sorption isotherm parameters
1
10
100
1000
10000
100000
1 100 10000 1000000
q [µ
g/kg
]
Cw [µg/L]
312-10.5312-4.0empirical, foc=0.12%empirical, foc=0.05%
Cw [µg/L]
1
10
100
1000
10000
100000
1 100 10000 1000000
q [µ
g/kg
]
313-9.3313-6.5empirical, foc=0.12%empirical, foc=0.05%
Cw [µg/L]
1
10
100
1000
10000
100000
1 100 10000 1000000
q [µ
g/kg
]
314-7.0314-3.5empirical, foc=0.12%empirical, foc=0.05%
Figure 3. Sorption behavior for each sample from the field site plotted with empirical estimate (q = KdCw = Koc,e focCw) as a reference. Lines through the data are Freundlich isotherm fits.
Table 3Freundlich Isotherm Parameters Determined for
the Full Concentration (5-10,000 µg/L) and the Low Concentration (5-500 µg/L) Ranges. Units of Kf are
(µg/kg)/(µg/L)n
Sample Number 312-4 312-10.5 313-6.5 313-9.3 314-3.5 314-7
Full Concentration Range Isotherms (~5–100,000 µg/L)
n 0.76 0.70 0.67 0.69 0.78 0.66
Log Kf
0.60 0.75 0.94 0.90 0.59 1.09
Kf
4.0 5.6 8.6 7.9 3.9 12
Low Concentration Range Isotherms (~5–500 µg/L)
n 0.74 0.71 0.69 0.70 0.76 0.73
Log Kf
0.64 0.74 0.90 0.87 0.62 1.02
Kf
4.3 5.5 7.9 7.5 4.1 10.6

NGWA.org G. Wang et al./ Ground Water Monitoring & Remediation 00, no. 0: 00–00 7
(Choung et al. 2012), we have identified kerogen forms of TACM in samples from this field site that also support this interpretation.
Test of the Proposed ApproachFigure 5 compares the equilibrium sorption iso-
therm computed from all measurements (true) over the 50-100,000 µg/L aqueous concentration range (Figure 5c) to that estimated using the approach tested here for one of the samples (313-9.3). The estimation is based on the mea-surements at either one (~50 µg/L; Figure 5a) or two (~50 and 500 µg/L; Figure 5b) low concentration points with extrapolation to the K
oc,e (=265 mL/g) near solubility. The
estimates used q = Koc,e
foc
Cw with C
w/S = 0.5 for the high
concentration point. Comparison of Figure 5a through 5c shows that the extrapolated isotherms from either one or two low concentration observations at ~50 and 500 µg/L agree very well with the isotherm for the measured data set. The Freundlich isotherm fit to the measured data set (covering a concentration range of 50-100,000 µg/L; Figure 5c) has a sorption capacity of 8.3 (µg/kg)/(µg/L)n and nonlinearity of 0.68. These values are similar to the isotherm parameters estimated by the proposed approach based on one or two low concentration observations (K
f
of 7.9 (µg/kg)/(µg/L)n and nonlinearity of 0.69 for both Figure 5a and 5b).
Similar results were observed for all six samples in this study. Table 4 compares the observed and estimated K
d at C
w ~ 500 µg/L for all samples tested in this study.
The estimated values were computed from a two-point Freundlich isotherm that combined the observations at one low aqueous concentration (=50 µg/L) with an empirical estimate (q = K
oc,efoc
Cw) at C
w/S = 0.5 (C
w = 120,000 µg/L;
Koc,e
= 265 mL/g). All of the estimates were <22% different from the observations. The results indicate that the com-bination of a single concentration batch K
d,c measurement
at low concentrations together with an empirically esti-mated value near the aqueous solubility can be useful as a practical approach to obtaining sorption estimates for the intervening aqueous concentration range for the purposes described here.
agree well (within a factor of two). The observed Koc,c
dif-fers between the sediments in this study and ranged from 2300 mL/g (sample 314-3.5) to 12,600 mL/g (sample 314-7) at the lowest aqueous concentration. In contrast, at the highest aqueous concentration the observed K
oc,c differences
among the samples almost vanished and the observed Koc,c
were similar (260-470 mL/g). These low values are consis-tent with the S- and K
ow-derived K
oc,e values (Figure 2), and
the lowest among these values are similar to the geometric mean (265 mL/g) of observed PCE K
oc,e reported by US
EPA (EPA 1996). The sample observations described above are consistent
with the theory of superposition of adsorption and partition-ing, with adsorption behavior linking to TACM, as shown in Figure 1. The differences between samples at low aque-ous concentration can be attributed to differing adsorbent proportions. In contrast, the K
oc,e approach is valid at aque-
ous concentrations that approach S because of the satura-tion of the available adsorption sites. In a companion study
Figure 4. Example of the Koc,c dependence on Cw and compari-son to Koc,e. The symbols are observations and the solid lines are computed from the isotherm parameters and foc.
100
1000
10000
100000
1 100 10000 1000000
Koc
,c [
( µg/
kg)/
(µg/
L)]
Cw [µg/L]
314-3.5
313-6.5
EPA Koc,e
S-derivedKoc,e
1
2
3
4
5
1 2 3 4 5 6
(a)
logCw [µg/L] logCw [µg/L] logCw [µg/L]
1
2
3
4
5
1 2 3 4 5 6
(b)
1
2
3
4
5
1 2 3 4 5 6
logq
[µg/
kg]
logq
[µg/
kg]
logq
[µg/
kg]
(c)
Figure 5. Sorption isotherms (sample 313-9.3) determined based on the measurement of equilibrium sorption at (a) one or (b) two low concentration points with extrapolation to the q = Koc,e focCw at Cw/S = 0.5. The open triangles represent the observations and open squares indicate the empirical estimate. The points shown on each graph were used to estimate the isotherm parameters. Graph (c) is the experimentally measured isotherm (true) without using any empirical estimation.

8 G. Wang et al./ Ground Water Monitoring & Remediation 00, no. 0: 00–00 NGWA.org
• The foc
is low, but it contains sufficient adsorbent to exert a meaningful impact. High f
oc soils and sediments (~1%
and greater, Figure 2) tend to exhibit partitioning- dominated behavior.
• Low aqueous concentrations are of interest for aquifer and soil remediation for drinking water protection. The TACM exerts significant impact on compound behavior through adsorption at low aqueous concentrations rela-tive to compound solubility.
For samples of vadose zone or aquifer material such as the ones in this study, the K
oc,e produces a reasonable
estimate of sorption only for very high aqueous concentra-tions, near S, proximal to a NAPL source, for example. As described in section “Background” and shown in Figure 2, low f
oc subsurface sedimentary samples from many locales
exhibit similar patterns. Our results support the proposed approach, and demonstrate that only one or two low con-centration K
d,c measurements combined with an empirically
based estimate for an aqueous concentration near solubility can provide a sorption isotherm useful for sorbed concentra-tion estimates over a wide aqueous concentration range. For contaminated sites where sorption to TACM is significant, the resulting values offer an improved means to compute quantities such as sorbed mass and/or soil cleanup level, as presented in the example here. It is clear that for a specific site, sorption measurements would be appropriate when the anticipated reduction in overall cleanup cost is greater than the analytical expenditure—a situation expected at larger and/or more complex contaminated sites compared to smaller, less complex sites. However, we anticipate that additional issues, such as contaminant accessibility and the need to have a better understanding of the contaminant phase distribution, would also contribute to a decision about whether sorption measurements are a wise investment for a particular contaminated site. Although the capability to perform sorption measurements is not widely commercially available, this study suggests that such measurements would be a valuable option for some site investigations and reme-dial programs.
AcknowledgmentThe authors would like to acknowledge the IBM
Corporation for supplying samples and for financial sup-port of this work.
ApplicationThe experiments and discussion above clearly illus-
trate that, at low aqueous concentrations, the PCE sorption capacity for the sand and gravel material at the New York site is much greater than one would predict via the empiri-cal organic carbon partitioning approach alone. This is because higher energy adsorption sites contribute to total sorption. As a result, elements of the remedial investigation interpretation and remediation design, such as determina-tion of the cleanup level and contaminant mass distribution among phases, should be strongly affected by the elevated (compared to empirical) sorption. At this field site, the use of a soil cleanup level derived from the site-specific sorp-tion measurements substantially reduced the area requir-ing vadose zone remediation to protect groundwater at an aqueous concentration equivalent to the drinking water standard or maximum contaminant level (MCL) (C
MCL =
5 µg/L for PCE; EPA 2009). The soil cleanup level (Cs)
was estimated via the equation (NYSDEC and NYSDOH 2006),
Cs = K
oc,e f
ocC
MCL(DAF), (3)
where the DAF is the dilution-attenuation factor for which a default value of 100 is typically employed. For the pur-poses of this discussion, the “generic” PCE soil cleanup level was estimated as C
s ~ 100 µg/kg using the site-specific
average foc
(=0.072%) with the EPA Koc,e
(=265 mL/g). In contrast, using the experimentally determined site-specific average K
oc,c = 1900 L/kg that corresponds to an aqueous
concentration of 500 µg/L results in Cs = 684 µg/kg, where
500 µg/L was selected as the target concentration based on DAF = 100 so that C
MCL(DAF) = 500 µg/L. The area
exceeding 684 µg/kg was about 35% of the area exceeding 100 µg/kg at this field site. The site-specific sorption data led to a logistically significant reduction of the vadose zone area requiring remediation.
It is clear that sorption measurements of site-specific samples are preferable to the use of an empirical value for conditions such as those illustrated above in which TACM exerts a significant impact on sorption. The conditions in this aquifer are as follows:
• Kerogen is present in the sediments. It occurs within carbonate grains derived from the local Upper and/or Middle Devonian shale bedrock (Randall 1977).
Table 4Evaluation of the Approach by Comparison Between Observed and Estimated Kd Values at Cw ~ 500 µg/L for All Samples Investigated. The Estimated Values Were Computed from a Two-Point Freundlich Isotherm That Combined the Observations at One Low Aqueous Concentration (=50 µg/L) with an Empirical Estimate (q =
Koc,e focCw) at Cw/S = 0.5 (Cw =120,000 µg/L; Koc,e = 265 mL/g)
Sample Number 312-4 312-10.5 313-6.5 313-9.3 314-3.5 314-7
Estimated Kd1 0.82 0.76 1.00 1.14 1.03 1.58
Observed Kd
0.80 0.82 1.16 1.16 0.82 1.92
Percentage difference2 (%) −3 ± 5 8 ± 4 16 ± 4 2 ± 5 −21 ± 3 22 ± 81At or nearest to Cw = 500 µg/L.2difference = (observed K
d−estimated K
d)/estimated K
d; the average difference resulting from quadruplicate vials.
NGWA.org G. Wang et al./ Ground Water Monitoring & Remediation 00, no. 0: 00–00 9
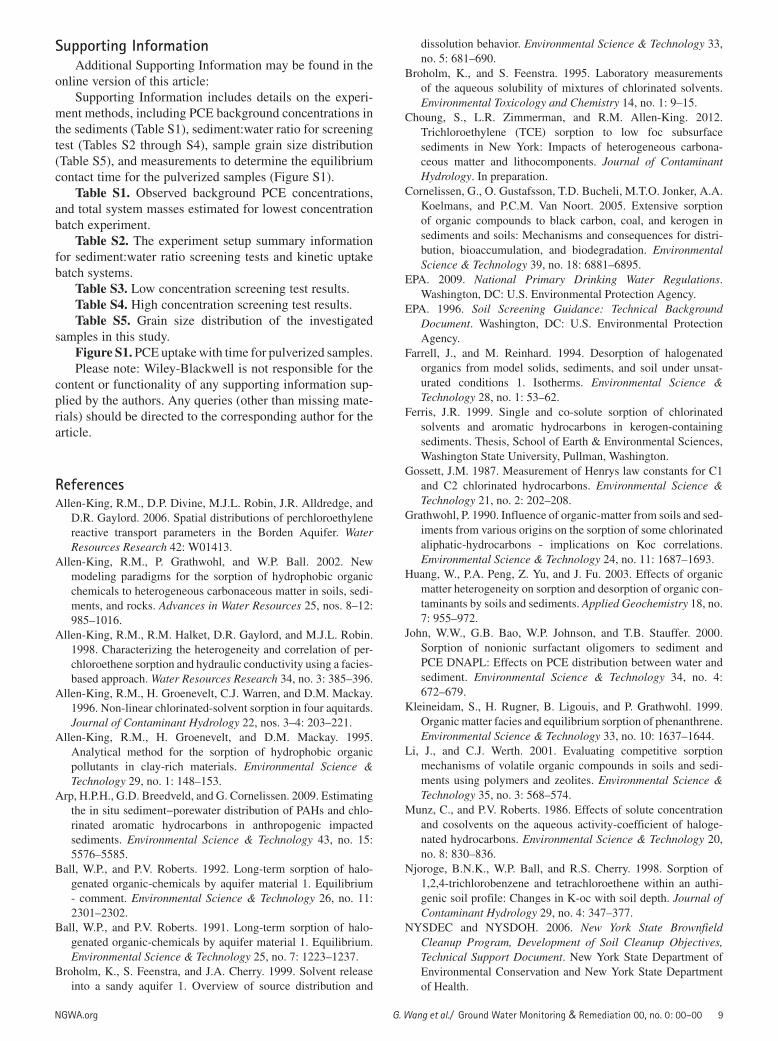
Supporting InformationAdditional Supporting Information may be found in the
online version of this article:Supporting Information includes details on the experi-
ment methods, including PCE background concentrations in the sediments (Table S1), sediment:water ratio for screening test (Tables S2 through S4), sample grain size distribution (Table S5), and measurements to determine the equilibrium contact time for the pulverized samples (Figure S1).
Table S1. Observed background PCE concentrations, and total system masses estimated for lowest concentration batch experiment.
Table S2. The experiment setup summary information for sediment:water ratio screening tests and kinetic uptake batch systems.
Table S3. Low concentration screening test results.Table S4. High concentration screening test results. Table S5. Grain size distribution of the investigated
samples in this study.Figure S1. PCE uptake with time for pulverized samples. Please note: Wiley-Blackwell is not responsible for the
content or functionality of any supporting information sup-plied by the authors. Any queries (other than missing mate-rials) should be directed to the corresponding author for the article.
ReferencesAllen-King, R.M., D.P. Divine, M.J.L. Robin, J.R. Alldredge, and
D.R. Gaylord. 2006. Spatial distributions of perchloroethylene reactive transport parameters in the Borden Aquifer. Water Resources Research 42: W01413.
Allen-King, R.M., P. Grathwohl, and W.P. Ball. 2002. New modeling paradigms for the sorption of hydrophobic organic chemicals to heterogeneous carbonaceous matter in soils, sedi-ments, and rocks. Advances in Water Resources 25, nos. 8–12: 985–1016.
Allen-King, R.M., R.M. Halket, D.R. Gaylord, and M.J.L. Robin. 1998. Characterizing the heterogeneity and correlation of per-chloroethene sorption and hydraulic conductivity using a facies-based approach. Water Resources Research 34, no. 3: 385–396.
Allen-King, R.M., H. Groenevelt, C.J. Warren, and D.M. Mackay. 1996. Non-linear chlorinated-solvent sorption in four aquitards. Journal of Contaminant Hydrology 22, nos. 3–4: 203–221.
Allen-King, R.M., H. Groenevelt, and D.M. Mackay. 1995. Analytical method for the sorption of hydrophobic organic pollutants in clay-rich materials. Environmental Science & Technology 29, no. 1: 148–153.
Arp, H.P.H., G.D. Breedveld, and G. Cornelissen. 2009. Estimating the in situ sediment−porewater distribution of PAHs and chlo-rinated aromatic hydrocarbons in anthropogenic impacted sediments. Environmental Science & Technology 43, no. 15: 5576–5585.
Ball, W.P., and P.V. Roberts. 1992. Long-term sorption of halo-genated organic-chemicals by aquifer material 1. Equilibrium - comment. Environmental Science & Technology 26, no. 11: 2301–2302.
Ball, W.P., and P.V. Roberts. 1991. Long-term sorption of halo-genated organic-chemicals by aquifer material 1. Equilibrium. Environmental Science & Technology 25, no. 7: 1223–1237.
Broholm, K., S. Feenstra, and J.A. Cherry. 1999. Solvent release into a sandy aquifer 1. Overview of source distribution and
dissolution behavior. Environmental Science & Technology 33, no. 5: 681–690.
Broholm, K., and S. Feenstra. 1995. Laboratory measurements of the aqueous solubility of mixtures of chlorinated solvents. Environmental Toxicology and Chemistry 14, no. 1: 9–15.
Choung, S., L.R. Zimmerman, and R.M. Allen-King. 2012. Trichloroethylene (TCE) sorption to low foc subsurface sediments in New York: Impacts of heterogeneous carbona-ceous matter and lithocomponents. Journal of Contaminant Hydrology. In preparation.
Cornelissen, G., O. Gustafsson, T.D. Bucheli, M.T.O. Jonker, A.A. Koelmans, and P.C.M. Van Noort. 2005. Extensive sorption of organic compounds to black carbon, coal, and kerogen in sediments and soils: Mechanisms and consequences for distri-bution, bioaccumulation, and biodegradation. Environmental Science & Technology 39, no. 18: 6881–6895.
EPA. 2009. National Primary Drinking Water Regulations. Washington, DC: U.S. Environmental Protection Agency.
EPA. 1996. Soil Screening Guidance: Technical Background Document. Washington, DC: U.S. Environmental Protection Agency.
Farrell, J., and M. Reinhard. 1994. Desorption of halogenated organics from model solids, sediments, and soil under unsat-urated conditions 1. Isotherms. Environmental Science & Technology 28, no. 1: 53–62.
Ferris, J.R. 1999. Single and co-solute sorption of chlorinated solvents and aromatic hydrocarbons in kerogen-containing sediments. Thesis, School of Earth & Environmental Sciences, Washington State University, Pullman, Washington.
Gossett, J.M. 1987. Measurement of Henrys law constants for C1 and C2 chlorinated hydrocarbons. Environmental Science & Technology 21, no. 2: 202–208.
Grathwohl, P. 1990. Influence of organic-matter from soils and sed-iments from various origins on the sorption of some chlorinated aliphatic-hydrocarbons - implications on Koc correlations. Environmental Science & Technology 24, no. 11: 1687–1693.
Huang, W., P.A. Peng, Z. Yu, and J. Fu. 2003. Effects of organic matter heterogeneity on sorption and desorption of organic con-taminants by soils and sediments. Applied Geochemistry 18, no. 7: 955–972.
John, W.W., G.B. Bao, W.P. Johnson, and T.B. Stauffer. 2000. Sorption of nonionic surfactant oligomers to sediment and PCE DNAPL: Effects on PCE distribution between water and sediment. Environmental Science & Technology 34, no. 4: 672–679.
Kleineidam, S., H. Rugner, B. Ligouis, and P. Grathwohl. 1999. Organic matter facies and equilibrium sorption of phenanthrene. Environmental Science & Technology 33, no. 10: 1637–1644.
Li, J., and C.J. Werth. 2001. Evaluating competitive sorption mechanisms of volatile organic compounds in soils and sedi-ments using polymers and zeolites. Environmental Science & Technology 35, no. 3: 568–574.
Munz, C., and P.V. Roberts. 1986. Effects of solute concentration and cosolvents on the aqueous activity-coefficient of haloge-nated hydrocarbons. Environmental Science & Technology 20, no. 8: 830–836.
Njoroge, B.N.K., W.P. Ball, and R.S. Cherry. 1998. Sorption of 1,2,4-trichlorobenzene and tetrachloroethene within an authi-genic soil profile: Changes in K-oc with soil depth. Journal of Contaminant Hydrology 29, no. 4: 347–377.
NYSDEC and NYSDOH. 2006. New York State Brownfield Cleanup Program, Development of Soil Cleanup Objectives, Technical Support Document. New York State Department of Environmental Conservation and New York State Department of Health.

10 G. Wang et al./ Ground Water Monitoring & Remediation 00, no. 0: 00–00 NGWA.org
Piwoni, M.D., and P. Banerjee. 1989. Sorption of volatile organic solvents from aqueous solution onto subsurface solids. Journal of Contaminant Hydrology 4: 163–179.
Randall, A.D. 1977. The Clinton Street-Ballpark Aquifer in Binghamton and Johnson City. New York: New York State Department of Environmental Conservation 87, Bulletin 73.
Schmidt, M.W.I., and A.G. Noack. 2000. Black carbon in soils and sediments: Analysis, distribution, implications, and current challenges. Global Biogeochemical Cycles 14, no. 3: 777–793.
Schwarzenbach, R.P., P.M. Gschwend, and D.M. Imboden. 2003. Environmental Organic Chemistry, 2nd ed. Hoboken: John Wiley & Sons.
Seth, R., D. Mackay, and J. Muncke. 1999. Estimating the organic carbon partition coefficient and its variability for hydrophobic chemicals. Environmental Science & Technology 33, no. 14: 2390–2394.
Wang, G.H., S. Kleineidam, and P. Grathwohl. 2007. Sorption/desorption reversibility of phenanthrene in soils and carbona-ceous materials. Environmental Science & Technology 41, no. 4: 1186–1193.
Weber, W.J., P.M. Mcginley, and L.E. Katz. 1992. A distrib-uted reactivity model for sorption by soils and sediments 1. Conceptual basis and equilibrium assessments. Environmental Science & Technology 26, no. 10: 1955–1962.
Xia, G., and J.J. Pignatello. 2001. Detailed sorption isotherms of polar and apolar compounds in a high-organic soil. Environmental Science & Technology 35, no. 1: 84–94.
Xia, G.S., and W.P. Ball. 1999. Adsorption-partitioning uptake of nine low-polarity organic chemicals on a natural sorbent. Environmental Science & Technology 33, no. 2: 262–269.
Xing, B., and J.J. Pignatello. 1997. Dual-mode sorption of low-polar-ity compounds in glassy poly (vinyl chloride) and soil organic matter. Environmental Science & Technology 31, no. 3: 792–799.
Zhao, X., R.B. Wallace, D.W. Hyndman, M.J. Dybas, and T.C. Voice. 2005. Heterogenei ty of chlorinated hydrocarbon sorp-tion properties in a sandy aquifer. Journal of Contaminant Hydrology 78, no. 4: 327–342.
Biographical SketchesG. Wang was at Department of Geology, University at Buffalo
(SUNY), Buffalo, NY 14260. The author is now at Geosciences Group, Pacific Northwest National Laboratory, Richland, WA 99352.
R.M. Allen-King, corresponding author, is at Department of Geology, University at Buffalo (SUNY), Buffalo, NY 14260; (716) 645-4287; fax (716) 645-3999; [email protected].
S. Choung is at Department of Geology, University at Buffalo (SUNY), Buffalo, NY 14260. Now at Division of Advanced Nuclear Engineering, Pohang University of Science and Technology (POSTECH), Pohang 790-784, Republic of Korea.
S. Feenstra is at Applied Groundwater Research LTD, Mississauga, ON, Canada.
R. Watson, Groundwater Sciences Corporation, Harrisburg, PA.M. Kominek is at IBM, Manassas, VA.